the Creative Commons Attribution 4.0 License.
the Creative Commons Attribution 4.0 License.
Characterizing ground ice content and origin to better understand the seasonal surface dynamics of the Gruben rock glacier and the adjacent Gruben debris-covered glacier (southern Swiss Alps)
Julie Wee
Sebastián Vivero
Tamara Mathys
Coline Mollaret
Christian Hauck
Christophe Lambiel
Jan Beutel
Wilfried Haeberli
Over the recent years, there have been focused international efforts to coordinate the development and compilation of rock glacier inventories. Nevertheless, in some contexts, identifying and characterizing rock glaciers can be challenging as complex conditions and interactions, such as glacier–rock-glacier interactions, can yield landforms or landform assemblages that are beyond a straightforward interpretation and classification through ordinary visual means alone. To gain a better understanding of the spatial and temporal complexity of the ongoing processes where glacier–permafrost interactions have occurred, the characterization of the subsurface of the Gruben rock glacier and its adjacent complex contact zone with the then more extended Little Ice Age Gruben glacier is quantitatively assessed using a petrophysical joint inversion (PJI) scheme, based on electrical resistivity (ERT) and refraction seismic (RST) data. Surface dynamics are assessed using both in situ and close-range remote sensing techniques to monitor daily and seasonal displacements and to monitor landform-wide surface changes at high spatial resolution, respectively. Both the geophysical and geodetic surveys allowed two zones to be identified: the rock glacier zone and the complex contact zone where both permafrost and embedded surface ice are present. In the complex contact zone extremely high ice contents (estimated up to 85 %) were found. Widespread supersaturated permafrost conditions were found in the rock glacier zone. Surface displacement rates in this zone are typical of permafrost creep behaviour, with a gradual acceleration in late spring and a gradual deceleration in winter. Moreover, the coherent nature of the rock glacier zone surface deformation contrasts with the back-creeping and slightly chaotic surface deformation of the complex contact zone. Favouring a multi-method approach allowed a detailed representation of the spatial distribution of ground ice content and origin, which enabled us to discriminate glacial from periglacial processes as their spatio-temporal patterns of surface change and geophysical signatures are (mostly) different.
- Article
(15626 KB) - Full-text XML
- BibTeX
- EndNote
The high-alpine environment is characterized by glacial and periglacial processes and landforms, which express varying degrees of sensitivity to the current warming trend (Carturan et al., 2020; Cicoira et al., 2021; Huss and Fischer, 2016; Kellerer-Pirklbauer et al., 2024; Mollaret et al., 2019). The dynamic response of these phenomena and landforms to this trend is not uniform in space or in time as the occurrence of ice in high-mountain environments can be found under a wide spectrum of possible conditions, processes, materials, origins, landform settings, and assemblages (Bosson and Lambiel, 2016; Cusicanqui et al., 2023; Monnier et al., 2014; Navarro et al., 2023). For instance, surface ice not only encompasses landforms of glacial origins, such as glaciers, debris-covered glaciers, or dead-ice masses, but also smaller ice occurrences such as perennial ice patches or glacierets, while various forms of ground ice (also termed subsurface ice) relate to long-term thermal aspects of ice formation and preservation in permafrost conditions. In most contexts, there is a clear differentiation between landforms containing surface ice and those that contain ground ice, as their morphologies and kinematic behaviour are distinctive (Haeberli et al., 2024). However, in environments where glacial and periglacial processes occurred or still occur simultaneously, the typology of the ice content and associated processes of the resulting phenomena and landforms can be delicate to assess as they are the product of complex interconnected glacial and periglacial processes (Monnier et al., 2014; Vivero et al., 2021).
In the Alps, perennially frozen-debris landforms at many sites have coexisted and episodically or continuously interacted with glaciers (Bosson et al., 2015; Haeberli, 2005; Maisch et al., 2003; Ribolini et al., 2010). The Little Ice Age characterized the apogee of the last interaction phase (ca. 1350–1850 in the Alps; Ivy-Ochs et al., 2009) during which small polythermal cirque glaciers (Etzelmüller and Hagen, 2005) altered the thermal regime of their forefields and the spatial distribution of pre-existing perennially frozen sediments (Kneisel and Kääb, 2007; Kunz and Kneisel, 2020; Seppi et al., 2019; Wee and Delaloye, 2022).
As geomorphological and glaciological systems, environments in which glacier–permafrost interactions have occurred are the result of a wide and interconnected spectrum of glacial, periglacial, nival, hydrological, gravitational, and mass-wasting processes (Etzelmüller and Hagen, 2005; Ballantyne, 2018). Such interactions give rise to the coexistence of a diverse range of landforms, such as glaciogenic debris, glacier ice masses including debris-covered ice, and buried dead glacier ice, but also thermally controlled (permafrost-related), viscous creeping debris masses (rock glaciers) disturbed and sometimes partly displaced by the loading of glacial stress (glaciotectonic). Besides geometrical alteration, these glacitectonized frozen landforms may encompass sporadic embedding and burial of glacier ice (sedimentary ice) and smaller forms of surface ice into frozen debris.
Post-glacial dynamics of these systems and associated landforms comprise spatio-temporally complex and interlaced glacial, periglacial, paraglacial, hydrological, and mass-wasting processes, whose full understanding requires high-resolution, quantitative, multi-method, and interdisciplinary approaches. Recent studies have manifested a growing interest in investigating these systems to achieve a better understanding of processes resulting from glacier–permafrost interactions (Gärtner-Roer and Bast, 2019; Kenner, 2019; Monnier and Kinnard, 2015; Seppi et al., 2015, 2019). New insights into the latter resulted from in-depth geophysical prospections, high-resolution archival and digital photogrammetry, and systematic kinematic and ground surface temperature monitoring (Bosson and Lambiel, 2016; Gärtner-Roer et al., 2022; Kunz and Kneisel, 2020; Wee and Delaloye, 2022), which enabled the extension of previous studies on the understanding of glacier–permafrost interactions (Kääb et al., 1997; Kneisel and Kääb, 2007; Reynard et al., 2003).
In a context of growing interest and effort to coordinate the development of rock glacier inventories as part of large-scale approaches to quantify the impact of climate change on permafrost, such as the Global Terrestrial Network for Permafrost and IPA Action Group Rock Glacier Inventories and Kinematics (IPA Action Group RGIK, 2023; Streletskiy et al., 2021), especially when automated remote sensing approaches are used (Robsons et al., 2020; Sun et al., 2024), confusion and misinterpretations may arise in complex geomorphological settings (Whalley, 2020). This is why there is a necessity for ground truth data to create clarity in order to better interpret and analyse the climatic, hydrological, and geomorphological significance of rock glaciers, in particular where complex geomorphological contexts (e.g. glacier–permafrost interactions) hamper simple and straightforward “either-or” classification (Haeberli et al., 2024).
This contribution aims to understand the extent to which ground ice properties influence the surface dynamics of (a) a rock glacier partially affected by the advance of a glacier during the Little Ice Age and (b) a nearby debris-covered glacier terminus at Gruben (southern Swiss Alps), on the basis of in situ geodetic, close-range remote sensing and geophysical measurements. The extent and properties of ground ice is assessed through the analysis of the combination of refraction seismic and geoelectrical resistivity measurements by applying the petrophysical joint inversion approach (Mollaret et al., 2020; Wagner et al., 2019). The kinematic behaviour of a rock glacier, of a complex contact zone (see Haeberli et al., 2024), and of the adjacent debris-covered glacier is investigated, with an emphasis on the contribution of ice-melt-induced subsidence to surface elevation changes. This is achieved by combining the analysis of seasonal GNSS and uncrewed aerial vehicle (UAV) surveys, as well as continuous time series of displacements from fixed differential global navigation satellite system (dGNSS) stations. This study underlines the importance of a multi-method and multi-disciplinary approach in understanding and discriminating driving processes contributing to the surface dynamics of complex periglacial landforms.
The Gruben site (46°10′22′′ N, 7°58′09′′ E; Fig. 1) is located in the Saas Valley in the southern Swiss Alps. It is characterized by the rapidly shrinking debris-covered cold tongue of the polythermal Gruben glacier below the western face of the Fletschhorn (3985 m a.s.l.); the continuously advancing, perennially frozen, Gruben glacier-forefield-connected rock glacier below the south-eastern flank of the Rothorngrat (3104 m a.s.l.); and a complex contact zone of the then more extended Little Ice Age glacier and the rock glacier permafrost (Haeberli et al., 2024). During its Little Ice Age (LIA) maximal extent, the margins of the Gruben polythermal glacier overrode the uppermost zone of the pre-existing Gruben rock glacier (Gärtner-Roer et al., 2022; Kääb et al., 1997), consequently altering the thermal regime, spatial distribution of ground ice, and surface morphology of this zone. The morphological signature of this glacier–permafrost contact and interaction is expressed by glaciotectonics (compressive ridges and furrows perpendicular to the stress exerted by the LIA glacier advance) and thermokarstic features, the latter inferring the presence of buried massive ground ice. Geometrical changes and reoriented stress fields in this zone are expressed by lateral back-creeping (in the direction of the topographic thalweg formerly occupied by the glacier) and enhanced surface elevation changes mainly due to ice-melt-induced subsidence. In contrast to the complex contact zone, the rock glacier displays longitudinal ridges and furrows parallel to its extending flow field. Its kinematic behaviour is rather constant over time (from 1994 to present day) with horizontal surface velocities ranging between 0.3 and 1.0 m yr−1 and mean vertical changes from −0.1 to −0.5 m yr−1 mainly due to the downslope creep movement and permafrost thaw in summer (Gärtner-Roer et al., 2022; Kääb et al., 1997).
The debris-covered glacier tongue of the polythermal Gruben glacier (south-eastern part in Fig. 1) is characterized by a rather chaotic surface morphology; however, a pattern of somewhat subdued transverse ridges and furrows from compressing flow is discernible. Earlier borehole temperature investigations (Haeberli, 1976) revealed ice temperatures of −1 to −2 °C within the tongue of the glacier, which was frozen to its bed at the margins (i.e. cold-based glacier margins) but was temperate at its upglacier base (see Etzelmüller and Hagen, 2005). Surface elevation changes express strong signs of downwasting: the central zone shows important rates of ice-melt-induced subsidence, gradually decreasing towards the margins, inferring the rapid thinning and vanishing of (cold) glacier ice (Gärtner-Roer et al., 2022).
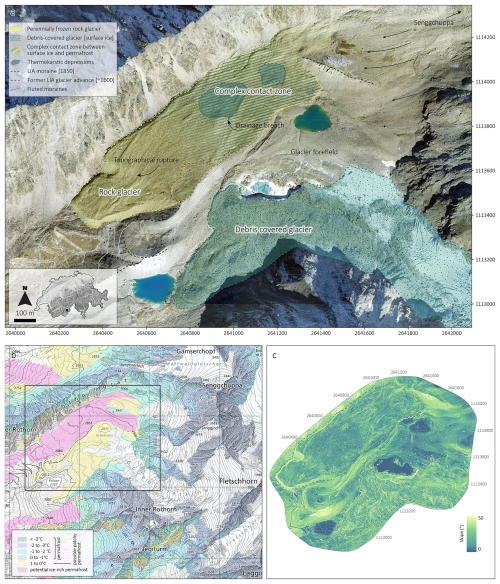
Figure 1General geomorphological description of the Gruben site (a). The Gruben rock glacier is highlighted by the dashed yellow lines. The complex contact zone is highlighted by alternating dashed yellow and blue lines. The delineation between the rock glacier and the complex contact zone (faded hatched lines) is here not clearly defined but based on geomorphological knowledge and prior studies (Kääb et al., 1997; Gärtner-Roer et al., 2022). The Gruben debris-covered glacier terminus is highlighted in blue. Dashed black lines indicate part of the LIA maximal extent of the Gruben glacier. Dashed red lines indicate a probable, former (∼ 1600) LIA glacier advance. Fluted moraines indicate the basal flow direction of the adjacent LIA Senggchuppa glacier. Background: SWISSIMAGE 2017 (swisstopo). Permafrost distribution map (Kenner et al., 2019) of the Gruben area (b) and slope gradient of the study area (c).
Winter equilibrium temperature (WEqT; earlier mostly called BTS – bottom temperature of the winter snow cover) values of the measured ground surface temperature at Gruben between 2015 and 2023 are evidence that permafrost is still thermally active – i.e. winter freezing penetrates down to the permafrost table (Gärtner-Roer et al., 2022; Noetzli and Pellet, 2023). However, the mean annual ground surface temperature (MAGST) measured between 2015 and 2023 in this complex contact zone is 0.39 °C, which is significantly (almost 4-fold) colder than the MAGST measured in the rock glacier zone (downslope of the complex contact zone; see Fig. 1), which is 1.27 °C (Fig. 2a). This infers that permafrost conditions at depth are in strong thermal disequilibrium with current thermal conditions at the surface (Noetzli and Pellet, 2023). Moreover, an ongoing warming trend of 1.51 °C per decade has been documented on the Gruben rock glacier and complex contact zone, essentially due to summer ground surface warming (Fig. 2b).
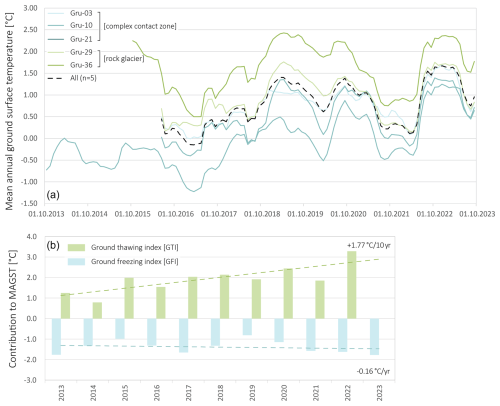
Figure 2Running MAGST measured on the Gruben rock glacier and complex contact zone (a) and contribution of the ground thawing index (GTI) and ground freezing index (GFI) to the MAGST at Gruben on average (b) (Noetzli and Pellet, 2023).
Following two lake outburst events in 1968 and 1979, both triggering devastating debris flows down to the main valley, important hazard protection work was carried out, supported by comprehensive field measurements (Kääb and Haeberli et al., 2001; Gärtner-Roer et al., 2022). These integrative glacier and permafrost investigations (Haeberli, 2005) document specific climate-related aspects for the Gruben site, which seem to be quite characteristic for the evolution of cold mountain regions in general. As part of a complex glacier–permafrost system, long-term creep and the advance of perennially frozen-debris masses – here the Gruben rock glacier – represent a comparably stable element with low hazard potential. Much more dynamic and dangerous is the development of lakes in a highly unstable environment of dead ice, locally frozen ground, and thermokarst phenomena (here the various Gruben lakes). Perhaps the most serious and most difficult-to-handle phenomenon is the deep and for very long time periods irreversible warming, degradation, and thaw of perennially frozen rock walls – here especially the north-exposed frozen rock walls south of the glacier, where rockfall and rock avalanche activity increased for decades already. The evolution must be carefully observed, and lake volumes must be kept small in order to avoid dangerous impact and flood waves.
To overcome the limitations in interpreting results that can arise when techniques are applied separately, this study favours a multi-method approach using recent and high-resolution datasets (Fig. 3). The characterization of frozen ground is quantitatively assessed in this study using the newly developed petrophysical joint inversion (PJI) approach (Mollaret et al., 2020; Wagner et al., 2019), based on the application of electrical resistivity tomography and refraction seismic tomography, which have complementary sensitivities to ice-to-water and air phase changes (e.g. Hauck et al., 2011). This novel approach allows not only the quantification of the ice content, but also the quantification of supersaturated conditions using non-invasive geophysical methods. Surface dynamics are assessed through a geodetic approach, which relies on differential global navigation satellite system (dGNSS) observations for high-temporal-resolution and repeated UAV-based imagery acquisition combined with structure-from-motion (SfM) three-dimensional (3D) reconstruction for high-resolution topographic analysis. Lastly, the combination of geodetics and geophysics allows us to link spatially variable ground ice contents with changes over time for different ice origins.
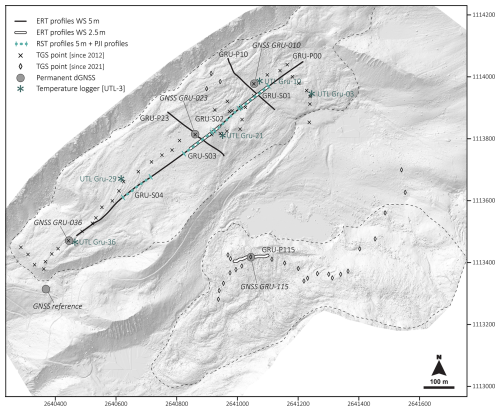
Figure 3Overview of the distribution of the geodetic survey points (crosses are the points monitored since 2012 and diamonds are the points monitored since 2021) and the location of the four permanent dGNSS stations and the reference station. The location of the electrical resistivity tomography (ERT) and refraction seismic tomography (RST) profiles is also presented. The continuous black line indicates ERT profiles with a 5 m electrode spacing, and the white lines indicate ERT profiles with a 2.5 m electrode spacing (see Sect. 4.1). The distribution of temperature loggers (UTL-3) is also presented. Background: UAV-derived hillshade (6 October 2022).
3.1 Electrical resistivity tomography (ERT)
ERT is a well-established method to image the two-dimensional (2D) distribution of electrical properties of subsurface mountain permafrost and ground ice due to its sensitivity and suitability to distinguish unfrozen material, ice-containing permafrost (excess ice), and massive sedimentary ice due to their contrasting electrical properties (e.g. Haeberli and Vonder Mühll, 1996; Hauck and Kneisel, 2008; Bosson et al., 2015; Halla et al., 2021; Herring et al., 2023).
On the rock glacier and complex contact zone, all ERT profiles were measured between 8–12 August 2022 with a Syscal Pro (Iris Instruments), which can connect to 48 stainless-steel electrodes. A longitudinal profile of 955 m (P00) was achieved by aligning seven consecutive profiles of 235 m (roll-along, with a one-half overlap) with an electrode spacing of 5 m. Along two sections of the profile P00, two co-located profiles, P00a and P00b (117.5 m each), with 2.5 m electrode spacing were measured to obtain information at a shallower investigation depth. Profiles P00, P00a, and P00b were merged in the data management software Prosys II (Iris Instruments), allowing for a single inversion of all quadrupoles measured along the same line (including both 2.5 and 5 m spacings). On the debris-covered glacier, one profile (P115) with 2.5 m electrode spacing was conducted. All profiles were measured with a Wenner–Schlumberger array configuration. The filtering (i.e. the extermination of bad data points) of the data from all profiles was achieved manually using Res2DInv (Aarhus GeoSoftware). For profiles GRU-P00, GRU-P10, GRU-P23, and GRU-P115, 18 %, 2 %, 6 %, and 14 % of the data points were filtered, respectively. The inversions were carried out using the pyGIMLi-based code (Rücker et al., 2017).
3.2 Refraction seismic tomography (RST)
RST makes use of the differences in the elastic properties of subsurface materials, such as unfrozen sediments, supersaturated permafrost, and buried surface ice, which are quantified in terms of their different P-wave velocities and their spatial variability. P waves are refracted when they encounter subsurface layers with velocity contrasts and are especially well-suited to delineate quasi-horizontal subsurface layers and to differentiate between air- and ice-filled pore spaces, both of which may exhibit similarly high electrical resistivities (Draebing, 2016; Halla et al., 2021; Hauck, 2001; Hilbich, 2010).
Four RST profiles were measured on co-located lines of the longitudinal ERT profile (P00). A first RST campaign was carried out in mid-August 2022, in the upper glacier-affected zone of the rock glacier (complex contact zone), and a second in mid-August 2023, in the lower glacier-affected zone (complex contact zone) and the rock glacier (see Fig. 3). In both campaigns, a 24-channel Geode instrument (Geometrics) with 24 geophones and a sledgehammer source were used. The 2D data analysis (picking of first breaks) and travel-time analysis were performed using ReflexW (Sandmeier geophysical research).
3.3 Petrophysical joint inversion (PJI)
We apply a PJI approach (Mollaret et al., 2020; Wagner et al., 2019) to jointly invert the measured apparent resistivities and seismic travel times to quantify the volumetric fraction of ice, water, air, and rock contents. Following Mollaret et al. (2020), the PJI approach is based on petrophysical equations that relate bulk electrical resistivities and seismic velocities to the fractions of the four phases in the subsurface, based on the resistivities and P-wave velocities of ice, water, air, and the rock matrix. The sum of all fractions has hereby to adhere to
with the indices r, w, a, and i indicating rock, water, air, and ice, respectively.
The petrophysical equation for P-wave velocities follows the approach of Timur (1968) and Hauck et al. (2011) linking the slowness and volumetric content of the four fractions to the measured bulk slowness as follows:
with the velocities vr, vw, va, and vi for rock, water, air, and ice, respectively.
In Wagner et al. (2019) and in many ERT applications on permafrost, Archie's law (Archie, 1942) is used to link measured resistivity to material properties such as saturation and porosity (see Herring et al., 2023). Archie's law is generally recognized as valid when the electrolytic conduction process is the dominant one. However, this is unlikely to be the case for coarse, blocky materials and supersaturated permafrost conditions, limiting its applicability. Thereby, following Mollaret et al. (2020), the geometric mean model (Eq. 3; Glover, 2010) was applied here instead, as it has the advantage of including all fractions of the four phases (and not only rock and water as in Archie's law), and consequently it yields realistic and well-constrained ice content estimations also in cases where the water content is potentially low (as in rock glaciers; Mollaret et al., 2020):
where ρr, ρi, ρw, and ρa are the resistivities for rock, water, air, and ice, respectively.
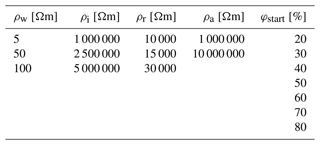
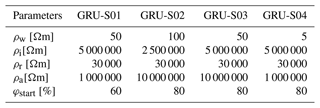
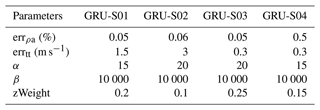
The results of the PJI depend on different sets of parameters in addition to the measured apparent resistivities and seismic travel times. A range of resistivity [Ωm] and P-wave velocity [m s−1] values was attributed to each of the four phases (ρw, ρi, ρa, ρr, vr, vi, vw, va). These were based on estimated resistivities and velocities obtained from the ERT and RST datasets as well as on standard ranges found in the literature (Hauck and Kneisel, 2008). A physically plausible range (i.e. 0.2–0.8) of initial porosity () values was prescribed through an iterative process to define the most adequate initial porosity value of each profile, which influences the distribution of the four phases. Regularization parameters for the inversion were attributed according to the suggested values by Mollaret et al. (2020) (see Table 1). Because of the varying sensitivity of the model to prescribed resistivities of the four phases and initial porosity, a looping process was used to systematically test different combinations of parameters (ρw, ρi, ρa, ρr, and initial porosity) with different sets of prescribed values (Table 2). The goal was to identify the optimal combination that most closely matched the model's χ2, where χ2=1 indicates a perfect fit to the data, given the data error, following the method outlined by Günther and Rücker (2023) and prior site knowledge.
Table 1Summary of the applied parameters for each profile. errtt and errρa are the individual inversion errors in both data types, α denotes the smoothness regularization parameter, β corresponds to the volumetric conservation regularization parameter, and zWeight corresponds to the anisotropic smoothness parameter, used to enhance horizontal or vertical structures (Mollaret et al., 2020).
3.4 Differential global navigation satellite system (dGNSS)
Surface velocities of rock glaciers are measured by bi-annual terrestrial geodetic surveys (TGSs) in early and late summer (early July and early October), as well as hourly by permanently installed dGNSS devices. These two complementary approaches allow the seasonal velocity variations to be captured (permanent dGNSS) as well as their spatially distributed annual and intra-annual changes (Noetzli and Pellet, 2023). Moreover, the data derived from these measurements allow the kinematic response to thermally driven processes such as ice-melt-induced subsidence to be calculated (Wee and Delaloye, 2022).
3.4.1 Bi-annual (seasonal) terrestrial geodetic survey (TGS) acquisitions
Surface displacement changes have been monitored on the Gruben rock glacier and complex contact zone bi-annually (early summer and late summer) since 2012, as well as on the Gruben debris-covered glacier since 2021 by differential GNSS surveys with real-time kinematics (RTK) using a Leica Viva GS10 (Leica Geosystems), according to the measurement set-up described by Lambiel and Delaloye (2004). In the scope of this study, measurements from field surveys carried out between 2022 and 2023 in early July and early October are used to distinguish the surface displacements during the longer winter period (approximately 270 ± 5 d) from those occurring during the snow-free summer period (90 ± 5 d). A total of 75 monitoring points are distributed throughout the site, including 46 on the rock glacier and complex contact zone and 24 on the debris-covered glacier as survey points, as well as five control points marked on stable bedrock for quality assessment. Horizontal, vertical, and 3D displacement vectors are calculated between two geodetic surveys with a relative accuracy of about 2–3 cm horizontally and 4–5 cm vertically. On survey dates 6 October 2022 and 3 July 2023, all monitoring points were measured. However, on 7 October 2023, only the monitoring points located on the rock glacier were measured.
From the TGS, we assess the driving processes contributing to surface elevation changes between early October 2022, early July 2023, and early October 2023. This time frame allows seasonal coverage over a year. We hereby assume that the change in elevation (Δzmeas) over time is attributed to the combination of three main processes: (a) elevation change due to the downslope movement, following the topographical slope angle (Δztopo); (b) change in elevation due to the melting (Δzmelt) or aggradation of excess ground ice, i.e. ice in oversaturated conditions or massive ice lenses; and (c) change in elevation caused by extending or compressing flow patterns (Δzflow) (Bosson and Lambiel, 2016; Haeberli et al., 2006; Lambiel and Delaloye, 2004; Wee and Delaloye, 2022). Here, following Isaksen et al. (2000) and Bosson and Lambiel (2016) the expected vertical position of each block (Δztopo) was calculated from the measured horizontal movement (Δxymeas) and the mean topographical slope angle around each block (derived from a resampled 5 m resolution DEM) (Eq. 4).
The difference between the obtained values of the expected vertical displacement (Δztopo) and the measured vertical movement (Δzmeas) provided information related to estimated ice-melt-induced surface elevation changes and flow patterns (calculated Δzmelt-flow; Eq. 5).
To assess the seasonality and spatial signature of the driving processes contributing to surface elevation changes, the ratio between the expected summer displacement (Δztopo-summer) and the winter displacement (Δztopo-winter) was calculated. The ratio between downslope movement and surface lowering () was calculated to evaluate the dominant process among the former and the latter. Surface lowering likely due to ice melt is dominant when , and downslope movement probably enhanced by an extending flow pattern is dominant when .
3.4.2 Continuous automatic dGNSS acquisitions
Three permanent GNSS stations are installed on the Gruben site: two on the complex contact zone and one on the debris-covered glacier, which have been delivering continuous hourly position measurements since early summer 2022. An additional permanent GNSS station has been installed on stable terrain to provide a reliable reference for the double-difference GNSS post-processing scheme to obtain robust quality-controlled daily positions (Cicoira et al., 2022). The high temporal resolution provided by permanent GNSS instruments enables the computation of monthly to daily displacements (Wirz et al., 2016; Noetzli and Pellet, 2023). However, because of the noise observed in the dataset, which can be caused by stochastic movements of the terrain's surface; by the rotation around the axis of the GNSS mast (which depends on the size of the boulder); and also by various environmental factors such as wind, temperature changes, or snow cover (Cicoira et al., 2022; Wirz et al., 2014), we apply a simple 15 d running mean to the dataset to filter displacement noise from any displacement signal.
3.5 UAV structure-from-motion (SfM) photogrammetry
To obtain high-resolution orthoimages and digital elevation models (DEMs) for the studied area, UAV surveys were conducted on 6 October 2022, 3 July 2023, and 7 October 2023. These surveys enabled high-spatial-resolution mapping of seasonal (summer and winter) surface displacements at the studied area (Vivero et al., 2022). The UAV surveys employed a DJI Phantom 4 RTK device, equipped with a GNSS antenna with L1 and L2 frequencies, providing real-time kinematics (RTK) differential corrections using a virtual reference station (VRS) based on the automated GNSS (reference stations) network for Switzerland (AGNES). Flight missions were planned with the built-in DJI GS RTK application. All missions were designed with the same parameters: side and forward overlaps were set to 70 % and 80 %, respectively, and flown at a constant height of 70 m, based on the swissALTI3D DEM loaded in the Terrain Awareness module to cover the entire area of interest. This resulted in approximately 2000 images with a geotagging accuracy between 1–2 cm (horizontally) and 1.5–3 cm (vertically) per survey. The UAV images were processed using the software PIX4Dmapper Pro version 4.7 to derive digital elevation models (DEMs) and orthomosaics, which were sampled at a resolution of 2.5 cm × 2.5 cm.
Surface elevation changes were quantified by differencing the sequential DEMs from each other to obtain a DEM of difference (DoD) for each time interval from 6 October 2022–3 July 2023 and 3 July 2023–7 October 2023. The obtained high-resolution DEMs allowed us to derive the terrain's topography, from which the loss in surface elevation due to downslope movement was calculated (Bosson and Lambiel, 2016; Wee and Delaloye, 2022). Horizontal surface displacements were derived from pairs of the above-mentioned multi-temporal orthoimages of 0.25 m pixel size by applying a normalized cross-correlation (NCC) procedure using the image correlation CIAS software (Debella-Gilo and Kääb, 2011; Kääb and Vollmer, 2000). The accuracy and quality of the image correlation was evaluated by applying the Helmert transformation based on points placed on stable terrain in the vicinity of the studied landforms. Despite the difficulty of finding stable terrain outside the studied landforms in the surveyed area, 46 (44) stable points were used for the t1 orthoimage and 44 for the epoch 1 (epoch 2) orthoimage pair. This allowed us to assess scale differences, rotations, or translations (x–y shifts) between two orthoimages (Table 3).
The uncertainties associated with the x and y displacement vectors derived from image-matching in CIAS were assessed using the standard deviations (σx and σy) of the residuals of the stable points used to assess the orthorectification of each orthoimage and where Δx and Δy are the individual components of the displacement vector, corrected for any co-registration bias (Redpath et al., 2013).
The variance σx and σy, which are about equal to the pixel size, indicate the spatial uncertainty that arises from the orthorectification and mosaicking processes, as well as the performance of the automatic image-matching using the NCC function. A confidence interval of 90 % for each displacement vector was calculated (i.e. 1.645 × σd) to define the minimum limit of detection (LoD). The resulting LoD values were converted into metres per year (m yr−1). A GIS filtering of flawed data points (e.g. vectors located on snow patches, vectors pointing upstream) was established in a final step.
3.6 Ground surface temperature
The thermal state of the ground surface and the possible occurrence of ground ice close to the subsurface on the Gruben rock glacier have been assessed through the monitoring of ground surface temperature (GST) at a 2 h frequency since 2013. Three temperature loggers are located in the complex contact zone (Gru-03, Gru-10, Gru-21), and two are located in the rock glacier zone (Gru-29 and Gru-36). From 2013 to 2018, GST data were measured using UTL-1 data loggers (Geotest AG) with an accuracy of ±0.2 °C, and from 2018 onwards, UTL-3 data loggers (Geotest AG) with an accuracy of ±0.02 °C were used.
4.1 Characterization of the subsurface: conventional ERT
Figure 4 presents the inverted resistivity tomograms for all profiles. Two main zones can be identified from prior geomorphological analysis and interpretation but also from the spatial distribution of resistivity values observed in the longitudinal profile GRU-P00: the rock glacier zone and the complex contact zone (Fig. 4a). In what is here considered as the permafrost zone of the Gruben rock glacier, resistivity values range between 35 and 50 kΩm in the uppermost 5–7 m, which likely corresponds to the active layer. Below the active layer, a layer with very high resistivity values ranging between 350 and 500 kΩm dominates the lower section of the profile, suggesting widespread, perennially frozen, ice-supersaturated sediments (excess ice). Resistivity values characterizing perennially frozen ground reach deeper than the penetration depth of the soundings.
In the central part of the profile GRU-P00 (Fig. 4a), between roughly 450 and 650 m, a relatively thin layer of coarse debris of about 2 m, which gradually becomes thinner (supposedly <1 m), overlays a layer with resistivity values ranging from 350 to 1000 kΩm, whose thickness exceeds the penetration depth of the sounding. Local distinct patches of resistivity values of around 2500 kΩm are corroborated by the transversal profile GRU-P23 that crosses the longitudinal profile at around 500 m (Fig. 4a, e, g). Such extremely high resistivity values suggest the presence of buried surface ice in this zone, as such ice produced by snow accumulation and transformation has been shown to be significantly less conductive than ground ice produced by freezing processes under permafrost conditions. The latter contains more electrically conductive ions through the refreezing of water that has been in contact with rock material (Colombo et al., 2019; Del Siro et al., 2023).
In the uppermost section of the complex contact zone, profiles GRU-S01 and GRU-P10 indicate resistivity values ranging between 350 and 1000 kΩm under a shallower layer of more conductive glaciogenic fine sediments between 15 and 30 kΩm (Fig. 4a, c, f). Resistivity values at the north-eastern end of the longitudinal profile (between 900 and 955 m) range from 3 to 10 kΩm, pointing to unfrozen and ice-free conditions. Similar to the values observed at the uppermost end of the longitudinal profile, towards the outer margins (south-east) of the Gruben rock glacier, both transversal profiles GRU-P10 (Fig. 4f) and GRU-P23 (Fig. 4g) show resistivity values between 3 and 30 kΩm, which could possibly indicate a high water content.
Profile GRU-P115 is located on the Gruben debris-covered glacier tongue (Fig. 4h). The resistivity values measured in the uppermost 3–4 m of the profile range between 10 and 30 kΩm. Under this layer of very coarse debris, a highly resistive layer of 1000 to likely >2500 kΩm is observed, indicating buried surface ice.
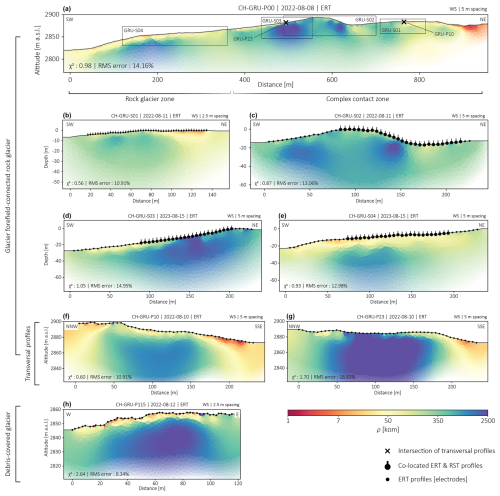
Figure 4The main longitudinal ERT profile GRU-P00 is presented in the uppermost panel (a). ERT profiles GRU-S01, GRU-S02, GRU-S03, and GRU-S04 are presented in panels (b)–(e) and represent the profiles where both ERT and RST measurements were carried out. The transversal profiles GRU-P10 and GRU-P23 are presented in panels (f)–(g). Profile GRU-P115, carried out on the debris-covered glacier, is presented in panel (h).
4.2 Estimation of ground ice content
Figure 5 shows the estimated ice, water, and rock content distributions along profiles GRU-S01, GRU-S02, GRU-S03, and GRU-S04. Using the full ranges of free parameters (within reasonable physically consistent bounds) shown in Table 2 would yield a wide range of different spatial distributions for the above-mentioned three phases. The parameters selected in Table 4 yield a best-guess estimate for the porosity (or rock fraction) and ice content distribution, informed by prior geomorphological knowledge of the site. The analysis of historical maps and historical aerial images allowed an initial geomorphological interpretation of the study area. For instance, the development of thermokarstic depressions in the upper area of the Gruben rock glacier (former contact zone) during the 1970s and the documented massive ice outcrops are clear indicators of the near-surface ground ice properties. This allowed us to better constrain the resistivity values for each profile and the rock fraction estimate. The chosen metrics in Table 4 also result in a low χ2 error, demonstrating a strong agreement with the observed data. A high water-to-ice ratio is observed in the north-eastern section (between 100 and 130 m) of profile GRU-S01 (Fig. 5a), where the terrain surface is characterized by fine-grained glaciogenic sediments (till), which is where more water capillary action occurs. In contrast, the section between 20 and 75 m, located at the edge of a former thermokarst lake, presents a high ice content. This can be explained by the coarse and blocky terrain surface, which favours the resilience of ground ice (Amschwand et al., 2024). Between 125 and 160 m in profile GRU-S02 (Fig. 5b), where the ice content ranges between 80 %–90 %, almost no water is present, suggesting the presence of embedded, cold surface ice. The minimum ice content is encountered in the thermokarst depression, intersecting the 1995 drainage breach (Kääb et al., 1997), suggesting an alteration of the subsurface thermal regime. Both extremities of profile GRU-S03 contain less ice, which is compensated for by a relatively high rock fraction. High ice contents reaching up to 84 % are locally found in the middle of the profile and are counterbalanced by a relatively porous medium, inferring remnants of massive (possibly surface) ice lenses embedded in the frozen sediments (Fig. 5c).
In contrast to the profiles located in the complex contact zone, the uppermost 5–7 m of profile GRU-S04 within the rock glacier zone displays a well-defined porous (about 40 %–30 %) and coarse debris layer. Below this layer, the maximum ice content is found under supersaturated conditions (Fig. 5d).
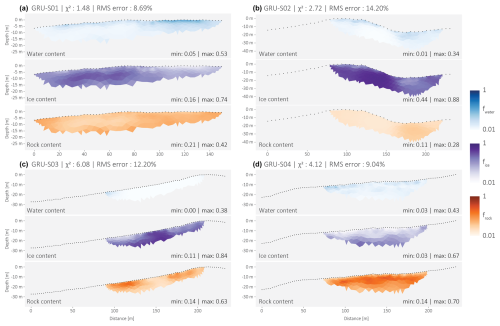
Figure 5Volumetric fractions of water (fw), ice (fi), and rock (fr) estimated by the petrophysical joint inversion of profiles GRU-S01, GRU-S02, GRU-S03, and GRU-S04.
4.3 Seasonal surface displacements and surface elevation changes
Figure 6 displays seasonal horizontal surface velocity flow fields of the Gruben rock glacier, complex contact zone, and debris-covered glacier. A coherent, lengthwise-oriented flow field is documented on the Gruben rock glacier downslope of the topographical rupture. Between the latter and the complex contact zone, the measured vector field shows an orientation oblique to the longitudinal surface structures observed on the rock glacier. This flow trajectory may indicate that the influence of the LIA glacier on the creeping permafrost extended beyond the former ice margin. In the complex contact zone with the LIA glacier, the flow field is considerably more complex and includes a clear south-east-oriented back-creeping towards the topographic depression of the forefield, previously occupied by the Gruben glacier during the LIA.
During the winter period (6 October 2022–3 July 2023; Fig. 6a), the mean horizontal surface velocity measured in the lower section of the slightly steeper rock glacier zone (close to the topographical rupture, zone 1) is 0.62 m yr−1, while in the relatively flat complex contact zone (zone 2), the mean horizontal surface velocity is 0.26 m yr−1. Horizontal surface velocities are generally faster during the summer period (Fig. 6b) compared to the winter period, particularly in the uppermost complex contact zone (zone 2), where the mean velocity is 0.52 m yr−1. In the lower section of the rock glacier (zone 1), the mean summer horizontal surface velocity is 0.92 m yr−1.
The upslope (zone 4; Fig. 6) and downslope (zone 3; Fig. 6) sections of the debris-covered glacier tongue are strikingly distinguishable in terms of flow field direction and velocity. In the uppermost zone, surface displacements are oriented towards the north-west, whereas in the lowermost zone, after the elbow turn, the flow trajectory is more diffuse and is directed towards the south-west. The upper section is characterized by faster velocities than the flatter and decaying frontal zone. The mean horizontal surface velocity observed in the lower zone (zone 3) during the winter period in the lower section is 0.37 m yr−1, while in the upper section (zone 4), the mean velocity is 1.74 m yr−1 (Fig. 6a). During the summer period (Fig. 6b), the lower section's (zone 3) mean velocity is 0.72 m yr−1, and the mean horizontal velocity is 4.19 m yr−1 in the upper part (zone 4). The latter is characterized by more chaotic flow fields, which is likely due to differential ablation rates of the glacier in this section caused by an uneven distribution of debris-cover thickness.
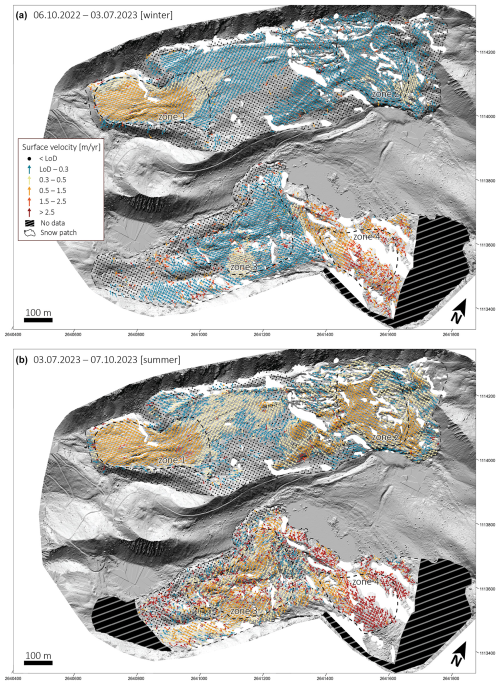
Figure 6UAV-derived horizontal surface displacements. The winter period (6 October 2022 to 3 July 2023) is presented in panel (a), and the summer period (3 July 2023 to 7 October 2023) is presented in panel (b). The zones (1–4) from which the mean velocities are derived are highlighted by the dashed polygons. Background: UAV-derived hillshade (6 October 2022).
Surface elevation changes and horizontal surface velocities presented in Fig. 7 reveal a striking seasonal and spatial signal in terms of the kinematic behaviour of the rock glacier. Flow fields and velocity patterns, together with elevation changes observed on the rock glacier surface, allowed us to highlight the distinction between surface processes occurring in the complex contact zone from processes occurring in the rock glacier zone. UAV-derived elevation changes show that during the winter period, elevation changes range from −0.05 to −0.20 m in the upper section of the complex contact zone, while in its lower section (east of the thermokarst depression) almost no elevation change is observed. The non-glacier-affected part of the rock glacier illustrates a vertical loss of about −0.20 m during winter, which can largely be explained by the continuous longitudinal stretching of the creeping ice-rich permafrost (Kääb et al., 1997). In summer, a higher vertical decrease of about −0.50 m is evidenced in the uppermost section of the complex contact zone, which largely exceeds the horizontal displacement (as shown in Fig. 7b), inferring ice-melt-induced subsidence. This elevation loss extends downstream to the lower part of the complex contact zone, where the average elevation change reaches −0.35 m. Elevation changes in the rock glacier zone reach −0.20 m, and the general displacement slope angle of the surveyed points largely exceeds the topographical slope angle, evidencing ice melt but also elevation loss due to thinning (extending flow pattern) and downslope movement along the topographical slope. Elevation changes obtained from in situ dGNSS surveys are consistent with the above-mentioned observations and are in agreement with the results previously presented by Gärtner-Roer et al. (2022).
Near the ice-cliff section of the debris-covered glacier terminus, the mean winter (6 October 2022–3 July 2023) surface elevation change is about −0.15 m, while in the margins surface elevation changes are <0.10 m. Summer elevation changes are generally enhanced in this lower section of the debris-covered tongue, ranging from −0.15 to −0.55 m.
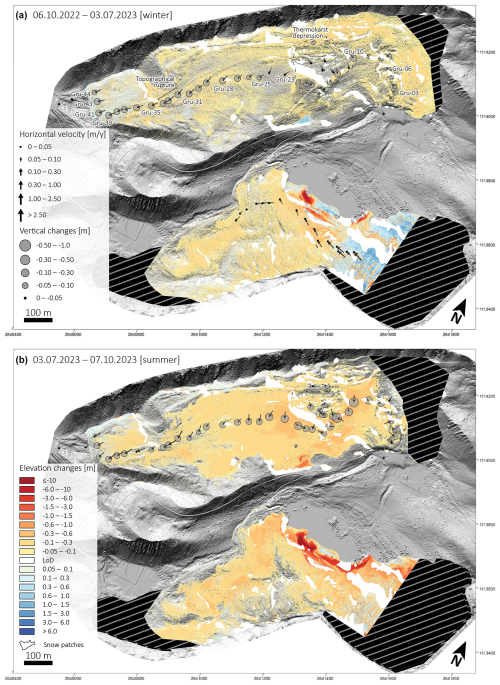
Figure 7Seasonal elevation changes derived from DoD. Vertical changes and horizontal surface displacements derived from TGS. The measured points are identified by their corresponding number (Gru-xx, only in panel a). The winter period (6 October 2022 to 3 July 2023) is presented in panel (a), and the summer period (3 July 2023 to 7 October 2023) is presented in panel (b). Background: UAV-derived hillshade (6 October 2022).
The spatio-temporal variation in the surface elevation changes was assessed by calculating the ratio of the expected vertical movement (solely due to the downslope movement) for the summer and winter periods. The results document a strong seasonal and spatial pattern (Fig. 8). In the complex contact zone, the mean ratio between the expected summer vertical displacement and the expected winter vertical displacement is 2.52, which infers that additional processes such as ice-melt-induced subsidence and extending flow contribute dominantly to the elevation loss in this zone, whereas in the rock glacier zone the mean ratio is 1.12, which implies that surface elevation changes are relatively constant throughout the year but are likely slightly enhanced by thaw or melt-induced subsidence or due to the extending flow pattern observed in this area. The ratio between the downslope movement and the additional surface lowering over a year was calculated to determine the weight of the processes contributing to surface elevation loss. Surface lowering most likely due to ice melt dominates in the complex contact zone, with a mean ratio of 0.30. The mean ratio of 5.12 obtained in the rock glacier zone illustrates the predominance of the downslope movement, likely combined with thinning effects from extending flow. Points located in the thermokarst depression showed a less coherent behaviour as their values are relatively heterogeneous.
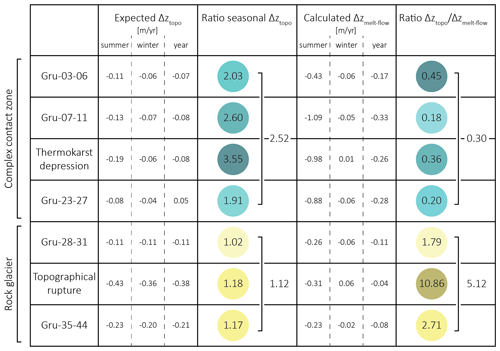
Figure 8The seasonal (summer and winter) and annual expected downslope displacement (solely following the slope angle topography) was calculated for the different zones (see Fig. 7) of the rock glacier and the complex contact zone. The ratio between the summer and winter expected downslope displacement was calculated (ratio seasonal Δztopo). Seasonal and annual surface lowering rates (calculated Δzmelt-flow) are presented. The main dynamics are represented by the ratio between the annual expected downslope displacement (Δztopo) and the calculated annual surface lowering (Δzmelt-flow).
4.4 Contribution of ground surface temperatures to seasonal surface changes
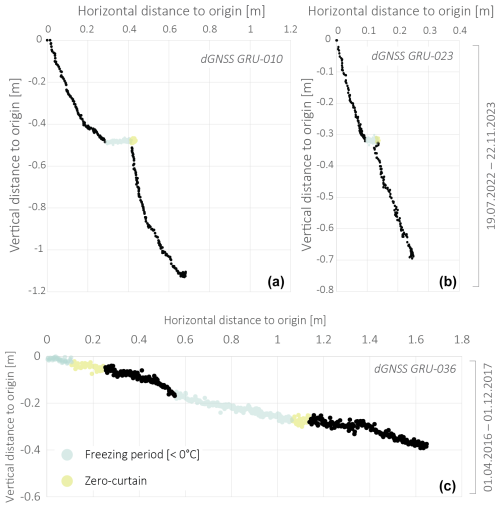
The potential direct influence of ground surface temperature changes on ice-melt-induced subsidence was assessed through the acquisition of hourly position measurements by permanent dGNSS stations, which were compared to daily GST measurements (Fig. 9). At stations Gru-010 and Gru-023, located in the complex contact zone, vertical surface velocities tend to instantly decelerate once ground surface temperatures are below 0 °C and accelerate with a 10 d phase lag following the warming (>0 °C) of ground surface temperatures. Horizontal surface velocities slightly increase as ground temperatures start to increase (Fig. 9a–b). Displacement profiles of Gru-010 and Gru-023 show the sensitivity of the underlying ground ice to surface temperatures, as summer surface temperatures lead to an enhanced vertical displacement (Fig. 10a–b). Moreover, the displacement angle of about 65° largely exceeds the surface topography (10°), suggesting ice-melt-induced subsidence. The reactivity of surface displacements to the thermal state of the ground surface can likely be attributed to the presence of embedded surface ice buried under a relatively shallow layer of debris, allowing effective direct heat transfer from the atmosphere to the permafrost table (Fig. 4). In contrast to the kinematic behaviour observed in the complex contact zone, the intra-annual variability in vertical and horizontal surface velocities observed at station Gru-036 in the rock glacier zone is more constant throughout the year (Fig. 9c). Peak velocities are reached in early summer, coinciding with the zero-curtain period, and in late autumn. This is explained by a phase lag between the seasonal summer peak in the ground surface temperatures and the surface velocities, which may be partly attributed to the time for the temperature signal to propagate from the surface to the permafrost table (Cicoira et al., 2019; Wirz et al., 2016). The displacement angle of profile Gru-036 (Fig. 10c) follows the topographical slope of 15°, which is in complete accordance with the observations made by Gärtner-Roer et al. (2022). The mere absence of a steeper displacement trajectory during the summer period suggests surface lowering due to downslope movement in a zone where the extending flow pattern is dominant.
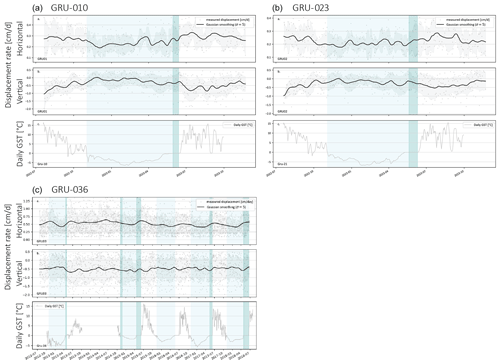
Figure 9Ground surface temperature and horizonal and vertical velocity time series in the complex contact zones Gru-010 (a) and Gru-023 (b) and in the rock glacier zone Gru-036 (c). The time series recorded by the stations GRU-010 and GRU-023 span July 2022 to early October 2023, whereas the time series recorded by the station GRU-036 spans July 2012 to June 2018. The period highlighted in light blue represents GST below 0 °C, and the period highlighted in dark blue represents the zero-curtain period. Grey points represent the measured data.
The combination of geophysical datasets with high-spatio-temporal-resolution geodetic measurements and ground surface temperature monitoring allowed a detailed representation of the spatial distribution of ground ice, its properties, and its influence on the kinematic behaviour of the Gruben rock glacier and debris-covered glacier tongue. Here, the analysis of recent and high-resolution geodetic data together with GST data provides key information regarding the kinematic response to thermally driven processes. Moreover, geoelectrical and refraction seismic data enabled the characterization of the subsurface, which revealed the influence of ground ice content and properties and the active-layer (or debris-cover) thickness on surface dynamics.
5.1 Evaluation of the geophysical approach
Using several ERT and RST profile lines on the rock glacier and debris-covered glacier, we applied a petrophysical joint inversion (PJI) approach to model the four phase contents of the subsurface, with a focus on the quantification of the ground ice content. Within the PJI, the geometric mean model was employed to link the measured electrical resistivities with the volumetric fractions of each phase, as this approach has yielded well-constrained estimations of ice content and porosity for ice-rich rock glaciers (Mollaret et al., 2020) such as the Gruben rock glacier. As mentioned in Sect. 3.3, different parameters, such as the initial porosity and the resistivity values of the four phases, were tested to build a plausible range of model estimations. It was found that the ground ice estimation is sensitive to the model's initial porosity constraints (Halla et al., 2021; Hilbich et al., 2022; Mollaret et al., 2020), as initial porosities ≥60 % systematically yielded higher mean ground ice content, which appeared to be the most plausible ice content values according to the model's χ2 and rms error. The choice of the most plausible tomograms was determined by considering the final model's best-fit value χ2 within the region where the model is characterized by high complexity and a low misfit. A sensitivity analysis was performed to better evaluate the reliability of the prescribed parameters and to estimate the range of possible model results from this parameter uncertainty. Figure 11 shows the dependence of (mean) ground ice contents in the different profiles on two of the major influencing parameters in our PJI models: initial porosity φstart and ice resistivity ρi. Higher initial porosities (φstart≥0.6) systematically generated lower χ2 and rms values (not shown) (Fig. 11). Moreover, we tested the uncertainty range related to the influence of the prescribed water resistivity values ρw (5, 50, 100 Ωm; red circles in Fig. 11) for a fixed set of other parameters. No significant variation in the mean ice content occurs, which reduces the uncertainty in regard to the chosen model. Finally, the choice of the model was also based on geomorphological knowledge and information from geodetic and temperature measurements. In contrast to the strong ambiguity between ice and rock content found in model applications using Archie's law (Hauck et al., 2011; Wagner et al., 2019), the application of the geometric mean model reduces the ice and rock ambiguity as all four phases are constrained by both geophysical datasets (Mollaret et al., 2020). Here, the model enabled better and more realistic estimations of the ice content.
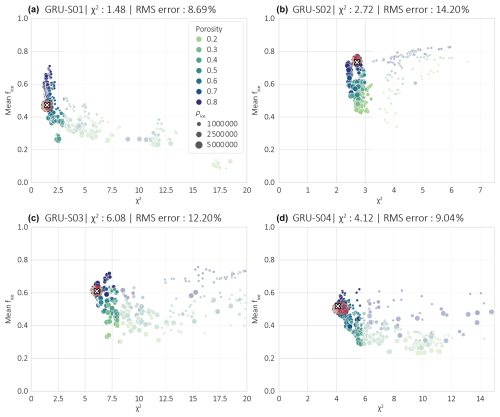
Figure 11Sensitivity analysis of mean ice content (fice) for the entire tomogram and model-fit χ2 to the prescribed porosity and resistivity of ice (ρice) for profiles GRU-S01 (a), GRU-S02 (b), GRU-S03 (c), and GRU-S04 (d). χ2 and rms error indicated in the title correspond to the PJI chosen for interpretation. The white cross represents the chosen model, and the red crosses represent the models with the same set of prescribed parameters aside from ρw. The red circle represents the uncertainty range for ρw on the estimated mean ice content.
The petrophysical joint inversion approach uses the measured apparent resistivities and seismic travel times to image the volumetric fractions of ice, rock, water, and air content. The latter is then re-transformed into P-wave velocity and electrical resistivity tomograms using the same petrophysical Eqs. (1) to (3). Thereby, we additionally assessed the reliability of the model by comparing the conventional, individually inverted ERT and RST tomograms with the PJI-derived (transformed) ERT and RST tomograms (Fig. 12). The same regularization parameters and mesh sizes were used for the individual inversions and for the PJI. All transformed ERT tomograms are qualitatively in good agreement with the conventional ERT tomograms. However, individual information, in particular higher velocities, is not represented in the transformed RST tomograms. Some discrepancies are also observed at the edges of the tomograms (e.g. profile GRU-S04), where the model's sensitivity to the measured data is inherently lower. The influence of these discrepancies on the overall interpretation remains minimal.
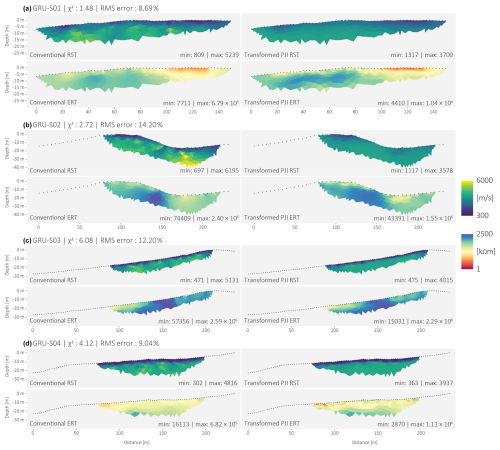
Figure 12Comparison between the results from the conventional (individual) RST and ERT inversions with the resistivity and P-wave velocity distributions obtained from the PJI using the geometric mean model for resistivity. The electrical resistivity (here in kΩm) is displayed on a logarithmic colour scale.
5.2 Geodetic approach
The application of dGNSS and UAV surveys enabled both a high-temporal- and high-spatial-resolution in-depth analysis of the kinematic behaviour of the Gruben rock glacier and debris-covered glacier. The large spatial coverage of the study site allowed us to grasp an overview of the general kinematic behaviour and patterns of both landforms, which are largely comparable to the observations of Kääb et al. (1997) and Gärtner-Roer et al. (2022). The geodetic datasets are quantitatively comparable, providing confidence to their robustness and reliability (Vivero et al., 2022). Despite the large spatial coverage provided by UAV-derived data, the selection of ground control points can be a challenging processing step, in particular in high-mountain environments where stable ground surfaces are limited. Furthermore, in this case, the deployment of UAV surveys for kinematic monitoring is limited to snow-free periods. During the early summer survey (3 July 2023), seasonal snow patches were still present on both the rock glacier and the debris-covered glacier and were consequently masked out due to their interference with the image correlation processing applied.
Permanent GNSS stations provided a very high temporal resolution (hourly) of local surface displacements. Here, the use of a reference station mounted on stable ground allowed the accuracy of the measured coordinates to be substantially improved, as each position was corrected in real time relative to the reference station. Despite the noisy dataset, which was filtered by applying a simple 15 d running mean approach, this dataset allowed us to better understand the thermo-mechanical response of the rock glacier and complex contact zone to ground temperature changes in regards to the thickness of the coarse blocky layer above the frozen ground.
5.3 Internal structure and surface dynamics of the Gruben rock glacier and complex contact zone
Despite the lack of a clear surface morphology that would allow a straightforward delineation between the rock glacier and the former glacier–rock-glacier contact zone, the observations made in this study provided key information to better understand the extent of the Gruben LIA glacier on the pre-existing perennially frozen sediments.
Geoelectrical soundings performed between 1979 and 1982 revealed ice-rich permafrost conditions in the downslope section of the rock glacier, here considered as the non-glacier-affected rock glacier zone (King et al., 1987). The results from geoelectrical and refraction seismic data of the present study confirmed the occurrence of a layer of ice-rich permafrost at depth in the frontal zone of the rock glacier and demonstrate the resilience of permafrost to the increasing air temperatures in the past 4 decades. The current conditions infer that the Gruben rock glacier was already under permafrost conditions before the LIA advance of the Gruben glacier. In the upslope section of the rock glacier, geomorphological indicators attest to a former contact zone between the permafrost of the Gruben rock glacier and the polythermal Gruben glacier during its LIA maximal extent (Kääb et al., 1997; Gärtner-Roer et al., 2022; Haeberli et al., 2024). During the interaction phase between the polythermal glacier and the permafrost of the rock glacier, debris-covered glacier ice was locally embedded within, and primarily on top of, the frozen debris, as evidenced by the geomorphological imprint of thermokarst in the former contact zone but also by the extremely resistive and widespread ground ice content, likely referring to buried cold surface ice.
The spatial distribution of ground ice and its associated properties (embedded cold glacier ice or supersaturated permafrost) within the rock glacier is reflected by the heterogeneous kinematic behaviour of the latter (Bosson and Lambiel, 2016; Cusicanqui et al., 2023; Kunz et al., 2022). The former glacier–permafrost interaction phase not only altered the spatial distribution of ground ice and ground surface thermal regime of the investigated landform through the direct material contact with its thermal coupling and mass exchange, but also induced geometrical deformations (changes in the topographic conditions) with related changes in stress transmission and stress fields. It is likely that the pressure – and hence the associated stress field reorientation – exerted by the formerly advancing polythermal glacier onto the pre-existing perennially frozen-debris landform was transmitted across extended spatial scales. Deformation may have reached a few tens of metres in depth and over a few hundreds of metres horizontally, meaning that the entire width of the rock glacier was probably impacted.
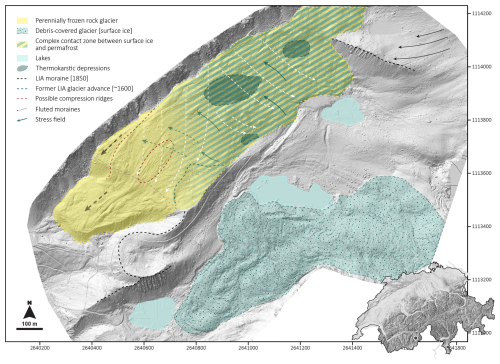
Figure 13Interpretation of the influence of the LIA glacier–permafrost interaction on the mechanical behaviour of the rock glacier and its adjacent complex contact zone based on the analysis of high-resolution photogrammetry. The dashed black line represents the LIA (1850) moraine and consequently the maximal extent of the Gruben glacier during its LIA apogee. The dashed grey line represents the topographical rupture. The dark blue arrows represent the stress exerted by the glacier onto the rock glacier. The dashed white arrows show the reoriented flow trajectories of the rock glacier and complex contact zone as a response to the stress exerted by the LIA glacier, while the dashed grey arrows show the unchanged flow trajectory of the rock glacier. The dashed blue line shows the probable extent of a prior stage (∼ 1600) of LIA glacier advance. The dashed dark-red line on the orographic right side of the rock glacier and the dashed ellipse show compression ridges likely due to the glacier stress. Background: UAV-derived hillshade (6 October 2022).
Figure 13 shows the general extent to which the mechanical behaviour of the rock glacier was influenced by the stresses exerted by the LIA glacier advances. It is likely that down-valley of the topographical rupture, large-scale stress transmission did not occur and the mechanical behaviour (steady-state creep) of the perennially frozen body remained as it was prior to the LIA glacier advance. Coherent flow fields and longitudinal ridges and furrows observed in the downslope section of the rock glacier indicate the gravity and thermally driven internal permafrost creep deformation and extending flow, respectively. However, up-valley of the topographical rupture up to the western boundary of the thermokarst depression, the stress exerted by the Gruben glacier during its LIA advances probably reached the orographic right side of the rock glacier, causing internal and surface deformation, which could be reflected by the flow trajectories and the compression ridges marked by the dashed dark-red lines. Moreover, a glacier advance prior to the latest 1850 advance (Fig. 13) could have contributed to the mechanical deformation in this zone of the rock glacier. Further up-valley in the complex contact zone, less coherent flow fields, diverging from the down-valley direction towards the glacier forefield, indicate geometrical adjustments following the interaction phase between the Gruben rock glacier and the debris-covered glacier. A lateral back-creeping motion dominates this former contact zone. However, in the vicinity of the thermokarst depression, the flow pattern becomes locally much less coherent as the topography is relatively chaotic, favouring the stochastic displacement of the blocky surface. Moreover, where ground ice content is widespread within a rock matrix with excess ice, surface lowering is mainly interpreted as the expression of ice melt and thaw subsidence. The magnitude of the latter is highly dependent of the ground ice properties, the surface debris thickness and coarseness, and the temperature of the ground surface. The results from the geodetic and temperature measurements show direct and high-magnitude responses of subsidence to summer ground surface heating in the complex contact zone, and the warmest temperatures are hereby associated with the largest subsidence. In this context, this shows that surface lowering is dominated by ice melt, a thermally driven process occurring at the permafrost or ground ice table (Staub et al., 2016; Wee and Delaloye, 2022). On the rock glacier, the loss in elevation appears to be mainly driven by internal continuous creep deformation, as the magnitude of the displacement is rather constant throughout the year, aside from a slight acceleration in early summer and early autumn and a slight deceleration in winter. Ice-melt-induced subsidence appears to be rather ineffective regarding surface lowering; however, the seasonal increase in water content due to snowmelt and permafrost thaw enhances the deformation, suggesting that surface lowering due to a seasonally increased extensive flow pattern cannot be excluded (Cicoira et al., 2019).
5.4 Surface dynamics of the Gruben debris-covered glacier tongue
Surface changes observed on the debris-covered tongue reflect typical processes in response to seasonal variations. However, the magnitude of surface changes observed in the lower section of the Gruben glacier tongue is much smaller than of those observed in the uppermost section of the debris-covered tongue, which is likely due to the thicker debris cover of the latter. The debris-covered glacier terminus, which is still connected to the debris-free active Gruben glacier, documents drastic signs of downwasting. The lowermost section of the debris-covered tongue, on the other hand, shows signs of advanced degradation, in particular in its margins where only very slight surface changes occur (Gärtner-Roer et al., 2022). In addition to the low flow velocities of the tongue's terminus which impede the removal of the debris from the glacier, an important input of debris is provided from the north-western flank of the Inner Rothorn (Benn et al., 2001; Mölg et al., 2020). In view of the thickness of the debris cover, which reaches up to roughly 5 m (Fig. 4), it cannot be excluded that the latter significantly reduces the ablation rate of the terminus part, as near-surface heat transfer is dissipated into the atmosphere before being transferred to the underlying ice surface (Nicholson and Benn, 2006; Rounce et al., 2015). The heterogeneity of the debris-cover thickness causes differential ablation rates and consequently a rather chaotic debris surface. These differential ablation rates can also eventually lead to the development of ice cliffs (Buri et al., 2016), as is the case at Gruben.
The multi-method approach applied in this study provided new insights into ongoing intra-annual and annual dynamics of complex ice-rich landform systems, such as the Gruben rock glacier and Gruben debris-covered glacier. This study has established the relationship between the internal structure of the investigated landforms with their physical processes and associated surface dynamics. The magnitude of ice-melt-induced subsidence was the highest in the complex contact zone where still-existing, isolated remnants of buried surface ice were detected by the geophysical investigations. Pronounced surface elevation loss due to extending flow and downslope movement was observed on the glacier-forefield-connected rock glacier, which reflects the dominance of permafrost creep deformation. The kinematic signature of these two distinct morphological zones attests to the geomorphological heritage from the Holocene and LIA and highlights the interrelationship between glacial and periglacial processes occurring in the so-called complex contact zone. This underlines the complexity in capturing a complete and thorough understanding of the driving processes contributing to the morphodynamical evolution of such systems. This study also revealed the resilience of the ground ice to a warming atmosphere, in particular in the permafrost of the rock glacier. This was also found for the glacier ice beneath the thickening debris cover of the Gruben glacier terminus, which is in complete disequilibrium with the current climate.
GST and TGS data are partly available on the PERMOS data portal (https://doi.org/10.13093/permos-2024-01, PERMOS, 2024). All other data are available upon request to the corresponding author.
JW designed the research; collected the GST and GNSS data since 2016; planned, coordinated, and participated in the geophysical campaigns; and processed and analysed the GST, GNSS, and geophysical data. SV conducted the UAV campaigns and processed the UAV-derived data with JW. TM and CM contributed to the development of the PJI code. JB provided data of one of the permanent GNSS stations. CH and CL supervised and contributed to the study design. WH provided his knowledge from earlier studies and local hazard protection work. All authors were involved in the discussion and in the preparation of the manuscript.
At least one of the (co-)authors is a member of the editorial board of The Cryosphere. The peer-review process was guided by an independent editor, and the authors also have no other competing interests to declare.
Publisher’s note: Copernicus Publications remains neutral with regard to jurisdictional claims made in the text, published maps, institutional affiliations, or any other geographical representation in this paper. While Copernicus Publications makes every effort to include appropriate place names, the final responsibility lies with the authors.
The acquisition of this important dataset would not have been possible without the valuable support and work from colleagues and friends involved in the fieldwork. We are sincerely grateful for the time and effort that you have invested in helping with the data acquisition. We are also thankful for the support that we received from the municipality of Saas-Balen for making the access to Gruben easier. We thank PERMOS for support with the collection of the GST and GNSS data.
This paper was edited by Vishnu Nandan and reviewed by Adriano Ribolini and one anonymous referee.
Amschwand, D., Scherler, M., Hoelzle, M., Krummenacher, B., Haberkorn, A., Kienholz, C., and Gubler, H.: Surface heat fluxes at coarse blocky Murtèl rock glacier (Engadine, eastern Swiss Alps), The Cryosphere, 18, 2103–2139, https://doi.org/10.5194/tc-18-2103-2024, 2024.
Archie, G. E.: The Electrical Resistivity Log as an Aid in Determining Some Reservoir Characteristics, Trans. AIME, 146, 54–62, https://doi.org/10.2118/942054-G, 1942.
Ballantyne, C. K.: Periglacial Geomorphology, John Wiley & Sons, 496 pp., 2018.
Benn, D. I., Wiseman, S., and Hands, K. A.: Growth and drainage of supraglacial lakes on debris-mantled Ngozumpa Glacier, Khumbu Himal, Nepal, J. Glaciol., 47, 626–638, https://doi.org/10.3189/172756501781831729, 2001.
Bosson, J.-B. and Lambiel, C.: Internal Structure and Current Evolution of Very Small Debris-Covered Glacier Systems Located in Alpine Permafrost Environments, Front. Earth Sci., 4, 39, https://doi.org/10.3389/feart.2016.00039, 2016.
Bosson, J.-B., Deline, P., Bodin, X., Schoeneich, P., Baron, L., Gardent, M., and Lambiel, C.: The influence of ground ice distribution on geomorphic dynamics since the Little Ice Age in proglacial areas of two cirque glacier systems, Earth Surf. Process. Landf., 40, 666–680, https://doi.org/10.1002/esp.3666, 2015.
Buri, P., Pellicciotti, F., Steiner, J. F., Miles, E. S., and Immerzeel, W. W.: A grid-based model of backwasting of supraglacial ice cliffs on debris-covered glaciers, Ann. Glaciol., 57, 199–211, https://doi.org/10.3189/2016AoG71A059, 2016.
Carturan, L., Rastner, P., and Paul, F.: On the disequilibrium response and climate change vulnerability of the mass-balance glaciers in the Alps, J. Glaciol., 66, 1034–1050, https://doi.org/10.1017/jog.2020.71, 2020.
Cicoira, A., Beutel, J., Faillettaz, J., and Vieli, A.: Water controls the seasonal rhythm of rock glacier flow, Earth Planet. Sci. Lett., 528, 115844, https://doi.org/10.1016/j.epsl.2019.115844, 2019.
Cicoira, A., Marcer, M., Gärtner‐Roer, I., Bodin, X., Arenson, L. U., and Vieli, A.: A general theory of rock glacier creep based on in‐situ and remote sensing observations, Permafr. Periglac. Process., 32, 139–153, https://doi.org/10.1002/ppp.2090, 2021.
Cicoira, A., Weber, S., Biri, A., Buchli, B., Delaloye, R., Da Forno, R., Gärtner-Roer, I., Gruber, S., Gsell, T., Hasler, A., Lim, R., Limpach, P., Mayoraz, R., Meyer, M., Noetzli, J., Phillips, M., Pointner, E., Raetzo, H., Scapozza, C., Strozzi, T., Thiele, L., Vieli, A., Vonder Mühll, D., Wirz, V., and Beutel, J.: In situ observations of the Swiss periglacial environment using GNSS instruments, Earth Syst. Sci. Data, 14, 5061–5091, https://doi.org/10.5194/essd-14-5061-2022, 2022.
Colombo, N., Salerno, F., Martin, M., Malandrino, M., Giardino, M., Serra, E., Godone, D., Said-Pullicino, D., Fratianni, S., Paro, L., Tartari, G., and Freppaz, M.: Influence of permafrost, rock and ice glaciers on chemistry of high-elevation ponds (NW Italian Alps), Sci. Total Environ., 685, 886–901, https://doi.org/10.1016/j.scitotenv.2019.06.233, 2019.
Cusicanqui, D., Bodin, X., Duvillard, P.-A., Schoeneich, P., Revil, A., Assier, A., Berthet, J., Peyron, M., Roudnitska, S., and Rabatel, A.: Glacier, permafrost and thermokarst interactions in Alpine terrain: Insights from seven decades of reconstructed dynamics of the Chauvet glacial and periglacial system (Southern French Alps), Earth Surf. Process. Landf., 48, 2595–2612, https://doi.org/10.1002/esp.5650, 2023.
Debella-Gilo, M. and Kääb, A.: Sub-pixel precision image matching for measuring surface displacements on mass movements using normalized cross-correlation, Remote Sens. Environ., 115, 130–142, https://doi.org/10.1016/j.rse.2010.08.012, 2011.
Del Siro, C., Scapozza, C., Perga, M.-E., and Lambiel, C.: Investigating the origin of solutes in rock glacier springs in the Swiss Alps: A conceptual model, Front. Earth Sci., 11, 1056305, https://doi.org/10.3389/feart.2023.1056305, 2023.
Draebing, D.: Application of refraction seismics in alpine permafrost studies: A review, Earth-Sci. Rev., 155, 136–152, https://doi.org/10.1016/j.earscirev.2016.02.006, 2016.
Etzelmüller, B. and Hagen, J. O.: Glacier-permafrost interaction in Arctic and alpine mountain environments with examples from southern Norway and Svalbard, Geol. Soc. Lond. Spec. Publ., 242, 11–27, https://doi.org/10.1144/GSL.SP.2005.242.01.02, 2005.
Gärtner-Roer, I. and Bast, A.: (Ground) Ice in the Proglacial Zone, in: Geomorphology of Proglacial Systems, Springer, 85–98, ISBN 978-3-319-94182-0, 2019.
Gärtner-Roer, I., Brunner, N., Delaloye, R., Haeberli, W., Kääb, A., and Thee, P.: Glacier–permafrost relations in a high-mountain environment: 5 decades of kinematic monitoring at the Gruben site, Swiss Alps, The Cryosphere, 16, 2083–2101, https://doi.org/10.5194/tc-16-2083-2022, 2022.
Glover, P. W. J.: A generalized Archie's law for n phases, Geophysics, 75, E247–E265, https://doi.org/10.1190/1.3509781, 2010.
Günther, T. and Rücker, C.: Boundless Electrical Resistivity Tomography BERT 2 – the user tutorial, version 2.4.1, http://www.resistivity.net/download/bert-tutorial.pdf (last access: 16 December 2024), 2023.
Haeberli, W.: Eistemperaturen in den Alpen, Z. Für Gletscherkunde Glazialgeol., XI/2, 203–220, 1976.
Haeberli, W.: Investigating glacier-permafrost relationships in high-mountain areas: historical background, selected examples and research needs, Geol. Soc. Lond. Spec. Publ., 242, 29–37, https://doi.org/10.1144/GSL.SP.2005.242.01.03, 2005.
Haeberli, W. and Vonder Mühll, D.: On the characteristics and possible origins of ice in rock glacier permafrost, Zeitschrift für Geomorphologie, 43–57, 1996.
Haeberli, W., Hallet, B., Arenson, L., Elconin, R., Humlum, O., Kääb, A., Kaufmann, V., Ladanyi, B., Matsuoka, N., Springman, S., and Mühll, D. V.: Permafrost creep and rock glacier dynamics, Permafr. Periglac. Process., 17, 189–214, https://doi.org/10.1002/ppp.561, 2006.
Haeberli, W., Arenson, L. U., Wee, J., Hauck, C., and Mölg, N.: Discriminating viscous-creep features (rock glaciers) in mountain permafrost from debris-covered glaciers – a commented test at the Gruben and Yerba Loca sites, Swiss Alps and Chilean Andes, The Cryosphere, 18, 1669–1683, https://doi.org/10.5194/tc-18-1669-2024, 2024.
Halla, C., Blöthe, J. H., Tapia Baldis, C., Trombotto Liaudat, D., Hilbich, C., Hauck, C., and Schrott, L.: Ice content and interannual water storage changes of an active rock glacier in the dry Andes of Argentina, The Cryosphere, 15, 1187–1213, https://doi.org/10.5194/tc-15-1187-2021, 2021.
Hauck, C.: Geophysical methods for detecting permafrost in high mountains, PhD Thesis, ETH Zurich, https://doi.org/10.3929/ethz-a-004172478, 2001.
Hauck, C. and Kneisel, C.: Applied geophysics in periglacial environments, Cambridge University Press, ISBN 978-0-521-88966-7, 2008.
Hauck, C., Böttcher, M., and Maurer, H.: A new model for estimating subsurface ice content based on combined electrical and seismic data sets, The Cryosphere, 5, 453–468, https://doi.org/10.5194/tc-5-453-2011, 2011.
Herring, T., Lewkowicz, A. G., Hauck, C., Hilbich, C., Mollaret, C., Oldenborger, G. A., Uhlemann, S., Farzamian, M., Calmels, F., and Scandroglio, R.: Best practices for using electrical resistivity tomography to investigate permafrost, Permafr. Periglac. Process., 34, 494–512, https://doi.org/10.1002/ppp.2207, 2023.
Hilbich, C.: Time-lapse refraction seismic tomography for the detection of ground ice degradation, The Cryosphere, 4, 243–259, https://doi.org/10.5194/tc-4-243-2010, 2010.
Hilbich, C., Hauck, C., Mollaret, C., Wainstein, P., and Arenson, L. U.: Towards accurate quantification of ice content in permafrost of the Central Andes – Part 1: Geophysics-based estimates from three different regions, The Cryosphere, 16, 1845–1872, https://doi.org/10.5194/tc-16-1845-2022, 2022.
Huss, M. and Fischer, M.: Sensitivity of Very Small Glaciers in the Swiss Alps to Future Climate Change, Front. Earth Sci., 4, 34, https://doi.org/10.3389/feart.2016.00034, 2016.
IPA Action Group RGIK: Guidelines for inventorying rock glaciers, https://doi.org/10.51363/unifr.srr.2023.002, 2023.
Isaksen, K., Ødegård, R. S., Eiken, T., and Sollid, J. L.: Composition, flow and development of two tongue-shaped rock glaciers in the permafrost of Svalbard, Permafr. Periglac. Process., 11, 241–257, https://doi.org/10.1002/1099-1530(200007/09)11:3<241::AID-PPP358>3.0.CO;2-A, 2000.
Ivy-Ochs, S., Kerschner, H., Maisch, M., Christl, M., Kubik, P. W., and Schlüchter, C.: Latest Pleistocene and Holocene glacier variations in the European Alps, Quat. Sci. Rev., 28, 2137–2149, https://doi.org/10.1016/j.quascirev.2009.03.009, 2009.
Kääb, A. and Haeberli, W.: Evolution of a high-mountain thermokarst lake in the Swiss Alps, Arct. Antarct. Alp. Res., 33, 385–390, 2001.
Kääb, A. and Vollmer, M.: Surface Geometry, Thickness Changes and Flow Fields on Creeping Mountain Permafrost: Automatic Extraction by Digital Image Analysis, Permafr. Periglac. Process., 11, 315–326, https://doi.org/10.1002/1099-1530(200012)11:4<315::AID-PPP365>3.0.CO;2-J, 2000.
Kääb, A., Haeberli, W., and Gudmundsson, G. H.: Analysing the creep of mountain permafrost using high precision aerial photogrammetry: 25 years of monitoring Gruben rock glacier, Swiss Alps, Permafr. Periglac. Process., 8, 409–426, https://doi.org/10.1002/(SICI)1099-1530(199710/12)8:4<409::AID-PPP267>3.0.CO;2-C, 1997.
Kellerer-Pirklbauer, A., Bodin, X., Delaloye, R., Lambiel, C., Gärtner-Roer, I., Bonnefoy-Demongeot, M., Carturan, L., Damm, B., Eulenstein, J., Fischer, A., Hartl, L., Ikeda, A., Kaufmann, V., Krainer, K., Matsuoka, N., Cella, U. M. D., Noetzli, J., Seppi, R., Scapozza, C., Schoeneich, P., Stocker-Waldhuber, M., Thibert, E., and Zumiani, M.: Acceleration and interannual variability of creep rates in mountain permafrost landforms (rock glacier velocities) in the European Alps in 1995–2022, Environ. Res. Lett., 19, 034022, https://doi.org/10.1088/1748-9326/ad25a4, 2024.
Kenner, R.: Geomorphological analysis on the interaction of Alpine glaciers and rock glaciers since the Little Ice Age, Land Degrad. Dev., 30, 580–591, https://doi.org/10.1002/ldr.3238, 2019.
Kenner, R., Noetzli, J., Hoelzle, M., Raetzo, H., and Phillips, M.: Distinguishing ice-rich and ice-poor permafrost to map ground temperatures and ground ice occurrence in the Swiss Alps, The Cryosphere, 13, 1925–1941, https://doi.org/10.5194/tc-13-1925-2019, 2019.
King, L., Fisch, W., Haeberli, W., and Wächter, H. P.: Comparison of resistivity and radio-echo sounding on rock glacier permafrost, Z. Für Gletscherkunde Glazialgeol., 32, 77–97, 1987.
Kneisel, C. and Kääb, A.: Mountain permafrost dynamics within a recently exposed glacier forefield inferred by a combined geomorphological, geophysical and photogrammetrical approach, Earth Surf. Process. Landf., 32, 1797–1810, https://doi.org/10.1002/esp.1488, 2007.
Kunz, J. and Kneisel, C.: Glacier–Permafrost Interaction at a Thrust Moraine Complex in the Glacier Forefield Muragl, Swiss Alps, Geosciences, 10, 205, https://doi.org/10.3390/geosciences10060205, 2020.
Kunz, J., Ullmann, T., and Kneisel, C.: Internal structure and recent dynamics of a moraine complex in an alpine glacier forefield revealed by geophysical surveying and Sentinel-1 InSAR time series, Geomorphology, 398, 108052, https://doi.org/10.1016/j.geomorph.2021.108052, 2022.
Lambiel, C. and Delaloye, R.: Contribution of real-time kinematic GPS in the study of creeping mountain permafrost: examples from the Western Swiss Alps, Permafr. Periglac. Process., 15, 229–241, https://doi.org/10.1002/ppp.496, 2004.
Maisch, M., Haeberli, W., Frauenfelder, R., Kääb, A., and Rothenbühler, C.: Lateglacial and Holocene evolution of glaciers and permafrost in the Val Muragl, Upper Engadin, Swiss Alps, in: Proceedings 8th International Conference on Permafrost, International Conference on Permafrost, 20–15 July 2003, Zurich, Switzerland, 717–722, ISBN 90 5809 582 7, 2003.
Mölg, N., Ferguson, J., Bolch, T., and Vieli, A.: On the influence of debris cover on glacier morphology: How high-relief structures evolve from smooth surfaces, Geomorphology, 357, 107092, https://doi.org/10.1016/j.geomorph.2020.107092, 2020.
Mollaret, C., Hilbich, C., Pellet, C., Flores-Orozco, A., Delaloye, R., and Hauck, C.: Mountain permafrost degradation documented through a network of permanent electrical resistivity tomography sites, The Cryosphere, 13, 2557–2578, https://doi.org/10.5194/tc-13-2557-2019, 2019.
Mollaret, C., Wagner, F. M., Hilbich, C., Scapozza, C., and Hauck, C.: Petrophysical Joint Inversion Applied to Alpine Permafrost Field Sites to Image Subsurface Ice, Water, Air, and Rock Contents, Front. Earth Sci., 8, 85, https://doi.org/10.3389/feart.2020.00085, 2020.
Monnier, S. and Kinnard, C.: Reconsidering the glacier to rock glacier transformation problem: New insights from the central Andes of Chile, Geomorphology, 238, 47–55, https://doi.org/10.1016/j.geomorph.2015.02.025, 2015.
Monnier, S., Kinnard, C., Surazakov, A., and Bossy, W.: Geomorphology, internal structure, and successive development of a glacier foreland in the semiarid Chilean Andes (Cerro Tapado, upper Elqui Valley, 30°08′ S., 69°55′ W.), Geomorphology, 207, 126–140, https://doi.org/10.1016/j.geomorph.2013.10.031, 2014.
Navarro, G., Valois, R., MacDonell, S., De Pasquale, G., and Díaz, J. P.: Internal structure and water routing of an ice-debris landform assemblage using multiple geophysical methods in the semiarid Andes, Front. Earth Sci., 11, 1102620, https://doi.org/10.3389/feart.2023.1102620, 2023.
Nicholson, L. and Benn, D. I.: Calculating ice melt beneath a debris layer using meteorological data, J. Glaciol., 52, 463–470, https://doi.org/10.3189/172756506781828584, 2006.
Noetzli, J. and Pellet, C. (Eds.): PERMOS 2023. Swiss Permafrost Bulletin 2022 (Annual report No. 4 on permafrost observation in the Swiss Alps), Cryospheric Commission of the Swiss Academy of Sciences, https://doi.org/10.13093/permos-bull-2023, 2023.
PERMOS: PERMOS Database, Swiss Permafrost Monitoring Network, Davos and Fribourg, Switzerland [data set], https://doi.org/10.13093/permos-2024-01, 2024.
Redpath, T. A. N., Sirguey, P., Fitzsimons, S. J., and Kääb, A.: Accuracy assessment for mapping glacier flow velocity and detecting flow dynamics from ASTER satellite imagery: Tasman Glacier, New Zealand, Remote Sens. Environ., 133, 90–101, https://doi.org/10.1016/j.rse.2013.02.008, 2013.
Reynard, E., Lambiel, C., Delaloye, R., Devaud, G., Baron, L., Chapellier, D., Marescot, L., and Monnet, R.: Glacier/permafrost relationships in forefields of small glaciers (Swiss Alps), in: Proceedings 8th international conference on permafrost, International Conference on Permafrost, 20–15 July 2003, Zurich, Switzerland, 947–952, ISBN 90 5809 582 7, 2003.
Ribolini, A., Guglielmin, M., Fabre, D., Bodin, X., Marchisio, M., Sartini, S., Spagnolo, M., and Schoeneich, P.: The internal structure of rock glaciers and recently deglaciated slopes as revealed by geoelectrical tomography: insights on permafrost and recent glacial evolution in the Central and Western Alps (Italy–France), Quat. Sci. Rev., 29, 507–521, https://doi.org/10.1016/j.quascirev.2009.10.008, 2010.
Robson, B. A., Bolch, T., MacDonell, S., Hölbling, D., Rastner, P., and Schaffer, N.: Automated detection of rock glaciers using deep learning and object-based image analysis, Remote Sens. Environ., 250, 112033, https://doi.org/10.1016/j.rse.2020.112033, 2020.
Rounce, D. R., Quincey, D. J., and McKinney, D. C.: Debris-covered glacier energy balance model for Imja–Lhotse Shar Glacier in the Everest region of Nepal, The Cryosphere, 9, 2295–2310, https://doi.org/10.5194/tc-9-2295-2015, 2015.
Rücker, C., Günther, T., and Wagner, F. M.: pyGIMLi: An open-source library for modelling and inversion in geophysics, Comput. Geosci., 109, 106–123, https://doi.org/10.1016/j.cageo.2017.07.011, 2017.
Seppi, R., Zanoner, T., Carton, A., Bondesan, A., Francese, R., Carturan, L., Zumiani, M., Giorgi, M., and Ninfo, A.: Current transition from glacial to periglacial processes in the Dolomites (South-Eastern Alps), Geomorphology, 228, 71–86, https://doi.org/10.1016/j.geomorph.2014.08.025, 2015.
Seppi, R., Carturan, L., Carton, A., Zanoner, T., Zumiani, M., Cazorzi, F., Bertone, A., Baroni, C., and Salvatore, M. C.: Decoupled kinematics of two neighbouring permafrost creeping landforms in the Eastern Italian Alps, Earth Surf. Process. Landf., 44, 2703–2719, https://doi.org/10.1002/esp.4698, 2019.
Staub, B., Lambiel, C., and Delaloye, R.: Rock glacier creep as a thermally-driven phenomenon: A decade of inter-annual observation from the Swiss Alps, XI International Conference on Permafrost – Book of Abstracts, 96–97, https://doi.org/10.2312/GFZ.LIS.2016.001, 2016.
Streletskiy, D., Noetzli, J., Smith, S. L., Vieira, G., Schoeneich, P., Hrbacek, F., and Irrgang, A. M.: Strategy and Implementation Plan for the Global Terrestrial Network for Permafrost (GTN-P) 2021–2024, Zenodo [data set], https://doi.org/10.5281/zenodo.6075468, 2021.
Sun, Z., Hu, Y., Racoviteanu, A., Liu, L., Harrison, S., Wang, X., Cai, J., Guo, X., He, Y., and Yuan, H.: TPRoGI: a comprehensive rock glacier inventory for the Tibetan Plateau using deep learning, Earth Syst. Sci. Data Discuss. [preprint], https://doi.org/10.5194/essd-2024-28, in review, 2024.
Timur, A.: Velocity of compressional waves in porous media at permafrost temperatures, Geophysics, 33, 584–595, https://doi.org/10.1190/1.1439954, 1968.
Vivero, S., Bodin, X., Farías-Barahona, D., MacDonell, S., Schaffer, N., Robson, B. A., and Lambiel, C.: Combination of Aerial, Satellite, and UAV Photogrammetry for Quantifying Rock Glacier Kinematics in the Dry Andes of Chile (30° S) Since the 1950s, Front. Remote Sens., 2, https://doi.org/10.3389/frsen.2021.784015, 2021.
Vivero, S., Hendrickx, H., Frankl, A., Delaloye, R., and Lambiel, C.: Kinematics and geomorphological changes of a destabilising rock glacier captured from close-range sensing techniques (Tsarmine rock glacier, Western Swiss Alps), Front. Earth Sci., 10, 1017949, https://doi.org/10.3389/feart.2022.1017949, 2022.
Wagner, F. M., Mollaret, C., Günther, T., Kemna, A., and Hauck, C.: Quantitative imaging of water, ice and air in permafrost systems through petrophysical joint inversion of seismic refraction and electrical resistivity data, Geophys. J. Int., 219, 1866–1875, https://doi.org/10.1093/gji/ggz402, 2019.
Wee, J. and Delaloye, R.: Post-glacial dynamics of an alpine Little Ice Age glacitectonized frozen landform (Aget, western Swiss Alps), Permafr. Periglac. Process., 33, 370–385, https://doi.org/10.1002/ppp.2158, 2022.
Whalley, W. B.: Gruben glacier and rock glacier, Wallis, Switzerland: glacier ice exposures and their interpretation, Geogr. Ann. Ser. Phys. Geogr., 102, 141–161, https://doi.org/10.1080/04353676.2020.1765578, 2020.
Wirz, V., Beutel, J., Gruber, S., Gubler, S., and Purves, R. S.: Estimating velocity from noisy GPS data for investigating the temporal variability of slope movements, Nat. Hazards Earth Syst. Sci., 14, 2503–2520, https://doi.org/10.5194/nhess-14-2503-2014, 2014.
Wirz, V., Geertsema, M., Gruber, S., and Purves, R. S.: Temporal variability of diverse mountain permafrost slope movements derived from multi-year daily GPS data, Mattertal, Switzerland, Landslides, 13, 67–83, https://doi.org/10.1007/s10346-014-0544-3, 2016.


