the Creative Commons Attribution 4.0 License.
the Creative Commons Attribution 4.0 License.
Use of multiple reference data sources to cross-validate gridded snow water equivalent products over North America
Colleen Mortimer
Lawrence Mudryk
Eunsang Cho
Chris Derksen
Mike Brady
Carrie Vuyovich
We use snow course and airborne gamma data available over North America to compare the validation of gridded snow water equivalent (SWE) products when evaluated with one reference dataset versus the other. We assess product performance across both non-mountainous and mountainous regions, determining the sensitivity of relative product rankings and absolute performance measures. In non-mountainous areas, product performance is insensitive to the choice of SWE reference dataset (snow course or airborne gamma): the validation statistics (bias, unbiased root mean squared error, and correlation) are consistent with one another. In mountainous areas, the choice of reference dataset has little impact on relative product ranking but a large impact on assessed error magnitudes (bias and unbiased root mean squared error). Further analysis indicates the agreement in non-mountainous regions occurs because the reference SWE estimates themselves agree up to spatial scales of at least 50 km, comparable to the grid spacing of most available SWE products. In mountain areas, there is poor agreement between the reference datasets, even at short distances (< 5 km). We determine that differences in assessed error magnitudes result primarily from the range of SWE magnitudes sampled by each method, although their respective spatiotemporal distribution and elevation differences between the reference measurements and grid centroids also play a role. We use this understanding to produce a combined reference SWE dataset for North America, applicable to future gridded SWE product evaluations and other applications.
- Article
(6809 KB) - Full-text XML
-
Supplement
(1470 KB) - BibTeX
- EndNote
Snow water equivalent (SWE) is an essential climate variable critical to determining freshwater availability in montane and northern regions (Barnett et al., 2005; Clark et al., 2011). Accurate estimates of SWE are key to the verification of seasonal forecasts (Sospedra-Alfonso et al., 2016), skilled streamflow predictions particularly at long lead times (De Roo et al., 2003; Liu et al., 2012; Wood et al., 2016), and efficient hydropower operations (Turcotte et al., 2007; Magnusson et al., 2020). Long-term spatially complete SWE records are necessary for climate assessments (e.g. Mudryk et al., 2022), effective water management (Ralph et al., 2014), and flood prediction (Vionnet et al., 2020).
Numerous publicly available gridded SWE products exist, generated from a variety of approaches ranging from earth observation (EO) (e.g. Luojus et al., 2021) to reanalysis products (e.g. Hersbach et al., 2020), snow models of varying complexity forced by reanalysis data (e.g. Brun et al., 2013), and data assimilation schemes (e.g. Zeng et al., 2018). Assessment of the quality of these products faces two challenges. First, there are few independent reference datasets with long time series and well-distributed spatial coverage across the range of snow-climate zones. Second, even where and when reference data are available, they are challenging to apply in a meaningful way because of the spatial mismatch with the typically coarse resolution of the gridded SWE products.
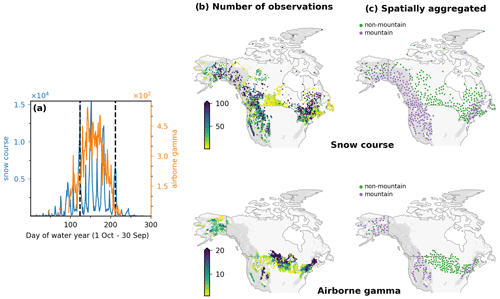
Figure 1Reference data distribution. (a) Total number of measurements by day of water year (1 October–30 September); vertical dotted lines delineate February–April period assessed in this study. (b) Number of snow course (top) and airborne gamma (bottom) measurements during February through April 1980–2020. (c) Spatially aggregated reference data (Sect. 3.1) separated into mountain (purple) and non-mountain (green) domains. Grey shading in (b) and (c) indicates mountain region.
Point-based SWE measurements from snow pillows (Beaumont, 1965), snow scales (Johnson, 2004; Smith et al., 2017), and passive gamma radiation sensors (Kodama et al., 1979; Paquet et al., 2008) provide continuous records of SWE at a specific location. However, the considerable spatial variability of SWE means that these point-based measurements are of questionable value when applied to larger areas (Meromy et al., 2013) and are thus not suitable for the evaluation of relatively coarse-scale gridded data. Snow courses on the other hand, consist of multiple measurements along a transect several hundreds of metres to kilometres in length that are averaged together to provide a single SWE value (WMO, 2018). These measurements better sample the sub-grid-scale variability than a single-point measurement and so are more effective in capturing the larger-scale average. As a result, snow course data can effectively discern subtle differences in performance between SWE products (Mortimer et al., 2022). SWE estimates from airborne gamma surveys (which measure the attenuation of water mass by naturally emitted gamma radiation) are averaged across 300 m wide footprints and along 15–20 km long flight lines. Like snow courses, they also effectively capture the larger-scale average and are appropriate to assess the accuracy of gridded SWE products (Cho et al., 2019, 2020).
SWE reference measurements are unevenly distributed in space and time (Fig. 1) and, as such, may not sample the complete range of naturally occurring SWE values. If a particular dataset is tuned to a specific environment or performs better across a certain range of SWE, the differing spatiotemporal distributions and sampled SWE ranges of separate reference datasets could influence the determined product performance. For example, some EO-based products have reasonable performance up to approximately 150 mm SWE (Pulliainen, 2006; Luojus et al., 2021) and so perform well against a reference dataset composed primarily of low and moderate SWE values but will have poorer performance when validated using a reference dataset that samples across regions with higher SWE.
Independent assessments of gridded SWE products using either snow courses (e.g. Mortimer et al., 2020, 2022) or airborne gamma SWE (e.g. Cho et al., 2019, 2020) have been conducted, but a unified assessment of gridded SWE products using both reference datasets is lacking. Combining multiple reference datasets can improve the rigour of such assessments, but interpreting and reconciling product accuracies obtained with multiple reference datasets is hindered by their differing sampling methodologies and limited uncertainty characterization, as well as their spatiotemporal distributions. Here, we investigate the agreement in reference SWE reported by the two reference datasets at various spatial and temporal scales and explore how the choice of reference dataset affects the assessed accuracy and ranking of gridded SWE products. Analysis contained herein resulted in the creation of a combined (snow course + airborne gamma) reference dataset that is used to critically assess 23 gridded SWE products across the Northern Hemisphere in Mudryk et al. (2024).
2.1 Gridded datasets
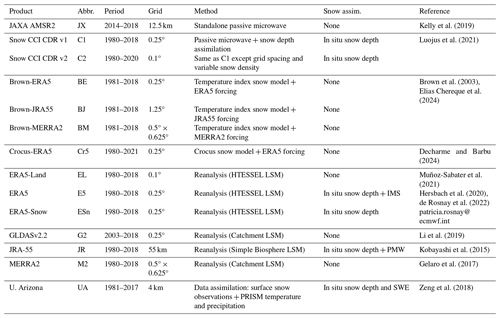
Fourteen gridded SWE products were validated in this study (Table 1). Products include those which utilize EO data, coupled land–atmosphere reanalysis (with and without separate snow models and/or data assimilation), snow models of varying complexity driven by reanalysis data, and data assimilation schemes. Some products (e.g. ERA5, JRA-55, Snow CCI, and U. Arizona) assimilate in situ snow depth measurements, while others (e.g. ERA5-Land, MERRA2 and GLDASv2.2) do not. Products are described in the references listed in Table 1 except for ERA5-Snow, which is an offline run of ERA5 without the assimilation of the IMS snow extent product to remove a temporal discontinuity associated with the introduction of its assimilation in 2004 (Mortimer et al., 2020; Ochi et al., 2023). All products cover the Northern Hemisphere except the U. Arizona dataset, which is limited to the conterminous US (CONUS). The current product suite includes datasets which were part of a previous evaluation reported in Mortimer et al. (2020), extended now with updated product versions and entirely new products.
2.2 Reference datasets
2.2.1 Snow course SWE
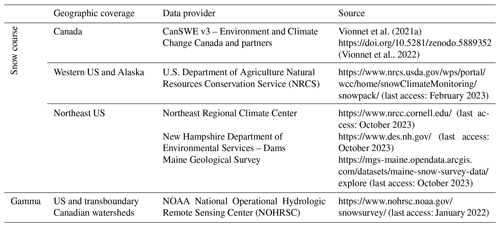
Snow courses, also known as snow transects, consist of manual gravimetric snow measurements made at multiple locations along a predefined transect averaged together to obtain a single SWE value on a given date (WMO, 2018). In Canada, measurements are typically conducted once or twice per month during the snow season, although some sites are only sampled near the timing of peak SWE, and measurements are sparse across the Arctic (Vionnet et al., 2021a). In the US, measurements generally start in late December in high-elevation areas of the west and throughout Alaska and after 1 January in the northeast. Measurement uncertainty for various snow samplers ranges from ∼ 3 % to 13 % (Table 2 in Dixon and Boon, 2012, and references therein; López-Moreno et al., 2020). The snow course measurements used in this study (Table 2, Fig. 1) are independent of the data assimilated into any of the gridded SWE products, with the exception of SnowCCI v2, which used an older Canadian dataset (Brown et al., 2019) to interpolate spatially and temporally varying snow densities (Luojus et al., 2021). The snow course and gamma SWE reference data used in this study are available from Mortimer and Vionnet (2024).
2.2.2 Airborne gamma SWE
The attenuation of gamma radiation by the water mass of the snowpack (liquid or solid phase) can be related to SWE provided the background soil moisture is properly accounted for (Carroll, 2001). The US National Oceanographic and Atmospheric Administration's (NOAA) National Operational Hydrologic Remote Sensing Center (NOHRSC) snow survey program (https://www.nohrsc.noaa.gov/snowsurvey/, last access: October 2023) has been using airborne gamma measurements to estimate SWE operationally since 1979 (Carroll, 2001). Flights are conducted to measure gamma radiation when the ground is snow-free (background attenuation by soil moisture only) and again when the ground is snow-covered (attenuation by soil moisture and the snowpack). The operational equations used to relate gamma radiation to SWE are described in Carroll (2001). The detection limit for this method is ∼ 1000 mm SWE.
The NOHRSC snow survey network (Table 2, Fig. 1) consists of approximately 2400 flight lines in 25 US states and seven Canadian provinces (Carroll, 2001). SWE is reported as an aerial average for each flight line, which is typically 15–20 km long across a 300 m wide footprint. Flights are conducted near the peak of the snow accumulation season and during melt when SWE information is critically needed for water supply outlook and flood forecasting (typically February through April depending on the location). Spatial coverage of this dataset has varied over the years, especially in the western US; flights over Alaska only began in 2003. Accuracy of these data, determined from comparisons with coincident ground-based snow observations during specific field campaigns, is 4 %–10 % in prairie environments across a SWE range of 20–150 mm (Carroll and Schaake, 1983) and 23 mm in densely forested terrain across a SWE range of 20–480 mm (Carroll and Vose, 1984).
3.1 Evaluation of gridded datasets
The analysis period for each product is listed in Table 1 and generally covers 1980–2020. Our analysis was restricted to February through April, when the ratio of snow courses to gamma SWE is most consistent (Fig. 1a). Validation statistics (bias, unbiased root mean squared error – (uRMSE), and correlation) were computed for North America, except U. Arizona (CONUS-only). Our uRMSE estimate is defined as the square root of the mean squared error minus the squared bias. Statistics are calculated for all non-zero SWE ≤ 1000 mm (both reference and product SWE must be ≤ 1000 mm for inclusion) as well as for a subset of cases when SWE is ≤ 250 mm (see Sect. 4.4). The upper threshold (1000 mm), which is consistent with the maximum detection limit of the airborne gamma SWE method, removes < 2 % of the snow course data (4 % of the data in mountain regions).
Reference SWE was matched up in space and time with gridded SWE at the native product resolution. To reduce errors from mismatched water and ice masks, we retained reference sites that have SWE estimates from two-thirds of the products listed in Table 1 as this number is roughly equivalent to the number of products covering the full spatial and temporal domain. For gamma SWE, we used the midpoint of each flight line for geolocation, which differs slightly from Cho et al. (2019, 2020) and Tuttle et al. (2018), who weighted the average of the gamma SWE footprint (using a fixed diameter of 330 m assigned to each flight line) contained within each product grid cell. We found that both methods produced similar results, so we used the flight line midpoint for simplicity.
The reference data were averaged to the resolution of each product in its native grid. Next, to reduce oversampling in areas with spatially dense networks, all product–reference pairs within sequential 200 km windows were averaged (see Sect. S0 in the Supplement). This averaging window corresponds to the range of non-mountain SWE variability (∼ 150–250 km, Fig. S5 in the Supplement, Pulliainen et al., 2020). Snow course and gamma SWE were considered separately, and mountain measurements were separated from non-mountain ones. This aggregation approach aims to provide a more even distribution of product errors across land cover types and snow classes. Sensitivity analysis of various spatial aggregation windows between 4 km (corresponding to the finest resolution product analyzed) and 500 km showed little impact of aggregation window size on product ranking (Fig. S1 in the Supplement, limited to 300 km for display purposes). In general, product metrics improve with aggregation window size up to ∼ 100 km, but inter-product differences remain fairly consistent. We selected a 200 km aggregation window as a compromise between sample size and spatial distribution. This approach, which effectively averages the reference data at the scale of the native product grid and then averages product errors within a larger area, is sufficiently flexible to enable the tests of covariates applied in Sect. 4.3 through 4.5.
Due to the well-documented challenges in estimating and validating mountain SWE at coarse resolutions (Dozier et al., 2016; López-Moreno et al., 2013; Wrzesien et al., 2019), we also computed metrics separately for mountain and non-mountain reference data. Mountain sites are defined as those intersecting the Global Mountain Biodiversity Assessment (GMBA) Mountain Inventory v2 (Snethlage et al., 2022a, b; https://www.earthenv.org/mountains, last access: June 2023) with a 25 km buffer or with a 2° slope mask derived from the GETASSE30 DEM. The 25 km buffer was added to the GMBA mountain mask to avoid contamination of product grid cells with fractional mountain terrain. SnowCCI products were excluded from our analysis of mountain regions because SWE is not provided across a complex terrain mask applied to those datasets.
3.2 Diagnosing the impact of reference data characteristics
We evaluated how differences in the measurement method (snow course versus airborne gamma), the spatiotemporal distribution, and the SWE magnitude of the reference datasets, and differences in the elevation of the reference measurement compared to the product grid impact both absolute and relative accuracies of the gridded products. For each of these covariates, a difference-of-means test (two-sided independent Student's t test) was applied to determine whether the mean product metrics calculated using snow courses are different from those obtained with airborne gamma, using a significance level of 95 %. Consistency in product rankings was assessed with the Spearman rank correlation coefficient.
3.2.1 Reference data measurement method
To investigate how the reference measurement method impacts the observed reference SWE value, we quantified the agreement between snow courses and airborne gamma SWE data at various spatial separations (5, 10, 25, and 50 km) and temporal lags (0, ± 3, ± 7 and ± 10 d), separately for mountain and non-mountain regions. This analysis was conducted on the non-aggregated reference data (Fig. 1b). The spatial separation of measurements in the two datasets was taken as the linear distance between the snow course location and the gamma flight line midpoint. We assigned a 10 % uncertainty to both reference datasets, informed by the measurement accuracies described in Sect. 2.2. Addition in quadrature of these independent uncertainties yields a combined baseline uncertainty of ∼ 14 % for the airborne gamma – snow course comparison. This value is likely an underestimate and does not consider issues of spatial representativeness and spatial scale which cannot be quantified with the available data used in this study, nor does it consider operator error in the case of snow courses (López-Moreno et al., 2020).
3.2.2 Spatial distribution of the reference data
To evaluate the impact of differences in spatial coverage beyond the scale of a typical product grid cell (Table 1) on the relative and absolute product accuracies calculated with either reference dataset, we generated matched reference data subsets. These subsets are composed of snow course sites having at least one gamma site within a specified linear distance and vice versa. We tested various distances between 25 and 500 km, separately for mountain and non-mountain sites (i.e. reference sites, where both are classified as either mountain or non-mountain). For each spatial separation distance, the matched snow course and gamma reference data were each spatially aggregated using a 200 km aggregation window as described in Sect. 3.1. In this analysis of spatial distribution, no restriction was placed on temporal separation of the reference data, meaning the reference sites can be from any date during the analysis period. In this way, spatial distribution serves as a proxy for similar land cover types.
3.2.3 SWE magnitude
To evaluate the impact of SWE magnitude on relative and absolute product accuracies calculated with either reference dataset, we calculated validation metrics for sequential 50 mm SWE bins based on the February–April climatological mean of the spatially aggregated reference sites (Sect. 3.1, Fig. 1c) having at least five observations during the study period.
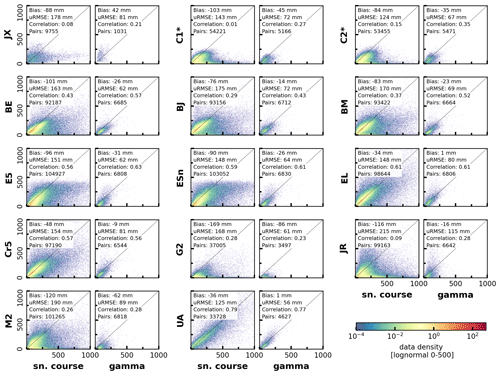
Figure 2Product versus reference SWE density scatter for measurements > 0 and ≤ 1000 mm during February–April. See Table 1 for product names, descriptions, and time periods. Note that Snow CCI (*) excludes areas of complex terrain, U. Arizona is limited to CONUS, and JAXA-AMSR2 (2014–2018) and GLDASv2.2 (2003–2018) are limited temporally.
3.2.4 Elevation bias
Mountain snowpacks exhibit considerable spatial and temporal variability at short scales, associated with a suite of complex and interrelated factors including orientation, wind exposure, vegetation cover, slope, and elevation (e.g. Clark et al., 2011; López-Moreno and Stähli, 2008; Mott et al., 2010, 2018; Pomeroy et al., 1998, 2007, and references therein; Vionnet et al., 2021b). Previous studies have often identified a positive correlation between elevation and SWE that tapers off at high elevations above the treeline (e.g. Durand et al., 2009; Grünewald et al., 2014; Kirchner et al., 2014; Lehning et al., 2011; Rohrer et al., 1994), which is above the elevation of most of our reference data. Therefore, if reference measurements are consistently collected at higher (lower) elevations relative to a product grid cell centroid, we might expect them to have more (less) SWE compared to the grid cell average. To understand the impact of elevation bias on SWE validation statistics, we compared the elevation of product grid centroids with the elevation reference data sites. We used the model surface geopotential height converted to metres or in the case of Crocus and U Arizona, the DEM used by the model. For EO products which do not rely on any type of elevation information, we used the GLOB30 DEM re-gridded to the native product grid. Reference data elevations were screened for outliers using the USGS 30 m NED1 DEM (NED2 60 m DEM for Alaska) (Gesch et al., 2018), and sites with metadata elevations > |1000| m from the NED1 DEM were removed. Reference sites without accompanying metadata elevations (16 gamma sites, 33 snow course sites) were assigned the intersecting USGS NED DEM elevation. Validation statistics were calculated for sequential 100 m elevation bias bins.
4.1 Overall gridded product performance
The relationship between gridded SWE products and reference data over the full spatial domain (using the aggregated reference data as shown in Fig. 1c) is shown in Fig. 2. There are clear differences in performance among the products. U. Arizona outperforms all products regardless of the reference dataset, but the dataset domain and hence the validation statistics are limited to CONUS. Considering the entire North America domain, ERA5-Land, ERA5, ERA5-Snow, and Crocus-ERA5 consistently rank among the top half of the products evaluated, albeit with some differences according to the metric and reference dataset. The Brown temperature index model products, despite employing relatively simple formulations for snow processes, also have reasonable performance, although the JRA-55 forcing results in poor correlations against snow courses (Fig. 2). A strength of the U. Arizona, ERA5-Land, and Crocus-ERA5 products is that they show good performance across the full range of reference SWE values (Fig. 2). While ERA5 and ERA5-Snow have strong correlations against both reference datasets, these products suffer from larger biases in high SWE regions because their maximum snow depth is fixed at 1.4 m (corresponding to ∼ 500 mm SWE depending on the snow density) to prevent excessive snow accumulation at high elevations and latitudes (Patricia de Rosnay, personal communication, 2022). The JAXA-AMSRE, JRA-55, MERRA2, and GLDASv2.2 products exhibit the weakest performance. SWE estimates from these products have very weak statistical relationships to observed SWE. This makes them unsuitable to discern the impact of covariates (i.e., sampling methodology, spatiotemporal distribution, SWE magnitude, product–reference elevation bias as described in Sect. 3.2) on the differing product statistics obtained with snow courses or airborne gamma SWE, so they are excluded from this analysis in Sect. 4.3 through 4.5. The best-performing EO-based products (Snow CCI) saturate when reference SWE exceeds ∼ 250 mm (Fig. 2), which is an important consideration for the appropriate use of these datasets.
The validation statistics shown in Fig. 2 provide benchmark information on the performance of currently available gridded SWE products over North America, building on an earlier assessment of a previous generation of products (Mortimer et al., 2020). A detailed analysis of these and nine other gridded SWE products over the Northern Hemisphere is provided in Mudryk et al. (2024). Here we focus on the impact of choice of reference dataset on relative and absolute product accuracies. For all products, the bias magnitude and uRMSE are larger using the snow course reference dataset as compared to the airborne gamma reference dataset. This difference is due in large part to the higher proportion of mountain snow course sites for which validation statistics are poor (Fig. 3): over 50 % of the snow course data are located in mountain areas compared to just over 30 % of the gamma data. Product performance is considerably worse in mountain compared to non-mountain regions (Fig. 3), but the discrepancy is larger when snow courses are used as the reference data. In the following sections, we evaluate how differences in measurement method, spatiotemporal distribution, reference SWE magnitude, and differences between matched reference and gridded product elevations impact both absolute and relative product statistics. A subset of products with coverage of both mountain and non-mountain areas and a reasonable relationship with reference SWE as determined from Fig. 2 – Crocus-ERA5, Brown-ERA5, Brown-MERRA2, Brown-JRA55, ERA5, ERA5-Land, ERA5-Snow, and U. Arizona – are used for this analysis.
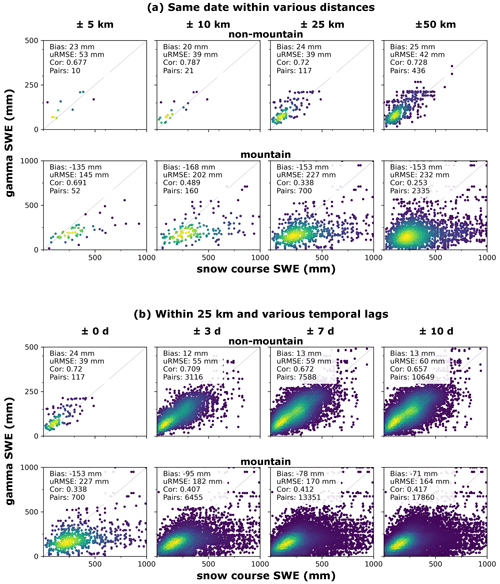
Figure 4Snow course versus gamma measurements. (a) Measurements on the same date within 5, 10, 25, and 50 km for SWE > 0 and ≤ 1000 mm. (b) Measurements within 25 km on the same date (0 d) and within 3, 7, and 10 d.
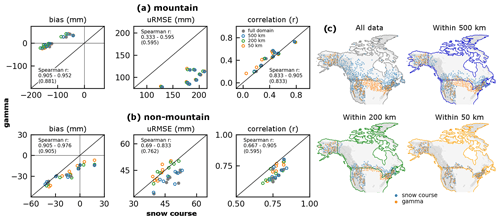
Figure 5Product performance metrics computed with airborne gamma SWE versus snow courses for the full spatial domain (solid grey circles) and for reference data spatial subsets (c), defined by the linear distance between the gamma and snow course sites for (a) mountain and (b) non-mountain regions. For example, 200 km refers to metrics calculated using only the subset of gamma (snow course) reference data having a snow course (gamma) site within 200 km. Each dot represents one of the products Brown-ERA5, Brown-JRA55, Brown-MERRA2, ERA5, ERA5-Snow, ERA5-Land, Crocus-ERA5, and U. Arizona. Spearman correlation coefficients, which assess the agreement in product rankings calculated with snow courses versus gamma SWE, are summarized by the range across the spatial lags tested and for the full domain (parentheses).
4.2 Reference data measurement method
Comparisons of snow course versus airborne gamma reference SWE at various spatial separation distances (Fig. 4a) and temporal lags (Fig. 4b) demonstrate poor agreement in the mountain regions, even at short distances and with no temporal lag (Fig. 4a, bottom row). Depending on the spatial separation distance and temporal lag, the mean difference between gamma and snow course measurements in mountain regions is between 35 % and 55 % of the mean reference SWE. The correlation of the two mountain reference measurements drops markedly with increasing distance. The agreement between snow course and gamma reference SWE is much stronger in non-mountain regions: when constrained to the same dates, the mean difference in non-mountain SWE measured by gamma and snow courses is ∼ 20 % across all spatial distances tested (Fig. 4a top row shows mean bias ∼ 20 mm and mean reference SWE ∼ 100 mm). Relaxing the temporal constraint (Fig. 4b) allows for many more paired measurements such that the mean difference in non-mountain regions drops to less than 12 % of the mean reference SWE for temporal lags larger than zero (Fig. 4b, top row); this is within the 14 % baseline uncertainty estimate for this comparison (Sect. 3.2.1). In addition, for all separation distances and temporal lags, the non-mountain reference SWE values are reasonably correlated with one another: generally above 0.7, although their correlation drops slightly at the longest temporal lags. Therefore, we conclude that in non-mountain terrain, the reference dataset measurement method does not result in detectable differences in the determination of product performance, up to the spatial (50 km) and temporal (10 d) lags evaluated. We note that the agreement of the reference datasets in non-mountain regions as evaluated up to 50 km is comparable to the grid spacing of the majority of SWE products considered (Table 1). However, because the majority (> 90 %) of the matched data are located in either the forested northeast or Central Great Plains of the US (NA L1 Great Plains Ecoregion as determined from https://www.epa.gov/eco-research/ecoregions-north-america, last access: November 2021), we are unable to extrapolate this result directly to all North American non-mountainous regions.
4.3 Reference data spatial distribution
Having directly compared the two sources of reference SWE (Sect. 4.2), in the following sections, we provide comparisons of product performance metrics calculated using one reference dataset or the other and demonstrate under what conditions and to what extent they agree. This analysis is restricted to the Crocus-ERA5, Brown-ERA5, Brown-MERRA2, Brown-JRA55, ERA5, ERA5-Land, ERA5-Snow, and U. Arizona products (see Sect. 4.1). First, we reassess differences for this product suite over the full spatial and temporal domain, separately for mountain and non-mountain areas. Over the full domain, there is reasonable agreement in relative product rankings of all three metrics in both mountain and non-mountain regions (expressed by Spearman correlation coefficients, Fig. 5). However, there is poor agreement on the absolute bias and uRMSE magnitudes, especially in mountain regions: the grey circles do not lie on the 1:1 line, and the mean difference in product bias and uRMSE computed with either reference dataset is larger than the uncertainty envelope attributed to measurement error (Fig. S2 in the Supplement, orange dots). Further, the mean product statistics calculated with either reference dataset are distinct from each other (p < 0.05) except for the bias in non-mountain regions and the correlation in mountain regions (Fig. S2, blue dots).
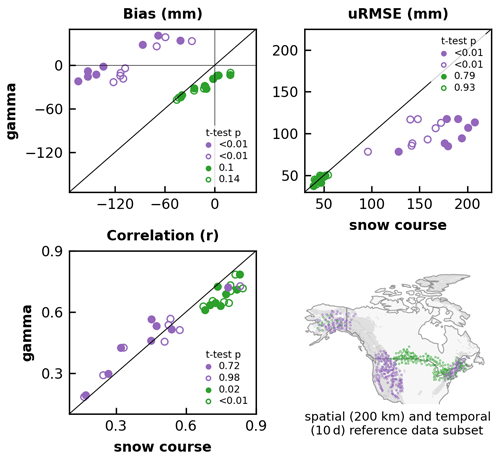
Figure 6Product metrics computed with airborne gamma versus snow course sites within 200 km of each other collected at any time during February–April 1980–2020 (solid circles) and for a subset of reference measurements collected within 10 d of each other (hollow circles). Each dot represents one of the products: Brown-ERA5, Brown-JRA55, Brown-MERRA2, ERA5, ERA5-Snow, ERA5-Land, Crocus-ERA5, and U. Arizona, in mountain (purple) and non-mountain (green) regions. The p values from the two-sided independent Student's t test (Sect. 3.2) compare the difference in mean product statistic computed with snow course and with airborne gamma. When p < 0.05 the ensemble mean metrics computed using either reference data are statistically distinguishable at 95 % confidence. The map on the lower right shows reference data locations of the spatially and temporally constrained subset (not separated by reference data type for display purposes).
The statistical differences in metrics assessed from the snow course versus airborne gamma reference datasets as described above may stem from differences in where each reference dataset has coverage (Fig. 1). Gamma SWE is limited to the US and southern Canada, and so it misses the high SWE areas of the boreal forest (e.g. northern Quebec, Canada), which is sampled by snow courses. Roughly one-third of the gamma data are in the Central Plains (NA L1 Great Plains Ecoregion), which has limited (< 2.4 %) snow course data for the paired analysis described in Sect. 4.2. Conversely, 12 % of the snow course data are in arctic regions (NA L1 Ecoregions – Arctic Cordillera, Taiga, Tundra, Hudson Plains) compared to just 3 % of the gamma data. Unless all products perform equally well across all land cover types (which is very unlikely), these spatial differences are likely to result in differing product accuracies calculated with the two reference datasets. To examine how sensitive the assessed product performance is to differences in spatial coverage of the reference data we recalculated performance metrics using only reference sites within 25 to 500 km (Sect. 3.2.2) of each other (Fig. 5, for display purposes only 50, 200 and 500 km are shown).
Spatially restricting the reference data had a minor impact on the agreement in product ranking (Spearman correlation coefficients, Fig. 5). In mountain regions, spatially restricting the analysis domain resulted in minimal change in product metrics (Fig. 5a), and thus there was no improvement in the discrepancy in product metrics according to choice of reference dataset (Fig. S2). Spatially restricting the reference data did, however, alter the uRMSE in non-mountain regions (Fig. 5b). At smaller separation distances (< 300 km) the discrepancy in product uRMSE decreased (Fig. 5b: green and orange circles fall close to the 1:1 line) such that the values calculated with either snow courses or airborne gamma reference data are statistically indistinguishable from one another (Fig. S2 solid blue line above the dashed horizontal line).
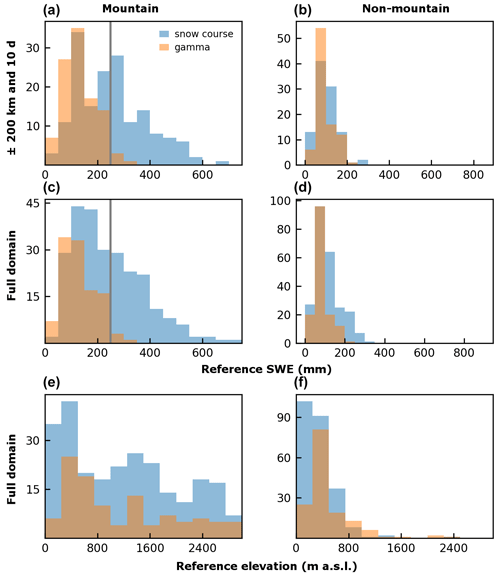
Figure 7Climatological reference SWE (a–d) and elevation (e, f) distribution of the aggregated reference data (Fig. 1c) for the spatially and temporally restricted subset (a, b) and the full domain (e, f) for mountain (a, c, e) and non-mountain (b, d, f) regions. The spatiotemporal subset (a, b) is the same reference dataset used to calculate the product statistics shown in Fig. 6 (hollow dots). The y-axis values are total counts. The 250 mm SWE threshold applied in the analysis of mountain regions (Figs. 9 and 10) is indicated by the grey vertical line.
The fact that the two reference datasets still yield different performance metrics in mountain regions despite the spatial restrictions applied above suggests that (i) our spatial domains are not sufficiently restrictive, or that we need to also consider the temporal domain, or that (ii) additional factors such as SWE magnitude or elevation bias have a greater impact on reference dataset performance agreement than spatial distribution does. To test the impact of temporal distribution on absolute and relative product statistics, we further restricted the reference dataset to only include nearby (within 200 km) measurements collected within 10 d of each other (Fig. 6). For the spatial distance we considered sample size and the distance at which non-mountain statistics converged. Specifically, in non-mountain areas there was no difference in mean product uRMSE computed with either reference dataset when constrained to sites within 250 km of each other, and there is lower agreement in non-mountain product ranking (bias and correlation) at spatial separation distances > ∼ 150–200 km (Fig. S3 in the Supplement). This spatial subset of sites within 200 km of each other comprises most of the mountain observations (> 95 % of gamma data, ∼ 75 % of snow course data) but only around half (∼ 60 % of gamma data, ∼ 50 % of snow course data) of the non-mountain data. The temporal distance was informed by our direct comparison of reference SWE (Sect. 4.2, Fig. 4), which showed little impact on agreement up to 20 d. The temporal restriction reduces the spatial subset by an additional 75 % (retains 85 % and 20 % of the spatially restricted gamma and snow course data, respectively).
Temporally restricting (within 10 d of each other) nearby reference measurements (i.e. within 200 km of each other) reduced the mean difference in mountain (product) bias and uRMSE computed with the two reference datasets by over 25 % (the hollow purple circles in Fig. 6 move closer to the 1:1 line compared to the solid purple dots). Yet, these metrics remain statistically larger and distinct when computed against snow courses rather than airborne gamma. Such differences are expected given the discrepancy in observed reference values at the measurement scale (Fig. 4). In non-mountain regions, agreement of the spatially restricted dataset was already strong, and the temporal restriction did not result in any further improvement (Fig. 6). In the next sections we use this coincident reference data subset (200 km and ± 10 d) to explore the impact of SWE magnitude and elevation bias on absolute and relative product accuracies. This spatial and temporal subset comprises less than 20 % of the original reference data, so comparisons with the full domain are included where appropriate. The 200 km distance is consistent with previously reported SWE autocorrelation lengths of 150 km to 250 km from snow course data (non-complex topography) (Pulliainen et al., 2020) and with analysis of the spatial variability of the snow courses used in our analysis (Fig. S5).
4.4 SWE magnitude
The relationship between product and reference SWE deteriorates for most gridded products at higher SWE magnitudes (Fig. 2). In some cases, there is a clear contribution to this deterioration by thresholds that are applied to avoid excessive snow accumulation (i.e. ERA5 and ERA5-Snow, Sect. 4.1) or, in the case of EO approaches, as the physical retrieval basis is no longer applicable (Chang et al., 1982, 1987; Luojus et al., 2021). In mountain areas, despite having similar elevation distributions, snow courses sample a much larger range of SWE than the airborne gamma dataset does, whether evaluating the complete domain or the spatially and temporally restricted subset (Fig. 7). In non-mountain areas, mean SWE observed by snow courses and airborne gamma is comparable over the coincident reference subset but is slightly higher for snow courses over the full domain due to high SWE sites, primarily in the northern boreal forest, which are not sampled by airborne gamma.
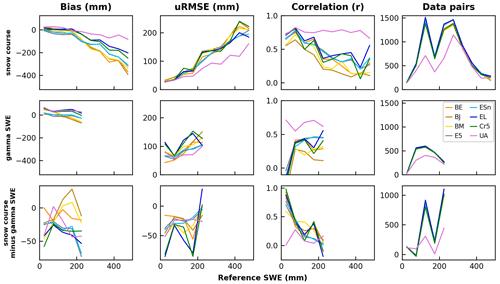
Figure 8Product performance in mountain regions for sequential 50 mm SWE bins (x-axis location is bin midpoint) over the spatially and temporally restricted domain. Bottom row shows the difference between snow-course-derived and airborne-gamma-derived metrics for each product and bin. Displayed product metrics are limited to ≤ 250 and ≤ 500 mm for airborne gamma and snow course, respectively, due to the limited number of data pairs above these thresholds (Fig. 7).
For the subset of products used to analyze the impact of covariates (as determined from Fig. 2, Sect. 4.1), bias and uRMSE magnitude increase with reference SWE magnitude in both mountain (Fig. 8) and non-mountain regions (not shown) whether computed over the full reference domain (Fig. S4 in the Supplement) or the restricted one. The spread in product uRMSE and bias values also increases with SWE magnitude; however, because airborne gamma observations are limited to moderate SWE values, it fails to capture most of these inter-product differences. Correlations calculated using snow course or gamma reference SWE are fairly stable between 50 and 150 mm. Those calculated using snow courses drop sharply above the 100–150 mm SWE bin except for U. Arizona, consistent with Fig. 2, which shows good agreement between reference and U. Arizona SWE across the full SWE range.
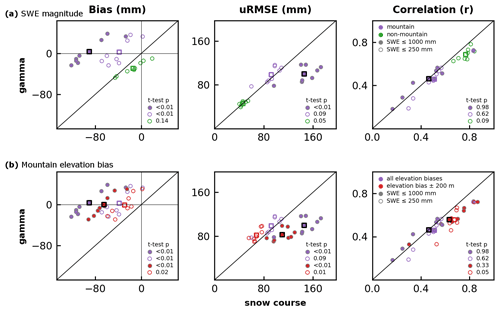
Figure 9Sensitivity of product metrics computed with gamma SWE versus snow courses to (a) SWE magnitude and (b) elevation bias for the spatially and temporally restricted domain. (a) Mountain (purple) and non-mountain (green) product metrics for SWE ≤ 1000 mm (solid circles) and SWE ≤ 250 mm (hollow circles). (b) Mountain product metrics for reference–product pairs with elevation biases < |200| m (red circles) and with no elevation bias restriction (purple) for the full (solid) and restricted ≤ 250 mm (hollow) SWE domain. Each dot represents one of the products Brown-ERA5, Brown-JRA55, Brown-MERRA2, ERA5, ERA5-Snow, ERA5-Land, Crocus-ERA5, and U. Arizona. Squares represent the mean of the products. The t test p values are as in Fig. 6. Solid purple dots correspond to hollow purple in Fig. 6. Non-mountain SWE ≤ 1000 mm circles overlap almost entirely with SWE ≤ 250 mm and are not shown. Purple dots in (a) and (b) are the same.
Restricting the coincident subset to the SWE domain consistently sampled by both reference datasets in mountain regions (250 mm and below as constrained by the gamma dataset, Fig. 7a) reduced the discrepancy in product metrics (bias and uRMSE) computed with snow courses and airborne gamma in mountain regions by almost two-thirds (Fig. 9a). The systematic negative product bias against snow courses observed over the full analysed mountain SWE range is reduced considerably when the moderate and high SWE sites responsible for much of this underestimation are excluded. Of course, restricting analysis in mountain regions to SWE ≤ 250 mm is unrealistic since this represents shallow-to-moderate mountain snow conditions. The uRMSE is reduced for both reference datasets, but the magnitude of improvement is considerably larger for the snow course dataset which improves the inter-reference dataset agreement (Fig. 9a, hollow purple circles fall along the 1:1 line) such that the ensemble means calculated with either reference dataset are no longer statistically distinct (p = 0.09). Restricting the reference dataset to sites with climatological SWE ≤ 250 mm had negligible impact on non-mountain product metrics (and so the full domain is not shown on Fig. 9a) because the non-mountain reference SWE distributions are similar and mostly below the 250 mm threshold (Fig. 7).
4.5 Elevation bias
A consistent high-level message is that products perform considerably worse in mountains compared to non-mountain areas. Restricting the analysis to moderate levels of SWE (≤ 250 mm) decreases the discrepancy in product statistics calculated with one reference dataset versus the other, but they are still worse in mountain compared to non-mountain regions (Fig. 9a). As outlined in Sect. 3.2.4, in mountain and complex terrain, the relationship between SWE and elevation can result in large SWE gradients over short distances (i.e. less than a single product grid cell). In these regions, systematic differences in elevation between reference measurements and the centroid of a product grid could, therefore, produce validation errors that are a result of the validation approach rather than the products themselves.
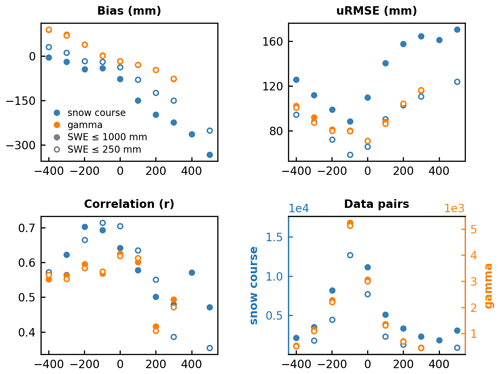
Figure 10Mean mountain bias, uRMSE, correlation, and total number of reference–product data pairs for sequential 100 m elevation bias bins (reference minus product elevation) for the products Brown-ERA5, Brown-JRA55, Brown-MERRA2, ERA5, ERA5-Snow, ERA5-Land, Crocus-ERA5, and U. Arizona. Metrics are computed for the spatially and temporally restricted reference dataset (Sect. 4.3) over the full (≤ 100 mm) and restricted (≤ 250 mm) SWE ranges. The x-axis labels indicate the centre of a 100 m wide elevation bin. Only bins with > 2 % of total data pairs are shown. Gamma statistics (orange circles) are nearly identical for both SWE ranges, so solid and hollow circles often overlap.
To investigate the impact of elevation biases, we computed product metrics for sequential 100 m elevation difference bins (determined by the reference measurement location versus the centroid of a product grid, Sect. 3.2.4). This analysis is restricted to mountain regions because elevation mismatches are smaller in non-mountain regions (< 10 % of reference–product data pairs have elevation biases > |200| m). The mean metrics of Brown-ERA5, Brown-MERRA2, Brown-JRA55, ERA5, ERA5-Snow, ERA5-Land, Crocus-ERA5, and U. Arizona are shown in Fig. 10. Product SWE bias increases linearly with elevation difference and the minimum uRMSE occurs at or near zero elevation difference. Correlations tend to be highest when elevation biases are smallest. The impact of elevation biases on product performance is reduced, but not eliminated, for snow courses when SWE is restricted to 250 mm and below (Fig. 10, blue hollow circles). This indicates that snow course sites with large elevation biases also have moderate to high SWE. Surprisingly, we did not find a systematic relationship between elevation bias and product grid spacing (e.g. larger and/or greater frequency of elevation bias for more coarsely gridded products).
Restricting the analyzed data pairs to those with elevation biases < |200| m (Fig. 9b, red) improves the mean bias and uRMSE across both the full and restricted SWE domains. However, the improvement in bias is small compared to that achieved by SWE thresholding (Fig. 9a). The discrepancy in product metrics (bias and uRMSE) assessed with one reference dataset versus the other also improves when restricted to data pairs with small elevation biases, although improvement is smaller when considering an already restricted set of pairs for which SWE ≤ 250 mm (Fig. 9b, hollow circles).
There are limited types of reference data available to evaluate gridded SWE products, with snow courses and airborne gamma providing the most appropriate options. Our analysis shows that the choice of reference dataset has little impact on the general assessment of relative product performance (Fig. 2) but has a large impact on the magnitude of the statistics calculated in mountain areas.
5.1 Non-mountain regions
There is no measurable difference in SWE measured by airborne gamma or snow courses in non-mountain terrain up to the scale of most gridded products evaluated (Fig. 4). This result suggests the reference data are sampling the true SWE field at spatial and temporal scales less than its intrinsic variability, and hence the reference SWE observations are representative at scales appropriate for gridded SWE evaluation in non-mountain areas. When constrained spatially, which serves as a proxy for land cover type, validation statistics from either of the two reference datasets are comparable (Fig. 5). The fact that validation statistics from either of the two independent reference datasets are comparable in non-mountain regions when evaluated over similar environments demonstrates that we can robustly validate gridded SWE estimates in such regions. Together, the strong agreement in reference SWE and consistent accuracies suggests that we can confidently use these two reference datasets in concert.
5.2 Mountain regions
In mountain areas, challenges remain surrounding the estimation and evaluation of coarse-resolution gridded SWE products. The U. Arizona SWE product demonstrates that strong performance in mountain areas is possible if observations from dense national in situ networks (SNOTEL and COOP) are combined with downscaled temperature and precipitation data (PRISM) at a fine spatial resolution (Zeng et al., 2018). Aside from this product, a consistent high-level message from our analysis is that products perform considerably worse in mountain compared to non-mountain areas. The grid spacing of nearly all products evaluated is larger than the mountain SWE autocorrelation length determined from our reference snow courses (≲ 5 km, Fig. S6 in the Supplement), which suggests that the current suite of global reanalysis and EO products are too coarse to capture the smallest-scale information provided by the reference data in mountain regions. This is a well-documented issue (Fang et al., 2022, and references therein; Kim et al., 2021; Liu et al., 2022; Snauffer et al., 2016; Terzago et al., 2017; Wrzesien et al., 2019). However, our analysis also shows that the choice of reference data may also contribute to differences in assessed product performance, as demonstrated by the large discrepancy in product metrics computed with the two reference datasets in coincident mountain areas (Fig. 6).
In mountain areas, SWE magnitude has the largest impact on product accuracies and their agreement according to the choice of reference dataset (Fig. 9a). Elevation bias and the spatiotemporal distribution of the reference datasets have comparable impacts, both of which are smaller than the impact of SWE magnitude. High SWE observations also tend to have large elevation biases, so the order in which the elevation bias and SWE thresholds are applied will influence their relative impact.
The systematically higher SWE measured by snow courses in mountain areas (compared to airborne gamma) (Fig. 7), even over short distances (5 km) (Fig. 4a), translates to measurable differences in product bias and uRMSE (Figs. 3 and 5a). It is only possible to obtain reasonable reference dataset agreement in product metrics by restricting the analysis to sites with climatological mean SWE of 250 mm and below (Fig. 9a). Such a restriction is unrealistic as it omits a majority of the SWE range observed by snow courses, at which differences in product performance are greatest. Airborne gamma is known to underestimate SWE in areas with high snowpack spatial variability (Carroll and Carroll, 1989; Cho et al., 2019; Cork and Loijens, 1980), commonly caused by drifting snow or complex terrain. Considering the full spatiotemporal domain, despite having similar elevation distributions to snow courses, the aggregated airborne gamma SWE estimates have a maximum of ∼ 350 mm (Fig. 7), which best represents shallow mountain snow conditions. This is an important consideration for the appropriate use of airborne gamma SWE estimates in these regions.
5.3 Towards a combined North American reference SWE dataset
Across North America, snow course and airborne gamma networks have largely complementary spatial coverage (Fig. 1). Creating a combined reference dataset using both of these sources contributes to a fuller picture of gridded SWE dataset performance. Given the strong agreement in reference SWE and their derived product accuracies in non-mountain areas, we are confident in pooling all snow course and gamma SWE observations together and computing a single product accuracy from these pooled data. As there is limited overlap between the datasets in the non-mountain domain outside of the northeastern US, weighting as a function of footprint size or spatiotemporal sampling density is not necessary.
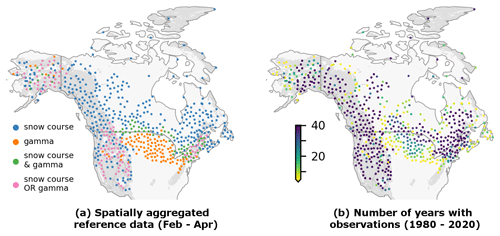
Figure 11Combined and spatially aggregated in situ SWE dataset consisting of snow course and airborne gamma SWE measurements over North America for February through April 1980–2020. Grey shading indicates mountain regions.
In mountain regions, the decision on whether and how to combine the reference data is less straightforward because of the lack of agreement between snow course measurements and gamma-derived estimates of SWE (e.g. Fig. 4). Reasonable alignment in mountain SWE product metrics from the two reference datasets only occurs when constraints on similar locations, dates, and climatological SWE are applied (Fig. 9). The higher spatial and temporal density of the snow course dataset (Fig. 1) will bias any combined dataset towards snow courses, and we considered evenly weighting snow courses and airborne gamma in mountain regions to address this. However, Fig. 7 shows the gamma SWE distribution is shifted toward lower values in mountain areas, so evenly weighting snow courses and gamma SWE would artificially reduce the relative peak SWE (because the less frequent gamma flights are typically conducted near peak SWE). Given these constraints we chose not to combine snow course and gamma SWE data in mountain areas. Instead, we recommend considering these two reference datasets separately in mountain regions. The new combined reference dataset, illustrated in Fig. 11 (described in Sect. 3.1), is the basis of a comprehensive evaluation of 23 gridded SWE products over the Northern Hemisphere in the context of the European Space Agency “Satellite Snow Product Intercomparison and Evaluation Exercise” (SnowPEx; Mudryk et al., 2024).
The choice of reference dataset has little impact on SWE product ranking but a large impact on the magnitude of validation statistics in mountain regions (Fig. 3). The strong agreement in non-mountain areas occurs because the reference SWE measured by gamma or snow courses agrees up to the scale of most gridded products evaluated (Figs. 4 and S5). In mountain regions the poor agreement in product statistics results primarily from the larger SWE range sampled by snow courses compared to airborne gamma (Fig. 7). Reasonable agreement in mountain product statistics was only achieved by restricting the reference data to similar dates, locations, climatological SWE, and elevation biases (Fig. 9). This approach is ultimately not appropriate, however, as it omits all but shallow-to-moderate mountain snowpacks. Building on insights gained from our analysis of reference SWE agreement and of the impact of covariates on product accuracies (SWE magnitude and product–reference elevation offsets both impact the absolute and relative product performance), we produced a combined spatially aggregated North American reference SWE dataset (Fig. 11). This dataset is used to assess gridded SWE products in non-mountain areas as part of the SnowPEx+ intercomparison project (Mudryk et al., 2024).
The reference data are available from Mortimer and Vionnet (2024), https://doi.org/10.5281/zenodo.10287093, except for data from the Ministère de l'Environnement, de la Lutte contres les changements climatiques, de la Faune et des Parcs that we are unable to share publicly. Gridded SWE product (Table 1) availability is as listed below.
| Product name | Availability/DOI |
| B-TIM-ERA5 | https://doi.org/10.5683/SP3/HHIRBU (Elias Chereque, 2024a) |
| B-TIM-JRA55 | https://doi.org/10.5683/SP3/X5QJ3P (Elias Chereque, 2024b) |
| B-TIM-MERRA2 | https://doi.org/10.5683/SP3/C5I5HN (Elias Chereque, 2024c) |
| Crocus-ERA5 | https://doi.org/10.5281/zenodo.10943718 (Decharme and Barbu, 2024) |
| ERA5 | https://doi.org/10.24381/cds.adbb2d47 (Hersbach et al., 2018) |
| ERA5-Snow | Available on request from patricia.rosnay@ecmwf.int |
| ERA5-Land | https://doi.org/10.24381/cds.e2161bac (Muñoz Sabater, 2019) |
| GLDAS v2.2 [CLSM] | https://doi.org/10.5067/TXBMLX370XX8 (Li et al., 2020) |
| JRA-55 | https://doi.org/10.5065/D6HH6H41 (Japan Meteorological Agency/Japan, 2013) |
| MERRA2 | https://doi.org/10.5067/RKPHT8KC1Y1T (GMAO, 2015) |
| Snow_CCI v2 | https://doi.org/10.5285/4647cc9ad3c044439d6c643208d3c494 (Luojus et al., 2022) |
| Snow_CCI v1 | https://doi.org/10.5285/fa20aaa2060e40cabf5fedce7a9716d0 (Luojus et al., 2020) |
| JAXA-AMSR2 | Preliminary version provided as part of SnowPEx+ Available on request from rejkelly@uwaterloo.ca |
| U. Arizona | https://doi.org/10.5067/0GGPB220EX6A (Broxton et al., 2019) |
The supplement related to this article is available online at: https://doi.org/10.5194/tc-18-5619-2024-supplement.
CM, EC, LM, and CD developed the analysis framework. CM and LM developed the code to calculate statistics and performed the analysis. CM prepared the manuscript with contributions from all co-authors.
At least one of the (co-)authors is a member of the editorial board of The Cryosphere. The peer-review process was guided by an independent editor, and the authors also have no other competing interests to declare.
Publisher's note: Copernicus Publications remains neutral with regard to jurisdictional claims made in the text, published maps, institutional affiliations, or any other geographical representation in this paper. While Copernicus Publications makes every effort to include appropriate place names, the final responsibility lies with the authors.
This research has been supported by the European Space Agency (grant no. 4000111278/14/I-LG-SnowPEx CCN-2).
This paper was edited by Nora Helbig and reviewed by Donghang Shao and Simon Gascoin.
Barnett, T. P., Adam, J. C., and Lettenmaier, D. P.: Potential impacts of a warming climate on water availability in snow-dominated regions, Nature, 438, 303–309, https://doi.org/10.1038/nature04141, 2005.
Beaumont, R. T.: Mt. Hood pressure pillow snow gage, J. Appl. Meteorol., 4, 626–631, https://doi.org/10.1175/1520-0450(1965)004<0626:MHPPSG>2.0.CO;2, 1965.
Brown, R., Brasnett, B., and Robinson, D.: Gridded North American monthly snow depth and snow water equivalent for GCM evaluation, Atmos. Ocean, 41, 1–14, https://doi.org/10.3137/ao.410101, 2003.
Brown, R. D., Fang, B., and Mudryk, L.: Update of Canadian historical snow survey data and analysis of snow water equivalent trends, 1967–2016, Atmos. Ocean, 57, 149–156, https://doi.org/10.1080/07055900.2019.1598843, 2019.
Broxton, P., Zeng, X., and Dawson N.: Daily 4 km Gridded SWE and Snow Depth from Assimilated In-Situ and Modeled Data over the Conterminous US, Version 1, Boulder, Colorado USA, NASA National Snow and Ice Data Center Distributed Active Archive Center [data set], https://doi.org/10.5067/0GGPB220EX6A, 2019.
Brun, E., Vionnet, V., Boone, A., Decharme, B., Peings, Y., Vallette, R., Karbou, F., and Morin, S.: Simulation of northern Eurasian local snow depth, mass, and density using a detailed snowpack model and meteorological reanalyses, J. Hydrometeorol., 14, 203–219, https://doi.org/10.1175/JHM-D-12-012.1, 2013.
Carroll, S. S. and Carroll, T. R.: Effect of uneven snow cover on airborne snow water equivalent estimates obtained by measuring terrestrial gamma radiation, Water Resour. Res., 25, 1505–1510, https://doi.org/10.1029/WR025i007p01505, 1989.
Carroll, T. R.: Airborne Gamma Radiation Snow Survey Program: A user's guide, Version 5.0, National Operational Hydrologic Remote Sensing Center (NOHRSC), Chanhassen, 14, 2001.
Carroll, T. R. and Schaake Jr., J. C.: Airborne snow water equivalent and soil moisture measurement using natural terrestrial gamma radiation, Optical Engineering for Cold Environments, Proc. SPIE 0414, 208–213, https://doi.org/10.1117/12.935888, 1983.
Carroll, T. R. and Vose, G. D.: Airborne snow water equivalent measurements over a forested environment using terrestrial gamma radiation, in: Proceedings of the Eastern Snow Conference, 7–8 June 1984, New Carrolton, Maryland, USA, 29, 101–115, 1984.
Chang, A. T. C., Foster, J. L., Hall, D. K., Rango, A., and Hartline, B. K.: Snow water equivalent estimation by microwave radiometry, Cold Reg. Sci. Technol., 5, 259–267, https://doi.org/10.1016/0165-232X(82)90019-2, 1982.
Chang, A. T. C., Foster, J. L., and Hall, D. K.: Nimubs-7 SMMR derived global snow cover parameters, Ann. Glaciol., 9, 39–44, https://doi.org/10.3189/S0260305500200736, 1987.
Cho, E., Jacobs, J. M., and Vuyovich, C.: The value of long-term (40 years) airborne gamma radiation SWE record for evaluating three observation-based gridded SWE datasets by seasonal snow and land cover classifications, Water Resour. Res., 56, e2019WR025813, https://doi.org/10.1029/2019WR025813, 2019.
Cho, E., Jacobs, J. M., Schroeder, R., Tuttle, S. E., and Olheiser, C.: Improvement of operational airborne gamma radiation using SMAP soil moisture, Remote Sens. Environ., 240, 111668, https://doi.org/10.1016/j.rse.2020.111668, 2020.
Clark, M. P., Hendrix, J., Slater, A. G., Kavetski, D., Anderson, B., Cullen, N. J., Kerr, T., Hreinsson, E. O., and Woods, R. A.: Representing spatial variability of snow water equivalent in hydrologic and land-surface models: a review, Water Resour. Res., 47, W07539, https://doi.org/10.1029/2011WR010745, 2011.
Cork, H. F. and Loijens, H. S.: The effect of snow drifting on gamma snow survey results, J. Hydrol., 48, 41–51, https://doi.org/10.1016/0022-1694(80)90064-5, 1980.
Decharme, B. and Barbu, A.: Crocus-ERA5 daily snow product over the Northern Hemisphere at 0.25° resolution (Version 2023), Zenodo [data set], https://doi.org/10.5281/zenodo.10943718, 2024.
De Roo, A. P., Gouweleeuw, B., Thielen, J., Bartholmes, J., Bongioannini-Cerlini, P., Todini, E., Bates, P. D., Horritt, M., Hunter, N., and Beven, K.: Development of a European flood forecasting system, Intl. J. River Basin Management, 1, 49–59, https://doi.org/10.1080/15715124.2003.9635192, 2003.
de Rosnay, P. Browne, P., de Boisséson, E., Fairbairn, D., Hirahara, Y., Ochi, K., Schepers, D., Weston, P., Zuo, H., Alonso-Balmaseda, M., Balsamo, G., Bonavita, M., Borman, N., Brown, A., Chrust, M., Dahoui, M., Chiara, G., English, S., Geer, A., Healy, S., Hersbach, H., Laloyaux, P., Magnusson, L., Massart, S., McNally, A., Pappenberger, F., and Rabier, F.: Coupled data assimilation at ECMWF: current status, challenges and future developments, Q. J. Roy. Meteor. Soc., 148, 2672–2702, https://doi.org/10.1002/qj.4330, 2022.
Dixon, D. and Boon, S.: Comparison of the SnowHydro snow sampler with existing snow tube designs, Hydrol. Process., 26, 2555–2562, https://doi.org/10.1002/hyp.9317, 2012.
Dozier, J., Bair, E. H., and Davis, R.: Estimating the spatial distribution of snow water equivalent in the world's mountains, WIREs Water, 3, 461–474, https://doi.org/10.1002/wat2.1140, 2016.
Durand, Y., Giraud, G., Laternser, M., Etchevers, P., Mèrindol, L., and Lesaffre, B.: Reanalysis of 47 Years of Climate in the French Alps (1958–2005): Climatology and Trends for Snow Cover, J. Appl. Meteorol. Clim., 48, 2487–2512, https://doi.org/10.1175/2009jamc1810.1, 2009.
Ecoregions of North America: NA_Eco_Level1, U.S. Environmental Protection Agency, U.S. EPA Office of Research & Development (ORD) – National Health and Environmental Effects Research Laboratory (NHEERL), Corvallis, OR, 2010, U.S. EPA Office of Research & Development (ORD) – National Health and Environmental Effects Research Laboratory (NHEERL), https://www.epa.gov/eco-research/ecoregions-north-america (last access: November 2021), 2010.
Elias Chereque, A.: B-TIM snow for ERA5, V1, Borealis [data set], https://doi.org/10.5683/SP3/HHIRBU, 2024a.
Elias Chereque, A.: B-TIM snow for JRA55, V1, Borealis [data set], https://doi.org/10.5683/SP3/X5QJ3P, 2024b.
Elias Chereque, A.: B-TIM snow for MERRA2, V1, Borealis [data set], https://doi.org/10.5683/SP3/C5I5HN, 2024c.
Elias Chereque, A., Kushner, P. J., Mudryk, L., Derksen, C., and Mortimer, C.: A simple snow temperature index model exposes discrepancies between reanalysis snow water equivalent products, The Cryosphere, 18, 4955–4969, https://doi.org/10.5194/tc-18-4955-2024, 2024.
Fang, Y., Liu, Y., and Margulis, S. A.: A western United States snow reanalysis dataset over the Landsat era from water years 1985 to 2021, Sci. Data, 9, 677, https://doi.org/10.1038/s41597-022-01768-7, 2022.
Gelaro, R., McCarty, W., Suárez, M. J., Todling, R., Molod, A., Takacs, L., Randles, C. A., Darmenov, A., Bosilovich, M. G., Reichle, R., Wargan, K., Coy, L., Cullather, R., Draper, C., Akella, S., Buchard, V., Conaty, A., da Silva, A. M., Gu, W., Kim, G., Koster, R., Lucchesi, R., Merkova, D., Nielsen, J. E., Partyka, G., Pawson, S., Putman, W., Rienecker, M., Schubert, S., Sienkiewicz, M., and Zhao, B.: The modern-era retrospective analysis for research and applications, version 2 (MERRA-2), J. Climate, 30, 5419–5454, https://doi.org/10.1175/JCLI-D-16-0758.1, 2017.
Gesch, D. B., Evans, G. A., and Oimoen, M. J.: The National Elevation Dataset, in: Digital elevation model technologies and applications—the DEM users manual, 3rd edn., editted by: Maune, D. and Nayegandhi, A., American Society for Photogrammetry and Remote Sensing, Bethesda, Maryland, 2018.
Global Modeling and Assimilation Office (GMAO): MERRA-2 tavg1_2d_lnd_Nx: 2d,1-Hourly,Time-Averaged,Single-Level,Assimilation,Land Surface Diagnostics V5.12.4, Greenbelt, MD, USA, Goddard Earth Sciences Data and Information Services Center (GES DISC) [data set], https://doi.org/10.5067/RKPHT8KC1Y1T (last access: December 2020), 2015.
Grünewald, T., Bühler, Y., and Lehning, M.: Elevation dependency of mountain snow depth, The Cryosphere, 8, 2381–2394, https://doi.org/10.5194/tc-8-2381-2014, 2014.
Hersbach, H., Bell, W., Berrisford, P., Horányi, A., Muñoz-Sabater, J., Nicolas, J., Peubey, C., Radu, R., Schepers, D., Simmons, A., Soci, C., Abdalla, S., Abellan, X., Balsamo, G., Bechtold, P., Biavati, G., Bidlot, J., Bonavita, M., De Chiara, G., Dahlgren, P., Dee, D., Diamantakis, M., Dragani, R., Flemming, J., Forbes, R., Fuentes, M., Geer, A., Haimberger, L., Healy, S., Hogan, R. J., Hólm, E., Janisková, M., Keeley, S., Laloyaux, P., Lopez, P. Lupu, C., Radnoti, G., de Rosnay, P., Rozum, I., Vamborg, F., Villaume, S., and Thépaut, J.-N.: The ERA5 global reanalysis, Q. J. Roy Meteor. Soc., 146, 1999–2049, https://doi.org/10.1002/qj.3803, 2020.
Hersbach, H., Bell, B., Berrisford, P., Biavati, G., Horányi, A., Muñoz Sabater, J., Nicolas, J., Peubey, C., Radu, R., Rozum, I., Schepers, D., Simmons, A., Soci, C., Dee, D., Thépaut, J.-N.: ERA5 hourly data on single levels from 1940 to present, Copernicus Climate Change Service (C3S) Climate Data Store (CDS) [data set], https://doi.org/10.24381/cds.adbb2d47 (last access: December 2020), 2018, last updated 2024.
Japan Meteorological Agency/Japan: JRA-55: Japanese 55-year Reanalysis, Daily 3-Hourly and 6-Hourly Data, Research Data Archive at the National Center for Atmospheric Research, Computational and Information Systems Laboratory, https://doi.org/10.5065/D6HH6H41, 2013, updated monthly.
Johnson, J. B.: A theory of pressure sensor performance in snow, Hydrol. Process., 18, 53–64, https://doi.org/10.1002/hyp.1310, 2004.
Kelly, R., Li, Q., and Saberi, N.: The AMSR2 Satellite-Based Microwave Snow Algorithm (SMSA): A New Algorithm for Estimating Global Snow Accumulation, in: IGARSS 2019 – 2019 IEEE International Geoscience and Remote Sensing Symposium, 5606–5609, 28 July–2 August 2019, Yokohama, Japan, https://doi.org/10.1109/IGARSS.2019.8898525, 2019.
Kim, R. S., Kumar, S., Vuyovich, C., Houser, P., Lundquist, J., Mudryk, L., Durand, M., Barros, A., Kim, E. J., Forman, B. A., Gutmann, E. D., Wrzesien, M. L., Garnaud, C., Sandells, M., Marshall, H.-P., Cristea, N., Pflug, J. M., Johnston, J., Cao, Y., Mocko, D., and Wang, S.: Snow Ensemble Uncertainty Project (SEUP): quantification of snow water equivalent uncertainty across North America via ensemble land surface modeling, The Cryosphere, 15, 771–791, https://doi.org/10.5194/tc-15-771-2021, 2021.
Kirchner, P. B., Bales, R. C., Molotch, N. P., Flanagan, J., and Guo, Q.: LiDAR measurement of seasonal snow accumulation along an elevation gradient in the southern Sierra Nevada, California, Hydrol. Earth Syst. Sci., 18, 4261–4275, https://doi.org/10.5194/hess-18-4261-2014, 2014.
Kobayashi, S., Ota, Y., Harada, Y., Ebita, A., Moriya, M., Onoda, H., Onogi, K., Kamahori, H., Kobayashi, C., Endo, H., Miyaoka, K., and Takahashi, K.: The JRA-55 reanalysis: General specifications and basic characteristics, J. Meteorol. Soc. Jpn. Ser. II, 93, 5–48, https://doi.org/10.2151/jmsj.2015-001, 2015.
Kodama, M., Nakai, K., Kawasaki, S., and Wada, M.: An application of cosmic-ray neutron measurements to the determination of the snow-water equivalent, J. Hydrol., 41, 85–92, https://doi.org/10.1016/0022-1694(79)90107-0, 1979.
Lehning, M., Gruenewald, T., and Schirmer, M.: Mountain snow distribution governed by an altitudinal gradient and terrain roughness, Geophys. Res. Lett., 38, L19504, https://doi.org/10.1029/2011GL048927, 2011.
Li, B., Rodell, M., Kumar, S., Beaudoing, H., Getirana, A., B. Zaitchik, de Goncalves, L., Cossetin, C., Bhanja, S., Mukherjee, A., Tian, S., Tangdamrongsub, N., Long, D., Nanteza, J., Lee, J., Policelli, F., Goni, I., Daira, D., Bila, M., de Lannoy, G., Mocko, D., Steele‐Dunne, S., Save, H., and Bettadpur, S.: Global GRACE data assimilation for groundwater and drought monitoring: Advances and challenges, Water Resour. Res., 55, 7564–7586, https://doi.org/10.1029/2018wr024618, 2019.
Li, B., Beaudoing, H., Rodell, M., and NASA/GSFC/HSL: GLDAS Catchment Land Surface Model L4 daily 0.25 x 0.25 degree GRACE-DA1 V2.2, Greenbelt, Maryland, USA, Goddard Earth Sciences Data and Information Services Center (GES DISC) [data set], https://doi.org/10.5067/TXBMLX370XX8, 2020.
Liu, Y., Weerts, A. H., Clark, M., Hendricks Franssen, H.-J., Kumar, S., Moradkhani, H., Seo, D.-J., Schwanenberg, D., Smith, P., van Dijk, A. I. J. M., van Velzen, N., He, M., Lee, H., Noh, S. J., Rakovec, O., and Restrepo, P.: Advancing data assimilation in operational hydrologic forecasting: progresses, challenges, and emerging opportunities, Hydrol. Earth Syst. Sci., 16, 3863–3887, https://doi.org/10.5194/hess-16-3863-2012, 2012.
Liu, Y., Fang, Y., Li, D., and Margulis, S. A.: How well do global snow products characterize snow water storage in High Mountain Asia?, Geophys. Res. Lett., 49, e2022GL100082, https://doi.org/10.1029/2022GL100082, 2022.
López-Moreno, J. I. and Stähli, M.: Statistical analysis of the snow cover variability in a subalpine watershed: Assessing the role of topography and forest interactions, J. Hydrol., 348(3-4): 379-394, https://doi.org/10.1016/j.jhydrol.2007.10.018, 2008.
López-Moreno, J. I., Fassnacht, S. R., Heath, J. T., Musselman, K. N., Revuelto, J., Latron, J., Morán-Tejeda, E., and Jonas, T.: Small scale spatial variability of snow density and depth over complex alpine terrain: Implications for estimating snow water equivalent, Adv. Water Resour., 55, 40–52, https://doi.org/10.1016/j.advwatres.2012.08.010, 2013.
López-Moreno, J. I., Leppänen, L., Luks, B., Holko, L., Picard, G., Sanmiguel-Vallelado, A., Alonso-González, E., Finger, D. C., Arslan, A. N., Gillemot, K., Sensoy, A., Sorman, A., Ertaş, M. C., Fassnacht, S. R., Fierz, C., and Marty, C.: Intercomparison of measurements of bulk snow density and water equivalent of snow cover with snow core samplers: Instrumental bias and variability induced by observers, Hydrol. Process., 34, 3120–3133, https://doi.org/10.1002/hyp.13785, 2020.
Luojus, K., Moisander, M., Pulliainen, J., Takala, M., Lemmetyinen, J., Derksen, C., Mortimer, C., Schwaizer, G., and Nagler, T.: ESA Snow Climate Change Initiative (Snow_cci): Snow Water Equivalent (SWE) level 3C daily global climate research data package (CRDP) (1979–2018), version 1.0, Centre for Environmental Data Analysis [data set, https://doi.org/10.5285/fa20aaa2060e40cabf5fedce7a9716d0 (last access: April 2020), 2020.
Luojus, K., Pulliainen, J., Takala, M., Lemmetyinen, J., Mortimer, C., Derksen, C., Mudryk, L., Moisander, M., Venäläinen, P., Hiltunen, M., Ikonen, J., Smolander, T., Cohen, J., Salminen, M., Veijola, K., and Norberg, J.: GlobSnow v3.0 Northern Hemisphere snow water equivalent dataset, Sci. Data, 8, 163, https://doi.org/10.1038/s41597-021-00939-2, 2021.
Luojus, K., Moisander, M., Pulliainen, J., Takala, M., Lemmetyinen, J., Derksen, C., Mortimer, C., Schwaizer, G., Nagler, T., and Venäläinen, P.: ESA Snow Climate Change Initiative (Snow_cci): Snow Water Equivalent (SWE) level 3C daily global climate research data package (CRDP) (1979–2020), version 2.0, NERC EDS Centre for Environmental Data Analysis [data set], https://doi.org/10.5285/4647cc9ad3c044439d6c643208d3c494 (last access: November 2021), 2022.
Magnusson, J., Nævdal, G., Matt, F., Burkhart, J. F., and Winstral, A.: Improving hydropower inflow forecasts by assimilating snow data, Hydrol. Res., 51, 226–237, https://doi.org/10.2166/nh.2020.025, 2020.
Meromy, L., Molotch, N. P., Link, T. E., Fassnacht, S. R., and Rice, R.: Subgrid variability of snow water equivalent at operational snow stations in the western USA, Hydrol. Process., 27, 2383–2400, https://doi.org/10.1002/hyp.9355, 2013.
Mortimer, C. and Vionnet, V.: Northern Hemisphere historical in-situ Snow Water Equivalent dataset (1979–2021), version 1, Zenodo [data set], https://doi.org/10.5281/zenodo.10287093, 2024.
Mortimer, C., Mudryk, L., Derksen, C., Luojus, K., Brown, R., Kelly, R., and Tedesco, M.: Evaluation of long-term Northern Hemisphere snow water equivalent products, The Cryosphere, 14, 1579–1594, https://doi.org/10.5194/tc-14-1579-2020, 2020.
Mortimer, C., Mudryk, L., Derksen, C., Brady, M., Luojus, K., Venäläinen, P., Moisander, M., Lemmetyinen, J., Takala, M., Tanis, C., and Pulliainen, J.: Benchmarking algorithm changes to the Snow CCI+ snow water equivalent product, Remote Sens. Environ., 274, 112988, https://doi.org/10.1016/j.rse.2022.112988, 2022.
Mott, R., Schirmer, M., Bavay, M., Grünewald, T., and Lehning, M.: Understanding snow-transport processes shaping the mountain snow-cover, The Cryosphere, 4, 545–559, https://doi.org/10.5194/tc-4-545-2010, 2010.
Mott, R., Vionnet, V., and Grünewald, T.: The seasonal snow cover dynamics: review on wind-driven coupling processes, Front. Earth Sci., 6, 197, https://doi.org/10.3389/feart.2018.00197, 2018.
Mudryk, L., Elias Chereque, A., Derksen, C., Luojus, K., and Decharme, B.: Terrestrial Snow Cover, Arctic Report Card 2022, in: NOAA technical report OAR ARC, 22-03, edited by: Druckenmiller, M. L., Thoman, R. L., and Moon, T. A., United States National Oceanic and Atmospheric Administration, Office of Oceanic and Atmospheric Research, Global Ocean Monitoring and Observing (U.S.), https://doi.org/10.25923/yxs5-6c72, 2022.
Mudryk, L., Mortimer, C., Derksen, C., Elias Chereque, A., and Kushner, P.: Benchmarking of SWE products based on outcomes of the SnowPEx+ Intercomparison Project, EGUsphere [preprint], https://doi.org/10.5194/egusphere-2023-3014, 2024.
Muñoz Sabater, J.: ERA5-Land hourly data from 1950 to present, Copernicus Climate Change Service (C3S) Climate Data Store (CDS) [data set], https://doi.org/10.24381/cds.e2161bac (last access: December 2020), 2019.
Muñoz-Sabater, J., Dutra, E., Agustí-Panareda, A., Albergel, C., Arduini, G., Balsamo, G., Boussetta, S., Choulga, M., Harrigan, S., Hersbach, H., Martens, B., Miralles, D. G., Piles, M., Rodríguez-Fernández, N. J., Zsoter, E., Buontempo, C., and Thépaut, J.-N.: ERA5-Land: a state-of-the-art global reanalysis dataset for land applications, Earth Syst. Sci. Data, 13, 4349–4383, https://doi.org/10.5194/essd-13-4349-2021, 2021.
Ochi, K., de Rosnay, P., and Fairbin, D.: Impact of assimilating ESA CCI Snow Cover on ECMWF Land Reanalysis, 10th EARSeL workshop on Land Ice and Snow, Bern, Switzerland, 6–8 February 2023, http://www.earsel.org/SIG/Snow-Ice/files/ws2023/Poster/1_A_Ochi_POSTER.pdf (last access: October 2023), 2023.
Paquet, E., Laval, M., Basalaev, L. M., Belov, A., Eroshenko, E., Kartyshov, V., Struminsky, A., and Yanke, V.: An Application of Cosmic-Ray Neutron Measurements to the Determination of the Snow Water Equivalent, in: Proceedings of the 30th International Cosmic Ray Conference, Merida, Mexico, 3–11 July 2008, https://indico.nucleares.unam.mx/event/4/session/39/contribution/1000/material/paper/0.pdf (last access: August 2023), 2008.
Pomeroy, J. W., Gray, D. M., Shook, K. R., Toth, B., Essery, R. L. H., Pietroniro, A., and Hedstrom, N.: An evaluation of snow accumulation and ablation processes for land surface modelling, Hydrol. Process., 12, 2339–2367, https://doi.org/10.1002/(SICI)1099-1085(199812)12:15<2339::AID-HYP800>3.0.CO;2-L, 1998.
Pomeroy, J. W., Gray, D. M., Brown, T., Hedstrom, N. R., Quinton, W. L., Granger, R. J., and Carey, S. K.: The cold regions hydrological model: a platform for basing process representation and model structure on physical evidence, Hydrol. Process., 21, 2650–2667, https://doi.org/10.1002/hyp.6787, 2007.
Pulliainen, J.: Mapping of snow water equivalent and snow depth in boreal and sub-arctic zones by assimilating space-borne microwave radiometer data and ground-based observations, Remote Sens. Environ., 101, 257–269, https://doi.org/10.1016/j.rse.2006.01.002, 2006.
Pulliainen, J., Luojus K., Derksen C., Mudryk L., Lemmetyinen J., Salminen M., Ikonen J., Takala M., Cohen J., Smolander T., and Norberg J.: Patterns and trends of Northern Hemisphere snow mass from 1980 to 2018, Nature, 581, 294–298, https://doi.org/10.1038/s41586-020-2258-0, 2020.
Ralph, F. M., Dettinger, M., White, A., Reynolds, D., Cayan, D., Schneider, T., Cifelli, R., Redmond, K., Anderson, M., Gherke, F., Jones J., Mahoney, K., Johnson, L., Gutman, S., Chandrasekar, V., Lundquist, J., Molotch, N., Brekke, L., Pulwarty, R., Horel, J., Schick, L., Edman, A., Mote, P., Abatzoglou, J., Pierce, R., and Wick, G.: A vision for future observations for western US extreme precipitation and flooding, Journal of Contemporary Water Research & Education, 153, 16–32, https://doi.org/10.1111/j.1936-704X.2014.03176.x, 2014.
Rohrer, M., Braun, L., and Lang, H.: Long-Term Records of Snow Cover Water Equivalent in the Swiss Alps 1. Analysis, Nord. Hydrol., 25, 53–64, 1994.
Smith, C. D., Kontu, A., Laffin, R., and Pomeroy, J. W.: An assessment of two automated snow water equivalent instruments during the WMO Solid Precipitation Intercomparison Experiment, The Cryosphere, 11, 101–116, https://doi.org/10.5194/tc-11-101-2017, 2017.
Snauffer, A. M., Hsieh, W. W., and Cannon, A. J.: Comparison of gridded snow water equivalent products with in situ measurements in British Columbia, Canada, J. Hydrol., 541, 714–729, https://doi.org/10.1016/j.jhydrol.2016.07.027, 2016.
Snethlage, M. A., Geschke, J., Spehn, E. M., Ranipeta, A., Yoccoz, N. G., Körner, Ch., Jetz, W., Fischer, M., and Urbach, D.: A hierarchical inventory of the world's mountains for global comparative mountain science, Sci. Data, 9, 149, https://doi.org/10.1038/s41597-022-01256-y, 2022a.
Snethlage, M. A., Geschke, J., Spehn, E. M., Ranipeta, A., Yoccoz, N. G., Körner, Ch., Jetz, W., Fischer, M., and Urbach, D.: GMBA Mountain Inventory v2, GMBA-EarthEnv. [data set], https://doi.org/10.48601/earthenv-t9k2-1407 (last access: June 2023), 2022b.
Sospedra-Alfonso, R., Mudryk, L., Merryfield, W., and Derksen, C.: Representation of snow in the Canadian seasonal to interannual prediction system. Part I: Initialization, J. Hydrometeorol., 17, 1467–1488, https://doi.org/10.1175/JHM-D-14-0223.1, 2016.
Terzago, S., von Hardenberg, J., Palazzi, E., and Provenzale, A.: Snow water equivalent in the Alps as seen by gridded data sets, CMIP5 and CORDEX climate models, The Cryosphere, 11, 1625–1645, https://doi.org/10.5194/tc-11-1625-2017, 2017.
Turcotte, R., Fortin, L. G., Fortin, V., Fortin, J. P., and Villeneuve, J. P.: Operational analysis of the spatial distribution and the temporal evolution of the snowpack water equivalent in southern Québec, Canada, Nord. Hydrol., 38, 211–234, https://doi.org/10.2166/nh.2007.009, 2007.
Tuttle, S. E., Jacobs, J. M., Vuyovich, C. M., Olheiser, C., and Cho, E.: Intercomparison of snow water equivalent observations in the Northern Great Plains, Hydrol. Process., 32, 817–829, https://doi.org/10.1002/hyp.11459, 2018.
Vionnet, V., Fortin, V., Gaborit, E., Roy, G., Abrahamowicz, M., Gasset, N., and Pomeroy, J. W.: Assessing the factors governing the ability to predict late-spring flooding in cold-region mountain basins, Hydrol. Earth Syst. Sci., 24, 2141–2165, https://doi.org/10.5194/hess-24-2141-2020, 2020.
Vionnet, V., Mortimer, C., Brady, M., Arnal, L., and Brown, R.: Canadian historical Snow Water Equivalent dataset (CanSWE, 1928–2020), Earth Syst. Sci. Data, 13, 4603–4619, https://doi.org/10.5194/essd-13-4603-2021, 2021a.
Vionnet, V., Marsh, C. B., Menounos, B., Gascoin, S., Wayand, N. E., Shea, J., Mukherjee, K., and Pomeroy, J. W.: Multi-scale snowdrift-permitting modelling of mountain snowpack, The Cryosphere, 15, 743–769, https://doi.org/10.5194/tc-15-743-2021, 2021b.
Vionnet, V., Mortimer, C., Brady, M., Arnal, L., and Brown, R.: Canadian historical Snow Water Equivalent dataset (CanSWE, 1928–2021) (Version v3), Zenodo [data set], https://doi.org/10.5281/zenodo.5889352, 2022.
WMO (Ed.): Guide to instruments and methods of observation: Volume II – Measurement of Cryospheric Variables, 2018th edn., World Meteorological Organization, Geneva, WMO-No. 8, 52 pp., 2018.
Wood, A. W., T. Hopson, A. Newman, L. Brekke, J. Arnold, and Clark, M.: Quantifying Streamflow Forecast Skill Elasticity to Initial Condition and Climate Prediction Skill, J. Hydrometeorol., 17, 651–668, https://doi.org/10.1175/JHM-D-14-0213.1, 2016.
Wrzesien, M. L., Pavelsky, T. M., Durand, M. T., Dozier, J., and Lundquist, J. D.: Characterizing biases in mountain snow accumulation from global data sets, Water Resour. Res., 55, 9873–9891, https://doi.org/10.1029/2019WR025350, 2019.
Zeng, X., P. Broxton, and Dawson, N.: Snowpack Change From 1982 to 2016 Over Conterminous United States, Geophys. Res. Lett., 45, 12940–12947, https://doi.org/10.1029/2018GL079621, 2018.


