the Creative Commons Attribution 4.0 License.
the Creative Commons Attribution 4.0 License.
 | 27 Sep 2024
Unprecedented 21st century glacier loss on Mt. Hood, Oregon, USA
Nicolas Bakken-French
Stephen J. Boyer
B. Clay Southworth
Megan Thayne
Anders E. Carlson
As part of the southern Cascades, Mt. Hood is the tallest and most glacierized peak in Oregon, USA. Despite alpine glaciers being one the clearest indicators of human-caused climate change, the 21st century behavior of glaciers on Mt. Hood has not been directly documented at the ground level. Here we directly measure changes in the extents of Mt. Hood's glaciers from 2003 to 2023 and find dramatic retreat of all glaciers, with one glacier ceasing to flow (joining another glacier that ceased flowing before 2003) and another three glaciers retreating towards this status. By 2023, Mt. Hood glaciers had lost ∼17 % of their 2015–2016 area and ∼39 % of their 1981 area. The rate of area loss from 2015–2016 to 2023 (∼2.10 % yr−1) was ∼2.6 times faster than the rate from 1981 to 2015–2016 (∼0.81 % yr−1). The seven largest glaciers on the volcano lost ∼25 % of their area between 2000 and 2023. Comparison to historic records of glacier area back to 1907 shows that this 21st century retreat is unprecedented relative to the previous century. The rate of area loss over the last 23 years (∼1.07 % yr−1) was ∼1.9 times faster than the fastest rate documented in the last century from 1907 to 1946 (∼0.56 % yr−1) and ∼3.5 times faster than the 20th century average (∼0.31 % yr−1). This unprecedented rate of retreat corresponds to regional summer warmth reaching 1.7–1.8 °C (2013–2023 average) relative to the early 1900s, but not with regional changes in winter precipitation. We conclude that Mt. Hood's glaciers are retreating in response to a warming climate and that this recession has accelerated in the 21st century.
- Article
(5708 KB) - Full-text XML
-
Supplement
(11736 KB) - BibTeX
- EndNote


The global loss of mass and retreat of glaciers in the 21st century are accelerating (Zemp et al., 2015; Hugonnet et al., 2021), with century-scale glacier recession attributed to regional climate change in response to anthropogenic greenhouse gas emissions (Marzeion et al., 2014; Roe et al., 2017, 2021). The 2021–2022 hydrological year was the 35th consecutive year of negative annual mass balance for 50 reference glaciers on six continents (Pelto, 2023; World Glacier Monitoring Service, 2022). If global average temperature increases by 1.5 °C relative to the pre-industrial period, the limit set forth in the Paris Agreement, roughly half of the world's individual glaciers are projected to disappear with ∼26 % loss in global glacier mass (Rounce et al., 2023). Indeed, in the western United States, this deglaciation is already coming to fruition (Fig. 1a). The Trinity Alps in the state of California (Fig. 1a) have lost ∼97 % of their late 1800s glacierized area, with only ∼0.017 km2 of one glacier still showing evidence of ice flow as of 2015 (Garwood et al., 2020). The Olympic Mountains of Washington State (Fig. 1a) lost about half of their late 1800s glacier area by 2015, with 35 glaciers disappearing since 1980 (Fountain et al., 2022). A total of 11 of the 37 named glaciers in Glacier National Park in the state of Montana (Fig. 1a) ceased to be classified as actively flowing glaciers as of 2015, with glacierized area in the park declining by ∼68 % from the 1800s to 2015 (Fagre et al., 2017). Washington State's Mt. Rainier (Fig. 1a), the most glacierized peak in the contiguous United States, saw its glacierized area decline by ∼42 % between 1896 and 2021 and had one glacier recently disappear, with two more nearing stagnation (Beason et al., 2023). Nearby in the Washington North Cascades (Fig. 1a), 33 glaciers were listed as extinct in the Global Land Ice Measurements from Space (GLIMS) glacier database at the National Snow and Ice Data Center (NSIDC) as of 2023 (GLIMS and NSIDC, 2023).
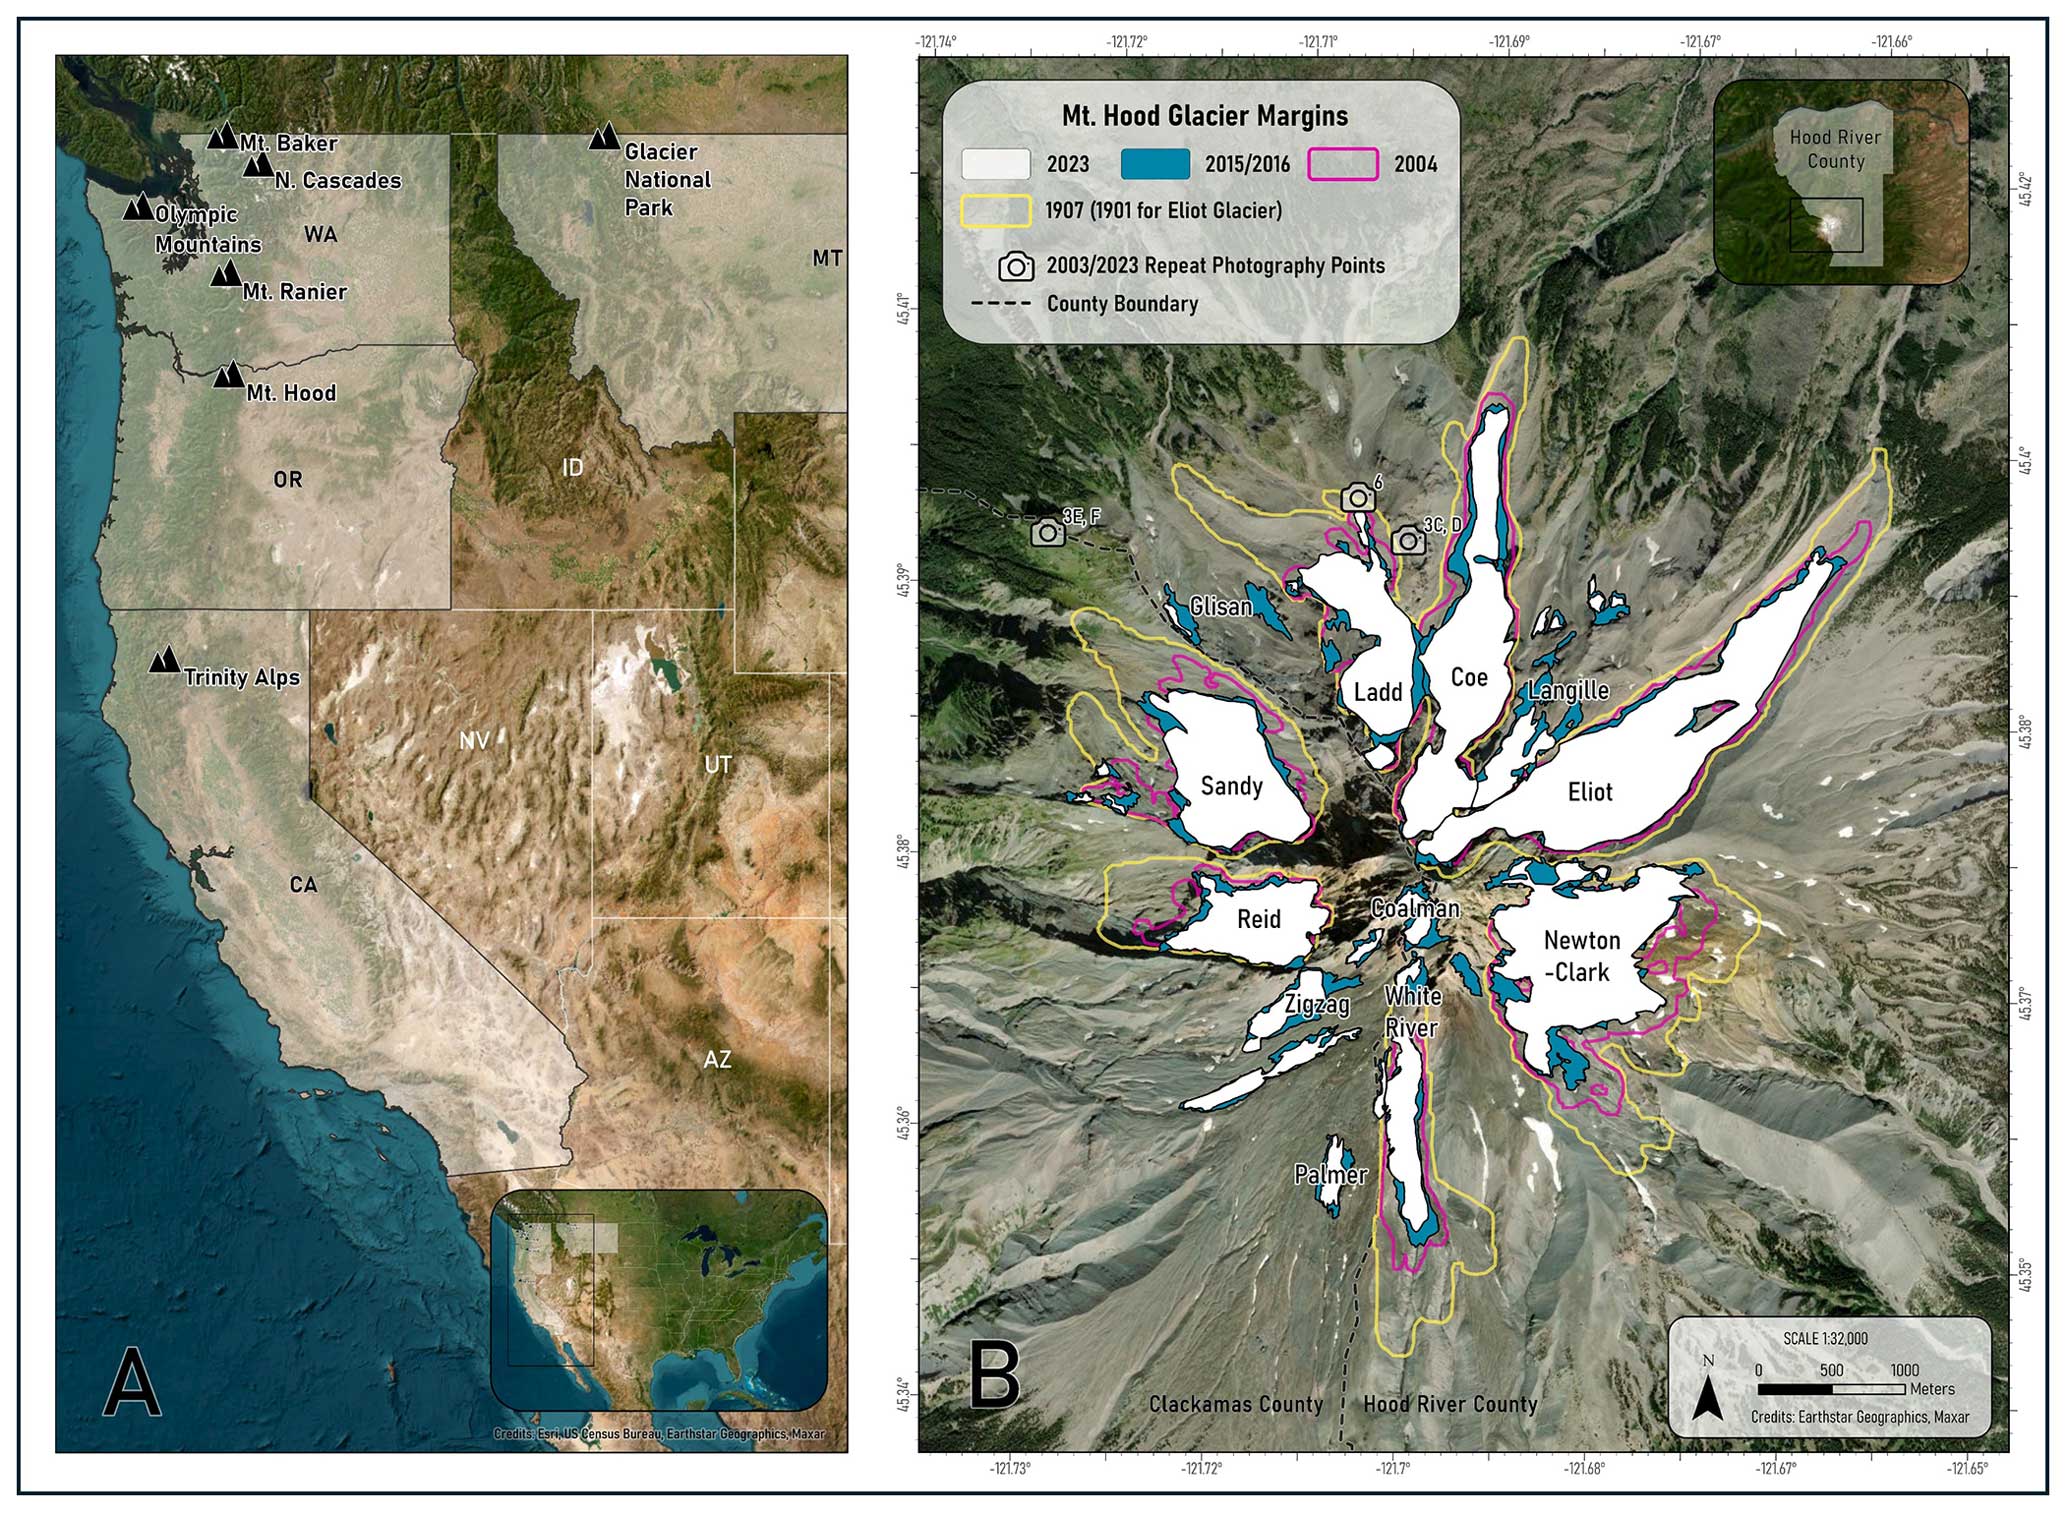
Figure 1Location map of Oregon (a) and Mt. Hood (b). (a) Western United States denoting the mountain ranges mentioned (WA: Washington, MT: Montana, OR: Oregon, CA: California, ID: Idaho, NV: Nevada, UT: Utah, AZ: Arizona); the inset shows the location with a black outline. (b) Glacier extents on Mt. Hood with photo locations in Figs. 3 and 6 noted. 1907–1901 and 2004 ice extents from Jackson and Fountain (2007); 2015–2016 ice extents from Fountain et al. (2023). 2023 extents from this study. The inset shows the figure location (black outline) within Hood River County (area for reanalysis data in Fig. 7). Credits: Esri, US Census Bureau, Earthstar Geographics, Maxar.
Despite these ominous predictions and dire observations for glaciers, data on the 21st century behavior of glaciers in the Cascade Range of Oregon are limited. Glaciers in Oregon were first noted in 1870 on Mt. Hood, the tallest and most glacierized peak in Oregon (Fig. 1a, b), only days after the first glaciers in the contiguous United States were recorded on Mt. Shasta in California (O'Connor, 2013). Mt. Hood is an active volcano that reached a height close to its current elevation of 3425 m above sea level by 30 000 years ago (U.S.G.S., 2023, https://www.usgs.gov/volcanoes/mount-hood/science/eruption-history-mount-hood-oregon, last access: 28 January 2024). The last major eruption was ∼1500 years ago, which created pyroclastic flows and lahars on the southwest side of the volcano upon which Zigzag and Palmer glaciers rested (Fig. 1b). Its last eruption occurred in the late 1700s, producing a lava dome south of the summit around which Coalman Glacier flows (Fig. 1b). In the late 1800s, fumaroles formed near this lava dome (Lillquist and Walker, 2006). Mt. Hood has high amounts of rockfall and variations in geothermal heat that could affect ablation, ice flow, and ice extent (e.g., Lundstrom et al., 1993; Lillquist and Walker, 2006; Jackson and Fountain, 2007; Howcutt et al., 2023).
Changes in Mt. Hood's glaciers were monitored by the Research Committee of the Mazama Mountaineering Club from the 1930s to mid-1980s (e.g., Phillips, 1935, 1938; Mason, 1954; Handewith, 1959; Dodge, 1971, 1987). In 1981, the US Geological Survey measured the thickness and area of Mt. Hood's glaciers, estimating their volume (Driedger and Kennard, 1986a, b). However, the extent of Oregon Cascade glaciers on current US Geological Survey and US Forest Service maps is still based on air photos from the 1950s (Fountain et al., 2017). The glacierized area of Mt. Hood was last measured with field observations in 2004 (Jackson and Fountain, 2007). Fountain et al. (2023) documented snow and ice areas in the western United States using 2015 and 2016 imagery for Mt. Hood's glaciers but did not test mapped accuracy with field observations. The timing of this imagery also missed what multiyear and longer impacts the 2015 record-low snowpack (Mote et al., 2016) and the June 2021 Pacific Northwest heatwave (Philip et al., 2022; Thompson et al., 2022) would have on Mt. Hood's glaciers (e.g., Pelto, 2018; Pelto et al., 2022).
Regarding climate change impacting Oregon's glaciers, Menounos et al. (2019) documented minimal elevation change for Mt. Hood's glaciers from 2000 to 2018, interpreting from this an approximately neutral mass balance for the first 19 years of the 21st century. Near-zero mass balance for 2000–2018 is at odds with the mass changes for global reference glaciers that include four glaciers to the north of Mt. Hood in the state of Washington; these four all had cumulative negative mass balances for the same time period (Pelto, 2023). For the 20th century, Lillquist and Walker (2006) did not find a relationship between glacier length change on Mt. Hood and temperature or precipitation change over the 20th century. Conversely, climate–glacier modeling simulates the emergence of glacier retreat from natural variability in western North America since the 1960s (Marzeion et al., 2014). As such, recent impacts of human-caused climate change on Mt. Hood's glaciers have been unclear and largely unexplored from direct field observations.
Glacier change on Mt. Hood is of importance to downstream ecosystems and economies (see Robel et al., 2024), such as orchards and farms in the Hood River Valley (Nolin et al., 2010; U.S. Bureau of Reclamation, 2015; Frans et al., 2016, 2018), unique glacier-fed spring water microbiomes (Miller et al., 2021), and salmon and steelhead (Pitman et al., 2020; Thieman et al., 2021). The Hood River Valley has ∼50 km2 producing seven varieties of pears, ∼6 km2 producing five varieties of apples, ∼6 km2 devoted to cherries, and ∼0.4 km2 of grapes for an expanding wine industry (Columbia Gorge Fruit Growers, 2024, http://www.cgfg.org/information/crops-information, last access: 3 April 2024), along with two hydropower plants with 4.4 MW capacity (Farmers Irrigation District, 2024, https://www.fidhr.org/index.php/en/about-us/hydroelectric, last access: 3 April 2024). Glaciers contribute ∼40 %–70 % of the streamflow in the late summer to the upper Hood River where flow is diverted for irrigation and local hydropower (Nolin et al., 2010). As such, future water resource management plans for the Hood River basin include projections of future glacier change on Mt. Hood (U.S. Bureau of Reclamation, 2015; Thieman et al., 2021). White River and Newton–Clark glaciers also contribute late-summer meltwater to a robust orchard industry in another county (Columbia Gorge Fruit Growers, 2024, http://www.cgfg.org/information/crops-information, last access: 3 April 2024). Furthermore, Mt. Hood is one of the most climbed mountaineering objectives in the world (∼10 000 attempts per year), which is becoming more dangerous during a diminishing climbing season with greater rockfall as the volcano has changed in recent years (O'Neil, 2023).
Here we document glacier change on Mt. Hood over the last 20 years. We conducted new repeat photography and field observations of glacier extent in 2003 and 2023 to provide detailed ground-based evidence for glacier change during a period where satellite-based altimetry previously found no significant change in these glaciers. We also utilized a series of field campaigns with satellite imagery to determine the magnitude of glacier area change up to mid-September 2023. We place these 21st century glacier changes in the context of 20th century glacier and regional climate changes.
2.1 2003 and 2023 flowing-ice-margin positions and repeat photography
In 2003 (28 August to 4 October), the lowest observed actively flowing glacier locations and stagnant-ice positions were measured (latitude–longitude–altitude) by global positioning system (GPS) for every glacier on Mt. Hood (Fig. S1). These were discrete observations, which served as points to assess future minimum changes in elevation. Repeat measurements and comparison to known elevation markers determined an elevation uncertainty of ±6 m. Termini were photographed with locations noted (Fig. S1) for future repeat photography (i.e., 2023). All glaciers were described in detail in the field (Supplement). The goal of this initial 2003 field effort was to provide baseline observations and archival photographic evidence from the early 21st century against which future glacier change could be assessed. We conducted further observations for this assessment 20 years later in 2023. From 15 to 22 September 2023, repeat photographs were taken at the same locations as the 2003 photographs (Fig. S1) and new field observations were made for all of the glaciers (Supplement). We selected photographs to repeat from an archive of photographs taken in 2003. Using the image and field notes for the location of the 2003 images, we located the precise site of each selected 2003 photograph. The same frame was maintained using relatively unchanged features such as buttresses, cliffs, and moraines as points of reference.
From 2020 to 2023, the full extent of the actively flowing parts of glaciers was mapped to determine the degree to which the lowest flowing ice had risen in elevation, which is related to the surface mass balance of the glacier (e.g., Haeberli and Hoelzle, 1995; Hoelzle et al., 2023). Because manual mapping is suggested for glaciers with debris cover (e.g., Paul et al., 2013), we initially manually mapped actively flowing glacier extents using composite Google Earth imagery in the application CalTopo (https://caltopo.com/, last access: 15 June 2020). As these images spanned multiple years and were not necessarily recent, we then manually refined ice margins using weekly Sentinel-2 satellite images that were taken shortly before the first snowfall from the summers of 2020, 2021, 2022, and 2023. These images were processed and made available in CalTopo 1 d after acquisition (see the Supplement for a complete list of satellite imagery). The combination of satellite imagery delineation of margins with ground-truth mapping relative to the images is a robust, effective technique. In October 2020, September 2021, and September 2023, we iteratively took these ice margins (updated year by year) into the field for direct mapping using CalTopo on a portable GPS-enabled tablet. We finalized our ice limits with the ESRI World Imagery Basemap from September 2023.
These 3 years were excellent for field mapping as the length of the 2020 summer and the warmth of the 2021 and 2023 summers resulted in extremely low snow cover that facilitated ice margin identification in regions that would typically have snow cover throughout the summer. All termini in the end-of-summer ablation area were walked, resulting in ∼60 %, on average, of each ice margin being physically mapped in the field. Notably, this means all debris-covered ice margins were mapped in the field and their delineation was not based solely on satellite imagery. Debris-covered termini are common on Mt. Hood glaciers, and such field mapping of the termini is critical to accurately delineate glacier margins (e.g., Lundstrom et al., 1993; Lillquist and Walker, 2006; Jackson and Fountain, 2007; Ellinger, 2010). We followed prior methods for differentiating actively flowing debris-covered ice from stagnant debris-covered ice on Mt. Hood (e.g., Lillquist and Walker, 2006): an identifiable glacier front, a lobate form of the terminus, and a visible connection of the lobate terminus to debris-free flowing ice. This methodology is consistent with the observation of a convex shape of actively flowing glacier margins by Leonard and Fountain (2003) and Leigh et al. (2019). To these criteria, we added the presence of crevasses observed in the field as another indicator of ice flow whether under debris or in bare ice (Leigh et al., 2019). Using these criteria, we determined and walked this transition from actively flowing to stagnant ice, mapping this demarcation in the field.
2.2 2023 glacier inventory and uncertainty
To determine the current glacier extent and compare to past inventories to assess glacier area change, we produced a 2023 glacier inventory for the 12 glaciers of Mt. Hood (Fig. 1b) following UNESCO guidelines that require inclusion of inactive or stagnant ice (Müller et al., 1977; Cogley et al., 2011). Specifically, we expanded our actively flowing ice areas discussed above to include stagnant ice (debris-free and debris-covered). We also included separate stagnant-ice bodies and perennial snowfields that used to be connected to a glacier. Following standard practices (Paul et al., 2013; Leigh et al., 2019), our 2023 ice limits were mapped on new high-resolution (0.3 m) Maxar (Vivid) imagery captured on 8 September 2023 available through the ESRI World Imagery Basemap (https://services.arcgisonline.com/ArcGIS/rest/services/World_Imagery/MapServer, last access: 14 July 2024; Fig. 1b) guided by our field observations from 2020, 2021, and 2023.
Manual remotely sensed ice limit comparisons with direct field observations yielded extent differences that were small enough (i.e., less than 1 or 2 m) to make uncertainty difficult to quantify. Using only remote sensing, Fountain et al. (2023) had their lowest ice extent uncertainty for a Mt. Hood glacier at ±1 %, while Jackson and Fountain (2007) reported an uncertainty for their 2000 Mt. Hood glacier areas of ±0 %. Our uncertainty is most likely lower than ±1 %, but to be conservative we assumed a ±7 % uncertainty in the glacier area for 2023. We based this ±7 % uncertainty on the average area uncertainty for the 2004 extents of Mt. Hood glaciers determined by Jackson and Fountain (2007), which was ±7 %. Our conservative ±7 % is slightly greater than the uncertainties determined from testing the accuracy of remotely sensed glacier area from the European Alps and Alaska of 2.6 %–5.7 % (Paul et al., 2013). This means any conclusions we made from our mapped glacier area were likely not dependent on our assumed glacier area uncertainty.
2.3 Glacier area change and uncertainty
We compared our 2023 glacier inventory to the most recent inventories conducted for Mt. Hood. Fountain et al. (2023) produced a Mt. Hood glacier inventory from remote sensing imagery from either 2015 or 2016; this allowed an assessment of glacier area change over the last 7 to 8 years. We also compared our 2023 glacier areas to the 1981 glacier inventory for Mt. Hood determined by Driedger and Kennard (1986b) that was based on field mapping and aerial photographs; this afforded a 42-year perspective on glacier change.
We assessed rates of glacier change by comparing our 2023-measured inventory area with the glacier area records of Jackson and Fountain (2007) for the time period 1907 (or 1901 in the case of Eliot Glacier) to 2004 for seven glaciers on Mt. Hood: White River, Newton–Clark, Eliot, Coe, Ladd, Sandy, and Reid (Fig. 1b). Because of the different temporal resolutions of each glacier area record, we calculated area change between observational years common to all seven glaciers: 1907, 1946, 1972, 2000, and 2023. We focused on the changes from 2000 to 2023, rather than 2000 to 2004 and then 2004 to 2023, to make the duration over which the most recent intervals of change were measured closer to the earlier temporal spacing. Newton–Clark Glacier lacked an aerial extent for 1946; we extrapolated between the measured extent in 1935 and 1956 when the glacier lost ∼0.04 km2 over these 21 years. To aid comparison between glaciers of different sizes on Mt. Hood and to other glaciers in the Pacific Northwest, we calculated relative changes in glacier area determined as a percent of its prior area. In calculating the rate of change, we propagated through the uncertainty in the area from Jackson and Fountain (2007) and our 2023 areas. For the 2000 area, we conservatively applied a ±7 % uncertainty of the 2004 Jackson and Fountain (2007) glacier margins. The propagation of uncertainty was through quadrature, where the squares of the individual percent uncertainties were summed and their square root taken.
2.4 Changes in climate
For records of regional climate change to use in assessing potential climatic causes of glacier change, we used US National Oceanic and Atmospheric Administration (NOAA) temperature and precipitation reanalysis data for the region of Hood River County (Fig. 1b) from 1895 to 2023 (U.S. NOAA, 2024, https://www.ncei.noaa.gov/access/monitoring/climate-at-a-glance/, last access: 8 January 2024). We chose Hood River County as this is the smallest geographic region for the reanalysis data that includes the majority of Mt. Hood and its glaciers (8 of the 12 glaciers with the other 4 adjacent to the boundary; Fig. 1b) and would still have direct weather station measurements within the geographic domain over the period of comparison. Snow telemetry stations on and around Mt. Hood were only installed in the late 1970s, with temperature sensors beginning to work consistently in the late 1980s (U.S. National Resources Conservation Service, 2024, https://www.nrcs.usda.gov/conservation-basics/conservation-by-state/oregon/oregon-snow-survey/about-us, last access: 7 April 2024).
For temperature, we focused on changes in May–October and June–September means. May through October is generally the period of time in the Oregon Cascades from peak winter snowpack to the first snowfall of the next winter, or the maximum length of the ablation season. Since this can vary, we also examined June–September temperature as a shorter ablation season. Pelto (2018) determined the best fit between mass balance and ablation temperature to be May–September or June–September for glaciers in Washington. For precipitation, we analyzed November–April and October–May totals. November through April in Oregon generally spans the time period from the first winter snow until peak winter snowpack, or the accumulation season. To account for seasonal variability, we also used October through May precipitation. We calculated the changes in temperature and precipitation relative to their 1895–1924 means. Glaciers in the North Cascades of Washington have 20–30-year response times (Pelto and Hedlund, 2001), while glaciers on the Mt. Baker volcano in Washington (a closer analogue to Mt. Hood) have faster response times down to 11 years (Pelto, 2016) (Fig. 1a). As such, we applied an 11-year running mean to the temperature and precipitation records.
Since 2003, the elevation of the lowest actively flowing ice has risen for every glacier on Mt. Hood (Table 1, Figs. 2, S1), with an average rise of ∼150 m (observed changes and repeat photographs provided in the Supplement). Note that these are inherently minimum estimates of the rises given the point nature of the 2003 observations. There does not appear to be any pattern in the degree of rise relative to glacier aspect on Mt. Hood (Fig. 2). The greatest rise occurred in the southeast-facing Clark drainage of Newton–Clark Glacier (> 300 m), followed by the southwest-facing Zigzag Glacier (> 250 m; Fig. 3a, b), the west-facing Sandy Glacier (>240 m; Fig. 3e, f), and the northwest-facing Ladd Glacier (>230 m). Of the three glaciers with substantial debris cover of their termini, Ladd (>230 m) and Coe (>170 m) (Fig. 3c, d) had rises greater than the average, while Eliot's rose >70 m (Table 1, Fig. 2).
Table 1Mt. Hood glacier observations from 2003 and 2023. Change (Δ) in elevation for lowest flowing ice; total glacier area in 1981 (Driedger and Kennard, 1986b), 2015–2016 (Fountain et al., 2023), and 2023; and total area change (Δ) as a percent (%) up to 2023 are provided. The asterisk notes the 2015–2016 area for Ladd Glacier, which excluded buried ice that remained in 2023.
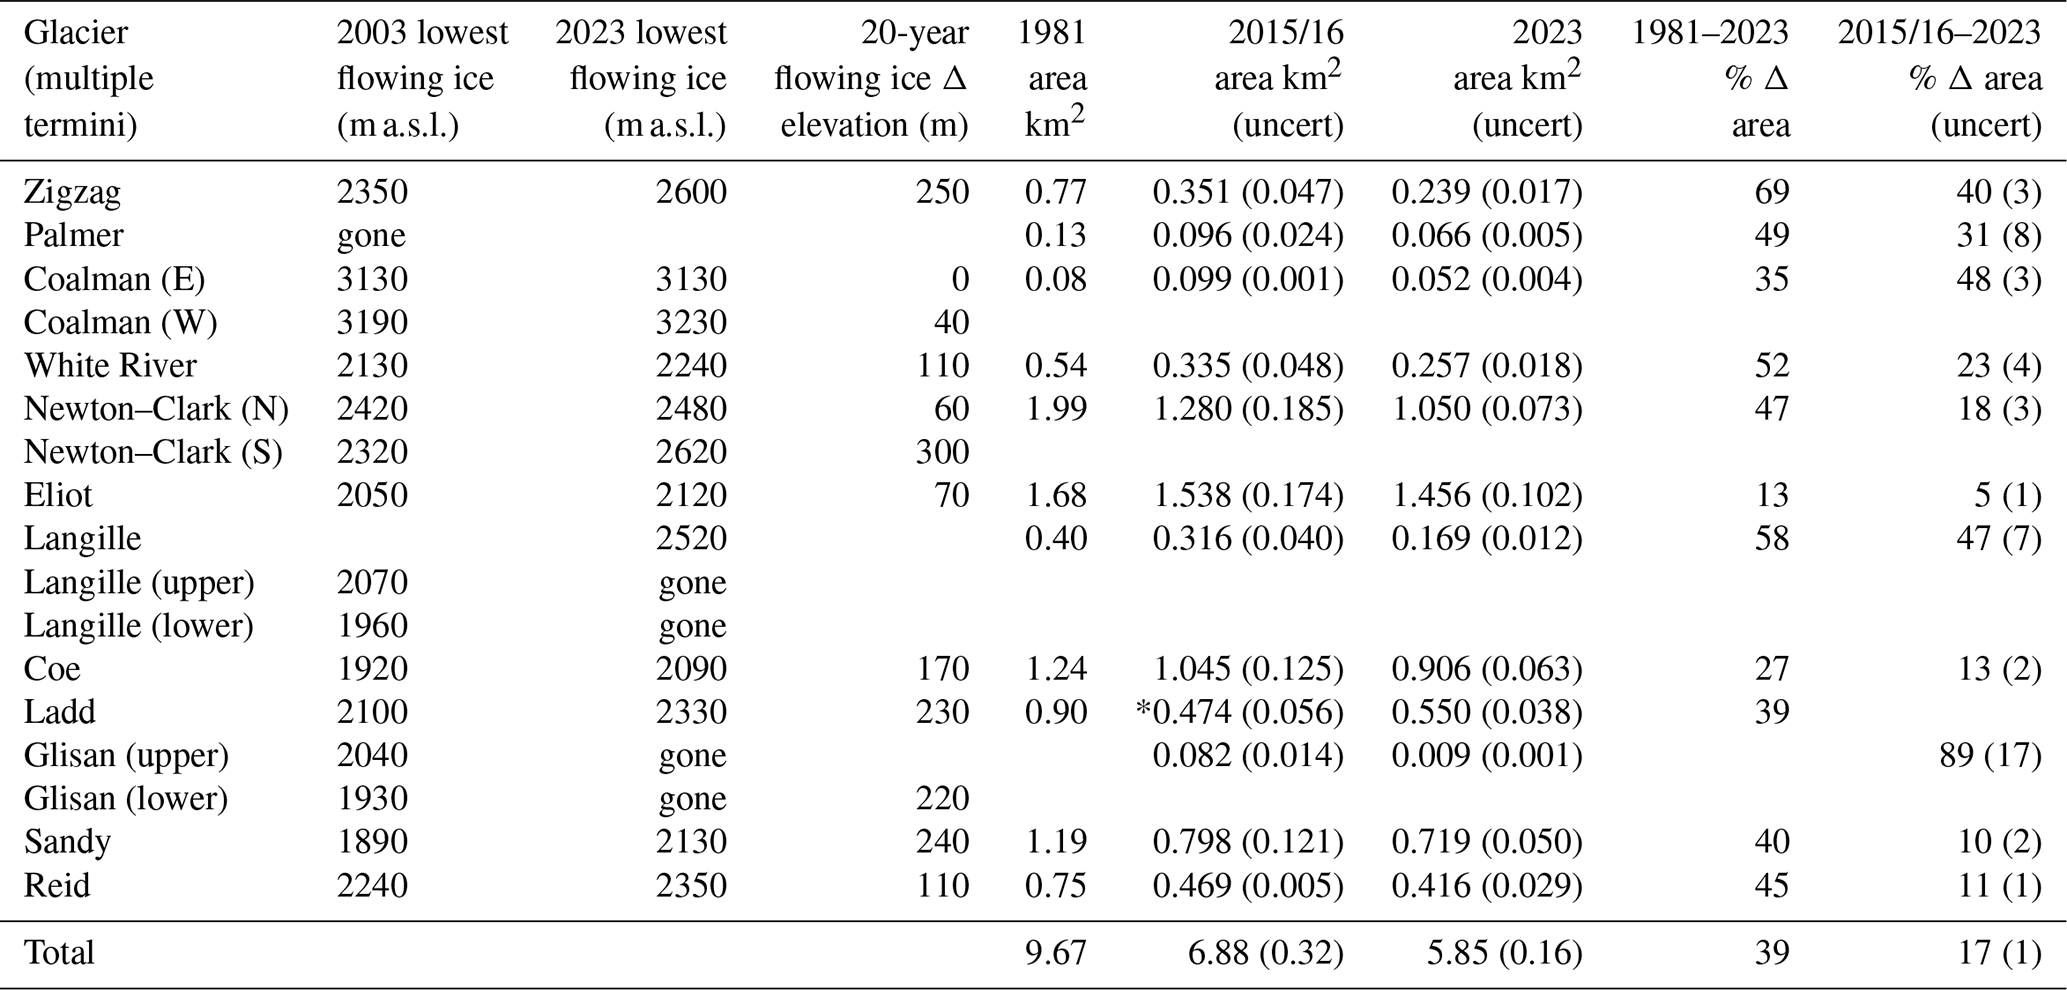
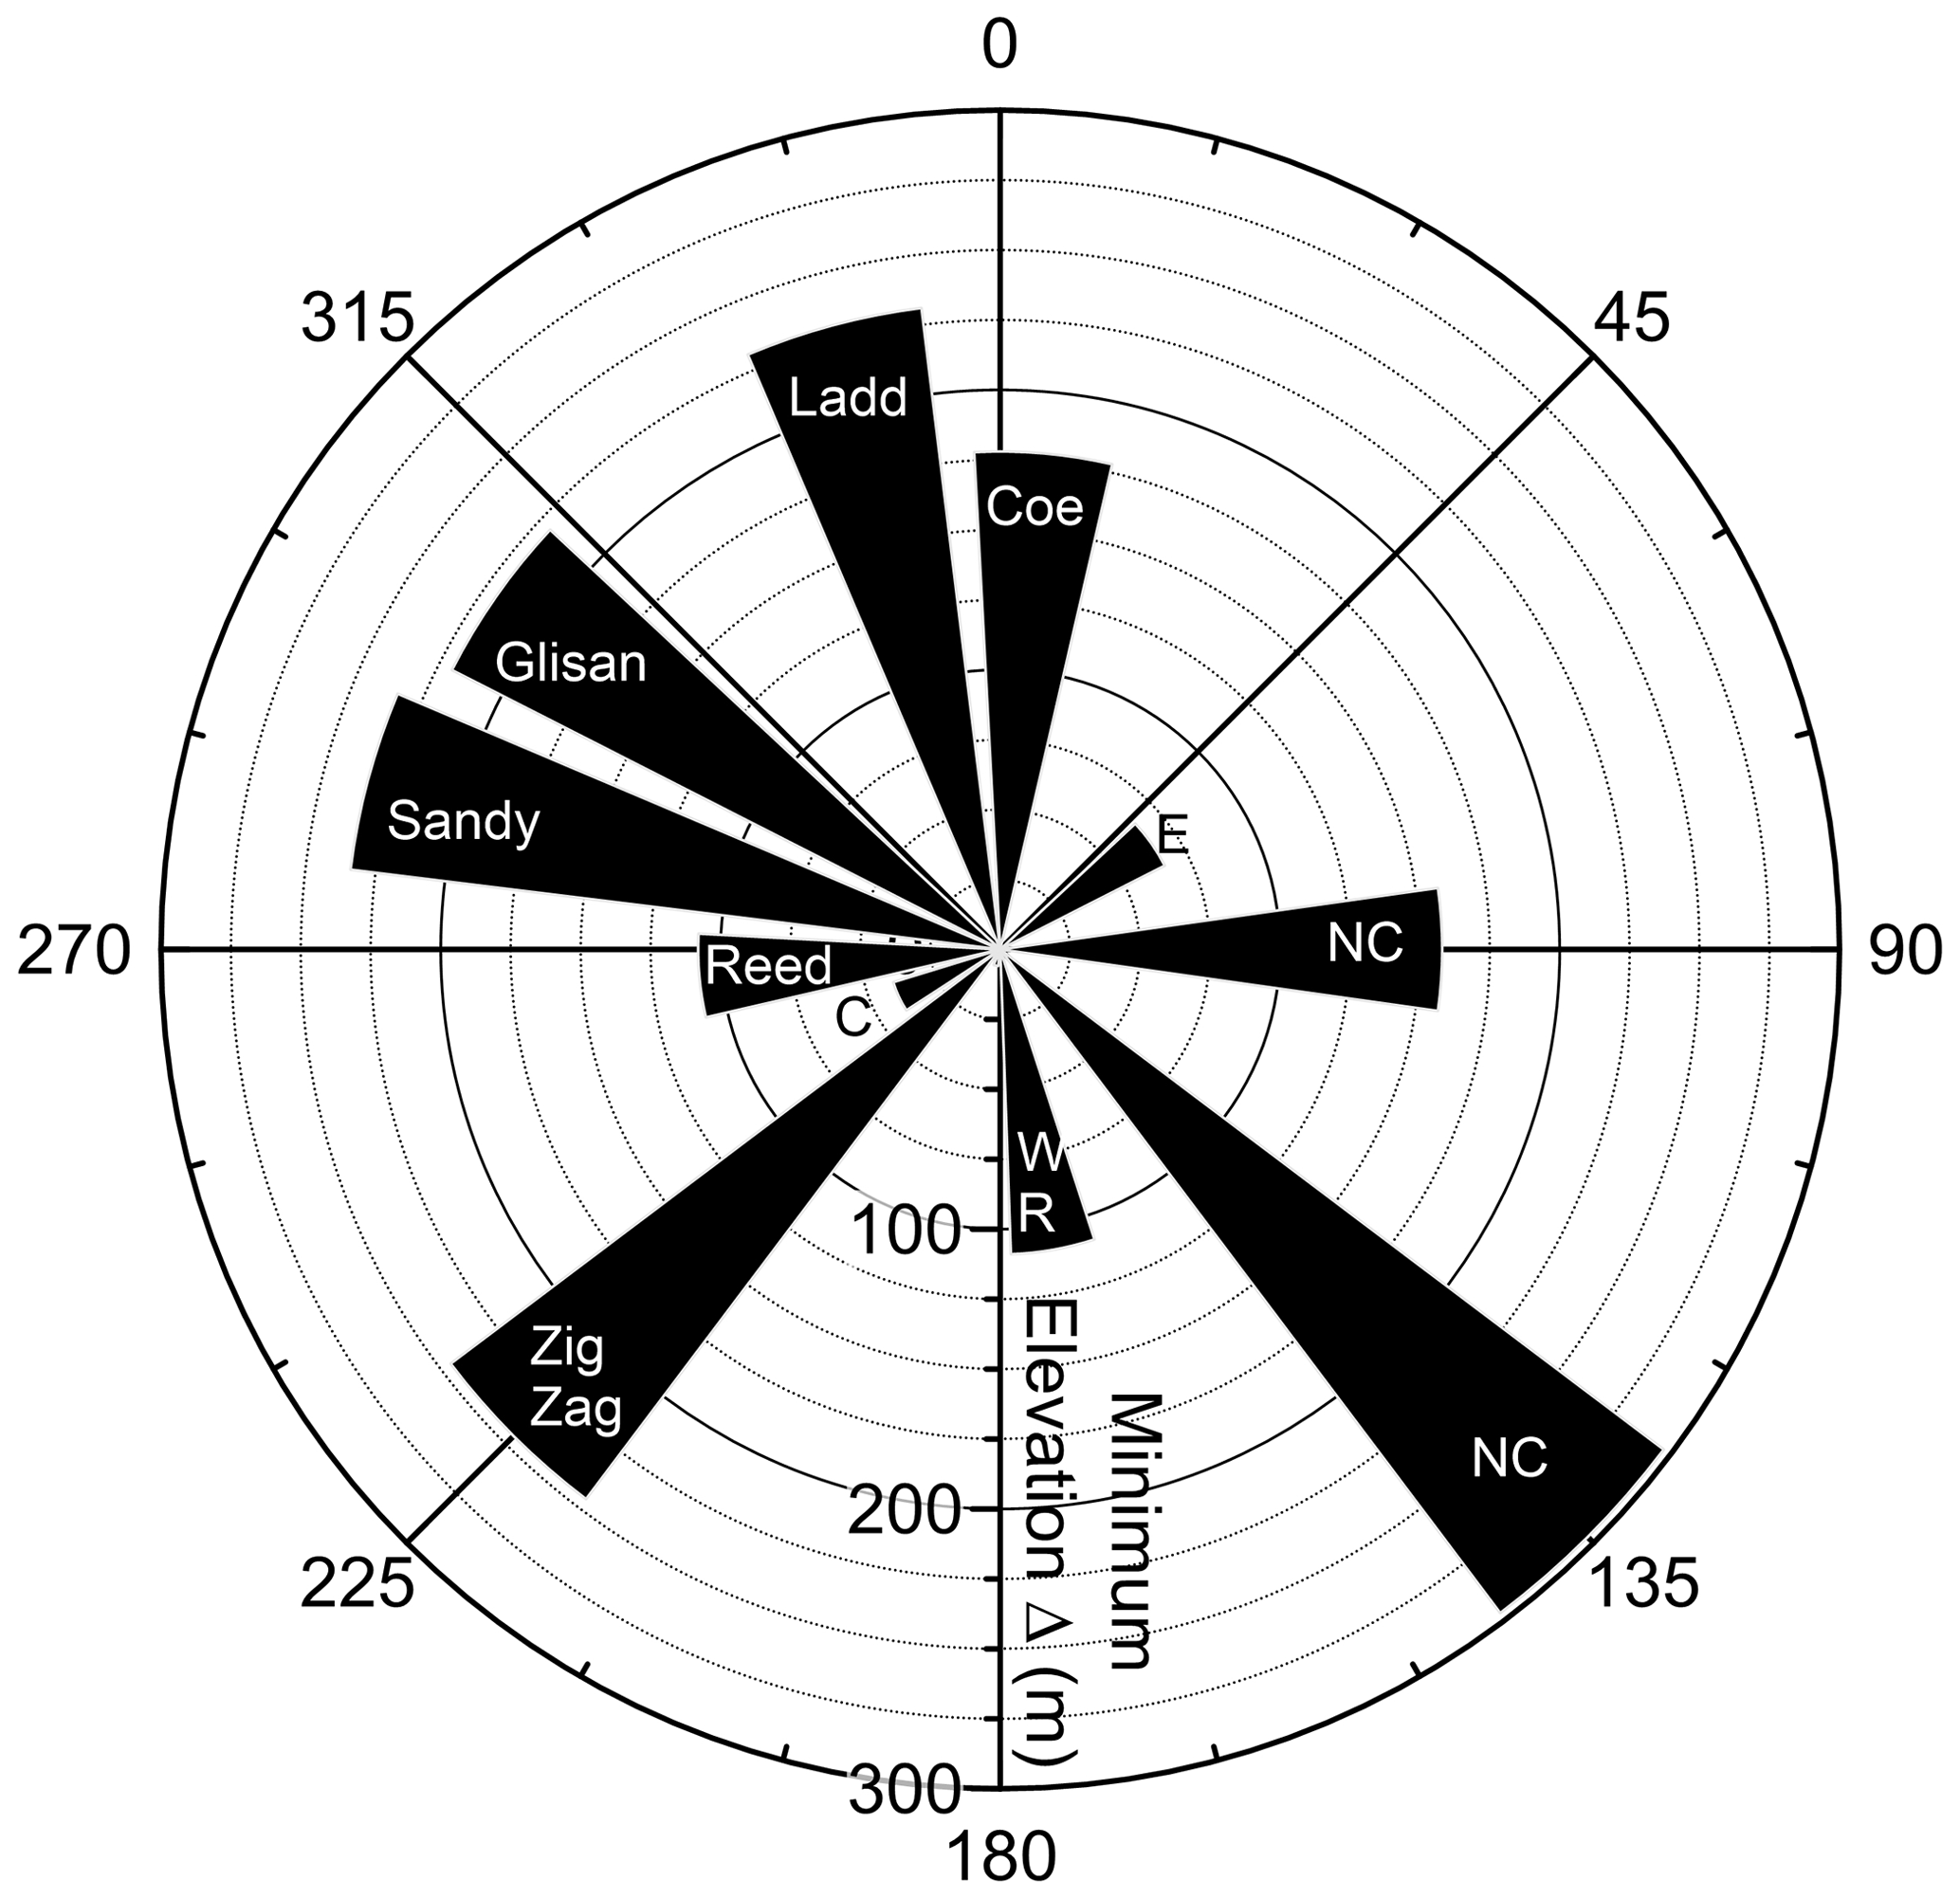
Figure 2Minimum change (Δ) in the lowest elevation of actively flowing ice from 2003 to 2023 relative to glacier position on Mt. Hood; C: Coalman, WR: White River, NC: Newton–Clark with its two termini labeled, and E: Eliot.
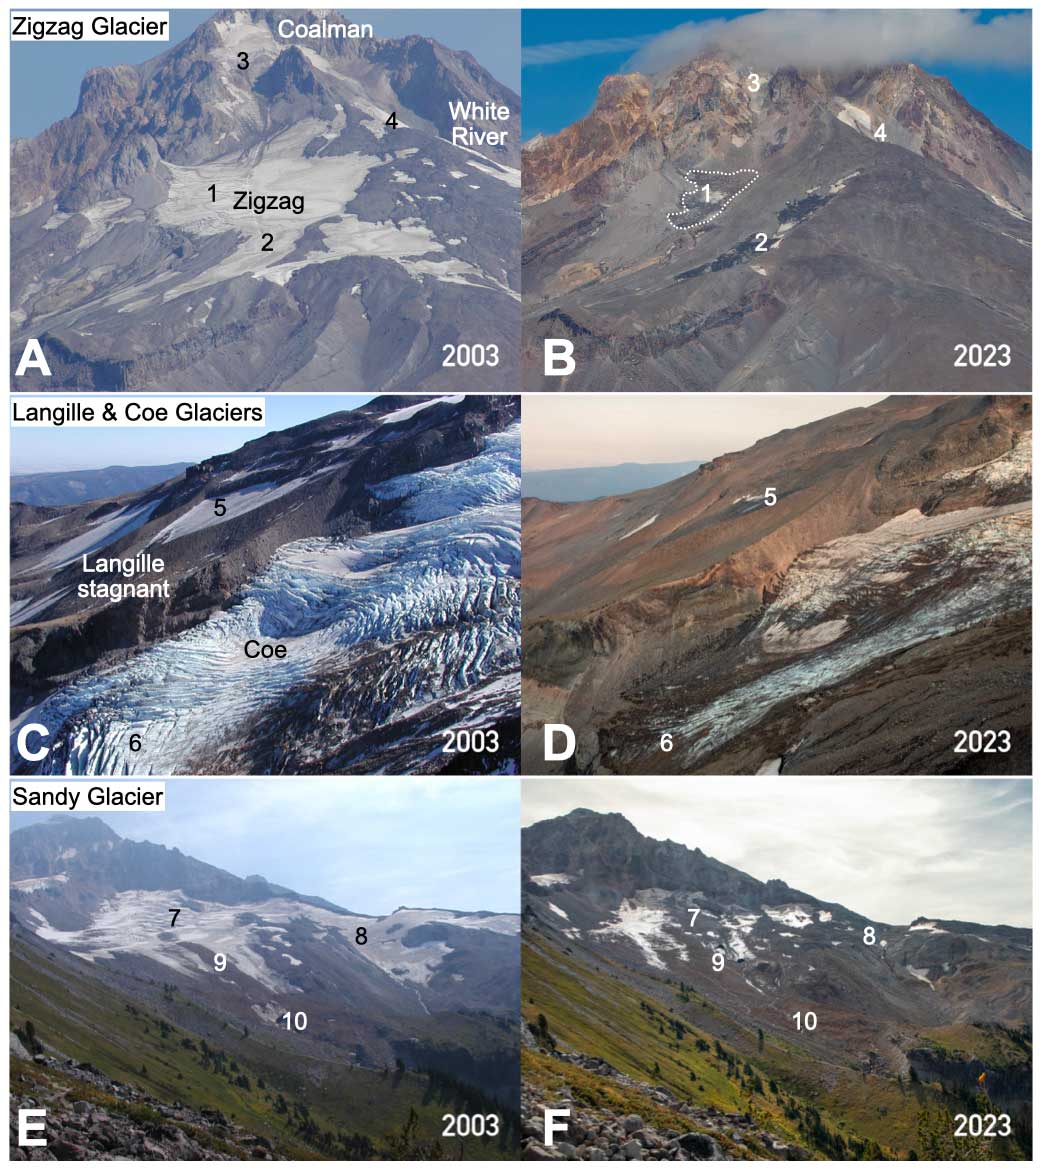
Figure 3Select repeat photographs from Mt. Hood; see Fig. 1b for photo locations. (a, b) Zigzag Glacier across the valley (shot location 45.29275, −121.80044°) repeat photograph from 2003 (a) and 2023 (b). (1) The reduction in area of Zigzag Glacier to its 2023 actively flowing limit (dashed white line). (2) Remnant stagnant ice that used to be part of the actively flowing glacier. (3) Western terminus of Coalman Glacier that has retreated but is still visible in 2023 at the edge of clouds. (4) Top of White River Glacier that has retracted since 2003. (c, d) Langille and Coe glaciers (shot location 45.39459, −121.69982°) in 2003 (c) and 2023 (d). (5) Nearly complete disappearance of remnant ice of Langille Glacier. (6) Loss of an icefall on Coe Glacier due to terminus retreat to just below the point (6) in panel (d). (e, f) Sandy Glacier (shot location 45.39477, −121.73124°) in 2003 (e) and 2023 (f). (7) Accumulation of rockfall on the glacier in the last 20 years. (8) Retreat of glacier ice that is now exposed bedrock. (9) 2023 terminus location and ice caves (f) that were in the center of the glacier in 2003 (e). (10) 2003 terminus with an ice cave (e) that is now stagnant, debris-covered ice (f).
In the last 7 to 8 years, every glacier on Mt. Hood lost area (Fig. 1b), resulting in 17±1 % loss in glacier area (Table 1) relative to 2015–2016 at 2.27±0.13 % yr−1 (yr: year). This area loss and rate do not include the area changes of Ladd Glacier. While Fountain et al. (2023) mapped Ladd's 2015–2016 area, we found that they excluded a region of buried ice that still existed in 2023, with our 2023 area (0.550±0.038 km2) being greater than the 2015–2016 area (0.474±0.056 km2). Nevertheless, our 2023 area was smaller than the 2004 area (0.67±0.05 km2) of Jackson and Fountain (2007). Glisan Glacier ceased to show evidence of flow between 2015 (Fountain et al., 2023) and our first field observation in 2020, with a stagnant-ice area of 0.009±0.0006 km2 as of 2023 (Table 1). Zigzag, Coalman, and Langille glaciers had lost >40 % of their area since 2015–2016. Ladd Glacier separated from its uppermost accumulation area (Fig. 3e, f), while Coe Glacier almost completely separated from its debris-covered terminus (Fig. 3c, d), both due to thinning over icefalls after 2016 (Fountain et al., 2023). A similar separation from its debris-covered terminus is occurring for Eliot Glacier (Fountain et al., 2023).
Relative to the 1981 glacier inventory (Driedger and Kennard, 1986b), the glacierized area of Mt. Hood had decreased by ∼39 % by 2023 (Table 1) at a rate of ∼0.93 % yr−1. This area change and rate do not include Glisan Glacier as this glacier's area was not included in the 1981 inventory. The largest relative area lost since 1981 was the southwest-facing Zigzag Glacier (∼69 %), followed by northeast-facing Langille Glacier (∼58 %) and south-facing White River Glacier (∼52 %). For the 10 glaciers with consistent 1981, 2015–2016, and 2023 areas, which thus excludes Ladd and Glisan, the rate of area change from 1981 to 2015–2016 was 0.81±0.04 % yr−1. From 2015–2016 to 2023, the rate of area loss was 2.10±0.06 % yr−1. Accordingly, glacier retreat accelerated by a factor of ∼2.6 between the two periods.
The seven largest glaciers on Mt. Hood (White River, Newton–Clark, Eliot, Coe, Ladd, Sandy, and Reid) that have area records extending back to 1907 (Jackson and Fountain, 2007) have lost a total of 47±2 % of their area since 1907 and 24.7±1.0 % of their area since 2000 (Table 2, Fig. 4). From 2000 to 2023, the rate of area loss was 1.07±0.04 % yr−1, ∼3.5 times faster than the 1907–2000 rate of 0.31±0.02 % yr−1 (Table 2). South-facing White River Glacier underwent the greatest rate of retreat in the 21st and 20th century, with the former being nearly 3 times faster than the latter (Table 2). North-facing Coe Glacier underwent the greatest 21st century acceleration in retreat, increasing by more than a factor of 7 from 0.15±0.05 % yr−1 to 1.09±0.11 % yr−1 (Table 2).
Table 2Area for the seven largest glaciers on Mt. Hood and their change (Δ) in area and rate of change expressed as a percent. 1907 and 2000 areas are from Jackson and Fountain (2007).
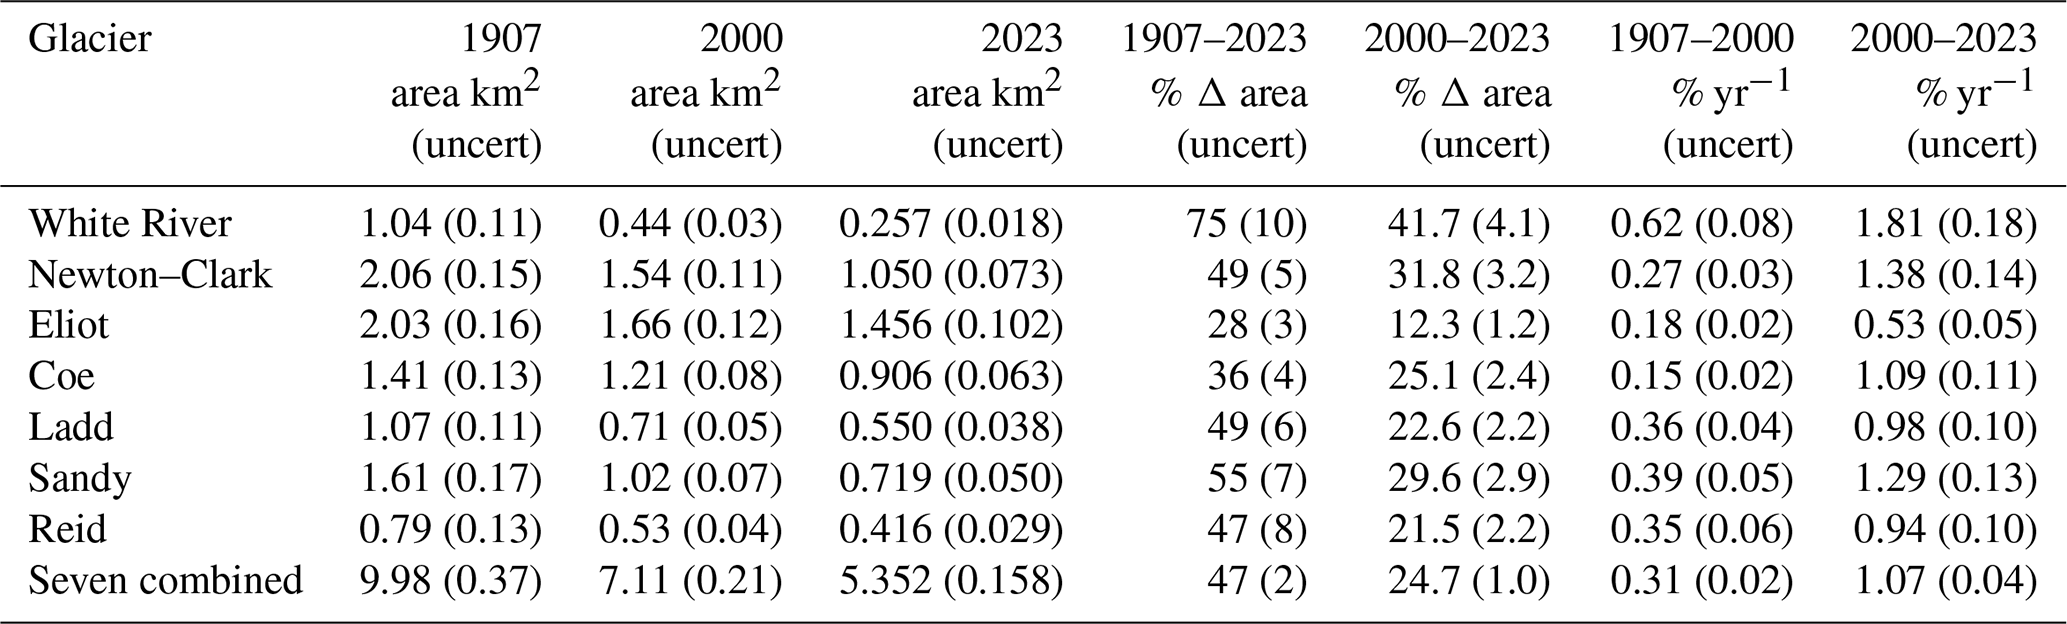
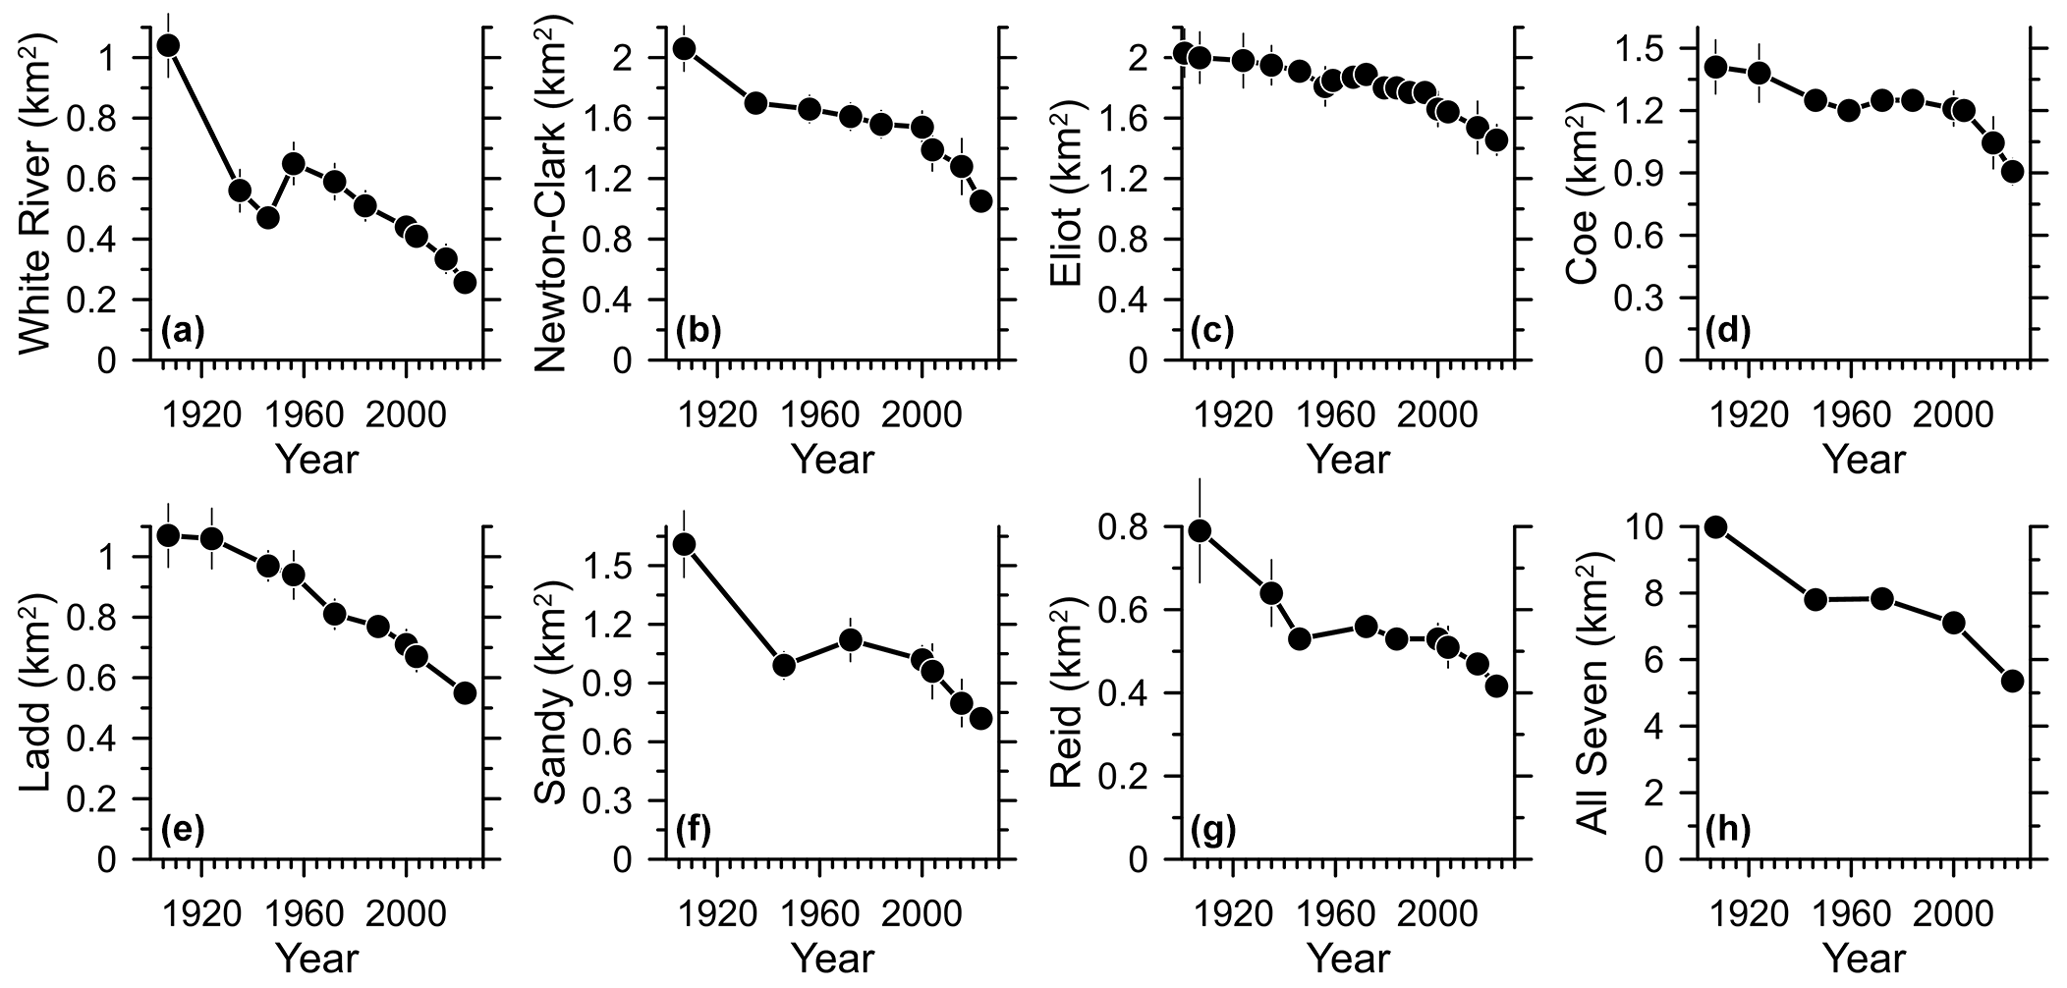
Figure 4Glacier area from 1907 (or 1901 for Eliot Glacier) to 2004 from Jackson and Fountain (2007), 2015 or 2016 from Fountain et al. (2023), and 2023 (new data), with combined area noted in the lower right. Uncertainty is noted by vertical bars; note that the uncertainty in the combined record is smaller than the symbol size. (a) White River Glacier. (b) Newton–Clark Glacier. (c) Eliot Glacier. (d) Coe Glacier. (e) Ladd Glacier. (f) Sandy Glacier. (g) Reid Glacier. (h) Combined record of seven glaciers.
The 21st century rate of total area loss for these seven glaciers (1.07±0.04 % yr−1) was 1.9 times faster than the prior maximum rate of area loss from 1907–1946 (0.56±0.02 % yr−1) (Fig. 5h). Six of the seven glaciers had individual 2000–2023 recession rates faster than their 1907–1946 rates (Fig. 5b–f). Reid Glacier's 2000–2023 rate of recession was 0.94±0.10 % yr−1, while its 1907–1946 rate was 0.84±0.14 % yr−1 (Fig. 5g).
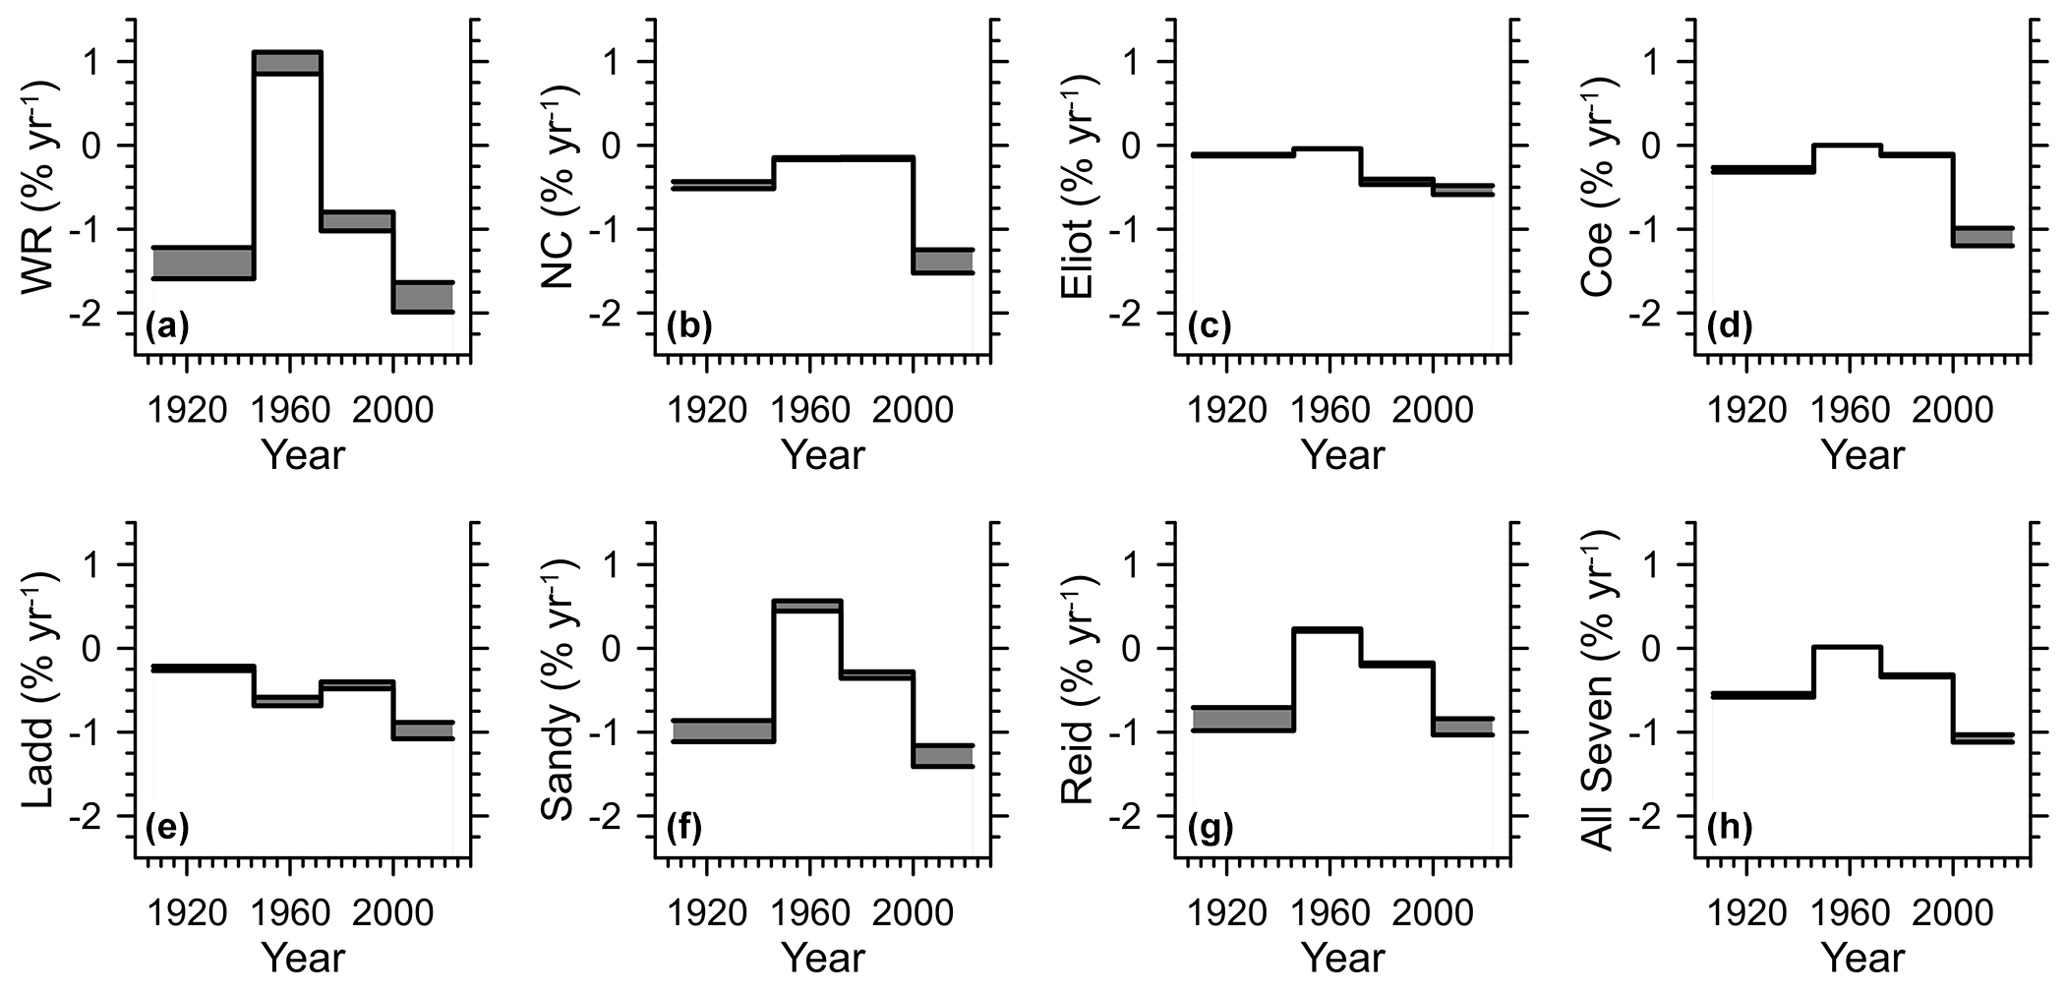
Figure 5Area change with respect to preceding ice area expressed as % yr−1 for seven glaciers calculated from Jackson and Fountain (2007) (1907–2000) and 2023 observations, with the combined rate in the lower right. Gray shading shows the uncertainty. (a) White River (WR) Glacier. (b) Newton–Clark (NC) Glacier. (c) Eliot Glacier. (d) Coe Glacier. (e) Ladd Glacier. (f) Sandy Glacier. (g) Reid Glacier. (h) Combined record of seven glaciers.
In the 21st century, every glacier on Mt. Hood has lost area, resulting in the loss of ∼25 % glacierized area since 2000, with a minimum rise in the elevation of actively flowing termini of ∼150 m on average over the last 20 years. This rapid area loss, combined with a rise in the lowest elevation for flowing ice, is indicative of large mass balance losses (e.g., Haeberli and Hoelzle, 1995; Pelto and Brown, 2012; Pelto, 2016; Hoelzle et al., 2023). Such clear glacier retraction and negative mass balance stand at odds with the Menounos et al. (2019) finding of near-neutral mass change for glaciers on Mt. Hood from 2000 to 2018. We note that their study lacked ground truthing of their geodetic measurements in Oregon, which combined with the high and growing debris cover on many of Mt. Hood's glaciers (e.g., Fig. 3h) could explain this disagreement. Furthermore, Florentine et al. (2024) found that not accounting for glacier area change when measuring geodetic mass balance reduces the mass balance change signal in western North American glaciers, with greater area loss leading to greater mass balance bias. Here, our field observations clearly show large-scale glacier loss, consistent with the 21st century retreat of glaciers around the globe (Zemp et al., 2015) and in agreement with the cumulative mass loss of benchmark glaciers to the north of Mt. Hood in Washington State (O'Neel et al., 2019; Pelto, 2023; World Glacier Monitoring Service, 2022).
Reconstructions of Ladd Glacier's extent in the 21st century highlight the difficulty that debris cover presents for mapping glacier extent in regions with significant rockfall. The 2015–2016 extent by Fountain et al. (2023), which did not include field checking, excluded a component of the debris-covered ice that we identified in the field in 2003 and that still remained in 2023 (Fig. 6). Jackson and Fountain (2007) also included this debris-covered ice in their 2004 Ladd extent (Fig. 1b), with this study including field checking of ice limits. This demonstrates the importance of field observations when mapping extents of glaciers with high amounts of debris cover.
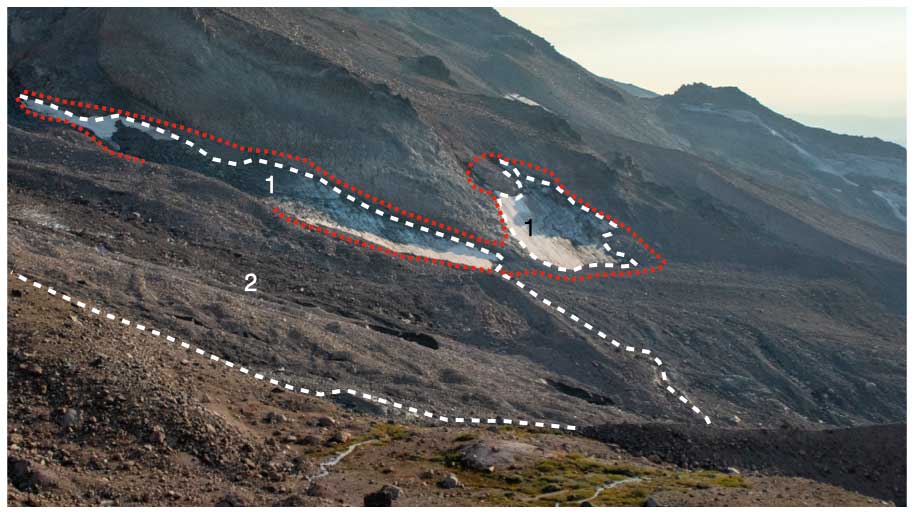
Figure 6Ladd Glacier terminus in 2023 (see Fig. 1b for photo location). Dashed white lines are the 2023 limit, while dotted red lines are the 2015–2016 ice limit of Fountain et al. (2023). (1) Ice bodies that Fountain et al. (2023) included in Ladd's 2015–2016 area. (2) Debris-covered stagnant ice that Fountain et al. (2023) did not include in the 2015–2016 area of the glacier that remained in 2023 and was included in its 2023 limit.
The combined retreat for Mt. Hood's seven largest glaciers over the first 23 years of the 21st century stands out as unparalleled since at least the beginning of the 1900s (Figs. 4, 5), similar to the findings of Beason et al. (2023) for glaciers on Mt. Rainier in Washington and agreeing with a shift to more negative annual mass balance for western United States benchmark glaciers since 1990 (O'Neel et al., 2019). We compare Mt. Hood's rate of glacier recession of 1.07±0.04 % yr−1 from 2000 to 2023 (seven largest glaciers; Table 2) and 2.27±0.13 % yr−1 from 2015–2016 to 2023 (all glaciers except Ladd; Table 1) to other western United States glacierized ranges with comparable records of glacier area. To the north in Washington State (Fig. 1a), Mt. Rainier glaciers retreated at 0.59±0.05 % yr−1 from 1994 to 2021 and 0.69±0.05 % yr−1 from 2015 to 2021 (Beason et al., 2023), while glaciers in the Olympic Mountains retreated at 1.44±0.02 % yr−1 from 1990 to 2015 and 2.75±0.04 % yr−1 from 2009 to 2015 (Fountain et al., 2022). To the northeast in Montana (Fig. 1a), Glacier National Park glaciers receded at ∼0.77 % yr−1 from 1998 to 2015 and ∼0.83 % yr−1 from 2005 to 2015 (Fagre et al., 2017). Lastly, to the south in California (Fig. 1a), glaciers in the Trinity Alps retreated at 3.89±0.02 % yr−1 between 1994 and 2015, leading to nearly complete deglaciation of the mountain range by 2015 (Garwood et al., 2020). Thus, the rates of glacier retreat on Mt. Hood in the 21st century are some of the highest rates in the western United States but have yet to exceed the 2009–2015 rate in the Olympic Mountains, where the rate change record ended in 2015, or the rate in the Trinity Alps, where the record ended in 2015 with nearly complete deglaciation.
In the last 20 years, Glisan Glacier on Mt. Hood retreated to a 2023 area of ∼0.009 km2 and ceased to be an actively flowing glacier, joining Palmer Glacier in this stagnant glacier status (Table 1; Supplement). We find that two other glaciers are nearing this reclassification as stagnant glaciers: Zigzag and Coalman (Supplement). With only ∼0.1 km2 of flowing ice remaining, Zigzag Glacier was only distinguishable from stagnant ice due to the presence of a few crevasses that have yet to start melting in on themselves (i.e., movement is keeping them open). Coalman Glacier at ∼0.06 km2 (Table 1) is now below the area threshold of 0.1 km2 used by the US Geological Survey to distinguish active flowing glaciers (Fagre et al., 2017) but is above the 0.01 km2 threshold used in global inventories (Pfeffer et al., 2014). More importantly, Coalman still showed evidence of flow with one active crevasse. These two glaciers also lost 40 %–48 % of their area, while Langille Glacier lost ∼47 % of its area in the last 7 to 8 years (Table 1). We predict that in the near future all three will stagnate if this rapid retreat continues.
Fluctuations in the rate of glacier area change on Mt. Hood generally corresponded to past changes in regional summer temperature and winter precipitation. The 20th century maximum rate of retreat from 1907 to 1946 (Fig. 7c) occurred during a period of warming summer temperatures (Fig. 7b) and reduced winter precipitation (Fig. 7a). Conversely, the interval of overall glacier stability from 1946 to 1972 (Figs. 4h, 7c) with some glaciers advancing (Fig. 4a, c, d, f, g) started with summer cooling, followed by temperatures below the 1940s maximum concurrent with initial maxima in winter precipitation, followed by elevated precipitation relative to the early 1900s. Marvel et al. (2019) previously attributed these changes in Pacific Northwest hydroclimate to anthropogenic forcing, with the initial warmer–drier period forced by rising anthropogenic greenhouse gas emissions and the subsequent cooler–wetter period caused by aerosol emissions counteracting continued greenhouse gas emissions. Renewed glacier retreat from 1972 to 2000 began with reduced winter precipitation and warming summer temperatures, but this pattern then changed in the 1990s when summer temperatures continued to warm along with greater winter precipitation. Glaciers still retreated in the 1990s despite greater winter precipitation (Figs. 4, 7c).
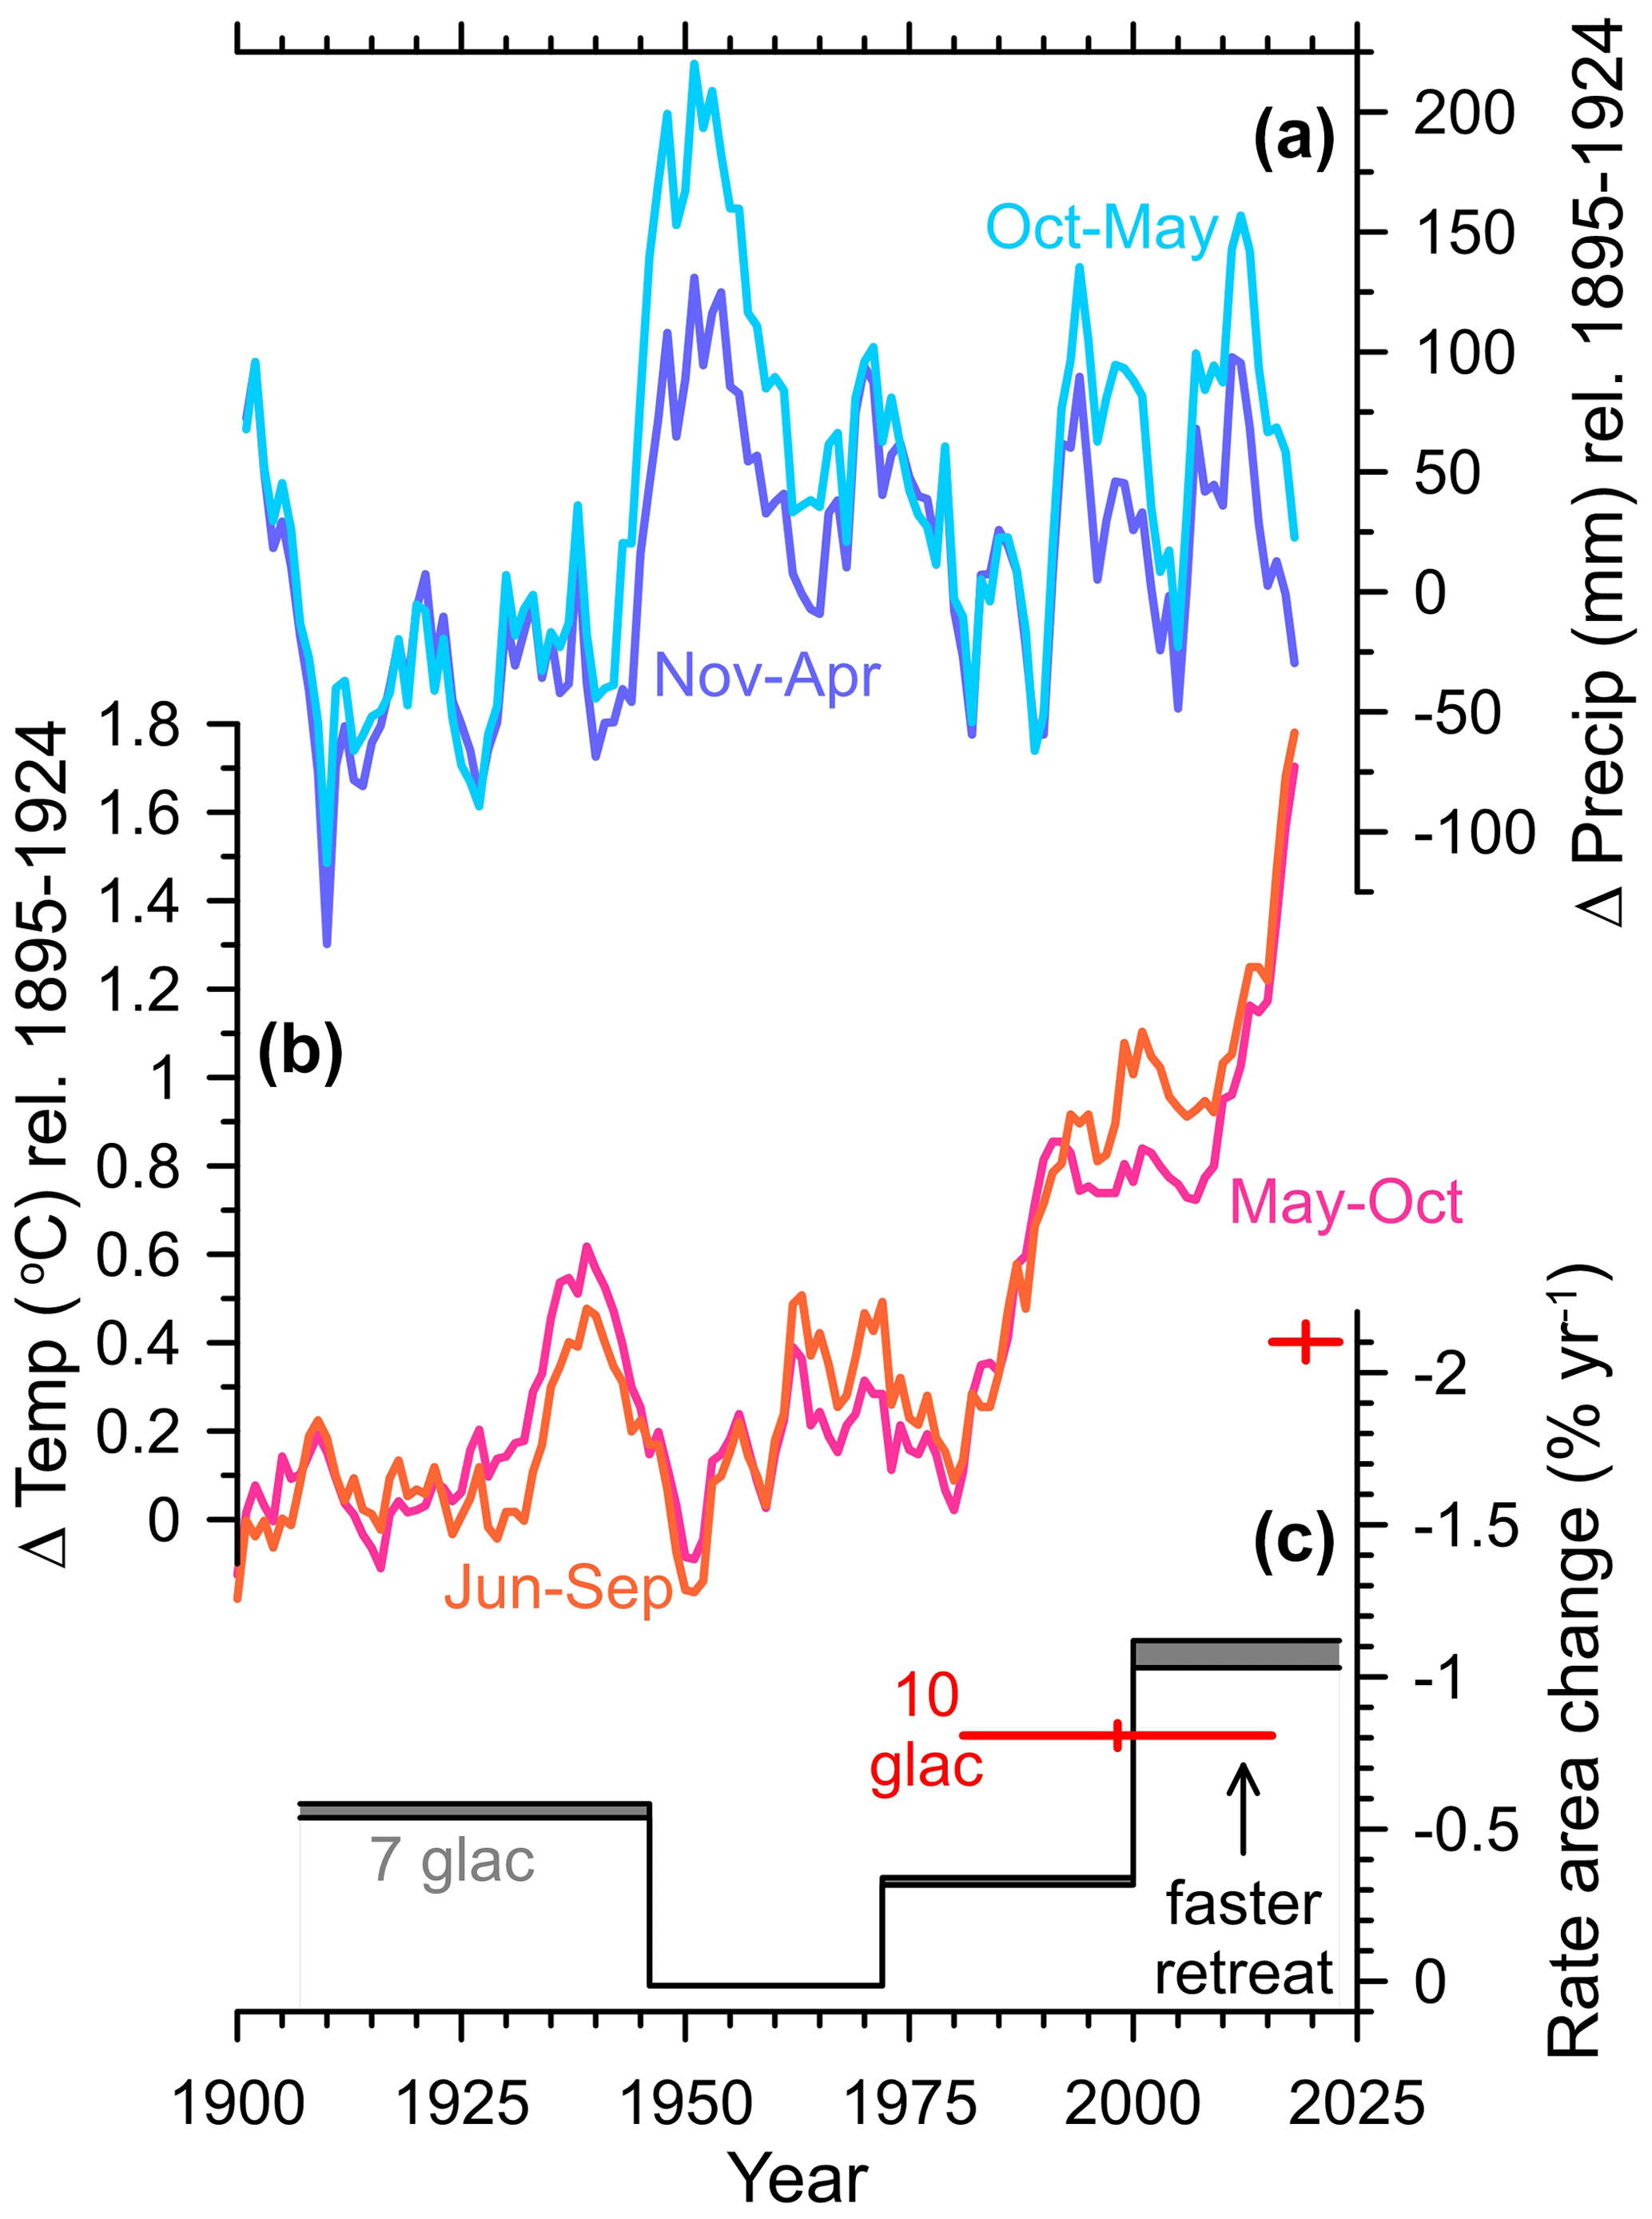
Figure 7Hood River County climate change and Mt. Hood glacier area change rate. (a) 11-year running mean for the change in total October–May (light blue) and November–April (blue) precipitation relative to the 1895–1924 average. (b) 11-year running mean change in May–October (pink) and June–September (orange) temperature relative to the 1895–1924 average. (c) Rate of glacier area change for the 7 glaciers (glac: glaciers) with records back to 1907 (Jackson and Fountain, 2007) (step plot with gray shading showing the uncertainty) and the rate of area change for 10 glaciers (excludes Ladd and Glisan) between 1981 and 2015–2016 and between 2015–2016 and 2023 (Driedger and Kennard, 1986b; Fountain et al., 2023) (red crosses where the length is the period of time covered and the height the uncertainty). Note the inverted axis where a faster rate of area loss is oriented up.
The unprecedented rate of glacier retreat in 21st century (2000–2023) and from 2015–2016 to 2023 (Fig. 7c) corresponds to regional summer temperatures warming to maxima (Fig. 7b). The 2013–2023 mean May–October and June–September temperatures were ∼1.7 °C and ∼1.8 °C, respectively, warmer than their 1895–1924 means. Indeed, recent summer warmth in the Oregon, Washington, and southern British Columbia is unequaled in more than a millennium (Heeter et al., 2023). Conversely, contemporary regional precipitation changes would not explain the 21st century glacier retreat on Mt. Hood because the 2013–2023 means were around the 1895–1924 means (November–April was slightly below, while October–May was slightly above the 1895–1924 means) and the preceding decade had greater amounts of precipitation (Fig. 7a).
As such, we argue that the retreat of Mt. Hood glaciers over the last ∼120 years reflects regional climate warming (Roe et al., 2017, 2021) and that recent unprecedented retreat reflects the unequaled recent warmth. This agrees with mass balance–temperature relationships for glaciers to the north in Washington State and for western United States benchmark glaciers. Pelto (2018) found significant relationships between annual mass balance with June–September temperature for 11 glaciers in Washington. O'Neel et al. (2019) noted the lack of a winter mass balance trend for the four benchmark glaciers in Washington and Alaska and a positive winter mass balance trend for the one glacier in Montana, meaning these glaciers' negative annual mass balance trends were being driven by summer temperatures.
We documented from field observations combined with remote sensing that the glaciers of Mt. Hood have retreated and accordingly lost mass in the 21st century, losing ∼25 % of their area (seven largest glaciers) in the last 23 years and ∼17 % of their area (11 of 12 glaciers) in the last 7 to 8 years at unprecedented rates (1.07±0.04 % yr−1 and 2.27±0.13 % yr−1, respectively) with respect to the last 120 years. This is contrary to geodetic mass balance changes from remote sensing data alone (Menounos et al., 2019). The rate of area loss in the 21st century has proceeded ∼1.9 times faster than the fastest rate of the 20th century and ∼3.5 times faster than the average 20th century rate. Two glaciers have ceased to flow (Glisan, Palmer), with another three glaciers rapidly losing area towards stagnation (Zigzag, Coalman, Langille). This recent rapid retreat of Mt. Hood glaciers can be attributed to a warming climate, with 2013–2023 regional summer means 1.7–1.8 °C warmer than 1895–1924 means. As such, the warming climate of the last 120 years, especially the last 20 years, has significantly impacted the glacier coverage of Mt. Hood, with this recession continuing unless and until the sign of multi-decadal temperature change is reversed.
The data referred to in this paper have all been provided within the tables and figures in the main text and Supplement or as an asset available on a FAIR-aligned data repository (available at https://doi.org/10.5281/zenodo.13356244, Oregon Glaciers Institute, 2024).
The supplement related to this article is available online at: https://doi.org/10.5194/tc-18-4517-2024-supplement.
The author contributions, following the CRediT authorship guidelines, are as follows. NBF, SJB, and AEC: conceptualization; NBF, SJB, BCS, DHR, and AEC: methodology; NBF, SJB, BCS, and AEC: validation; NBF, SJB, BCS, MT, DHR, and AEC: analysis; NBF, SJB, BCS, MT, DHR, and AEC: investigation; NBF, SJB, BCS, DHR, and AEC: resources; NBF, SJB, BCS, MT, and AEC: data curation; AEC: original draft; NBF, SJB, BCS, MT, DHR, and AEC: review and editing; NBF, SJB, BCS, MT, DHR, and AEC: visualization; NBF, SJB, BCS, MT, DHR, and AEC: administration; NBF, SJB, BCS, MT, DHR, and AEC: funding acquisition.
The contact author has declared that none of the authors has any competing interests.
Publisher's note: Copernicus Publications remains neutral with regard to jurisdictional claims made in the text, published maps, institutional affiliations, or any other geographical representation in this paper. While Copernicus Publications makes every effort to include appropriate place names, the final responsibility lies with the authors.
We thank the US National Forest Service for permitting research access to the Mt. Hood Wilderness Area and Andrew Fountain for sharing the historical area record for Mt. Hood. Insight from reviewers Andrew G. Fountain, Mauri Pelto, and Frank Paul, as well as an anonymous reviewer, greatly improved this manuscript, along with guidance from editor Ben Marzeion.
This research has been supported by the Mazamas Mountaineering Club through a conservation grant. The Oregon Glaciers Institute is a nonprofit 501-c-3 that is supported by private donations.
This paper was edited by Ben Marzeion and reviewed by Andrew G. Fountain, Mauri Pelto, Frank Paul, and one anonymous referee.
Beason, S. R., Kenyon, T. R., Jost, R. P., and Walker, L. J.: Changes in glacier extents and estimated changes in glacial volume at Mount Rainier National Park, Washington, USA from 1896 to 2021, National Resource Report NPS/MORA/NRR-2023/2524, 2023.
Cogley, J. G., Hock, R., Rasmussen, L. A., Arendt, A. A., Bauder, A., Braithwaite, R. J., Jansson, P., Kaser, G., Möller, M., Nicholson, L., and Zemp, M.: Glossary of Glacier Mass Balance and Related Terms, IHP-VII Technical Documents in Hydrology No. 86, IACS Contribution No. 2, UNESCO-IHP, 2011.
Columbia Gorge Fruit Growers: Crops Information, http://www.cgfg.org/information/crops-information (last access: 3 April 2024), 2024.
Dodge, N. A.: The Eliot Glacier: New Methods and Some Interpretations, Mazama Bulletin, 53, 25–33, 1971.
Dodge, N. A.: Eliot Glacier: Net Mass Balance, Mazama Bulletin, 69, 52–55, 1987.
Driedger, C. L. and Kennard, P. M.: Glacier volume estimation on Cascade volcanoes: An analysis and comparison with other methods, Ann. Glaciol., 8, 59–64, 1986a.
Driedger, C. L. and Kennard, P. M.: Ice Volumes on Cascade Volcanoes: Mount Rainier, Mount Hood, Three Sisters, and Mount Shasta, U.S. Geological Survey Professional Paper 1365, 1986b.
Ellinger, J. R.: The Changing Glaciers of Mt. Hood, Oregon and Mt. Rainier, Washington: Implications for Periglacial Debris Flows, MSc Thesis, Oregon State University, 2010.
Fagre, D. B., McKeon, L. A., Dick, K. A., and Fountain, A. G.: Glacier margin time series (1966, 1998, 2005, 2015) of the named glaciers of Glacier National Park, MT, USA, U.S. Geological Survey data release, https://doi.org/10.5066/F7P26WB1, 2017.
Farmers Irrigation District, https://www.fidhr.org/index.php/en/about-us/hydroelectric (last access: 3 April 2024), 2024.
Florentine, C., Sass, L., McNeil, C., Baker, E., and O'Neel, S.: How to handle glacier area change in geodetic mass balance, J. Glaciol., jog.2023.86, https://doi.org/jog.2023.86, 2024.
Fountain, A. G., Glenn, B., and Basagic, H. J.: The geography of glaciers and perennial snowfields in the American West, Arct. Antarct. Alp. Res., 49, 391–410, 2017.
Fountain, A. G., Gray, C., Glenn, B., Menounos, B., Pflug, J., and Riedel, J. L.: Glaciers of the Olympic Mountains, Washington – The Past and Future 100 Years, J. Geophys. Res., 127, e2022JF006670, https://doi.org/10.1029/2022JF006670, 2022.
Fountain, A. G., Glenn, B., and Mcneil, C.: Inventory of glaciers and perennial snowfields of the conterminous USA, Earth Syst. Sci. Data, 15, 4077–4104, https://doi.org/10.5194/essd-15-4077-2023, 2023.
Frans, C., Istanbulluoglu, E., Lettenmaier, D. P., Clarke, G., Bohn, T. J., and Stumbaugh, M.: Implications of decadal to century scale glacio-hydrological change for water resources of the Hood River basin, OR, USA, Hydrol. Process., 30, 4314–4329, 2016.
Frans, C., Istanbulluoglu, E., Lettenmaier, D. P., Fountain, A. G., and Riedel, J.: Glacier Recession and the Response of Summer Streamflow in the Pacific Northwest United States, 1960–2099, Water Res. Res., 54, 6202–6225, 2018.
Garwood, J. M., Fountain, A. G., Lindke, K. T., van Hattem, M. G., and Basagic, H. J.: 20th Century Retreat and Recent Drought Accelerated Extinction of Mountain Glaciers and Perennial Snowfields in the Trinity Alps, California, Northwest Sci., 94, 44–61, 2020.
GLIMS and NSIDC: Global Land Ice Measurements from Space Glacier Database, Compiled and Made Available by the International GLIMS Community and the National Snow and Ice Data Center [data set], https://doi.org/10.7265/N5V98602, 2005, updated 2023.
Haeberli, W. and Hoelzle, M.: Application of inventory data for estimating characteristics of and regional climate-change effects on mountain glaciers: a pilot study with the European Alps, Ann. Glaciol., 21, 206–212, 1995.
Handewith Jr., H.: Recent Glacier Variations on Mt. Hood, Mazama Bulletin, 41, 23–28, 1959.
Heeter, K. J., Harley, G. L., Abatzoglou, J. T., Anchukaitis, K. J., Cook, E. R., Coulthard, B. L., Dye, L. A., and Homfeld, I. K.: Unprecedented 21st century heat across the Pacific Northwest of North America, npj Clim. Atmos. Sci., 6, 5, https://doi.org/10.1038/s41612-023-00340-3, 2023.
Hoelzle, M., Haeberli, W., Dischl, M., and Peschke, W.: Secular glacier mass balances derived from cumulative glacier length changes, Global Planet. Change, 36, 295–306, 2023.
Howcutt, S., Spagnolo, M., Rea, B. R., Jaszewski, J., Barr, I., Coppola, D., De Siena, L., Girona, T., Gomez-Patron, A., Mullan, D., and Pritchard, M. E.: Icy Thermometers: Quantifying the impact of volcanic heat on glacier elevation, Geology, 51, 1143–1147, 2023.
Hugonnet, R., McNabb, R., Berthier, E., Menounos, B., Nuth, C., Girod, L., Farinotti, D., Huss, M., Dussaillant, I., Brun, F., and Kääb, A.: Accelerated global glacier mass loss in the early twenty-first century, Nature, 592, 726–731, 2021.
Jackson, K. M., and Fountain, A. G.: Spatial and morphological change on Eliot Glacier, Mount Hood, Oregon, USA, Ann. Glaciol., 46, 222–226, 2007.
Leigh, J. R., Stokes, C. R., Carr, J. R., Evans, I. S., Andreassen, L. M., and Evans, D. J. A.: Identifying and mapping very small (<0.5 km2) mountain glaciers on coarse to high-resolution imagery, J. Glaciol., 65, 873–888, 2019.
Leonard, K. C. and Fountain, A. G.: Map-based methods for estimating glacier equilibrium-line altitudes, J. Glaciol., 49, 329–336, 2003.
Lillquist, K. and Walker, K.: Historical Glacier and Climate Fluctuations at Mount Hood, Oregon, Arct. Antarct. Alp. Res., 38, 399–412, 2006.
Lundstrom, S. C., McCafferty, A. E., and Coe, J. A.: Photogrammetric analysis of 1984-89 surface altitude change of the partially debris-covered Eliot Glacier, Mount Hood, Oregon, U.S.A., Ann. Glaciol., 17, 167–170, 1993.
Marvel, K., Cook, B. I., Bonfils, C. J. W., Durack, P. J., Smerdon, J. E., and Williams, A. P.: Twentieth-century hydroclimate changes. Consistent with human influences, Nature, 569, 59–65, 2019.
Marzeion, B., Cogely, J. G., Richter, K., and Parkes, D.: Attribution of global glacier mass loss to anthropogenic and natural causes, Science, 345, 919–921, 2014.
Mason, R. S.: Recent Survey of Coe and Eliot Glaciers, Mazama Bulletin, 36, 37–39, 1954.
Menounos, B., Hugonnet, R., Shean, D., Gardner, A., Howat, I., Berthier, E., Pelto, B., Tennant, C., Shea, J., Noh, M.-J., Brun, F., and Dehecq, A.: Heterogeneous Changes in Western North American Glaciers Linked to Decadal Variability in Zonal Wind Strength, Geophys. Res. Lett., 46, 200–209, 2019.
Miller, J. B., Frisbee, M. D., Hamilton, T. L., and Murugapiran, S. K.: Recharge from glacial meltwater is critical for alpine springs and their microbiomes, Environ. Res. Lett., 16, 064012, https://doi.org/10.1088/1748-9326/abf06b, 2021.
Mote, P. W., Rupp, D. E., Li, S., Sharp, D. J., Otto, F., Uhe, P. F., Xiao, M., Lettenmaier, D. P., Cullen, H., and Allen, M. R.: Perspectives on the causes of exceptionally low 2015 snowpack in the western United States, Geophys. Res. Lett., 43, 10980–10988, 2016.
Müller, F., Caflisch, T., and Müller, G.: Instructions for Compilation and Assemblage of Data for a World Glacier Inventory, Temporary Technical Secretariat for World Glacier Inventory, International Commission on Snow and Ice, https://wgms.ch/downloads/Mueller_etal_UNESCO_1977.pdf (last access: 10 July 2024), 1977.
Nolin, A. W., Phillippe, J., Jefferson, A., and Lewis, S. L.: Present-day and future contributions of glacier runoff to summertime flows in a Pacific Northwest watershed: Implications for water resources, Water Res. Res., 46, W12509, https://doi.org/10.1029/2009WR008968, 2010.
O'Connor, J. E.: Our Vanishing Glaciers, Oregon Historical Quarterly, 114, 402–427, 2013.
O'Neil, D.: Changes at Elevation, 1859 Oregon's Magazine, 77, 60–67, 2023.
O'Neel, S., McNeil, C., Sass, L. C., Florentine, C., Baker, E. H., Peitzsch, E., McGrath, D., Fountain, A. G., and Fagre, D.: Reanalysis of the US Geological Survey Benchmark Glaciers: long-term insight into climate forcing of glacier mass balance, J. Glaciol., 65, 850–866, 2019.
Oregon Glaciers Institute: 2023 Mt. Hood Glacier Margins for “Unprecedented Twenty-First Century Glacier Loss on Mt. Hood, Oregon, U.S.A.”, Zenodo [data set], https://doi.org/10.5281/zenodo.13356244, 2024.
Paul, F., Barrand, N. E., Baumann, S., Berthier, E., Bolch, T., Casey, K., Frey, H., Joshi, S. P., Konovalov, V., Le Bris, R., Mölg, N., Nosenko, G., Nuth, C., Pope, A., Racoviteanu, A., Rastner, P., Raup, B., Scharrer, K., Steffen, S., and Winsvold, S.: On the accuracy of glacier outlines derived from remote-sensing data, Ann. Glaciol., 54, 171–182, 2013.
Pelto, M.: Climate Driven Retreat of Mount Baker Glaciers and Changing Water Resources, Springer Briefs in Climate Studies, https://doi.org/10.1007/978-3-319-22605-7, 2016.
Pelto, M. and Brown, C.: Mass balance loss of Mount Baker, Washington glaciers 1990–2010, Hydrol. Process., 26, 2601–2607, 2012.
Pelto, M. S.: How Unusual Was 2015 in the 1984-2015 Period of the North Cascade Glacier Annual Mass Balance?, Water, 10, w10050543, https://doi.org/10.3390/w10050543, 2018.
Pelto, M. S.: Alpine Glaciers, State of the Climate in 2022, 2. Global Climate, B. Am. Meteorol. Soc., 104, Si-S501, https://doi.org/10.1175/2023BAMSStateoftheClimate.1, 2023.
Pelto, M. S. and Hedlund, C.: Terminus behavior and response time of North Cascade glaciers, Washington, U.S.A., J. Glaciol., 47, 497–506, 2001.
Pelto, M. S., Dryak, M., Pelto, J., Matthews, T., and Perry, L. B.: Contributions of Glacier Runoff during Heat Waves in the Nooksack River Basin USA, Water, 14, w14071145, https://doi.org/10.3390/w14071145, 2022.
Pfeffer, W. T., Arendt, A. A., Bliss, A., Bolch, T., Cogley, J. G., Gardner, A. S., Hagen, J.-O., Hock, R., Kaser, G., Kienholz, C., Miles, E. S., Moholdt, G., Mölg, N., Paul, F., Radić, V., Rastner, P., Raup, B. H., Rich, J., Sharp, M. J., and The Randolph Consortium: The Randolph Glacier Inventory: a globally complete inventory of glaciers, J. Glaciol., 60, 537–552, 2014.
Philip, S. Y., Kew, S. F., van Oldenborgh, G. J., Anslow, F. S., Seneviratne, S. I., Vautard, R., Coumou, D., Ebi, K. L., Arrighi, J., Singh, R., van Aalst, M., Pereira Marghidan, C., Wehner, M., Yang, W., Li, S., Schumacher, D. L., Hauser, M., Bonnet, R., Luu, L. N., Lehner, F., Gillett, N., Tradowsky, J. S., Vecchi, G. A., Rodell, C., Stull, R. B., Howard, R., and Otto, F. E. L.: Rapid attribution analysis of the extraordinary heat wave on the Pacific coast of the US and Canada in June 2021, Earth Syst. Dynam., 13, 1689–1713, https://doi.org/10.5194/esd-13-1689-2022, 2022.
Phillips, K.: Recent Changes in Hood's Glaciers, Mazama Bulletin, 17 45–50, 1935.
Phillips, K.: Our Vanishing Glaciers, Mazama Bulletin, 20, 24–41, 1938.
Pitman, K. J., Moore, J. W., Sloat, M. R., Beaudreau, A. H., Bidlack, A. L., Brenner, R. E., Hood, E. W., Pess, G. R., Mantua, N. J., Milner, A. M., Radić, V., Reeves, G. H., Schindler, D. E., and Whited, D. C.: Glacier Retreat and Pacific Salmon, BioScience, 70, 220–236, 2020.
Robel, A. A., Ultee, L., Ranganathan, M., and Nash, M.: For whom and by whom is glaciology?, J. Glaciol., in press, https://doi.org/10.1017/jog.2024.29, 2024.
Roe, G. H., Baker, M. B., and Herla, F.: Centennial glacier retreat as categorical evidence of regional climate change, Nat. Geosci., 10, 95–99, 2017.
Roe, G. H., Christian, J. E., and Marzeion, B.: On the attribution of industrial-era glacier mass loss to anthropogenic climate change, The Cryosphere, 15, 1889–1905, https://doi.org/10.5194/tc-15-1889-2021, 2021.
Rounce, D. R., Hock, R., Maussion, F., Hugonnet, R., Kochtitzky, W., Huss, M., Berthier, E., Brinkerhoff, D., Compagno, L., Copland, L., Farinotti, D., Menounos, B., and McNabb, R. W.: Global glacier change in the 21st century: Every increase in temperature matters, Science, 379, 78–83, 2023.
Thieman, C., Danielsen, A., Salminen, E., Berge, H., and Ross, K.: Watershed 2040, Hood River Basin Partnership Strategic Action Plan, Oregon Watershed Enhancement Board, 2021.
Thomspon, V., Kennedy-Asser, A. T., Vosper, E., Lo, Y. T. E., Huntingford, C., Andrews, O., Collins, M., Hegerl, G. C., and Mitchell, D.: The 2021 western North American heat wave among the most extreme events ever recorded globally, Sci. Adv., 8, eabm6860, https://doi.org/10.1126/sciadv.abm6860, 2022.
U.S. Bureau of Reclamation: Reclamation Managing Water in the West: Hood River Basin Study, https://www.usbr.gov/pn/studies/hoodriver/index.html (last access: 5 January 2024), 2015.
U.S. Geological Survey: Eruption History of Mount Hood, Oregon, https://www.usgs.gov/volcanoes/mount-hood/science/eruption-history-mount-hood-oregon (last access: 28 January 2024), 2023.
U.S. National Oceanic and Atmospheric Administration: Climate at a Glance, https://www.ncei.noaa.gov/access/monitoring/climate-at-a-glance/ (last access: 8 January 2024), 2024.
U.S. National Resources Conservation Service: Oregon, Water, About Us, https://www.nrcs.usda.gov/conservation-basics/conservation-by-state/oregon/oregon-snow-survey/about-us (last access: 7 April 2024), 2024.
World Glacier Monitoring Service: Reference glacier data, https://wgms.ch/products_ref_glaciers/ (last access: 4 April 2024), 2022.
Zemp, M., Frey, H., Gärtnew-Roer, I., Nussbaumer, S. U., Helzle, M., Paul, F., Haeberli, W., Denzinger, F., Ahlstrøm, A. P., Anderson, B., Bajracharya, S., Baroni, C., Braun, L. N., Cáceres, B. E., Casassa, G., Cobos, G., Dávila, L. R., Delgado Granados, H., Demuth, M. N., Espizua, L., Fischer, A., Fujita, K., Gadek, B., Ghazanfar, A., Hagen, J. O., Holmlund, P., Karimi, N., Li, Z., Pelto, M., Pitte, P., Popovnin, V. V., Portocarrero, C. A., Prinz, R., Sangewar, C. V., Severskiy, I., Sigurdsson, O., Soruco, A., Usubaliev, R., and Vincent, C.: Historically unprecedented global glacier decline in the early 21st century, J. Glaciol., 61, 745–762, 2015.