the Creative Commons Attribution 4.0 License.
the Creative Commons Attribution 4.0 License.
 | 10 Sep 2024
Which global reanalysis dataset has better representativeness in snow cover on the Tibetan Plateau?
Shirui Yan
Yang Chen
Yaliang Hou
Kexin Liu
Xuejing Li
Yuxuan Xing
Dongyou Wu
Jiecan Cui
The extensive snow cover across the Tibetan Plateau (TP) has a major influence on the climate and water supply for over 1 billion downstream inhabitants. However, an adequate evaluation of variability in the snow cover fraction (SCF) over the TP simulated by multiple reanalysis datasets has yet to be undertaken. In this study, we used the Snow Property Inversion from Remote Sensing (SPIReS) SCF dataset for the water years (WYs) 2001–2017 to evaluate the capabilities of eight reanalysis datasets (HMASR, MERRA2, ERA5, ERA5L, JRA55, CFSR, CRAL, and GLDAS) in simulating the spatial and temporal variability in SCF in the TP. CFSR, GLDAS, CRAL, and HMASR are good in simulating the spatial pattern of climatological SCF, with lower bias and higher correlation and Taylor skill score (SS). By contrast, ERA5L, JRA55, and ERA5 have a relatively good performance in terms of SCF annual trends among eight reanalysis datasets. The biases in SCF simulations across reanalysis datasets are influenced by a combination of meteorological forcings, including snowfall and temperature, as well as by the SCF parameterization methods. However, the primary influencing factors vary among the reanalysis datasets. Additionally, averaging multiple reanalysis datasets can enhance the spatiotemporal accuracy of SCF simulations, but this enhancement effect does not consistently increase with the number of reanalysis datasets used.
- Article
(11824 KB) - Full-text XML
-
Supplement
(5410 KB) - BibTeX
- EndNote


Widespread snow cover on the Tibetan Plateau (TP), with its high albedo and low thermal conductivity, plays a crucial role in the surface energy balance (Zhang, 2005) and affects the climate locally (Zhang et al., 2022), across Asia, and globally (Lyu et al., 2018; Ma et al., 2017). Furthermore, in its role as the “Asian water tower” (Kitoh and Arakawa, 2016; Qiu, 2008; Xu et al., 2008), the snow that accumulates on the TP during the cold season is an essential freshwater resource for over 1 billion people during the warm season, supplying their domestic, agricultural, and industrial water needs (Immerzeel et al., 2010). In the context of climate change, the snow cover over the TP is an extremely sensitive element to warming (Yao et al., 2019; You et al., 2020a). Therefore, the accurate and reliable representation of snow cover over the TP is crucial to regional climate and ecosystem studies.
Comprehensive ground-based measurements face challenges due to the complex terrain and harsh weather conditions on the TP (Yang et al., 2019), leading to issues of spatial representativeness. By contrast, optical satellite observations provide global-scale snow cover data and offer crucial support for snow research. For example, NASA's Moderate Resolution Imaging Spectroradiometer (MODIS) has been providing moderate-resolution global daily snow cover fraction (SCF) data since 2000 (Hall et al., 2002). The Snow Property Inversion from Remote Sensing (SPIReS) then uses a more advanced spectral unmixing technique that provides improvements to SCF estimates for the period of water years (WYs) 2000–2021 (Bair et al., 2021). However, the more precise satellite products and remote sensing data using more advanced methods have relatively short time spans from 2000 to the present, limiting their role in long-term climate analysis.
Reanalysis methods based on observations and mathematical models (Fujiwara et al., 2017) provide a critical avenue for obtaining long-term snow information. These techniques use data assimilation to integrate historical environmental observations with short-term weather forecasts, yielding optimal estimates of global or regional weather and climate states (Lei et al., 2023). In recent decades, the major meteorological agencies around the world have generated atmospheric and land reanalysis products at varying temporal and spatial resolutions (Fujiwara et al., 2017). Reanalysis datasets have become indispensable sources of data when it comes to studying processes related to snow variability as well as their impacts and responses to climate change (Lin and Wu, 2011; Pu et al., 2021; Thackeray et al., 2016; Wegmann et al., 2017). For example, the reanalysis snow dataset (e.g., ERA40 and NCEP-NCAR) has revealed that anomalous snow cover in prior autumn facilitates a warm-north, cold-south winter over North America by influencing the teleconnection response in the Pacific–North American (PNA) region (Lin and Wu, 2011). Reanalysis datasets (e.g., MERRA, ERA-Interim, and GLDAS-2) have been integrated into the Canadian Sea Ice and Snow Evolution (CanSISE) dataset to analyze the impacts of global warming on snow changes on the TP (You et al., 2020b).
A comprehensive evaluation of multiple snow reanalysis datasets based on referenced observation data is of paramount importance before launching related scientific research. Previous studies have focused more on the accuracy of snow depth (SD) and snow water equivalent (SWE) in reanalysis datasets across different regions (Bian et al., 2019; Li et al., 2022; Wang and Zeng, 2012; Zhang et al., 2021). However, only Orsolini et al. (2019) and Li et al. (2022) have assessed the SCF performance of reanalysis datasets over the High Mountain Asia region based on SCF data from the Interactive Multisensor Snow and Ice Mapping System (IMS; Helfrich et al., 2007) and ground observations. Their studies considered the SCF accuracy of a limited number of reanalysis datasets and lacked a multidimensional evaluation that considers aspects such as regional variations and annual trends as well as an in-depth analysis of the impact of parameterization on SCF bias. In addition, the IMS dataset, which uses microwave remote sensing technology, is challenging for detecting shallow or wet snow that may lead to increased uncertainty in SCF detection (Yu et al., 2013). Therefore, prior evaluations of reanalysis SCF datasets are still insufficient.
The various reanalysis snow datasets have unique spatiotemporal characteristics (Mudryk et al., 2015). The differences in snow characteristics originate not only from the use of different land surface models (LSMs), but also from the meteorological forcing data and parameterization methods. De Rosnay et al. (2014) indicated that the accuracy of snow simulations is constrained largely by uncertainties associated with some of the key meteorological inputs, including precipitation and temperature (Cao et al., 2020; Zhang et al., 2015), under regional climate conditions and elevation factors (Brown and Mote, 2009; Hernández-Henríquez et al., 2015). Therefore, uncertainties associated with precipitation and temperature data are likely to be the primary sources of bias in the reanalysis SCF datasets. Moreover, Jiang et al. (2020) emphasized that optimizing the parameterization methods used to convert SD or SWE to SCF would reduce the uncertainties associated with snow modeling, which would further reduce biases in land surface albedo simulations, particularly in high-altitude regions. The reanalysis datasets use different SCF parameterization methods, with a 100 % SCF corresponding to an SD that ranges from 2 to 26 cm (Orsolini et al., 2019). The selection of different SCF parameterizations for the reanalysis datasets may lead to varying degrees of bias in SCF.
For this study, we conducted an in-depth evaluation of SCF simulations derived from eight atmospheric and land assimilation reanalysis datasets over the period of WYs 2001–2017, using the SPIReS SCF dataset as a reference. The accuracy of SCF was assessed multidimensionally by examining the spatial characteristics, seasonal variations, and annual trends across the whole TP and its nine basins. Additionally, we aimed to assess the influence of meteorological forcing (snowfall and temperature) and SCF parameterization on the SCF biases associated with the various reanalysis datasets. On this basis, we attempted to develop an optimal combination of reanalysis SCF datasets.
2.1 Data
2.1.1 Remote sensing data
For this study, we utilized the SPIReS SCF dataset (Bair et al., 2021) as the reference SCF. It is derived from Landsat 8 Operational Land Imager (OLI) and MODIS data using a spectral unmixing methodology at a 4 km resolution for the period spanning WY 2000 to WY 2021 (e.g., WY 2000 refers to 1 October 1999 to 30 September 2000). The SCF calculation in SPIReS relies on two endmembers (i.e., snow and snow-free) along with an ideal shade component, effectively simplifying the calculation process while maintaining high accuracy. SPIReS reduces the effects of cloud noise through interpolation and smoothing to provide more accurate SCF data (Bair et al., 2021; Dozier et al., 2008). In a comprehensive evaluation conducted by Stillinger et al. (2023) utilizing airborne lidar datasets for subcanopy snow mapping performance over mountain areas in the western United States, spectral unmixing-derived data (including SPIReS and MODIS Snow-Covered Area and Grain Size, abbreviated as “MODSCAG”) exhibited lower bias and root mean square error (RMSE) compared with data derived from band ratio methods and spectral mixture methods. Moreover, unlike MODSCAG, SPIReS incorporates the influence of light-absorbing particles on snow, leading to more accurate SCF data.
2.1.2 Reanalysis datasets
We examined eight widely used reanalysis datasets obtained from various meteorological organizations, with details listed in Table 1. Meteorological forcing fields are used to drive the LSMs, and parameterization methods are used to calculate the daily SCF data. The assimilation of snow data varied among the datasets.
The High Mountain Asia Snow Reanalysis (HMASR; Liu et al., 2021a) is a snowpack-specific reanalysis dataset produced by the NASA High Mountain Asia Team (HiMAT). HMASR uses the simplified Simple Biosphere model, version 3 (SSiB3; Sun and Xue, 2001; Xue et al., 2003), as the LSM to generate the initial snowpack mass for WYs 2000–2017 based on meteorological inputs from MERRA2 and physiographic characteristics. The model-derived SCF predictions are then constrained by integrating spectral unmixing algorithm-derived SCF data from the MODIS and Landsat satellites products (Painter et al., 2009) via data assimilation. The parameterization method used in HMASR (abbreviated as “SSiB3_SCF” in Table 1) has not been publicly disclosed.
The Modern-Era Retrospective analysis for Research and Applications, version 2 (MERRA2; Gelaro et al., 2017), developed by NASA's Global Modeling and Assimilation Office (GMAO), provides land surface state estimates including SCF via the Catchment LSM (CLSM; Koster et al., 2000). The surface-forced precipitation is a combination of the National Oceanic and Atmospheric Administration (NOAA) Climate Prediction Center (CPC) unified gauge-based analysis of global daily precipitation (CPCU; Xie et al., 2007) product and the precipitation generated by the atmospheric general circulation model within the MERRA2 system. The generated precipitation is also adjusted using a precipitation correction algorithm (Reichle et al., 2017). MERRA2 does not include snow data assimilation. The parameterization scheme in MERRA2 considers 100 % SCF to occur when the SWE reaches a threshold of 26 kg m−2 (abbreviated as “MM_SCF” in Table 1; Orsolini et al., 2019; Reichle et al., 2017).
The ECMWF Reanalysis version 5 (ERA5; Hersbach et al., 2020), produced and published by the European Centre for Medium-Range Weather Forecasts (ECMWF), uses the Tiled ECMWF Scheme for Surface Exchanges over Land (HTESSEL) model to simulate various land surface variables. The precipitation forcing in ERA5 is adjusted using Global Precipitation Climatology Project (GPCP; Adler et al., 2003) data. ERA5 assimilates in situ SD observations and binary SCF data from IMS only below 1500 m so that snow assimilation does not apply to the TP region (Bian et al., 2019). Additionally, a refined dataset known as “ERA5-Land” (abbreviated as “ERAL”; Muñoz-Sabater et al., 2021) has been derived from ERA5 via the offline rerunning of the land portion of the model at a higher spatial resolution. ERA5L provides solely land surface parameters and is based on the same forcing and LSM as ERA5. Both datasets have a 10 cm SD threshold to identify full SCF (abbreviated as “ME_SCF” in Table 1; ECMWF, 2018; Orsolini et al., 2019). ERA5 does not directly output the SCF variable. The SCF values for ERA5 used in this study were calculated using the ME_SCF method.
The Japanese 55-year Reanalysis (JRA55; Kobayashi et al., 2015), developed by the Japan Meteorological Agency (JMA), generates the land surface analysis field using an offline version of the Simple Biosphere (SIB) model (Sato et al., 1989; Sellers et al., 1986). The precipitation forcing is corrected using precipitable water retrieved from the Special Sensor Microwave/Imager (SSM/I) brightness temperature (Onogi et al., 2007). JRA55 incorporates daily SD data from the SSM/I and the Special Sensor Microwave Imager Sounder (SSMIS) using a univariate two-dimensional optimal interpolation (OI) approach. In addition, it assimilates surface synoptic observation (SYNOP) reports and digitizes China's daily SD data from 1971 to 2006 (Onogi et al., 2007). The detection of full SCF in JRA55 is based on a 2 cm SD threshold (abbreviated as “MJ_SCF” in Table 1; Orsolini et al., 2019). Similar to ERA5, the SCF in JRA55 was also calculated rather than provided directly by the product.
The Climate Forecast System Reanalysis (CFSR; Saha et al., 2010a), developed by the National Center for Environmental Prediction (NCEP) under NOAA, is a weakly coupled global reanalysis system. The land surface analysis utilizes the Noah model (Meng et al., 2012). Two observed global precipitation analyses, namely, the CPC Merged Analysis of Precipitation (CMAP; Xie and Arkin, 1997) and the CPCU, are used as alternative forcings for precipitation. In terms of snow analysis, CFSR assimilates IMS and the Global Snow Depth Model (SNODEP). On 1 January 2011, CFSR transitioned to a newer version of the NCEP data assimilation system called “CFSv2” (Saha et al., 2014). Despite differences in horizontal resolution and minor changes to the physical parameterization, CFSv2 is considered a continuation of CFSR in most cases (Fujiwara et al., 2017). The SCF parameterization method in CFSR is related to the surface characteristics, using varying SD thresholds to identify the full SCF depending on the underlying surface type (abbreviated as “Noah_SCF” in Table 1; Ek et al., 2003).
The Global Land Data Assimilation System version 2.1 (GLDAS-2.1; Rodell et al., 2004) is a global land data assimilation product developed jointly by NASA and NOAA. It uses the global meteorological forcing dataset from Princeton University (Sheffield et al., 2006) and the GPCP V1.3 Daily Analysis precipitation fields (Adler et al., 2003; Huffman et al., 2001) to drive three distinct LSMs: the CLSM model, the Noah model, and the Variable Infiltration Capacity (VIC) model. As a result, four datasets are generated (Table S1 in the Supplement). Notably, the full-series datasets within GLDAS-2.1 do not assimilate snow observations. Furthermore, owing to the unavailability of SCF variables in these datasets, this study derived different SCF values using three parameterization methods (MM_SCF, ME_SCF, and MJ_SCF). Finally, the 0.25° × 0.25° GLDAS–Noah product using the MM_SCF approach was selected as a representative of GLDAS due to its better SCF simulation (Fig. S1 in the Supplement).
China's first-generation global atmospheric and land reanalysis (CRA-40; Liu et al., 2023) is produced by the China Meteorological Administration (CMA). The matched land surface reanalysis datasets (CRA-40/Land, abbreviated as “CRAL”) are simultaneously generated offline based on an updated version of the Noah model and atmospheric driving factors from CRA-40. In CRAL, precipitation meteorological forcing is derived from a similar combination of data sources to CFSR (Liang et al., 2020). CRAL does not assimilate other observational data in the LSM. Instead, data from over 2400 CMA surface weather observatories indirectly influence the land surface product through conventional meteorological forcing derived from atmospheric reanalysis (Liang et al., 2020). The SCF parameterization method in CRAL is the same as that in CFSR.
Table 1Characteristics of the reanalysis datasets used in this study.
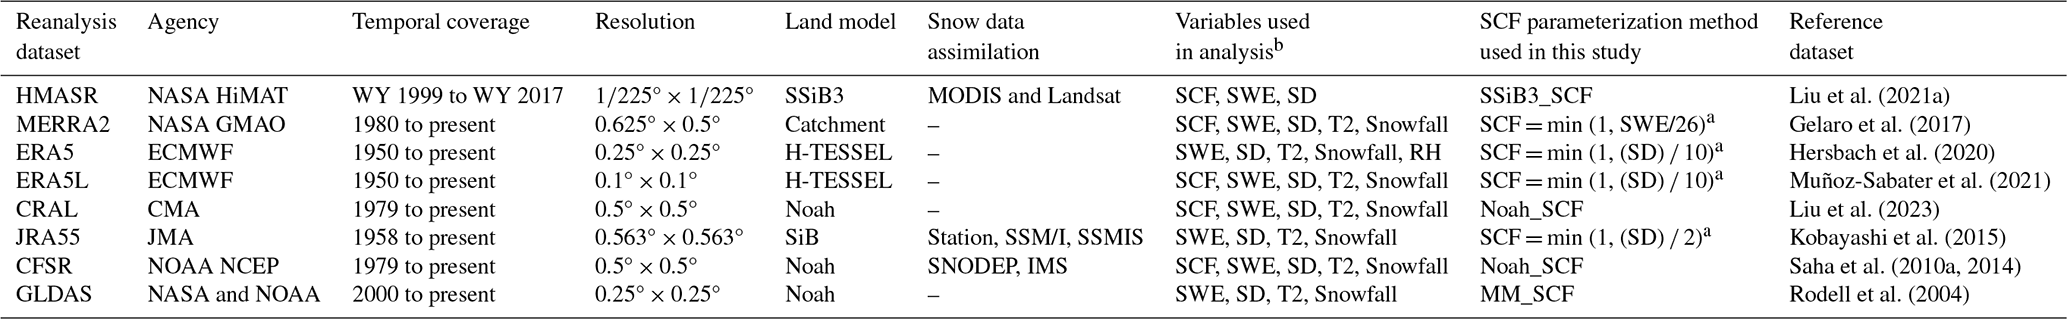
a The unit for SWE is kg m−2 and for SD it is cm. b ERA5, JRA55, and GLDAS do not provide output for the SCF variable directly. In this study, the SCF values for ERA5 and JRA55 were derived using their respective parameterization methods, as shown in this table. The SCF values for GLDAS were derived using MERRA2 parameterization methods. T2 is 2 m air temperature.
2.1.3 Meteorological dataset
To investigate the effects of snowfall and temperature biases on SCF bias, we used precipitation and 2 m air temperature data from the high-resolution near-surface Meteorological Forcing Dataset for the Third Pole region (TPMFD; Yang et al., 2023) as the reference data. Precipitation and 2 m air temperature in TPMFD were derived by combining a short-term high-resolution Weather Research and Forecasting (WRF) simulation (Zhou et al., 2021), long-term ERA5 data, and in situ observations, all at a resolution of ° for the period 1979–2020. Validation conducted by Jiang et al. (2023) demonstrated that the precipitation data from TPMFD are unbiased overall and considerably better than other widely used datasets. To obtain snowfall data for this study, we applied a dynamic threshold parameterization scheme, which considers surface air conditions such as wet bulb temperature, altitude, and relative humidity, to convert TPMFD total precipitation to snowfall. This approach has been proven effective in capturing snowfall variations on the TP through comparisons with station observations (Ding et al., 2014) and has been used in many studies (Deng et al., 2017; Luo et al., 2020; Yang et al., 2021; Zhu et al., 2017). For detailed calculation methods and further information, readers are referred to the work of Ding et al. (2014). We note that TPMFD lacks the relative humidity variable necessary for snowfall conversion, while all variables in TPMFD are assimilated from ERA5 data. Therefore, we utilized ERA5 surface relative humidity as a substitute.
2.2 Study region
The boundary of the TP used in this study is identified as an isoline of 2500 m according to the Global Multi-resolution Terrain Elevation Data 2010 (Danielson and Gesch, 2011), spanning 26–41° N and 67–105° E (Fig. 1b). The prevailing westerlies and monsoons are the primary moisture sources in this region, exerting significant influence on the spatial and temporal distribution of snowfall and glacier mass balance (Liu et al., 2021a; Yao et al., 2012). Specifically, the westerlies dominate winter precipitation, while the Indian and East Asian monsoons dominate summer precipitation in the southeast (Yao et al., 2012), resulting in diverse snow regimes. We identified nine major river basins within the TP using Hydrological Data and Maps Based on Shuttle Elevation Derivatives at Multiple Scales (HydroSHEDS; Lehner et al., 2008), namely, the Amu, Indus, Tarim, Inner Tibetan Plateau (ITP), Brahmaputra, Salween, Mekong, Yangtze, and Yellow basins. Due to the differing impacts of winter and summer atmospheric forcing, the performance of SCF simulations from reanalysis datasets varies across these basins.
2.3 Methods
2.3.1 Evaluation of SCF accuracy for reanalysis datasets
In this study, we used time series spanning WYs 2001–2017, covering periods for which all data were available. Before evaluation, all data were regridded to a 0.5° × 0.5° grid via bilinear interpolation for MERRA2, JRA55, and CRAL and the grid averaging approach for HMASR, ERA5, ERA5L, GLDAS, SPIReS, and TPMFD.
For each 0.5° × 0.5° grid cell within the TP, we calculated the climatological SCF over the full period and seasonally for SPIReS and eight reanalysis datasets (e.g., Figs. 1a and S3). Absolute bias and correlation (Pearson's correlation coefficient) were calculated from these values at both the basin and the TP scales. Spatial distribution and basin-averaged values of the climatological SCF, as well as bias maps of the reanalysis datasets compared with SPIReS, are presented. Additionally, Taylor diagrams are used to provide additional information regarding the RMSE and standard deviation ratio (STDR). The climatological SCF values for each grid cell within each basin and region were used as input to calculate the Taylor diagram component metrics (correlation, RMSE, and STDR). The component metrics were summarized by the Taylor skill score (SS) as follows:
where R0 is the maximum correlation attainable.
The Mann–Kendall (MK; Kendall, 1975; Mann, 1945) test was used to assess the significance of annual trends. Since the sign (+ or −) may impact the robustness of the trend analysis results, we employed the consistency index (CI; Zhang et al., 2021) to compare the agreement in SCF annual trend signs between the reanalysis datasets and SPIReS. The CI is defined as follows:
where Ninc is the number of grid points with a significant increasing trend in both the reanalysis dataset and SPIReS (P<0.05), Ndec is the number of grid points with a significant decreasing trend in both datasets, Nno is the number of grid points with a non-significant trend in both datasets, and Ntot is the total number of grid points. The higher the CI value, the better the performance of the trend simulation.
2.3.2 Analysis of SCF bias sources for meteorological forcings
Variations in snowfall and temperature are the dominant influences on snow evolution and can explain half to two-thirds of the interannual variability in snow cover (Xu et al., 2017). Hence, biases in snowfall and temperature within reanalysis datasets are likely the main sources of bias in SCF. Here, the analysis of bias sources was primarily based on correlation analysis between the bias of SCF and the biases of snowfall and temperature. The absolute biases of snowfall and temperature were computed by comparing the reanalysis datasets with TPMFD. Additionally, we calculated the correlation between the annual time series of snowfall and temperature biases at each TP grid cell and SCF bias to obtain the spatial distribution of correlations, as shown in Fig. 6.
2.3.3 Analysis of SCF bias sources for parameterization method
Evaluations have shown that in the TP, with relatively thin and short-lived snow (Huang et al., 2023), optimizing the SCF parameterization can significantly reduce the annual SCF bias in snow models (Jiang et al., 2020). Orsolini et al. (2019) noted that SCF parameterization differs significantly among reanalyses, affecting SCF bias. For the eight reanalysis datasets considered here, five parameterizations were used to convert SWE or SD into SCF, i.e., MM_SCF, ME_SCF, MJ_SCF, SSiB3_SCF, and Noah_SCF (see Sect. 2.1.2 and Table 1). In order to evaluate the impact of the parameterization on SCF simulations, we incorporated three publicly available and easily offline-usable parameterization methods (MM_SCF, ME_SCF, and MJ_SCF) separately into each reanalysis dataset. For HMASR, CRAL, and CFSR, which do not include their parameterization among these three methods, we derived three additional SCF datasets. For MERRA2, ERA5, ERA5L, JRA55, and GLDAS we derived another two SCF datasets.
2.3.4 Generation of combined optimal datasets
Mortimer et al. (2020) demonstrated that product accuracy can be enhanced by averaging multiple reanalysis datasets, as this allows unrelated errors and deficiencies between them to offset each other. To investigate whether averaging of multiple datasets can improve SCF accuracy over the complex terrain of the TP, we considered all possible combinations of the eight reanalysis datasets, totaling 247. The output of each combined dataset was computed as the equally weighted average of all reanalysis datasets in the combination (Mudryk et al., 2015). Subsequently, we characterized the SCF accuracy of combined datasets in spatial distribution and annual trends by computing the SS and CI values.
3.1 Evaluation of spatial and temporal accuracy in SCF
3.1.1 Spatial variability of SCF climatology and seasonality
The TP-averaged SCF for HMASR, GLDAS, and CRAL is 0.14, 0.12, and 0.12, respectively, which aligns closely with the SPIReS value of 0.13 (Fig. 1b). HMASR (GLDAS and CRAL) slightly underestimates (overestimates) in westerlies-dominated basins such as the Amu and Indus and overestimates (underestimates) in monsoon-dominated basins such as the Yellow, Yangtze, Mekong, Salween, and Brahmaputra (Fig. 2a). These regional biases average out when considering the entire TP, which is reflected in the strong permanence of these datasets over the TP. Conversely, ERA5, ERA5L, and JRA55 have large positive SCF biases across all basins, whereas MERRA2 has a negative bias in all basins. Over the TP as a whole, ERA5 (MERRA2) has the largest positive (negative) bias.
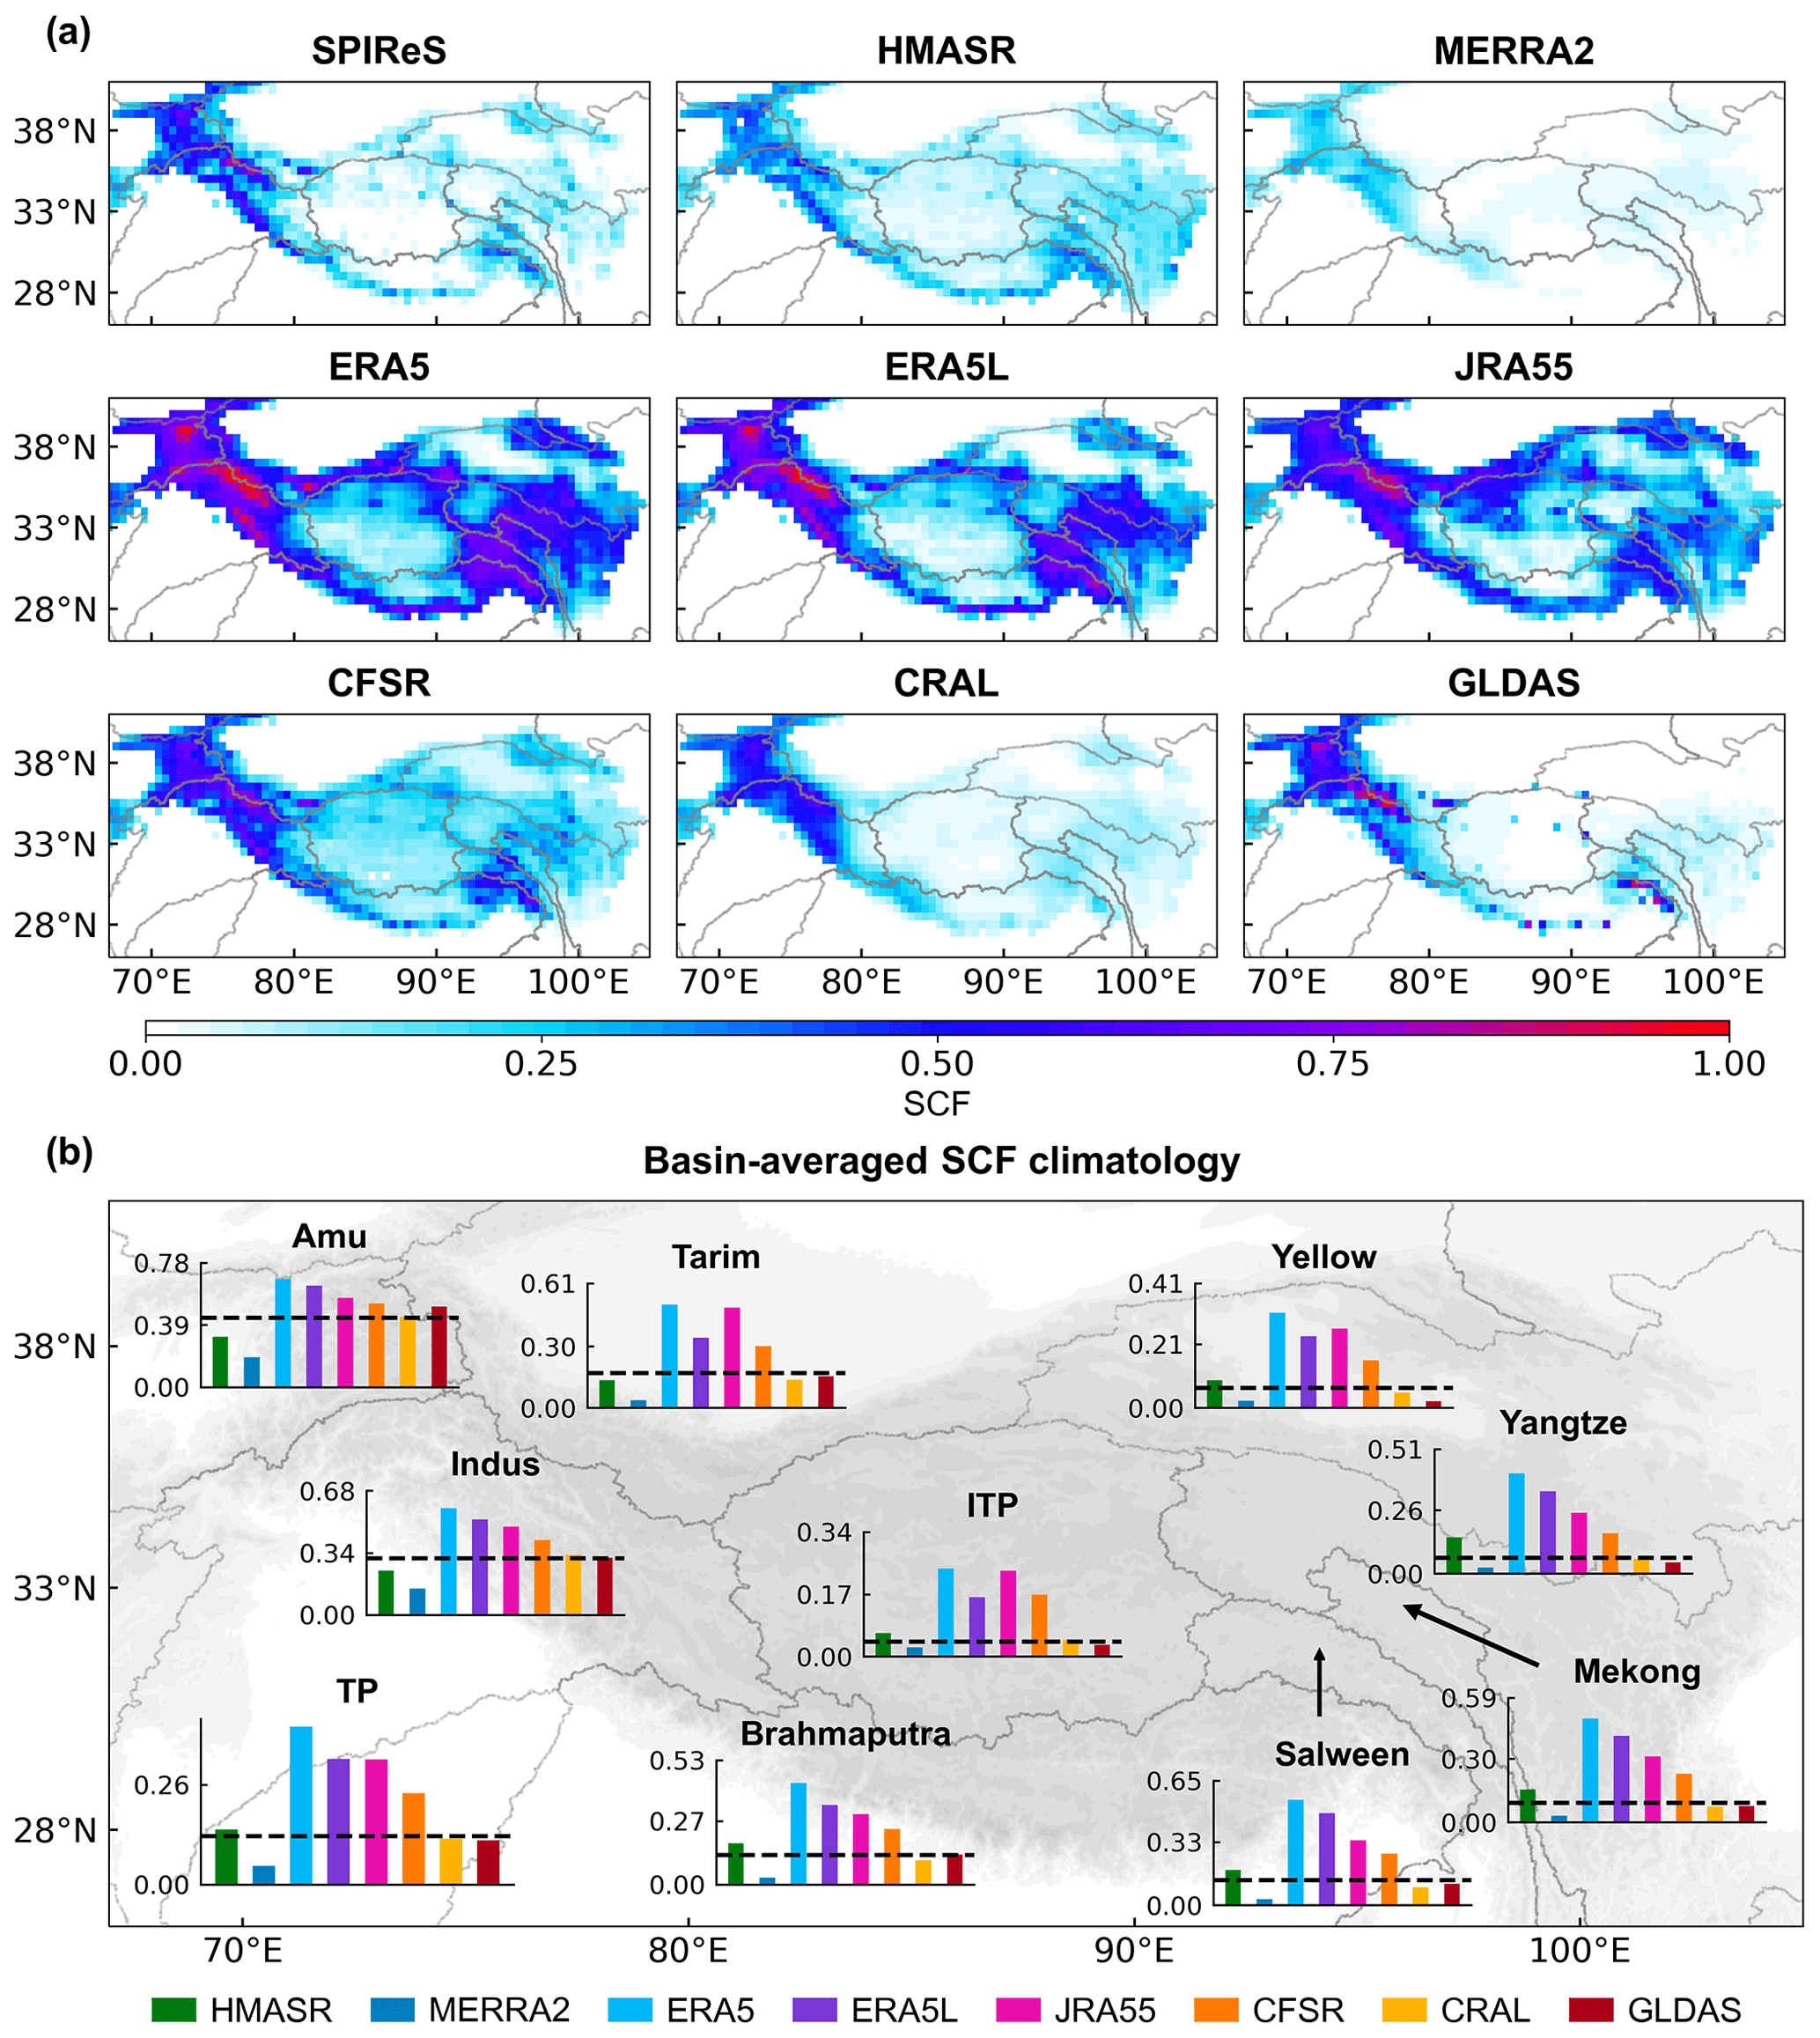
Figure 1(a) Spatial distribution of snow cover fraction (SCF) climatological average for water years (WYs) 2001–2017 from SPIReS and eight reanalysis datasets over the Tibetan Plateau region. (b) Basin-averaged SCF climatology from SPIReS (horizontal black line) and the eight reanalysis datasets overlain on a map of the TP. ITP: Inner Tibetan Plateau.
All datasets have similar spatial patterns of SCF, with higher values in the western TP and lower values in the interior (Fig. 1a). However, compared with SPIReS, the magnitude and sign of their biases vary spatially (Fig. 2a). This variation is demonstrated by their differing correlation, STDR, and RMSE values (Fig. 2b; see Fig. S2 for a clearer version) and hence their SS values (Fig. 2c) between the reanalysis datasets and SPIReS. CFSR has the highest SS value of 0.83, reflecting its strong correlation in westerlies-dominated basins and variability close to that of SPIReS in monsoon-dominated basins (STDR close to 1, e.g., 0.98 for the Indus Basin). The SS values for GLDAS, CRAL, and HMASR are all above 0.7, benefiting from their high correlations similar to CFSR. Consequently, these four datasets have superior SCF spatial performance across the TP. By contrast, although ERA5, ERA5L, and JRA55 can adequately capture the STDR in monsoon-dominated basins, their large positive biases lead to high RMSE, resulting in moderate SS values across the TP. MERRA2 has the worst spatial performance, with the lowest SS value in all basins and across the TP. This contradicts Orsolini et al. (2019), who found MERRA2 to perform well in capturing the SCF and SD characteristics. This discrepancy arises because their results depended mainly on the high correlation between MERRA2 and the reference dataset, ignoring severe underestimations in SCF values. These underestimations result in very small self-standard deviations in the STDR calculation, leading to the lowest SS value.
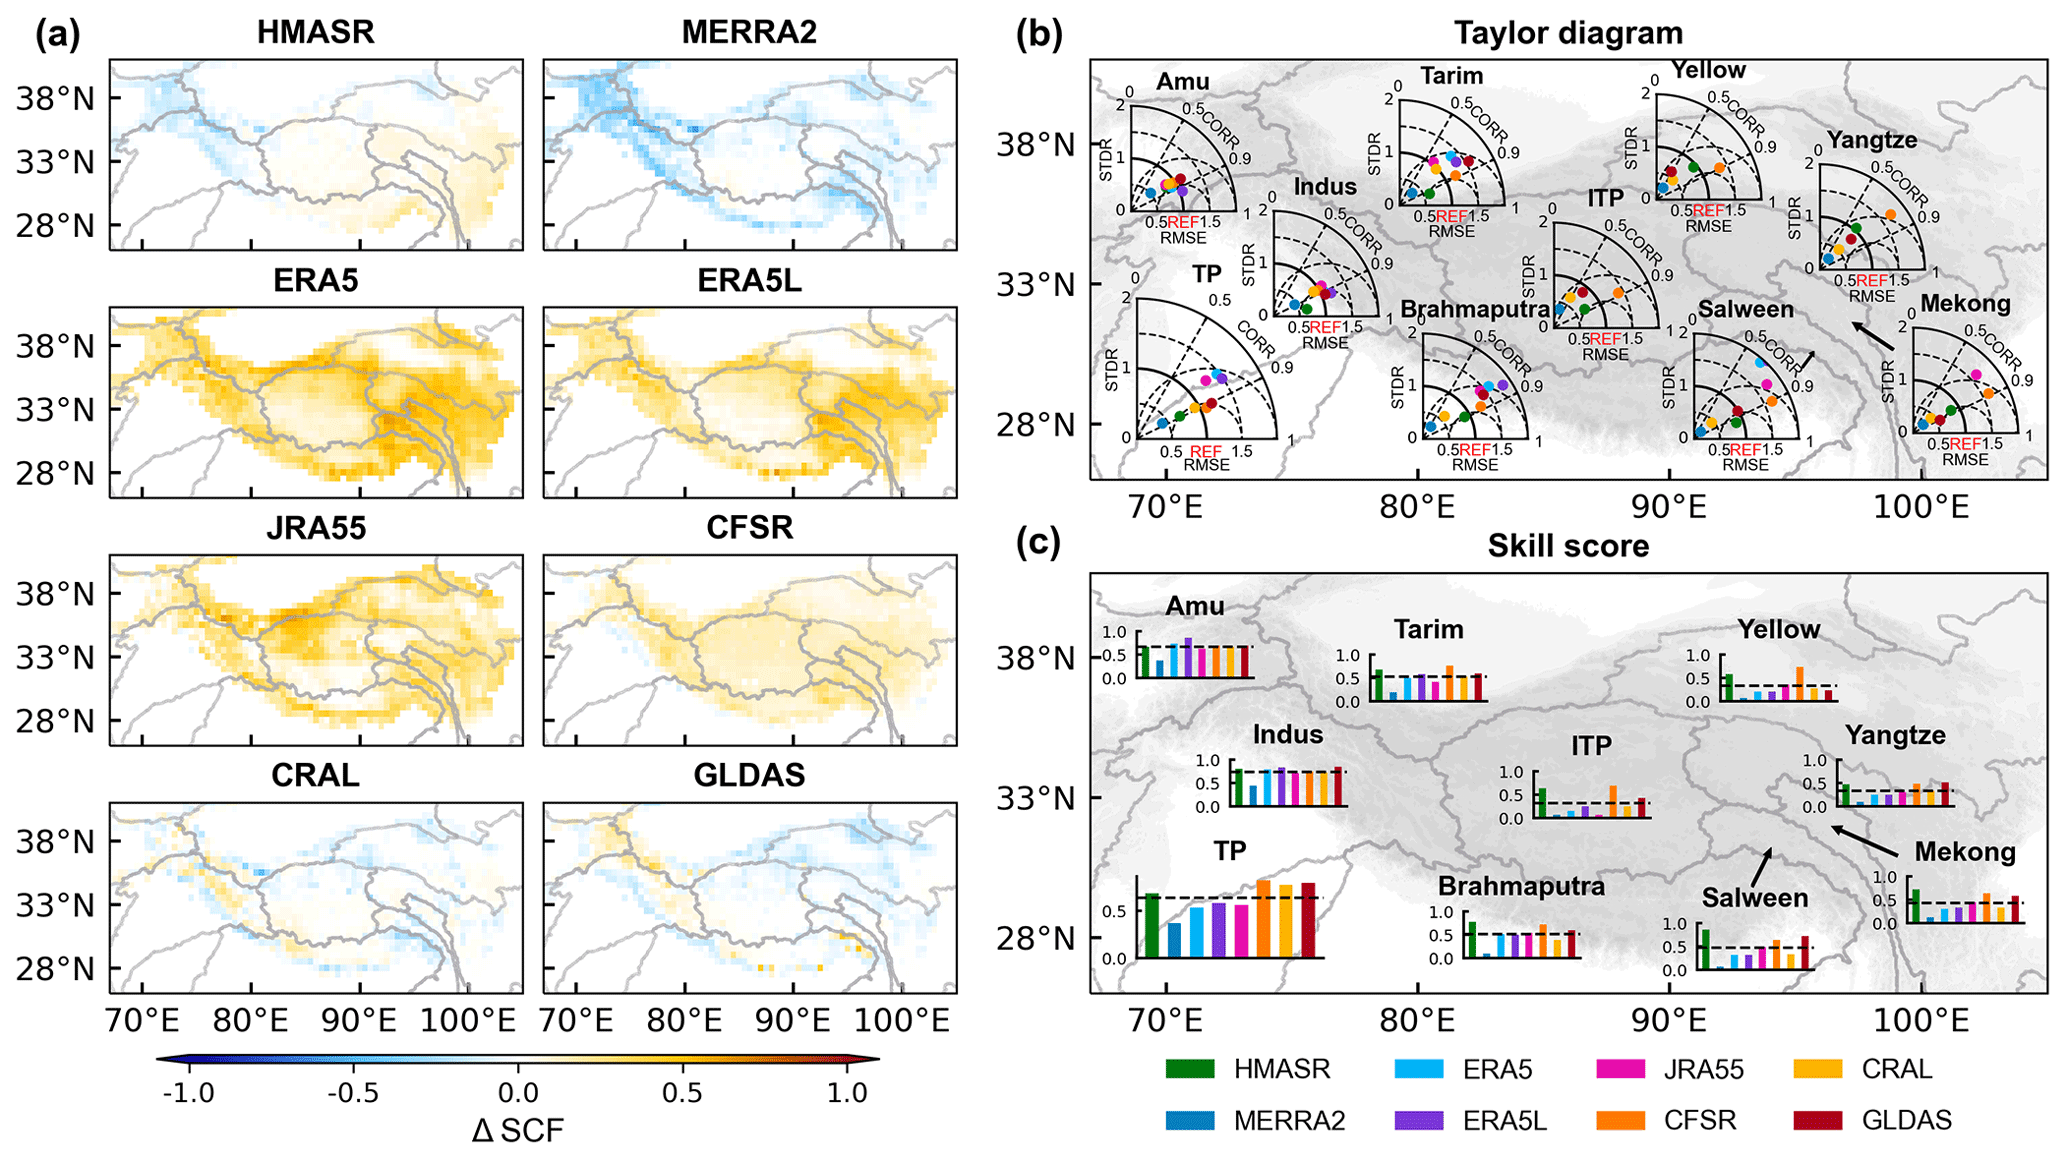
Figure 2(a) Spatial distribution of the SCF climatological bias from the reanalysis datasets based on SPIReS over the TP. (b) Taylor diagrams showing the correlation coefficients (R), root mean square error (RMSE), and standard deviation ratio (STDR) of SCF between the reanalysis datasets and SPIReS for each basin, overlain on a map of the TP. (c) Taylor skill scores (SS) for each basin overlain on a map of the TP. The black line is the average of the SS values for all reanalysis datasets in the basins.
Basins affected primarily by the winter westerlies (e.g., the Amu and Indus basins) have better spatial performance, with the SS values for all reanalysis datasets within these basins exceeding 0.66 (Fig. 2c). In basins influenced by the summer monsoon (e.g., the Yellow, Yangtze, Mekong, Salween, and Brahmaputra basins), SCF spatial consistency with SPIReS varies. The basin-averaged SCF climatology is highly biased in the Yellow and Yangtze basins for the reanalysis datasets (Fig. 1b). Specifically, the basin-averaged SCF values of ERA5, ERA5L, and JRA55 (MERRA2) are more than 2× larger (lower) than SPIReS. These biases result in varied RMSE and STDR values among these reanalysis datasets (Fig. 2b) and lower SS values (Fig. 2c). However, this phenomenon is less pronounced in the Salween and Brahmaputra basins. The Tarim and ITP basins are considered inland basins. In particular, the ITP basin shows the poorest SCF spatial performance among basins, with the reanalysis average SS value of only 0.33.
Figure 3 shows the SCF bias, its probability density distribution, and the SS values for four seasons. In general, the different seasons have similar spatial patterns of SCF bias for each reanalysis dataset (Fig. 3, first to fourth columns on the left). However, there are seasonal variations in the bias magnitudes, with larger biases during the accumulation period (winter and spring) and smaller biases during the ablation period (summer and autumn). The largest bias in winter can be several times larger than the lowest bias in summer. This is because higher seasonal averages of SCF (Fig. S3) may induce larger seasonal bias. Additionally, correlation and STDR (Table S2), and hence SS (Fig. 3, fifth column on the left), are better during the accumulation period, indicating that winter and spring have better spatial performance for SCF. MERRA2 and CRAL have the largest seasonal variability in SCF performance (Fig. 3, sixth column on the left).
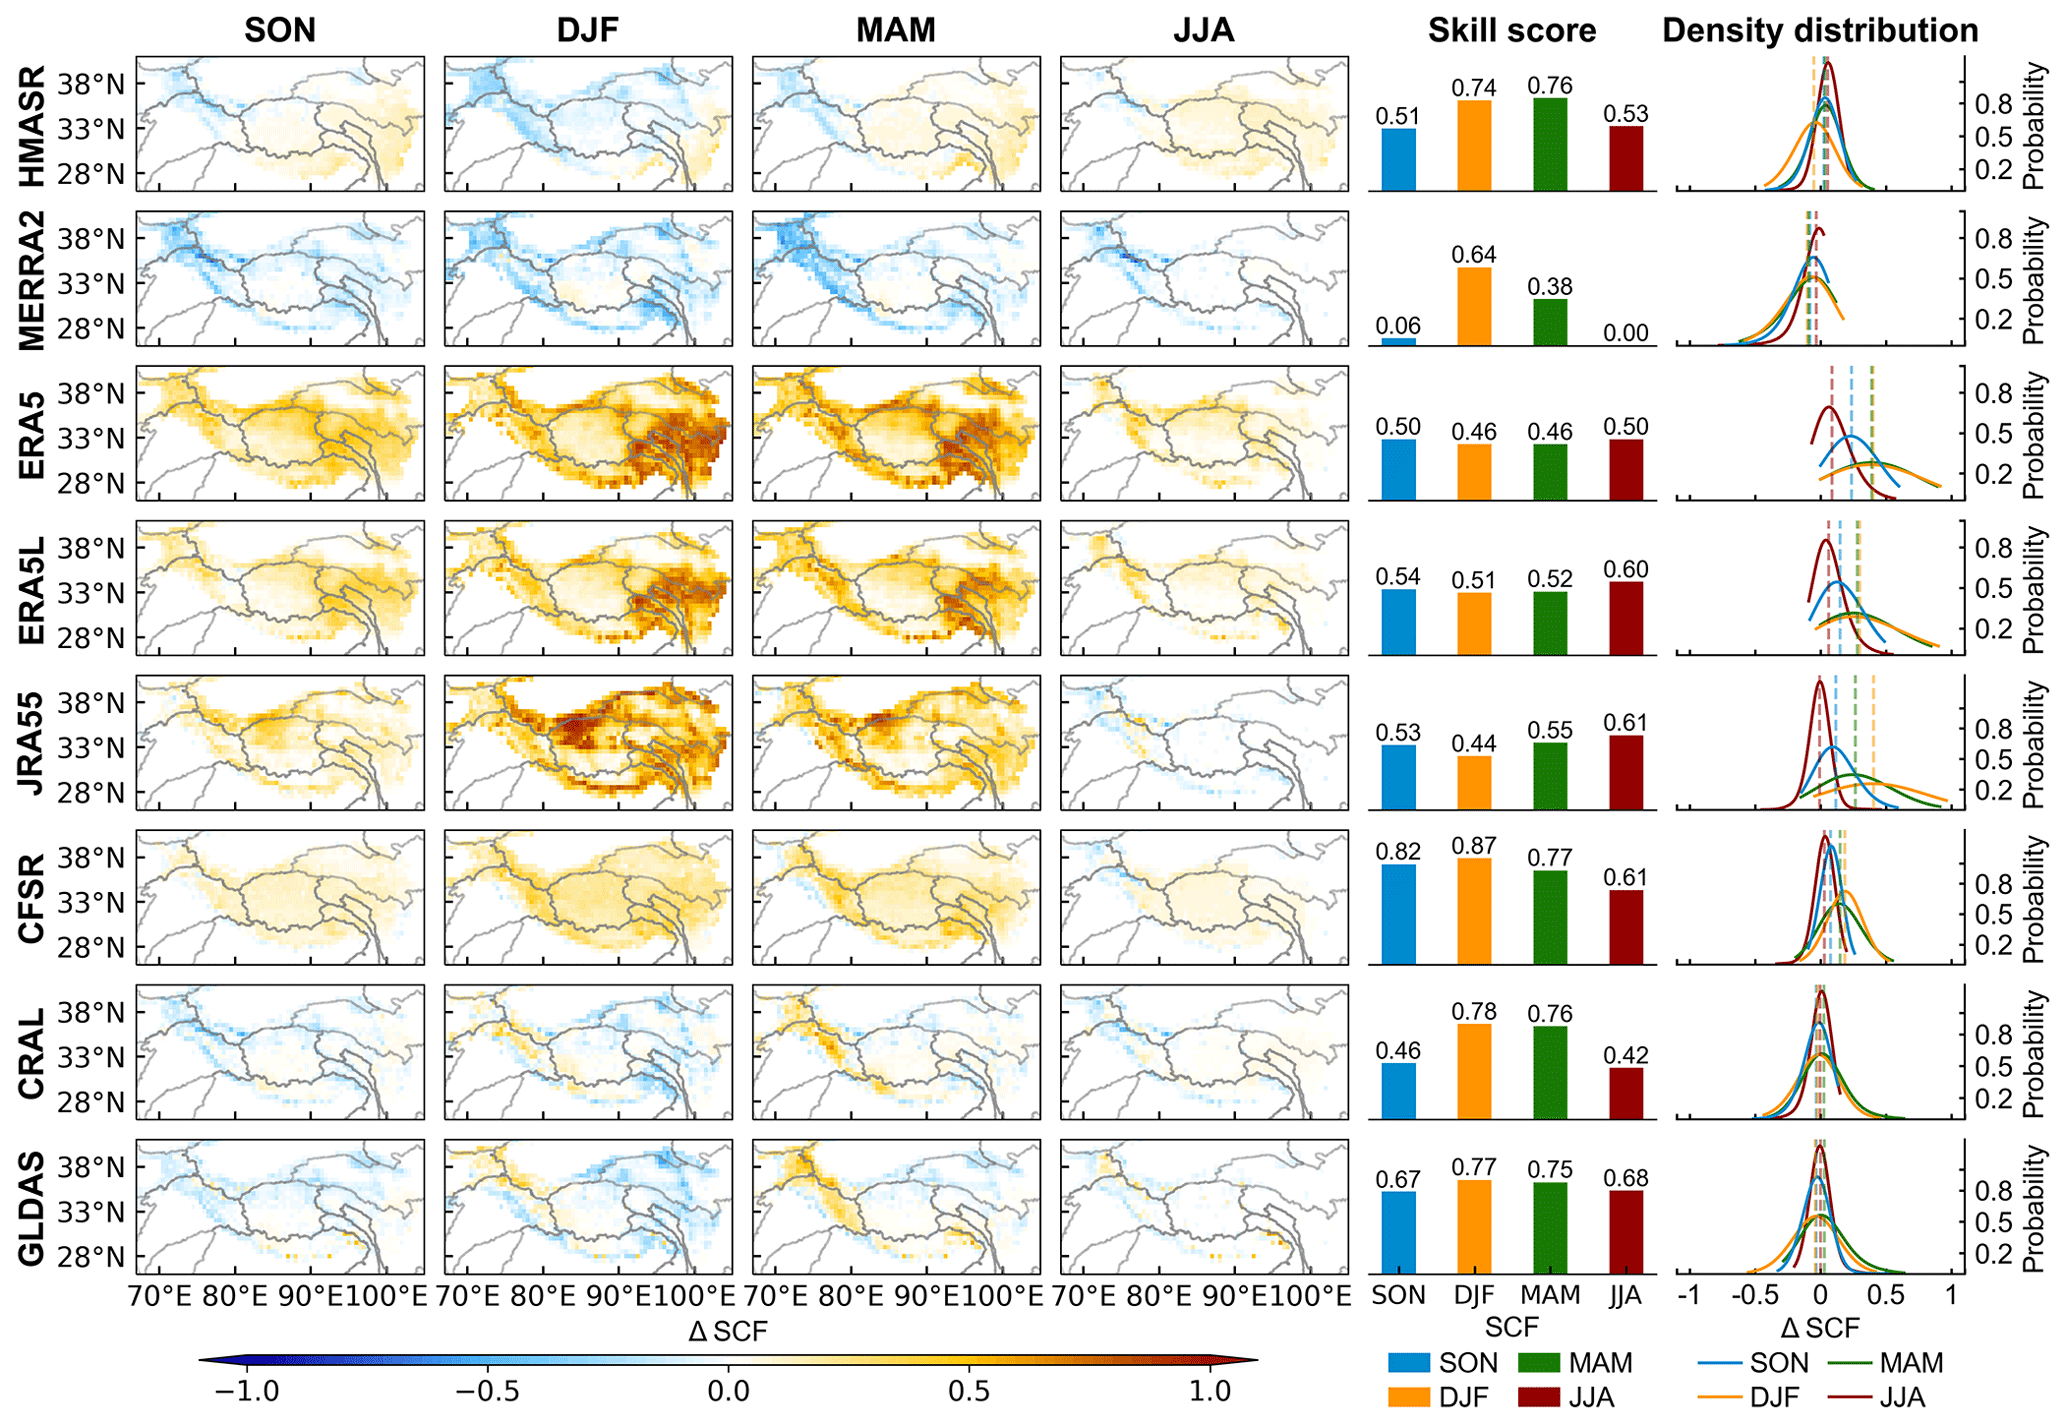
Figure 3The first four columns show the spatial distribution of seasonal SCF climatological bias from the reanalysis datasets based on SPIReS over the TP during (left to right) autumn (September–November: SON), winter (December–February: DJF), spring (March–May: MAM), and summer (June–August: JJA). The SS values of seasonal SCF climatology are shown in the fifth column. The probability density distribution of seasonal SCF climatological bias is shown in the sixth column. The dashed lines in the sixth column represent the TP-average SCF bias for each season.
3.1.2 Annual variability and trends in SCF
The 17 WY time series of reanalysis datasets have spatially consistent overestimates for ERA5L, ERA5, and JRA55 and an underestimate for MERRA2 (Fig. 4a). Notably, the fluctuations in CFSR around 2010 align with variations in its temperature and snowfall (Fig. S4), most likely due to inherent discontinuities in the dataset that cause changes in boundary conditions and subsequently in model output variables (Fujiwara et al., 2017). Additionally, the annual variation of TP-averaged SCF has no significant annual trend in SPIReS (Fig. 4b). ERA5L, JRA55, and GLDAS have annual trends consistent with SPIReS, showing a slight decline and significant correlation, with correlation coefficients above 0.7 (Fig. 4c). Although HMASR and ERA5 have a slight increasing trend, they remain significantly correlated with SPIReS. Conversely, the correlation of MERRA2, CFSR, and GLDAS with SPIReS did not pass the statistical significance test.
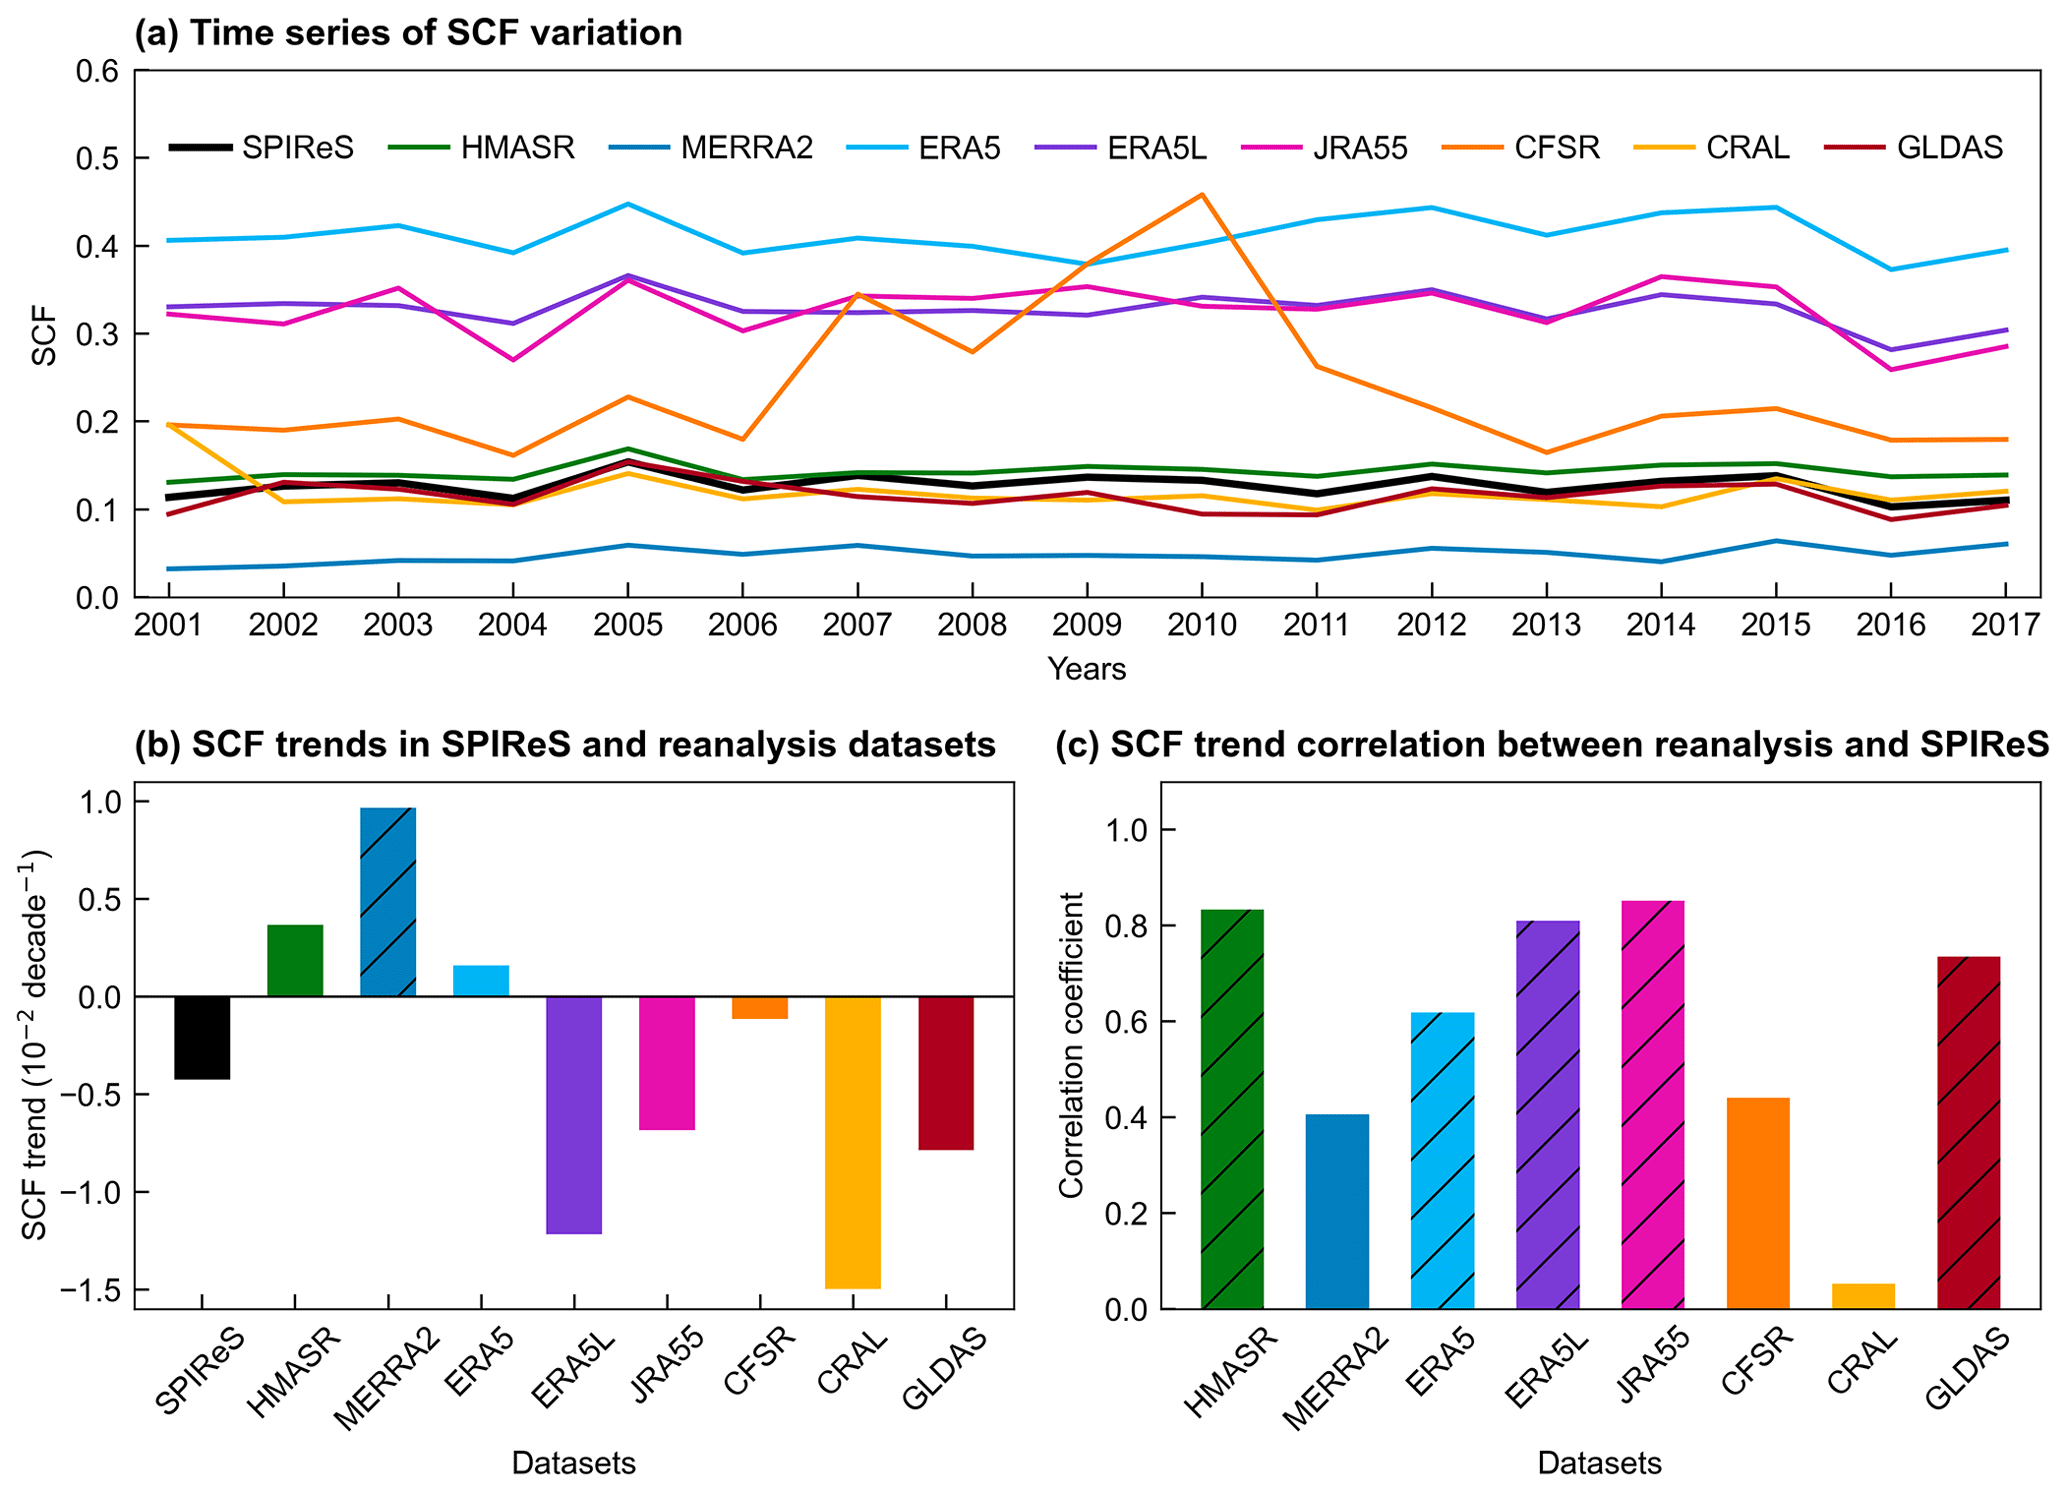
Figure 4(a) Time series of the annual SCF from SPIReS and eight reanalysis datasets over the TP. (b) The annual trends of SCF from SPIReS and eight reanalysis datasets over the TP. (c) The correlation of SCF annual trends in the reanalysis datasets with SPIReS over the TP. Slashes in (b) and (c) indicate that the annual trends and correlation exceed the 95 % confidence level.
We further evaluated the spatial consistency of annual trends in reanalysis datasets with SPIReS (Fig. 5). SPIReS has generally decreased SCF over the westerlies-dominated and the eastern and southeastern monsoon-dominated basins, but increased SCF in the northeastern ITP, the central Brahmaputra, and the northern Yangtze basins. However, these changes are statistically significant in only about 17 % of the TP (Fig. 5a). ERA5L, JRA55, and ERA5 have greater variability in SCF annual trends, with significant decreases in the Tarim basin. Nevertheless, they still have relatively high CI values of 0.62, 0.58, and 0.51, respectively (Fig. 5b). This indicates that ERA5L, JRA55, and ERA5 can capture more than half of the SCF annual trend changes over the TP, having the spatial pattern of annual trends most similar to SPIReS. By contrast, CFSR has highly uneven SCF annual trends with intermixed increases and decreases across grid cells, resulting in a poorer trend performance with a CI value of only 0.39. MERRA2 exhibits significant increasing trends in the Indus basin but fails to capture the correct decreasing trend in the monsoon-dominated basins. Consequently, it has the lowest CI value of 0.38, with CI values below 0.4 in most basins (Fig. S6). GLDAS has a significant decrease in SCF over more than 60 % of the TP, notably differing from SPIReS. Although the widespread significant trends allow GLDAS to capture the most correct significant increase and decrease in trends, reaching 16.42 % (as indicated by the red and yellow bars in Fig. 5b), it also introduces a major drawback by misjudging too many insignificant SCF fluctuations. Therefore, GLDAS has the lowest CI value, similar to MERRA2. Combinations of SCF time series and spatial consistency in the SCF annual trend, ERA5L, JRA55, and ERA5 have better temporal performance, while CFSR, MERRA2, and GLDAS perform worse.
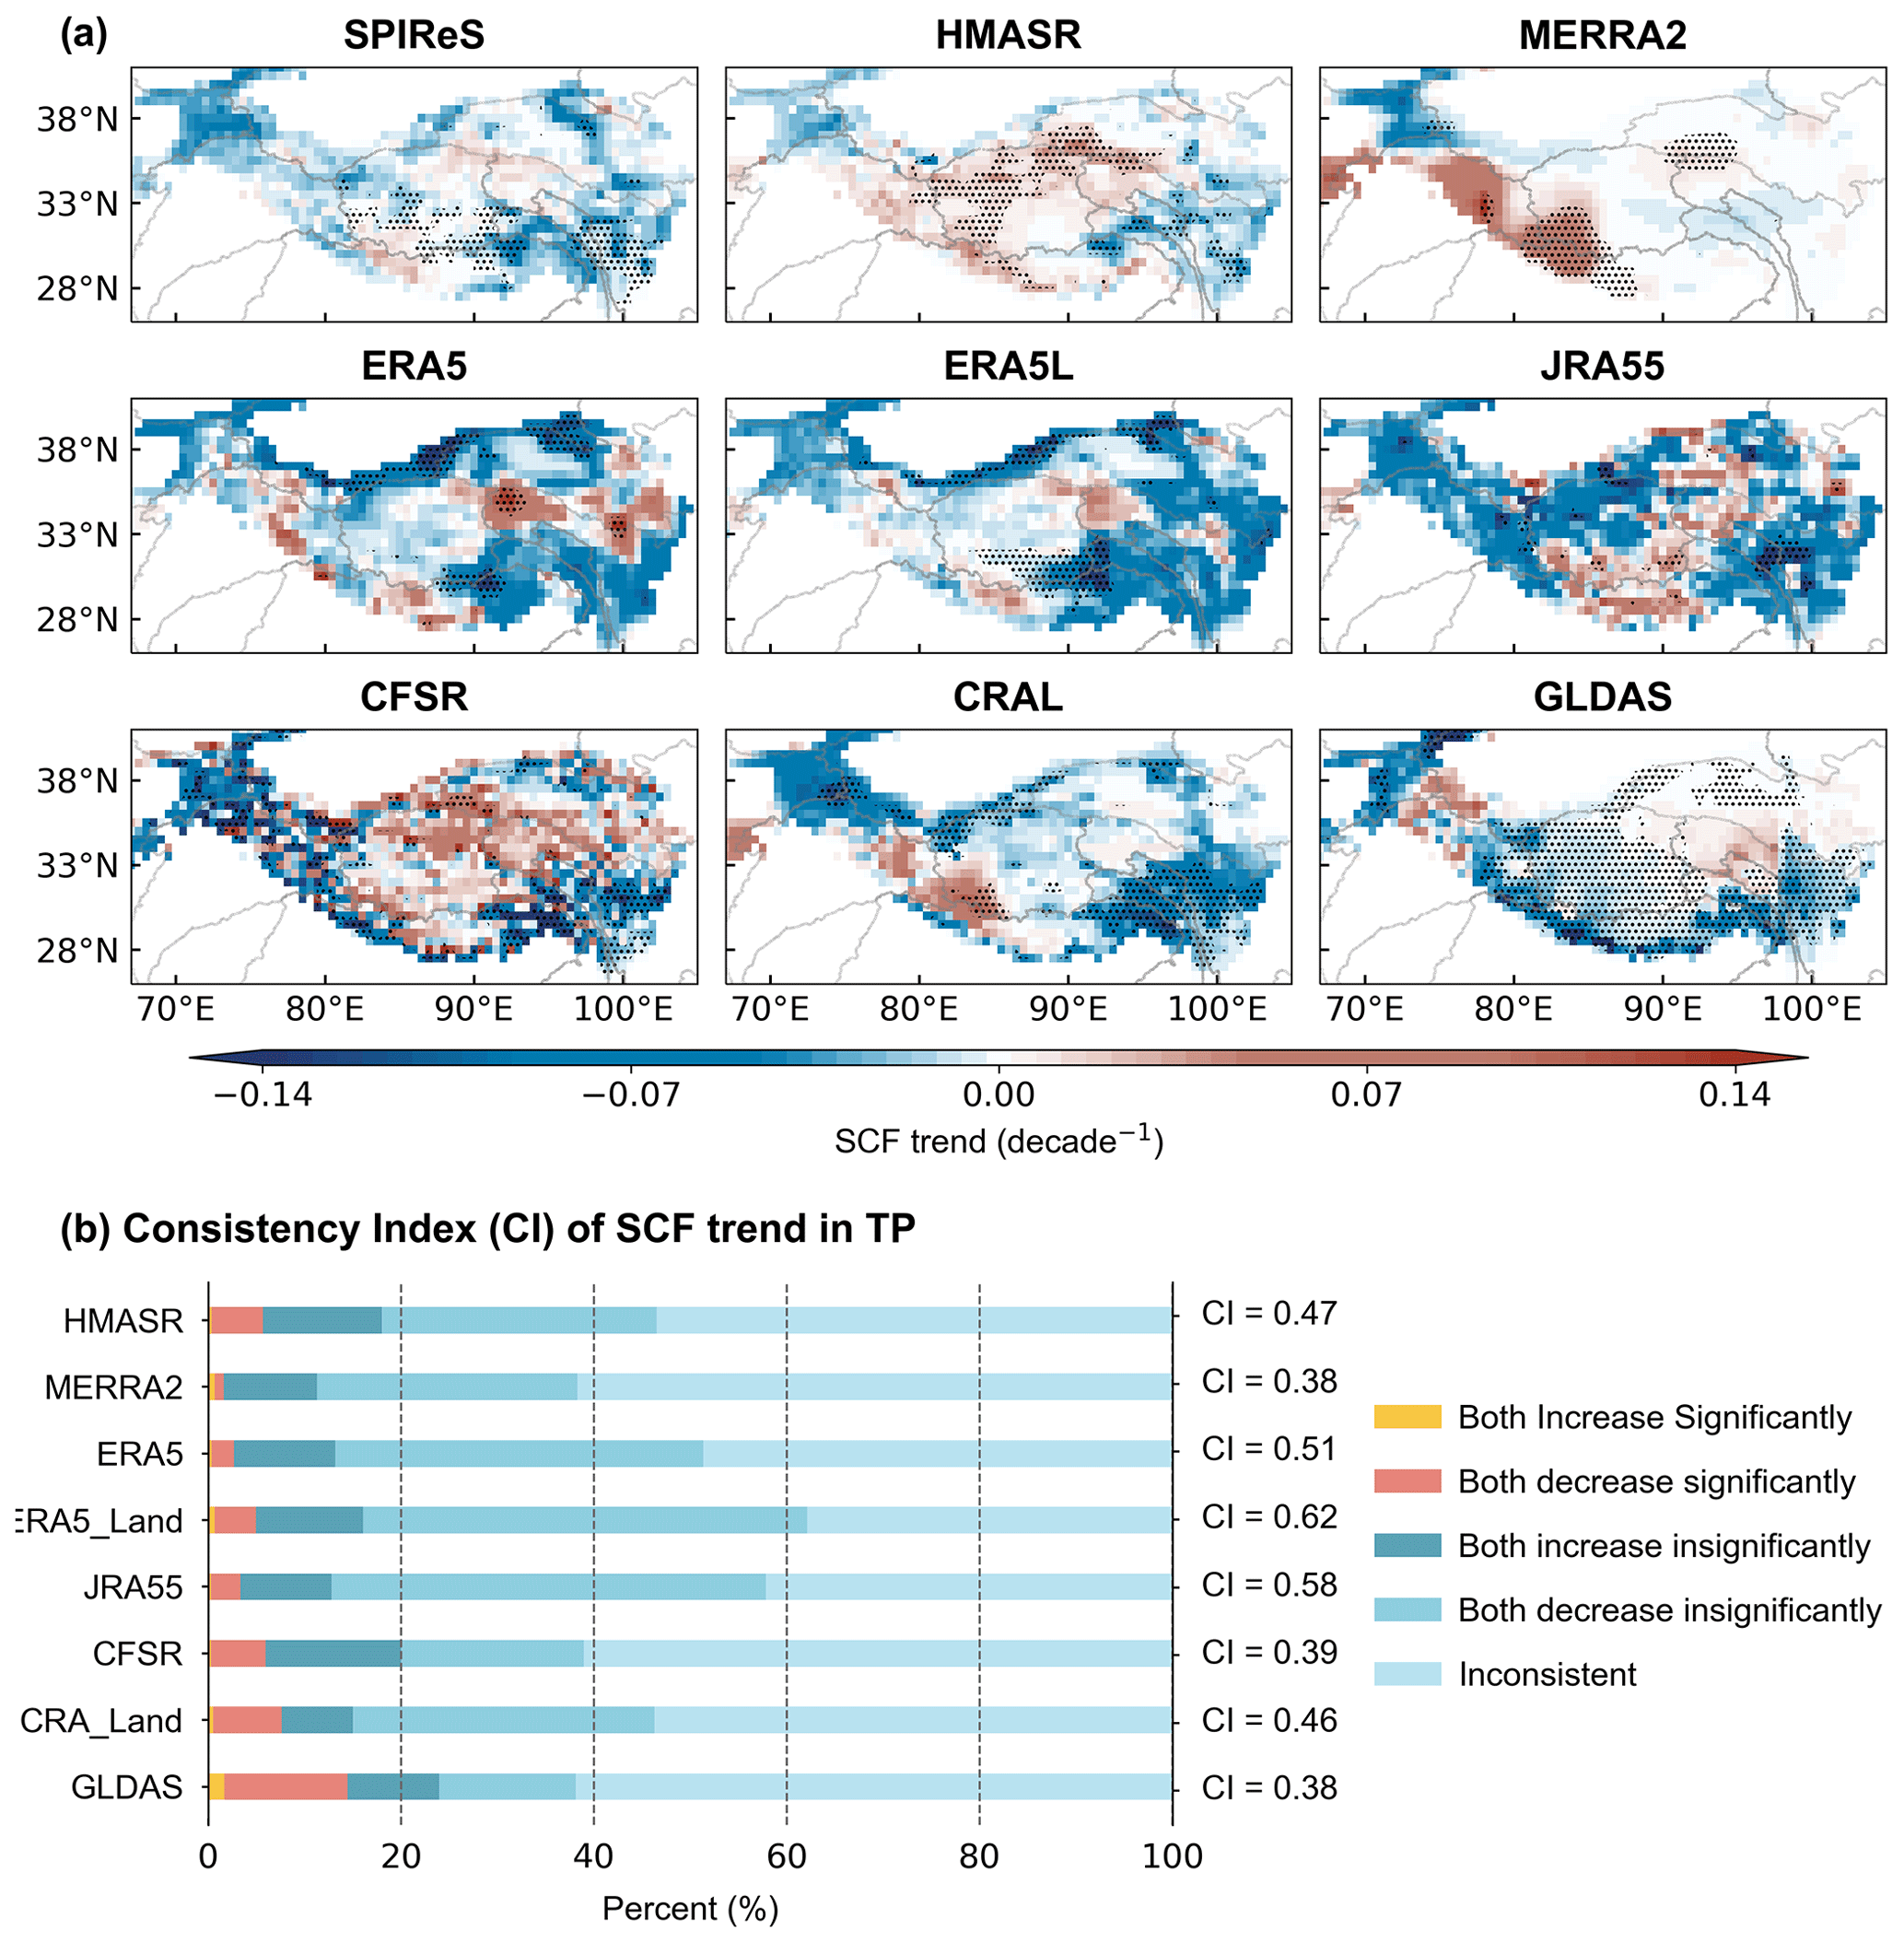
Figure 5(a) Spatial distribution of the SCF annual trend from SPIReS and eight reanalysis datasets over the TP for the period WY 2001 to WY 2017. (b) The consistency index (CI) of SCF trends in reanalysis datasets with SPIReS over the TP.
3.2 Bias attribution of SCF
3.2.1 Meteorological forcing effects on SCF bias
The evolution of SCF can be determined from the balance between snow mass gain via snowfall and snow depletion via snowmelt, sublimation, and wind drifting (Liu et al., 2022). Both snowfall and snowmelt are strongly dependent on temperature (Serquet et al., 2011; Vorkauf et al., 2021); hence, the accuracy of snowfall and temperature forcings impacts the accuracy of snow-related variables (Zhang et al., 2015). We investigated the impact of meteorological factors on SCF bias by examining the performance with respect to snowfall and temperature in each reanalysis dataset.
In the climatological spatial distribution, ERA5, ERA5L, JRA55, and CFSR overestimate snowfall in both the westerlies-dominated and monsoon-dominated basins, particularly in the Indus and Brahmaputra basins (Fig. 6, first column on the left). Conversely, these reanalysis datasets consistently underestimate temperatures in these regions (Fig. 6, third column on the left). Overestimated snowfall contributes to heightened snow accumulation, while underestimated temperatures can impede the snowmelt process, leading to an overestimation of snow cover (Liu et al., 2022). The combination of overestimated snowfall and underestimated temperatures contributes to the positive SCF bias observed in ERA5, ERA5L, JRA55, and CFSR, evidenced by the significant correlations between snowfall and temperature biases and SCF bias (Fig. 6, second and fourth columns on the left). Additionally, the positive SCF and snowfall biases, as well as negative temperature bias for these reanalysis datasets, persist across four seasons, reflecting that the uncertainties in snowfall and temperature data affect the SCF bias year-round (Fig. 7). Compared with snowfall, temperature bias has higher correlations with SCF bias and passes significance tests over broader areas (Fig. 6, second and fourth columns on the left). This indicates that physical processes influenced by temperature bias may have a more pronounced and widespread role with respect to SCF bias. The temperature biases in ERA5, ERA5L, JRA55, and CFSR also appear to have a greater impact on the seasonal evolution of SCF biases, as evidenced by the higher correlation values (Fig. 7). For MERRA2, CRAL, and GLDAS, the SCF climatology has large biases in the westerlies-dominated basins as well as in the Tarim and Brahmaputra basins (Fig. 2a), where a significant correlation exists between snowfall and temperature biases and SCF bias (Fig. 6, second and fourth columns on the left). This suggests that in these regions, both snowfall and temperature play equally important roles in influencing the SCF biases in MERRA2, CRAL, and GLDAS. When considering the TP as a whole, the SCF biases across four seasons for these three datasets align with their well-simulated snowfall (Fig. 7). Therefore, snowfall is likely the primary driver of the seasonal SCF bias.
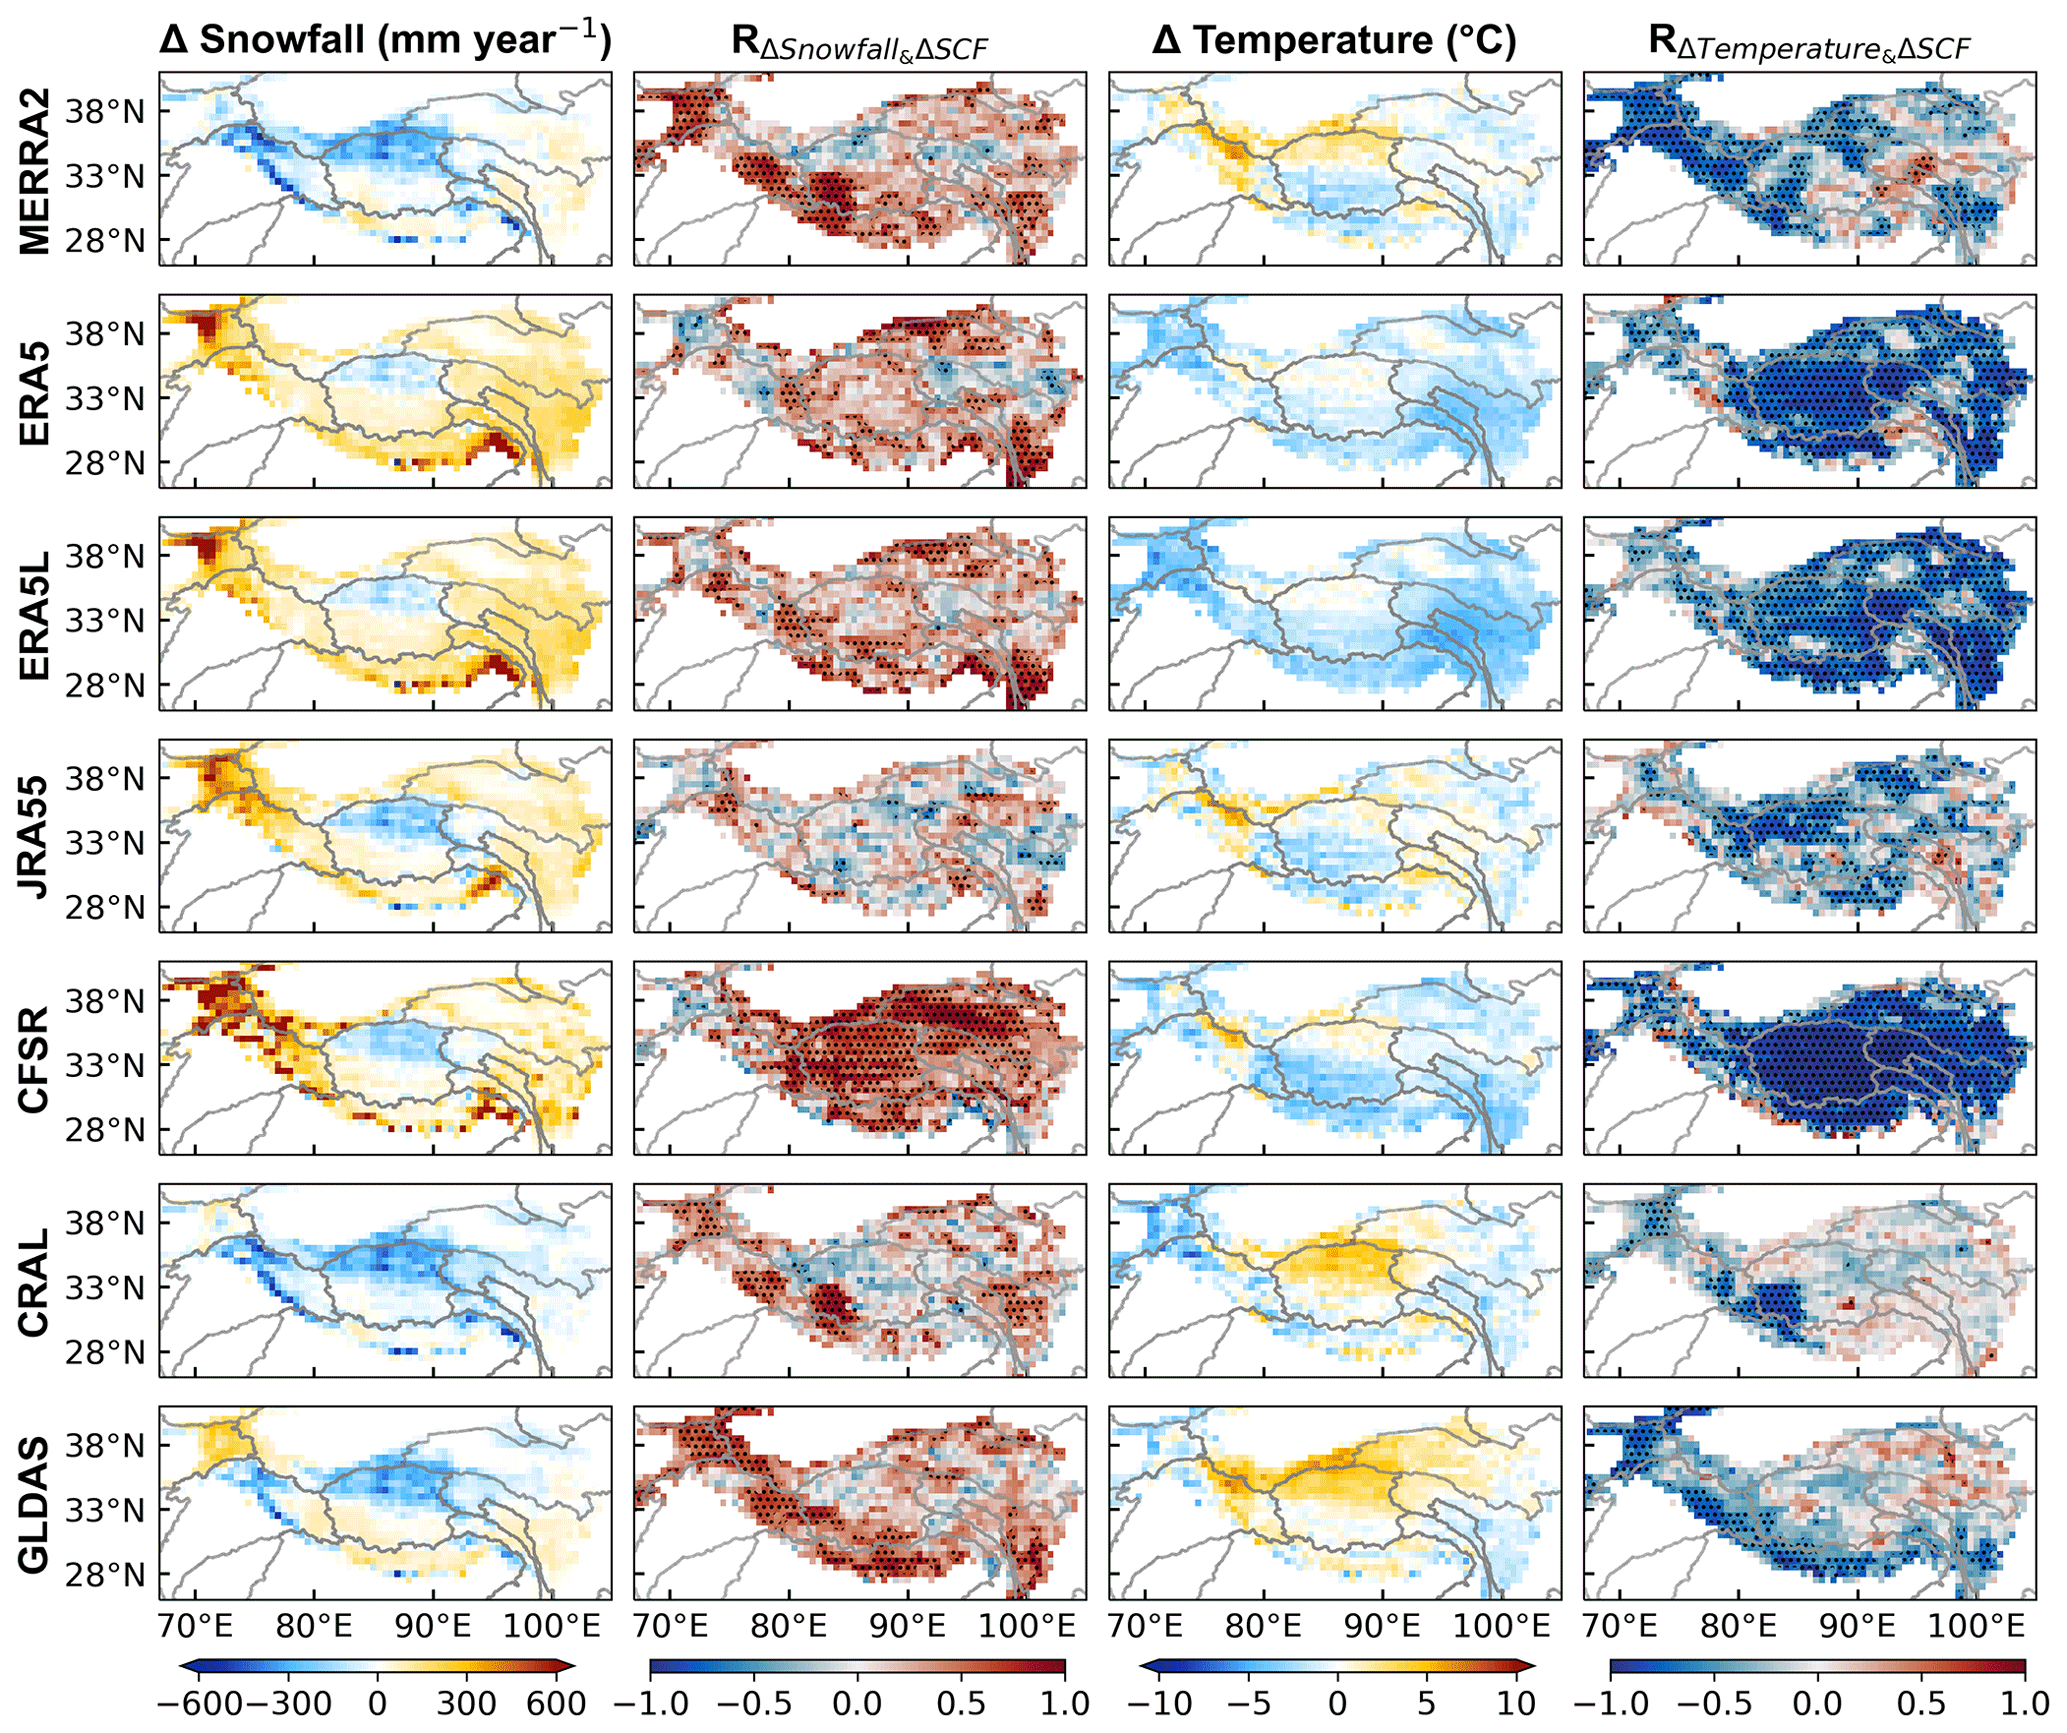
Figure 6The columns show (from left to right) the spatial distribution of the snowfall climatological bias for the reanalysis datasets based on TPMFD over the TP, the spatial distribution of the R value between snowfall bias and SCF bias, the spatial distribution of the temperature climatological bias for the reanalysis datasets based on TPMFD over the TP, and the spatial distribution of R values between temperature bias and SCF bias. Black dots in the second and fourth columns indicate that the correlation exceeds the 95 % confidence level. HMASR and MERRA2 share the same meteorological forcing data.
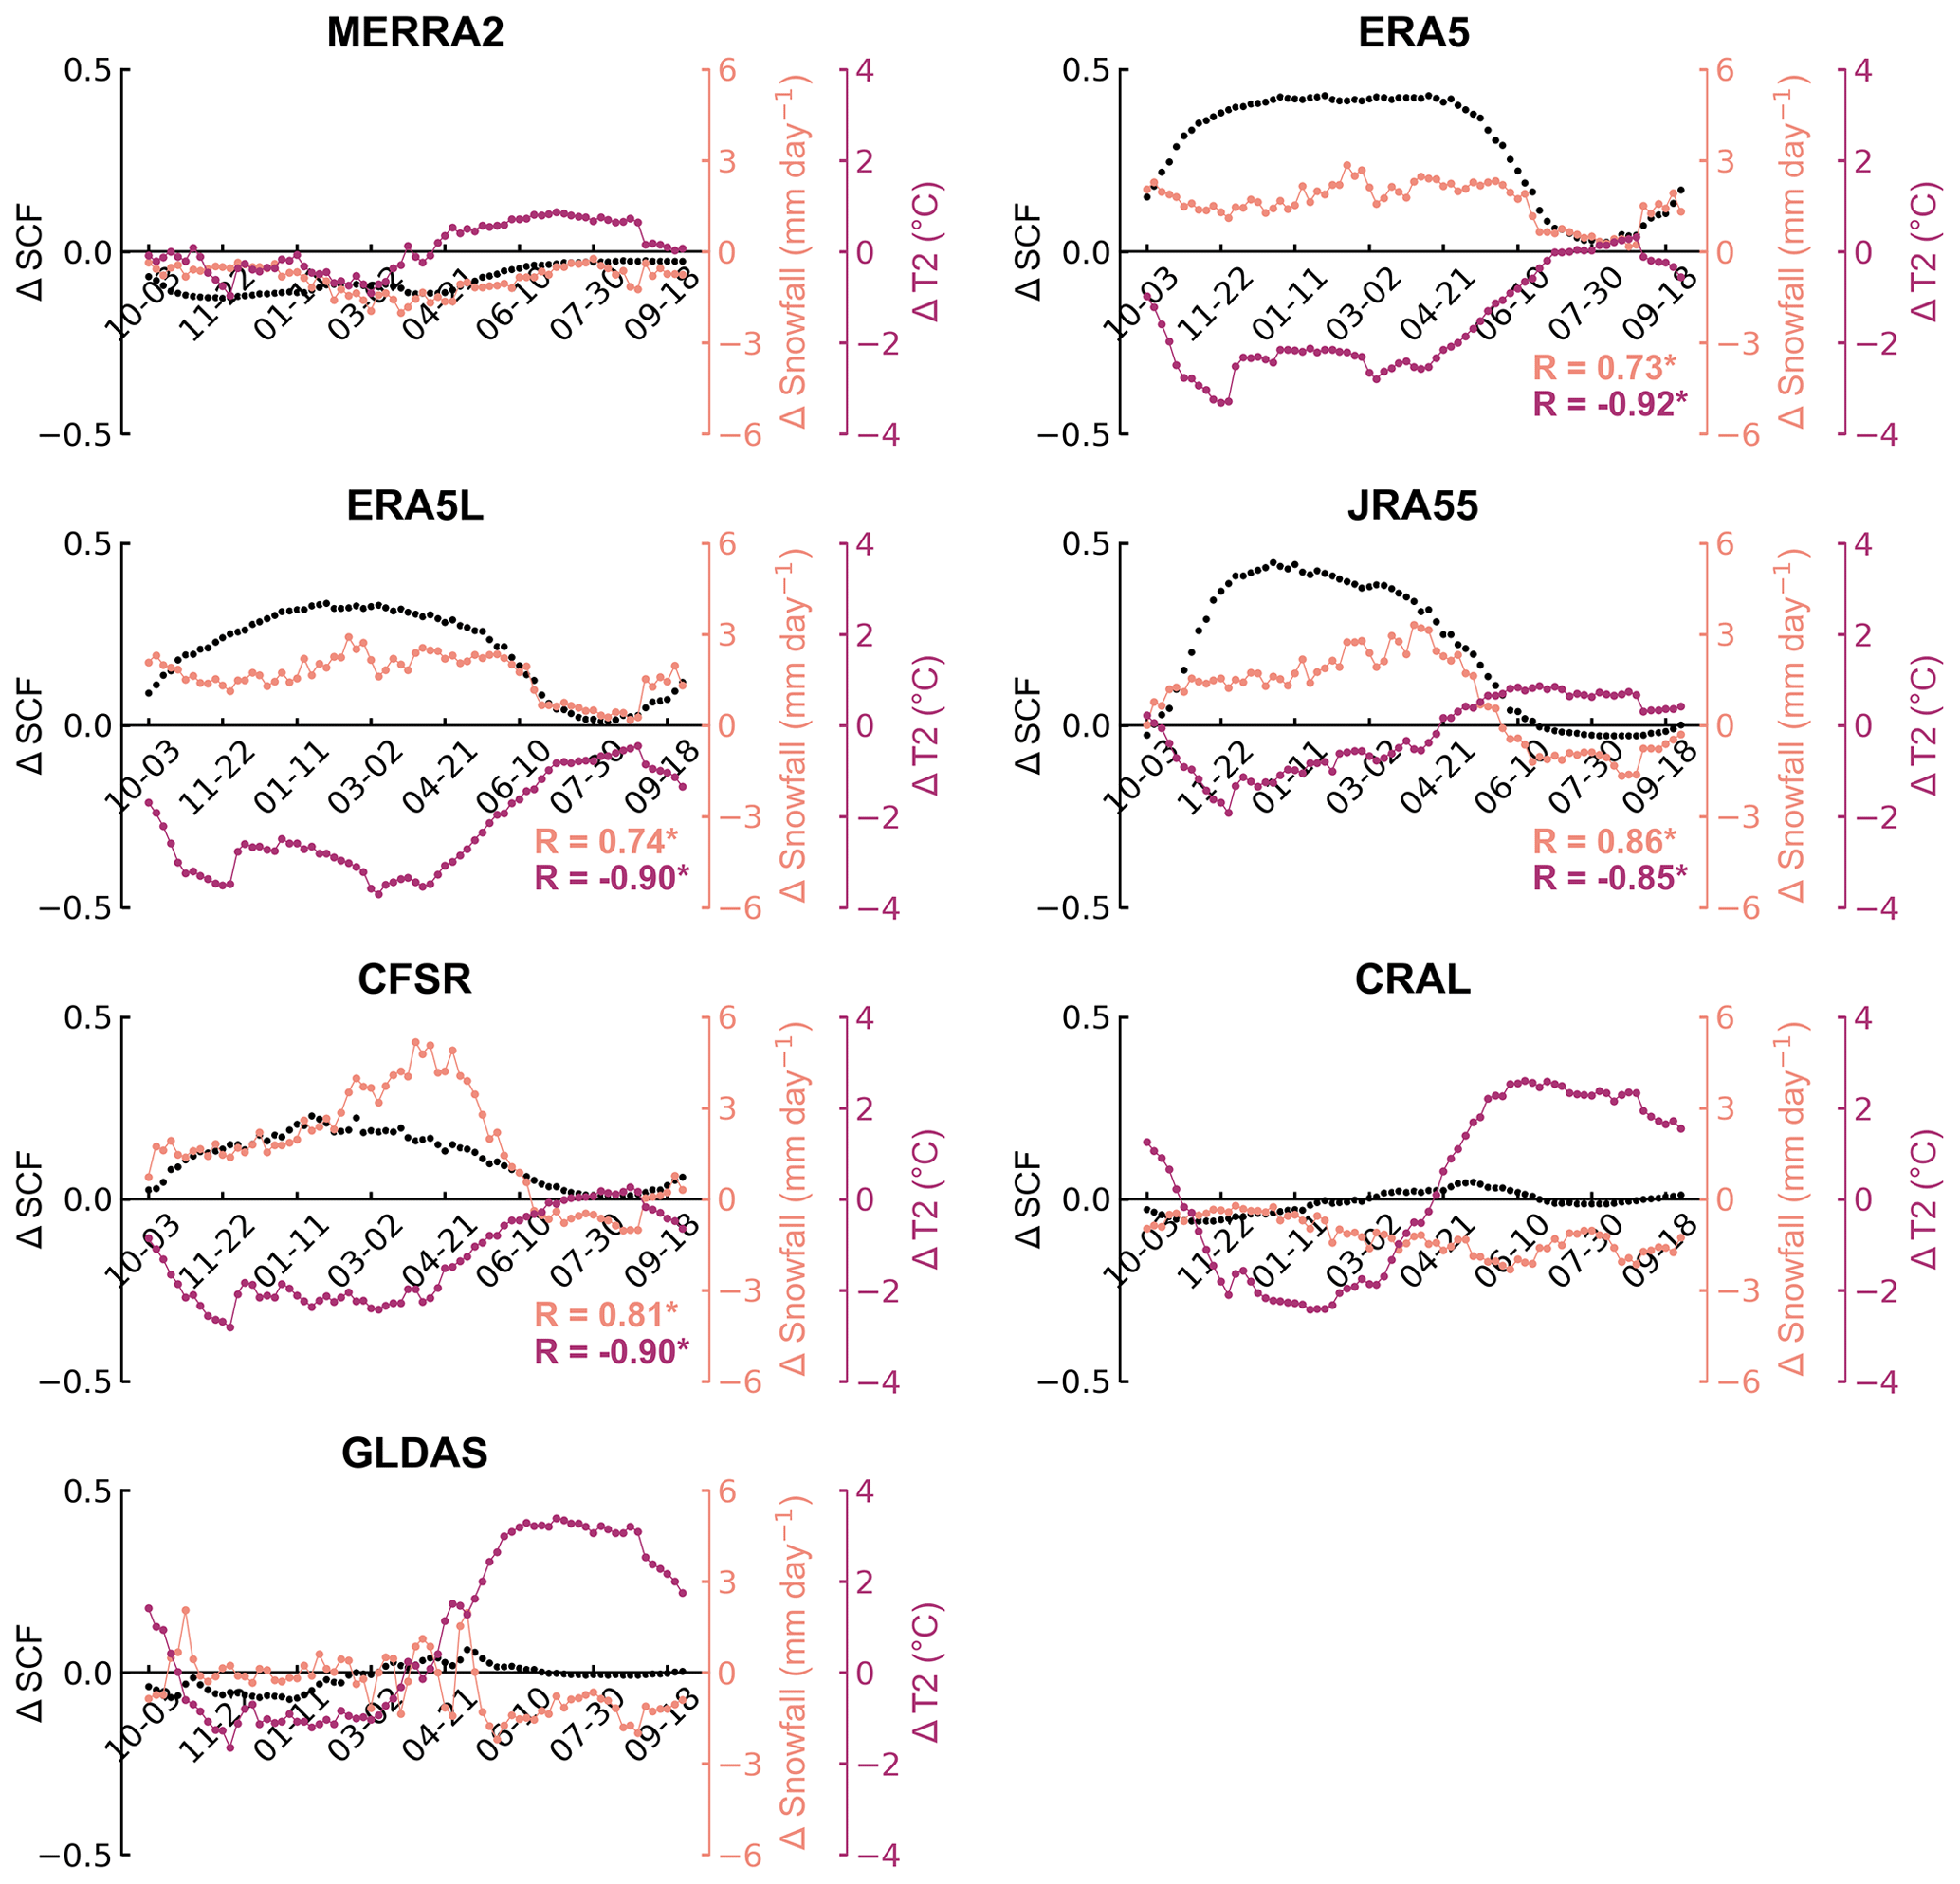
Figure 7Temporal variations in SCF (black), snowfall (light pink), and temperature (purple) bias averaged at 5 d intervals from all reanalysis datasets. R in light pink (purple) represents the correlation coefficient between snowfall (temperature) bias and SCF bias. The asterisks indicate the correlation exceeds the 95 % confidence level. HMASR and MERRA2 share the same meteorological forcing data.
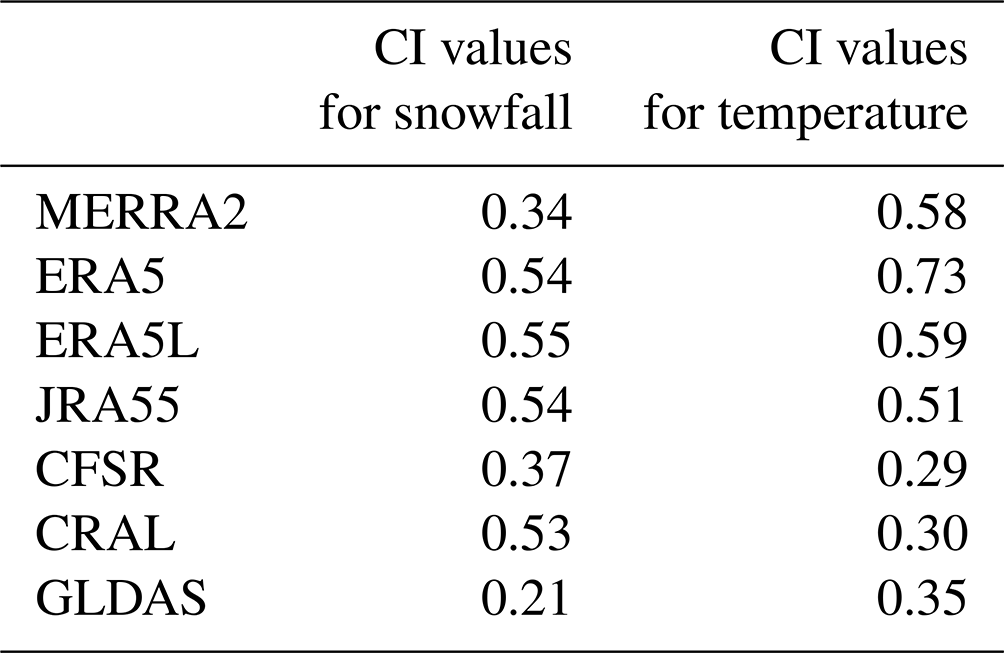
The snowfall and temperature annual trends in most datasets are significantly correlated with their own SCF annual trends (Table S3), indicating that the ability of datasets to capture the annual trends in meteorological factors influences the simulation of SCF annual trends. ERA5L, JRA55, and ERA5 have correct decreasing snowfall trends and increasing temperature trends in the southeastern monsoon-dominated basins (Fig. 8). Their CI values for meteorological factor trends all exceed 0.5, showing better spatial consistency with TPMFD (Table 2), resulting in better SCF trend simulations. By contrast, MERRA2 has an incorrect significant increase in snowfall over a broad region, except for the Tarim Basin (Fig. 8), resulting in a snowfall CI value of only 0.34 (Table 2) and poorer SCF trend simulations. The highly uneven spatial distribution of annual snowfall and temperature trends in CFSR, as well as the widespread significant trends in GLDAS (with temperature trends significantly increasing in over 90 % of the TP), mirror their respective SCF annual trend patterns (Fig. 8). Consequently, CFSR and GLDAS have the lowest CI values for SCF trends (Fig. 5b).
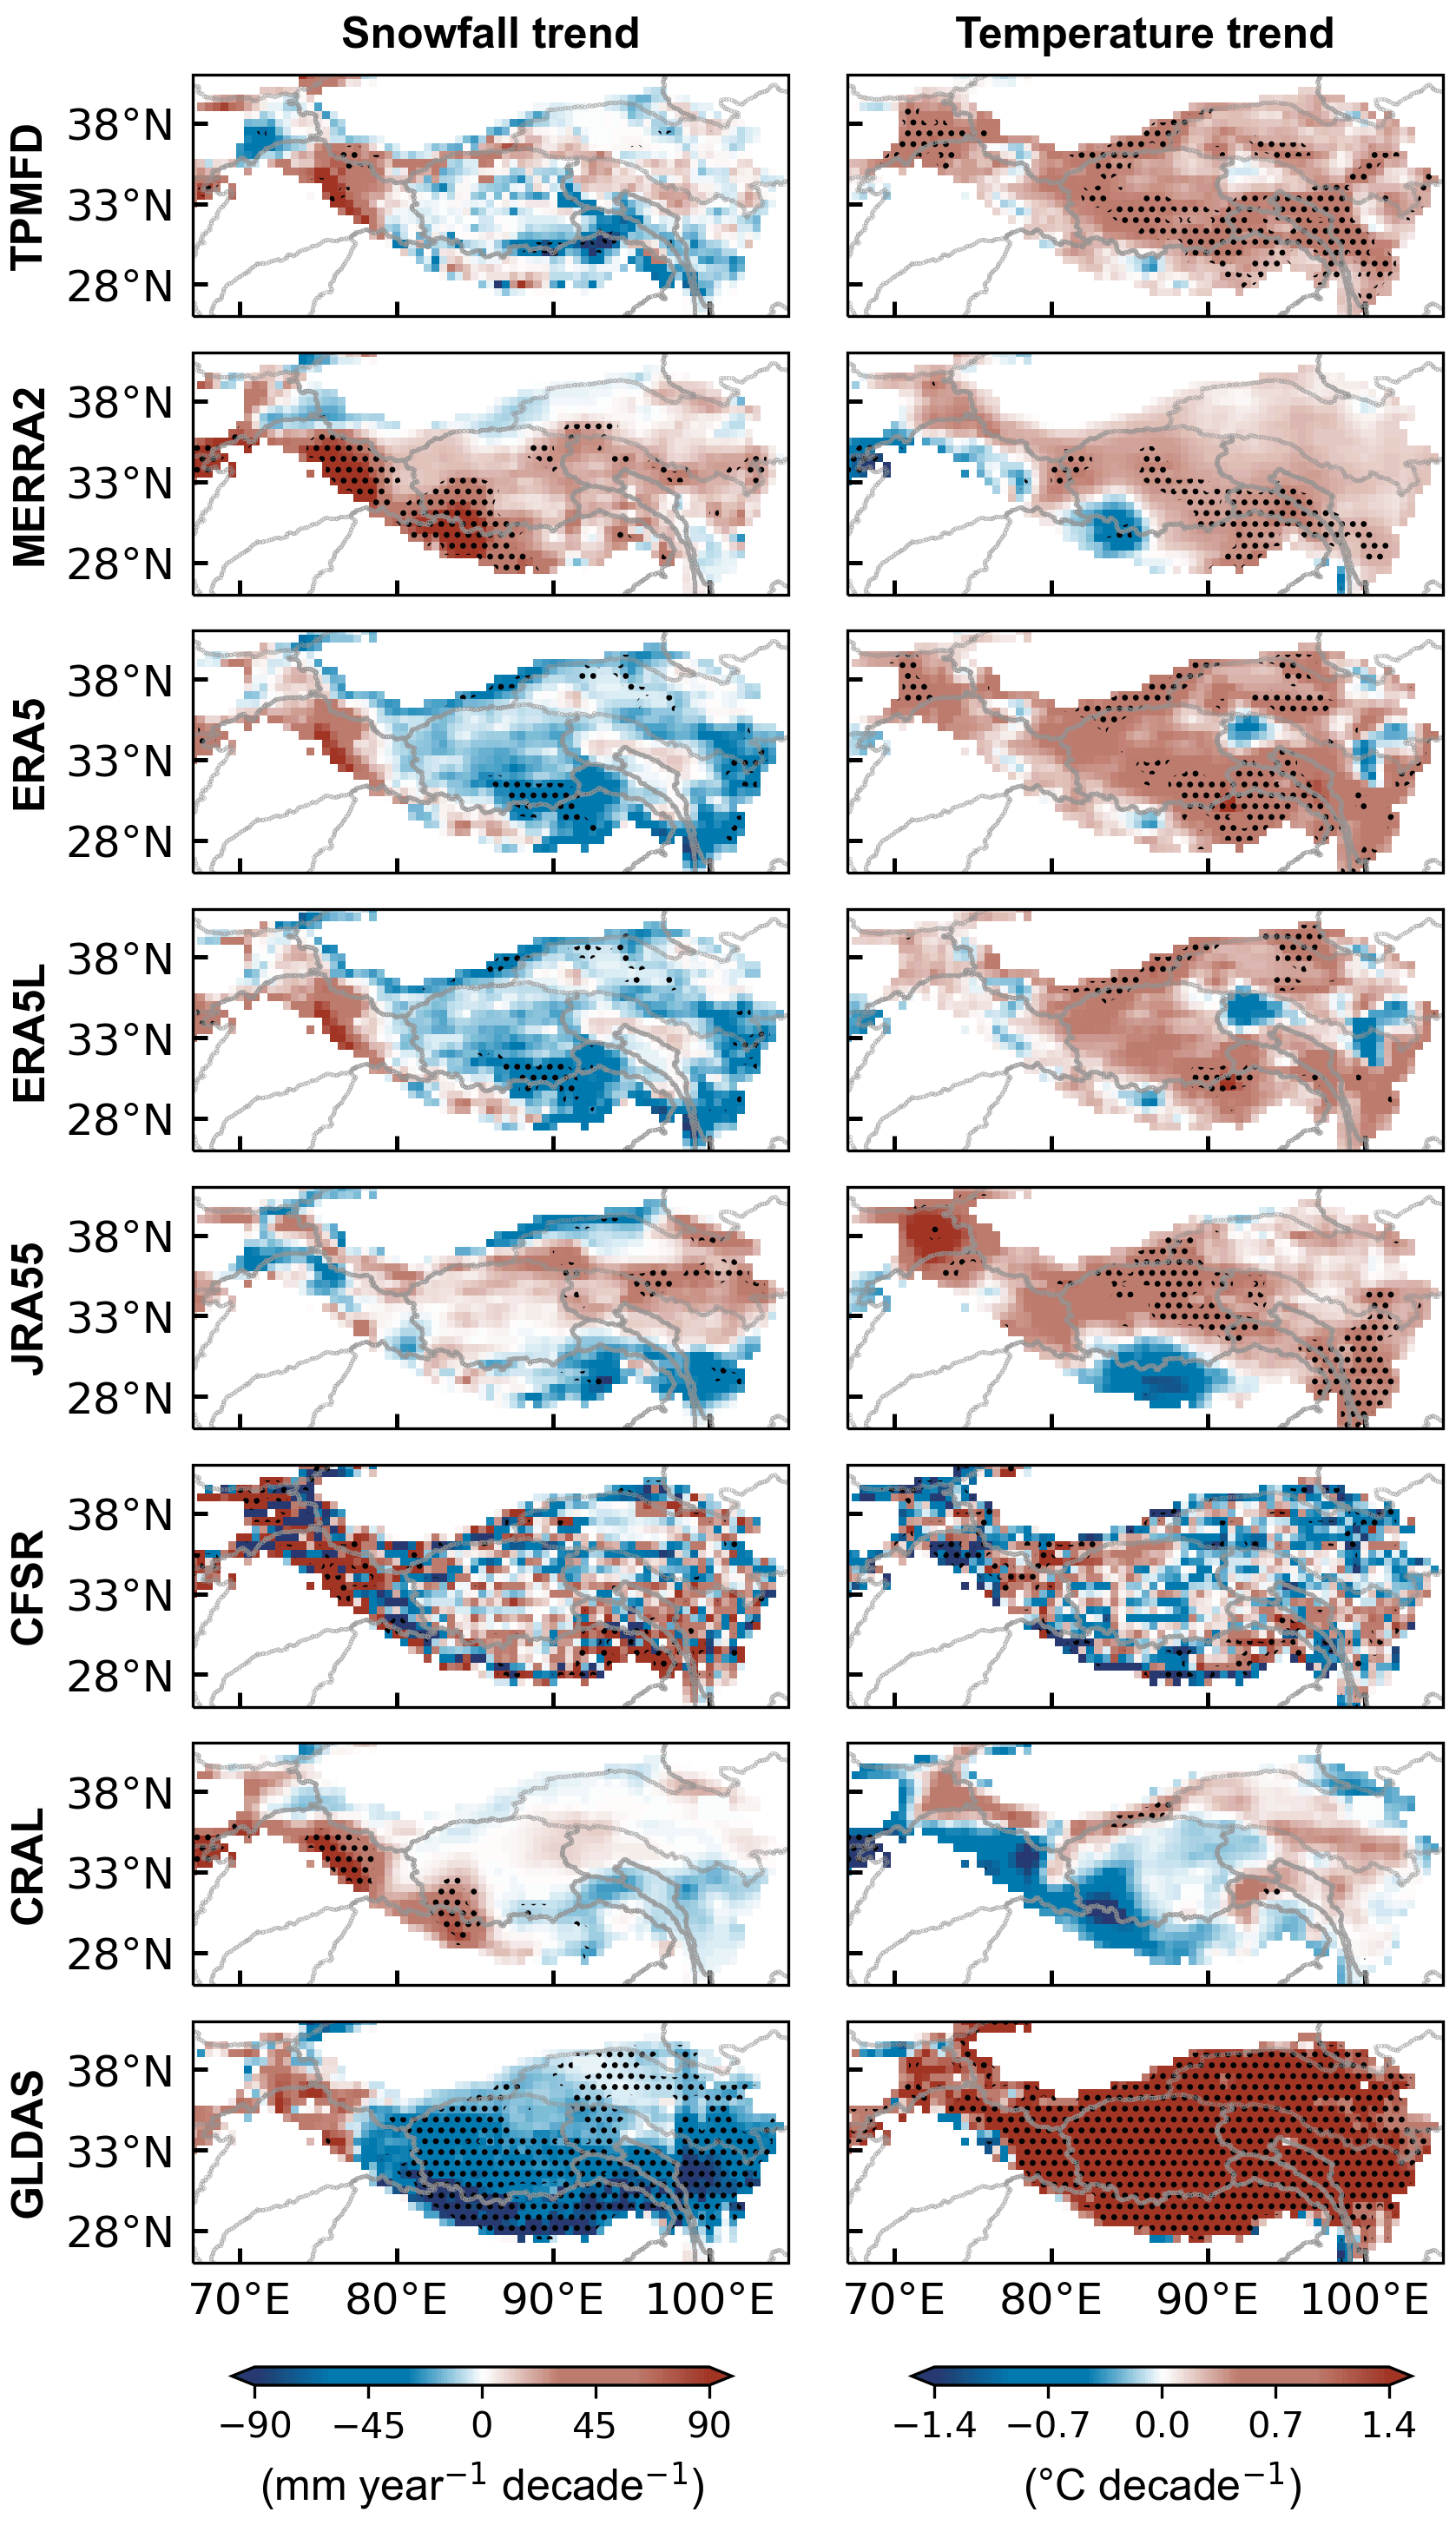
Figure 8Spatial distribution of the snowfall annual trend from the reanalysis datasets over the TP for the period WY 2001 to WY 2017 (left) and the temperature annual trend (right). Black dots indicate that the trend exceeds the 95 % confidence level. HMASR and MERRA2 share the same meteorological forcing data.
Table 2CI value for snowfall and temperature from eight reanalysis datasets calculated by comparing with TPMFD annual trends from WY 2001 to WY 2017.
3.2.2 Parameterization approach effects on SCF bias
Different SCF parameterizations influence the instability inherent in the snow models (Dutra et al., 2011; Jiang et al., 2020). We considered the impact of different parameterizations on the spatial distribution and annual trend simulation of SCF for each reanalysis dataset (Fig. 9). The parameterization process primarily affects the SCF values, while its impact on the phase of fluctuations in SCF time series is limited, as evidenced by the small variations in CI values among the reanalysis datasets (Fig. 9b). Therefore, the focus is on the spatial performance of the parameterization-improved SCF simulation, reflected by the spatial distribution of SCF bias (Fig. S7) and SS values (Fig. 9a).
The MM_SCF method improves the SCF spatial simulation in ERA5, ERA5L, JRA55, HMASR, and CFSR, reducing biases and increasing SS values and demonstrating its broad applicability. Meanwhile, the MM_SCF method is applicable in most of the basins (Fig. S8). The ME_SCF method also slightly enhances the spatial performance of some datasets (Fig. 9a). The Noah_SCF method, which accounts for the complex influence of underlying surface characteristics on SCF, has a spatial performance comparable to MM_SCF and ME_SCF. This indicates that surface characteristics have a limited impact on spatial SCF accuracy. In contrast to the parameterization above, the aggressive MJ_SCF approach with a 2 cm SD threshold to define the complete SCF (Table 1) reduces the spatial performance of all datasets, particularly in JRA55, which uses MJ_SCF as its built-in method. Additionally, SCF obtained using the MJ_SCF method for all reanalysis datasets has large positive biases (Fig. S7), further reflecting its inapplicability. Orsolini et al. (2019) found that JRA55 performs well in SD simulations due to assimilating SD data from Chinese ground observation stations. When adopting a more appropriate method to transform SD into SCF, the bias of JRA55 significantly decreased, and the SS value increases from 0.57 to 0.81, comparable to the best-performing CFSR (Fig. 9a). This apparent improvement confirms the importance of parameterization to JRA55 SCF accuracy. Apart from JRA55, optimizing parameterization does not significantly alter the spatial performance ranking of the eight reanalysis datasets. For example, the SS values for MERRA2, ERA5, and ERA5L using the optimal MM_SCF method are still lower than those for CFSR using the poorest MJ_SCF method. This indirectly highlights the primary role of snowfall and temperature forcing inputs with respect to SCF simulations.
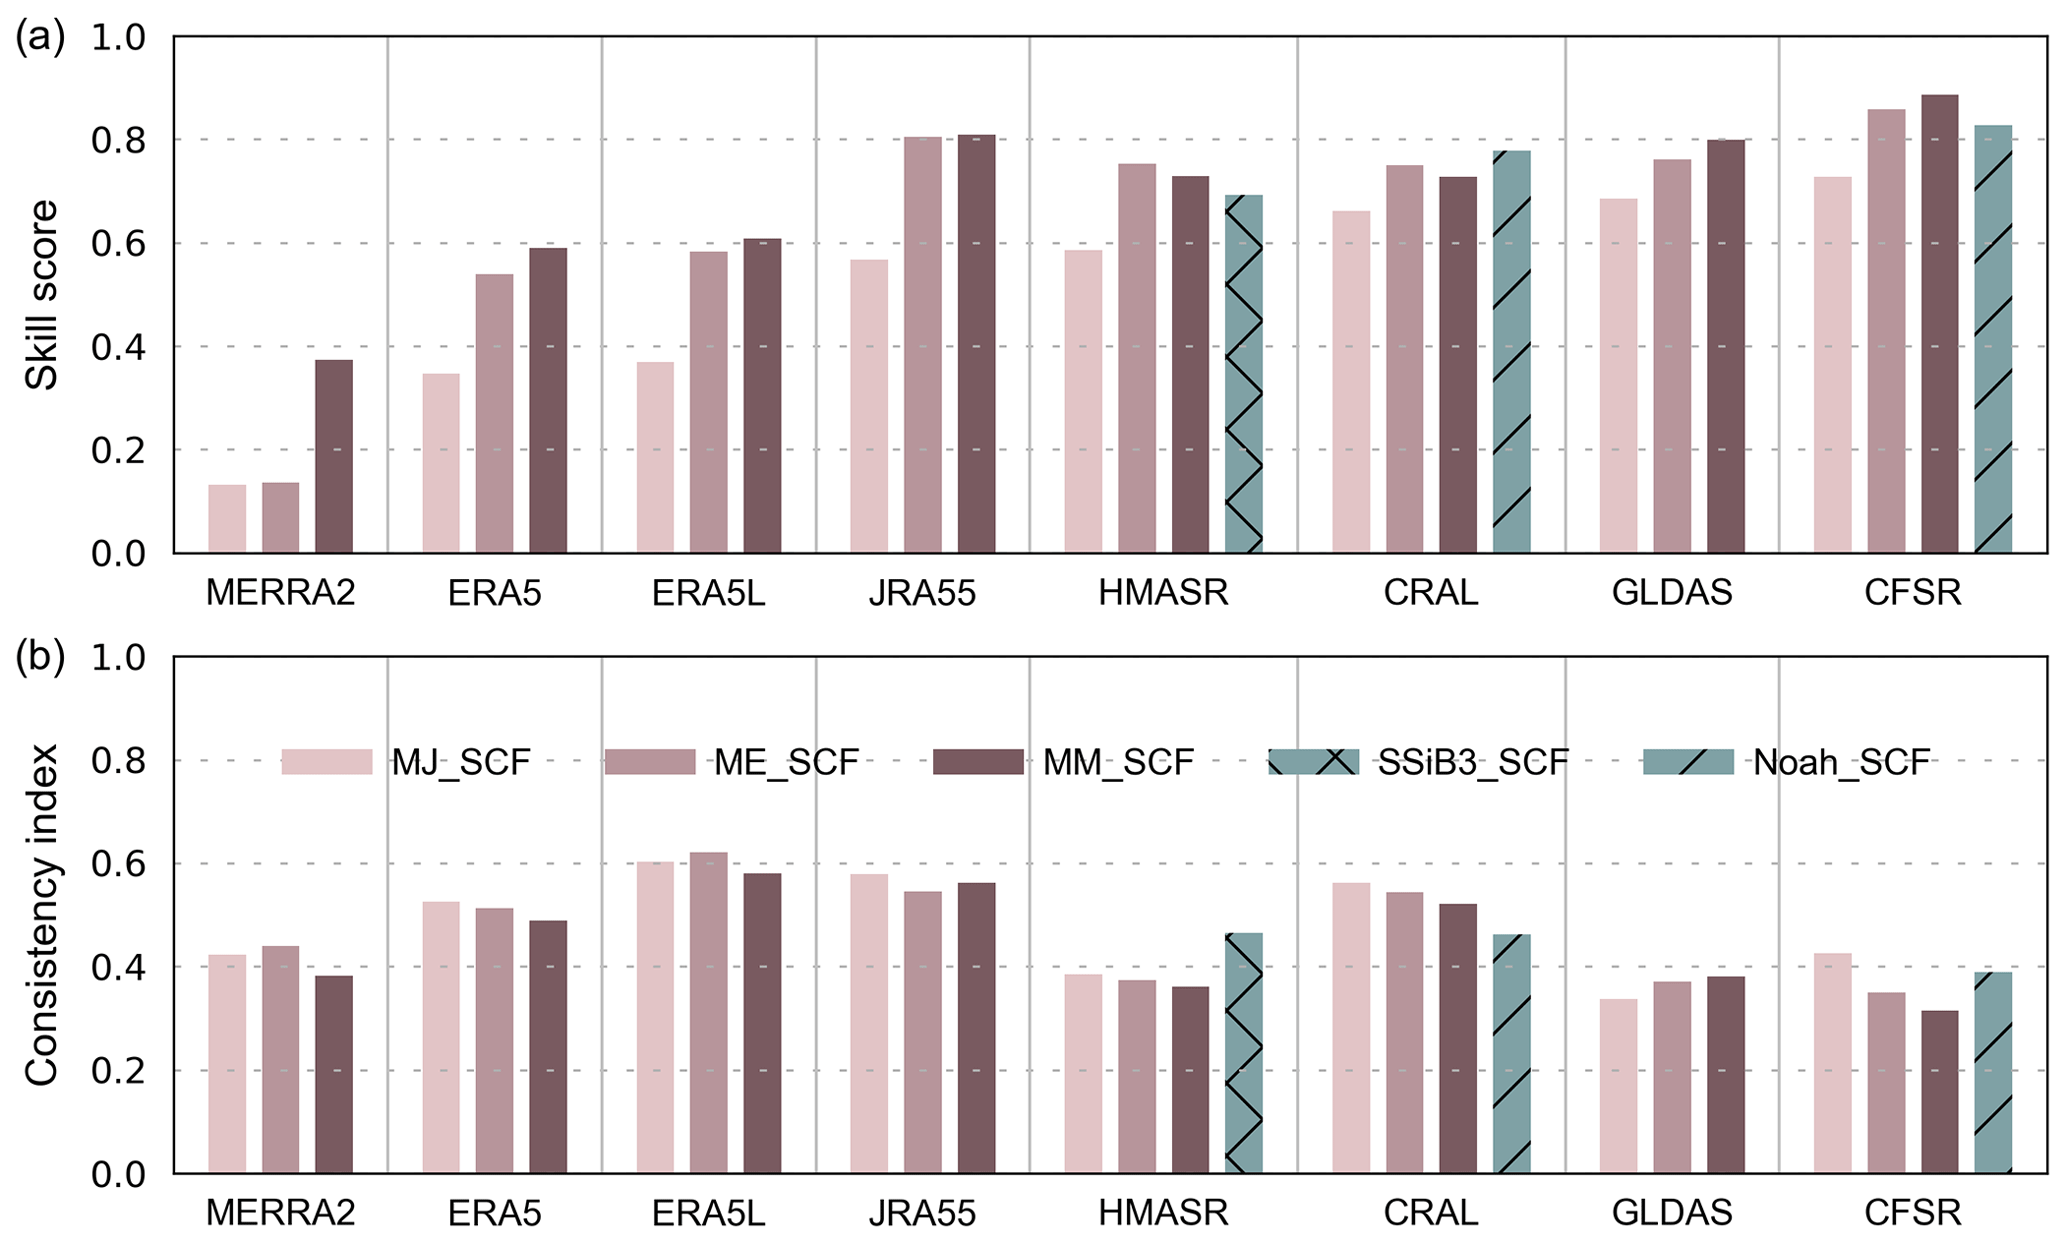
Figure 9SS (a) and CI (b) values of SCF for all reanalysis datasets calculated offline using the MM_SCF, MJ_SCF, and ME_SCF parameterization methods. The green bars represent the built-in parameterization methods for HMASR, CRAL, and CFSR.
3.3 Combination of reanalysis datasets for SCF optimization
Combining datasets can improve SCF accuracy, as evidenced by the SS and CI values of all combined datasets being higher than those of the single best-performing dataset (Fig. 10). However, SCF accuracy does not monotonically improve with the number of combined datasets. Spatially, the SS value improves when transitioning from CFSR alone to a combination with GLDAS and HMASR but declines when more datasets are combined (Fig. 10a). This appears reasonable because CFSR, GLDAS, and HMASR have excellent accuracy in simulating SCF spatial variability, but adding poorly performing datasets (e.g., MERRA2 and JRA55) introduces more bias, resulting in a suboptimal outcome. Consequently, we concluded that a combination of CFSR, GLDAS, and HMASR is optimal for spatial SCF studies over the TP. Temporally, the highest CI value is achieved with the combination of more datasets, namely, ERA5L, JRA55, HMASR, ERA5, GLDAS, and CRAL, which is different from the SS results (Fig. 10b). This is because reanalysis datasets generally have moderate SCF annual trend performance. Combining more datasets can help mitigate the shortcomings of individual datasets and improve the overall annual trend accuracy. In contrast to the optimal combination, the worst combination shows a monotonically and significantly improving performance for both spatial distribution and annual trends with an increased number of combined datasets (Fig. 10c and d).
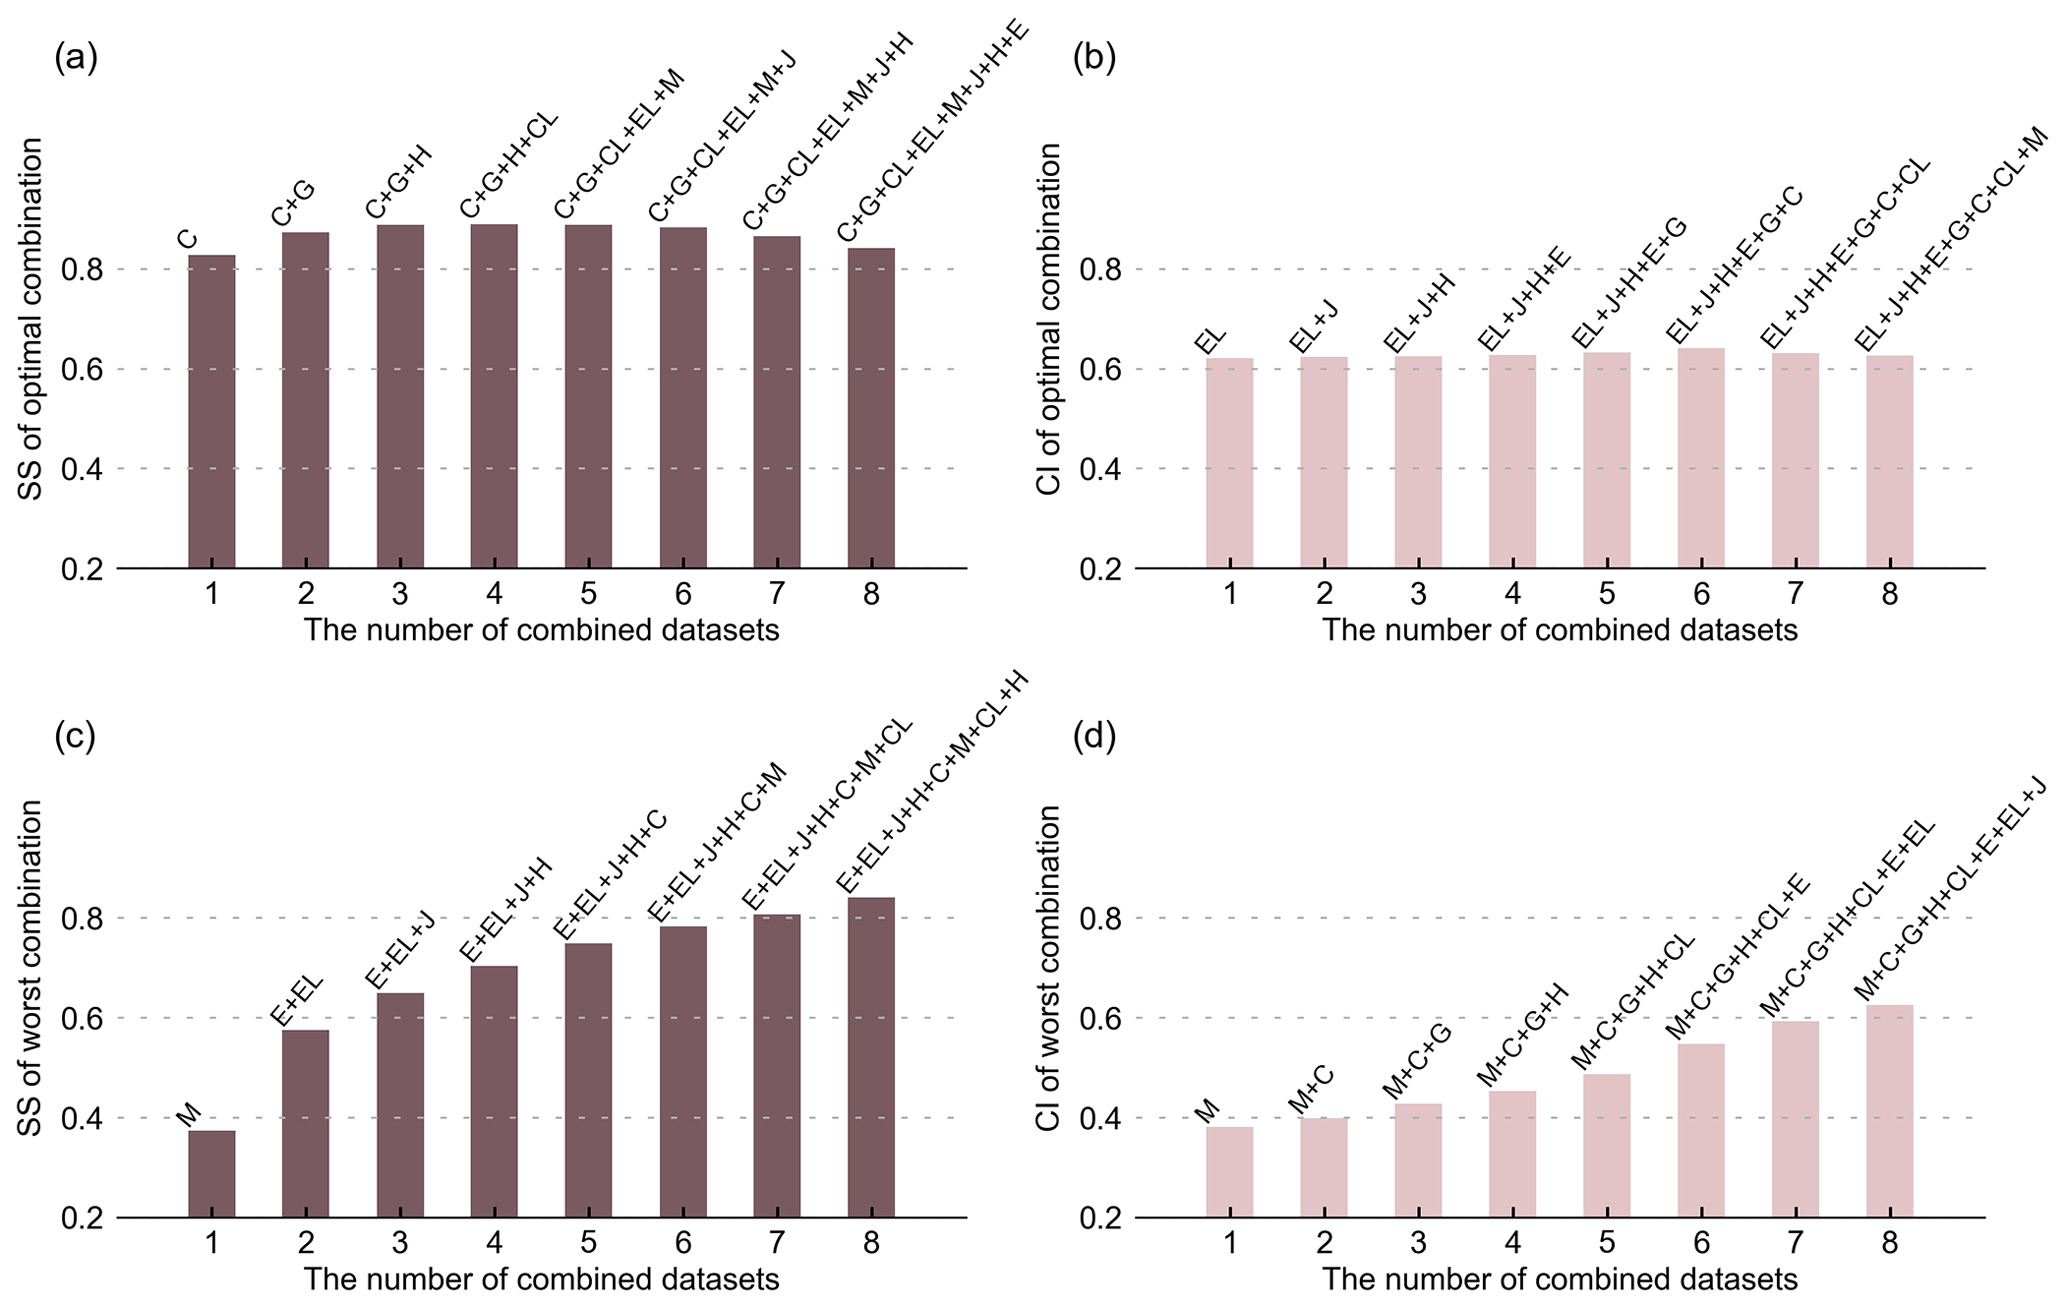
Figure 10(a) SS for optimal reanalysis dataset combinations across varying numbers of datasets. (b) As in (a) but for CI; (c) and (d) as in (a) and (b), but for the worst combinations. H: HMASR; M: MERRA2; E: ERA5; EL: ERA5L; J: JRA55; C: CFSR; CL: CRAL; G: GLDAS.
4.1 Effects of data assimilation, resolution, and LSM
Data assimilation is an effective approach for reducing snow model uncertainties and enhancing the capability to monitor seasonal snow changes (Andreadis and Lettenmaier, 2006; Sun et al., 2004). HMASR directly assimilates SCF data obtained from MODIS and Landsat satellites (Liu et al., 2021a), which are processed using a spectral unmixing algorithm that has been found more accurate than the original band ratio methods (Stillinger et al., 2023). Under the same meteorological input fields as MERRA2, the data assimilation in HMASR corrects the widespread SCF underestimation and erroneous trends in the southwestern TP exhibited by MERRA2, enhancing the spatiotemporal simulation performance of HMASR. By contrast, the lowest SS and CI values in SCF spatiotemporal simulations for MERRA2 may be partly related to its lack of SCF data assimilation. JRA55 and CFSR assimilate SD data and show good simulation performance in SD and SWE (Bian et al., 2019; Orsolini et al., 2019). However, the process of converting SD to SCF in JRA55 introduces additional errors, limiting the impact of SD assimilation on SCF spatial simulation accuracy. By contrast, CFSR employs a more reasonable SCF parameterization, resulting in significantly higher spatial simulation performance compared with JRA55. This indirectly highlights the influence of parameterization methods on SCF simulation in JRA55.
The spatial resolution of reanalysis datasets and the choice of LSM may also affect the accuracy of SCF simulations. Lei et al. (2023) pointed out that reanalysis datasets characterized by finer spatial resolutions exhibit better consistency with in situ measurements of SD over the TP; e.g., ERA5L outperforms ERA5 and MERRA2. Sun et al. (2023) evaluated the ability of different LSMs to simulate SD in China based on station observation data and found that the community Noah LSM with multi-parameterization options (Noah-MP model) provided the best overall performance. In our study, the fine spatial resolution version of GLDAS generates better SCF simulations than the coarse spatial resolution version for both spatial distribution and annual trend (Fig. S1). Additionally, compared with the CLSM and VIC models, GLDAS simulations using the Noah model show better SCF performance at a 1° × 1° resolution. This indicates the non-negligible impact of model resolution and LSM choice on SCF simulation accuracy. However, SCF products with different spatial resolutions and LSMs are available only in GLDAS. Therefore, this study cannot conclusively state that the impact of spatial resolution and LSM on SCF accuracy is universal.
4.2 Limitations
This study focused primarily on the impact of snowfall and temperature factors in snow models, as well as the choice of SCF parameterization, on the performance of reanalysis datasets in simulating SCF over the TP. However, other model parameters related to precipitation and temperature, such as the precipitation gradient used to describe precipitation variations at different elevations and the critical temperature used to distinguish rain from snow, are equally vital to snow simulations (Zhang et al., 2015). Furthermore, snow, being a suspended substance, is susceptible to sublimation. It is estimated that blowing snow sublimation accounts for ∼30 % of global surface sublimation (Déry and Yau, 2002). The TP is perpetually influenced by the westerly jet stream, and processes such as blowing snow sublimation may be significant under windy and arid conditions. However, most LSMs used in reanalysis datasets do not consider blowing snow (Mortimer et al., 2020), and deficiencies in their model structures may also affect the accuracy of SCF simulations.
This study evaluated the ability and attributed the biases of eight widely used reanalysis datasets to simulate spatiotemporal variations in SCF over the TP based on SPIReS covering the period of WYs 2001–2017. The results indicate that CRAL, GLDAS, and HMASR agree best with SPIReS in TP-averaged SCF and SS values, all exceeding 0.7. CFSR, despite overestimating SCF, has the highest SS value due to the good correlation with SPIReS and a high STDR value. These four datasets perform well spatially. By contrast, ERA5, ERA5L, and JRA55 generally overestimate SCF, while MERRA2 consistently underestimates it, leading to poor spatial performance. Overall, the reanalysis datasets exhibit moderate accuracy in annual trend analysis. ERA5L, JRA55, and ERA5 have relatively good temporal performance, with a significant correlation in trend time series and better CI values in trend spatial consistency. GLDAS and CFSR perform poorly in trend representation, while MERRA2 has the worst performance in both spatial distribution and annual trend.
Snowfall and temperature significantly impact SCF bias. ERA5, ERA5L, and JRA55 overestimate SCF due to overestimated snowfall and underestimated temperature. Temperature-related physical processes have a more significant impact on SCF bias and its seasonal variations in these datasets. The poor trend performance in GLDAS and CFSR is due to inconsistencies between temperature and snowfall trends compared with TPMFD trends. Meteorological factor errors impact the poor spatiotemporal performance of MERRA2. Additionally, the overestimation of SCF in JRA55 is also linked to aggressive parameterization. Except for JRA55, parameterization optimization improves SCF but does not significantly alter the spatial performance ranking of the eight reanalysis datasets. To improve SCF accuracy, combining datasets is an effective method. A three-member combination of CFSR, GLDAS, and HMASR is optimal for the study of SCF spatial scales, while the combination of ERA5L, JRA55, HMASR, ERA5, GLDAS, and CRAL is optimal for the study of annual trends.
These findings are crucial for selecting the most suitable reanalysis SCF datasets and gaining deeper insights into SCF variations and their controlling mechanisms on the TP. Reducing uncertainties within reanalysis SCF datasets stands as a pivotal step toward refining climate models and prediction systems. Considering the significant impact of precipitation and temperature bias, acquiring more precise meteorological forcing data is essential to further enhance the accuracy of reanalysis SCF simulations. Simultaneously, selecting more appropriate parameterization methods specific to reanalysis data models will contribute to improving dataset reliability. Optimizing simulations of snow cover on the TP will provide critical support for future climate change research and response strategies.
The SPIReS product used in this work is publicly available from https://github.com/edwardbair/SPIRES (Bair, 2023). The TPMFD dataset was obtained from the National Tibetan Plateau Science Data Center (TPDC; https://doi.org/10.11888/Atmos.tpdc.300398, Yang et al., 2023). All the reanalysis data were also acquired online: HMASR was obtained from the National Snow and Ice Data Center (NSIDC; https://doi.org/10.5067/HNAUGJQXSCVU, Liu et al., 2021b). ERA5 and ERA5L data were downloaded from the Copernicus Climate Change Service (C3S) Climate Data Store (ERA5: https://doi.org/10.24381/cds.adbb2d47, Hersbach et al., 2023; ERA5-land: https://doi.org/10.24381/cds.e2161bac, Muñoz-Sabater, 2019). JRA55 and CFSR data were downloaded from the NSF NCAR Research Data Archive (RDA; JRA55: https://doi.org/10.5065/D6HH6H41, Japan Meteorological Agency/Japan, 2013; CFSR: https://doi.org/10.5065/D69K487J, Saha et al., 2010b; CFSv2: https://doi.org/10.5065/D61C1TXF, Saha et al., 2011). CRAL was obtained from the National Meteorological Information Center (CMA Meteorological Data Centre, 1979; https://doi.org/10.12065/2.C.GLB.2019.5.v1). MERRA2 data were obtained from the NASA Goddard Earth Science Data and Information Service Center (GES DISC), with the specifications of SCF (FRSNO), SWE (SNOMAS), SD (SNODP), and snowfall (PRECSNOLAND) obtained from https://doi.org/10.5067/RKPHT8KC1Y1T (Global Modeling and Assimilation Office, 2015a) and air temperature (T2MMEAN) obtained from https://doi.org/10.5067/9SC1VNTWGWV3 (Global Modeling and Assimilation Office, 2015b). GLDAS-2.1 data sets were also obtained from GES DISC (GLDAS_NOAH025: https://doi.org/10.5067/E7TYRXPJKWOQ, Beaudoing and Rodell, 2020a; GLDAS_NOAH100: https://doi.org/10.5067/IIG8FHR17DA9, Beaudoing and Rodell, 2020b; GLDAS_VIC_100: https://doi.org/10.5067/ZOG6BCSE26HV, Beaudoing and Rodell, 2020c; GLDAS_CLSM100: https://doi.org/10.5067/VCO8OCV72XO0; Li et al., 2020).
The supplement related to this article is available online at: https://doi.org/10.5194/tc-18-4089-2024-supplement.
SY was responsible for conceptualizing the study, collecting data, drafting figures, analyzing results, and writing the original manuscript. WP contributed to the study design, figure development, result discussions, and manuscript editing and provided funding support. XW was involved in study design, manuscript editing, and also provided funding support. YC, YH, and KL offered technical assistance and contributed to result discussions. All authors were involved in the analysis and reviewed and improved the manuscript.
The contact author has declared that none of the authors has any competing interests.
Publisher's note: Copernicus Publications remains neutral with regard to jurisdictional claims made in the text, published maps, institutional affiliations, or any other geographical representation in this paper. While Copernicus Publications makes every effort to include appropriate place names, the final responsibility lies with the authors.
We gratefully acknowledge the special funding support from the National Natural Science Foundation of China, the Natural Science Foundation of Gansu Province, and the Lanzhou University “Double First-class” Construction Special Guidance Project. We also extend our thanks to the constructive comments and suggestions from the editor Chris Derksen and the three anonymous referees.
This research has been supported by the National Science Fund for Distinguished Young Scholars (grant no. 42025102), the Natural Science Foundation of Gansu Province (grant no. 21ZDKA0017), the National Natural Science Foundation of China (grant nos. 42075061, 42375068, and 42301142), and the Lanzhou University “Double First-class” Construction Special Guidance Project (grant no. 561120205).
This paper was edited by Chris Derksen and reviewed by three anonymous referees.
Adler, R. F., Huffman, G. J., Chang, A., Ferraro, R., Xie, P.-P., Janowiak, J., Rudolf, B., Schneider, U., Curtis, S., Bolvin, D., Gruber, A., Susskind, J., Arkin, P., and Nelkin, E.: The Version-2 Global Precipitation Climatology Project (GPCP) monthly precipitation analysis (1979–present), J. Hydrometeorol., 4, 1147–1167, https://doi.org/10.1175/1525-7541(2003)004<1147:TVGPCP>2.0.CO;2, 2003.
Andreadis, K. M. and Lettenmaier, D. P.: Assimilating remotely sensed snow observations into a macroscale hydrology model, Adv. Water Resour., 29, 872–886, https://doi.org/10.1016/j.advwatres.2005.08.004, 2006.
Bair, E.: edwardbair/SPIRES, GitHub [code], https://github.com/edwardbair/SPIRES, last access: 4 February 2023.
Bair, E. H., Stillinger, T., and Dozier, J.: Snow Property Inversion from Remote Sensing (SPIReS): a generalized multispectral unmixing approach with examples from MODIS and Landsat 8 OLI, IEEE T. Geosci. Remote, 59, 7270–7284, https://doi.org/10.1109/TGRS.2020.3040328, 2021.
Beaudoing, H. and Rodell, M.: NASA/GSFC/HSL: GLDAS Noah Land Surface Model L4 3 hourly 0.25 × 0.25 degree V2.1, Greenbelt, Maryland, USA, Goddard Earth Sciences Data and Information Services Center (GES DISC) [data set], https://doi.org/10.5067/E7TYRXPJKWOQ, 2020a.
Beaudoing, H. and Rodell, M.: NASA/GSFC/HSL GLDAS Noah Land Surface Model L4 3 hourly 1.0 × 1.0 degree V2.1, Greenbelt, Maryland, USA, Goddard Earth Sciences Data and Information Services Center (GES DISC) [data set], https://doi.org/10.5067/IIG8FHR17DA9, 2020b.
Beaudoing, H. and Rodell, M.: NASA/GSFC/HSL GLDAS VIC Land Surface Model L4 3 hourly 1.0 × 1.0 degree V2.1, Greenbelt, Maryland, USA, Goddard Earth Sciences Data and Information Services Center (GES DISC) [data set], https://doi.org/10.5067/ZOG6BCSE26HV, 2020c.
Bian, Q., Xu, Z., Zhao, L., Zhang, Y.-F., Zheng, H., Shi, C., Zhang, S., Xie, C., and Yang, Z.-L.: Evaluation and intercomparison of multiple snow water equivalent products over the Tibetan Plateau, J. Hydrometeorol., 20, 2043–2055, https://doi.org/10.1175/JHM-D-19-0011.1, 2019.
Brown, R. D. and Mote, P. W.: The response of Northern Hemisphere snow cover to a changing climate, J. Climate, 22, 2124–2145, https://doi.org/10.1175/2008JCLI2665.1, 2009.
Cao, B., Gruber, S., Zheng, D., and Li, X.: The ERA5-Land soil temperature bias in permafrost regions, The Cryosphere, 14, 2581–2595, https://doi.org/10.5194/tc-14-2581-2020, 2020.
CMA Meteorological Data Centre: CMA Meteorological Data Centre [data set], https://doi.org/10.12065/2.C.GLB.2019.5.v1, 1979.
Danielson, J. J. and Gesch, D. B.: Global multi-resolution terrain elevation data 2010 (GMTED2010), USGS, report, https://doi.org/10.3133/ofr20111073, 2011.
Deng, H., Pepin, N. C., and Chen, Y.: Changes of snowfall under warming in the Tibetan Plateau, J. Geophys. Res. Atmos., 122, 7323–7341, https://doi.org/10.1002/2017JD026524, 2017.
de Rosnay, P., Balsamo, G., Albergel, C., Muñoz-Sabater, J., and Isaksen, L.: Initialisation of land surface variables for numerical weather prediction, Surv. Geophys., 35, 607–621, https://doi.org/10.1007/s10712-012-9207-x, 2014.
Déry, S. J. and Yau, M. K.: Large-scale mass balance effects of blowing snow and surface sublimation, J. Geophys. Res. Atmos., 107, ACL 8-1–ACL 8-17, https://doi.org/10.1029/2001JD001251, 2002.
Ding, B., Yang, K., Qin, J., Wang, L., Chen, Y., and He, X.: The dependence of precipitation types on surface elevation and meteorological conditions and its parameterization, J. Hydrol., 513, 154–163, https://doi.org/10.1016/j.jhydrol.2014.03.038, 2014.
Dozier, J., Painter, T. H., Rittger, K., and Frew, J. E.: Time–space continuity of daily maps of fractional snow cover and albedo from MODIS, Adv. Water Resour., 31, 1515–1526, https://doi.org/10.1016/j.advwatres.2008.08.011, 2008.
Dutra, E., Kotlarski, S., Viterbo, P., Balsamo, G., Miranda, P. M. A., Schär, C., Bissolli, P., and Jonas, T.: Snow cover sensitivity to horizontal resolution, parameterizations, and atmospheric forcing in a land surface model, J. Geophys. Res.-Atmos., 116, D21109, https://doi.org/10.1029/2011JD016061, 2011.
ECMWF: IFS Documentation CY45R1 – Part IV : Physical processes, in: IFS Documentation CY45R1, ECMWF, https://doi.org/10.21957/4whwo8jw0, 2018.
Ek, M. B., Mitchell, K. E., Lin, Y., Rogers, E., Grunmann, P., Koren, V., Gayno, G., and Tarpley, J. D.: Implementation of Noah land surface model advances in the National Centers for Environmental Prediction operational mesoscale Eta model, J. Geophys. Res.-Atmos., 108, 2002JD003296, https://doi.org/10.1029/2002JD003296, 2003.
Fujiwara, M., Wright, J. S., Manney, G. L., Gray, L. J., Anstey, J., Birner, T., Davis, S., Gerber, E. P., Harvey, V. L., Hegglin, M. I., Homeyer, C. R., Knox, J. A., Krüger, K., Lambert, A., Long, C. S., Martineau, P., Molod, A., Monge-Sanz, B. M., Santee, M. L., Tegtmeier, S., Chabrillat, S., Tan, D. G. H., Jackson, D. R., Polavarapu, S., Compo, G. P., Dragani, R., Ebisuzaki, W., Harada, Y., Kobayashi, C., McCarty, W., Onogi, K., Pawson, S., Simmons, A., Wargan, K., Whitaker, J. S., and Zou, C.-Z.: Introduction to the SPARC Reanalysis Intercomparison Project (S-RIP) and overview of the reanalysis systems, Atmos. Chem. Phys., 17, 1417–1452, https://doi.org/10.5194/acp-17-1417-2017, 2017.
Gelaro, R., McCarty, W., Suárez, M. J., Todling, R., Molod, A., Takacs, L., Randles, C. A., Darmenov, A., Bosilovich, M. G., Reichle, R., Wargan, K., Coy, L., Cullather, R., Draper, C., Akella, S., Buchard, V., Conaty, A., Silva, A. M. da, Gu, W., Kim, G.-K., Koster, R., Lucchesi, R., Merkova, D., Nielsen, J. E., Partyka, G., Pawson, S., Putman, W., Rienecker, M., Schubert, S. D., Sienkiewicz, M., and Zhao, B.: The Modern-Era Retrospective analysis for Research and Applications, version 2 (MERRA-2), J. Climate, 30, 5419–5454, https://doi.org/10.1175/JCLI-D-16-0758.1, 2017.
Global Modeling and Assimilation Office (GMAO): MERRA-2 tavg1_2d_lnd_Nx: 2d,1-Hourly,Time-Averaged,Single-Level,Assimilation,Land Surface Diagnostics V5.12.4, Greenbelt, MD, USA, Goddard Earth Sciences Data and Information Services Center (GES DISC) [data set], https://doi.org/10.5067/RKPHT8KC1Y1T, 2015a.
Global Modeling and Assimilation Office (GMAO): MERRA-2 statD_2d_slv_Nx: 2d,Daily,Aggregated Statistics,Single-Level,Assimilation,Single-Level Diagnostics V5.12.4, Greenbelt, MD, USA, Goddard Earth Sciences Data and Information Services Center (GES DISC) [data set], https://doi.org/10.5067/9SC1VNTWGWV3, 2015b.
Hall, D. K., Riggs, G. A., Salomonson, V. V., DiGirolamo, N. E., and Bayr, K. J.: MODIS snow-cover products, Remote Sens. Environ., 83, 181–194, https://doi.org/10.1016/S0034-4257(02)00095-0, 2002.
Helfrich, S. R., McNamara, D., Ramsay, B. H., Baldwin, T., and Kasheta, T.: Enhancements to, and forthcoming developments in the Interactive Multisensor Snow and Ice Mapping System (IMS), Hydrol. Process., 21, 1576–1586, https://doi.org/10.1002/hyp.6720, 2007.
Hernández-Henríquez, M. A., Déry, S. J., and Derksen, C.: Polar amplification and elevation-dependence in trends of Northern Hemisphere snow cover extent, 1971–2014, Environ. Res. Lett., 10, 044010, https://doi.org/10.1088/1748-9326/10/4/044010, 2015.
Hersbach, H., Bell, B., Berrisford, P., Hirahara, S., Horányi, A., Muñoz-Sabater, J., Nicolas, J., Peubey, C., Radu, R., Schepers, D., Simmons, A., Soci, C., Abdalla, S., Abellan, X., Balsamo, G., Bechtold, P., Biavati, G., Bidlot, J., Bonavita, M., Chiara, G., Dahlgren, P., Dee, D., Diamantakis, M., Dragani, R., Flemming, J., Forbes, R., Fuentes, M., Geer, A., Haimberger, L., Healy, S., Hogan, R. J., Hólm, E., Janisková, M., Keeley, S., Laloyaux, P., Lopez, P., Lupu, C., Radnoti, G., Rosnay, P., Rozum, I., Vamborg, F., Villaume, S., and Thépaut, J.: The ERA5 global reanalysis, Q. J. Roy. Meteor. Soc., 146, 1999–2049, https://doi.org/10.1002/qj.3803, 2020.
Hersbach, H., Bell, B., Berrisford, P., Biavati, G., Horányi, A., Muñoz Sabater, J., Nicolas, J., Peubey, C., Radu, R., Rozum, I., Schepers, D., Simmons, A., Soci, C., Dee, D., and Thépaut, J.-N.: ERA5 hourly data on single levels from 1940 to present, Copernicus Climate Change Service (C3S) Climate Data Store (CDS) [data set], https://doi.org/10.24381/cds.adbb2d47, 2023.
Huang, J., Zhou, X., Wu, G., Xu, X., Zhao, Q., Liu, Y., Duan, A., Xie, Y., Ma, Y., Zhao, P., Yang, S., Yang, K., Yang, H., Bian, J., Fu, Y., Ge, J., Liu, Y., Wu, Q., Yu, H., Wang, B., Bao, Q., and Qie, K.: Global climate impacts of land-surface and atmospheric processes over the Tibetan Plateau, Rev. Geophys., 61, e2022RG000771, https://doi.org/10.1029/2022RG000771, 2023.
Huffman, G. J., Adler, R. F., Morrissey, M. M., Bolvin, D. T., Curtis, S., Joyce, R., McGavock, B., and Susskind, J.: Global precipitation at one-degree daily resolution from multisatellite observations, J. Hydrometeorol., 2, 36–50, https://doi.org/10.1175/1525-7541(2001)002<0036:GPAODD>2.0.CO;2, 2001.
Immerzeel, W. W., Van Beek, L. P. H., and Bierkens, M. F. P.: Climate change will affect the Asian water towers, Science, 328, 1382–1385, https://doi.org/10.1126/science.1183188, 2010.
Japan Meteorological Agency/Japan: JRA-55: Japanese 55-year Reanalysis, Daily 3-Hourly and 6-Hourly Data, Research Data Archive at the National Center for Atmospheric Research, Computational and Information Systems Laboratory [data set], https://doi.org/10.5065/D6HH6H41, 2013, updated monthly.
Jiang, Y., Chen, F., Gao, Y., He, C., Barlage, M., and Huang, W.: Assessment of uncertainty sources in snow cover simulation in the Tibetan Plateau, J. Geophys. Res.-Atmos., 125, e2020JD032674, https://doi.org/10.1029/2020JD032674, 2020.
Jiang, Y., Yang, K., Qi, Y., Zhou, X., He, J., Lu, H., Li, X., Chen, Y., Li, X., Zhou, B., Mamtimin, A., Shao, C., Ma, X., Tian, J., and Zhou, J.: TPHiPr: a long-term (1979–2020) high-accuracy precipitation dataset (1/30°, daily) for the Third Pole region based on high-resolution atmospheric modeling and dense observations, Earth Syst. Sci. Data, 15, 621–638, https://doi.org/10.5194/essd-15-621-2023, 2023.
Kendall, M. G.: Rank Correlation Methods, J. Inst. Actuar., 75, 140–141, https://doi.org/10.1017/S0020268100013019, 1975.
Kitoh, A. and Arakawa, O.: Reduction in the east–west contrast in water budget over the Tibetan Plateau under a future climate, Hydrol. Res. Lett., 10, 113–118, https://doi.org/10.3178/hrl.10.113, 2016.
Kobayashi, S., Ota, Y., Harada, Y., Ebita, A., Moriya, M., Onoda, H., Onogi, K., Kamahori, H., Kobayashi, C., Endo, H., Miyaoka, K., and Takahashi, K.: The JRA-55 Reanalysis: General Specifications and Basic Characteristics, J. Meteorolog. Soc. Jpn., 93, 5–48, https://doi.org/10.2151/jmsj.2015-001, 2015.
Koster, R. D., Suarez, M. J., Ducharne, A., Stieglitz, M., and Kumar, P.: A catchment-based approach to modeling land surface processes in a general circulation model: 1. Model structure, J. Geophys. Res.-Atmos., 105, 24809–24822, https://doi.org/10.1029/2000JD900327, 2000.
Lehner, B., Verdin, K., and Jarvis, A.: New Global Hydrography Derived From Spaceborne Elevation Data, EoS Transactions, 89, 93–94, https://doi.org/10.1029/2008EO100001, 2008.
Lei, Y., Pan, J., Xiong, C., Jiang, L., and Shi, J.: Snow depth and snow cover over the Tibetan Plateau observed from space in against ERA5: matters of scale, Clim. Dynam., 60, 1523–1541, https://doi.org/10.1007/s00382-022-06376-0, 2023.
Li, B., Beaudoing, H., and Rodell, M.: NASA/GSFC/HSL GLDAS Catchment Land Surface Model L4 3 hourly 1.0 × 1.0 degree V2.1, Greenbelt, Maryland, USA, Goddard Earth Sciences Data and Information Services Center (GES DISC) [data set], https://doi.org/10.5067/VCO8OCV72XO0, 2020.
Li, Q., Yang, T., and Li, L.: Evaluation of snow depth and snow cover represented by multiple datasets over the Tianshan Mountains: Remote sensing, reanalysis, and simulation, Int. J. Climatol., 42, 4223–4239, https://doi.org/10.1002/joc.7459, 2022.
Liang, X., Jiang, L., Pan, Y., Shi, C., Liu, Z., and Zhou, Z.: A 10-Yr global land surface reanalysis interim dataset (CRA-Interim/Land): Implementation and preliminary evaluation, J. Meteorolog. Res., 34, 101–116, https://doi.org/10.1007/s13351-020-9083-0, 2020.
Lin, H. and Wu, Z.: Contribution of the autumn Tibetan Plateau snow cover to seasonal prediction of North American winter temperature, J. Climate, 24, 2801–2813, https://doi.org/10.1175/2010JCLI3889.1, 2011.
Liu, Y., Fang, Y., and Margulis, S. A.: Spatiotemporal distribution of seasonal snow water equivalent in High Mountain Asia from an 18-year Landsat–MODIS era snow reanalysis dataset, The Cryosphere, 15, 5261–5280, https://doi.org/10.5194/tc-15-5261-2021, 2021a.
Liu, Y., Fang, Y., and Margulis, S. A.: High Mountain Asia UCLA Daily Snow Reanalysis, Version 1, Boulder, Colorado USA, NASA National Snow and Ice Data Center Distributed Active Archive Center [data set], https://doi.org/10.5067/HNAUGJQXSCVU, 2021b.
Liu, Y., Fang, Y., Li, D., and Margulis, S. A.: How well do global snow products characterize snow storage in High Mountain Asia?, Geophys. Res. Lett., 49, e2022GL100082, https://doi.org/10.1029/2022GL100082, 2022.
Liu, Z., Jiang, L., Shi, C., Zhang, T., Zhou, Z., Liao, J., Yao, S., Liu, J., Wang, M., Wang, H., Liang, X., Zhang, Z., Yao, Y., Zhu, T., Chen, Z., Xu, W., Cao, L., Jiang, H., and Hu, K.: CRA-40/Atmosphere – the first-generation Chinese atmospheric reanalysis (1979–2018): System description and performance evaluation, J. Meteorol. Res., 37, 1–19, https://doi.org/10.1007/s13351-023-2086-x, 2023.
Luo, J., Chen, H., and Zhou, B.: Comparison of Snowfall Variations over China Identified from Different Snowfall/Rainfall Discrimination Methods, J. Meteorol. Res., 34, 1114–1128, https://doi.org/10.1007/s13351-020-0004-z, 2020.
Lyu, M., Wen, M., and Wu, Z.: Possible contribution of the inter-annual Tibetan Plateau snow cover variation to the Madden-Julian oscillation convection variability, Int. J. Climatol., 38, 3787–3800, https://doi.org/10.1002/joc.5533, 2018.
Ma, Y., Ma, W., Zhong, L., Hu, Z., Li, M., Zhu, Z., Han, C., Wang, B., and Liu, X.: Monitoring and Modeling the Tibetan Plateau's climate system and its impact on East Asia, Sci. Rep., 7, 44574, https://doi.org/10.1038/srep44574, 2017.
Mann, H. B.: Nonparametric tests against trend, Econometrica, 13, 245–259, https://doi.org/10.2307/1907187, 1945.
Meng, J., Yang, R., Wei, H., Ek, M., Gayno, G., Xie, P., and Mitchell, K.: The land surface analysis in the NCEP climate forecast system reanalysis, J. Hydrometeorol., 13, 1621–1630, https://doi.org/10.1175/JHM-D-11-090.1, 2012.
Mortimer, C., Mudryk, L., Derksen, C., Luojus, K., Brown, R., Kelly, R., and Tedesco, M.: Evaluation of long-term Northern Hemisphere snow water equivalent products, The Cryosphere, 14, 1579–1594, https://doi.org/10.5194/tc-14-1579-2020, 2020.
Mudryk, L. R., Derksen, C., Kushner, P. J., and Brown, R.: Characterization of Northern Hemisphere snow water equivalent datasets, 1981–2010, J. Climate, 28, 8037–8051, https://doi.org/10.1175/JCLI-D-15-0229.1, 2015.
Muñoz Sabater, J.: ERA5-Land hourly data from 1950 to present, Copernicus Climate Change Service (C3S) Climate Data Store (CDS) [data set], https://doi.org/10.24381/cds.e2161bac, 2019.
Muñoz-Sabater, J., Dutra, E., Agustí-Panareda, A., Albergel, C., Arduini, G., Balsamo, G., Boussetta, S., Choulga, M., Harrigan, S., Hersbach, H., Martens, B., Miralles, D. G., Piles, M., Rodríguez-Fernández, N. J., Zsoter, E., Buontempo, C., and Thépaut, J.-N.: ERA5-Land: a state-of-the-art global reanalysis dataset for land applications, Earth Syst. Sci. Data, 13, 4349–4383, https://doi.org/10.5194/essd-13-4349-2021, 2021.
Onogi, K., Tsutsui, J., Koide, H., Sakamoto, M., Kobayashi, S., Hatsushika, H., Matsumoto, T., Yamazaki, N., Kamahori, H., Takahashi, K., Kadokura, S., Wada, K., Kato, K., Oyama, R., Ose, T., Mannoji, N., and Taira, R.: The JRA-25 reanalysis, J. Meteorolog. Soc. Jpn., 85, 369–432, https://doi.org/10.2151/jmsj.85.369, 2007.
Orsolini, Y., Wegmann, M., Dutra, E., Liu, B., Balsamo, G., Yang, K., de Rosnay, P., Zhu, C., Wang, W., Senan, R., and Arduini, G.: Evaluation of snow depth and snow cover over the Tibetan Plateau in global reanalyses using in situ and satellite remote sensing observations, The Cryosphere, 13, 2221–2239, https://doi.org/10.5194/tc-13-2221-2019, 2019.
Painter, T. H., Rittger, K., McKenzie, C., Slaughter, P., Davis, R. E., and Dozier, J.: Retrieval of subpixel snow covered area, grain size, and albedo from MODIS, Remote Sens. Environ., 113, 868–879, https://doi.org/10.1016/j.rse.2009.01.001, 2009.
Pu, W., Cui, J., Wu, D., Shi, T., Chen, Y., Xing, Y., Zhou, Y., and Wang, X.: Unprecedented snow darkening and melting in New Zealand due to 2019–2020 Australian wildfires, Fundam. Res., 1, 224–231, https://doi.org/10.1016/j.fmre.2021.04.001, 2021.
Qiu, J.: China: The third pole, Nature, 454, 393–396, https://doi.org/10.1038/454393a, 2008.
Reichle, R. H., Draper, C. S., Liu, Q., Girotto, M., Mahanama, S. P. P., Koster, R. D., and Lannoy, G. J. M. D.: Assessment of MERRA-2 Land Surface Hydrology Estimates, J. Climate, 30, 2937–2960, https://doi.org/10.1175/JCLI-D-16-0720.1, 2017.
Rodell, M., Houser, P. R., Jambor, U., Gottschalck, J., Mitchell, K., Meng, C.-J., Arsenault, K., Cosgrove, B., Radakovich, J., Bosilovich, M., Entin, J. K., Walker, J. P., Lohmann, D., and Toll, D.: The global land data assimilation system, B. Am. Meteorol. Soc., 85, 381–394, https://doi.org/10.1175/BAMS-85-3-381, 2004.
Saha, S., Moorthi, S., Pan, H.-L., Wu, X., Wang, J., Nadiga, S., Tripp, P., Kistler, R., Woollen, J., Behringer, D., Liu, H., Stokes, D., Grumbine, R., Gayno, G., Wang, J., Hou, Y.-T., Chuang, H., Juang, H.-M. H., Sela, J., Iredell, M., Treadon, R., Kleist, D., Van Delst, P., Keyser, D., Derber, J., Ek, M., Meng, J., Wei, H., Yang, R., Lord, S., Van Den Dool, H., Kumar, A., Wang, W., Long, C., Chelliah, M., Xue, Y., Huang, B., Schemm, J.-K., Ebisuzaki, W., Lin, R., Xie, P., Chen, M., Zhou, S., Higgins, W., Zou, C.-Z., Liu, Q., Chen, Y., Han, Y., Cucurull, L., Reynolds, R. W., Rutledge, G., and Goldberg, M.: The NCEP climate forecast system reanalysis, B. Am. Meteorol. Soc., 91, 1015–1058, https://doi.org/10.1175/2010BAMS3001.1, 2010a.
Saha, S., Moorthi, S., Pan, H., Wu, X., Wang, J., Nadiga, S., Tripp, P., Kistler, R., Woollen, J., Behringer, D., Liu, H., Stokes, D., Grumbine, R., Gayno, G., Wang, J., Hou, Y., Chuang, H., Juang, H. H., Sela, J., Iredell, M., Treadon, R., Kleist, D., Van Delst, P., Keyser, D., Derber, J., Ek, M., Meng, J., Wei, H., Yang, R., Lord, S., van den Dool, H., Kumar, A., Wang, W., Long, C., Chelliah, M., Xue, Y., Huang, B., Schemm, J., Ebisuzaki, W., Lin, R., Xie, P., Chen, M., Zhou, S., Higgins, W., Zou, C., Liu, Q., Chen, Y., Han, Y., Cucurull, L., Reynolds, R. W., Rutledge, G., and Goldberg, M.: NCEP Climate Forecast System Reanalysis (CFSR) 6-hourly Products, January 1979 to December 2010, Research Data Archive at the National Center for Atmospheric Research, Computational and Information Systems Laboratory [data set], https://doi.org/10.5065/D69K487J, 2010b.
Saha, S., Moorthi, S., Wu, X., Wang, J., Nadiga, S., Tripp, P., Behringer, D., Hou, Y., Chuang, H., Iredell, M., Ek, M., Meng, J., Yang, R., Mendez, M. P., van den Dool, H., Zhang, Q., Wang, W., Chen, M., and Becker, E.: NCEP Climate Forecast System Version 2 (CFSv2) 6-hourly Products, Research Data Archive at the National Center for Atmospheric Research, Computational and Information Systems Laboratory [data set], https://doi.org/10.5065/D61C1TXF, 2011.
Saha, S., Moorthi, S., Wu, X., Wang, J., Nadiga, S., Tripp, P., Behringer, D., Hou, Y.-T., Chuang, H., Iredell, M., Ek, M., Meng, J., Yang, R., Mendez, M. P., Van Den Dool, H., Zhang, Q., Wang, W., Chen, M., and Becker, E.: The NCEP climate forecast system version 2, J. Climate, 27, 2185–2208, https://doi.org/10.1175/JCLI-D-12-00823.1, 2014.
Sato, N., Sellers, P. J., Randall, D. A., Schneider, E. K., Shukla, J., Kinter, J. L., Hou, Y.-T., and Albertazzi, E.: Effects of implementing the Simple Biosphere Model in a general circulation model, J. Atmos. Sci., 46, 2757–2782, https://doi.org/10.1175/1520-0469(1989)046<2757:EOITSB>2.0.CO;2, 1989.
Sellers, P. J., Mintz, Y., Sud, Y. C., and Dalcher, A.: A Simple Biosphere Model (SIB) for use within general circulation models, J. Atmos. Sci., 43, 505–531, https://doi.org/10.1175/1520-0469(1986)043<0505:ASBMFU>2.0.CO;2, 1986.
Serquet, G., Marty, C., Dulex, J.-P., and Rebetez, M.: Seasonal trends and temperature dependence of the snowfall/precipitation-day ratio in Switzerland, Geophys. Res. Lett., 38, L07703, https://doi.org/10.1029/2011GL046976, 2011.
Sheffield, J., Goteti, G., and Wood, E. F.: Development of a 50-Year High-Resolution Global Dataset of Meteorological Forcings for Land Surface Modeling, J. Climate, 19, 3088–3111, https://doi.org/10.1175/JCLI3790.1, 2006.
Stillinger, T., Rittger, K., Raleigh, M. S., Michell, A., Davis, R. E., and Bair, E. H.: Landsat, MODIS, and VIIRS snow cover mapping algorithm performance as validated by airborne lidar datasets, The Cryosphere, 17, 567–590, https://doi.org/10.5194/tc-17-567-2023, 2023.
Sun, C., Walker, J. P., and Houser, P. R.: A methodology for snow data assimilation in a land surface model, J. Geophys. Res.-Atmos., 109, 2003JD003765, https://doi.org/10.1029/2003JD003765, 2004.
Sun, S. and Xue, Y.: Implementing a new snow scheme in Simplified Simple Biosphere Model, Adv. Atmos. Sci., 18, 335–354, https://doi.org/10.1007/BF02919314, 2001.
Sun, S., Shi, C., Liang, X., Zhang, S., Gu, J., Han, S., Jiang, H., Xu, B., Yu, Q., Liang, Y., and Deng, S.: The Evaluation of Snow Depth Simulated by Different Land Surface Models in China Based on Station Observations, Sustainability, 15, 11284, https://doi.org/10.3390/su151411284, 2023.
Thackeray, C. W., Fletcher, C. G., Mudryk, L. R., and Derksen, C.: Quantifying the Uncertainty in Historical and Future Simulations of Northern Hemisphere Spring Snow Cover, J. Climate, 29, 8647–8663, https://doi.org/10.1175/JCLI-D-16-0341.1, 2016.
Vorkauf, M., Marty, C., Kahmen, A., and Hiltbrunner, E.: Past and future snowmelt trends in the Swiss Alps: the role of temperature and snowpack, Clim. Change, 165, 44, https://doi.org/10.1007/s10584-021-03027-x, 2021.
Wang, A. and Zeng, X.: Evaluation of multireanalysis products with in situ observations over the Tibetan Plateau, J. Geophys. Res.-Atmos., 117, D05102, https://doi.org/10.1029/2011JD016553, 2012.
Wegmann, M., Orsolini, Y., Dutra, E., Bulygina, O., Sterin, A., and Brönnimann, S.: Eurasian snow depth in long-term climate reanalyses, The Cryosphere, 11, 923–935, https://doi.org/10.5194/tc-11-923-2017, 2017.
Xie, P. and Arkin, P. A.: Global precipitation: A 17-year monthly analysis based on gauge observations, satellite estimates, and numerical model Outputs, B. Am. Meteorol. Soc., 78, 2539–2558, https://doi.org/10.1175/1520-0477(1997)078<2539:GPAYMA>2.0.CO;2, 1997.
Xie, P., Chen, M., Yang, S., Yatagai, A., Hayasaka, T., Fukushima, Y., and Liu, C.: A gauge-based analysis of daily precipitation over East Asia, J. Hydrometeorol., 8, 607–626, https://doi.org/10.1175/JHM583.1, 2007.
Xu, W., Ma, L., Ma, M., Zhang, H., and Yuan, W.: Spatial–temporal variability of snow cover and depth in the Qinghai–Tibetan Plateau, J. Climate, 30, 1521–1533, https://doi.org/10.1175/JCLI-D-15-0732.1, 2017.
Xu, X., Lu, C., Shi, X., and Gao, S.: World water tower: An atmospheric perspective, Geophys. Res. Lett., 35, L20815, https://doi.org/10.1029/2008GL035867, 2008.
Xue, Y., Sun, S., Kahan, D. S., and Jiao, Y.: Impact of parameterizations in snow physics and interface processes on the simulation of snow cover and runoff at several cold region sites, J. Geophys. Res.-Atmos., 108, 2002JD003174, https://doi.org/10.1029/2002JD003174, 2003.
Yang, D., Ding, M., Dou, T., Han, W., Liu, W., Zhang, J., Du, Z., and Xiao, C.: On the Differences in Precipitation Type Between the Arctic, Antarctica and Tibetan Plateau, Front. Earth Sci., 9, 607487, https://doi.org/10.3389/feart.2021.607487, 2021.
Yang, K., Jiang, Y., Tang, W., He, J., Shao, C., Zhou, X., Lu, H., Chen, Y., Li, X., and Shi, J.: A high-resolution near-surface meteorological forcing dataset for the Third Pole region (TPMFD, 1979–2022), National Tibetan Plateau/Third Pole Environment Data Center [data set], https://doi.org/10.11888/Atmos.tpdc.300398, 2023.
Yang, M., Wang, X., Pang, G., Wan, G., and Liu, Z.: The Tibetan Plateau cryosphere: Observations and model simulations for current status and recent changes, Earth Sci. Rev., 190, 353–369, https://doi.org/10.1016/j.earscirev.2018.12.018, 2019.
Yao, T., Thompson, L., Yang, W., Yu, W., Gao, Y., Guo, X., Yang, X., Duan, K., Zhao, H., Xu, B., Pu, J., Lu, A., Xiang, Y., Kattel, D. B., and Joswiak, D.: Different glacier status with atmospheric circulations in Tibetan Plateau and surroundings, Nat. Clim. Change, 2, 663–667, https://doi.org/10.1038/nclimate1580, 2012.
Yao, T., Xue, Y., Chen, D., Chen, F., Thompson, L., Cui, P., Koike, T., Lau, W. K.-M., Lettenmaier, D., Mosbrugger, V., Zhang, R., Xu, B., Dozier, J., Gillespie, T., Gu, Y., Kang, S., Piao, S., Sugimoto, S., Ueno, K., Wang, L., Wang, W., Zhang, F., Sheng, Y., Guo, W., Ailikun, Yang, X., Ma, Y., Shen, S. S. P., Su, Z., Chen, F., Liang, S., Liu, Y., Singh, V. P., Yang, K., Yang, D., Zhao, X., Qian, Y., Zhang, Y., and Li, Q.: Recent Third Pole's Rapid Warming Accompanies Cryospheric Melt and Water Cycle Intensification and Interactions between Monsoon and Environment: Multidisciplinary Approach with Observations, Modeling, and Analysis, B. Am. Meteorol. Soc., 100, 423–444, https://doi.org/10.1175/BAMS-D-17-0057.1, 2019.
You, Q., Wu, T., Shen, L., Pepin, N., Zhang, L., Jiang, Z., Wu, Z., Kang, S., and AghaKouchak, A.: Review of snow cover variation over the Tibetan Plateau and its influence on the broad climate system, Earth Sci. Rev., 201, 103043, https://doi.org/10.1016/j.earscirev.2019.103043, 2020a.
You, Q., Wu, F., Wang, H., Jiang, Z., Pepin, N., and Kang, S.: Projected changes in snow water equivalent over the Tibetan Plateau under global warming of 1.5 ° and 2 °C, J. Climate, 33, 5141–5154, https://doi.org/10.1175/JCLI-D-19-0719.1, 2020b.
Yu, L., Zhang, S., Bu, K., Yang, J., Yan, F., and Chang, L.: A review on snow data sets, Scientia Geographica Sinica, 33, 878–883, 2013.
Zhang, F., Zhang, H., Hagen, S. C., Ye, M., Wang, D., Gui, D., Zeng, C., Tian, L., and Liu, J.: Snow cover and runoff modelling in a high mountain catchment with scarce data: effects of temperature and precipitation parameters, Hydrol. Process., 29, 52–65, https://doi.org/10.1002/hyp.10125, 2015.
Zhang, H., Zhang, F., Che, T., Yan, W., and Ye, M.: Investigating the ability of multiple reanalysis datasets to simulate snow depth variability over mainland China from 1981 to 2018, J. Climate, 34, 9957–9972, https://doi.org/10.1175/JCLI-D-20-0804.1, 2021.
Zhang, H., Immerzeel, W. W., Zhang, F., De Kok, R. J., Chen, D., and Yan, W.: Snow cover persistence reverses the altitudinal patterns of warming above and below 5000 m on the Tibetan Plateau, Sci. Total Environ., 803, 149889, https://doi.org/10.1016/j.scitotenv.2021.149889, 2022.
Zhang, T.: Influence of the seasonal snow cover on the ground thermal regime: An overview, Rev. Geophys., 43, RG4002, https://doi.org/10.1029/2004RG000157, 2005.
Zhou, X., Yang, K., Ouyang, L., Wang, Y., Jiang, Y., Li, X., Chen, D., and Prein, A.: Added value of kilometer-scale modeling over the third pole region: a CORDEX-CPTP pilot study, Clim. Dynam., 57, 1673–1687, https://doi.org/10.1007/s00382-021-05653-8, 2021.
Zhu, X., Wu, T., Li, R., Wang, S., Hu, G., Wang, W., Qin, Y., and Yang, S.: Characteristics of the ratios of snow, rain and sleet to precipitation on the Qinghai-Tibet Plateau during 1961–2014, Quat. Int., 444, 137–150, https://doi.org/10.1016/j.quaint.2016.07.030, 2017.