the Creative Commons Attribution 4.0 License.
the Creative Commons Attribution 4.0 License.
 | 05 Sep 2024
Scientific history, sampling approach, and physical characterization of the Camp Century subglacial material, a rare archive from beneath the Greenland Ice Sheet
Andrew J. Christ
Catherine M. Collins
Halley M. Mastro
Juliana Souza
Pierre-Henri Blard
Stefanie Brachfeld
Zoe R. Courville
Tammy M. Rittenour
Elizabeth K. Thomas
Jean-Louis Tison
François Fripiat
Basal materials in ice cores hold information about paleoclimate conditions, glacial processes, and the timing of past ice-free intervals, all of which aid understanding of ice sheet stability and its contribution to sea level rise in a warming climate. Only a few cores have been drilled through ice sheets into the underlying sediment and bedrock, producing limited material for analysis. The last of three Camp Century ice cores, which the U.S. Army collected in northwestern Greenland from 1963–1966 CE, recovered about 3.5 m of subglacial material, including ice and sediment. Here, we document the scientific history of the Camp Century subglacial material. We present our recent core-cutting, sub-sampling, and processing methodology and results for this unique archive.
In 1972 CE, curators at the Buffalo, New York, Ice Core Laboratory cut the original core sections into 32 segments that were each about 10 cm long. Since then, two segments were lost and are unaccounted for, two were thawed, and two were cut as pilot samples in 2019 CE. Except for the two thawed segments, the rest of the extant core has remained frozen since collection. In 2021 CE, we documented, described, and then cut each of the remaining frozen archived segments (n=26). We saved an archival half and cut the working half into eight oriented sub-samples under controlled temperature and light conditions for physical, geochemical, isotopic, sedimentological, magnetic, and biological analyses. Our approach was designed to maximize sample usage for multiproxy analysis, minimize contamination, and preserve archive material for future analyses of this legacy subglacial material.
Grain size, bulk density, sedimentary features, magnetic susceptibility, and ice content, as well as pore ice pH and conductivity, suggest that the basal sediment contains five stratigraphic units. We interpret these stratigraphic units as representing different depositional environments in subglacial or ice-free conditions: from bottom to top, a diamicton with subhorizontal ice lenses (Unit 1), vertically fractured ice with dispersed fine-grained sediments (<20 % in mass) (Unit 2), a normally graded bed of pebbles to very fine sand in an icy matrix (Unit 3), bedded very fine to fine sand (Unit 4), and stratified medium to coarse sand (Unit 5). Plant macrofossils are present in all samples and are most abundant in Units 3 and 4; insect remains are present in some samples (Units 1, 3, and 5).
Our approach provides a working template for future studies of ice core basal materials because it includes intentional planning of core sub-sampling, processing methodologies, and archiving strategies to optimize the collection of paleoclimate, glacial process, geochemical, geochronological, and sediment properties from archives of limited size. Our work benefited from a carefully curated and preserved archive, allowing the application of analytical techniques not available in 1966 CE. Preserving uncontaminated core material for future analyses that use currently unavailable tools and techniques is an important consideration for rare archive materials such as these from Camp Century.
- Article
(13425 KB) - Full-text XML
-
Supplement
(506 KB) - BibTeX
- EndNote


Ice cores are paleoclimate archives that offer valuable insights into past atmospheric composition and temperature via the analysis of trapped air and physical and chemical properties of ice. Ice cores typically recover clean glacial ice (commonly called “clear ice”), and only a few ice cores have reached the ice–bed interface to recover basal materials such as sediment-laden ice (sometimes referred to as “silty ice” or “basal ice”), subglacial sediment, and subglacial bedrock (Talalay, 2013).
Isotopic, mineralogic, and geochemical analyses of basal materials from ice cores yield important information about basal ice sheet processes (Goossens et al., 2016; Souchez et al., 2000; Herron and Langway, 1982; Gow and Meese, 1996; Verbeke et al., 2002; Tison et al., 1994), subglacial geology and sediment provenance (Blard et al., 2023; Fountain et al., 1981; Licht and Hemming, 2017; Weis et al., 1997), the timing and duration of ice-free intervals or grounding-line retreat (Schaefer et al., 2016; Venturelli et al., 2020), and the ecosystems that occupied formerly ice-free landscapes now buried beneath the ice (Christ et al., 2021; Tison et al., 1998; Souchez et al., 2006; Willerslev et al., 2007). However, the amount of material retrieved from beneath ice sheets is minimal; sometimes only tens of grams of rock or sediment are available for analysis (Talalay, 2013). Given the specific requirements for sample mass, grain size, and handling needed to enable a wide variety of analyses, strategic sampling and sample distribution protocols are critical to optimize results obtained from such limited quantities of archive material.
The United States Army drilled three ice cores between 1960 and 1966 CE in northwestern Greenland at Camp Century. The last core (1963–1966 CE) was the first to reach the bed of any ice sheet and was also the first to recover a core of subglacial material. Until 2023 CE and the start of GreenDrill coring, the Camp Century core contained the longest subglacial sedimentary sequence recovered from Greenland (Hansen and Langway, 1966) (Figs. 1a, 2a). Because the subglacial material was not extensively sampled at the time of collection and has since been stored frozen, we were able to design a detailed, intentional sub-sampling and analysis plan for multiple geochemical, physical, magnetic, biological, and isotopic proxies.
The purpose of this paper is four-fold. First, we compile and summarize the historical record of the collection, handling, and prior analyses of the Camp Century subglacial material to provide a clear context for ongoing and future analyses (Sect. 2). Second, we detail and explain our approach to cutting, sub-sampling, and distributing this unique sediment archive to optimize sample usage for multiproxy analysis, avoid contamination, and preserve material for future studies (Sect. 3). Third, we present our documentation of the archive and the data collected during the sub-sampling and initial processing of the sediment, which allow us to describe the stratigraphy of the Camp Century subglacial material (Sect. 4). Fourth, we provide initial interpretations of the depositional history of the material and provide lessons learned for handling, sub-sampling, and storing rare archives of ice core basal materials (Sect. 5).
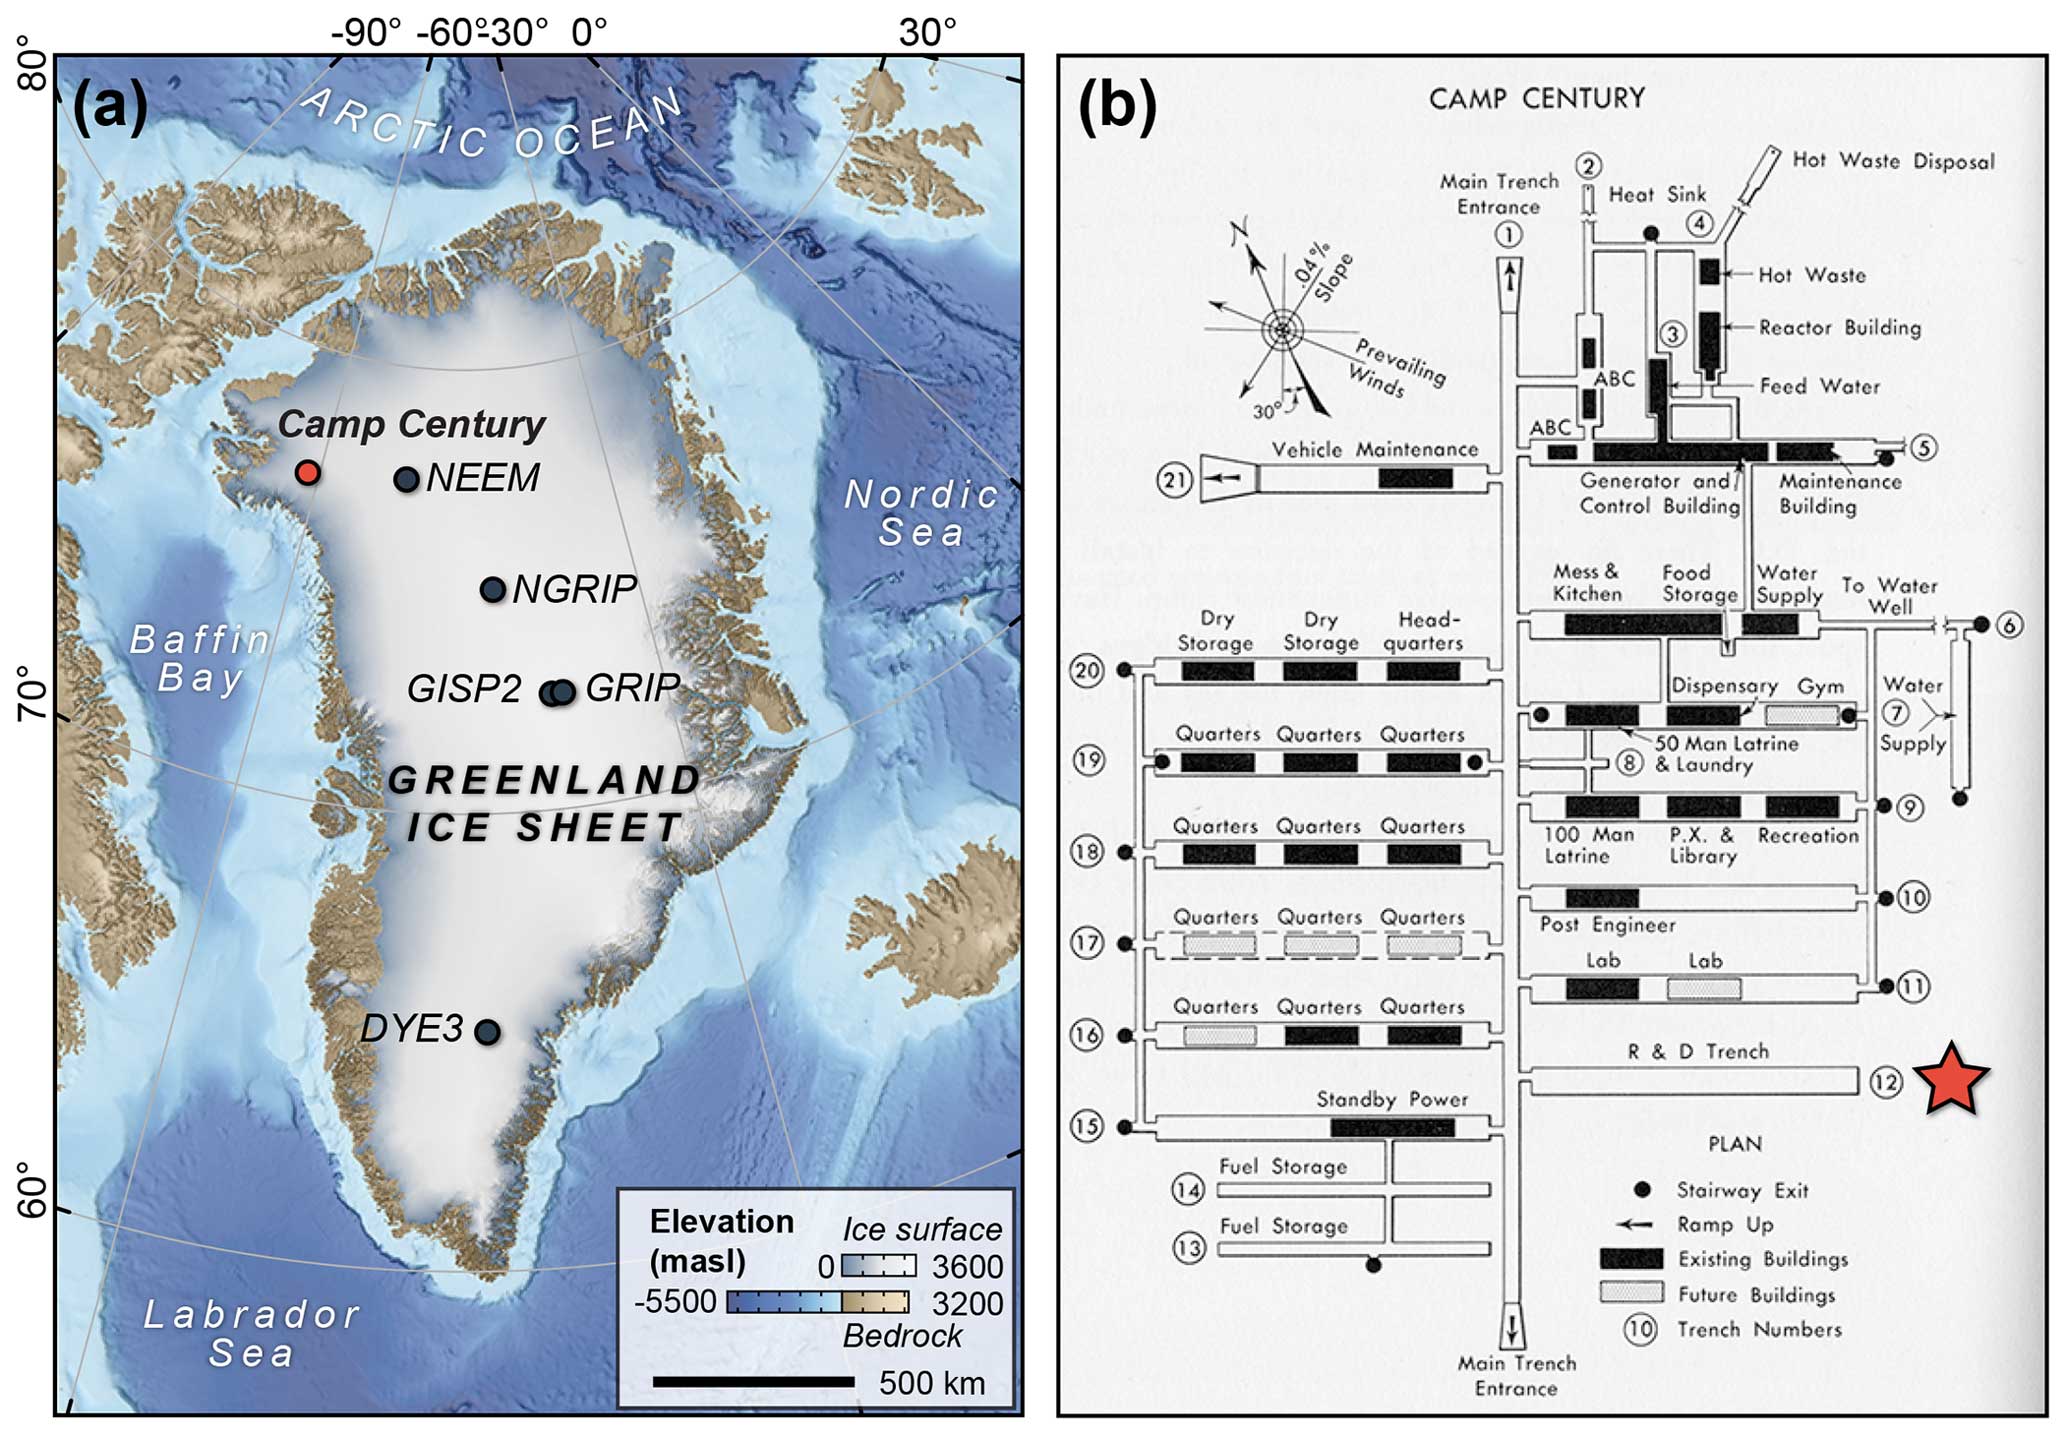
Figure 1Location and context of the Camp Century core. (a) Overview map of Greenland showing the locations of Camp Century (red circle) and other deep-ice cores (dark circles). (b) Schematic layout of the Camp Century installation with the location of the drill trench (marked with a red star) (Daugherty, 1963).
In the 1950s (CE), the US military was concerned that the Arctic was warming (Thomis, 1955), although the warming then turned out to be short-lived. Such warming had implications for the ongoing militarization of the Arctic during the Cold War, but little was then known about past changes in Arctic climate (Doel et al., 2017). To address this knowledge gap, Henri Bader and James Bender, two civilian scientists from the Snow, Ice, and Permafrost Research Establishment (SIPRE) in the U.S. Army Corps of Engineers, lobbied for drilling deep cores into and through the Greenland Ice Sheet (Bader, 1962). Bader had overseen the drilling of the first US ice core in Alaska from the Taku Glacier in 1950 CE, and Bender had suggested that bubbles trapped in glacial ice preserved bits of ancient atmosphere, the analysis of which could resolve questions about fossil fuel combustion and its relation to climate change (Anonymous, 1959). Along with Chester Langway, who at the time was a junior researcher at SIPRE, they oversaw drilling of ice cores into the Greenland Ice Sheet at Site 2 (about 100 km northeast and up-ice from Camp Century) in 1956 and 1957 CE. Although recovery was poor at a US military camp called Site 2, and the cores were only a few hundred meters long, they made advances in drilling technology.
Analyses on small continuous sections of the 1957 Site 2 ice core demonstrated that the ice preserved records of past climate, including annual variations in the stable water isotopes (Epstein and Sharp, 1959; Langway, 1958). The full potential of extracting paleoclimatic information from a deep core was revealed when Langway joined forces with Willi Dansgaard in 1967 CE to perform systematic stratigraphic water isotope analysis of the Camp Century clear-ice core. Dansgaard, who had been considering the precipitation vs. temperature relationship in stable water isotopes since 1953 CE (Dansgaard, 1953, 1954) had the only lab in the world at that time capable of analyzing thousands of samples in a timely fashion. The first 100 000-year-long paleoclimatic record (based on stable water isotopes) was published in 1969 CE (Dansgaard et al., 1969). Later, Werner Berner, who was provided Camp Century ice by Langway, extracted gases from bubbles in the ice and quantified their concentration (Berner, 1978).
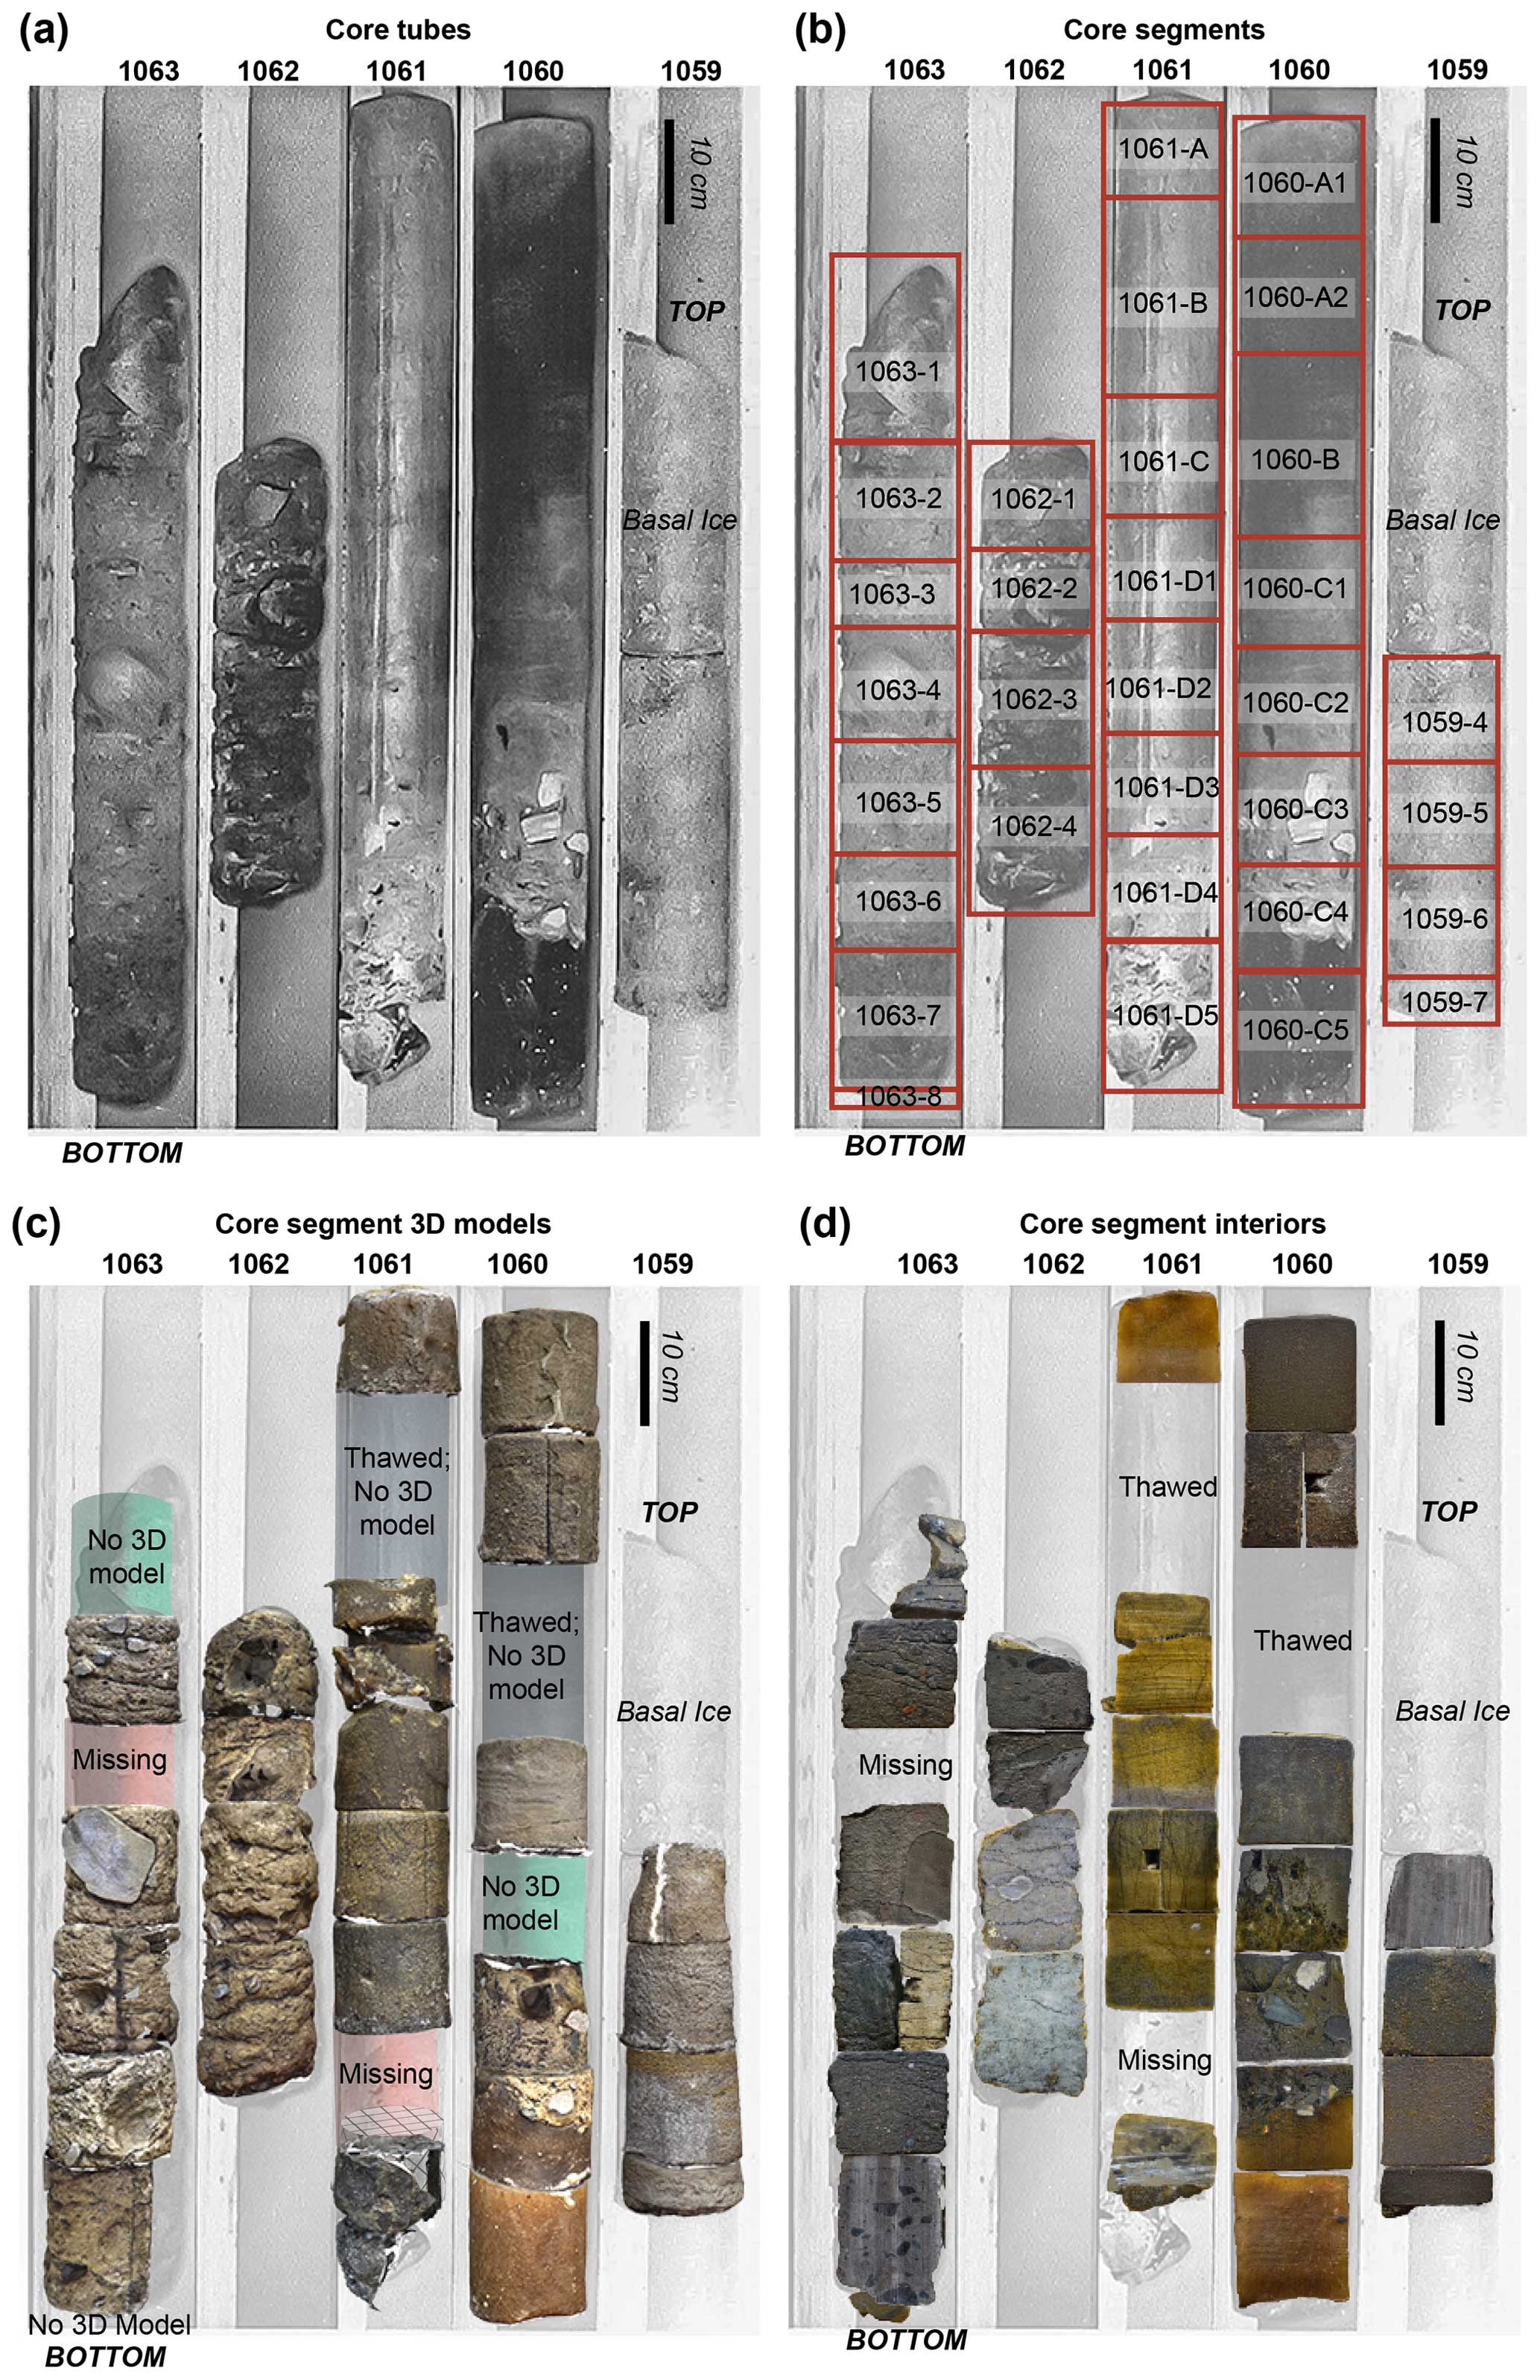
Figure 2Photographs of the Camp Century subglacial material core. (a) Historic photograph of the Camp Century subglacial material core segments (by tube number) prior to initial cutting in October 1972 CE (Fountain et al., 1981). (b) Photograph in A with core piece (from cutting in 1972 CE) and identifiers overlain. (c) Two-dimensional rendering of photogrammetric 3D models of the segments rearranged into their original position. The 3D models were constructed from new photographs of the core (2021 CE). Shaded cylinders: green indicates no 3D model available, red indicates a missing sample, blue indicates a thawed sample. (d) New core photographs (2021 CE) showing interior cut faces of the archived halves of each piece. Note that the photos of interior cut faces (in d) are not all oriented in the same manner as the original core (a and b). Scale bar is given in upper right of each panel.
Camp Century was a U.S. Army base carved into the surface of the Greenland Ice Sheet. It was built as part of the American militarization of the Arctic (Clark, 1966). The base was ∼ 200 km inland from the ice margin in northwestern Greenland at 1890 m a.s.l. (meters above sea level) (Fig. 1a). Construction of the camp began in June 1959 CE and was completed in October 1960 CE. Camp Century was constructed in snow and firn using cut-and-cover methods and could house up to 200 people in heated barracks nestled within the snow tunnels. From 1961 CE until the Northern Hemisphere summer in 1963 CE, the base was occupied year-round – powered and heated by a portable nuclear reactor that was removed in 1964 CE (Corliss, 1968). The US military operated Camp Century with a science-driven engineering program to assess novel and applied technologies that allowed people to live and work in extreme environments. Much of this scientific effort was applied and directed toward better understanding snow compaction and firn deformation, both on the surface of the ice sheet and in the tunnels of Camp Century, which deformed at rates of 0.1 to 1.0 m yr−1 (Abele, 1964).
A drilling trench was included in the plans for the base (Fig. 1b). Personnel from SIPRE, the predecessor of the Cold Regions Research and Engineering Laboratory (CRREL), conducted research on the physical properties of ice and snow and led collection of the Camp Century ice core (Fig. 3a). A new thermal ice drill was designed for Camp Century and deployed from 1960 to 1964 CE, but it was plagued with problems related to the removal and collection of meltwater from the borehole (Bader, 1962; Hansen, 1994). The thermal drill extracted three ice cores: between 1960 and 1961 CE the first hole recovered 186 m, in 1962 CE the second hole recovered 238 m, and in 1963 CE the third hole recovered 264 m. The last hole was then filled with a fluid mixture of 12 % trichloroethylene and 88 % Arctic diesel fuel when Camp Century closed for the winter and drilling halted (Ragone and Finelli, 1972). In 1964 CE, the fluid-filled third hole was extended to a depth of 535 m. Starting in 1965 CE, an electromechanical drill that used ethylene glycol to melt ice chips in addition to the drilling fluid (Langway and Hansen, 1970; Ueda and Garfield, 1968) advanced more rapidly and extended the third core to 1002 m. In 1966 CE, drilling resumed with the electromechanical drill. Silty ice was encountered near the bottom of the hole, and coring was extended to the bed of the ice sheet and into the subglacial material below.
The subglacial material recovered in July 1966 CE is what we describe in this paper. As material came out of the hole, it was placed into 1.5 m aluminized tubes. These tube numbers are used as primary sample identifiers. The ice–sediment interface is in core tube 1059; the base of the Camp Century core is in tube 1063. The original drill log (Table 2 and Fig. 4) from 2 July 1966 CE, describes the subglacial sediment as follows:
[Core tube 1059] 30 cm from top silty ice stops and frozen sand begins. [Core tube 1060] Appears to be a column of frozen sand with some rocks as large as 5 cm in diameter. Permacrete down to 80 cm then a silty ice lens for rest of core. Red, grey, maroon, and green rocks as large as 5 cm in diameter. [Core tube 1061] Silty ice lens down to 0.80 m. Sand and large rocks after 0.80 m. [Core tube 1062] Large rocks and sand, rocks, and sand. [Core tube 1063] Sand and large rocks (17 cm).
There are discrepancies in the reported drilling depths and thicknesses of clear ice, silty ice, and subglacial sediment between the original core log, the early literature, and later studies of the Camp Century basal materials (Table 1). The core tube log appears to have been amended with multiple, different entries (in differing pencil weights and ink colors) for the depth of the core below the surface (Table 2 and Fig. 4). While the reported “depth below the surface” of the sub-ice material equates to 4.5 m of penetration (Table 2), the sum of the reported lengths of sediment recovered (on the drilling log) in each core tube is 3.55 m. Thus, it is possible that core recovery was incomplete. However, the original core logs (both tabular and graphical) have notes that read “These depths are in error”. Given the rigidity of the frozen material, core compaction is unlikely. Drilling depths were not simple to discern accurately as coring was done by wireline and not using rods. Additionally, there are several subtraction errors found on the hand-written sheet (Fig. 4).
We conclude that it is not possible with the information available in 2024 CE to figure out whether recovery of the sub-ice material was complete or not. Furthermore, the depths and ice thicknesses documented in the core log are slightly different to those reported by Hansen and Langway (1966):
… at a depth of 1,370.5 meters, ice containing silt bands and small pebbles was encountered. On July 4, after drilling through 16.9 meters of this material, the interface at the bottom of the ice cap was reached at a depth of 1,387.4 meters. The bottom material is frozen till; 3.55 meters of this material was recovered. The total depth of the hole is 1,391 meters.
Early reports about drilling activities at Camp Century (Ueda and Garfield, 1968) and investigations of the basal materials (Herron and Langway, 1979; Whalley and Langway, 1980; Fountain et al., 1981) are in closer agreement with Hansen and Langway (1966) and report that the thicknesses of the silty ice and subglacial material are 16 and 3.5 m, respectively (Table 1). Note that while most publications report that the subglacial core was completed on 4 July 1966, the drilling log has the date of 2 July 1966.
Later, in the Northern Hemisphere summer of 1966 CE, Camp Century was abandoned, and the ice and subglacial cores were transported frozen (likely with dry ice as was used for previous cores but with no record of temperature monitoring) from Greenland to the United States and stored in the CRREL freezers in and/or near Hanover, New Hampshire (Fig. 3). At some point between 1966 and 1972 CE, the five core tubes containing the subglacial sediment were photographed alongside each other; the only known photograph of the intact subglacial archive is presented in Fountain et al. (1981) (Figs. 2a, 3b).
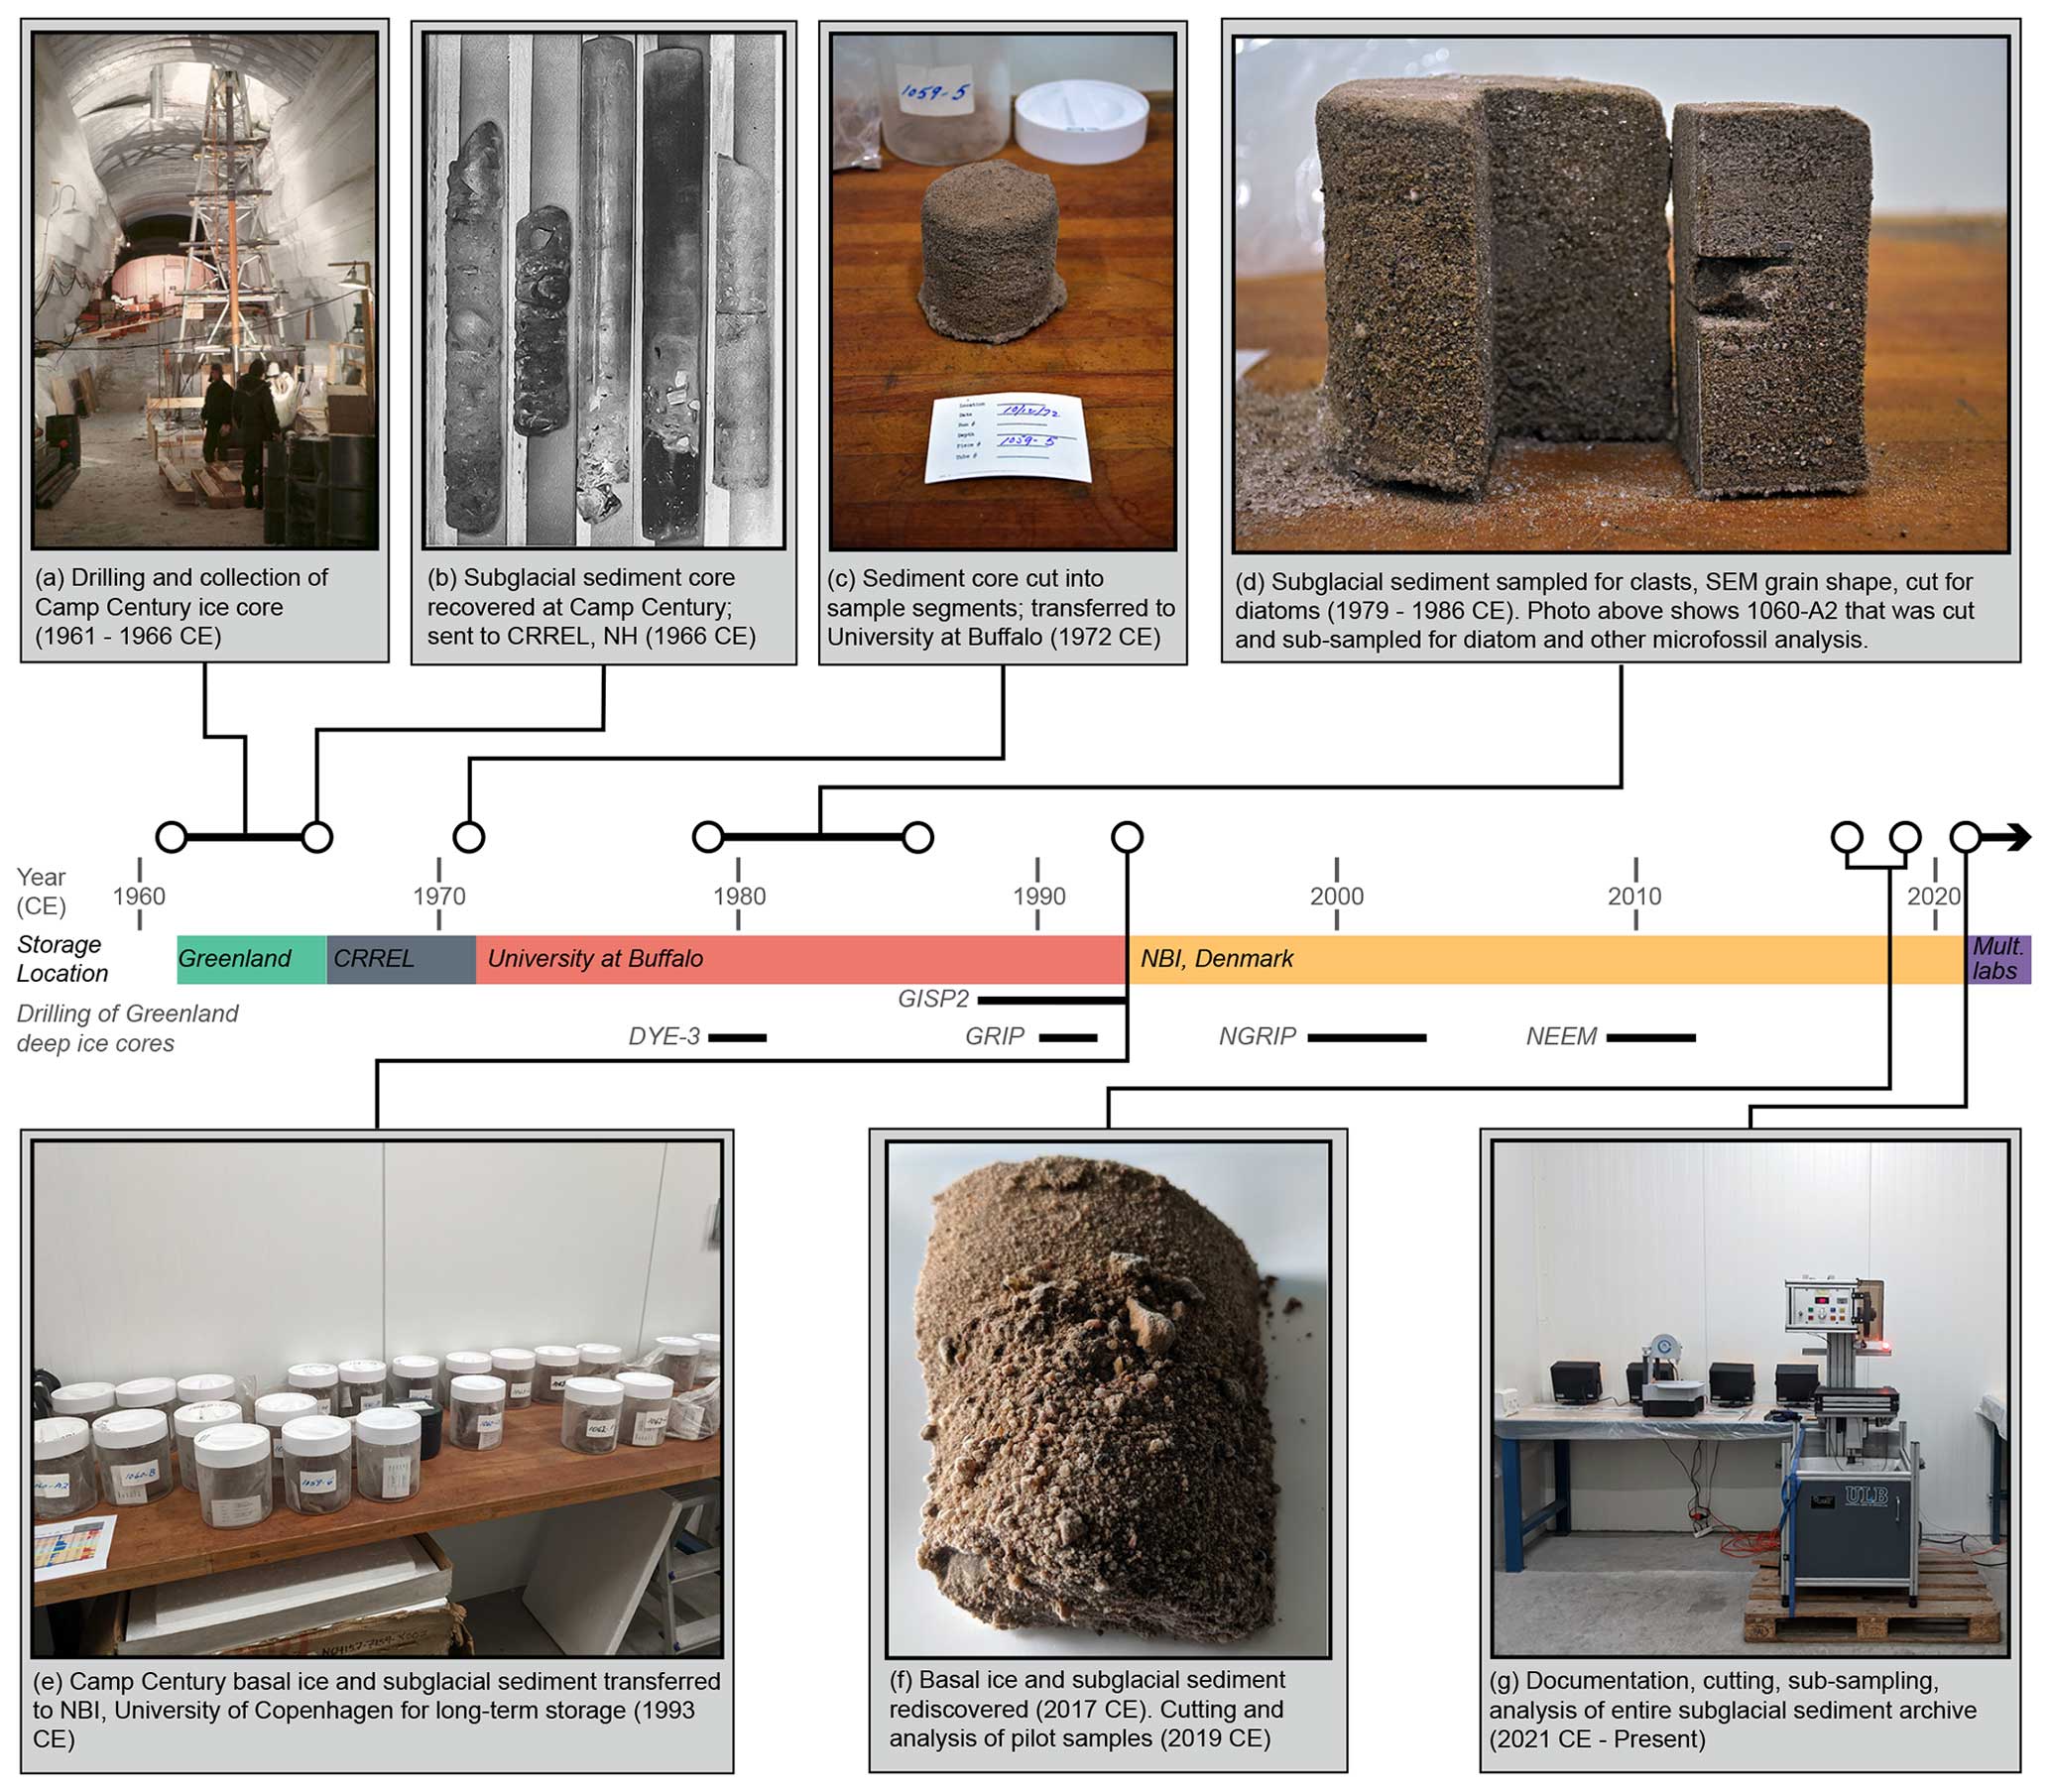
Figure 3Timeline of the scientific history of the Camp Century subglacial sediment, including changes in storage location and core cutting and sub-sampling. The duration of drilling campaigns at other Greenland deep-ice-core sites (Fig. 1a) is shown for comparison. Photo credits: (a) Langway (2008) and Fountain et al. (1981); (c)–(g) Andrew J. Christ.
Table 1Discrepancies between reported drilling depths and thicknesses.
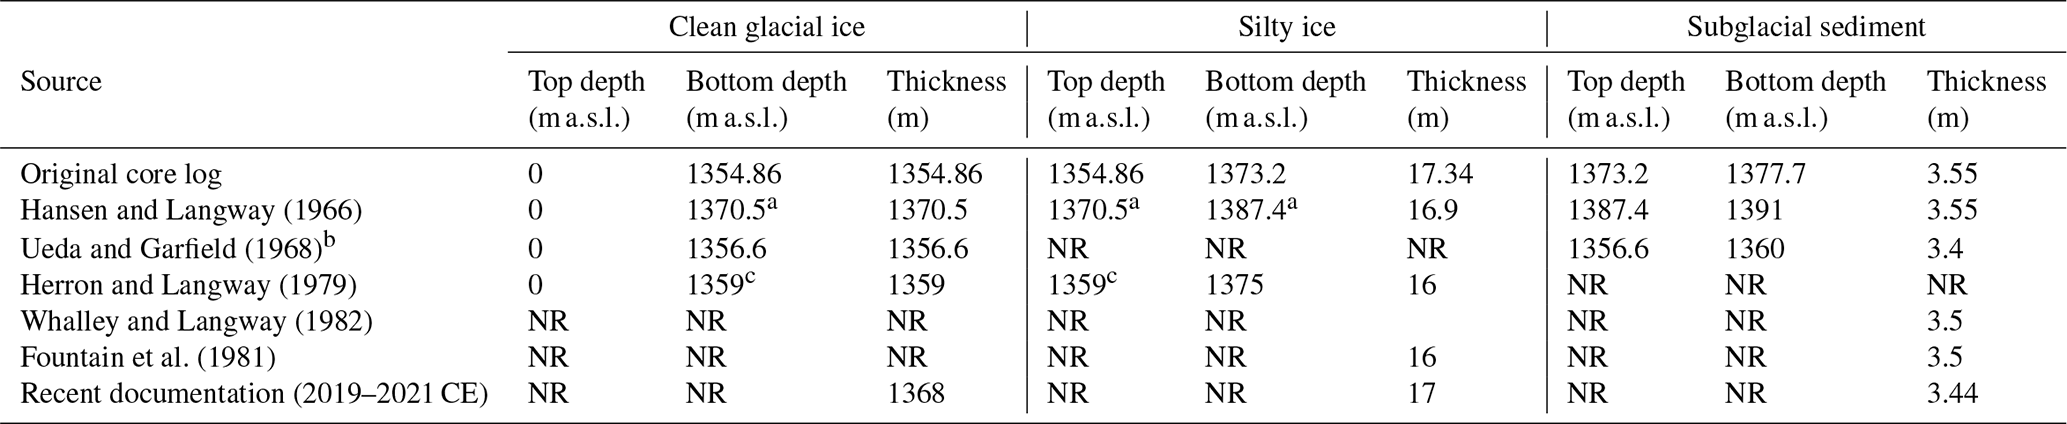
NR is for not reported; m a.s.l. is for meters above sea level. a Calculated based on reported thickness. b Reported values in feet were converted to meters. This source did not mention silty ice and included only the depths/thickness of ice and subglacial material. c Calculated based on reported drilling depth.
Table 2Transcribed core tube log of sub-ice materials.
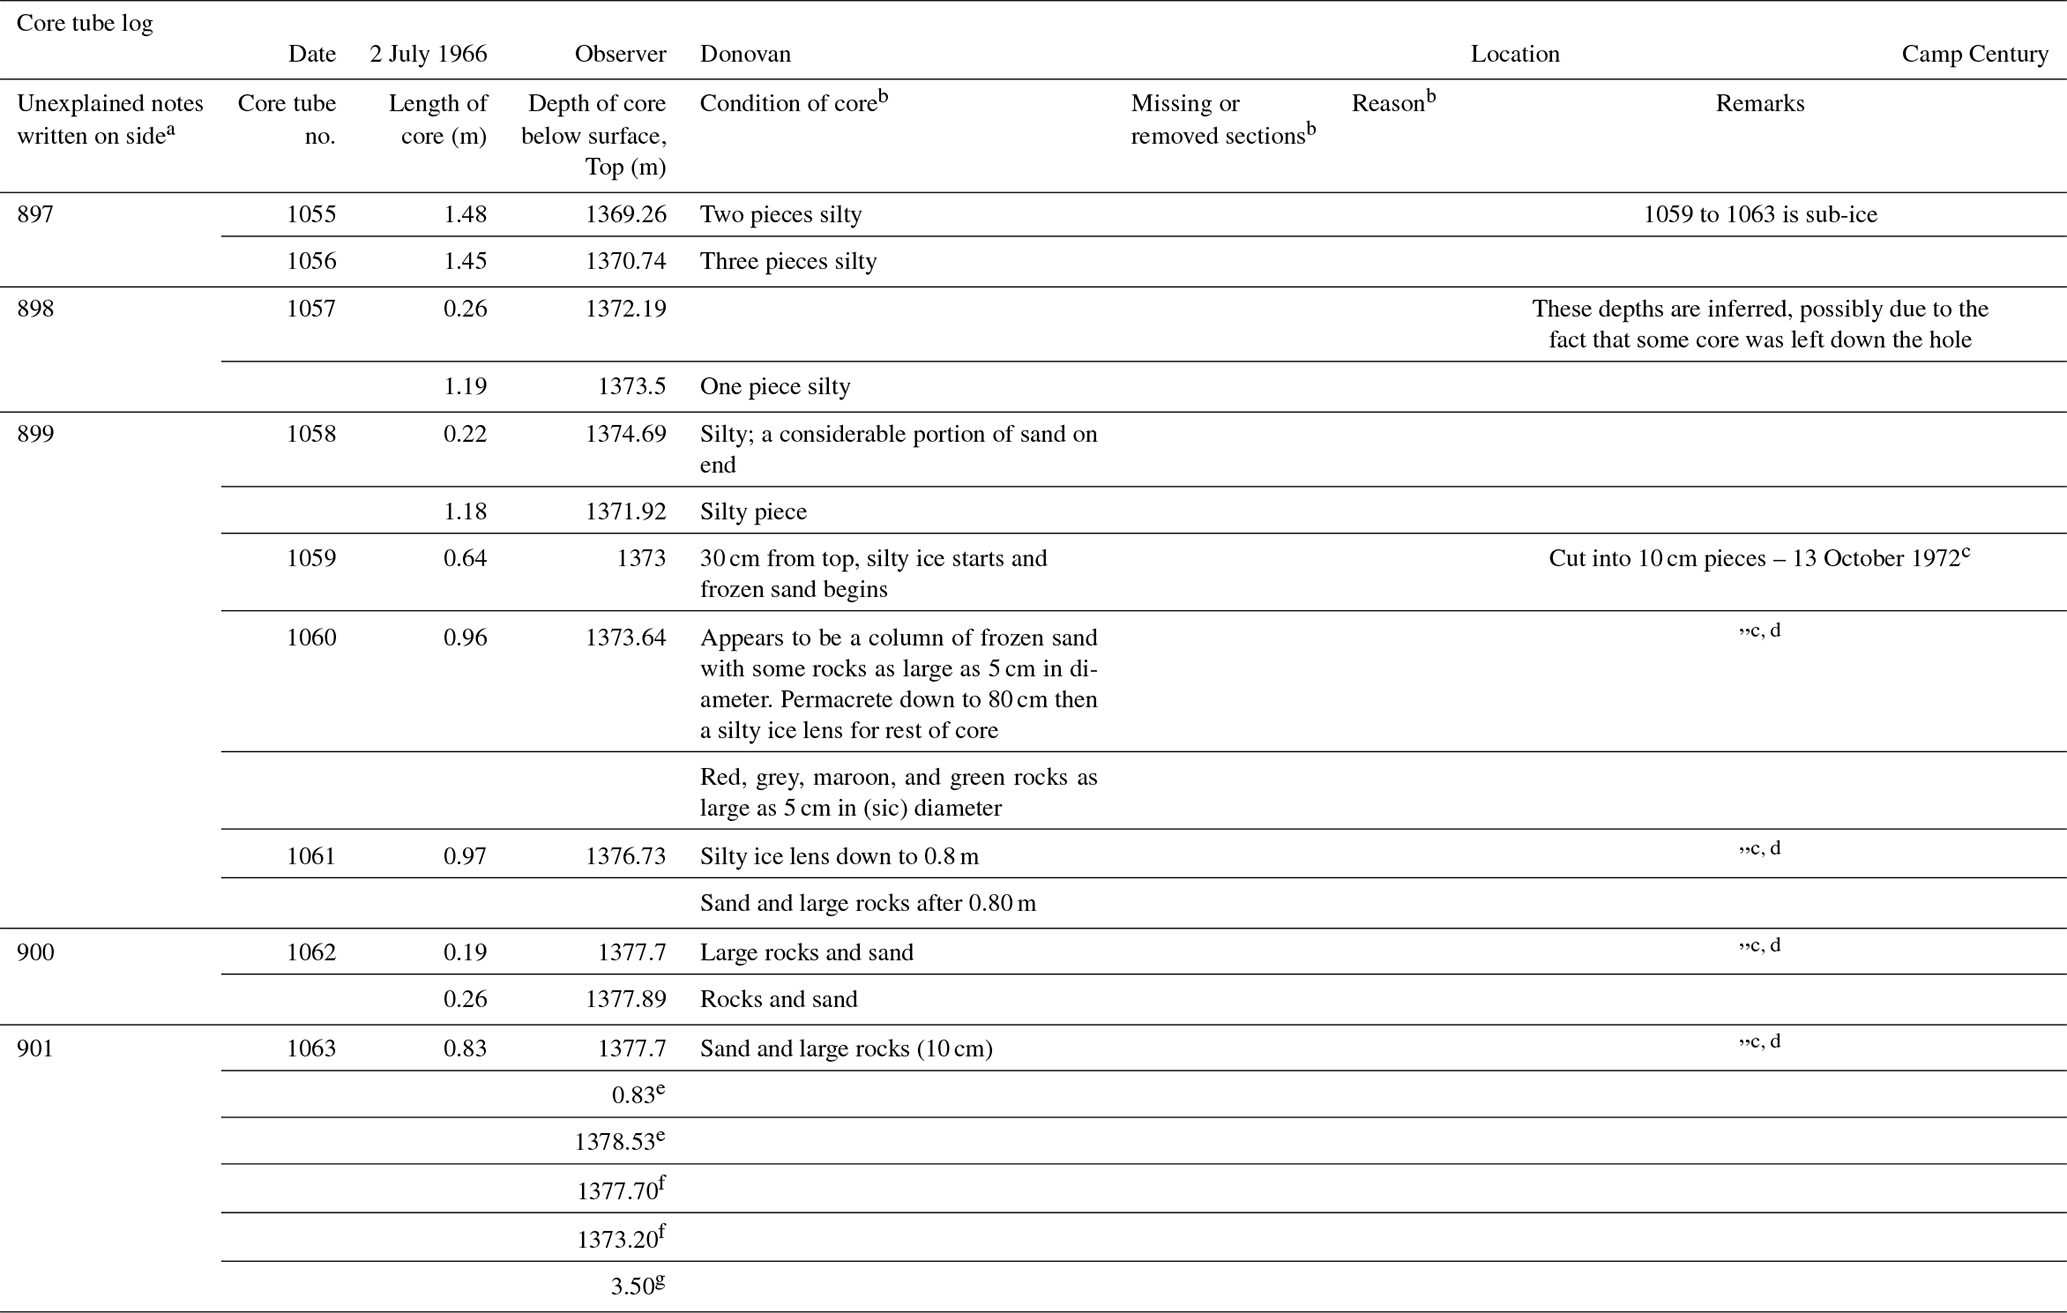
a Notes written on the side of the log that do not correspond to a table heading that might refer to a box number in which samples were stored. b Condition of core descriptions were written across the two columns to the right. c This note was written in a different ink color and clearly was added later. d Interpreted to mean “same as above”. e Purpose of these notes is unclear. f Upper and lower depth range of sub-ice sediment. g Sub-ice sediment thickness.
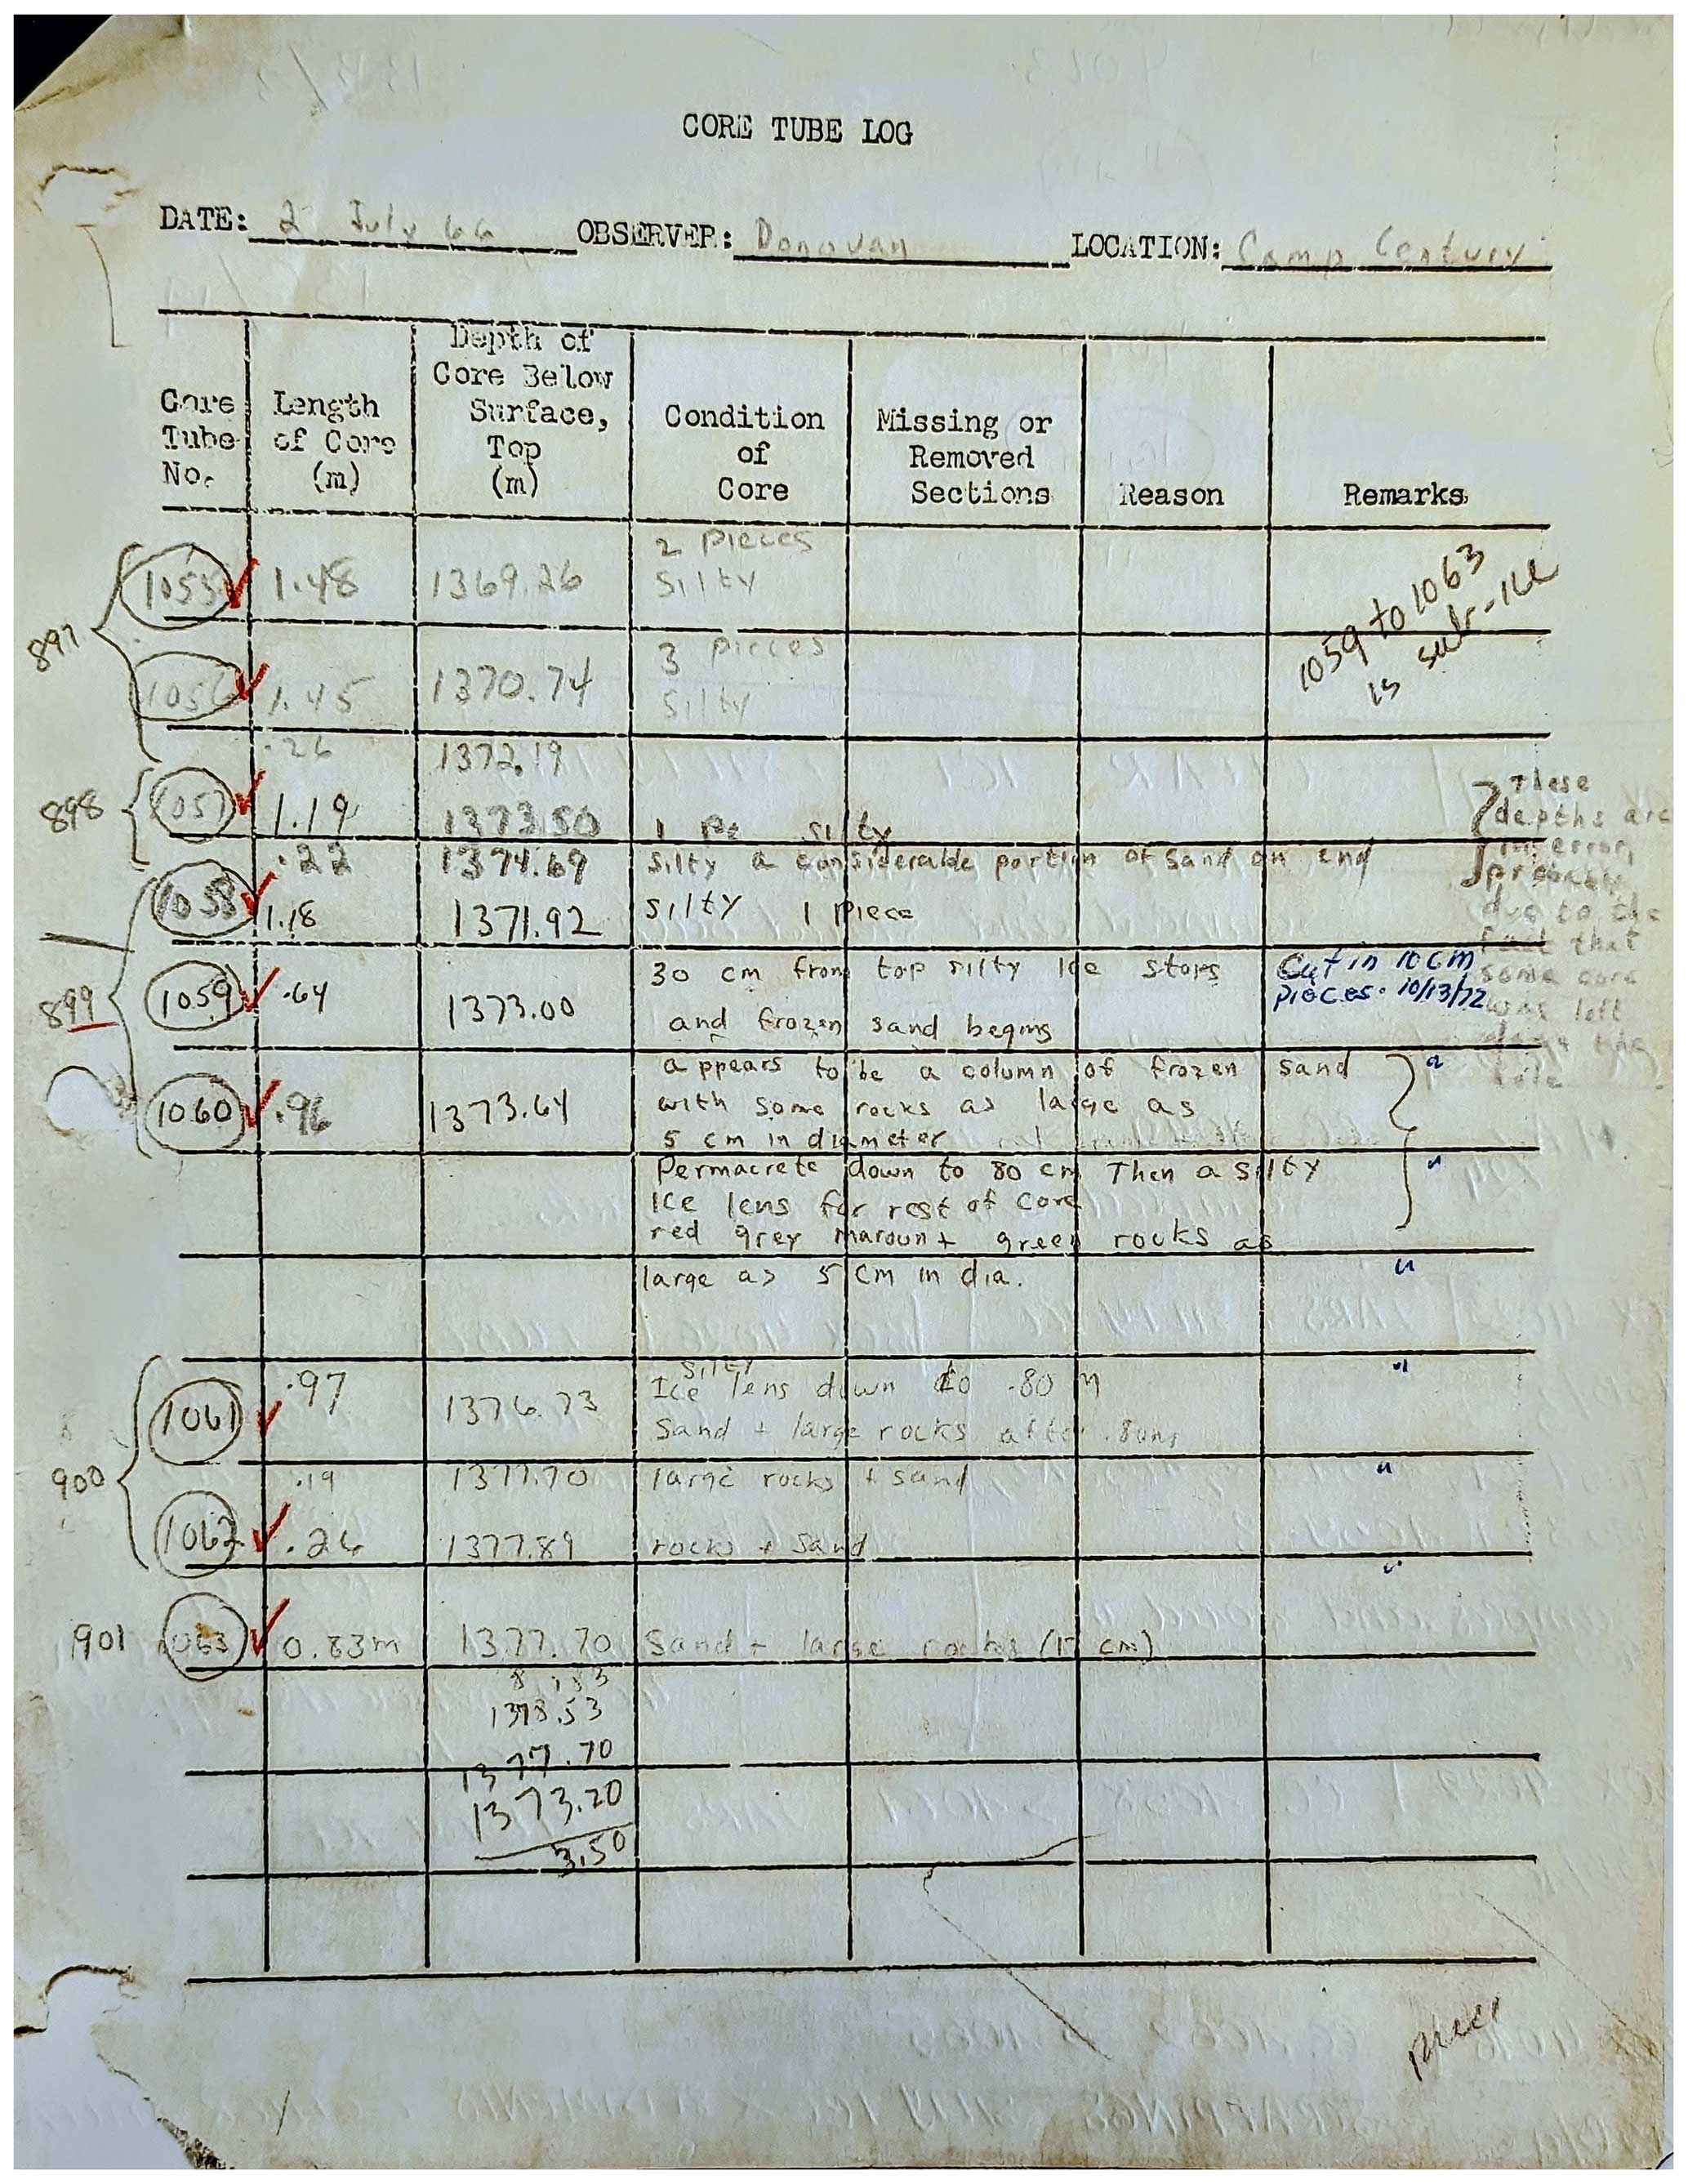
Figure 4Scan of original drilling log from Camp Century, courtesy of Jørgen Peder Steffensen.
In October 1972 CE, the subglacial material from each core tube was cut into 32 segments that were each about 10 cm long (Figs. 3c, 4). The cutting of the subglacial material preceded Chester Langway's move from CRREL to the University at Buffalo in 1974 CE. The date and sample name were recorded on tags kept with each cylindrically shaped segment in glass jars with plastic screw-top lids. Each segment was given a sample name that included the tube number and a sequential number or letter (e.g., 1059-4 and 1061-D1). The reasoning behind the sample naming scheme is not explained in any existing records but appears to be related to sedimentological properties seen on the exterior of the core (e.g., sediment and ice content or grain size). The entirety of the Camp Century basal ice and subglacial material was then transferred to the U.S. National Science Foundation (NSF) Ice Core Storage Facility at the University at Buffalo, where it remained from 1974 to ca. 1993 CE.
There was renewed interest in the Camp Century ice core basal materials in the late 1970s and early 1980s. Susan L. Herron's dissertation research (at University at Buffalo) analyzed the ice fabric, debris content, and gas concentrations of the silty ice (Herron and Langway, 1982, 1979). Basic petrological descriptions and Rb–Sr dating was performed on some exterior pebbles and cobbles from core tubes 1062 and 1063 (Fountain et al., 1981). Scanning electron microscope (SEM) analysis of grain shape was conducted on sand from an unspecified portion of the subglacial material (Whalley and Langway, 1980). Along with five samples of the basal silty ice retained with the Camp Century ice core, segment 1060-A2 was cut during the 1980s for investigation for microfossils (Fig. 3d) (Harwood, 1986). That sample held abundant freshwater diatoms and a few marine diatoms. After Harwood (1986), there is no documented investigation of the Camp Century subglacial material.
In 1993 CE, the ice cores stored at the University at Buffalo, including most of the Camp Century ice core archive, were moved to Denver when the U.S. National Science Foundation contract for ice core curation and storage was awarded to the University of Colorado for a new, purpose-built ice core storage facility. At or after that time, the lowermost 131 m of the Camp Century ice core, including the silty ice and subglacial material, were transferred from University at Buffalo to the ice core facility at the Centre for Ice and Climate at the Niels Bohr Institute (NBI) at the University of Copenhagen, where they have remained in frozen storage in the original boxes from the University at Buffalo (Fig. 3e). Most US researchers and National Science Foundation staff concluded that the lower 131 m of ice, silty ice, and subglacial sediment were lost because they were no longer with the rest of the ice core in Denver.
In 2019 CE, the NBI centralized all ice core samples in a new single-freezer storage facility. In the process of doing a full inventory, the curator of the ice cores in Copenhagen found the samples of subglacial material, and in the NBI archives, they also found the original core logbooks and paper log rolls. The curator then brought this discovery to the attention of the ice core community. Later, in 2019 CE, sedimentological properties on the exterior of core segments were described, and two pilot samples were cut using a diamond wire saw from the uppermost (1059-4) and lowermost (1063-7) segments of the subglacial material (Fig. 3f) (Christ et al., 2021). Multiple geochemical and isotopic analyses of these two pilot samples showed that the Camp Century subglacial material held a multimillion-year-old record of glacial and vegetation history of northwestern Greenland (Christ et al., 2021). In 2021 CE, 55 years after the subglacial material core was collected and 49 years to the month after it was cut into ∼ 10 cm segments, the remaining sub-ice material was documented and cut for multiple analyses (Fig. 3g). In 2023 CE, Christ et al. (2023) determined, using luminescence measurements, that the uppermost sample of subglacial material was last exposed to sunlight at 416 ± 38 ka, during the Marine Isotope Stage (MIS) 11 interglacial.
3.1 Sample documentation prior to sub-sample cutting
We documented the archived inventory of core segments of the Camp Century subglacial material in the freezer laboratory (−20 °C) at the Ice Core Facility of the Centre for Ice and Climate, NBI, at the University of Copenhagen, Denmark. We recorded the label name, mass, and dimensions for each core segment found in the archive (Table S1). We noted ice content, grain size, and visually observable cryo-sedimentary structures for each sample. We tracked the storage orientation (i.e., top direction) of each segment during the entirety of handling and cutting. We then compared the segment name, dimensions, and storage orientation to the original core tube logs and core photograph (Fountain et al., 1981) to reconstruct the length of material recovered in each core tube and to identify samples that were previously sampled, thawed, or missing. We estimate that there were 3.44 m of recovered core material based on what is physically present in the inventory and estimating the length of samples that were thawed (n=2) and those now missing (n=2) from the archive.
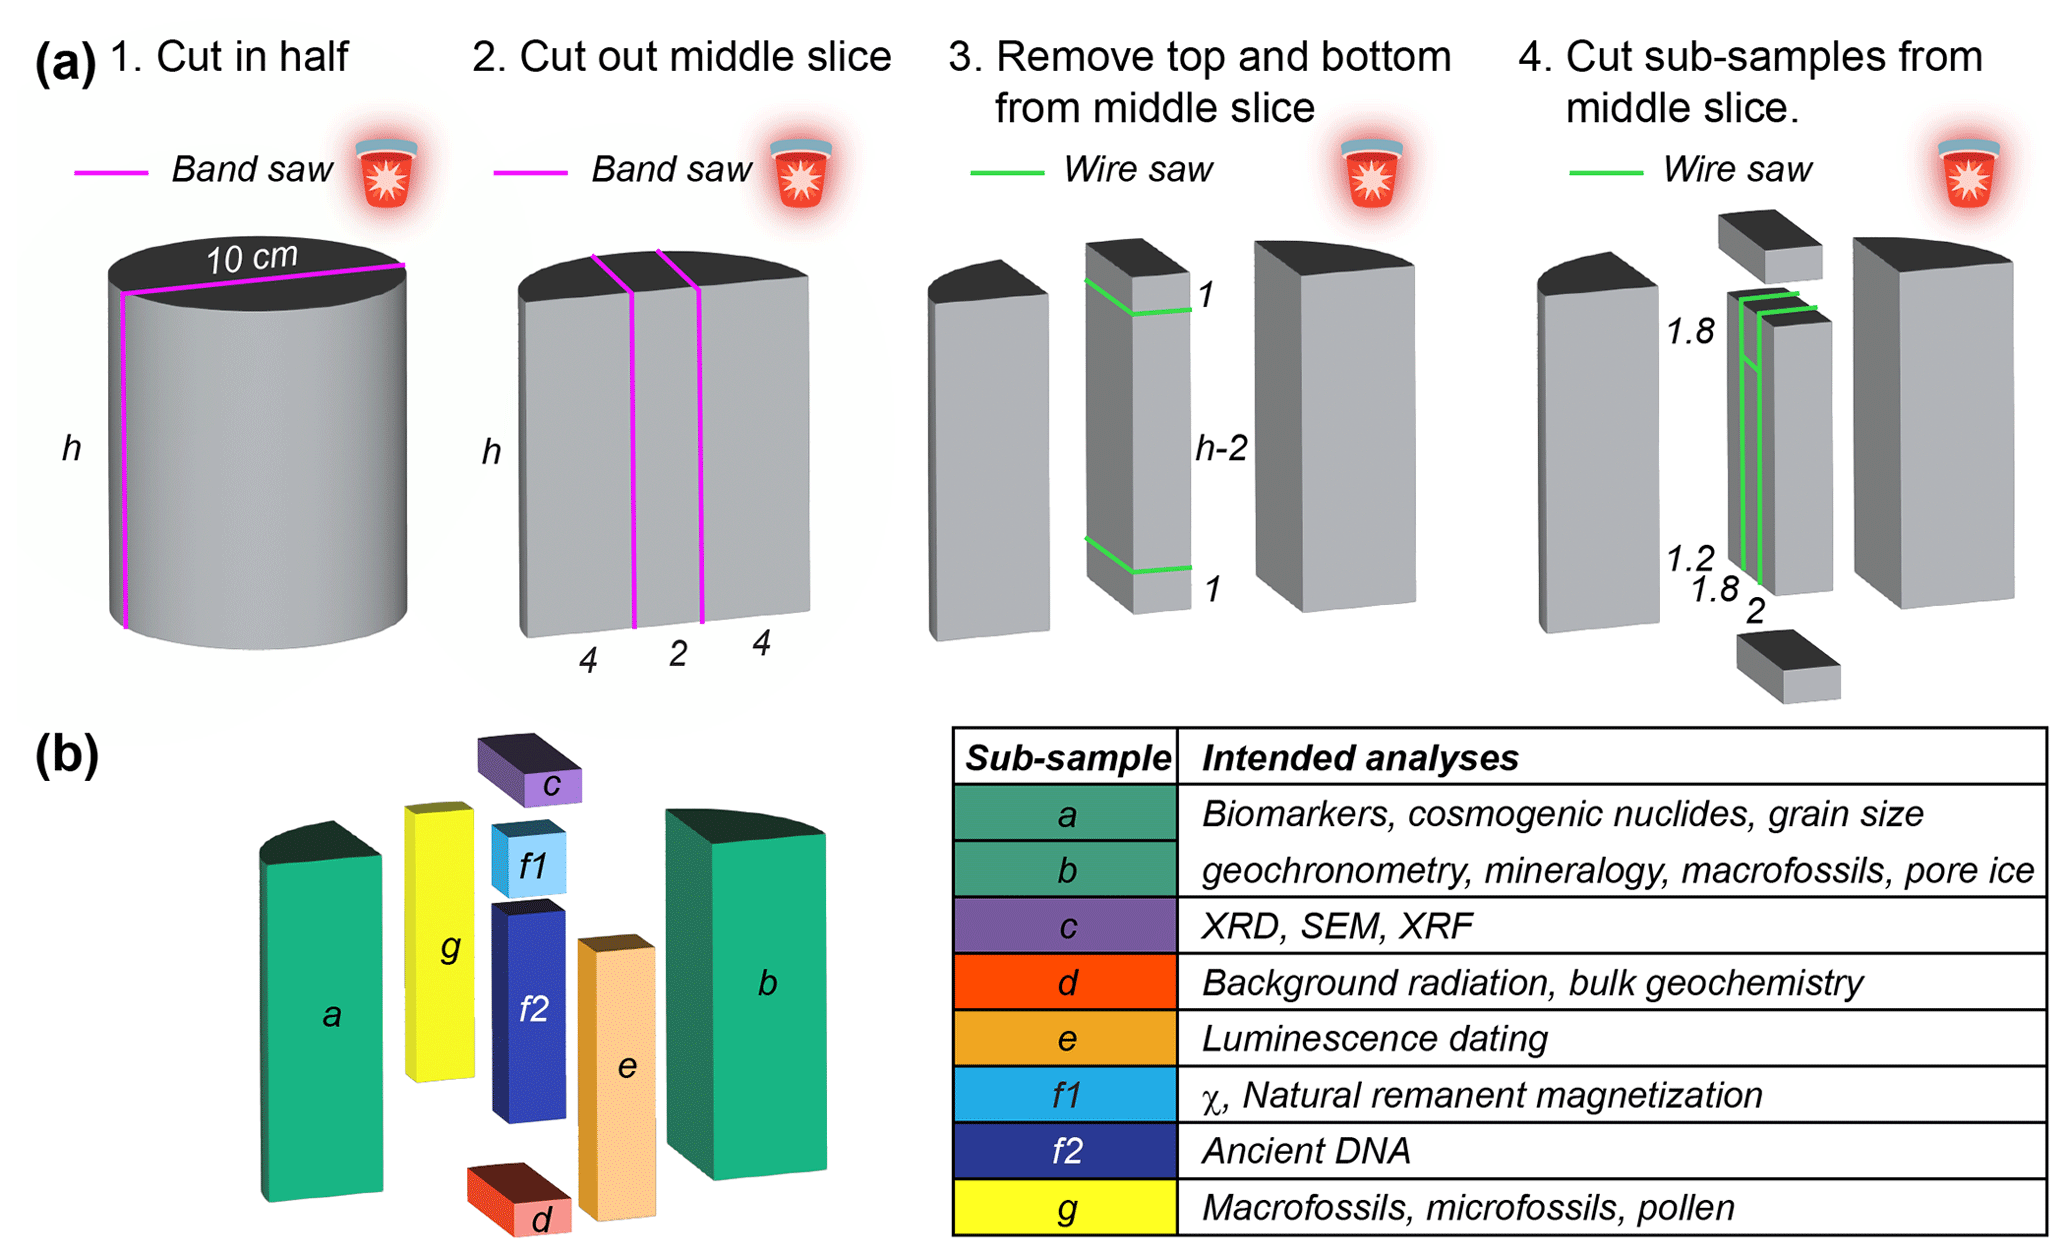
Figure 5Sample cutting in 2021 CE. (a) Scaled schematic of how samples were cut using the band saw (bright purple lines) and diamond wire saw (bright green lines) in the −20 °C climate-controlled laboratory at NBI. Samples were cut under red light conditions (red light symbol) until sub-sample (e) was cut and packaged in aluminum foil. All numbers refer to dimension in centimeters; h= is for height. (b) Sub-samples color-coded according to intended analyses. Geochronometry measurements in quadrants (a) and (b) include (U–Th)He and solid-state measurements by laser ablation inductively coupled plasma mass spectrometry (LA-ICP-MS).
For the remaining samples not analyzed in the pilot study (Christ et al., 2021), we took approximately 20 digital photographs of each frozen core segment from all directions (excluding the thawed and missing samples). Using these photographs, we constructed three-dimensional photogrammetric models with 3DF Zephyr Lite® software, using default settings to produce a textured mesh for each sample, and exported them as 3D objects. We imported the textured meshes into Adobe Dimension® and compared them against the original core photographs (Fountain et al., 1981) to reconstruct each core tube into its original orientation, determine if samples were stored upside down, and to identify any missing exterior pebbles (images archived at https://www.morphosource.org/concern/cultural_heritage_objects/000583438, MorphoSource, 2023). We note that the core reconstruction using 3D photogrammetric models and comparison against historical photographs occurred following sediment sub-sampling due to time constraints during the 2021 CE sub-sampling event. Using Adobe Photoshop®, we calculated the color of the frozen sediment by extracting the average RGB value of the exterior and interior cut face of each core segment from digital photographs, converting that RGB value to a HEX color code, and then matching to the best-fit Munsell soil color (Table S2).
In the climate-controlled freezer laboratory at NBI, we measured the mass and dimensions (height and radius) of each frozen core segment to calculate the volume and bulk density. Using these data, we derived an estimated percent ice content by mass, assuming that this material is a two-component mixture of ice and sediment with densities of 0.9 and 2.7 g cm−3, respectively (Table S3). We assumed that core segments had cylindrical geometries for the purpose of calculating the volume. To calculate the volume of oddly shaped segments, we measured the dimensions of specific individual segments, approximating the segment volume to the volume of the “best-fit” simple 3D geometries.
3.2 Sub-sample cutting design, shipping, and distribution
We designed our core-cutting method to ensure sufficient sample material for varied analyses, retain the orientation of samples during storage, avoid further chemical and/or biological contamination and exposure to light, and save archival material at NBI for future analysis. Using the mass and dimensional measurements and derived bulk density and ice content for each core segment, we trigonometrically calculated the dimensions of individual frozen sub-samples needed to satisfy sample size and mass requirements for multiple analyses (Table 3; Fig. 5). We cut samples into eight oriented sub-samples (a–g) (Fig. 5a) using two different saws in the −20 °C cold room at NBI: (1) a Gryphon C-40 CR tall diamond band saw (AquaSaw XL) with a 1 mm thick stainless steel diamond blade (Gryphon 301SS-42), using ethylene glycol as a cutting fluid, and (2) a Well diamond wire saw, model 6234, with a 0.5 mm diameter diamond wire according to the methods of Tison (1994). Smaller pieces and those where we needed to avoid glycol contamination were cut with the diamond wire saw.
We cut core segments from the entire subglacial section of the core (e.g., segments 1059-5 through 1063-8). After cutting each sample, we removed the bandsaw from the freezer and cleaned it by wiping down and washing working surfaces with tap water and a clean sponge, and then we allowed it to air dry. We drained and replaced the glycol cutting fluid after every other sample. We saved two aliquots of the ethylene glycol cutting fluid for chemical analysis to identify any potential contamination to pore ice and biological analyses. We replaced the bandsaw blade when it became dull, typically every 2 to 3 samples. We replaced the diamond wire when necessary, typically after a total cutting length of ∼ 30 cm for the sediment-rich samples, or if the wire snapped during cutting. To prevent light exposure of the interior prism for luminescence measurements, we cut sub-samples (a) through (e) in red light conditions using photography darkroom lamps and red LED bicycle lights. We handled all sub-samples with nitrile gloves and wrapped sub-sample (f2), which was devoted to biological analyses, in plastic wrap.
Table 3Analytical requirements for intended analyses.
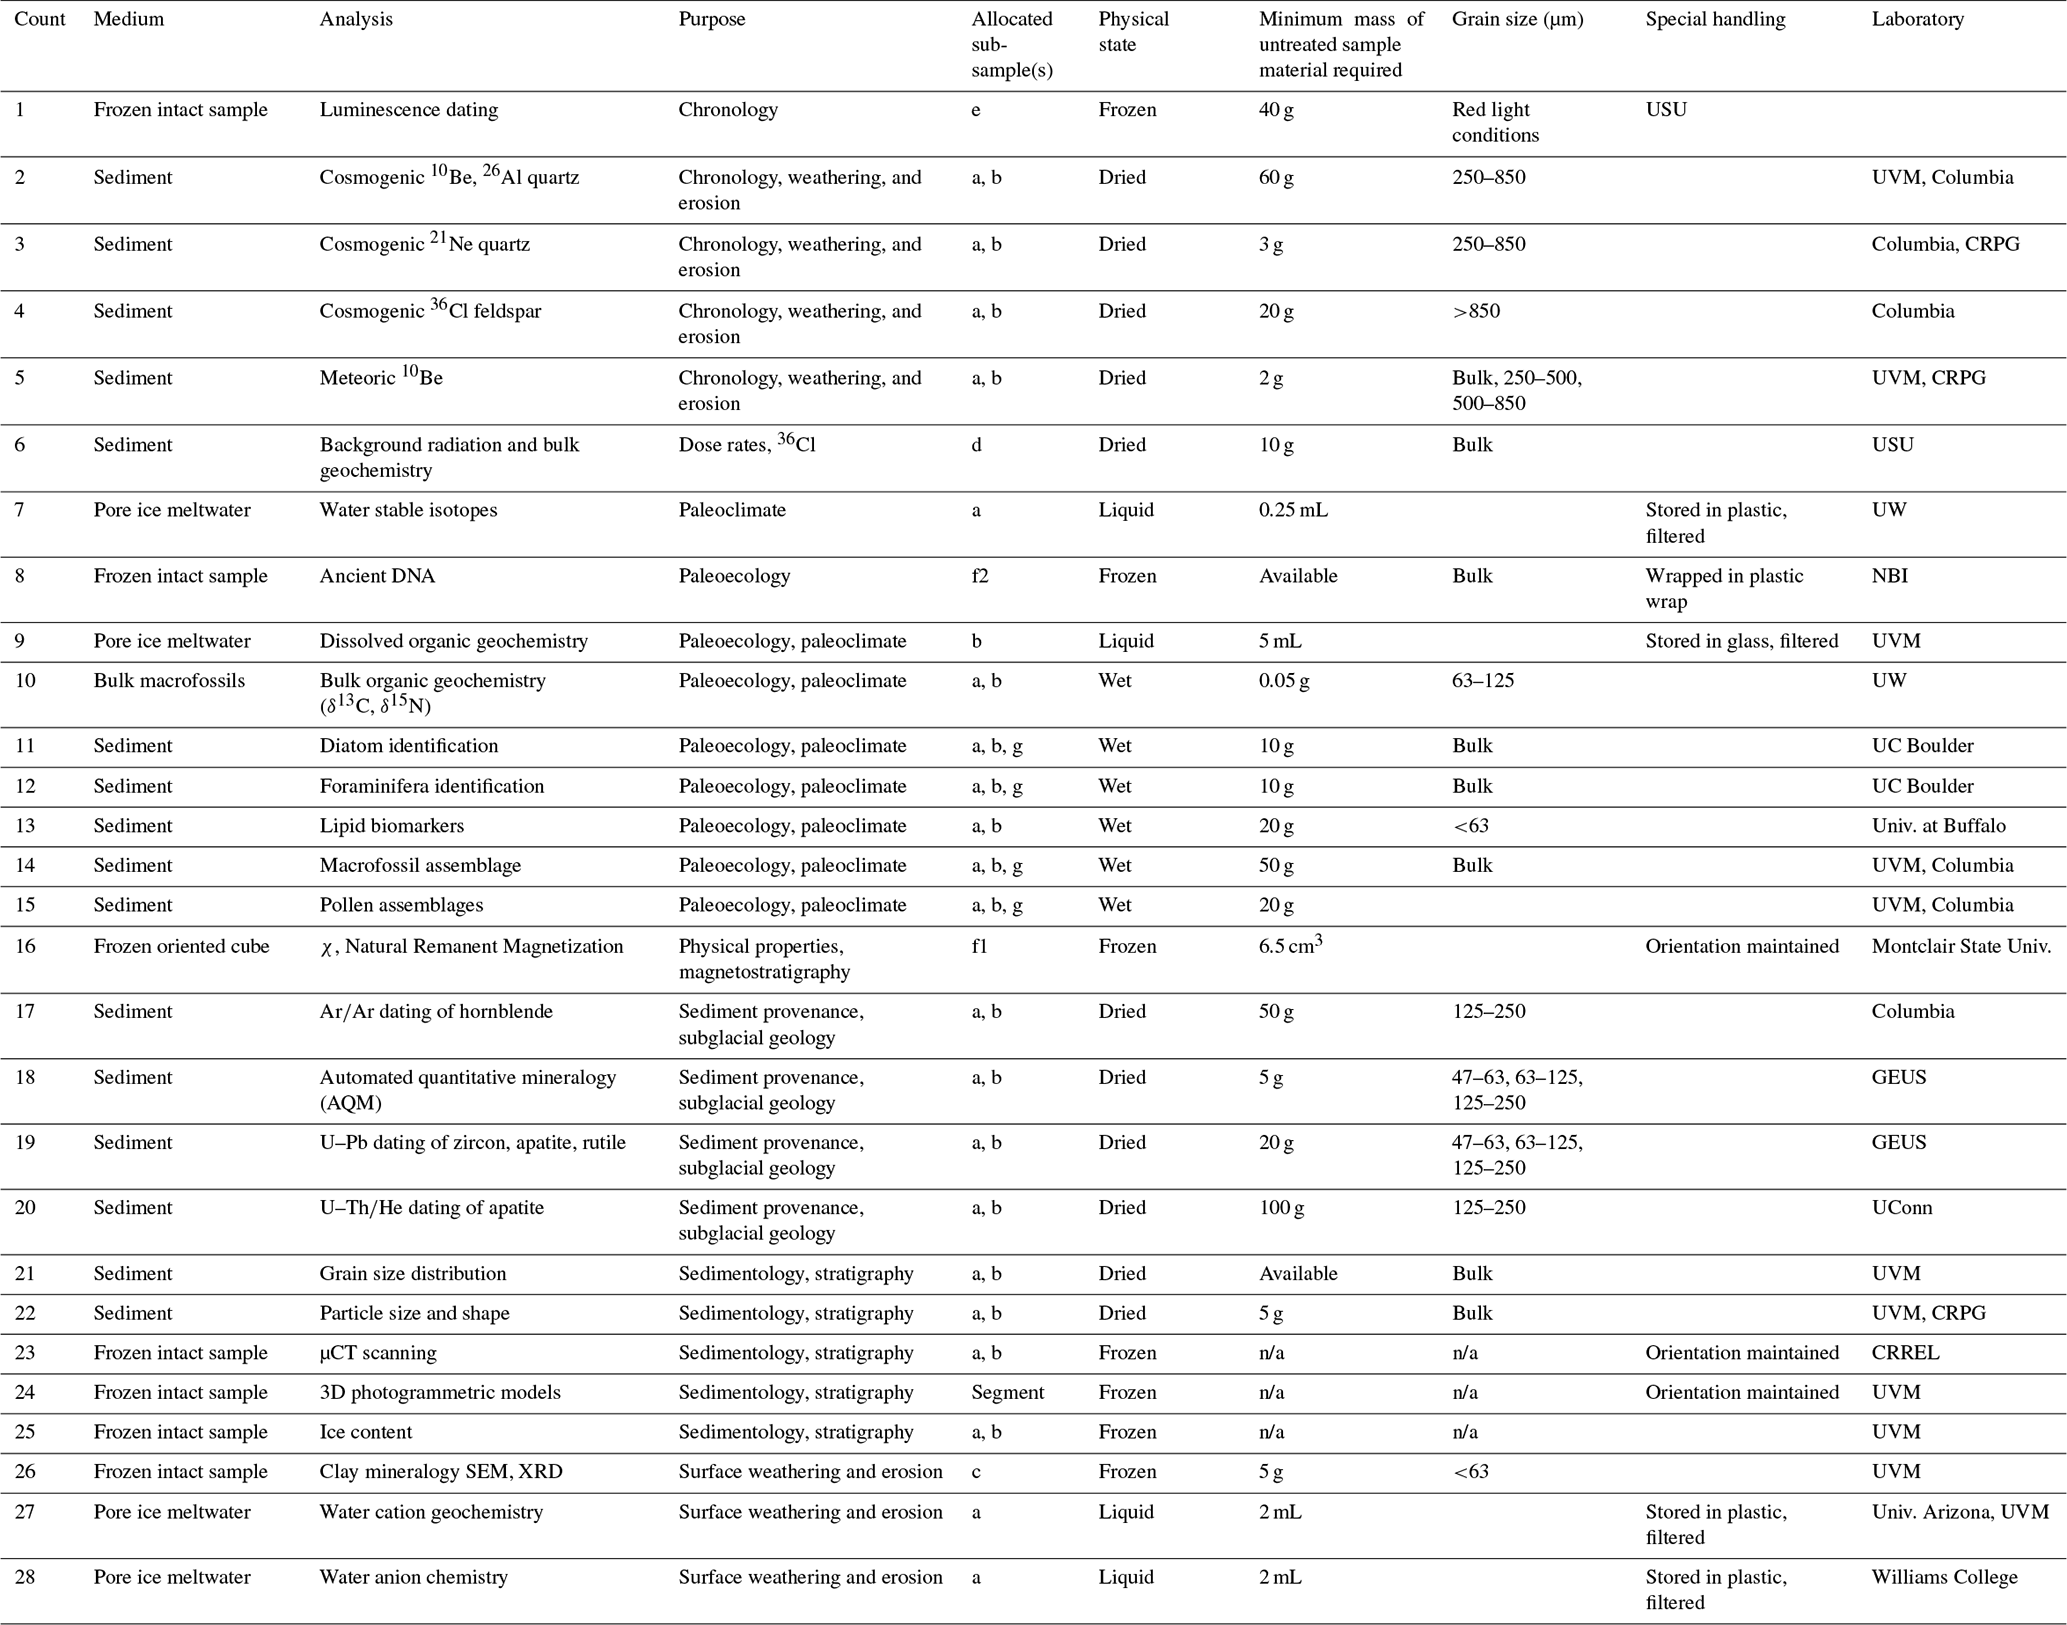
USU is for Utah State University, UVM is for the University of Vermont; CRPG is for Centre de Recherches Pétrographiques et Géochimiques; UW is for the University of Washington; NBI is for the Niels Bohr Institute; UC Boulder is for the University of Colorado, Boulder; CRREL is for Cold Regions Research and Engineering Laboratory; UConn is for the University of Connecticut. Note that n/a is for not applicable.
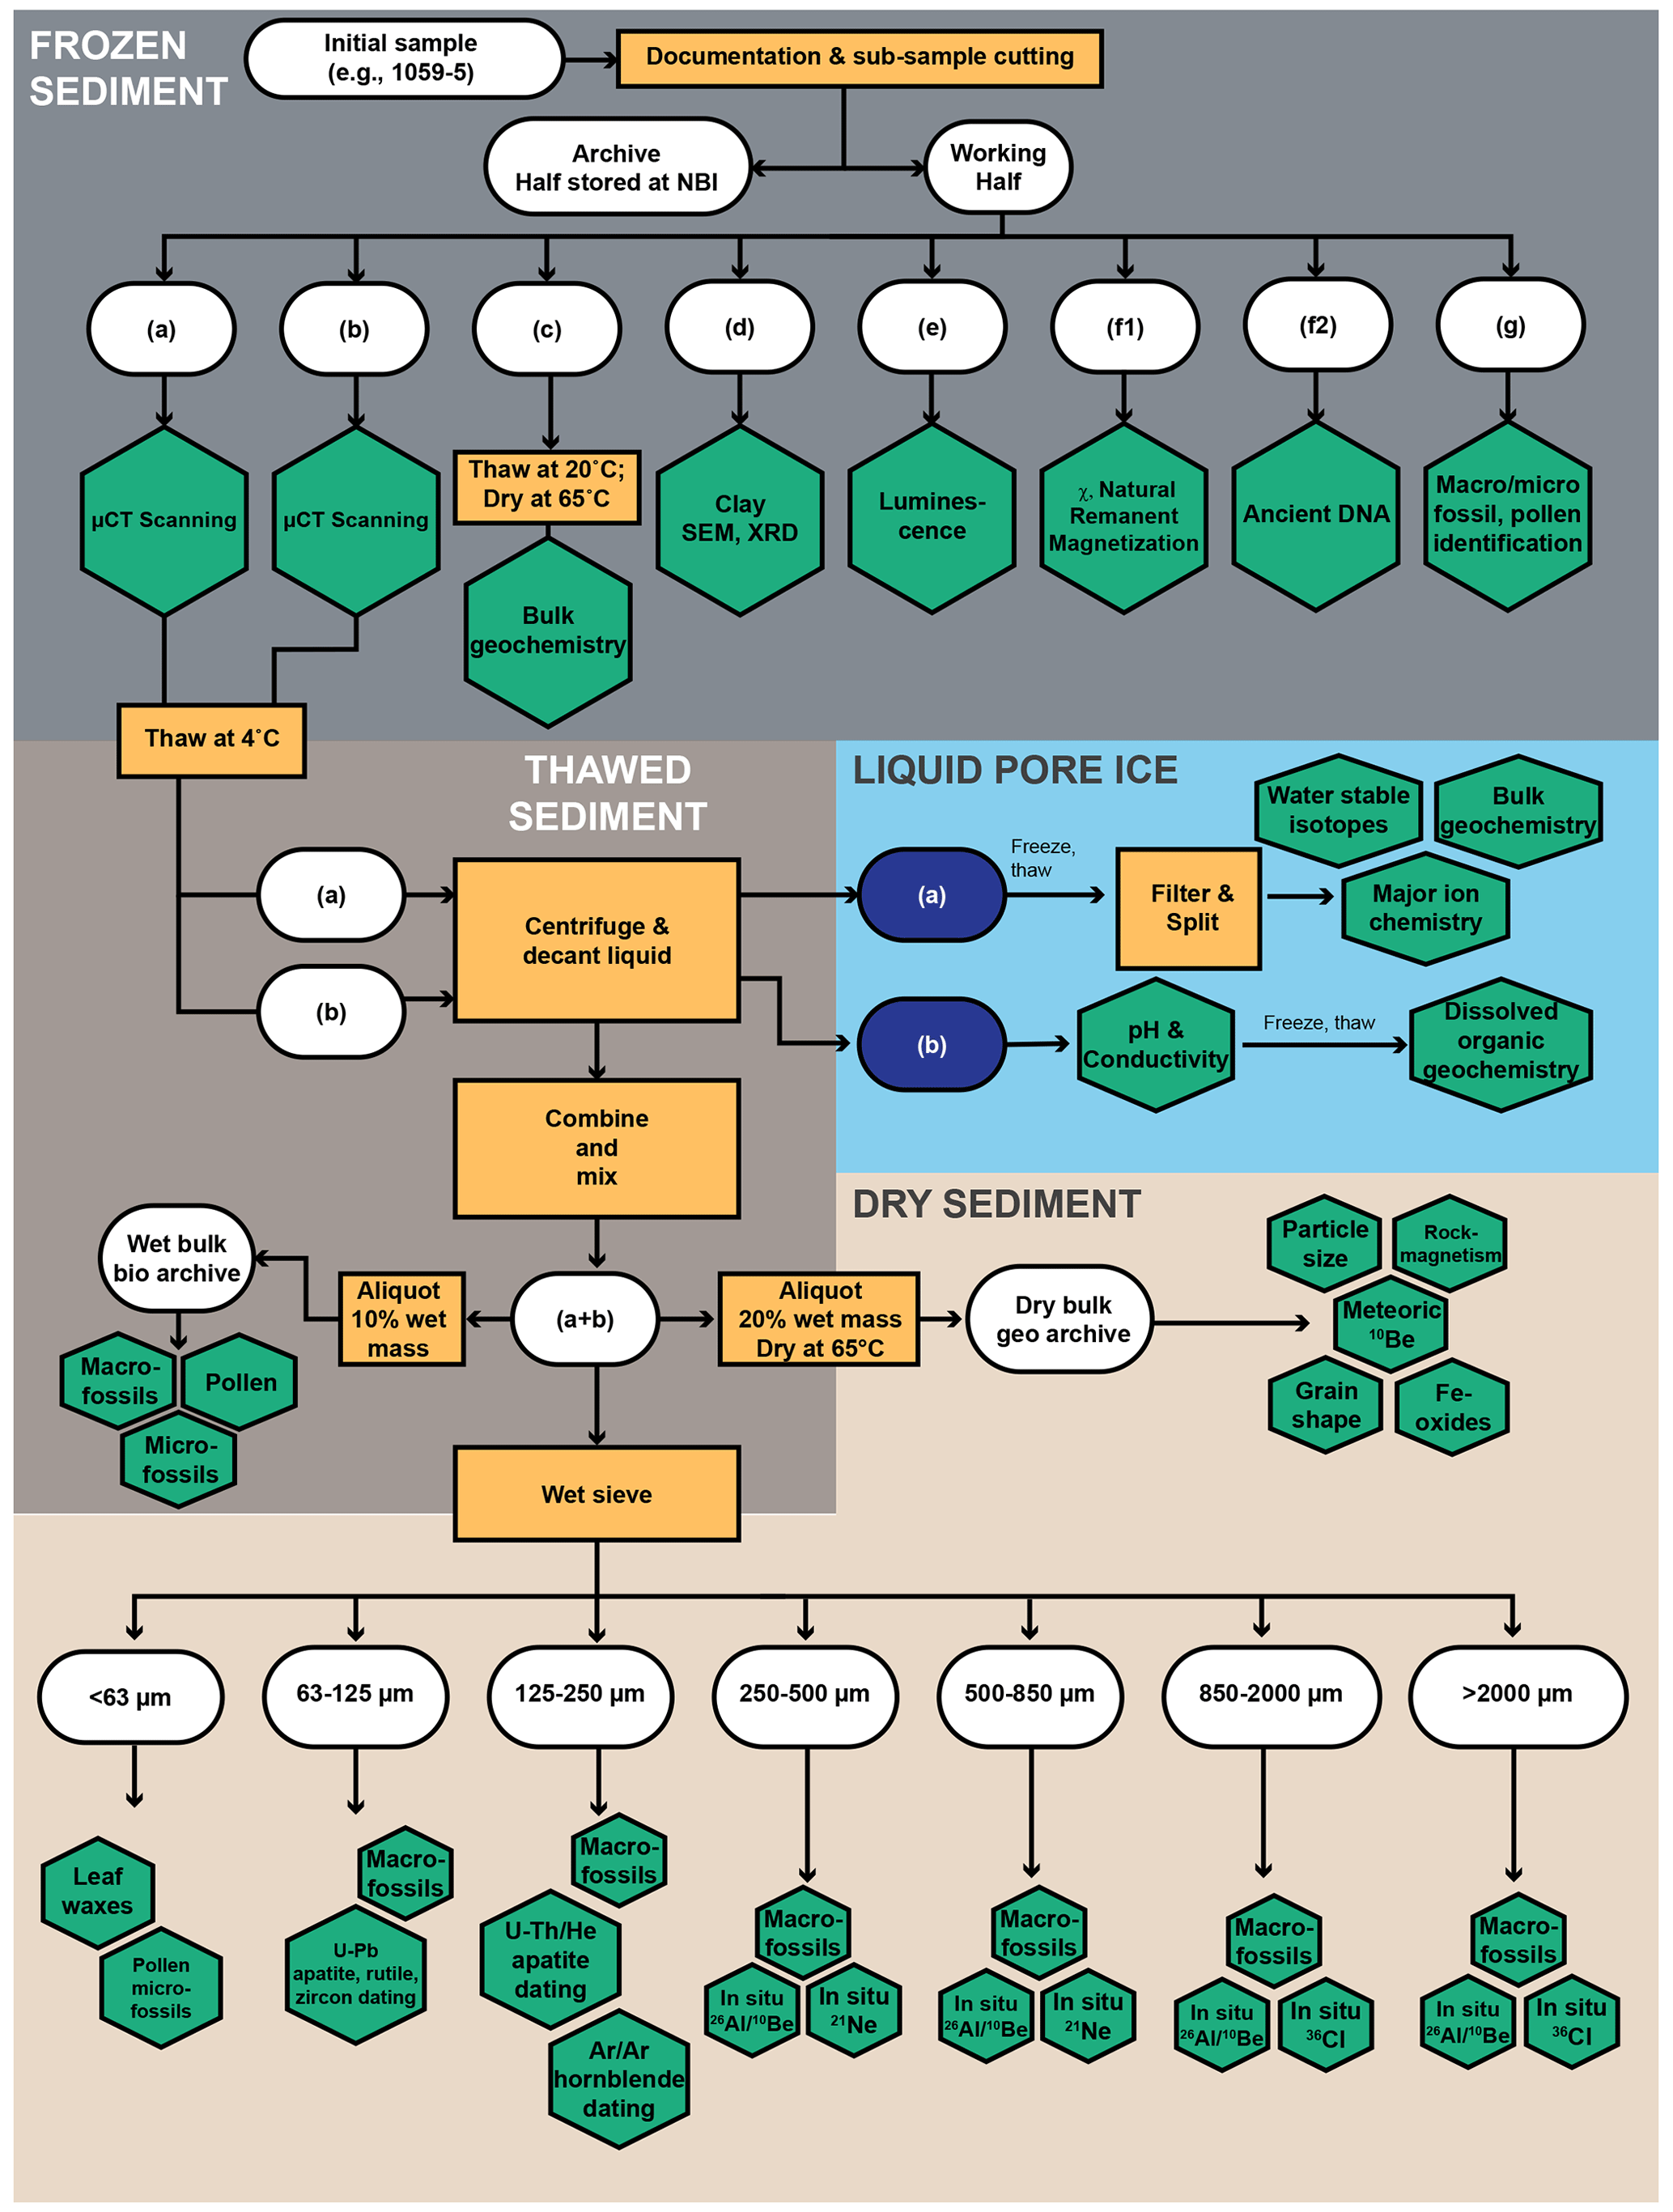
Figure 6Sample cutting, sub-sampling, and processing flow diagram. White boxes show sample materials, orange boxes indicate major processing steps, and green hexagons show analyses.
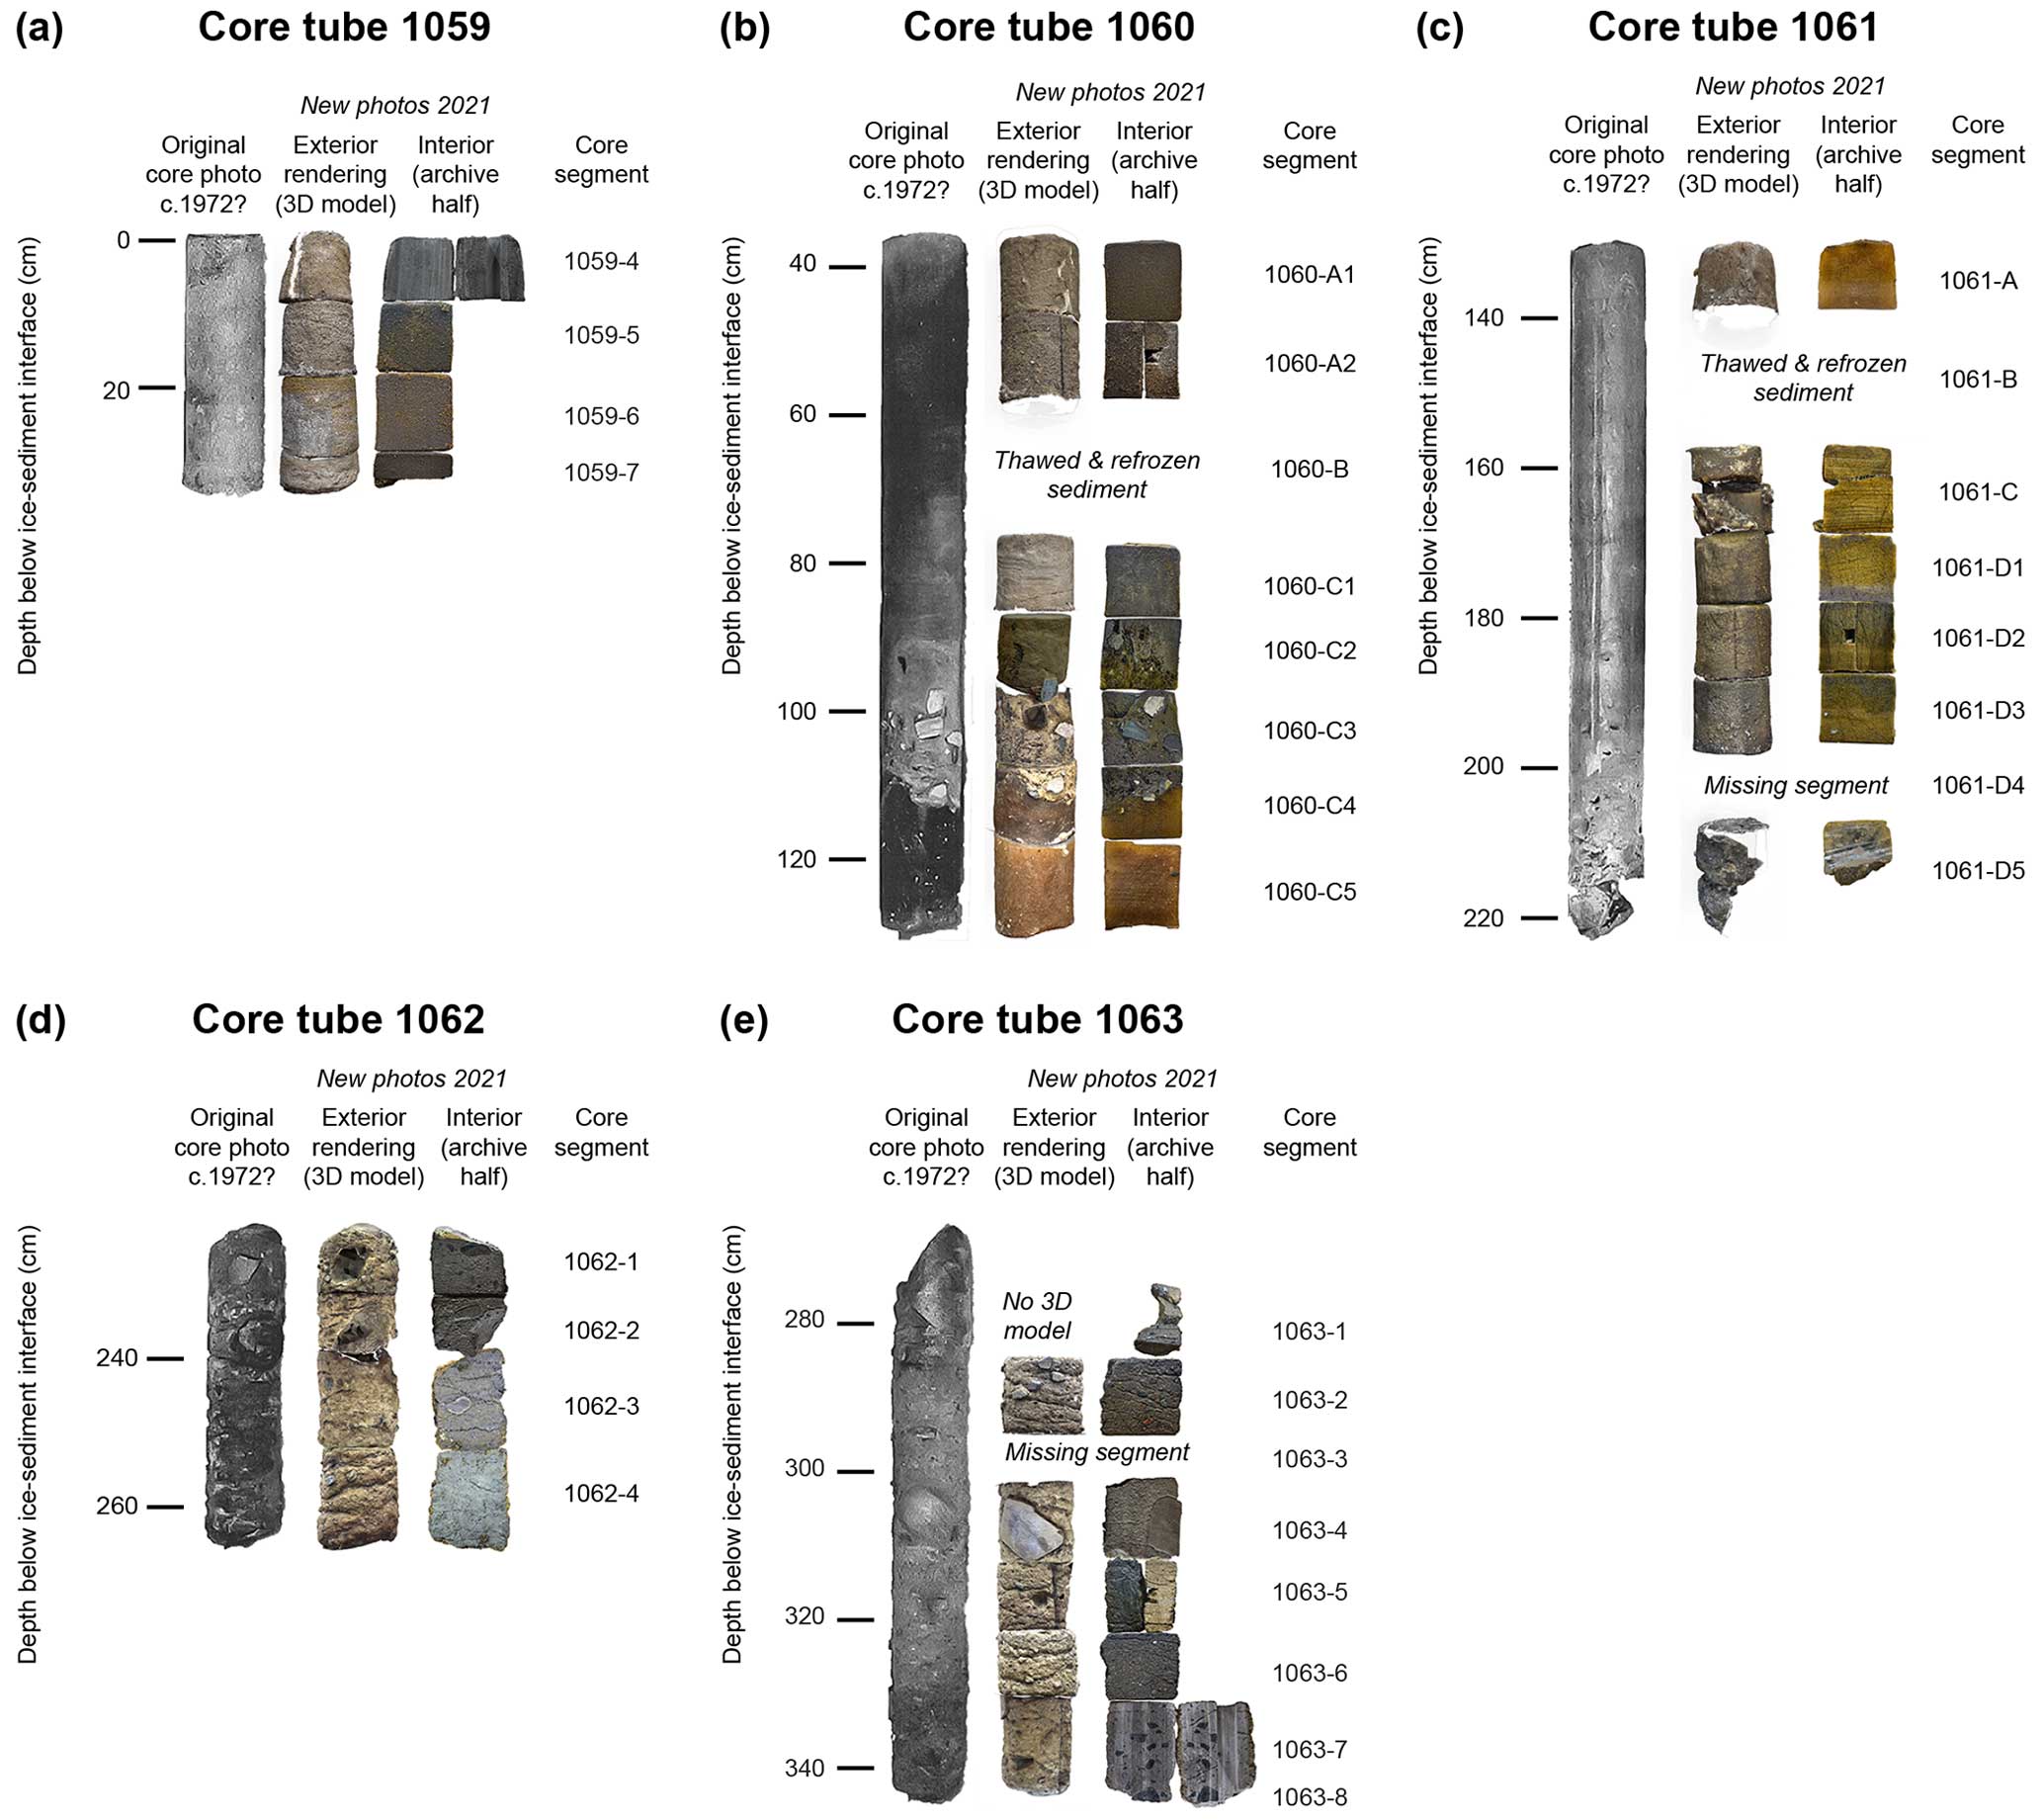
Figure 7Each tube of the subglacial section of the core. Comparison of the photographs taken between 1966 and 1972 CE (black and white; Fountain et al., 1981), the 3D photogrammetry model, and the segments cut for this study in 2021 CE for this study at 2000 rpm. Photogrammetric models of most core segments are available for viewing and download at this online public repository: https://www.morphosource.org/concern/cultural_heritage_objects/000583438 (MorphoSource, 2023).
Using the bandsaw, we cut each core segment in half along the z axis to produce an archival half and a working half (Fig. 5a). From the working half, we cut the outer quadrants (sub-samples (a) and (b)) to isolate an interior prism of the core segment. We recorded the dimensions (width, length, and height (h)) of sub-samples (a), (b), and the interior rectangular prism. Then, to isolate pristine surfaces, we cut the top and bottom ∼ 1 cm of the interior prism using the diamond wire saw and saved the pieces as sub-samples (c) and (d). Then, we cut the interior prism using the diamond wire saw to remove a sub-sample with dimensions of 2 × 2 × (h−2) cm (e) for luminescence measurements. The h−2 cm length is the result of cutting off the top 1 cm and bottom 1 cm from the interior rectangular prism. We wrapped sub-sample (e) in two layers of aluminum foil to secure the sediment from light exposure and placed in a separate plastic sample bag with the sample orientation kept intact. Then, in normal light conditions and using the diamond-wire saw, we cut a ∼ 1.8 × 2 × (h−2) cm slice and from that slice cut a 2 × 2 × 1.8 cm cube of sediment (sub-sample (f1)) for paleomagnetic measurements. We placed sub-sample (f1) into a labeled plastic paleomagnetic cube with the core orientations maintained. The remaining outer piece, sub-sample (g), was kept for macro- and microfossil identification and stored in a separate bag. While most samples were ∼ 10 cm tall cylinders, we applied slightly different procedures for segments that were previously cut or thawed for sampling, had odd or small geometries, or were too delicate to cut according to the cutting design (Table 4). For all samples, we saved any loose material from the storage container as a separate “residual” sub-sample for method testing and replicate measurements. We recorded the masses of each sub-sample (a–g), residual material, and archive half (Table S1). The cut interior face of the archived half and sub-samples (a) and (b) were photographed and then described including ice content, sedimentological properties, and sedimentary features.
We placed sub-samples (a–d) in the same plastic bag with sample orientations maintained (e.g., up and down direction). All sub-samples (a–g) were kept in the storage freezer at NBI (−30 °C) prior to transfer from NBI to the University of Vermont. The archive halves of all samples remain in the NBI ice core facility in plastic bags inside of glass jars in closed foam boxes shielded from light. We packed sub-samples into insulated shipping containers lined with brine freeze packs that constituted 50 % of the interior container volume and allowed to equilibrate at −30 °C for 2 d before being sealed for transport. We transported all sub-samples from NBI via commercial air travel on a direct flight from Copenhagen, Denmark, to Newark, New Jersey. Within 1 h of arrival, we transferred samples into a −20 °C chest freezer at Montclair State University and allowed them to cool for 2 d. We repacked the samples into insulated shipping containers with brine freeze packs and transported them by car from Montclair, New Jersey, to Burlington, Vermont, where samples were promptly transferred into a −20 °C chest freezer with back-up power and high limit alarms for storage. At all times, samples remained frozen.
We distributed sub-samples (e) and (d) for the luminescence and bulk chemistry measurements. We placed sub-sample (e) into labeled, opaque resealable bags and shipped them frozen to Utah State University for luminescence measurements. We thawed each sub-sample (d) overnight in a 65 °C oven and massed each again to determine water content. Then, the dried sediment was shipped to Utah State University for bulk geochemistry and background radiation analyses that will be used for luminescence dose rate calculations and interpretation of cosmogenic 36Cl concentrations.
Table 4Samples with modified cutting or sub-sampling design (2021).
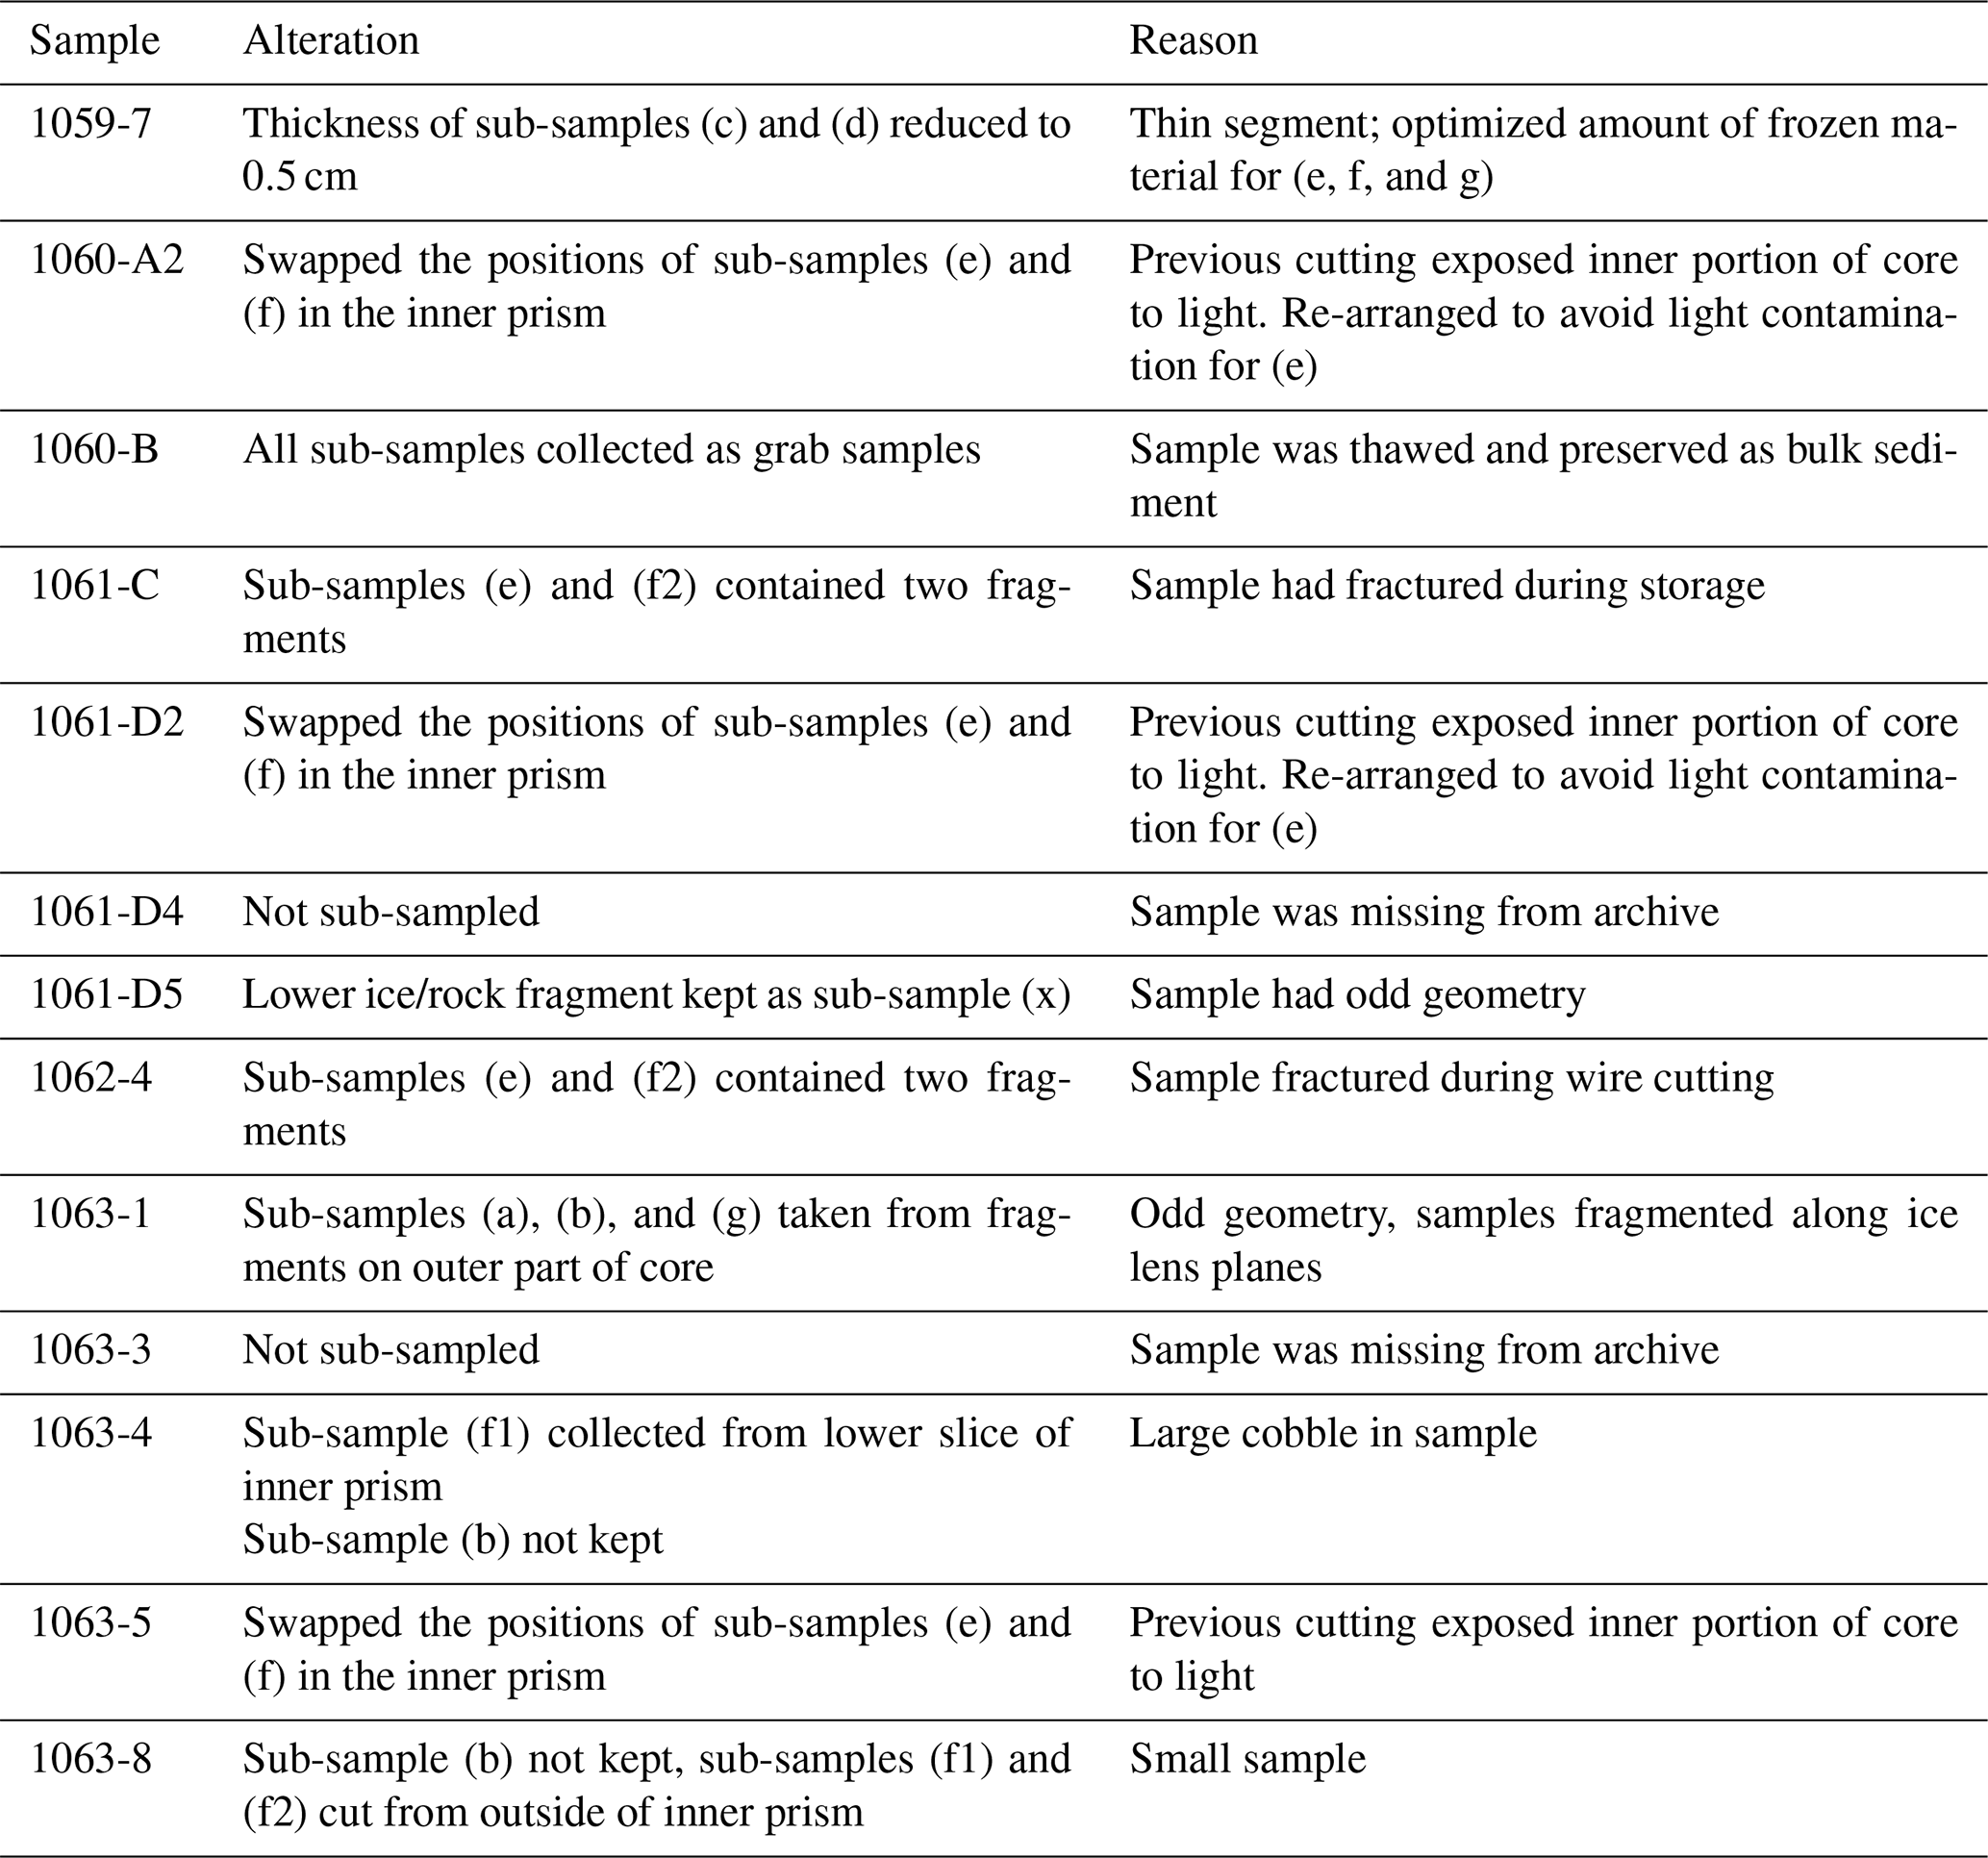
Note: this table is relevant to deviations from the cutting and sub-sampling protocols during the 2021 sampling event. Details about previous cutting, sampling activity, or alterations to the sediment archive prior to 2021 are described in the text, in Tables 5 and S9, and in Fig. 8.
3.3 Analysis of frozen sediment
Using frozen sub-samples, we measured magnetic properties (f1) and collected micro-computed tomography (µCT) scans (a) and (b). We measured the magnetic susceptibility of the frozen (f1) sub-samples from each core segment at Montclair State University. Susceptibility measurements were collected in an applied field of 200 A m−1 and at two frequencies (976 and 3904 Hz) using an AGICO MFK2A Kappabridge (Table S4). Here, we report the measurements made at 976 Hz (χ976 Hz) as the low-field susceptibility.
Samples were then measured for paleomagnetic inclination, declination, and intensity of remanence at alternating field demagnetization (AFD) levels of 0 mT (natural remnant magnetization, NRM), 10 mT, and 20 mT using an AGICO JR-6 spinner magnetometer (Table S5) and D-tech alternating field demagnetization unit. Samples were kept frozen between AFD treatments. However, by the 20 mT step, many of the frozen samples had partially deformed inside their plastic cubes, and we therefore discontinued AFD treatments. We corrected the orientations of samples that were noted to have been stored upside down at NBI by rotating the NRM vector 180° around the x axis in the sample coordinate system (Fig. 8; Tables 5, S9).
We collected µCT scans from the (a) and (b) sub-samples to create a digital, three-dimensional record and to non-destructively observe and measure sedimentological properties (e.g., porosity, grain size, and grain shape) and stratigraphic features at sub-millimeter-scale resolution. We scanned sub-samples (a) and (b) from each segment using a Bruker SkyScan 1173 µCT scanner fit for use in a −10 °C cold room at CRREL in Hanover, New Hampshire. Full-sized, ∼ 10 cm tall samples were scanned at 71 µm per pixel in the 2D cross-sectional slices that make up the image stack. However, due to the height limit of 7 cm for each scan, two overlapping 7.9 cm tall scans of the bottom and the top of each sub-sample were collected to ensure full coverage.
3.4 Processing and analysis of thawed sediment
Following full documentation and µCT scanning of sub-samples (a) and (b), we thawed these sub-samples from each segment to extract pore ice meltwater, save aliquots of bulk material, and isolate specific grain size fractions used for varied analyses. For each core segment, we placed sub-samples (a) and (b) in separate sealed plastic and glass containers, respectively, to avoid contamination for pore ice measurements designated for each sub-sample. Plastic was used for sub-sample (a) because pore ice in this sub-sample was analyzed for stable water isotopes, bulk geochemistry, and major ion chemistry. Glass was used for sub-sample (b) because pore ice in this sub-sample was analyzed for dissolved organic geochemistry.
We measured the frozen mass of each sub-sample, thawed the sub-samples overnight in a 4 °C refrigerator, and then re-measured the thawed mass to ensure that no water was lost due to evaporation. After thawing, we transferred the sediment into two 250 mL HPDE (high-density polyethylene) bottles that we centrifuged for 20 min to isolate porewater from the solids. The liquid supernatant from sub-sample (a) was transferred into a 50 mL plastic vial, and the supernatant from sub-sample (b) was transferred into a glass test tube. We recorded the mass of the melted pore ice for both sub-samples. Melted pore ice from sub-sample (a) was then stored frozen at −15 °C immediately after it was recovered. We measured pH and conductivity in melted pore ice from sub-sample (b) using calibrated, handheld Myron L conductivity and pH meters (Table S6). Melted pore ice from sub-sample (b) was transferred to a glass jar and stored frozen at −15 °C.
We recombined, gently mixed, and homogenized the wet thawed sediment from sub-samples (a) and (b) and recorded the recombined mass. We saved two bulk aliquots of the recombined sediment. First, ∼ 10 % by mass of the wet sediment was stored in a plastic bag at 4 °C as the wet bulk archive for other biological analyses (e.g., pollen, microfossils including diatoms, and macrofossil characterization). Second, 20 % by mass of the wet sediment was oven-dried at 65 °C and saved as a dried bulk archive for geological and sedimentological analyses (grain shape, particle size, meteoric 10Be, rock magnetism, and Fe-oxide analysis); the mass was recorded before and after drying to calculate the water lost (Table S7). We calculated the percent ice content by mass for each sample by subtracting the total mass of water removed for pore ice meltwater samples and the estimated loss of water from drying from the total thawed sediment mass (using the percent water lost from the bulk geological aliquot) (Table S7).
Then we wet-sieved (with deionized, 17 mOhm, DI water) the remaining thawed sediment and stored, in plastic bins, the >2000, 850–2000, 500–850, 250–500, 125–250, and 63–125 µm grain size fractions. The <63 µm fraction was stored in an acid-washed 5 gal (18.9 L) bucket and allowed to settle for at least 72 h before decanting water via suction. We transferred the settled wet <63 µm fraction into plastic bags and stored it frozen at −15 °C and then shipped the frozen samples to the University at Buffalo for lipid biomarker analyses. For grain sizes >63 µm, we visually inspected each grain size fraction for macrofossils and transferred macrofossil specimens floating in water using disposable pipettes into Petri dishes for observation and photographic documentation under a dissecting microscope. We transferred macrofossils from each grain size fraction to glass vials filled with DI water for storage at 4 °C. After removing macrofossils, we dried each grain size fraction in plastic bins at 60 °C overnight and then measured its dry mass. The dried sediment was stored in plastic bags at room temperature. We calculated the grain size distribution of each sample using the estimated total dry mass of each sample, the dried masses of each grain size fraction >63 µm, and the estimated the <63 µm mass (Table S7).
For samples composed primarily of ice rather than sediment, we adapted a different processing flow. Using a handsaw, we cut sub-samples from 1060-C4 to separate frozen sediment (1060-C4sediment) from underlying sediment-laden ice (1060-C4ice). For the ice-rich samples (1060-C4ice through 1061-D5), only one quadrant (a or b), whichever was smaller by mass, was processed according to the procedure above. The remaining quadrant remains frozen and in storage for future high-resolution stable water isotope analysis and other analyses.
This paper reports fundamental observations that we made during core processing and develops a core stratigraphy to provide context for research performed on sub-samples allocated from the core. We report data for physical properties directly measured on the core as it was processed. Other data from geochemical, isotopic, and geochronologic analyses will be reported elsewhere by scientists making those measurements. Below we detail our documentation efforts and results from processing the different sub-samples for an array of analyses (Table 3).
4.1 Sample preservation
Based on our measurements of cut-core segments and our reconstruction based on a photograph taken before the core was cut, the Camp Century subglacial core is 3.44 m long, which is slightly shorter than what was originally reported (3.55 m). This shortening could be the result of sublimation-induced drying and shrinkage. Comparison of photographs taken before 1972 CE and those taken in 2021 CE shows that there have been changes in the shape of individual core segments, including increased surface relief and deeper grooves on the surface. However, our work reveals that most of the core (28 of 32 segments) is intact; below we detail modifications and sub-sampling of the archived segments prior to this study (Tables 5, S9). Two segments (1061-D4 and 1063-3) are missing without documentation of their current location; no information exists showing that they were used for earlier analysis. Two segments were previously thawed and have been refrozen; 1060-B is loose, dry sediment, and 1061-B is loosely compacted ice particles. Table S9 outlines differences in core segment diameter between the top and bottom of the segments and evidence for an icy, flattened side/bottom of the core segments, both indicating melting, ice flow/deformation, and possible sublimation during storage.
Table 5Evidence of sub-sampling or modification of archive prior to 2021.
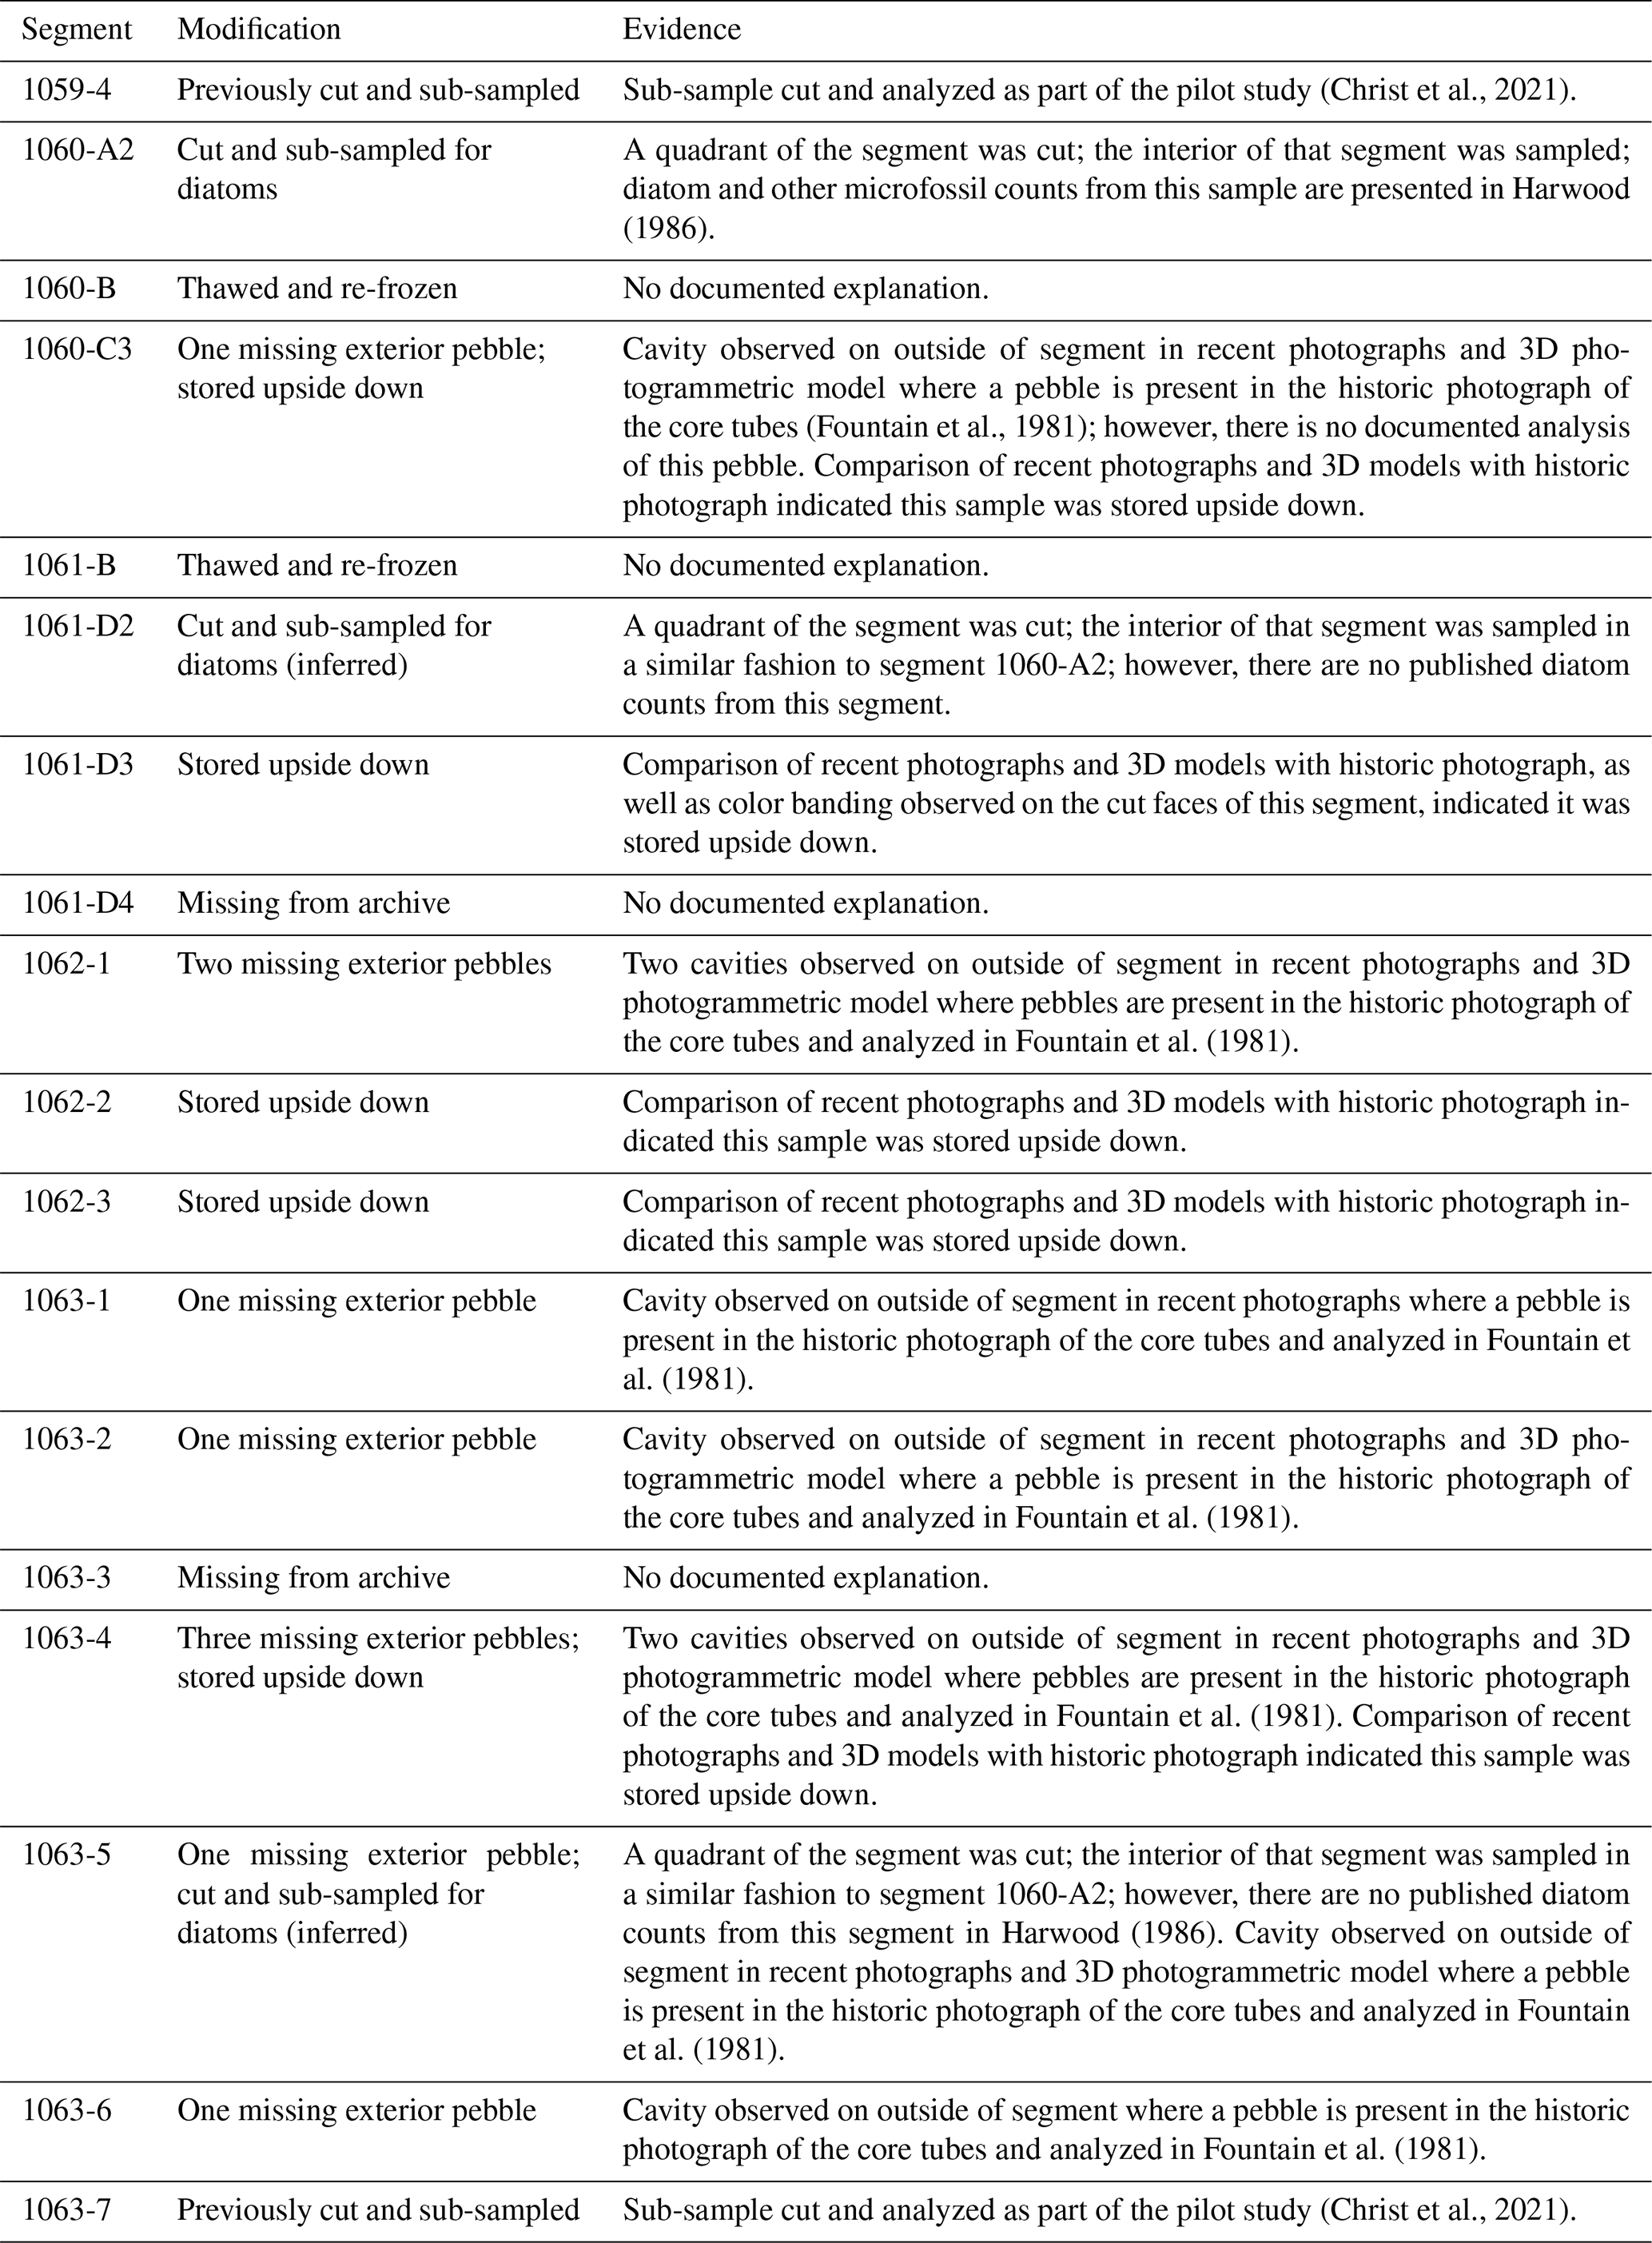
We confirmed past sampling and investigation of some core segments (Table 5; Fig. 8). A quadrant from segments 1060-A2, 1061-D2, and 1063-5 was previously cut, and ∼ 1 cm3 samples were collected from the interior of the cut quadrant of the core (Fig. 3d). These samples were presumably collected for diatom analysis, as Harwood (1986) reported abundant freshwater diatoms in segment 1060-A2; however, there is no documented record of diatom analysis in the other two segments. The outer ∼ 3 cm of two 10 cm long segments (1059-4, 1063-7) were cut, thawed, and analyzed separately in 2019 CE for a pilot study (Christ et al., 2021). We identified cavities on the exterior of several core segments, some of which correspond to pebbles that were analyzed in Fountain et al. (1981): 1062-1 (two pebbles), 1063-1 (one pebble), 1063-2 (one pebble), 1063-4 (three pebbles), 1063-5 (one pebble), and 1063-6 (one pebble).
One pebble from the exterior of segment 1060-C3 is missing, but there is no documentation of earlier sampling activity for this segment. It is possible that this is the clast Herb Ueda mentions in his oral history as having sent to a colleague in Japan (Shoemaker, 2002). Based on the comparison of the original core photograph (Fountain et al., 1981) with recent photographs, 3D photogrammetric models, and visual inspection of the core interior, we identified six core segments that were stratigraphically inverted during storage: 1060-C3, 1061-D3, 1062-2, 1062-3, 1063-4, and 1063-7. Additionally, one side of several segments had a flat icy surface, which may have formed due to partial thawing and refreezing of these segments when they were removed for sampling or photography in the past (e.g., Fig. 3c; Table S9). All other segments were cylindrical and therefore had not deformed or melted.
4.2 Sedimentology and stratigraphy
Based on the grain size distribution, the pore ice content, and sedimentary structures seen on the core cut faces, we identified five stratigraphic units in the Camp Century subglacial material (Fig. 8). At the base of the core, Unit 1 (215 to 344 cm depth below the ice–sediment interface; segments 1063-8 through 1061-D5) is an olive grey (5Y 4/2) homogeneous, poorly sorted, clay-rich diamicton (all colors are Munsell designations). Pebbles and cobbles are sub-angular to sub-rounded. Pebbles are composed of a variety of lithologies (including granite, gabbro, tonalite, and sandstone); several cobbles in this unit were previously sampled and petrologically analyzed (Fountain et al., 1981). Unit 1 is 11 ± 4 % ice by mass and has sub-horizontal millimeter-scale ice lenses with thicknesses ranging from 1 to 2 mm and spacing ranging from 1 to 5 cm. Ice lenses generally do not intersect pebbles, and some ice lenses intersect each other. The contact between Units 1 and 2 is not readily observable due to the fractured and non-cylindrical geometry of core segment 1061-D5 but is suggested by a shift from clay-rich diamicton to sediment-laden ice at 215 cm depth.
Unit 2 (112 to 215 cm depth; segments 1061-D5 through 1060-C4ice) is composed of olive (5 Y 4/4) sediment-laden ice, having sub-vertical inclusions of ice that are longer than they are wide and without sediment. The sediment-laden ice of Unit 2 is clearly distinct from the rest of the subglacial material (Herron and Langway, 1979). Ice lenses commonly crosscut each other and show tight folded structures based on visual observations. The lower half of Unit 2 (158 to 215 cm depth) displays horizontal color banding between light olive brown (2.5 Y 5/6) ice and brown (10 YR 3/2) ice that likely corresponds to greater sediment content that is mostly silt and clay (72 % to 78 %), with minor amounts of fine to medium sand and rare pebbles. Segment 1061-B (140 to 158 cm depth) was previously thawed and refrozen, so there is no observable stratigraphy or structure in that segment. The upper part of Unit 2 (112 to 140 cm depth) is moderate orange (10 Y 3/2) silty ice with brown (7.5 YR 2/4) sub-vertical ice-filled lenses. Sediment content is low (4 to 10 % by mass) and is dominated by silt and clay (84 %) with minor amounts of fine sand and rare pebbles in an ice matrix. Sediment content and grain size decreases in the upper 70 cm of Unit 2. The contact between Units 2 and 3 (112 cm depth; segment 1060-C4) has pebbly gravel resting over a very irregular ice surface.
Unit 3 (85 to 112 cm depth; segments 1060-C4 sediment through 1060-C1) is dark olive grey sediment (2.5 GY 4/2) that fines upward from a pebble gravel to sand and mud in a dark amber (7.5 Y 3/4) ice-supported matrix (22 to 49 % ice by mass); sediment is concentrated in deformed bands separated by ice. This unit has abundant macrofossils. Unit 4 (55 to 85 cm depth; segments 1060-C1 through 1060-B) is dark greenish grey (10 Y 4/2) very fine and fine sand with slightly inclined bedding. Due to prior melting of segment 1060-B, we cannot evaluate the ice content within much of this unit. There is a gradational contact between Units 4 and 5 at ∼ 55 cm. Unit 5 (0 to 55 cm depth; segments 1060-A2 through 1059-4) is olive grey (5 Y 4/2) bedded medium and coarse sand that is 15 % ice by mass.
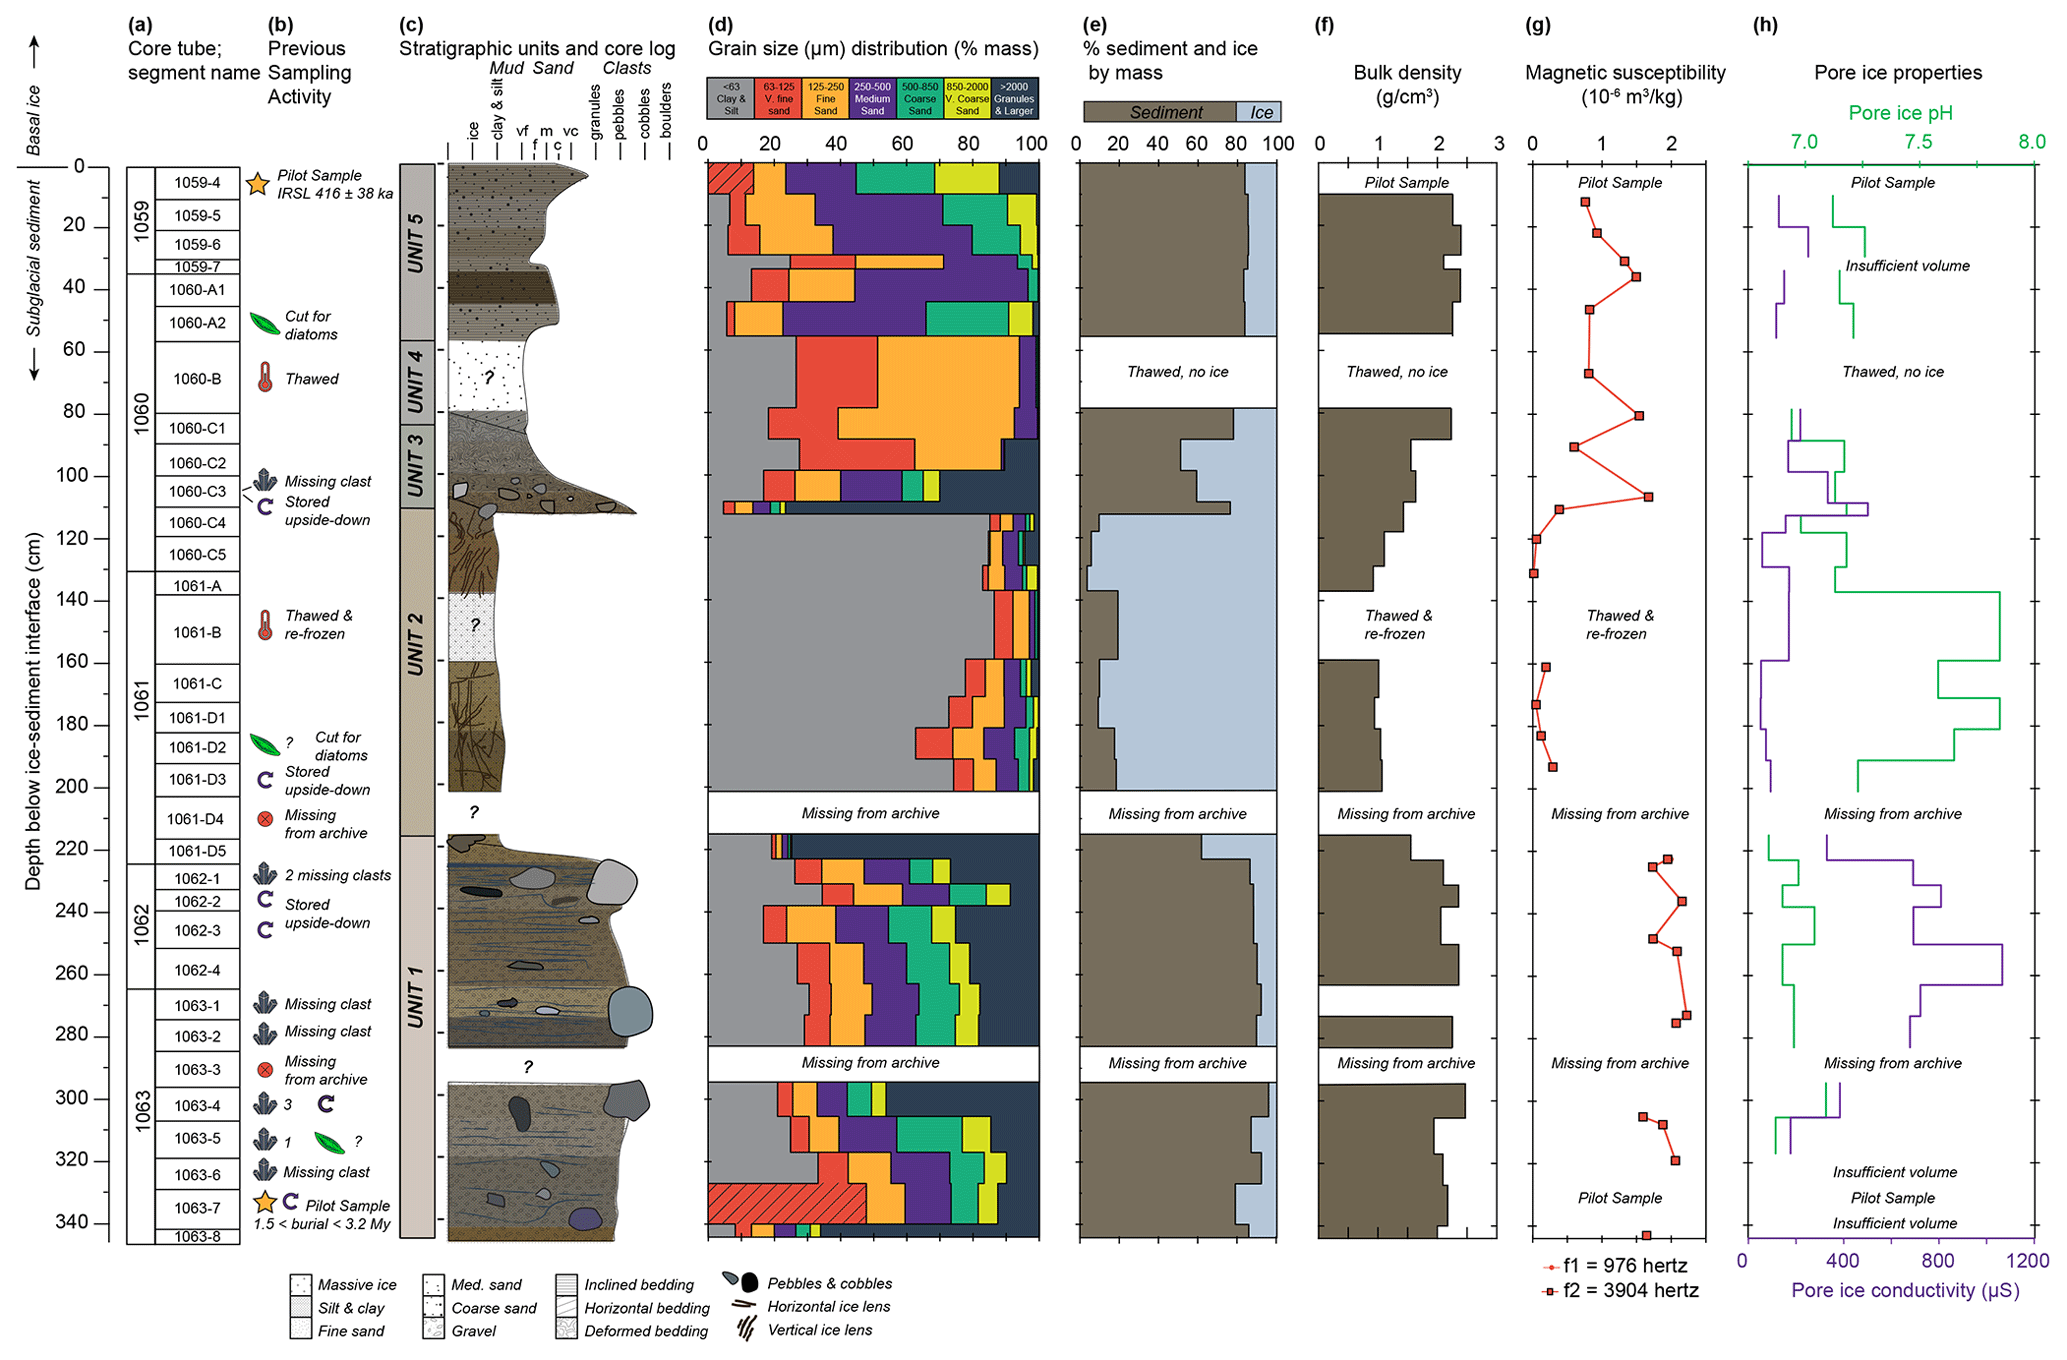
Figure 8Results compiled from sample documentation and processing (from left to right). (a) Core tube numbers and sample names created when the core was cut in 1972 CE. (b) Evidence of altered, previously investigated, or missing samples based on literature, photographs, and recent documentation. (c) Stratigraphic units and core log. The color corresponds to the average soil color of each sample segment; vf is for very fine sand, f is for fine sand, m is for medium sand, c is for coarse sand, and vc is for very coarse sand. (d) Grain size distribution (by mass) measured from wet-sieving. The dashed pattern in 63–125 µm for segments 1059-4 and 1063-7 denotes the <125 µm fraction. (e) Percent sediment and ice content (by mass). (f) Frozen bulk density. (g) Magnetic susceptibility (χ) measured at 976 Hz. (h) Pore ice pH and conductivity. Gaps in datasets due to thawed or missing segments, insufficient pore water, non-cylindrical geometries, or analyses not made on pilot samples. Dates in column B from Christ et al. (2021, 2023).
4.3 Physical characteristics
Bulk density and χ976 Hz measurements (Fig. 8f, g) both correspond to the stratigraphy and sediment content with generally higher values in the sediment-rich units and lower values in ice-rich units. Bulk density is 2.2 ± 0.2 g cm−3 (mean ± 1σ) in Unit 1, decreases to 1.1 ± 0.2 g cm−3 in Unit 2, increases to 1.7 ± 0.3 g cm−3 in Unit 3, and then increases to 2.3 ± 0.1 g cm−3 in Units 4 and 5. At some levels, there is an apparent discrepancy between density and ice content, which is mainly due to our sub-sampling approach used to measure the ice proportion, while the bulk density was done on longer, full ice cylinders at lower resolution. Moreover, the contact between Units 2 and 3 is not horizontal but tilted; several cobbles are also embedded in the top of unit 2. χ976 Hz values are greatest in Unit 1 (1.93 ± 0.22 × 10⁻⁶ m3 kg−1); lowest in Unit 2 (0.16 ± 0.14 × 10⁻⁶ m3 kg−1), where sediment is substantially diluted by ice; variable in Unit 3 (1.27 ± 0.59 × 10⁻⁶ m3 kg−1); and similar through Units 4 and 5 (1.03 ± 0.31 × 10⁻⁶ m3 kg−1).
4.4 Paleomagnetic measurements
Paleomagnetic inclinations in Units 1, 3, 4 and 5 are highly variable (Table S5). We do not consider the silty ice of Unit 2, >80 % ice, to be a reliable geomagnetic field recorder. The steepest inclinations were observed at the 0 mT (NRM) AFD level, which may reflect the acquisition of a viscous remanence in the downward direction (+Z in the sample coordinate system) while in storage at NBI. Inclinations at the 10 and 20 mT AFD levels are shallower than the expected geocentric axial dipole value of 84° at the site latitude, which could result from compaction of subglacial diamicton, post-depositional slumping, disturbance from permafrost, or partial thawing of the sample during the AFD treatments and measurements.
Identification of normal or reversed polarity is possible from subglacial and grounding line sediment (Wilson et al., 2012; Hodson et al., 2016), though challenging in the Camp Century core due to our limited number of AFD levels. Most of our samples display positive inclinations, consistent with normal polarity, with the possibility of three reversed polarity or excursion intervals in Units 1 and 2 recorded in samples 1061-D1, 1061-D3, and 1062-3. Although the AFD data are limited, these samples display inclinations that become progressively more negative at higher alternating field (AF) levels, consistent with removal of vertically downward overprint, or inclinations that remain moderately negative at all AFD levels.
4.5 Pore ice pH and conductivity
In general, melted pore ice pH and conductivity are inversely related throughout the core (Fig. 8h). Conductivity is the lowest in Unit 2, with the highest percentage of ice by mass, and higher in the other units, with maximum values occurring where the percentage of fine grains is the highest. In contrast, pH is the inverse of the bulk density profile, with lower values in sediment-rich units (i.e., Units 1–3 and 5) and higher values in ice-rich units (i.e., Unit 2). Unit 1 generally has the lowest pH (mean ± 1σ; 6.96 ± 0.07) and highest conductivity values (653 ± 250 µS; maximum 1066 µS), while Unit 2 has the highest and most variable pH (7.37 ± 0.35) and lowest conductivity values (129 ± 85 µS; minimum 52.1 µS). In Unit 3, conductivity increases up-core from 168 to 502 µS but displays stable pH values (7.11 ± 0.10). Units 4 and 5 have similar pH (7.14 ± 0.11) and low conductivity (174 ± 53 µS).
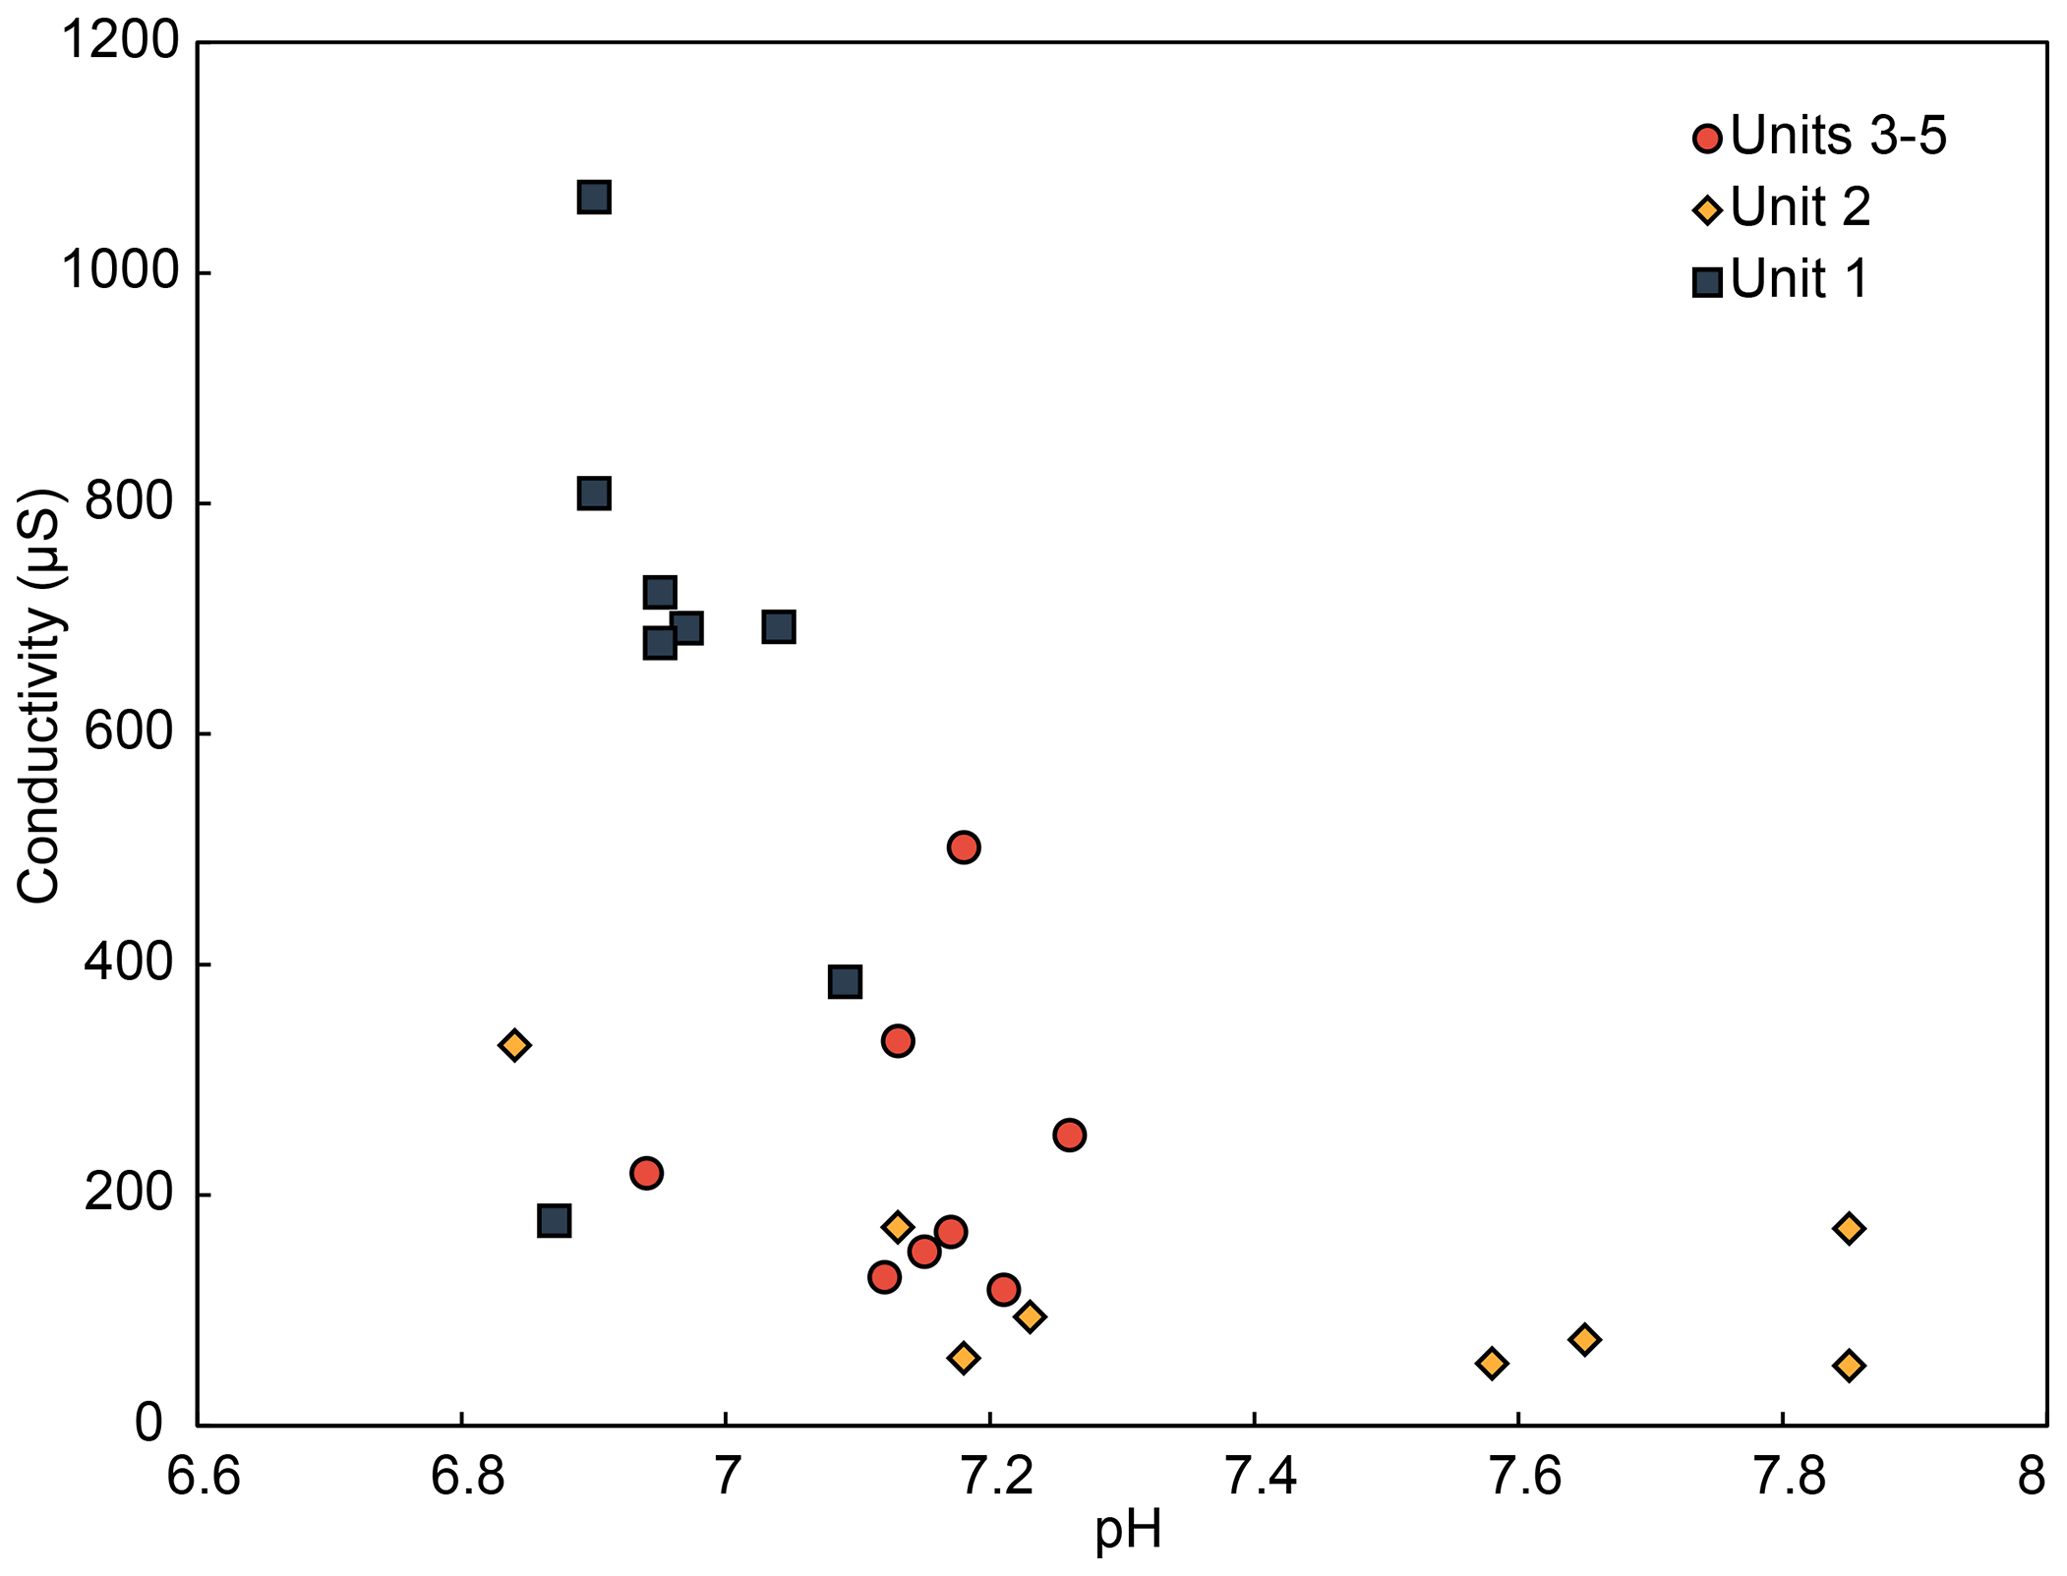
The controls on pore ice pH and conductivity likely differ between the units due to varying sediment and ice content, as well as depositional and pore water history. Regression analysis shows no significant correlation between any combination of conductivity, pH, and grain size, but there is distinct clustering; for example, Fig. 9 shows that water isolated from Unit 1 has little variance in pH but large variance in conductivity. The former is likely the result of sediment buffering capacity, and the latter is possibly the result of sediment–water interactions during weathering and the competing processes of dilution by meteoric waters and the chemical weathering of the sediment. In contrast, the sediment-laden ice of Unit 2 has consistently low conductivity but a wide variance in pH, likely the result of low buffering capacity and the paucity of sediment grains that in the presence of liquid water provide ions that would increase conductivity.
4.6 Macrofossils
Macrofossil remains are present in all sub-samples we examined (Fig. 10). Initial observation and photographic documentation of isolated macrofossils in sub-samples (a) and (b) indicates that plant macrofossil remains are present in all units and most abundant in Units 3 and 4 and that insect remains are present in Units 1, 3, and 5. Macrofossils are least abundant in Unit 2. The quality of macrofossil preservation is consistently better in the largest size fractions, namely 850–2000 and >2000 µm. In Unit 1, samples hold primarily woody debris and bryophyte leaves or stem fragments. Near the interface between Units 1 and 2, sample 1062-1 has insect remains, including chironomid larval head capsules. Unit 2 contains sparse plant remains and mostly fragments of bryophyte leaves. Within Unit 3, a partial chironomid pupa was recovered from sample 1060-C1. Macrofossils in Unit 4, sample 1060-B, are abundant and distinct from those of samples below, including fungal sclerotia. Within Unit 5, samples 1060-A1 and 1059-5 have chironomid larval head capsules.
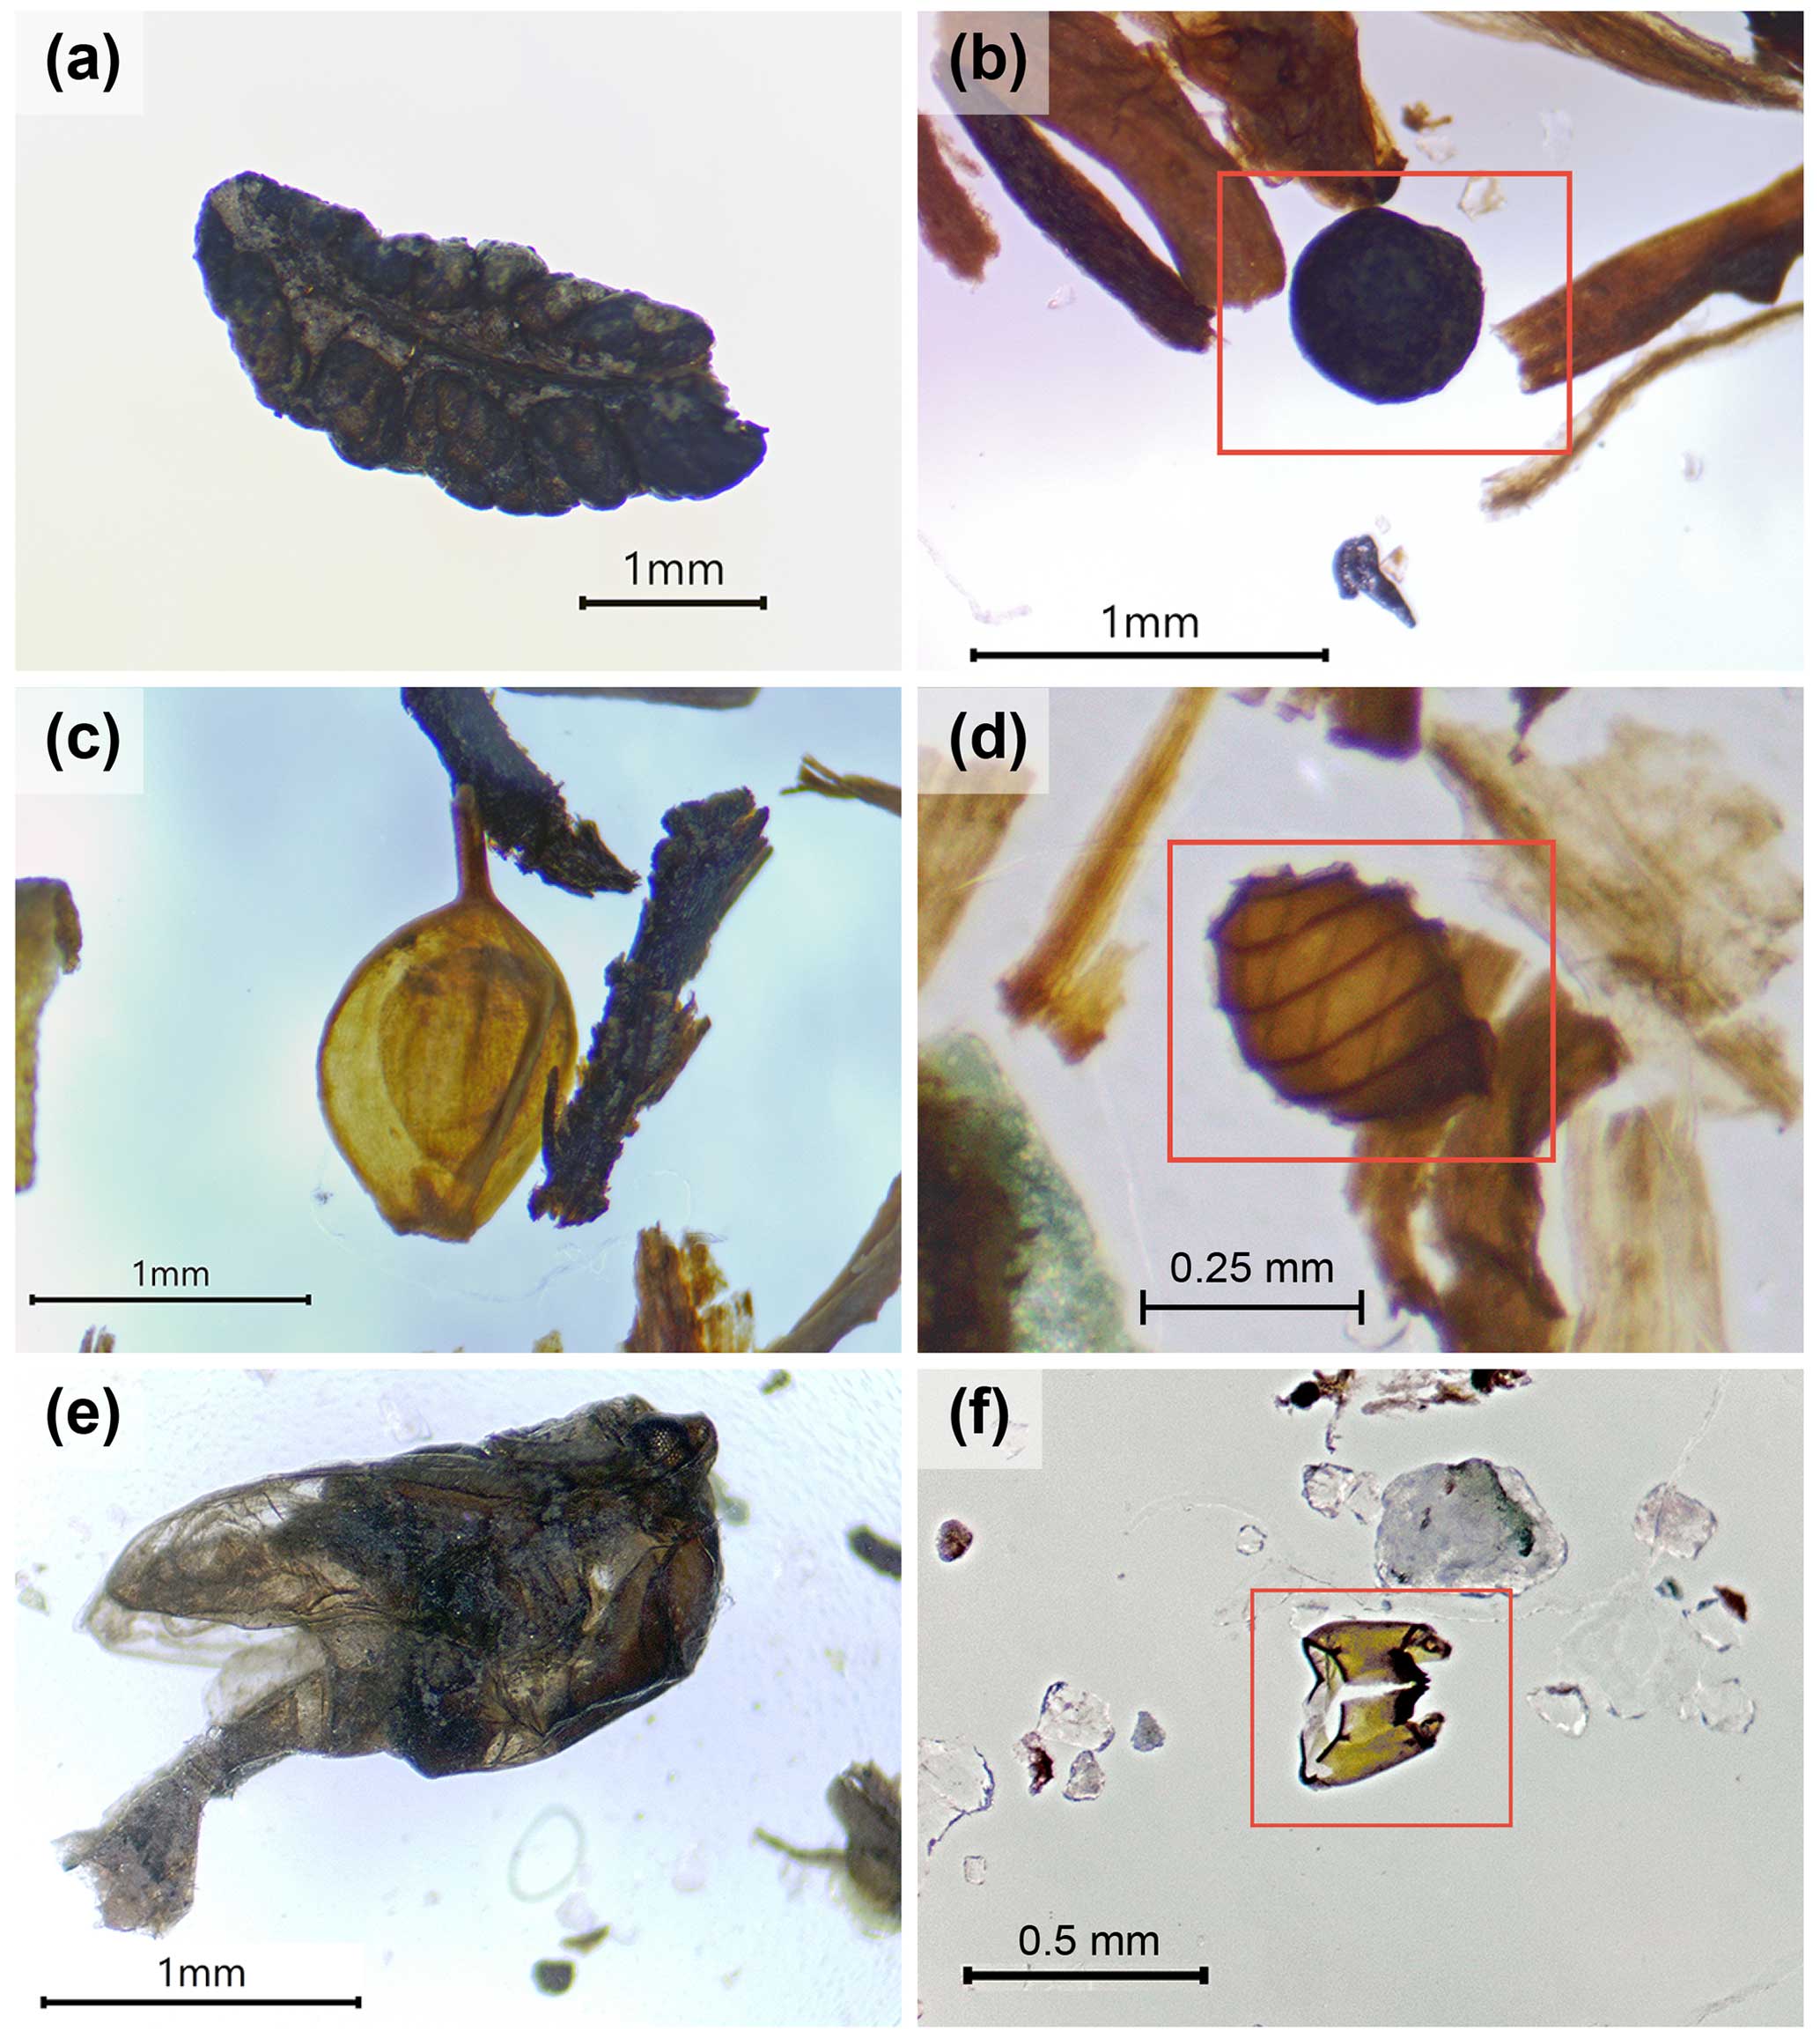
Figure 10Examples of macrofossils recovered during wet-sieving: (a) Dryas octopetala leaf (1060-A2); (b) Cenococcum geophilum sclerotium (red rectangle) (1060-C2); (c) Cyperaceae seed (1060-C1); (d) Characeae oospore (red rectangle) (1060-C1); (e) partial chironomid pupa (1060-C1); (f) chironomid larval head capsule (1062-1).
5.1 Initial interpretation of subglacial core stratigraphy and paleo-environments
The Camp Century subglacial material preserves evidence for different surface and depositional processes in both glaciated and ice-free environments. The absence of stratification, variable grain size, shape, and poor sorting suggest that the diamicton at the base of the core (Unit 1) was most likely subglacially deposited as a basal till. The fragmented macrofossil remains in Unit 1 are derived from a non-glaciated landscape and were incorporated into the till most likely either by overriding ice or surface mass movement. The presence of millimeter-scale ice lenses throughout Unit 1 are consistent with permafrost activity.
The contact between Units 1 and 2 marks a shift from predominantly sediment to ice-dominated subglacial materials. Unit 2, sediment-laden ice, has near-vertical ice-filled fractures. The origin of the ice in Unit 2 is not clear based on physical observations alone. It could be remnant basal glacial ice, residual firn, or represent a thermokarst pond or other small, sequentially frozen waterbody or could be a lens of permafrost ground ice or segregation ice. Further analysis, including chronological and stable water isotope data, will better show how this unit formed. The unconformable contact between Units 2 and 3, along with upward fining grain size and abundant plant macrofossils, suggests the sediment in Unit 3 might have been deposited by slumping (or by another process that had sufficient power to erode Unit 2). The very fine-grained to fine-grained bedded sand with abundant macrofossils in Unit 4 suggests subsequent subaerial sediment deposition by low-energy flowing water. The coarsening in grain size up-core from Units 4 to 5 suggests sediment deposition by higher-energy water. The abundance of well-preserved and delicate macrofossil fragments demonstrates the presence of a subaerial ecosystem during the deposition of Units 3, 4, and 5. Luminescence dating of the uppermost sample in Unit 5 indicates it was last exposed to light 416 ± 38 ka, coincident with the Marine Isotope Stage 11 interglacial (Christ et al., 2023).
The preservation of delicate frozen macrofossils and bedding suggests that the internal of the Camp Century subglacial sediment in Units 3, 4 and 5 have not been deformed – future fabric and/or micromorphology analysis could affirm the validity of this observation. Basal borehole temperatures at Camp Century (−13.0 °C at the time of drilling; −11.8 °C corrected for pressure melting using local ice thickness) are far below the pressure melting point (MacGregor et al., 2016), indicating that the northwestern Greenland Ice Sheet is presently cold-based and therefore non-erosive. The basal thermal state, and thus erosional character, of this sector of the ice sheet has likely varied in the time since the sediment was deposited and over-ridden by ice; however, we have no way to determine if or how much overlying sediment was initially present and then eroded after deposition.
5.2 Lessons learned about the acquisition and sampling of basal ice core materials
The Camp Century subglacial core is a unique archive. It was the first subglacial archive recovered from beneath any ice sheet and remains well preserved. Apart from two missing samples and two previously thawed samples, the rest of the archive was still frozen and intact in 2019 CE when we began our work.
While the historic documentation of earlier cutting, sampling, and core-handling activities is incomplete, the excellent preservation of this archive allowed us to reconstruct the original orientation of the subglacial material and then design and execute a detailed and comprehensive sampling and analysis plan. We archived, handled, and processed this sediment to ensure that future studies are not compromised either due to contamination or inadvertent loss of material useful for varied analytical techniques that have yet to be developed.
The framework that we devised in this study draws upon the sub-sampling approaches commonly used for ice cores, lake, and marine sediment cores, which save archival material and allocate samples for a variety of analyses (e.g., Souney et al., 2014; McKay et al., 2019; Priscu and SALSA Science Team, 2021; Hodson et al., 2016). These large community efforts today devise sampling plans that consider analytical techniques prior to core collection. In contrast, we devised our plan 55 years after core recovery. We share this historical documentation, intentional core cutting and sub-sampling design, and results as a guide for the many on-going and future analyses of the Camp Century subglacial archive that will shed light on the paleoclimate conditions, ice-free ecosystems, surface and subglacial processes, and chronology of sediment deposition.
This analytical framework could also be useful as a baseline for the study of other subglacial materials, since our preliminary results (Christ et al., 2021) demonstrate that small amounts of rare, archival sub-ice material can be used to answer pressing questions in paleoclimate, such as the long-term history of ice sheets. The approach we outline here is currently being used not only for the U.S. National Science Foundation funded project (lead investigator, Paul. R. Bierman, University of Vermont) to understand the sub-ice material from Camp Century but also by a European Research Council Project (Green2Ice lead investigator, Dorthe Dahl-Jensen, University of Copenhagen) focused on basal ice and subglacial material from several ice cores, including historical ones from Camp Century and the Greenland Ice Core Project (GRIP).
Our work with the Camp Century core suggests ways in which future subglacial materials could be acquired and treated to minimize contamination and maximize scientific impact. Based on our experiences, we make five specific suggestions.
-
Collecting and preserving sediment and the top of bedrock without light exposure allows them to be dated by luminescence and prevents degradation of biochemical records. While not originally collected or stored in red light and light-proof conditions, we were able to sub-sample the Camp Century core segments in light-safe manner. More recent coring campaigns are implementing luminescence-safe sample collection procedures (e.g., EastGRIP, NEEM, and GreenDrill).
-
Making extensive documentation of core recovery, including accurate assessment of percent recovery during drilling is also important for understanding the continuity of core sections. Obtaining and preserving information about core orientation is essential for paleomagnetic and structural studies.
-
Maintaining detailed records of transport and storage conditions, as well as sample allocation, treatment, and usage, from the time of core collection onward is important for future analyses. Considering ways to minimize contamination in sample collection, storage, and transport is key for biologic studies. For example, a modern carpet beetle made its way into one of the Camp Century samples sometime over the last 50+ years.
-
Facilitating analysis of biomarkers, including lipids and DNA, drilling, and sampling in a way that avoids inadvertent contamination is important. Advances could include the use of hydrocarbon-free drilling fluid and the maintenance of sterile conditions for collection of DNA and RNA samples – realizing, of course, limitations of the polar environment (although such work has been pioneered in sub-ice Antarctic lakes) (Hodson et al., 2016; Priscu and SALSA Science Team, 2021). Retention of representative samples of drilling fluids is key for determining blank levels for later chemical analyses.
-
Performing bulk density measurements on cores immediately after they are extracted and again when they are cut will provide information about changes over time as cores are stored in freezers.
Working with the Camp Century subglacial archive has taught us the importance documenting all sampling activities and the value of sustained funding and support for ice core storage facilities that make it possible for future researchers to come back to a core many decades later.
5.3 Outstanding research questions
Although recent (Christ et al., 2021, 2023) and prior research (Whalley and Langway, 1980; Fountain et al., 1981; Harwood, 1986) involving the Camp Century subglacial core has already revealed much about the history of northwestern Greenland, there is much more to do and learn. Christ et al. (2021) and (2023) provide a glimpse into the richness and complexity of interpreting subglacial sediment archives using modern analytical techniques and large, international, and collaborative teams. We now know that the uppermost sample was exposed at the surface during MIS 11 and that the till at the base of the core has been buried no more than 3.2 Myr, but we have little knowledge of the age of the units in between. More temporal information will come as cosmogenic and luminescence analyses are completed on the rest of the core. Almost the entire core contains macrofossils which reveal the composition of interglacial ecosystems. Although many macrofossils have been identified using reference collections (Fig. 10), biochemical analyses in process using biomarkers, including DNA and lipids, will further characterize biologic molecules preserved in the core materials. Geochemical analysis of both sediment and porewater will refine our understanding of water–rock interaction in the past, while geochronological measurements will enhance our understanding of sediment provenance.
The most important implication of the Camp Century subglacial core is not the specific knowledge that will be gained about the history of ice, ecosystems, climate, and sediments of northwestern Greenland, but the realization that subglacial archives hold such a rich, albeit complex, record of the past. It is this complexity that provides the richness but demands the application of many and varied analytical techniques as we begin to demonstrate here. Combined with analysis of the basal and clear ice above, as well as the bedrock below, cores collected from beneath ice sheets are poised to provide the information needed to understand the behavior of the Greenland and Antarctic ice sheets in the past and thus allow better prediction of their future and, as a result, ours. Recovering more cores through the ice and into the sediment and bedrock below should be a high priority of the cryosphere science community.
We provide data in the tables in the paper and Supplement. Photogrammetric models of most core segments are available for viewing and download at this online, public repository: https://www.morphosource.org/concern/cultural_heritage_objects/000583438 (MorphoSource, 2023).
The archive half of the Camp Century sub-ice and basal ice core remains frozen at the NBI in Copenhagen and will be accessible for further analyses upon application to the ice core facility there and a plan for collaboration with Danish scientists who now control, via their sample distribution committee, access to the core materials. Similarly, material from Camp Century presently in the United States and not consumed for analyses, both at UVM and with investigators at institutions listed in Table 3, will be sent to the National Science Foundation Ice Core Facility for preservation and future distribution. It will be available, after the current NSF support ends, by application and approval of a sample request to the sample allocation committee with the collaboration and support of American scientists.
The supplement related to this article is available online at: https://doi.org/10.5194/tc-18-4029-2024-supplement.
AJC and PRB designed the sample processing methodology with input from TMR and EKT. JLT, PHB, FF, and AJC did core logging, cut the core, and made initial observations and interpretation. AJC and SB conducted χ and NRM measurements. AJC wrote the initial draft and drafted the initial figures with input and data from PRB, HMM, JS, and CMC. All authors read and edited several drafts of the paper. PRB did several rounds of revision of the text and figures with the authors and submitted the paper.
At least one of the (co-)authors is a member of the editorial board of The Cryosphere. The peer-review process was guided by an independent editor, and the authors also have no other competing interests to declare.
The findings and conclusions in this article are those of the authors and do not necessarily represent the views of their corresponding affiliated organization.
Publisher’s note: Copernicus Publications remains neutral with regard to jurisdictional claims made in the text, published maps, institutional affiliations, or any other geographical representation in this paper. While Copernicus Publications makes every effort to include appropriate place names, the final responsibility lies with the authors.
This article is part of the special issue “The Camp Century ice and sediment core: new science from a 1966 core that touched the base of the Greenland ice sheet”. It is not associated with a conference.
Funding for core analysis has been provided by the National Science Foundation (grant nos. NSF-OPP-2114629, 2114630, and 2114632) for Paul R. Bierman, Tammy M. Rittenour, and Elizabeth K. Thomas. Laboratory support at the University of Vermont received funding from the National Science Foundation (grant nos. NSF-EAR-1735676 and NSF-EAR-1735676) for Paul R. Bierman and Lee Corbett. Andrew J. Christ's work has been supported in part by a postdoctoral fellowship from the Gund Institute for Environment, University of Vermont. François Fripiat and Jean-Louis Tison have received funding from the FNRS-FRS (National Fund for Scientific Research) for the AEROBIC project (grant no. CDR.J.0080.22) and the Subventions Jaumotte-Demoulin for the GENIAL project. We thank the staff of the ice core facility in Copenhagen, particularly Dorthe Dahl-Jensen and Jørgen Peder Steffensen, for preserving the sub-ice core since 1994 and for providing support during sampling.
This research has been supported by the National Science Foundation (grant nos. OPP-2114629, 2114630, and 2114632 and grant nos. NSF-EAR-1735676 and 2300560). Research also received funding from the European Research Council under the Green2Ice Synergy project (grant no. 101072180).
This paper was edited by Nanna Bjørnholt Karlsson and reviewed by Mike Bentley and two anonymous referees.
Abele, G.: SR-62 Construction of a Snow Runway at Camp Century for Wheel Landings with Lightweight Aircraft, https://erdc-library.erdc.dren.mil/jspui/bitstream/11681/11581/1/SR-62.pdf (last access: 17 August 2024), 1964.
Anonymous: “Ancient Air' held in polar ice cores, Tallahassee Democr., 1959.
Bader, H.: Special Report 58: Scope, Problems, and Potential Value of deep ice Core Drilling in Ice Sheets, Hanover, 1962.
Berner, W., Stauffer, B., and Oeschger, H: Past Atmospheric Composition and Climate, Gas Parameters Measured on Ice Cores, Nature, 276, 53–55, https://doi.org/10.1038/276053a0, 1978.
Blard, P.-H., Protin, M., Tison, J.-L., Fripiat, F., Dahl-Jensen, D., Steffensen, J. P., Mahaney, W. C., Bierman, P. R., Christ, A. J., Corbett, L. B., Debaille, V., Rigaudier, T., Claeys, P., and Team, A.: Basal debris of the NEEM ice core, Greenland: a window into sub-ice sheet geology, basal ice processes and ice sheet oscillations, J. Glaciol., 69, 1011–1029, https://doi.org/10.1017/jog.2022.122, 2023.
Christ, A. J., Bierman, P. R., Schaefer, J. M., Dahl-Jensen, D., Steffensen, J. P., Corbett, L. B., Peteet, D., Thomas, E. K., Steig, E. J., Rittenour, T. M., Tison, J.-L., Blard, P. H., Perdrial, N., Dethier, D., Lini, A., Hidy, A. J., Caffee, M. W., and Southon, J. R.: A multi-million-year-old record of Greenland vegetation and glacial history preserved in sediment beneath 1.4 km of ice at Camp Century, P. Natl. Acad. Sci. USA, 118, e2021442118, https://doi.org/10.1073/pnas.2021442118, 2021.
Christ, A. J., Rittenour, T. M., Bierman, P. R., Keisling, B. A., Knutz, P. C., Thomsen, T. B., Keulen, N., Fosdick, J. C., Hemming, S. R., Tison, J., Blard, P., Steffensen, J. P., Caffee, M. W., and Corbett, L. B.: Deglaciation of northwestern Greenland during Marine Isotope Stage 11, Science, 381, 330–335, https://doi.org/10.1126/science.ade4248, 2023.
Clark, E.: Technical Report 174: Camp Century Evolution of Concept and History of Design Construction and perfromance, https://apps.dtic.mil/sti/pdfs/AD0477706.pdf (last access: 17 August 2024), 1966.
Corliss, W. R.: Power Reactors in Small Packages, United States, https://www.osti.gov/includes/opennet/includes/Understanding the Atom/Power Reactors in Small Packages V.2.pdf (last access: 17 August 2024), 1968.
Dansgaard, W.: The Abundance of O18 in Atmospheric Water and Water Vapour, Tellus, 5, 461–469, https://doi.org/10.1111/j.2153-3490.1953.tb01076.x, 1953.
Dansgaard, W.: The O18-abundance in fresh water, Geochim. Cosmochim. Ac., 6, 241–260, https://doi.org/10.1016/0016-7037(54)90003-4, 1954.
Dansgaard, W., Johnsen, S. J., Møller, J., and Langway, C. C.: One Thousand Centuries of Climatic Record from Camp Century on the Greenland Ice Sheet, Science, 166, 377–381, https://doi.org/10.1126/science.166.3903.377, 1969.
Daugherty, C. M.: City Under the Ice, The Macmillan Company, New York, 158 pp., 1963.
Doel, R. E., Harper, K. C., and Heymann, M.: Exploring Greenland: Cold War Science and Technology on Ice, edited by: Ronald E. Doel, K. C. Harper, and M. Heymann, Palgrave Macmillan, New York, ISBN 978-1137596871, 2017.
Epstein, S. and Sharp, R.: Oxygen Isotope Studies, National Acad. Sci. IGY Bull. #21, Transactions, Am. Geophys. Union, 40, 81–84, 1959.
Fountain, J., Usselman, T. M., Wooden, J., and Langway, C. C.: Evidence of the Bedrock Beneath the Greenland Ice Sheet Near Camp Century, Greenland, J. Glaciol., 27, 193–197, https://doi.org/10.1017/S0022143000011370, 1981.
Goossens, T., Sapart, C. J., Dahl-Jensen, D., Popp, T., El Amri, S., and Tison, J.-L.: A comprehensive interpretation of the NEEM basal ice build-up using a multi-parametric approach, The Cryosphere, 10, 553–567, https://doi.org/10.5194/tc-10-553-2016, 2016.
Gow, A. J. and Meese, D. A.: Nature of basal debris in the GISP2 and Byrd ice cores and its relevance to bed processes, Ann. Glaciol., 22, 134–140, https://doi.org/10.3189/1996aog22-1-134-140, 1996.
Hansen, B. L.: Deep Core Drilling in Ice, Mem. Natl. Inst. Polar Res. Spec. Issue, 49, 5–8, https://scholar.google.com/scholar?cluster=82144692841318147&hl=en&as_sdt=0,46(last access: 17 August 2024), 1994.
Hansen, B. L. and Langway, C.: Deep core drilling in ice and core analysis at Camp Century, Greenland, 1961–66, Antarct. J. United States, Sept–Oct, 207–208, 1966.
Harwood, D. M.: Do Diatoms beneath the Greenland Ice Sheet Indicate Interglacials Warmer than Present?, Arctic, 39, 304–308, 1986.
Herron, S. and Langway, C. C.: The debris-laden ice at the bottom of the Greenland Ice Sheet, J. Glaciol., 23, 193–207, 1979.
Herron, S. L. and Langway, C. C.: A Comparison of Ice Fabrics and Textures at Camp Century, Greenland and Byrd Station, Antarctica, Ann. Glaciol., 3, 118–124, https://doi.org/10.3189/s0260305500002639, 1982.
Hodson, T. O., Powell, R. D., Brachfeld, S. A., Tulaczyk, S., and Scherer, R. P.: Physical processes in Subglacial Lake Whillans, West Antarctica: Inferences from sediment cores, Earth Planet. Sc. Lett., 444, 56–63, https://doi.org/10.1016/J.EPSL.2016.03.036, 2016.
Langway, C. C.: The history of early polar ice cores, Cold Reg. Sci. Technol., 52, 101–117, https://doi.org/10.1016/j.coldregions.2008.01.001, 2008.
Langway, C. C.: A 400 Meter Deep Ice Core in Greenland: Preliminary Report, J. Glaciol., 3, 217–217, https://doi.org/10.3189/s0022143000024278, 1958.
Langway, C. C. and Hansen, B. L.: Drilling Through the Ice Cap: Probing Climate for a Thousand Centuries, Bull. At. Sci., 26, 62–66, https://doi.org/10.1080/00963402.1970.11457874, 1970.
Licht, K. J. and Hemming, S. R.: Analysis of Antarctic glaciogenic sediment provenance through geochemical and petrologic applications, Quaternary Sci. Rev., 164, 1–24, https://doi.org/10.1016/J.QUASCIREV.2017.03.009, 2017.
MacGregor, J., Fahnestock, M. A., Catania, G., Aschwanden, A., Clow, G. D., Colgan, W. T., Gogineni, S. P., Morlighem, M., Nowicki, S., Paden, J., Price, S. F., and Seroussi, H.: A synthesis of the basal thermal state of the Greenland Ice Sheet, J. Geophys. Res.-Earth, 121, 1328–1350, https://doi.org/10.1002/2015JF003803, 2016.
McKay, R. M., Santis, L. De, Kulhanek, D. K., Ash, J. L., Beny, F., Browne, I. M., Cortese, G., Sousa, I. M. C. de, Dodd, J. P., Esper, O. M., Gales, J. A., Harwood, D. M., Ishino, S., Keisling, B. A., Kim, S., Kim, S., Laberg, J. S., Leckie, R. M., Müller, J., Patterson, M. O., Romans, B. W., Romero, O. E., Sangiorgi, F., Seki, O., Shevenell, A. E., Singh, S. M., Sugisaki, S. T., Flierdt, T. van de, Peer, T. E. van, Xiao, W. and Xiong, Z.: Expedition 374 methods, Proc. Int. Ocean Discov. Progr., 374, 1–54, https://doi.org/10.14379/iodp.proc.374.102.2019, 2019.
MorphoSource: NBI:ICF Camp Century Sub Ice, MorphoSource [code and data set], https://www.morphosource.org/concern/cultural_heritage_objects/000583438 (last access: 1 September 2024), 2023.
Priscu, J. C. and SALSA Science Team: Scientific Access into Mercer Subglacial Lake: Scientific Objectives, Drilling Operations and Initial Observations, Ann. Glaciol., 62, 340–352, https://doi.org/10.1017/aog.2021.10, 2021.
Ragone, S. E. and Finelli, R.: Special Report 167: Procedures for Removing Surface Contaminants From Deep Ice Cores, https://erdc-library.erdc.dren.mil/jspui/bitstream/11681/11771/1/SR-167.pdf (last access: 17 August 2024), 1972.
Schaefer, J. M., Finkel, R. C., Balco, G., Alley, R. B., Caffee, M. W., Briner, J. P., Young, N. E., Gow, A. J., and Schwartz, R.: Greenland was nearly ice-free for extended periods during the Pleistocene, Nature, 540, 252–255, https://doi.org/10.1038/nature20146, 2016.
Shoemaker, B.: Herb Ueda Interview, Polar Oral Hist. Proj., 51 http://hdl.handle.net/1811/44677 (last access: 15 July 2024), 2002.
Souchez, R., Vandenschrick, G., Lorrain, R., and Tison, J.-L.: Basal ice formation and deformation in central Greenland: a review of existing and new ice core data, in Deformation of Glacial Materials, edited by: Maltman, A. J., Hubbard, B., and Hambrey, M. J., Geological Society, Special Publications, London, 13–22, https://doi.org/10.1201/b14059-6, 2000.
Souchez, R., Jouzel, J., Landais, A., Chappellaz, J., Lorrain, R., and Tison, J. L.: Gas isotopes in ice reveal a vegetated central Greenland during ice sheet invasion, Geophys. Res. Lett., 33, 20–23, https://doi.org/10.1029/2006GL028424, 2006.
Souney, J. M., Twickler, M. S., Hargreaves, G. M., Bencivengo, B. M., Kippenhan, M. J., Johnson, J. A., Cravens, E. D., Neff, P. D., Nunn, R. M., Orsi, A. J., Popp, T. J., Rhoades, J. F., Vaughn, B. H., Voigt, D. E., Wong, G. J., and Taylor, K. C.: Core handling and processing for the WAIS Divide ice-core project, Ann. Glaciol., 55, 15–26, https://doi.org/10.3189/2014AoG68A008, 2014.
Talalay, P. G.: Subglacial till and bedrock drilling, Cold Reg. Sci. Technol., 86, 142–166, https://doi.org/10.1016/j.coldregions.2012.08.009, 2013.
Thomis, W.: Arctic Is Warming Up But Word Hasn't Reached Yanks at Outposts, Chicago Dly. Trib., 5, https://campcentury.omeka.net/admin/files/show/817 (last access: 17 August 2024), 1955.
Tison, J.-L., Souchez, R., Wolff, E. W., Moore, J. C., Legrand, M. R., and de Angelis, M.: Is a periglacial biota responsible for enhanced dielectric response in basal ice from the Greenland Ice Core Project ice core?, J. Geophys. Res., 103, 18885–18894, 1998.
Tison, J. L.: Diamond wire-saw cutting technique for investigating textures and fabrics of debris-laden ice and brittle ice, J. Glaciol., 40, 410–414, https://doi.org/10.1017/S0022143000007498, 1994.
Tison, J. L., Thorsteinsson, T., Lorrain, R. D., and Kipfstuhl, J.: Origin and development of textures and fabrics in basal ice at Summit, Central Greenland, Earth Planet. Sc. Lett., 125, 421–437, https://doi.org/10.1016/0012-821X(94)90230-5, 1994.
Ueda, H. T. and Garfield, D. E.: Special Report 126: Drilling through the Greenland Ice Sheet, https://icedrill.org/sites/default/files/SR-126.pdf (last access: 17 August 2024), 1968.
Venturelli, R. A., Siegfried, M. R., Roush, K. A., Li, W., Burnett, J., Zook, R., Fricker, H. A., Priscu, J. C., Leventer, A., and Rosenheim, B. E.: Mid-Holocene Grounding Line Retreat and Readvance at Whillans Ice Stream, West Antarctica, Geophys. Res. Lett., 47, e2020GL088476, https://doi.org/10.1029/2020GL088476, 2020.
Verbeke, V., Lorrain, R., Johnsen, S. J., and Tison, J. L.: A multiple-step deformation history of basal ice from the dye 3 (Greenland) core: New insights from the CO2 and CH4 content, Ann. Glaciol., 35, 231–236, https://doi.org/10.3189/172756402781817248, 2002.
Weis, D., Demaiffe, D., Souchez, R., Gow, A. J., and Meese, D. A.: Ice sheet development in Central Greenland: Implications from the Nd, Sr and Pb isotopic compositions of basal material, Earth Planet. Sci. Lett., 150, 161–169, https://doi.org/10.1016/s0012-821x(97)00073-3, 1997.
Whalley, W. B. and Langway, C. C.: A scanning electron microscope examination of subglacial quartz grains from Camp Century core, Greenland – a preliminary study, J. Glaciol., 25, 125–131, 1980.
Willerslev, E., Cappellini, E., Boomsma, W., Nielsen, R., Hebsgaard, M. B., Brand, T. B., Hofreiter, M., Bunce, M., Poinar, H. N., Dahl-Jensen, D., Johnsen, S., Steffensen, J. P., Bennike, O., Schwenninger, J. L., Nathan, R., Armitage, S., De Hoog, C. J., Alfimov, V., Christl, M., Beer, J., Muscheler, R., Barker, J., Sharp, M., Penkman, K. E. H., Haile, J., Taberlet, P., Gilbert, M. T. P., Casoli, A., Campani, E., and Collins, M. J.: Ancient biomolecules from deep ice cores reveal a forested southern Greenland, Science, 317, 111–114, https://doi.org/10.1126/science.1141758, 2007.
Wilson, G. S., Levy, R. H., Naish, T. R., Powell, R. D., Florindo, F., Ohneiser, C., Sagnotti, L., Winter, D. M., Cody, R., Henrys, S., Ross, J., Krissek, L., Niessen, F., Pompillio, M., Scherer, R., Alloway, B. V., Barrett, P. J., Brachfeld, S., Browne, G., Carter, L., Cowan, E., Crampton, J., DeConto, R. M., Dunbar, G., Dunbar, N., Dunbar, R., von Eynatten, H., Gebhardt, C., Giorgetti, G., Graham, I., Hannah, M., Hansaraj, D., Harwood, D. M., Hinnov, L., Jarrard, R. D., Joseph, L., Kominz, M., Kuhn, G., Kyle, P., Läufer, A., McIntosh, W. C., McKay, R., Maffioli, P., Magens, D., Millan, C., Monien, D., Morin, R., Paulsen, T., Persico, D., Pollard, D., Raine, J. I., Riesselman, C., Sandroni, S., Schmitt, D., Sjunneskog, C., Strong, C. P., Talarico, F., Taviani, M., Villa, G., Vogel, S., Wilch, T., Williams, T., Wilson, T. J., and Wise, S.: Neogene tectonic and climatic evolution of the Western Ross Sea, Antarctica – Chronology of events from the AND-1B drill hole, Glob. Planet. Change, 96–97, 189–203, https://doi.org/10.1016/j.gloplacha.2012.05.019, 2012.
- Abstract
- Introduction
- The scientific history of ice core drilling at Camp Century and the subglacial material core
- Methods
- Results
- Implications
- Code and data availability
- Sample availability
- Author contributions
- Competing interests
- Disclaimer
- Special issue statement
- Acknowledgements
- Financial support
- Review statement
- References
- Supplement