the Creative Commons Attribution 4.0 License.
the Creative Commons Attribution 4.0 License.
 | 23 Aug 2024
Microstructure-based modelling of snow mechanics: experimental evaluation of the cone penetration test
Clémence Herny
Pascal Hagenmuller
Guillaume Chambon
Isabel Peinke
Jacques Roulle
Snow is a complex porous material presenting a variety of microstructural patterns. This microstructure largely controls the mechanical properties of snow, although the relation between the micro and macro properties remains to be better understood. Recent developments based on the discrete element method (DEM) and three-dimensional microtomographic data make it possible to reproduce numerically the brittle mechanical behaviour of snow. However, these developments lack experimental evaluation so far. In this study, we evaluate a DEM numerical model by reproducing cone penetration tests on centimetric snow samples. The microstructures of different natural snow samples were captured with X-ray microtomography before and after the cone penetration test, from which the grain displacements induced by the cone could be inferred. The tests were conducted with a modified snow micropenetrometer (5 mm cone diameter), which recorded the force profile at a high resolution. In the numerical model, an elastic–brittle cohesive contact law between snow grains was used to represent the cohesive bonds. The initial positions of the grains and their contacts were directly derived from the tomographic images. The numerical model was evaluated by comparing the measured force profiles and the grain displacement fields. Overall, the model satisfactorily reproduced the force profiles in terms of mean macroscopic force (mean relative error of about 20 %) and the amplitude of force fluctuations (mean relative error of about 55 %), while the correlation length of force fluctuations was more difficult to reproduce (mean relative error of about 40 % for two samples out of four and by a factor ≥ 8 for the other two). These characteristics were, as expected, highly dependent on the tested sample microstructure, but they were also sensitive to the choice of the micromechanical parameters describing the contact law. A scaling law was proposed between the mechanical parameters, the initial microstructure characteristics and the mean macroscopic force obtained with the DEM numerical model. The model could also reproduce the measured deformation around the cone tip (mean grain displacement relative error of 57 % along the horizontal axis), with a smaller sensitivity to the contact law parameterisation in this case. These detailed comparisons between numerical and experimental results give confidence to the reliability of the numerical modelling strategy and opens promising prospects to improve the understanding of snow mechanical behaviour.
- Article
(8927 KB) - Full-text XML
-
Supplement
(7018 KB) - BibTeX
- EndNote


Snow is a brittle and porous material existing on Earth close to its melting point. The thermodynamical conditions in clouds govern the snowflake morphology, and, once deposited on the ground, snow continues to evolve via metamorphism. The snow material is thus characterised by a wide variety of microstructural patterns (grain size, grain shape, density) classified into different snow types (Fierz et al., 2009). It has been established that the snow microstructure controls the properties of snow (Shapiro et al., 1997; Johnson and Schneebeli, 1999; Schneebeli, 2004). For instance, weak layers involved in avalanche triggering (Schweizer et al., 2003) are usually constituted of specific snow types (depth hoar, surface hoar, precipitation particle, faceted crystals) characterised by low cohesion and low strength (Jamieson and Johnston, 1992). The link between the snow microstructure and its properties, especially its mechanical properties, is still not well understood, even if it is crucial for many applications, such as avalanche forecasting (Schweizer et al., 2003; Jamieson and Johnston, 1992), snowpack modelling (Calonne et al., 2014), ice core interpretation (Montagnat et al., 2020) or geotechnics (Shapiro et al., 1997). In particular, the brittle failure occurring at high shear rates (> 10−4 s−1) during the release of an avalanche remains represented by very coarse empirical laws (Brun et al., 1992; Bartelt and Lehning, 2002; Vionnet et al., 2012). In this elastic–brittle regime (rapid and large deformations), the mechanical behaviour of snow is thought to be mainly controlled by bond failures and grain rearrangements (Narita, 1983).
The snow microstructure and its evolution can be captured at high resolution (typically 10–50 µm) with X-ray microtomography imaging (µCT) (Coléou et al., 2001; Freitag et al., 2004; Schneebeli, 2004; Heggli et al., 2011). This non-destructive method preserves the snow microstructure and resolves the shape of snow grains, grain bonds, and porosity, which is of primary importance for mechanical studies. In particular, structural properties of snow, such as density, specific surface area (SSA), correlation length and bond characteristics, can be evaluated from tomographic data (e.g. Schneebeli, 2004; Schneebeli and Sokratov, 2004; Hagenmuller et al., 2014; Calonne et al., 2014; Proksch et al., 2015). The tomographic data are also used as a basis for numerical modelling (Schneebeli, 2004; Schneebeli and Sokratov, 2004; Hagenmuller et al., 2015) or calibration/validation data of statistical empirical models retrieving grain-scale physical and mechanical properties from other measurements (e.g. Proksch et al., 2015; Reuter et al., 2019). However, tomographic imaging is time-consuming and not adapted to routine measurements in the field.
The mechanical properties of snow are commonly derived from cone penetration test (CPT) measurements, which is an objective and relatively easy-to-set-up method (Schneebeli and Johnson, 1998). This method has been widely used to characterise soil stratigraphy (Lunne et al., 1997) and adapted to snowpack stratigraphy (Gubler, 1975; Schaap and Föhn, 1987; Dowd and Brown, 1986; Schneebeli and Johnson, 1998; Mackenzie and Payten, 2002; McCallum, 2014). The CPT provides a force profile by measuring the resisting force exerted on a conic tip penetrating, at a constant rate, into a material. The development of high-resolution digital penetrometers dedicated to snow studies (Schneebeli and Johnson, 1998; Mackenzie and Payten, 2002; McCallum, 2014) has provided the possibility to resolve the force profile at a microscopic scale and capture the high-frequency fluctuations of the force signal up to a metre depth. Such force penetration profiles contain valuable information on the snow structural parameters at the macroscale and microscale (Löwe and van Herwijnen, 2012).
Interpretation of the CPT requires a good understanding of the interactions between the cone tip and the snow grains. Several studies aimed to investigate the grain displacement field around the tip. Particle image velocimetry (PIV) imaging was performed to quantify the 2D displacement field of snow grains while the tip penetrates into the material (Floyer and Jamieson, 2010; Herwijnen, 2013; LeBaron et al., 2014). Peinke et al. (2020) developed a grain-tracking algorithm from µCT data to reconstruct the 3D displacement field of snow grains induced by a CPT. All these studies revealed the development of a compaction zone (CZ) in front of the tip.
Various mechanical or statistical models have been developed to interpret the CPT penetration signal in terms of mechanical properties. The cavity expansion model (CEM) (Bishop et al., 1945; Yu and Carter, 2002) has been applied to snow by Ruiz et al. (2016) and Peinke et al. (2020). This model considers snow as a continuum and describes the elastic–plastic deformation of the material around the tip in order to retrieve macroscopic material properties (cohesion, friction, etc.). The continuum assumption becomes invalid for a ratio between cone diameter and mean grain diameter lower than 20 typically (Bolton et al., 1993), leading to potentially erroneous interpretations of the CPT results. Alternatively, the shot noise model interprets the force signal and its fluctuations as a superposition of independent elastic–brittle ruptures occurring next to the tip (Schneebeli and Johnson, 1999; Marshall and Johnson, 2009; Löwe and van Herwijnen, 2012) and retrieves microstructural properties (e.g. bond rupture force). The penetration process is generally modelled as a homogeneous Poisson process (HPP) with a constant intensity (Löwe and van Herwijnen, 2012). Peinke et al. (2019) have generalised the HPP method to account for the transient phase of the penetration process, attributed to the development of the CZ (Peinke et al., 2019). These authors used a non-homogeneous Poisson process (NHPP) considering a depth dependency of the intensity (number of bond failures per penetration increment). Yet, the assumption of independent elastic–brittle rupture events essentially neglects the development of a CZ (Johnson and Schneebeli, 1999; Herwijnen, 2013; LeBaron et al., 2014; Ruiz et al., 2017). Therefore, these two models do not appear to fully account for the specificity of snow deformation induced by the CPT. Additional investigations are required to better understand the tip interaction with snow and better interpret the force measurements.
Recently, numerical approaches have been developed to study the mechanical response of snow by explicitly accounting for the microstructure (Johnson and Hopkins, 2005; Gaume et al., 2015, 2017a; Hagenmuller et al., 2015; Wautier et al., 2015; Mede et al., 2018b, 2020; Bobillier et al., 2020, 2021). Snow is described as a granular material and modelled by the discrete element method (DEM) in a high-shear-rate regime. The complexity of the snow microstructure can be taken into account by feeding the DEM simulations with high-resolution 3D reconstructions obtained with µCT. These simulations have provided new insights into the snow mechanical behaviour, such as the dependence of snow strength to microstructure properties (Hagenmuller et al., 2015) or the identification of different failure modes in shear loading (Mede et al., 2018b, 2020). The downside of this method is that it is time-consuming, and simulations can only be performed on small samples (up to a few centimetres). Furthermore, these numerical models still lack direct experimental evaluation.
In this context, the aim of this study was to evaluate a microstructure-based DEM model using recent CPT experimental data performed in a controlled environment (Peinke et al., 2020). The dataset includes µCT images of the samples acquired before and after the tests. The deformation induced by the CPT (strain rate of about 102 s−1; Reuter et al., 2019) belongs to the elastic–brittle regime (Narita, 1983; Floyer and Jamieson, 2010) and is therefore suitable for the DEM simulation. The results of the numerical model are directly compared to experimental data in terms of (1) macroscopic force profile and associated statistical indicators and (2) grain displacements induced by the cone penetration. A systematic sensitivity analysis on the DEM mechanical parameters, including Young's modulus, cohesion coefficient and friction coefficient, was performed to find the combinations of parameters that best reproduce experimental results. Finally, the role of the microstructure was also investigated by performing DEM simulations for different snow types. The evaluation of the numerical model provides the opportunity to better understand the mechanisms at play during snow deformation in an elastic–brittle regime and better interpret CPT profiles.
We first present the experimental dataset and the numerical methods. The data processing used to compare experimental and numerical results is also explained. The results of the DEM, the sensitivity analysis on mechanical parameters and the comparison to experimental results are then presented. The relevance of the DEM model and the limits of our approach are eventually discussed before concluding.
2.1 Experimental measurements
The experimental dataset used in this study has been acquired by Peinke et al. (2020) and is only briefly presented in this paper. The methodology comprises the collection and preparation of snow samples and the acquisition of high-resolution microtomographic images and cone penetration tests (CPT).
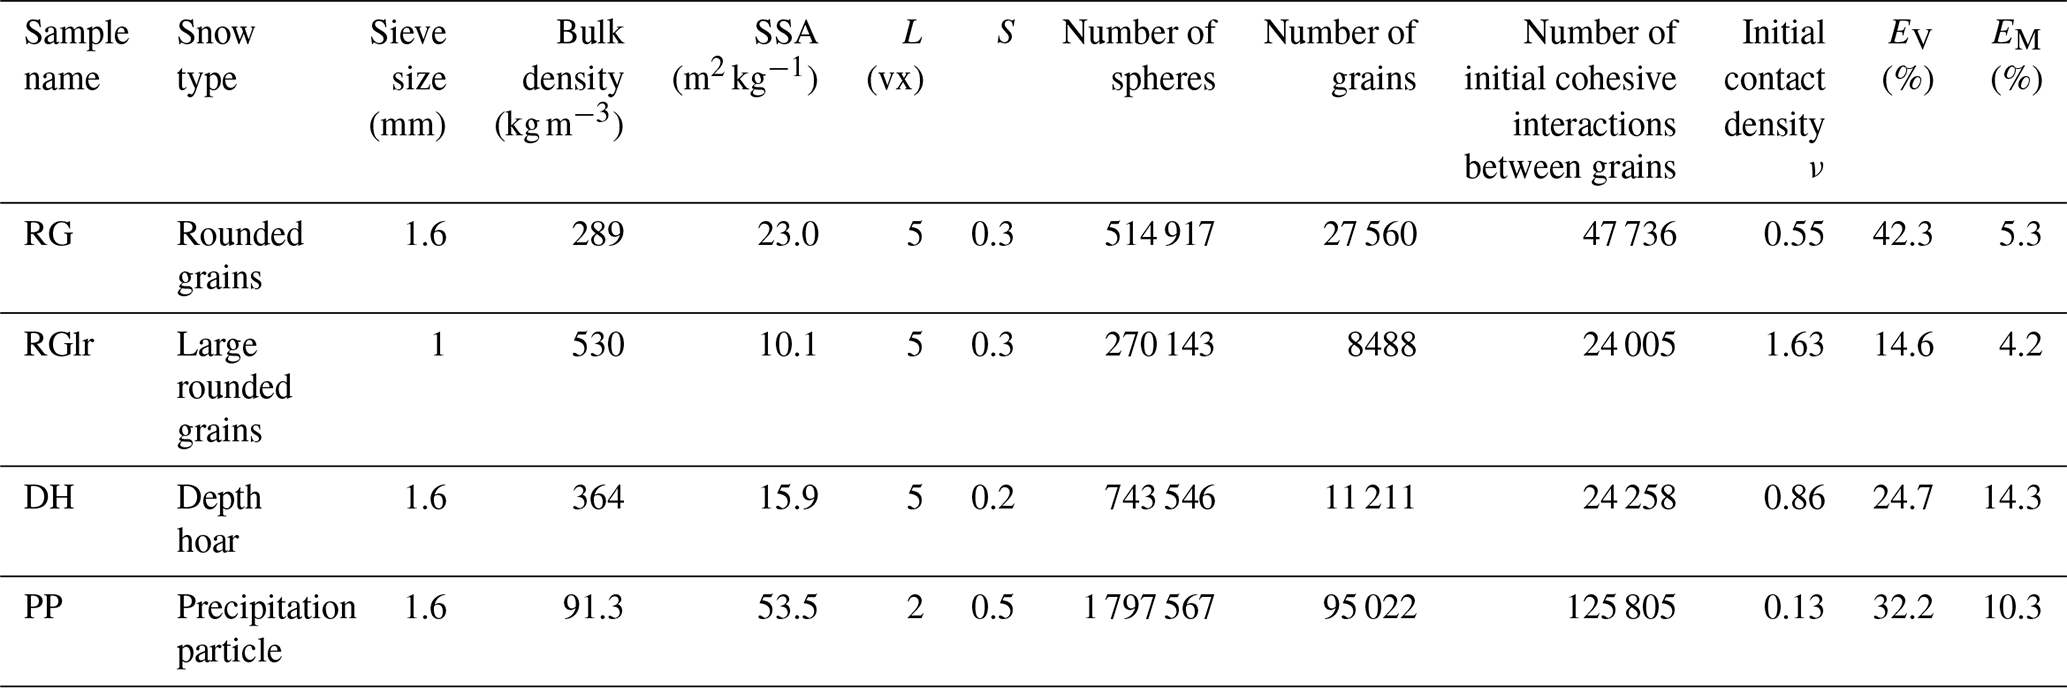
Table 1Overview of the snow samples analysed in this study and parameters of DEM grain shape representation. Sample names were given according to the snow type classification (Fierz et al., 2009). The sample density and specific surface area (SSA) were derived from the microtomographic images (Peinke et al., 2020). The initial contact density was computed according to Eq. (10). The minimum radius of the sphere L (voxel, vx) and the minimum sphere coverage S were determined through a sensitivity analysis presented in Sect. S1.1 in the Supplement. The resulting numbers of spheres, grains and cohesive grain–grain interactions are indicated, as well as the volumetric error EV and the mechanical error EM associated with each grain shape representation.
2.1.1 Snow sample preparation
Blocks of natural snow were sampled in the French Alps near Grenoble and stored at −20 °C in a cold room. The materials collected were representative of the variety of seasonal snow types (Table 1), namely rounded grains (RG), large rounded grains (RGlr), depth hoar (DH) and precipitation particles (PP), with distinct bulk densities and specific surface areas (SSAs).
The samples were then prepared in a cold room at −10 °C by sieving the different snow types into aluminium cylinders of 20 mm height and 20 mm diameter. All samples were prepared at least 24 h before the measurements in order for the bonds between grains to rebuild after sieving.
2.1.2 Microtomography (µCT)
Tomographic scans of each sample were acquired before and after performing the CPT to capture the initial and final microstructure of the snow, respectively. An X-ray tomograph (DeskTom130, RX Solutions) operating at a pixel size of 15 µm per pixel, a voltage of 80 kV and a current of 100 µA was used. During tomographic scanning, the samples were maintained at a constant and uniform temperature of −10 °C in a cryogenic cell (CellDyM; Calonne et al., 2015). Each scan, consisting of 1440 two-dimensional radiographs, was reconstructed to obtain 3D greyscale images representing the attenuation coefficients of the different materials composing the samples. The greyscale images were then transformed into binary (ice matrix and pore space) segmented images using an energy-based segmentation algorithm (Hagenmuller et al., 2013).
2.1.3 Cone penetration test (CPT)
After the initial microtomography scan, a CPT was performed on the snow samples using a modified snow micropenetrometer (SMP version 4; Schneebeli and Johnson, 1998). The specific rod used by Peinke et al. (2020) displays a conic tip with an apex angle a of 60° and a maximum cone radius equal to the rod radius R of 2.5 mm. The rod was inserted vertically into the snow sample at a constant penetration speed v of 20 mm s−1. The resisting force applied on the penetrometer (cone and rod) was recorded at every 4 µm of penetration increment (i.e. 5 kHz frequency). The SMP sensor (Kistler sensor type 9207) can measure forces up to 40 N with a resolution of 0.01 N. The tip was stopped at depths between 7 and 15 mm, i.e. 5 to 13 mm above the sample bottom, to avoid boundary effects (Peinke et al., 2020). The experimental force profiles are presented in Fig. S26.
2.2 Numerical modelling
Snow is here considered a granular cohesive material. The high strain rate (> 10−4 s−1) induced by the tip penetration into the snow sample is considered to lead to brittle deformations, with inter-granular fracture and grain rearrangements (Narita, 1983; Johnson and Hopkins 2005; Hagenmuller et al., 2015). We adopted an approach based on the DEM to simulate the cone penetration tests in the measured snow samples. The mechanical model, based on YADE software (Šmilauer et al., 2021), is adapted from the work by Hagenmuller et al. (2015) and Mede et al. (2018a, b, 2019).
The setup of the simulations involves different steps, namely the generation of the initial conditions based on measured snow microstructures, the definition of the contact laws between the snow grains and the setting of the boundary conditions to reproduce the CPT configuration.
2.2.1 Grain segmentation and grain shape representation
The DEM model was fed by the 3D ice–air images derived from µCT. The continuous ice matrix was first segmented into individual grains based on geometrical criteria, as described by Hagenmuller et al. (2013). The main idea of the approach is to detect potential mechanical weakness zones (i.e. the bonds) based on the principal minimal curvature κT and a contiguity parameter cT. The threshold on curvature κT was set to 1.0 for the RG, RGlr and DH samples and to 0.7 for the PP sample; the contiguity parameter was set to 0.1 for all the samples (see Hagenmuller et al., 2013, for details).
To construct the DEM sample, the irregular shape of the grains was approximated by filling the grain volume with a population of overlapping spheres (Fig. 1). The position of these spheres was derived from the medial axis of the structure (Coeurjolly et al., 2007; Mede et al., 2018a), and redundant spheres were discarded based on a power diagram filter (Coeurjolly et al., 2007). This grain shape representation by a multitude of spheres preserves the capability of YADE to handle sphere–sphere contact detection. However, a high number of spheres slows down the simulations. We thus further decimated the number of spheres by approximating the grain shape. We only selected the spheres with a radius larger than a threshold L (voxel) and with a relative coverage larger than S (i.e. the ice volume associated with the sphere according to the power diagram should be larger than S times the sphere volume) (Coeurjolly et al., 2007). A trade-off must be found between this grain shape approximation, influencing the simulation accuracy, and the number of spheres influencing the numerical cost. Eventually, the spheres belonging to the same grain were clumped together in rigid aggregates constituting single discrete elements (DEs). A detailed sensitivity analysis was conducted (see Table S1 and Fig. S1 in the Supplement) to determine the optimal values of the L and S parameters. Note that this grain shape approximation might also lead to deleting the smallest grains in the numerical samples, as they cannot be covered with the chosen parameters L and S. The grain number difference and shape approximation of the numerical sample compared to the initial segmented µCT image can be quantified by computing the volumetric error EV. The final chosen L and S values for each snow type, with the associated volumetric EV and mechanical EM errors (defined in Sect. S1.1), can be found in Table 1.
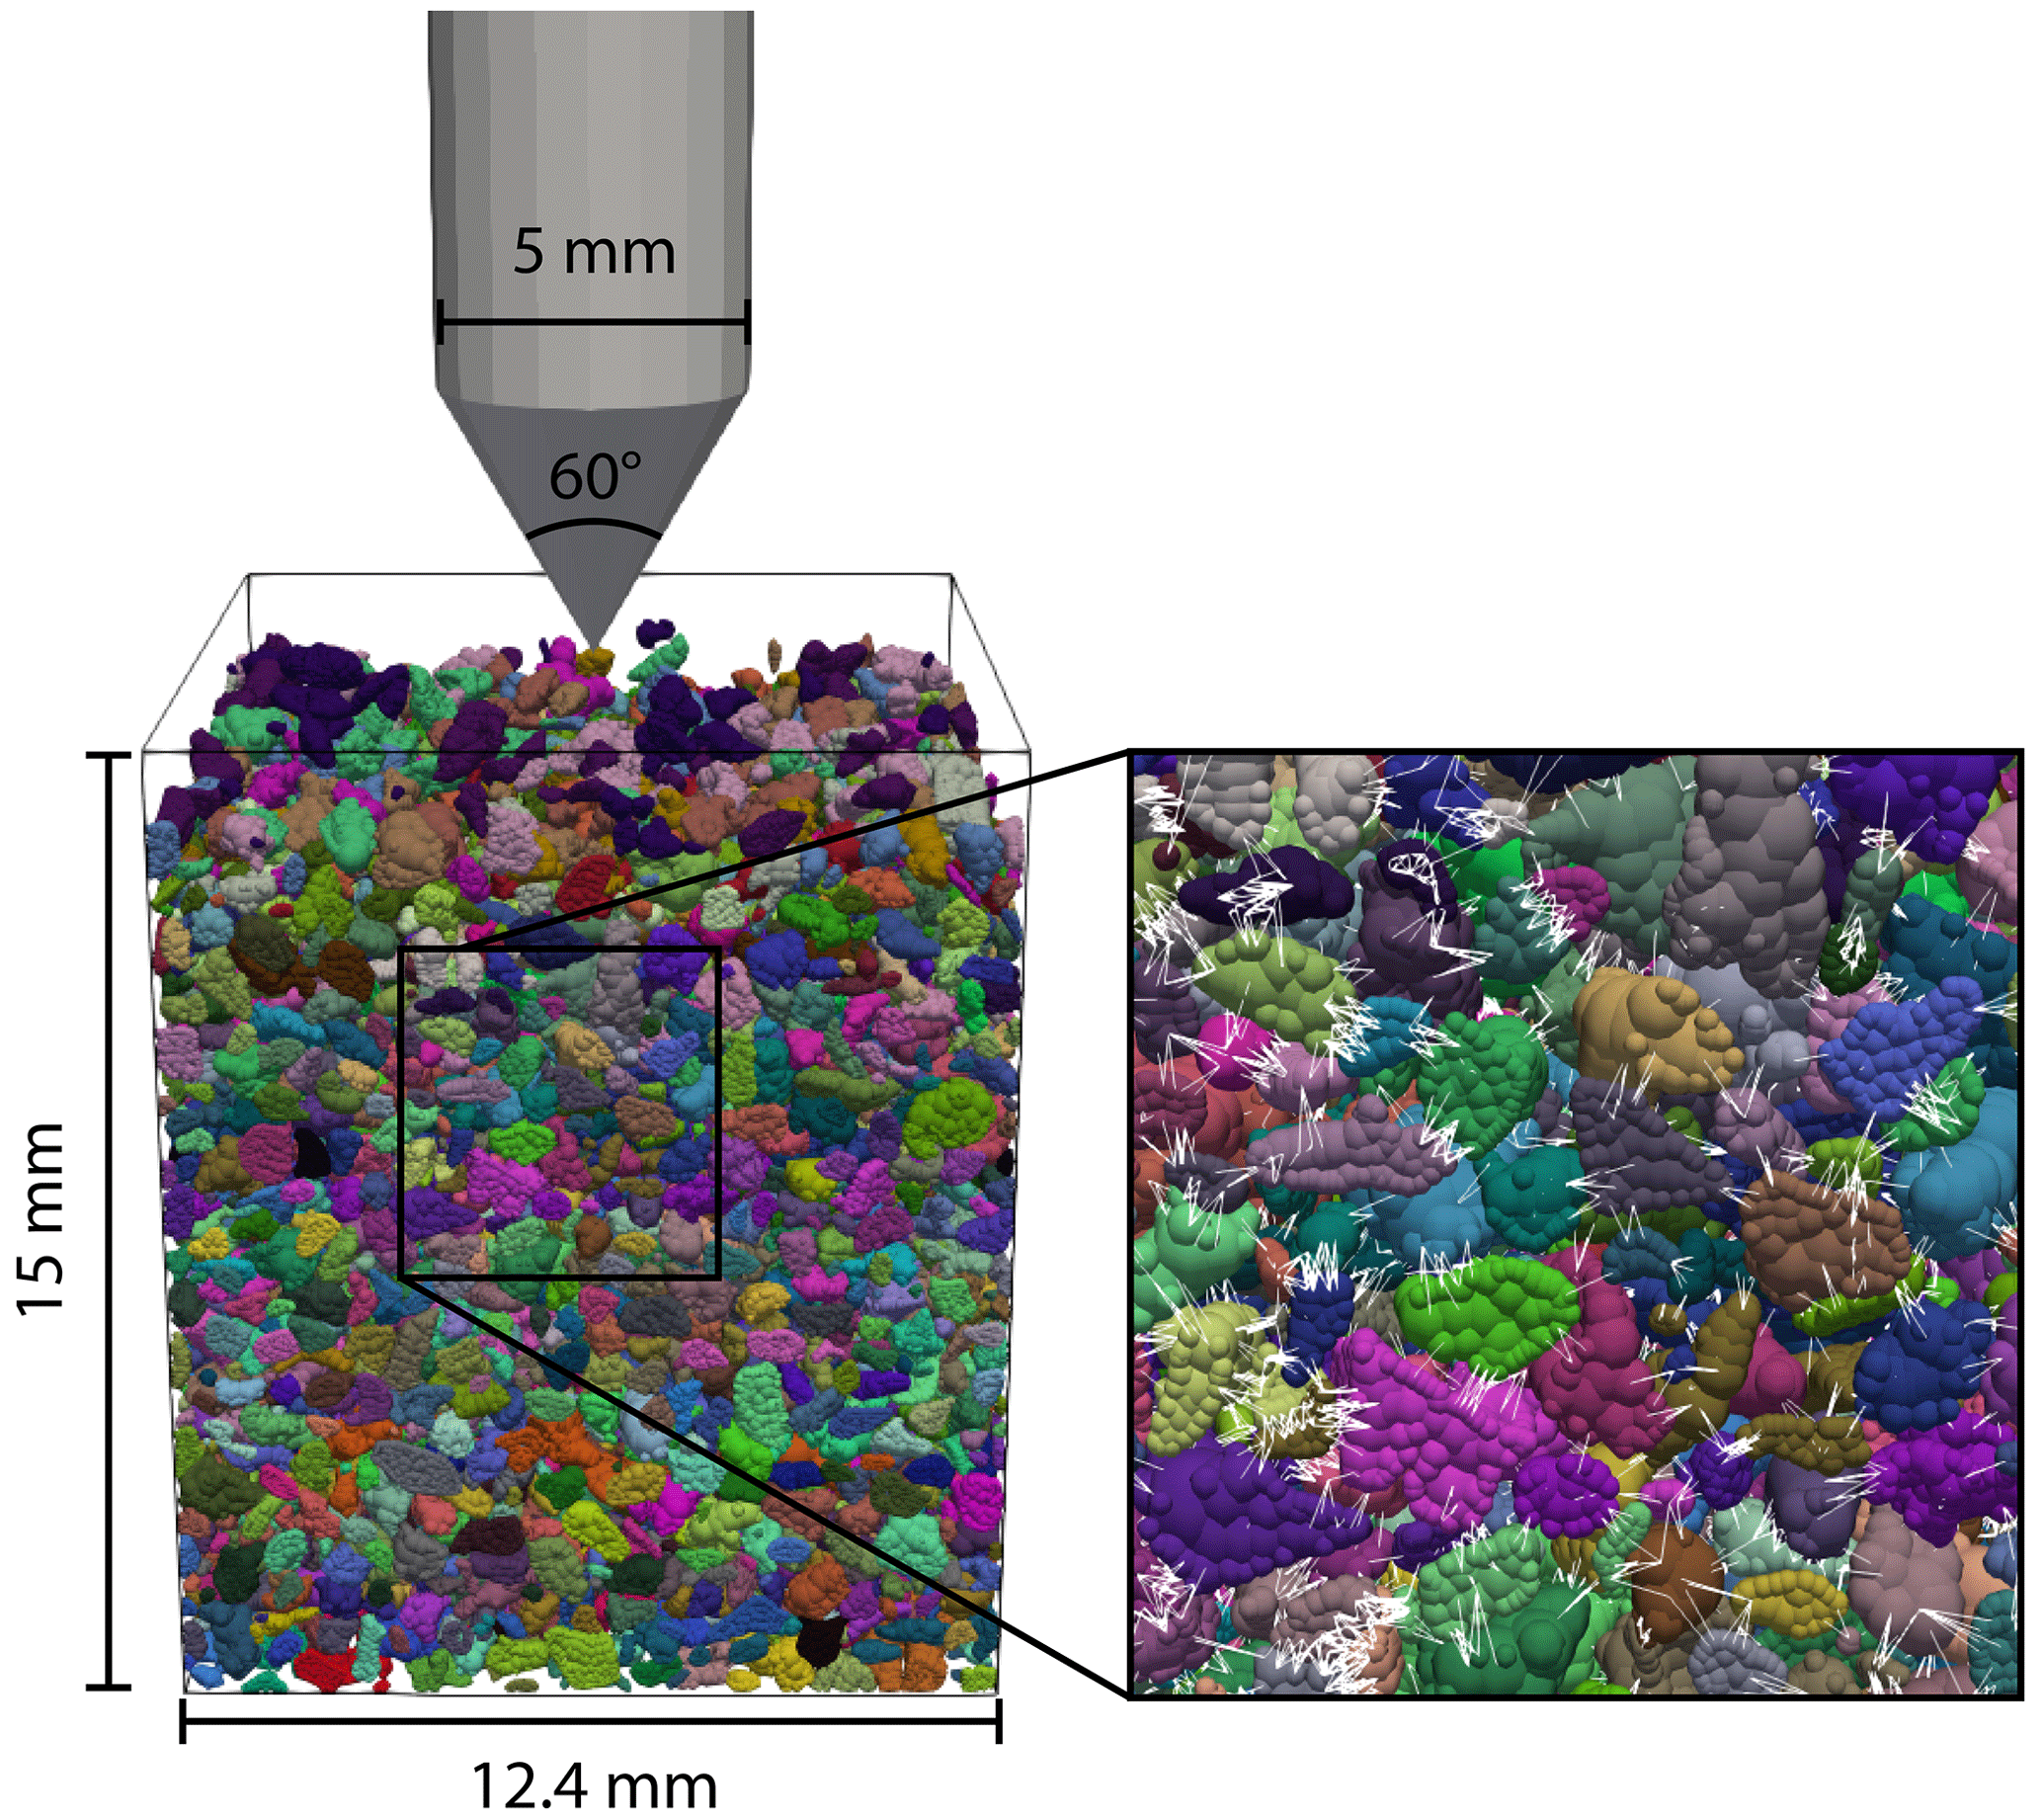
Figure 1Illustration of the DEM CPT modelling for the RGlr sample. The penetrometer is moving downward at a constant speed of 20 mm s−1. Snow grains (represented with different colours) are modelled by overlapping spheres clumped together. The zoomed-in window shows the initial cohesive interactions between the spheres of adjacent grains (white lines).
2.2.2 Interactions and contact law
The contacts between adjacent grains were identified during the grain segmentation phase. In the DEM simulations, each grain contact is represented by several sphere–sphere interactions. The interactions between spheres are described by an elastic–brittle cohesive contact law characterised by four parameters, namely the normal and the shear contact stiffness KN and KS, the adhesion A, and the friction angle φ. The normal force FN between two spheres is computed as proportional to the distance between the two sphere surfaces xN and limited by the adhesion value in the tensile regime (xN > 0):
The shear force FS is proportional to the shear displacement between the spheres xS, with a maximal value given by the sum of adhesion and friction:
If the force exceeds the threshold, either in tension or in shear, the cohesive bond is broken. As long as the spheres remain in contact after the bond is broken, friction remains active in shear. In the initial state, all interactions in the numerical sample are considered cohesive. While the sample deforms, grain displacements lead to progressive breakage of the initial cohesive interactions and the potential creation of new contacts. These new interactions are frictional only (no cohesion), meaning that sintering mechanisms are not considered in this study.
The force of a given inter-granular cohesive contact corresponds to the sum of all the associated sphere–sphere interactions. Based on the total contact surface between two grains (obtained from the µCT image) and the number of associated sphere–sphere interactions, each sphere–sphere interaction i can be associated with a representative contact surface Di. In order to recover the correct cohesion strength between two grains, the adhesion parameter A was defined for each sphere–sphere interaction as
with C (Pa) being the cohesion of ice. In YADE, by default, the contact stiffnesses are computed based on the radii of the spheres in interaction and two elastic material parameters, namely Young's modulus E and the Poisson ratio ν. For our computations, to ensure that all cohesive sphere–sphere interactions between two grains break at the same separation distance, the computation of the normal stiffness was redefined as
where rmean (m) is a characteristic length constant for all the interactions in the numerical sample, taken as the mean sphere radius. The shear stiffness is then defined as
Note that due to the rather arbitrary characteristic length considered in the definition of the normal stiffness (Eq. 4), which depends on the grain shape approximation, as well as to the simple linear relation considered for the normal force (Eq. 1), the contact-level YADE Young's modulus E should not be regarded as the true Young's modulus of the material but rather as a representative parameter of the elastic properties at the contacts.
2.2.3 Simulation setup and critical time step
In order to evaluate the DEM model, we have implemented a CPT configuration similar to the experimental setup used by Peinke et al. (2020) (Fig. 1). The snow sample is contained in a rectangular box open at the top. The box is about 12.4 mm along the x and y axes and about 15 mm along the z axis. The vertical and horizontal box sizes were reduced compared to the 20 mm height and 20 mm diameter, respectively, of the sample holder used by Peinke et al. (2020). This choice has been motivated by (1) simplifying the geometry with a rectangular numerical sample, (2) matching the sample height imaged with µCT and (3) reducing the computational time. A sample size sensitivity analysis has been performed to ensure that border effects are not introduced by reducing the sample size (Fig. S2). The penetrometer tip displays a maximal radius R of 2.5 mm and an apex angle a of 60°. Initially in a centred position at the box surface, it is displaced downwards through the sample at a constant speed of 20 mm s−1. The simulation stops when the tip reaches the bottom of the box. The walls (box and tip) are represented by facets with rigid boundary conditions. The gravity is set to 9.81 m s−2.
The stability of the explicit integration scheme is ensured by estimating the critical time step, based on the propagation speed of elastic waves in the sample (Zhao, 2017):
with mi and KN,i being the mass and normal stiffness of the DE i. The mass mi, or equivalently the material density ρ, can be artificially increased to increase the time step (Hagenmuller et al., 2015). A numerical sensitivity analysis (Fig. S3) has shown that increasing the density by a factor f equal to 100 does not affect the simulation results, while it does significantly reduce the computing time. Finally, a Cundall's non-viscous damping coefficient Λ was applied to the particle acceleration to dissipate kinetic energy and avoid numerical instabilities (Šmilauer et al., 2021). A value of 0.05 was chosen according to the results of a numerical sensitivity analysis (Fig. S4).
2.2.4 Input parameters
In view of the preceding paragraph, the density of the ice grains was set to ρ = f × 917 kg m−3. The contact law parameters were derived from typical values measured on ice. The Poisson coefficient P was set to 0.3 (Schulson and Duval, 2009). The typical Young's modulus E, the cohesion strength C and the friction coefficient tan (φ) values for the ice are usually evaluated around 1 × 10¹⁰ Pa, 1 × 10⁶ Pa and 0.2, respectively (Gammon et al., 1983; Schulson and Duval, 2009). For this study, a sensitivity analysis on the values of these parameters was performed to get insights into their influence and best adjust simulation results to the experimental measurements. The considered ranges were 1 × 10⁸–1 × 10¹⁰ Pa for E, 5 × 10⁵–5 × 10⁶ Pa for C and 0.2–0.5 for tan (φ), respectively. Note that the range of Young's modulus E ensures small grain overlaps, i.e. compliance with the rigid grain assumption (Fig. S5). We must mention that, due to longer computing times, fewer parameter values could be explored for large Young's modulus values. For the PP sample, no numerical simulations could be performed for a Young's modulus of 1 × 10¹⁰ Pa, as computing times were unreasonable (E = 1 × 10⁸ Pa, t ∼ 4 months, and E = 1 × 10⁹ Pa, t ∼ 10 months, on a 72-core machine with 2.6 GHz Intel Xeon processors (2.6 GHz) and 500 GB RAM. YADE scripts enable parallelisation on up to five cores).
2.3 Data processing
The outputs of the DEM simulations are the resisting force exerted by the grains on the penetrating rod and the displacement of the grains. These results can be directly compared to the experimental measurements.
2.3.1 Force sampling
The sum of the forces along the z axis applied on all the facets constituting the penetrometer (cone and rod) is recorded at each time step. The characteristics of the raw numerical force profiles depend on the numerical parameters (notably the time step), and they are not necessarily suited for direct comparison with experimental results. To obtain numerical profiles that can be compared to their experimental counterparts, the simulated force values were averaged over windows corresponding to displacement increments of 4 µm, thus matching the sampling frequency of the SMP. This averaging is also useful to smooth out high-frequency fluctuations linked to the very small time steps used in the DEM. Finally, numerical and experimental force profiles are then resampled by linear interpolation over a regular grid with a step of 4 µm over the same depth. The profiles span from a depth of 0 mm (initial contact between the cone and the sample surface) to the chosen maximum depth, which, in our study, is set to 7 mm (i.e. 1750 points). This value corresponds to the minimum depth reached by the penetrometer during the experimental CPT tests for the selected samples.
2.3.2 Statistical indicators
Quantitatively, the DEM numerical model is evaluated by comparisons with experimental force profiles in terms of three statistical indicators: the mean macroscopic force (N), the amplitude of force fluctuations σ (N) and the correlation length l (mm). The indicator σ is calculated as the variance of the detrended force profile as follows:
with (Eq. 5) (Peinke et al., 2019) being the detrended force profile, F being the force profile and Fsm being the averaged force profile calculated over a rolling window Δz = 3 mm. The correlation length l (mm) is also computed on the detrended force profile (Peinke et al., 2019). In our study, the snow samples exhibit a rather homogeneous structure, allowing us to consider that l is constant over the depth (Peinke et al., 2019). These three statistical indicators have been chosen because they are easily quantifiable and commonly used to describe force profiles obtained by CPT in snow (Johnson and Schneebeli, 1999; Löwe and van Herwijnen, 2012; Peinke et al., 2019). In addition, they constitute key parameters to derive additional microstructural properties based on Poisson shot noise models (Löwe and van Herwijnen, 2012; Peinke et al., 2019).
To select the set of model mechanical parameters (E, C and tan (φ)) providing the best fit to the experimental measurements, a total error REtot is computed according to
with REk being the logarithmic relative error calculated for the three statistical indicators, k = (), as
Given the difficulties in reproducing the correlation length with the DEM model for two out of four samples and the fact that the values of the statistical indicators vary over several orders of magnitude (see Sect. 3.2), the logarithmic relative errors (REk) were computed with the log of the considered values. We have attributed a weight factor of 2 to the logarithmic relative error REF related to the mean macroscopic force, to put more emphasis on the correct reproduction of this quantity. Hence, for each snow sample, the set of mechanical parameters minimising the total error REtot was determined.
2.3.3 Grain displacement analysis
The position of all grains was recorded every ∼ 0.4 mm of penetration into the DEM simulations. The total displacements and the trajectories can therefore be reconstructed for each grain. Due to the thermodynamically active nature of snow, interrupted experimental tests were not feasible, and only the initial (before CPT) and the final states (after CPT) of the snow sample could be imaged by µCT. Grain tracking, applied to the microtomographic images, has been performed by Peinke et al. (2020), providing the total displacement of the identified grains. We thus compared the total displacement between the CPT experiments and the DEM simulations at the same penetration depth, i.e. at the maximal penetration measured experimentally. Note that grain tracking could not be performed for the PP sample due to the small size of the grains.
The profiles of vertical and radial displacements were averaged around the cone axis and over the height of an area located between the top section of the cone and the sample surface. A displacement threshold of 0.03 mm was set to define the CZ (Peinke et al., 2020). Only the radial profiles were compared to the experimental results, as we suspect the vertical profiles derived from µCT scans might be misleading (Peinke et al., 2020). Indeed, before acquiring the post-CPT µCT scans, the tip was removed from the snow. This procedure was performed about 1 h after the tip penetration to allow for bonds between ice grains to re-form by sintering and to limit grain displacements during tip removal. However, despite this precaution, some grains in contact with the tip might have been dragged upward due to friction with the tip. Therefore, the upward component of the vertical displacement might have been overestimated in the experimental results, especially for the larger grains.
3.1 Simulated cone penetration tests
This section presents an example of CPT simulation results for the case of the RG snow sample with the following mechanical parameters: E = 1 × 10⁹ Pa, C = 5 × 10⁶ Pa and tan (φ) = 0.2 (Table 3). The results for the other snow samples are shown in Sect. S2.1 in the Supplement.
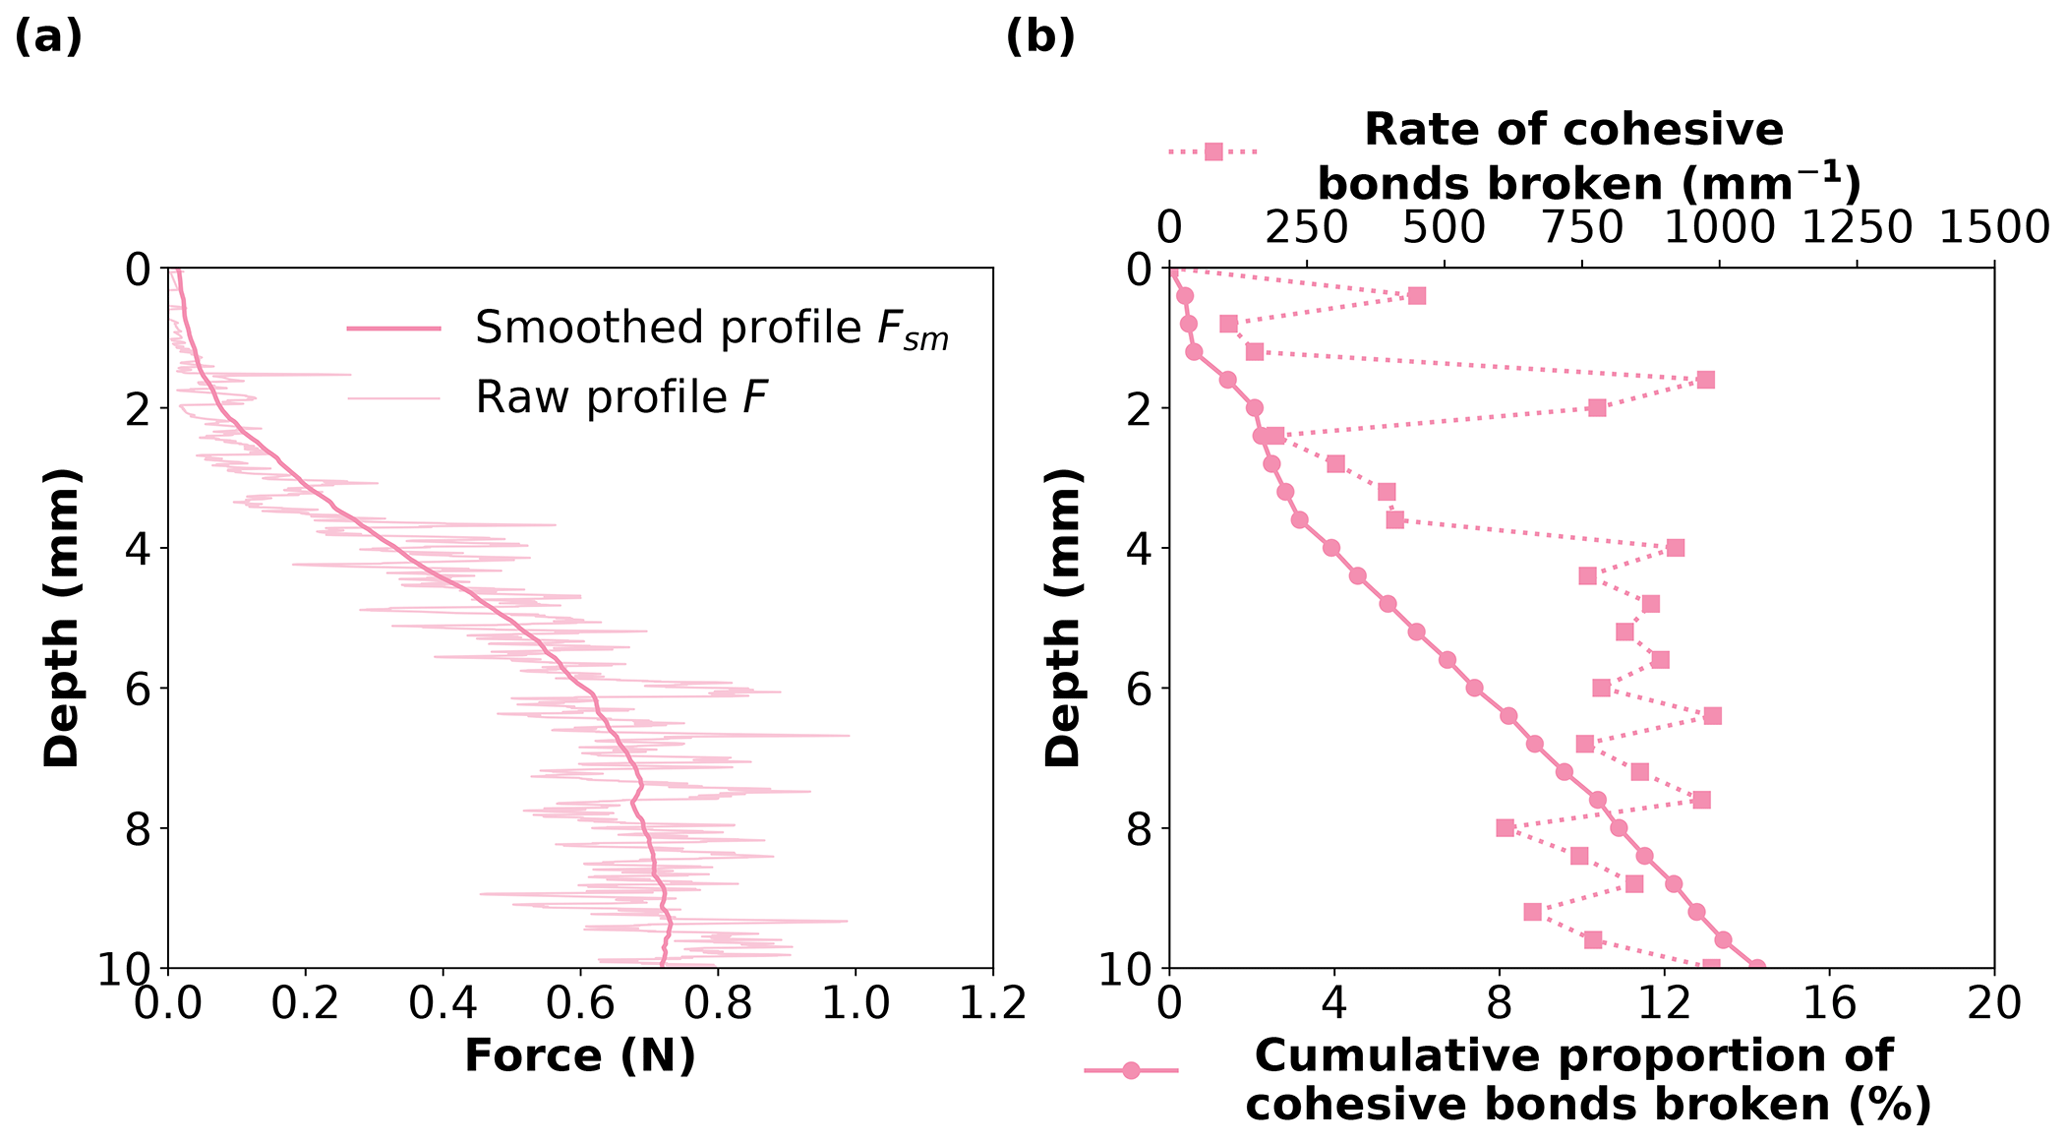
Figure 2(a) Force F as a function of penetration depth (light line) obtained for the RG sample. The superimposed smoothed profile (bold line) Fsm corresponds to the force value averaged over a rolling window of 3 mm. (b) Rate of cohesive bonds broken per unit penetration depth and cumulative proportion of cohesive bonds broken (%) as a function of tip penetration depth. The initial number of cohesive bonds is indicated in Table 1. The results are obtained with the mechanical parameters indicated in Table 3.
The simulated penetration force globally increases with depth and is characterised by high-frequency fluctuations whose amplitude also tends to increase with depth (Fig. 2a). The force profile displays an S shape with three stages: (1) up to ∼ 3.5 mm depth the profile is convex, (2) between ∼ 3.5 and ∼ 6 mm depth the increase in force with depth is almost linear, and (3) for depths larger than 6 mm the force reaches a nearly constant value. A similar behaviour is observable for the RGlr and PP samples (Figs. S6a and S10a), with slight variations in the transition depths between the different stages. For the DH sample, the macroscopic force profile also displays stages 1 and 2, but the stabilisation at a nearly constant value is less evident for the results presented in Fig. S8a. Stage 3 might be reached at greater depths for this sample.
The penetration of the tip induces bond failures in the simulated samples (Fig. 2b). Overall, for the RG sample, about 15 % of the cohesive interactions broke over 10 mm of penetration, corresponding to an average rate of ∼ 650 bond failures per millimetre. This average bond failure rate is variable among the samples, reaching up to 1400 bond failures per millimetre for the RGlr sample (Figs. S6b, S8b and S10b). In detail, for the RG sample, we notice an increase in the bond failure rate at around 3.5 mm of penetration depth (Fig. 2b), coinciding with the transition between the first and second stages observed in the force signal (Fig. 2a). Bond failure intensity then remains nearly constant as the macroscopic force reaches its steady-state value. Similar characteristics are observed for the other snow types (Figs. S6 and S10), except for the DH sample, for which the slope change between the first and second stages is less clear (Fig. S8b).
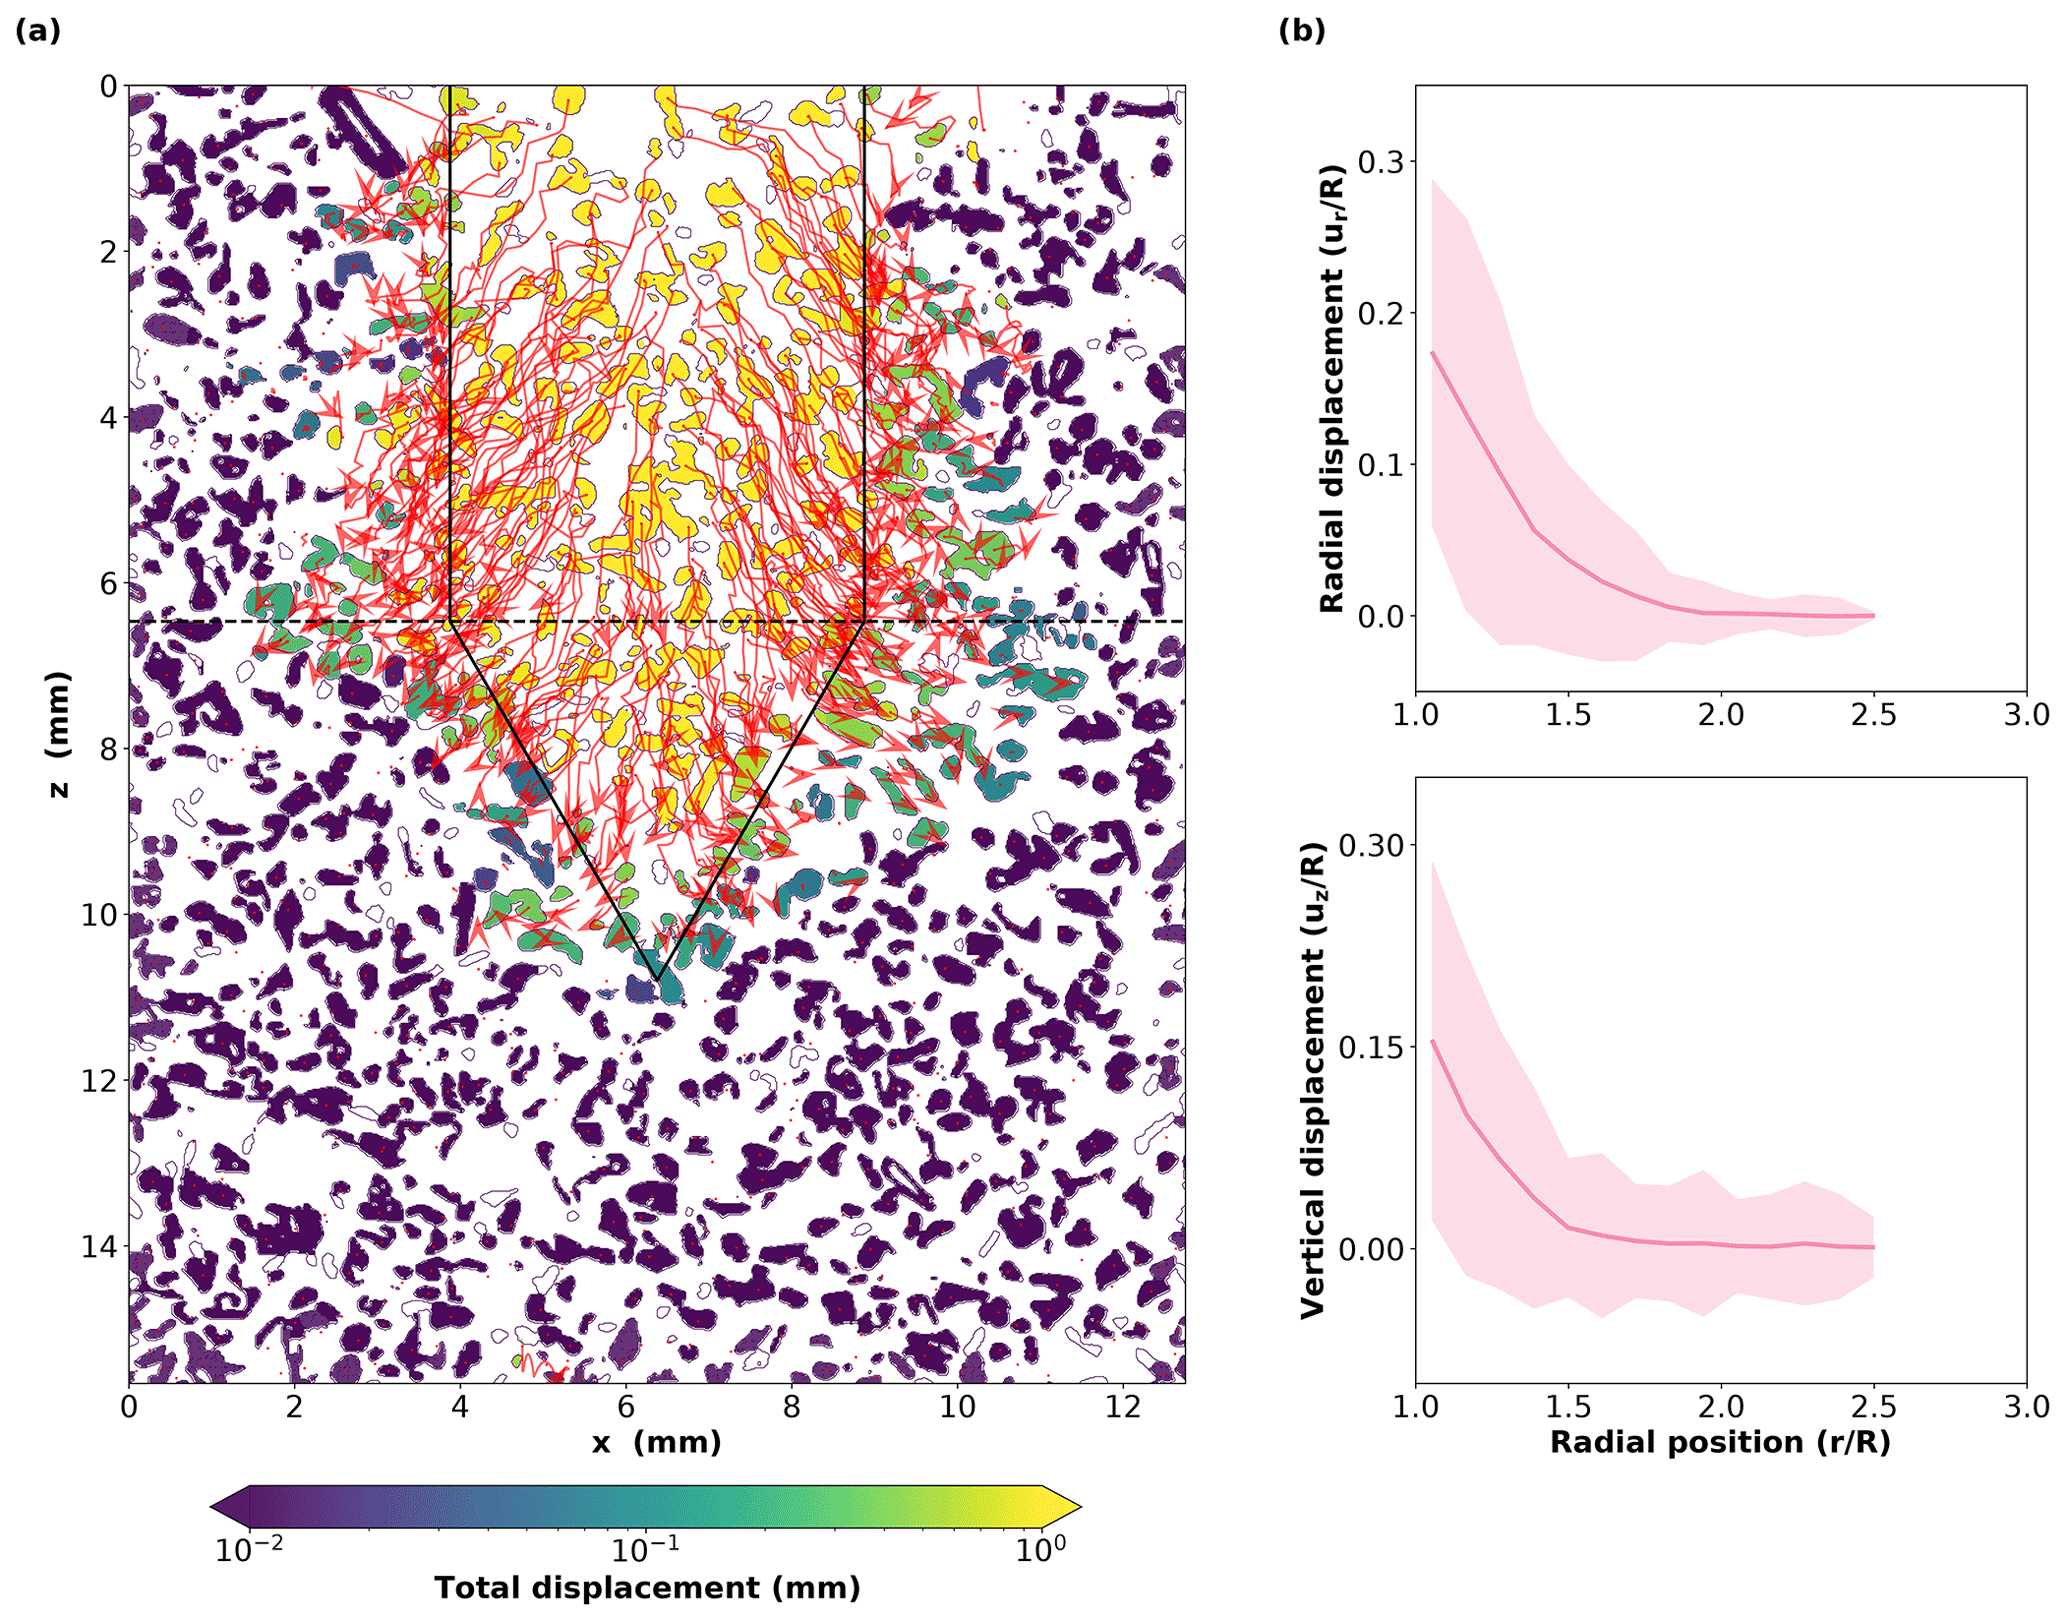
Figure 3(a) Simulated grain displacement map for the RG sample. The red arrows indicate the grain trajectories while the tip is penetrating (sampling = 0.4 mm). White grains correspond to grains that are not represented in the DEM simulation. The final tip position is indicated by the solid black lines. The horizontal dashed black line indicates the cone top. (b) Radial (upper panel) and vertical (lower panel) displacement profiles (red curves) for the RG sample. These profiles represent averages computed from the sample surface to the cone top. By convention, downward (respectively upward) movement corresponds to positive (respectively negative) values of vertical displacement. The shadowed areas around the solid lines represent the standard deviation of grain displacements. The results are obtained with the mechanical parameters indicated in Table 3.
Figure 3a shows the total displacement of the grains as well as grain trajectories. The largest displacements (up to several millimetres) are observed for grains initially located on the path of the tip. Around the tip, the displacements are <1 mm and are mainly localised close to the tip. Grain trajectories indicate that grains are pushed downward from each side of the tip. Grains initially located on the tip axis display quasi-straight vertical trajectories. The trajectories become more radial and curved away from the tip medial axis, with grains also being pushed aside. Both radial and vertical displacement profiles show a pronounced decreasing trend and reach almost zero values at a radial position of about 1.7–1.8 R (Fig. 3b). The vertical profile attests of a dominant downward movement of the grains close to the tip. Similar observations are made for the DH (Fig. S9) and PP (Fig. S11) samples. In contrast, for the RGlr sample, vertical displacements are smaller and oriented slightly upward, on average, for the mechanical parameters chosen here (Fig. S7).
Table 2Input parameters used for the simulations presented in this paper.
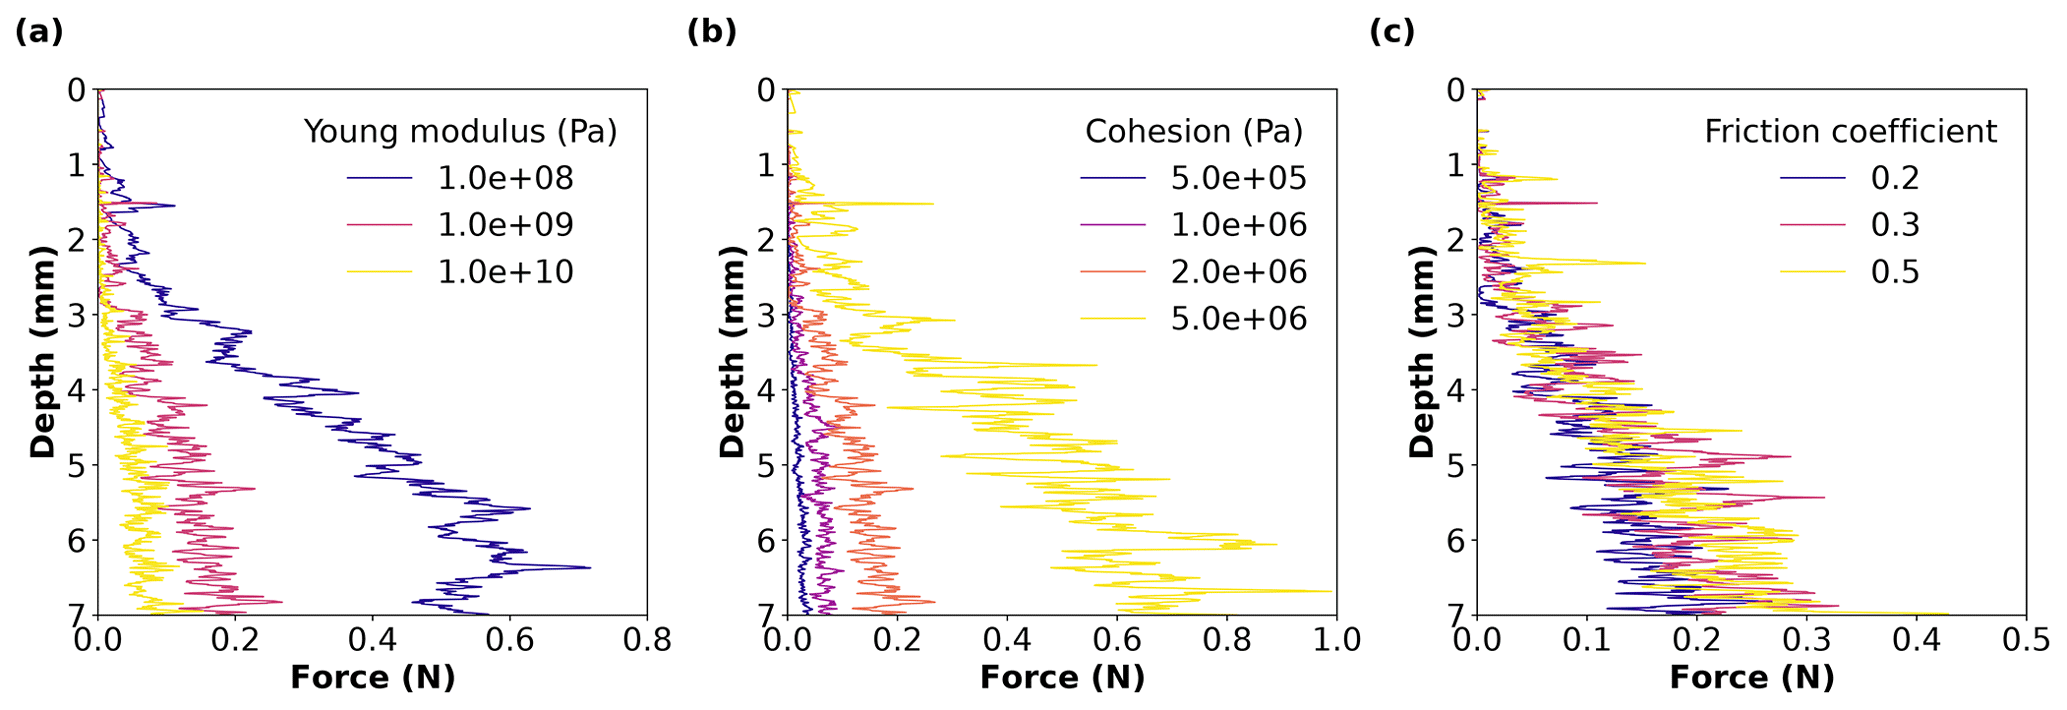
Figure 4Influence of mechanical parameters on the simulated force profile. The sensitivity analysis has been performed on (a) Young's modulus E (Pa) (for C = 2.0 × 10⁶ Pa and tan (φ) = 0.2), (b) cohesion C (Pa) (for E = 1.0 × 10⁹ Pa and tan (φ) = 0.2) and (c) friction coefficient tan (φ) (for E = 1.0 × 10⁹ Pa and C = 2.0 × 10⁶ Pa). The results presented here correspond to the RG sample.
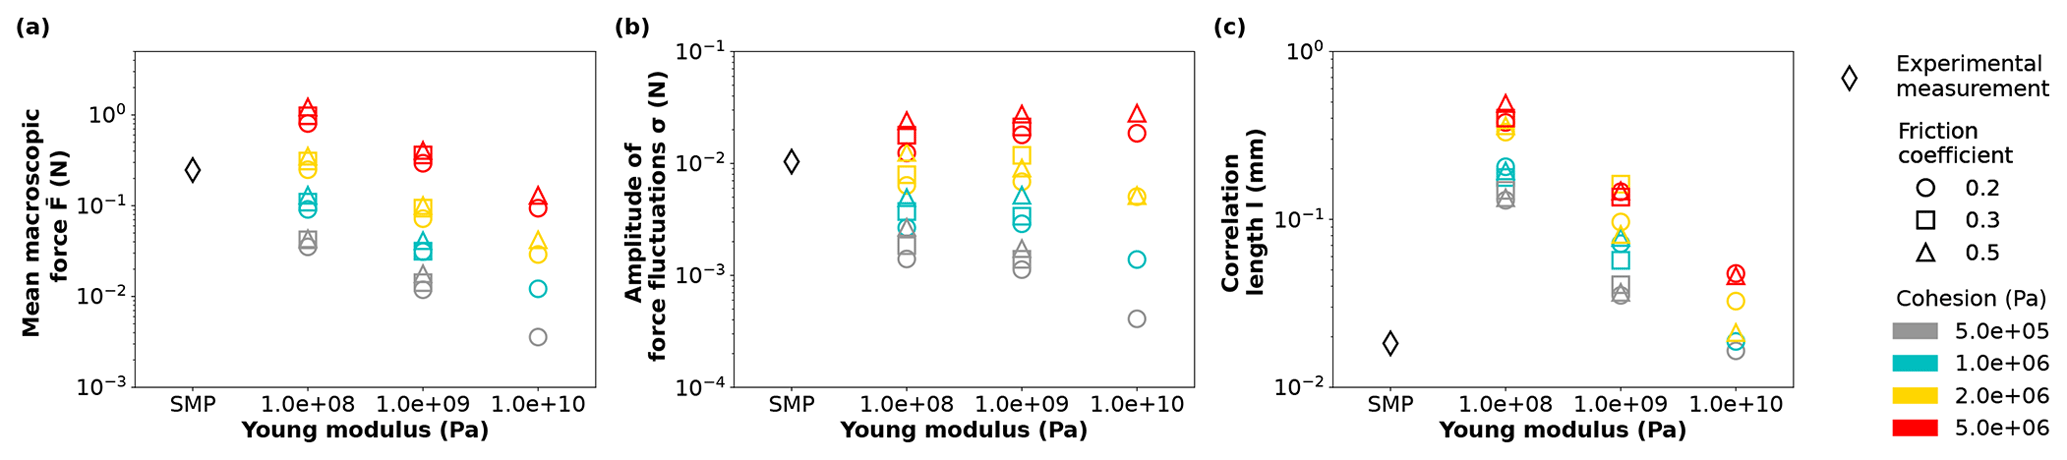
Figure 5Evolution of statistical indicators as functions of Young's modulus, cohesion and friction coefficient: (a) mean macroscopic force , (b) amplitude of force fluctuations σ and (c) correlation length l. The experimental results (black diamonds) are also represented in the plots. The results presented here correspond to the RG sample.
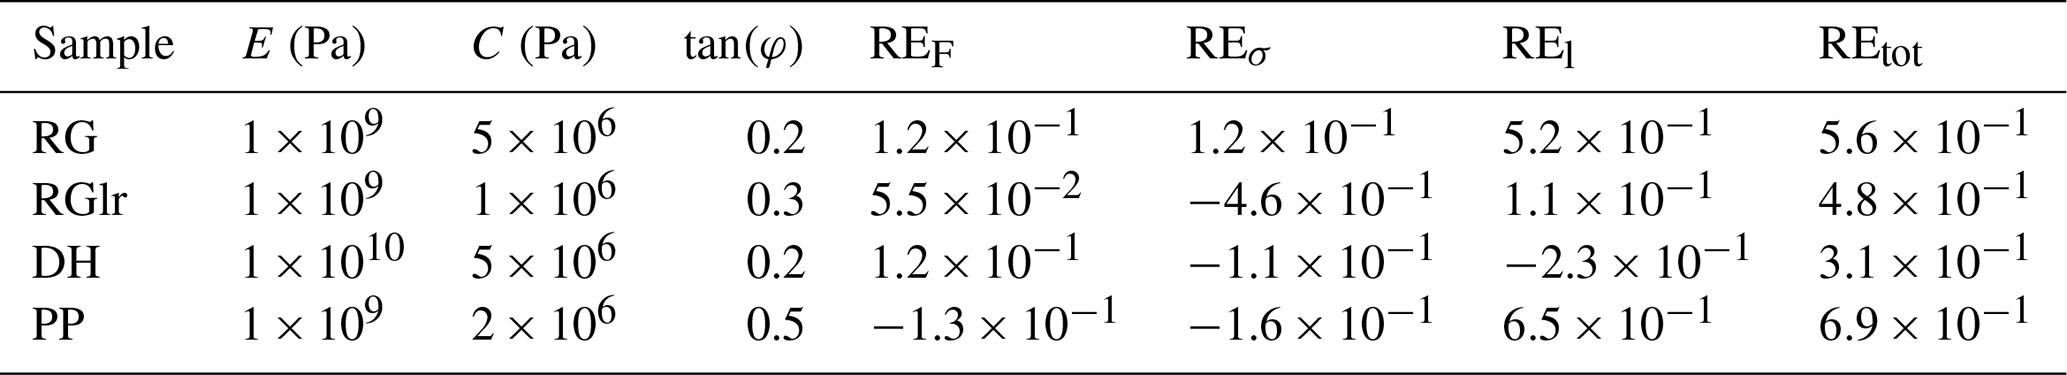
Table 3Selected combination of mechanical parameters for the RG, RGlr, DH and PP samples. The indicated values of Young's modulus E, cohesion C and friction coefficient tan (φ) correspond to the combinations that yield the lowest total error REtot on the statistical indicators (mean macroscopic force , amplitude of force fluctuations σ, correlation length l) measured experimentally. Logarithmic relative error REk for all the mechanical parameter combinations tested are indicated in Table S3.
3.2 Sensitivity to mechanical parameters
The influence of the mechanical parameters (Young's modulus, cohesion, friction coefficient) involved in the contact law has been systematically explored. For the RG sample, the force profiles obtained for the different values of the parameters within the explored ranges (Table 2) are presented in Fig. 4, and synthetic plots of the sensitivity of the statistical indicators to these parameters are presented in Fig. 5. The results for the other snow samples can be found in Sect. S2.3. Table S3 also summarises the values of statistical indicators in all cases.
First, it can be observed that increasing Young's modulus decreases the mean macroscopic force (Figs. 4a and 5a) and the correlation length (Fig. 5c). The influence of Young's modulus on the amplitude of force fluctuations is more complex and displays a co-dependency with the cohesion values (Fig. 5b). For low (respectively high) cohesion values, the amplitude of force fluctuations shows a decreasing (respectively increasing) trend with Young's modulus. Regarding the influence of cohesion, it is observed that increasing this parameter increases the three statistical indicators. Finally, increasing the friction coefficient generally also leads to an increase in the three statistical indicators. Note however that, over the range of explored friction coefficient values (0.2–0.5), the sensitivity to this parameter is less important than for the other two mechanical parameters (where E is varied over 2 orders of magnitude and where C is varied over 1 order of magnitude). Despite changes in absolute force values, the evolution of the force profiles (Figs. S14, S18 and S22) and statistical indicators (Figs. S15, S19 and S23) with the mechanical parameters follow similar trends for all the samples.
The number of broken bonds per increment of tip penetration depth appears rather insensitive to Young's modulus (Figs. S12a, S16a, S20a and S24a) and is only slightly reduced when cohesion increases (Figs. S12b, S16b, S20b and S24b). Conversely, this quantity is significantly affected by the friction coefficient, with an increase in the average bond failure rate when tan (φ) increases (Figs. S12c, S16c, S20c and S24c).
Finally, it is observed that the influence of the mechanical parameters on the radial grain displacement profiles is negligible (Figs. S13, S17, S21 and S25). Young's modulus shows no influence on the vertical grain displacement either. Cohesion appears to play a role in the vertical displacement profile for the RGlr sample, by enhancing upward movements. Larger friction coefficients tend to increase the downward movement of the grains close to the tip for all the snow types.
3.3 Comparison of the DEM results with experimental measurements
A first noticeable observation is that, for the values of the mechanical parameters tested, the orders of magnitude of the statistical indicators obtained numerically are consistent with the experimental results in most of the cases (Figs. 5, S15, S19, and S23 and Tables S2 and S3). This demonstrates that the DEM model is indeed capable of reproducing the main characteristics of the CPT force profile (Fig. S26, Table S2). However, we highlight the difficulty of matching the three statistical indicators at once for a given combination of the three mechanical parameters studied. Hence, for the RG sample (Fig. 5), the DEM simulation can reproduce the experimental mean macroscopic force and the amplitude of force fluctuations but tends to overestimate the correlation length by a factor of 8 for the best combination of mechanical parameters. For the RGlr and DH samples (Figs. S15 and S18), all the experimental statistical indicators can be reproduced individually but not for one single combination of the mechanical parameters. For the PP sample, the experimental mean macroscopic force and the amplitude of force fluctuations can be reproduced numerically, but the correlation length is systematically overestimated by a factor of at least 8 (Fig. S23).
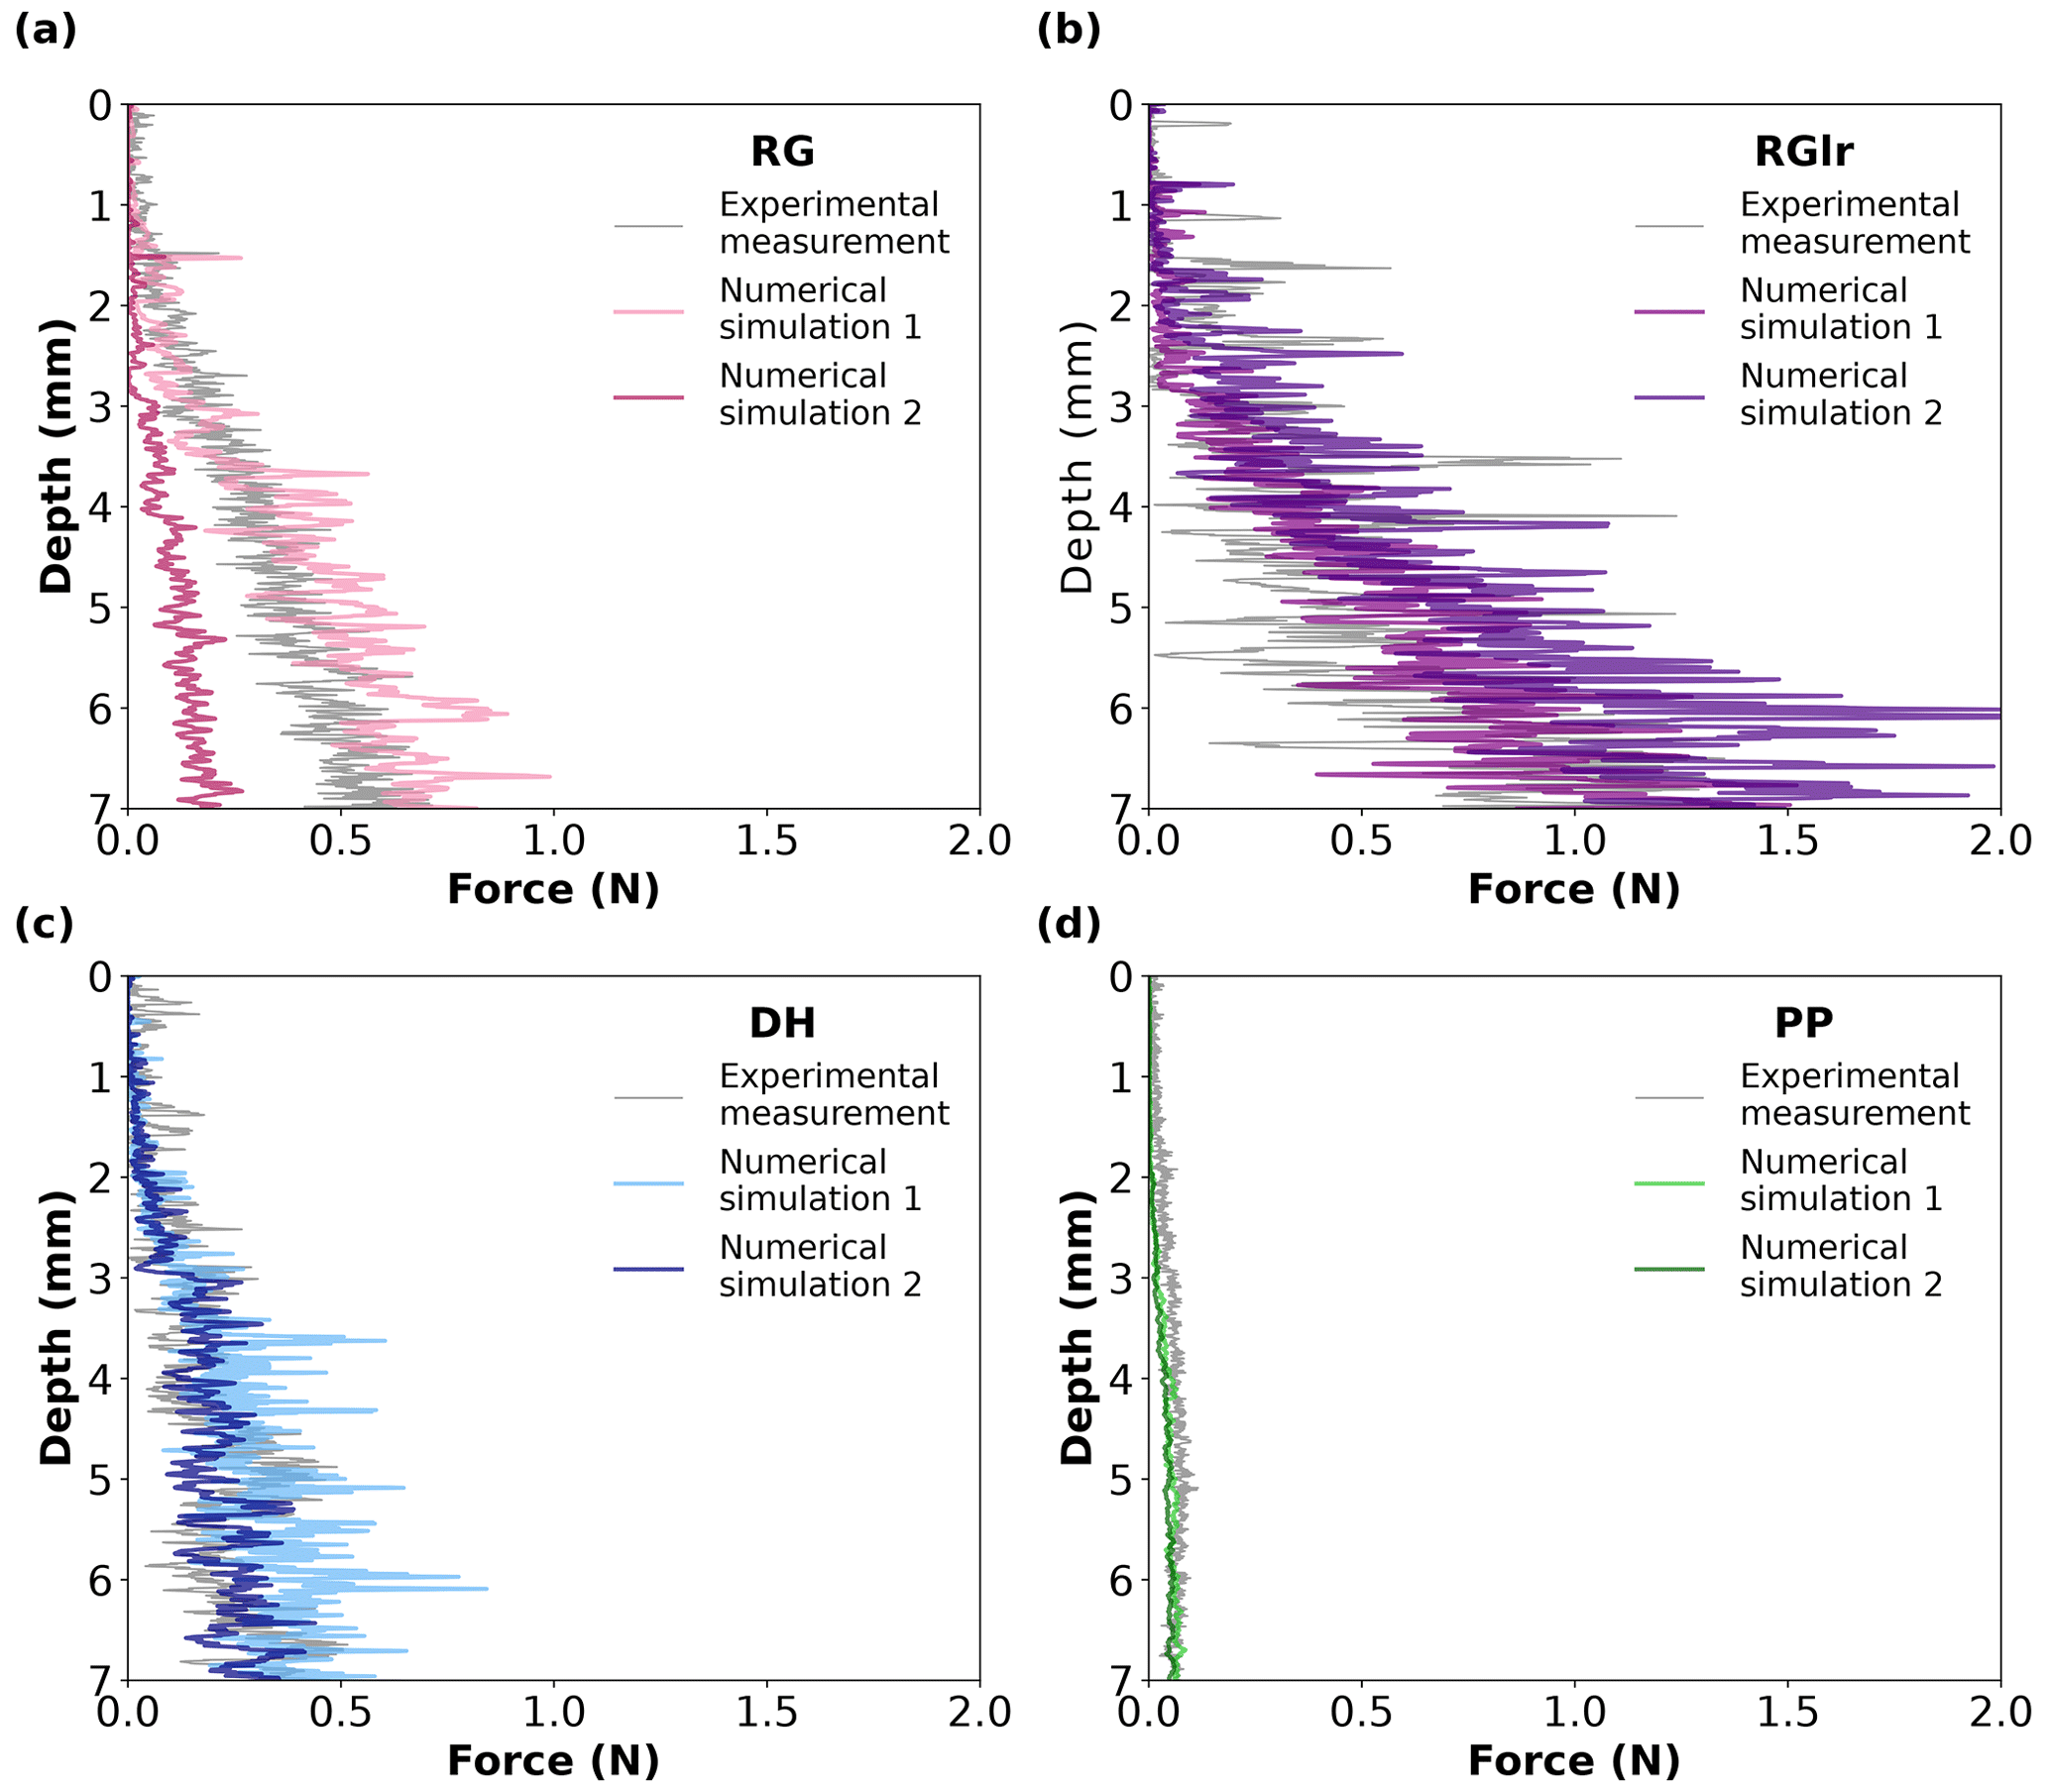
Figure 6Experimental (grey) and numerical (coloured) CPT force profiles obtained for (a) RG, (b) RGlr, (c) DH and (d) PP samples. The “Numerical simulation 1” profiles correspond to the best fit of the mechanical parameters determined for each sample (Table 3), while “Numerical simulation 2” profiles correspond to an overall best fit of the mechanical parameters for the four samples (E = 1 × 10⁹ Pa, C = 2 × 10⁶ Pa and tan (φ) = 0.2; Table S3).
Based on the sensitivity analysis (Sect. 3.2), we selected for each sample the combination of the three mechanical parameters that minimises the total error REtot (Tables 3 and S3). The corresponding simulated force profiles (referred to as “Numerical simulation 1”) are compared with the experimental profiles in Fig. 6. Note that the error values quoted in the text below correspond to relative errors calculated without the logarithmic function, as they are easier to grasp. These values therefore differ from the logarithmic relative errors shown in Tables 3 and S3 and used for the parameter selection. From a qualitative point of view, a good overall agreement is observed between these numerical and experimental force profiles. For the RG sample, the experimental mean macroscopic force is overestimated by ∼ 20 % for the numerical result, the amplitude of force fluctuation is overestimated by ∼ 70 % and the correlation length is largely overestimated by a factor of 8 (Figs. 5 and 6a, Table 3). Both the experimental and numerical force profiles reach a quasi-steady-state value at about the same depth (∼ 6 mm, Fig. S27). For the RGlr sample, the experimental mean macroscopic force is fairly reproduced with a relative error of 6 %, the amplitude of force fluctuations is underestimated by ∼ 60 % and the correlation length is overestimated by 35 % (Figs. S15 and 6b, Table 3). We note that the slope change between 2.5 and 3 mm penetration depth is reproduced numerically. However, it appeared difficult to reproduce numerically the amplitude of force fluctuations in the upper section (from 0 to 4 mm) of the experimental profile. For the DH sample, the experimental mean macroscopic force is overestimated by ∼ 25 %. The experimental amplitude of force fluctuations is underestimated by 28 %, and the correlation length is about half of the experimental value (Figs. S19 and 6c, Table 3). The numerical results minimise the force peaks observed in the upper part of the experimental profile (above 3 mm) but reproduce fairly well the main features of the amplitude of force fluctuations, especially the force jump at 3 mm depth. Finally, for the PP sample, the experimental mean macroscopic force is underestimated by ∼ 30 %, while the experimental amplitude of force fluctuations is underestimated by ∼ 60 %. In this case, the experimental correlation length could not be reproduced at all, with values overestimated by a factor of 20 (Figs. S23 and 6d, Table 3).
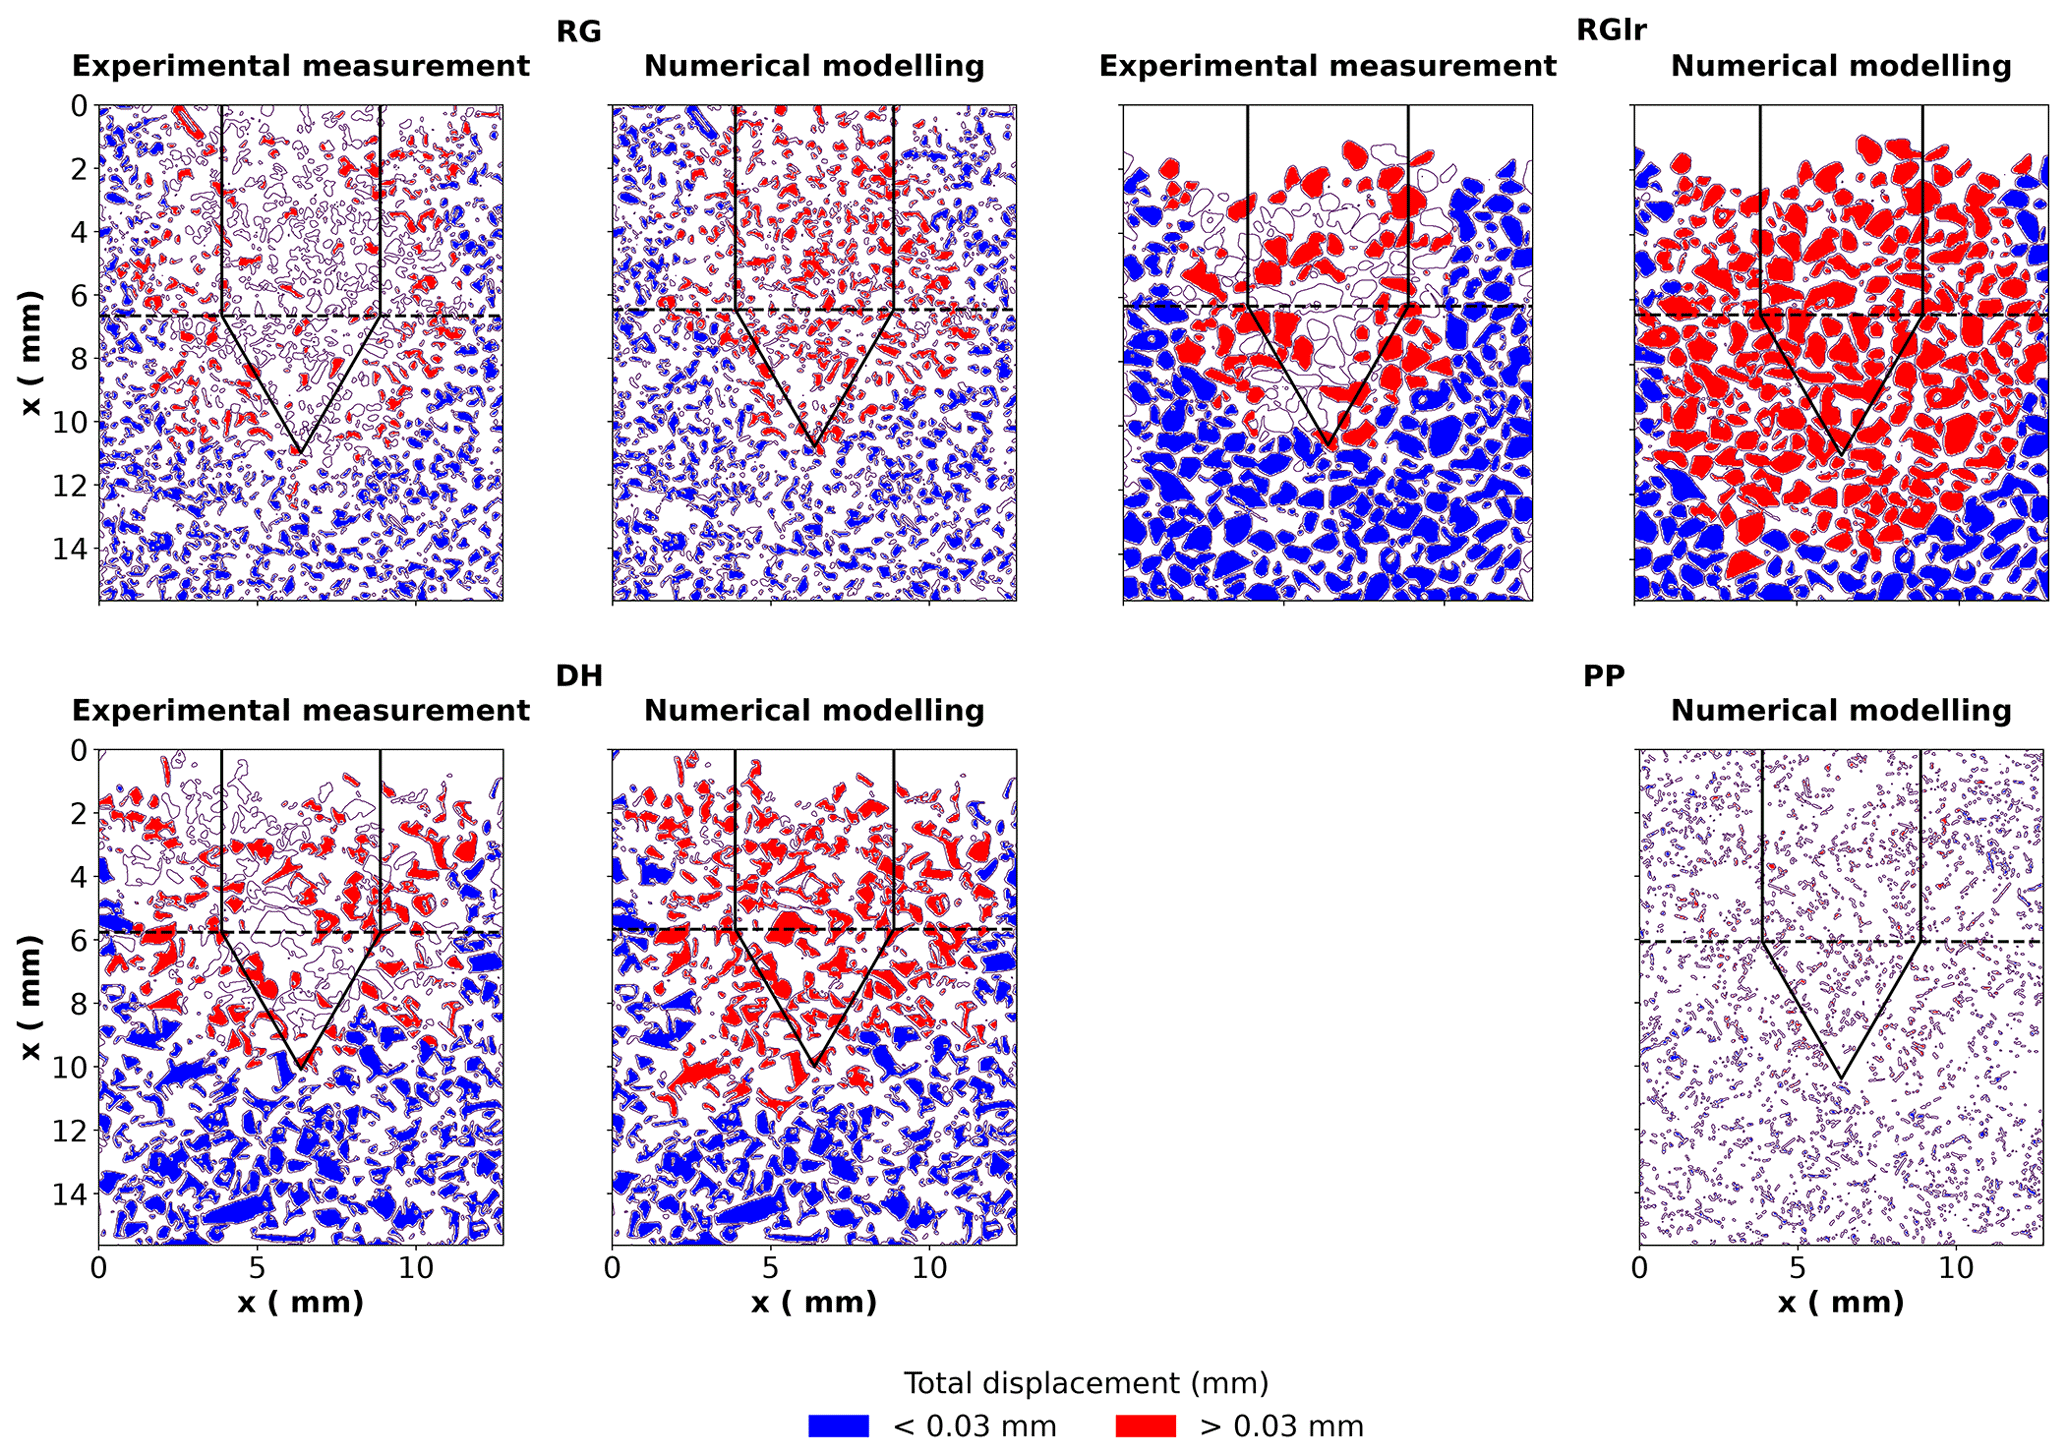
Figure 7Total displacement maps obtained experimentally with µCT (left panels) and numerically with the DEM simulation (right panels) for the RG, RGlr, DH and PP samples. A displacement threshold of 0.03 mm has been set to define the deformation zone (Peinke et al., 2020). White grains correspond to non-trackable grains in µCT scans (Peinke et al., 2020) and grains not represented in the DEM simulations. The final tip position is indicated with solid black lines. The horizontal dashed black line indicates the cone top. Displacement profiles shown in Fig. 8 are computed from the sample surface to the cone top. Numerical results are obtained with the mechanical parameters indicated in Table 3. The experimental displacement field could not be determined for the PP sample.
For comparison, we also selected the single set of mechanical parameters that minimises the combined total error REtot on RG, RGlr, DH and PP samples. Corresponding values are E = 1 × 10⁹ Pa, C = 2 × 10⁶ Pa and tan (φ) = 0.2. The respective logarithmic relative errors for each sample can be found in Table S3. As before, the error values presented in the text below correspond to the relative errors without the logarithmic function applied to the values. In general, the corresponding simulated force profiles (referred to as “Numerical simulation 2” in Fig. 6) also show a fair agreement with the experimental results. For the RG sample, however, the experimental mean macroscopic force is significantly underestimated by ∼ 70 % (Figs. 5 and 6a, Table S3). The numerical amplitude of force fluctuations is underestimated by ∼ 35 %, while the correlation length is significantly overestimated by a factor of 5. For the RGlr sample, the agreement is acceptable for the three statistical indicators with relative errors around 50 %. For the DH sample, the experimental mean macroscopic force is reproduced at 90 %, while the experimental amplitude of force fluctuations is underestimated by 60 % and the experimental correlation length is overestimated by a factor of ∼ 2. Finally, for the PP sample, the experimental mean macroscopic force is underestimated by ∼ 80 %, the amplitude of force fluctuations is underestimated by ∼ 85 % and the experimental correlation length is again strongly overestimated by a factor of 20 (Figs. S23 and 6d, Table S3).
As shown in Fig. 7, the DEM simulations also proved capable of reproducing, at least qualitatively, the experimental grain displacement patterns derived from µCT scans for the four snow types. Essentially similar results are obtained with the individual best-matching sets of mechanical parameters indicated in Table 3 (Fig. 7) and with the globally matching set of parameters introduced in the previous paragraph (Fig. S28). For the RG sample, the overall shape and size of the deformation zone are well reproduced by the simulations. For the DH sample, the radial extension of the deformation zone is well reproduced by the simulations, but the vertical extension tends to be overestimated. The largest discrepancies are observed for the RGlr sample, for which the radial and vertical extensions of the deformation zone are overestimated compared to the experimental data.
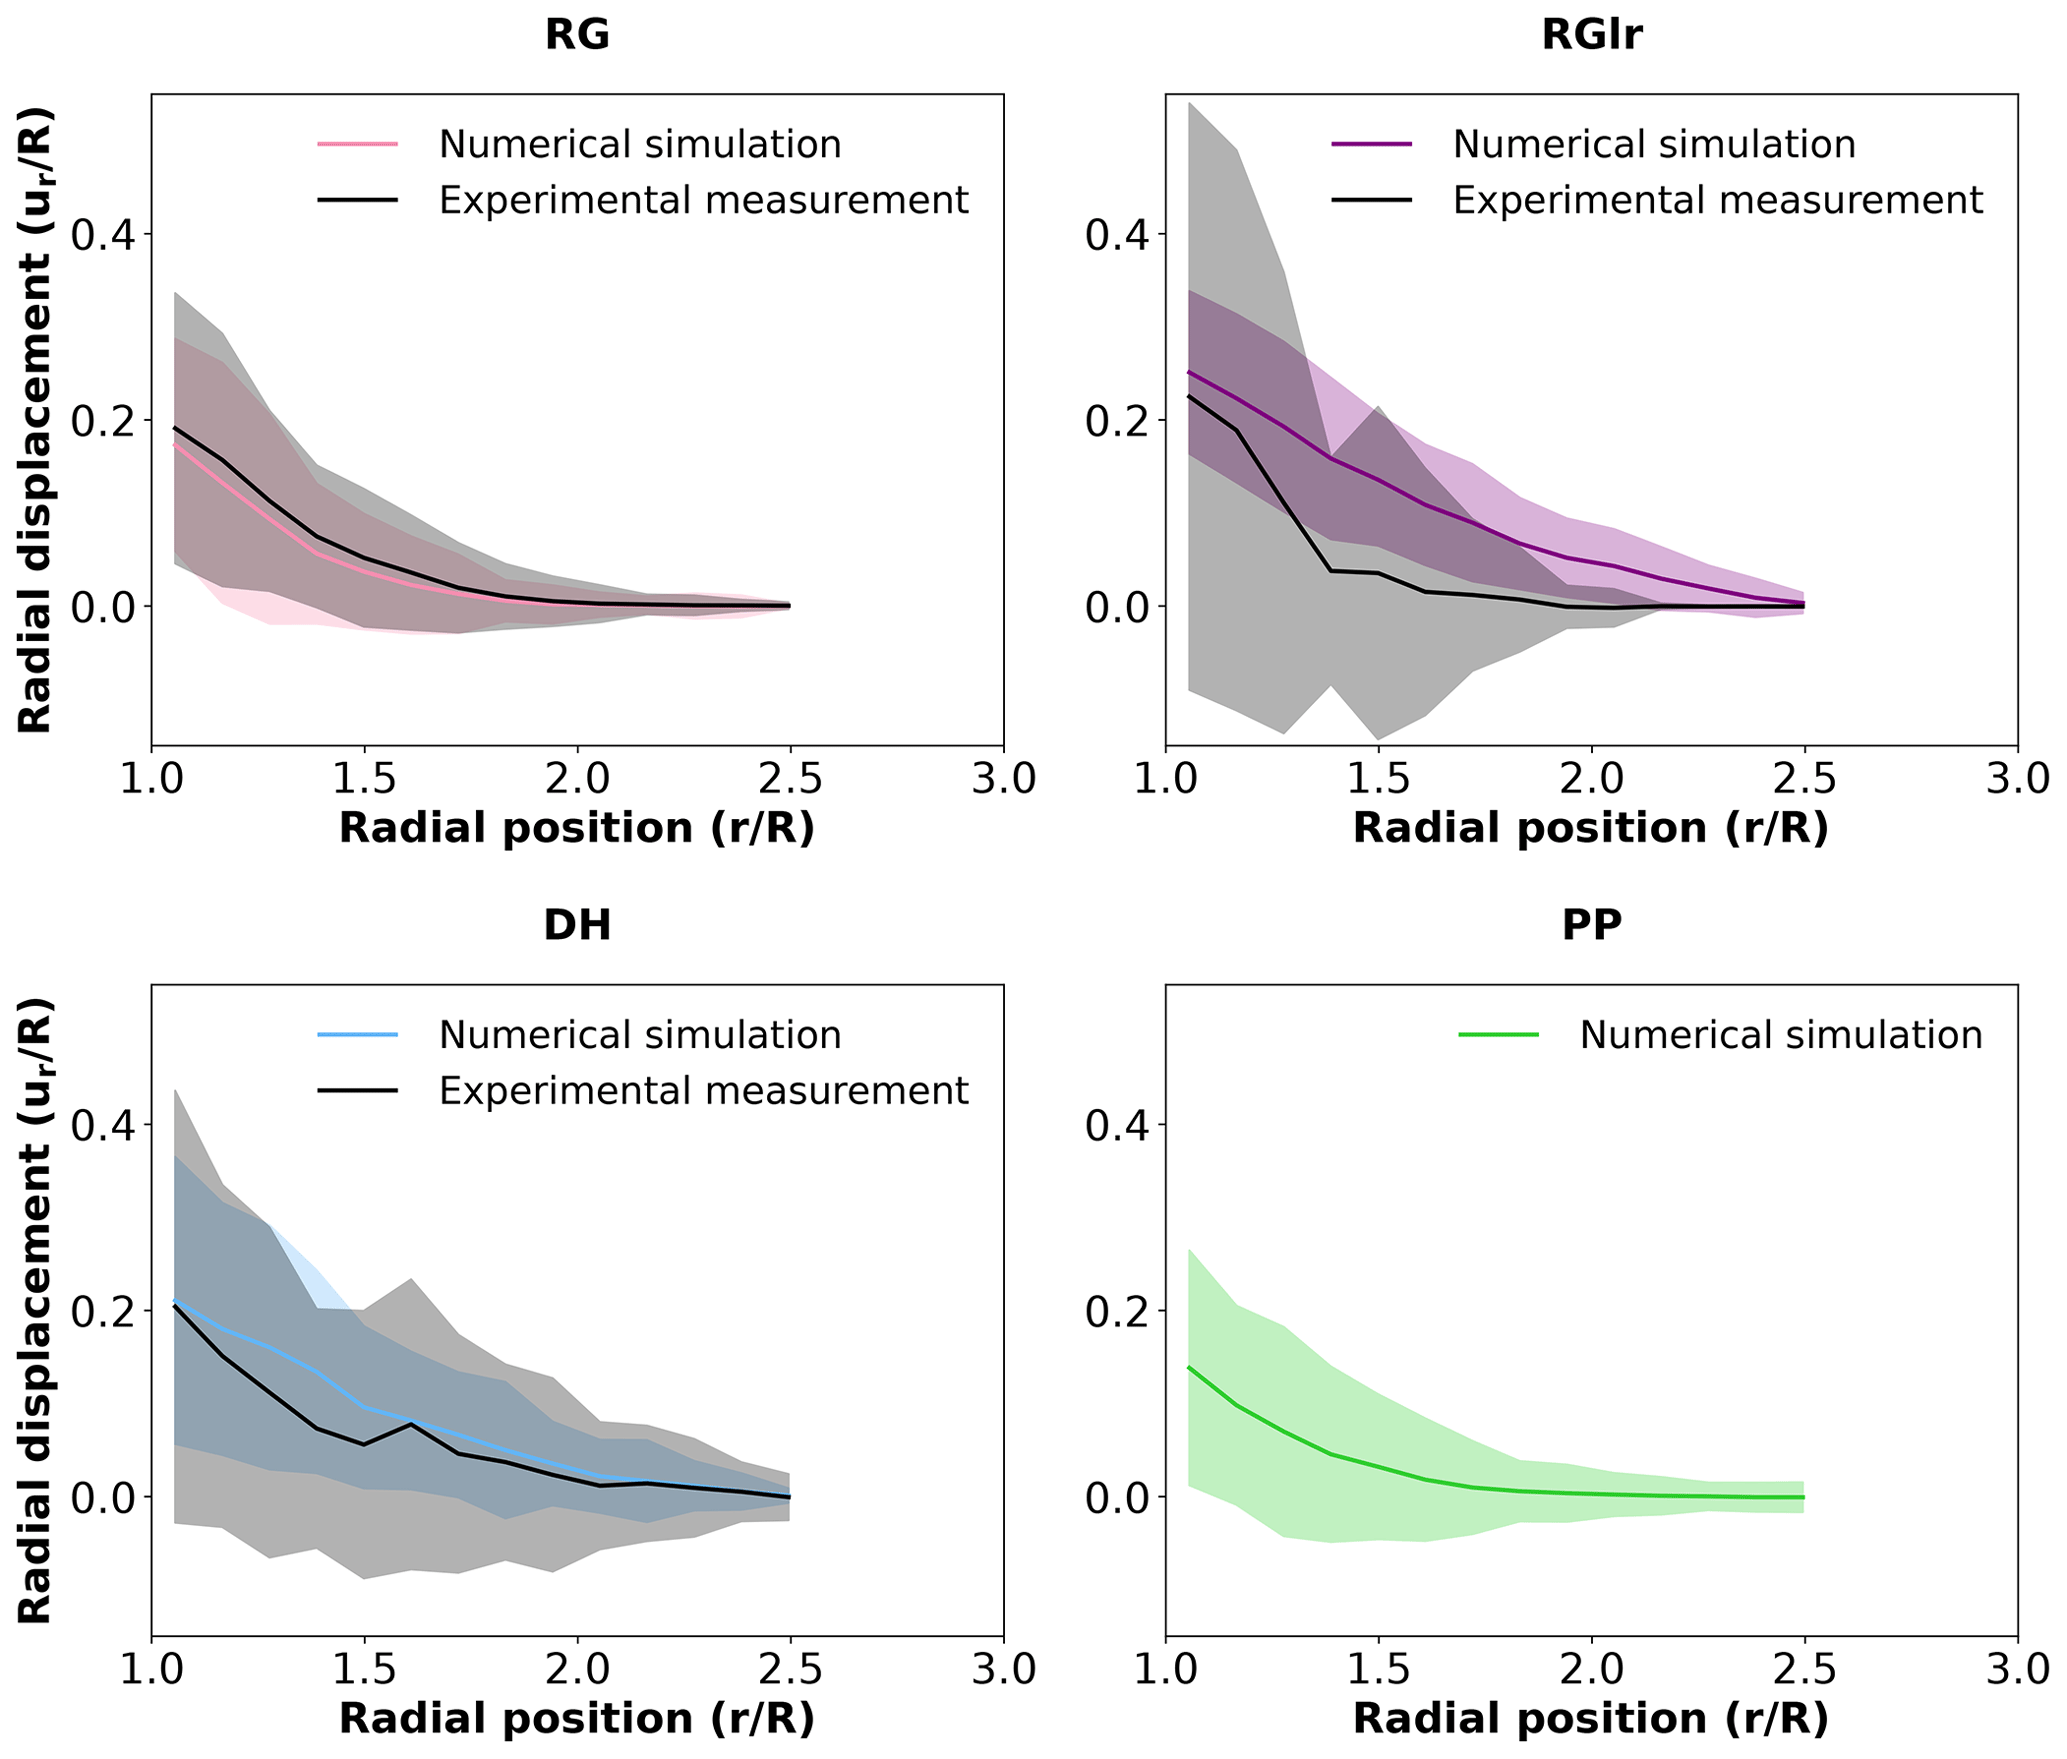
Figure 8Radial displacement profiles (solid lines) obtained experimentally (black) and numerically (coloured) for the RG, RGlr, DH and PP samples. The shadowed areas around the solid lines correspond to the standard deviation of grain displacement and exhibit the variability of the radial displacement of grains. The numerical results are obtained with the mechanical parameters indicated in Table 3.
Similarly, the radial displacement profiles obtained from the DEM numerical simulations are overall in good agreement with their experimental counterparts (Figs. 8 and S29). Consistently with the displacement maps, the largest discrepancy is observed for the RGlr sample. In particular, the abrupt slope break seen in the experimental profile at a radial position of about 1.5 is not reproduced in the numerical profile. Note, however, that, due to a relatively low number of trackable grains (Fig. 7), the standard deviation of the grain radial displacements is larger in the experimental measurements, which may result in a larger uncertainty on the average profile. In contrast, simulations on the RG and DH samples show a very good agreement with the experiments. The CZ (defined with displacement threshold set at 0.03 mm) obtained from numerical simulations extends radially up to 1.6 R, 2.2 R, 2.0 R, and 1.5 R for the RG, RGlr, DH, and PP samples, respectively. In comparison, the CZ derived from µCT scans extends radially up to 1.7 R, 1.5 R, and 1.9 R for the RG, RGlr, and DH samples, respectively (no measurement for PP sample).
4.1 Evaluation of the DEM model
We used three mechanical parameters, namely Young's modulus, the cohesion coefficient and the friction coefficient, to adjust the simulated force profiles to the experimental results. Overall, the numerical model could reproduce relatively well the mechanical response of all studied numerical samples with a single set of mechanical parameters (E = 1 × 10⁹ Pa, C = 2 × 10⁶ Pa and tan (φ) = 0.2) (Fig. 6), indicating that the differences in the force profiles among the samples are mainly dependent on the snow microstructure.
It should also be noted that the values of the mechanical parameters obtained by adjusting the model on the experimental data (either globally for all samples or for each sample individually, Table 3) are reasonably close to the mechanical properties of ice. Young's modulus of ice is measured between 9 × 10⁹ and 10 × 109 Pa (Gammon et al., 1983), while our selected values range between 1 × 10⁹ and 1 × 10¹⁰ Pa. Recall that, in YADE, Young's modulus is a numerical parameter used to define the normal contact stiffness, and it is not expected to necessarily correspond to the physical Young's modulus of the material (Sect. 2.2.2). Nevertheless, the fact that the numerical value of E is in the same range of magnitude as the elastic properties of ice provides confidence that the DEM model and the used contact law (Eqs. 1–5) correctly capture the physical processes at play. Similarly, the numerical cohesion values, ranging between 1 × 10⁶ Pa and 5 × 10⁶ Pa, are in agreement with typical cohesion values measured on ice (in the range 2 × 10⁶ to 6 × 10⁶ Pa; Schulson and Duval, 2009). Finally, numerical friction coefficients appear to be of the order of 0.2–0.5, while values measured experimentally generally range from 0.02 to 1 (Fish and Zaretsky, 1997; Maeno and Arakawa, 2004). All these results reinforce confidence in the relevance of the DEM model.
We acknowledge that the mechanical parameters obtained from minimising the logarithmic relative errors on the statistical indicators do not necessarily represent optimal values, in the sense that only a limited number of parameter sets could be tested. Based on the sensitivity analysis, a proper inversion procedure could be developed to retrieve true optimal values of the mechanical parameters. This would certainly provide more robust elements as to whether a single set of mechanical parameters can be used to represent the experimental results of all snow types or whether these mechanical parameters differ according to the snow type. Our current analysis cannot provide a conclusive answer to this question. Note that ice is a polycrystalline material, whose mechanical behaviour can be strongly anisotropic depending on the ice structure (Fish and Zaretsky, 1997; Thorsteinsson, 2001; Maeno and Arakawa, 2004). Therefore, it is not unlikely that ice bonds between grains could be characterised by different mechanical properties depending on the specific conditions of snow formation and evolution.
As further proof of the DEM predictive capabilities, we could also observe that the grain displacement fields measured for the different snow types were overall well reproduced by the simulations (Figs. 7 and 8). In particular, the model captures the radial extent of the deformation zone, which is of the order of 1.5 R–2.2 R. A discrepancy between the numerical and experimental radial displacement profiles was observed for the RGlr sample. However, it can be noted that these experimental radial displacement profiles for the RGlr sample also show the largest divergence with the prediction of the cavity expansion model (CEM) (Yu and Carter, 2002), as shown by Peinke et al. (2020). In fact, the radial profile predicted by the CEM for this sample is similar to the radial profile obtained numerically in this study.
4.2 Interpretation
4.2.1 Sensitivity to the mechanical parameters
The sensitivity analysis revealed a strong influence of the mechanical parameters on the simulation results. In particular, a clear dependence of the mean macroscopic force with Young's modulus E was observed, suggesting that a significant part of the sample undergoes elastic deformation, while brittle failures are confined in a region close to the tip. Note that a similar dependence on E with a cohesive contact law has been observed in the DEM modelling of soil compression (De Pue et al., 2019) and snow compression (Bobillier et al., 2020). The mean macroscopic force, the amplitude of force fluctuations and the correlation length all increase with the cohesion C and, to a smaller extent, with the friction coefficient tan (φ). This can be related to the fact that increasing cohesion and friction between grains increase bond strength. It was also observed that cohesion tends to prevent bond failures and to favour the upward movement of grains for samples with a large initial density, such as RGlr. In contrast, increasing the friction coefficient enhances the bond failure rate and the downward movement of grains (Figs. S12, S16, S20 and S24). When sliding between grains is inhibited, a grain dragged by the tip movement will entrain surrounding grains more easily, thus enlarging the deformation zone and triggering additional bond failures. Finally, radial grain displacements and the radius of the deformation zone appeared to be mostly insensitive to the mechanical parameters, indicating that these features are mainly controlled by the CPT configuration and snow microstructure.
4.2.2 Compaction zone development
For all snow types, the force profiles computed numerically display an S shape (Figs. 1, S6, S8 and S10). We attribute this shape to the development of a compaction zone (CZ) in front of the tip during its penetration into the numerical sample. More specifically, the first stage of the force profiles (slope increase) is presumably caused by the progressive entry of the cone into the sample. The second stage (constant slope) is attributed to the development of the CZ in front of the tip. The third stage (quasi-constant force value) suggests that a steady-state regime, with a fully developed CZ, is reached. Depending on the snow type, the numerical results indicate that full development of the CZ occurs for 6 mm to 8 mm of penetration depth. These results agree with the experimental profiles for the RG, DH and PP samples. Globally, we can highlight that the DEM simulations are able to reproduce fairly well the global shape of the experimental profiles and thus to correctly capture the development of the CZ.
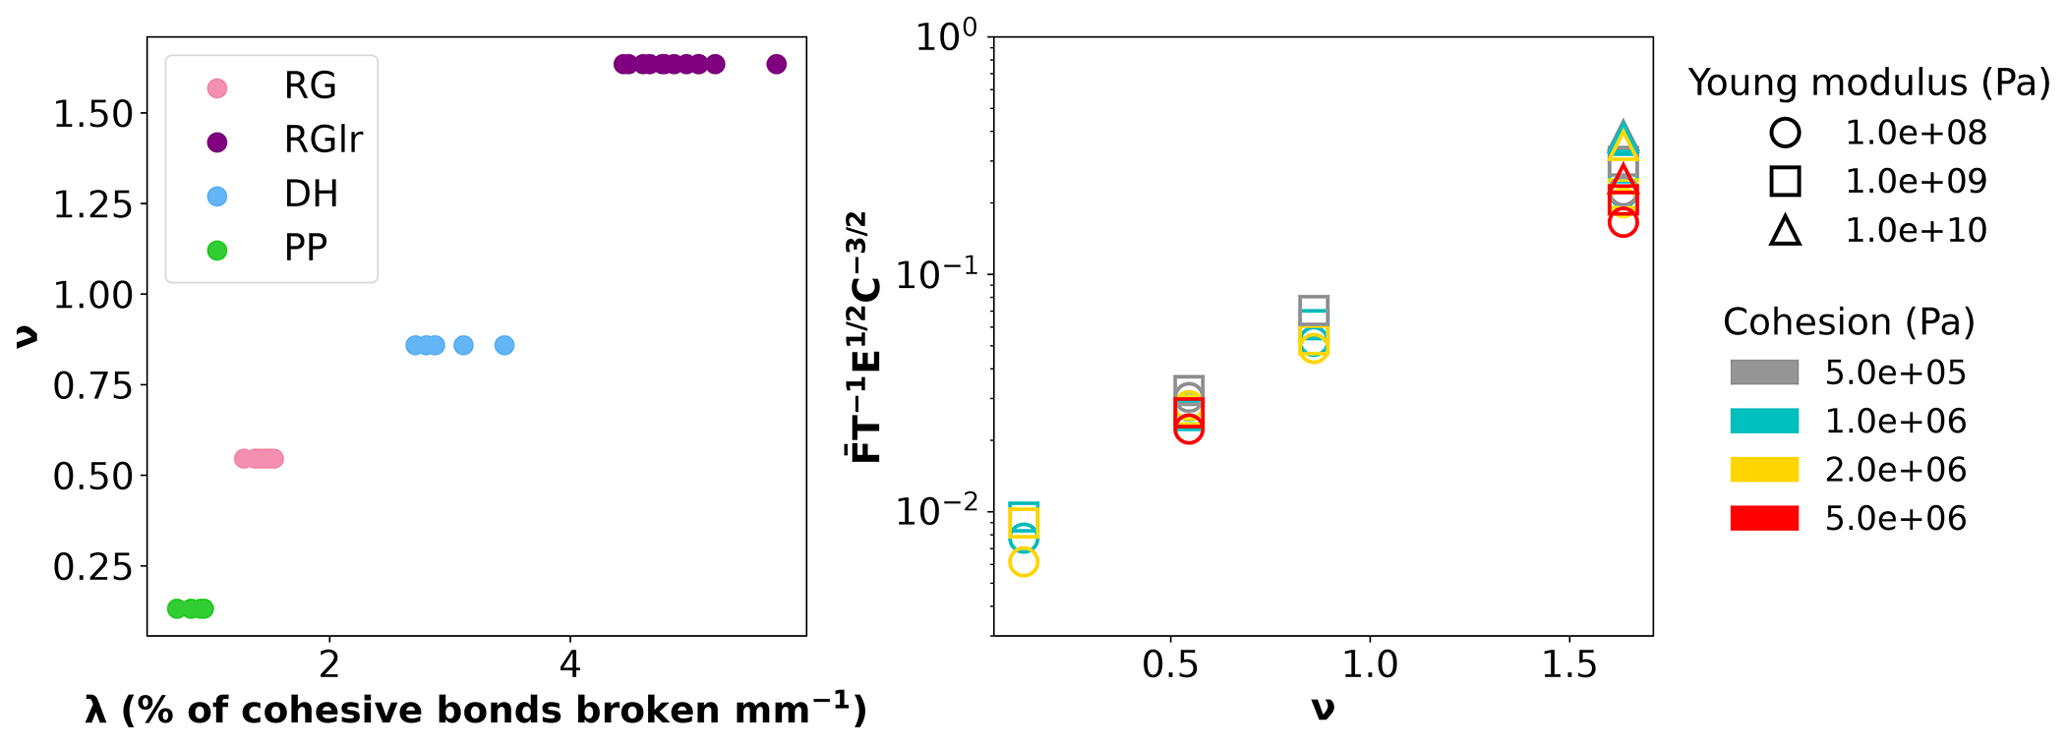
Figure 9(a) Initial contact density ν versus the slope λ of the proportion of cohesive bonds broken per unit depth (mm−1) for each snow type. The values of initial contact density ν were computed with Eq. (10), and the values are indicated in Table 1. The slopes λ were computed from the evolution of the cumulative proportion of cohesive bonds broken (Figs. S12, S16, S20 and S24) over a window of 7 mm depth. (b) Dimensionless quantity (see Eq. 11) versus the initial contact density ν for all simulation results is shown. All the results are provided for a friction coefficient tan (φ) of 0.3.
Nevertheless, in another experimental study, the CZ has been reported to be fully developed only for around 40 mm of depth penetration (Herwijnen, 2013), which is significantly deeper than the experimental and numerical results obtained in this study. A first hypothesis to explain this discrepancy is that since the maximum depth of our CPT force profiles is 10 mm, we might miss information on the full CZ development. A second explanation could be related to the differences in the experimental setups. Indeed, Peinke et al. (2020) performed the CPT on snow samples contained in cylinders of 20 mm diameter and 20 mm height, which is significantly smaller than the decimetric snow samples considered by Herwijnen (2013). Boundary effects might thus play a role in limiting the development of the CZ. Finally, the tip geometry also differs between the two studies. Peinke et al. (2020) used a plain tip, while Herwijnen (2013) used the original SMP tip geometry with a cone radius larger than the rod. A sensitivity analysis comparing the two geometries showed an influence over the upper 12 mm of the force profiles (Peinke, 2019). The plain tip geometry resulted in larger values of the mean macroscopic force and the amplitude of force fluctuation values. This effect might also influence the characteristics of the CZ development, which could be studied in the future using the presented numerical model.
4.2.3 Grain–tip interaction
The sensitivity analysis on the grain shape representation (Sect. S1.1) provides interesting insights into the interpretation of force profiles. In particular, the study highlighted that the grain shape representation could be relatively coarse (high volumetric error EV) but still produce a force profile with an acceptable mechanical error EM compared to a reference profile obtained for a fine grain shape representation (EV < 10 %) (Fig. S1, Table S1). This is notably the case for the RG sample, for which the selected grain shape representation (L = 5, S = 0.3) corresponds to a value of EV of about 40 %. Large values of EV often imply grain loss, as the smallest grains identified in the µCT scans cannot be represented by the DEM with coarse spherical elements. Yet, the similarity of the force profile to the reference force profile indicates the limited contribution of these smallest grains to the macroscopic force, compared to the largest grains with stronger bonds. The loss of grains and bonds might nevertheless directly affect the force fluctuations, providing a potential explanation as to why the DEM model underestimates the correlation length obtained experimentally for the samples with the smallest grain sizes (RG and PP) (Figs. 5 and S23).
4.2.4 Scaling relation for the mean macroscopic force
To try and synthesise the large number of simulation results obtained in this study, scaling relations describing the evolution of the statistical indicators as a function of the main simulation parameters can be looked for. We focused in particular on the mean macroscopic force , which was observed to depend both on the mechanical parameters (E, C and tan (φ)) and on sample microstructure. Since the range of friction coefficient values (between 0.2–0.5) that we could explore remained limited compared to the ranges of E and C, the parameter tan (φ) was not included in this analysis, and the results presented below correspond to a single value tan (φ) = 0.3.
First, inspection of our results (see Figs. 5a, S15a, S19a and S23a) indicates that the dependencies of the mean macroscopic force to Young's modulus E and cohesion C appear to be consistent across the four tested samples (see also Table S4). More precisely, scales with E according to a power law of the form , with an exponent α of the order of . Similarly, scales with C according to a power law of the form , with β of the order of .
Second, we can expect to be also related to the rate of cohesive broken bonds per unit penetration depth. In particular, it is observed (see Figs. S12, S16, S20 and S24) that the slope λ of the cumulative proportion of broken bonds as a function of depth is essentially independent of Young's modulus and cohesion. Conversely, as shown in Fig. 9a, this slope λ is linearly related to the initial contact density ν defined as
with z being the coordination number (number of initial cohesive interactions between grains divided by the number of grains; see Table 1), and Φ the volume fraction of the sample (ice density = 917 kg m−3; see Table 1).
From these different observations, the following scaling law for the mean macroscopic force can be proposed:
with B being a dimensionless constant, T (m2) being the surface area of the cone (with a radius R and a cone apex a, Table 2) in contact with the sample and f being a function to be determined. Figure 9b shows the dimensionless quantity plotted against the initial contact density ν. We observe that all the simulation results for the four snow types and the different values of Young's modulus and cohesion nicely merge on a unique logarithmic trend. Note, however, that a relatively larger dispersion is observed for RGlr (ν = 1.63) compared to the other samples.
Equation (11) encapsulates in a single relation the main physics controlling the mean macroscopic force recorded by the penetrometer. In particular, this relation indicates that the influence of snow microstructure can be captured, at least as a first approximation, by the initial contact density ν. Former studies already showed that this parameter plays a key role in the mechanical behaviour of cohesive granular materials (Gaume et al., 2017b). Looking for similar relations describing the other statistical indicators (amplitude of force fluctuations and correlation length) constitutes an interesting prospect for future analyses, although we can anticipate these indicators to display more complex dependencies. Further analyses will also be required to explore the influence of the friction coefficient on these relations.
We have evaluated a numerical model based on a DEM that reproduces the mechanical behaviour of snow in the brittle regime. The DEM model takes into account the ice properties and the snow microstructure captured by tomography. The experimental configuration of the CPT measurements conducted on different snow types by Peinke et al. (2020) has been reproduced with the DEM model. Three parameters, namely the mean macroscopic force, the amplitude of force fluctuations and the correlation length, were used to quantify the similitude of the numerical and experimental profiles. The grain displacement field was computed and compared to the experimental displacement field derived from µCT scans acquired before and after the CPT.
The DEM model has demonstrated, overall, a good capability to reproduce the mechanical responses of CPTs performed in different snow types. The computed force profiles satisfactorily reproduce the main characteristics of the experimental force profiles. The results revealed that the force profile characteristics are strongly dependent on the microstructure. A sensitivity analysis also demonstrated the dependence of the mechanical response to the mechanical parameters of the contact law. In particular, a simple scaling law could be derived, relating the mean macroscopic force computed by the DEM to the mechanical parameters E (Young's modulus) and C (cohesion), as well as to the microstructure characteristics captured by the initial contact density. The displacement fields are also well reproduced by the model, except for the RGlr sample, showing a larger extent for the numerical results. The agreement in terms of radial displacement profiles is very good. The grains are mainly travelling downward during the CPT, although for the RGlr sample the upward movements close to the surface are not negligible. The CPT implies a complex deformation field with a compression zone around the apex and an expansion zone close to the surface (Peinke et al., 2020). Therefore, being able to reproduce the force profiles (including high-frequency fluctuations) and displacement fields for this mechanical test constitutes a strong validation of the reliability of the DEM model.
However, a downside of the DEM is its high computational cost (simulation times ranging from 1 week to several months depending on the physical and numerical parameters for the chosen CPT configuration), which limited the range of mechanical parameters that could be explored for all snow types. The developed DEM model nonetheless constitutes a versatile approach that could be applied to various materials and configurations in future studies. In particular, it will be possible to use the model to gain more physical insights into the interaction between the tip and the grains, in order to better interpret the CPT force profiles. Such analyses will provide ways to test and derive relevant macroscale and microscale mechanical parameters to characterise the microstructure properties from the CPT force signal solely. In particular, the validity of the assumptions made by the HPP-NHPP method, as well as the influence of the CZ development, will be assessed. Future studies may also consider refining the used contact laws, e.g. the influence of sintering processes on CPT results.
Codes can be provided by the corresponding author upon request.
All data can be provided by the corresponding author upon request.
The supplement related to this article is available online at: https://doi.org/10.5194/tc-18-3787-2024-supplement.
CH, PH, and GC developed the numerical model; CH performed simulations and evaluated the numerical model; IP, PH, GC, and JR designed the experiment; IP acquired experimental data; IP processed and analysed experimental measurements; CH analysed and interpreted the numerical results; CH wrote the manuscript draft; and PH and GC reviewed and edited the manuscript.
At least one of the (co-)authors is a member of the editorial board of The Cryosphere. The peer-review process was guided by an independent editor, and the authors also have no other competing interests to declare.
Publisher's note: Copernicus Publications remains neutral with regard to jurisdictional claims made in the text, published maps, institutional affiliations, or any other geographical representation in this paper. While Copernicus Publications makes every effort to include appropriate place names, the final responsibility lies with the authors.
We thank the two reviewers, Richard Parsons and Henning Löwe, for their constructive feedback that enabled us to significantly improve the quality of our paper.
This research has been supported by the Centre National de la Recherche Scientifique (CNRS), the Centre National de la Recherche Météorologique and the Agence Nationale de la Recherche (ANR project MiMESis-3D ANR-19-CE01-0009). IGE and CNRM-CEN are part of LabEx OSUG (ANR-10-LABX-0056). IGE is part of LabEx TEC21 (ANR-11-LABX-0030).
This paper was edited by Melody Sandells and reviewed by Richard Parsons and Henning Löwe.
Bartelt, P. and Lehning, M.: A physical SNOWPACK model for the Swiss avalanche warning: Part I—Numerical model, Cold Reg. Sci. Technol., 35, 123–145, https://doi.org/10.1016/S0165-232X(02)00074-5, 2002.
Bishop, R. F., Hill, R., and Mott, F. N.: The theory of indentation hardness tests, P. Phys. Soc., 57, 321, https://doi.org/10.1088/0959-5309/57/3/301, 1945.
Bobillier, G., Bergfeld, B., Capelli, A., Dual, J., Gaume, J., van Herwijnen, A., and Schweizer, J.: Micromechanical modeling of snow failure, The Cryosphere, 14, 39–49, https://doi.org/10.5194/tc-14-39-2020, 2020.
Bobillier, G., Bergfeld, B., Dual, J., Gaume, J., Herwijnen, A., and Schweizer, J.: Micro-mechanical insights into the dynamics of crack propagation in snow fracture experiments, Sci. Rep.-UK, 11, 11711, https://doi.org/10.1038/s41598-021-90910-3, 2021.
Bolton, M. D., Gui, M. W., and Phillips, R.: Review of miniature soil probes for model tests, in: Proceedings of the 11th Southeast Asian Geotechnical Conference, Singapore, 4–8 May 1993, 85–90, 1993.
Brun, E., David, P., Sudul, M., and Brunot, G.: A numerical model to simulate snow-cover stratigraphy for operational avalanche forecasting, J. Glaciol., 38, 13–22, https://doi.org/10.3189/S0022143000009552, 1992.
Calonne, N., Flin, F., Geindreau, C., Lesaffre, B., and Rolland du Roscoat, S.: Study of a temperature gradient metamorphism of snow from 3-D images: time evolution of microstructures, physical properties and their associated anisotropy, The Cryosphere, 8, 2255–2274, https://doi.org/10.5194/tc-8-2255-2014, 2014.
Calonne, N., Flin, F., Lesaffre, B., Dufour, A., Roulle, J., Puglièse, P., Philip, A., Lahoucine, F., Geindreau, C., Panel, J.-M., Rolland du Roscoat, S., and Charrier, P.: CellDyM: a room temperature operating cryogenic cell for the dynamic monitoring of snow metamorphism by time-lapse X-ray microtomography, Geophys. Res. Lett., 42, 3911–3918, https://doi.org/10.1002/2015GL063541, 2015.
Coeurjolly, D., Montanvert, A., and Chassery, J.-M.: Descripteurs de forme et moments géométriques, in: Géométrie discrète et images numériques, Hermès, ISBN13 978-2-7462-1643-3, EAN13 9782746216433, https://www.eyrolles.com/Informatique/Livre/geometrie-discrete-et-images-numeriques-9782746216433/ (last access: 19 August 2024), 2007.
Coléou, C., Lesaffre, B., Brzoska, J.-B., Ludwig, W., and Boller, E.: Three dimensional snow images by X-ray microtomography, Ann. Glaciol., 32, 75–81, https://doi.org/10.3189/172756401781819418, 2001.
De Pue, J., Di Emidio, G., Verastegui Flores, R. D., Bezuijen, A., and Cornelis, W. M.: Calibration of DEM material parameters to stimulate stress-strain behaviour of unsaturated soils during uniaxial compression, Soil Till. Res., 194, 104303, https://doi.org/10.1016/j.still.2019.104303, 2019.
Dowd, T. and Brown, R. L.: A new instrument for determining strength profiles in snow cover, J. Glaciol., 32, 299–301, https://doi.org/10.3189/S0022143000015628, 1986.
Fierz, C., Armstrong, R. L., Durand, Y., Etchevers, P., Greene, E., and McClung, D. M.: The international classification for seasonal snow on the ground, in: Tech. Doc. Hydrol. 83, UNESCO, Paris, 2009.
Fish, A. M. and Zaretsky, Y. K.: Ice strength as a function of hydrostatic pressure and temperature, CRREL report, 38207814, Cold Regions Research and Engineering Laboratory, https://books.google.ch/books/about/Ice_Strength_as_a_Function_of_Hydrostati.html?id=smZ-0AEACAAJ&redir_esc=y (last access: 19 August 2024), 1997.
Floyer, J. A. and Jamieson, J. B.: Rate-effect experiments on round-tipped penetrometer insertion into uniform snow, J. Glaciol., 56, 664–672, https://doi.org/10.3189/002214310793146322, 2010.
Freitag, J., Wilhelms, F., and Kipfstuhl, S.: Microstructure dependent densification of polar firn derived from X-ray microtomography, J. Glaciol., 50, 243–250, https://doi.org/10.3189/172756504781830123, 2004.
Gammon, P. H., Kiefte; H., Clouter, M. J., and Denner, W. W.: Elastic constants of artificial and natural ice samples by Brillouin spectroscopy, J. Glaciol., 29, 433–460, https://doi.org/10.3189/S0022143000030355, 1983.
Gaume, J., van Herwijnen, A., Chambon, G., Birkeland, K. W., and Schweizer, J.: Modeling of crack propagation in weak snowpack layers using the discrete element method, The Cryosphere, 9, 1915–1932, https://doi.org/10.5194/tc-9-1915-2015, 2015.
Gaume, J., van Herwijnen, A., Chambon, G., Wever, N., and Schweizer, J.: Snow fracture in relation to slab avalanche release: critical state for the onset of crack propagation, The Cryosphere, 11, 217–228, https://doi.org/10.5194/tc-11-217-2017, 2017a.
Gaume, J., Löwe, H., Tan, S., and Tsang, L.: Sacaling laws for the mechanics of loose and cohesive granular materials based on Baxter's sticky hard spheres, Phys. Rev. E, 96, 032914, https://doi.org/10.1103/PhysRevE.96.032914, 2017b.
Gubler, H. U.: On the ramsonde hardness equation, IAHS-AISH Publ., 114, 110–121, 1975.
Hagenmuller, P., Chambon, G., Lesaffre, B., Flin, F., and Naaim, M.: Energy-based binary segmentation of snow microtomographic images, J. Glaciol., 59, 859–873, https://doi.org/10.3189/2013JoG13J035, 2013.
Hagenmuller, P., Calonne, N., Chambon, G., Flin, F., Geindreau, C., and Naaim, M.: Characterization of the snow microstructural bonding system through the minimum cut density, Cold Reg. Sci. Technol., 108, 72–79, https://doi.org/10.1016/j.coldregions.2014.09.002, 2014.
Hagenmuller, P., Chambon, G., and Naaim, M.: Microstructure-based modeling of snow mechanics: a discrete element approach, The Cryosphere, 9, 1969–1982, https://doi.org/10.5194/tc-9-1969-2015, 2015.
Heggli, M., Köchle, B., Matzl, M., Pinzer, B. R., Riche, F., Steiner, S., Steinfeld, D., and Schneebeli, M.: Measuring snow in 3-D using X-ray tomography: Assessment of visualization techniques, Ann. Glaciol., 52, 231–236, https://doi.org/10.3189/172756411797252202, 2011.
Herwijnen, A. V.: Experimental analysis of snow micropenetrometer (SMP) cone penetration in homogeneous snow layers, Can. Geotech. J., 50, 1044–1054, https://doi.org/10.1139/cgj-2012-0336, 2013.
Jamieson, J. B. and Johnston, C. D.: Snowpack characteristics associated with avalanche accidents, Can. Geotech. J., 29, 862–866, https://doi.org/10.1139/t92-093, 1992.
Johnson, J. and Schneebeli, M.: Characterizing the microstructural and microchemical properties of snow, Cold Reg. Sci. Technol., 30, 91–100, https://doi.org/10.1016/S0165-232X(99)00013-0, 1999.
Johnson, J. B. and Hopkins, M. A.: Identifying microstructural deformation mechanisms in snow using discrete-element modeling, J. Glaciol., 51, 432–442, https://doi.org/10.3189/172756505781829188, 2005.
LeBaron, A., Miller, D., and van Herwijnen, A.: Measurements of the deformation zone around a split-axis snow micropenetrometer tip, Cold Reg. Sci. Technol., 97, 90–96, https://doi.org/10.1016/j.coldregions.2013.10.008, 2014.
Löwe, H. and van Herwijnen, A.: A Poisson shot noise model for micropenetration of snow, Cold Reg. Sci. Technol., 70: 62–70, https://doi.org/10.1016/j.coldregions.2011.09.001, 2012.
Lunne, T., Robertson, P. K., and Powell, J. J. M.: Cone penetration testing in geotechnical practice, Blackie Academic, EF Spon/Routledge, New York, 1997.
Mackenzie, R. and Payten, W.: A portable, variable-speed, penetrometer for snow pit evaluation, in: Proceedings of the 2002 International Snow Science Workshop, Penticton, BC, 29 September–4 October 2002, 294–300, 2002.
Maeno, N. and Arakawa, M.: Adhesion shear theory of ice friction at low sliding velocities, combined with ice sintering, J. Appl. Phys., 95, 134–139, https://doi.org/10.1063/1.1633654, 2004.
Marshall, H. P. and Johnson, J. B.: Accurate inversion of high-resolution snow penetrometer signals for microstructural and micromechanical properties, J. Geophys. Res.-Earth, 114, F04016, https://doi.org/10.1029/2009JF001269, 2009.
McCallum, A.: A brief introduction to cone penetration testing (CPT) in frozen geomaterials, Ann. Glaciol., 55, 7–14, https://doi.org/10.3189/2014AoG68A005, 2014.
Mede, T., Chambon, G., Hagenmuller, P., and Nicot, F.: A medial axis based method for irregular grain shape representation in DEM simulations, Granul. Matter, 20, 1–11, https://doi.org/10.1007/s10035-017-0785-7, 2018a.
Mede, T., Chambon, G., Hagenmuller, P., and Nicot, F.: Snow failure modes under mixed loading, Geophys. Res. Lett., 45, 13–351, https://doi.org/10.1029/2018GL080637, 2018b.
Mede, T.: Etude numérique du comportement mécanique de la neige: une perspective microstructurale, Université Grenoble Alpes, https://theses.fr/2019GREAU004 (last access: 19 August 2024), 2019.
Mede, T., Chambon, G., Nicot, F., and Hagenmuller, P.: Micromechanical investigation of snow failure under mixed-mode loading, Int. J. Solids Struct., 199, 95–108, https://doi.org/10.1016/j.ijsolstr.2020.04.020, 2020.
Montagnat, M., Löwe, H., Calonne, N., Schneebeli, M., Matzl, M., and Jaggi, M.: On the birth of structural and crystallographic fabric signals in polar snow: A case study from the EastGRIP snowpack, Front. Earth Sci., 8, 365, https://doi.org/10.3389/feart.2020.00365, 2020.
Narita, H.: An experimental study on tensile fracture of snow, Contribut. Inst. Low Temperat. Sci., A32, 1–37, 1983.
Peinke, I.: Étude à micro-échelle du test de pénétration du cône dans la neige, Météorologie, Université Paul Sabatier – Toulouse III, https://theses.hal.science/tel-02879065v1/document (last access: 19 August 2024), 2019.
Peinke, I., Hagenmuller, P., Chambon, G., and Roulle, J.: Investigation of snow sintering at microstructural scale from micro-penetration tests, Cold Reg. Sci. Technol., 162, 43–55, https://doi.org/10.1016/j.coldregions.2019.03.018, 2019.
Peinke, I., Hagenmuller, P., Andò, E., Chambon, G., Flin, F., and Roulle, J.: Experimental Study of Cone Penetration in Snow Using X-Ray Tomography, Front. Earth Sci., 8, 63, https://doi.org/10.3389/feart.2020.00063, 2020.
Proksch, M., Löwe, H., and Schneebeli, M.: Density, specific surface area, and correlation length of snow measured by high-resolution penetrometry, J. Geophys. Res.-Earth, 120, 346–362, https://doi.org/10.1002/2014JF003266, 2015.
Reuter, B., Proksch, M., Löwe, H., Van Herwijnen, A., and Schweizer, J.: Comparing measurements of snow mechanical properties relevant for slab avalanche release, J. Glaciol., 65, 55–67, https://doi.org/10.1017/jog.2018.93, 2019.
Ruiz, S., Straub, I., Schymanski, S. J., and Or, D.: Experimental evaluation of earthworm and plant root soil penetration-cavity expansion models using cone penetrometer analogs, Vadose Zone J., 15, 1–14, https://doi.org/10.2136/vzj2015.09.0126, 2016.
Ruiz, S., Capelli, A., van Herwijnen, A., Schneebeli, M., and Or, D.: Continuum cavity expansion and discrete micromechanical models for inferring macroscopic snow mechanical properties fromcone penetration data, Geophys. Res. Lett., 44, 8377–8386, https://doi.org/10.1002/2017GL074063, 2017.
Shapiro, L. H., Johnson, J. B., Sturm, M., and Blaisdell, G. L.: Snow mechanics: review of the state of knowledge and applications, CRREL Rep. 97-3, Cold Regions Research and Engineering Laboratory, https://apps.dtic.mil/sti/citations/ADA330695 (last access: 19 August 2024), 1997.
Schaap, L. H. J. and Föhn, P. M. B.: Cone penetration testing in snow, Can. Geotech. J., 24, 335–341, https://doi.org/10.1139/t87-044, 1987.
Schneebeli, M.: Numerical simulation of elastic stress in the microstructure of snow, Ann. Glaciol., 38, 339–342, https://doi.org/10.3189/172756404781815284, 2004.
Schneebeli, M. and Johnson, J. B.: A constant-speed penetrometer for high resolution snow stratigraphy, Ann. Glaciol., 26, 107–111, https://doi.org/10.3189/1998AoG26-1-107-111, 1998.
Schneebeli, M. and Sokratov. S. A.: Tomography of temperature gradient metamorphism of snow and associated changes in heat conductivity, Hydrol. Process., 18, 3655–3665, https://doi.org/10.1002/hyp.5800, 2004.
Schulson, E. M. and Duval, P.: Creep and Fracture of Ice, Cambridge University Press, ISBN 978-0-521-80620-6, 2009.
Schweizer, J., Jamieson, J. B., and Schneebeli, M.: Snow avalanche formation, Rev. Geophys., 41, 1016, https://doi.org/10.1029/2002RG000123, 2003.
Šmilauer, V., Angelidakis, V., Catalano, E., Caulk, R., Chareyre, B., Chèvremont, W., Dorofeenko, S., Duriez, J., Dyck, N., Elias, J., Er, B., Eulitz, A., Gladky, A., Guo, N., Jakob, C., Kneib, F., Kozicki, J., Marzougui, D., Maurin, R., Modenese, C., Pekmezi, G., Scholtès, L., Sibille, L., Stransky, J., Sweijen, T., Thoeni, K., and Yuan, C.: Yade documentation, Zenodo [software], https://doi.org/10.5281/zenodo.5705394, 2021.
Thorsteinsson, T.: An analytical approach to deformation of anisotropic ice-crystal aggregates, J. Glaciol., 47, 507–516, https://doi.org/10.3189/172756501781832124, 2001.
Vionnet, V., Brun, E., Morin, S., Boone, A., Faroux, S., Le Moigne, P., Martin, E., and Willemet, J.-M.: The detailed snowpack scheme Crocus and its implementation in SURFEX v7.2, Geosci. Model Dev., 5, 773–791, https://doi.org/10.5194/gmd-5-773-2012, 2012.
Wautier, A., Geindreau, C., and Flin, F.: Linking snow microstructure to its macroscopic elastic stiffness tensor: A numerical homogenization method and its application to 3-D images from X-ray tomography, Geophys. Res. Lett., 42, 8031–8041, https://doi.org/10.1002/2015GL065227, 2015.
Yu, H. S. and Carter, J.: Rigorous similarity solutions for cavity expansion in cohesive-frictional soils, Int. J. Geomech., 2, 233–258, https://doi.org/10.1061/(ASCE)1532-3641(2002)2:2(233), 2002.
Zhao, T.: Coupled DEM-CFD Analyses of Landslide-Induced Debris Flows, Springer, https://doi.org/10.1007/978-981-10-4627-8, 2017.