the Creative Commons Attribution 4.0 License.
the Creative Commons Attribution 4.0 License.
 | 25 Jul 2024
Characterization of in situ cosmogenic 14CO production, retention and loss in firn and shallow ice at Summit, Greenland
Benjamin Hmiel
Vasilii V. Petrenko
Christo Buizert
Andrew M. Smith
Michael N. Dyonisius
Philip Place
Bin Yang
Quan Hua
Ross Beaudette
Jeffrey P. Severinghaus
Christina Harth
Ray F. Weiss
Lindsey Davidge
Melisa Diaz
Matthew Pacicco
James A. Menking
Michael Kalk
Xavier Faïn
Alden Adolph
Isaac Vimont
Lee T. Murray
Measurements of carbon-14-containing carbon monoxide (14CO) in glacial ice are useful for studies of the past oxidative capacity of the atmosphere as well as for reconstructing the past cosmic ray flux. The 14CO abundance in glacial ice represents the combination of trapped atmospheric 14CO and in situ cosmogenic 14CO. The systematics of in situ cosmogenic 14CO production and retention in ice are not fully quantified, posing an obstacle to interpretation of ice core 14CO measurements. Here we provide the first comprehensive characterization of 14CO at an ice accumulation site (Summit, Greenland), including measurements in the ice grains of the firn matrix, firn air and bubbly ice below the firn zone. The results are interpreted with the aid of a firn gas transport model into which we implemented in situ cosmogenic 14C. We find that almost all (≈ 99.5 %) of in situ 14CO that is produced in the ice grains in firn is very rapidly (in <1 year) lost to the open porosity and from there mostly vented to the atmosphere. The timescale of this rapid loss is consistent with what is expected from gas diffusion through ice. The small fraction of in situ 14CO that initially stays in the ice grains continues to slowly leak out to the open porosity at a rate of ≈ 0.6 % yr−1. Below the firn zone we observe an increase in 14CO content with depth that is due to in situ 14CO production by deep-penetrating muons, confirming recent estimates of 14CO production rates in ice via the muon mechanisms and allowing for narrowing constraints on these production rates.
- Article
(1512 KB) - Full-text XML
-
Supplement
(540 KB) - BibTeX
- EndNote


Measurements of carbon-14 (14C) in ice cores have been explored in a number of applications, including the determination of glacial ablation rates (e.g., Lal et al., 1990) and ice core dating (e.g., van de Wal et al., 2007; Wilson and Donahue, 1992). More recently, they have been used for characterization of the fossil fraction of the paleoatmospheric methane budget (Petrenko et al., 2017; Dyonisius et al., 2020; Hmiel et al., 2020). The 14C is included in glacial ice via two separate mechanisms: trapping of carbon-containing atmospheric gases (mainly carbon dioxide, CO2; carbon monoxide, CO; and methane, CH4) into air bubbles in ice and in situ production directly from 16O within the ice crystal lattice via neutron-induced spallation (e.g., Lal et al., 1987), negative muon capture (van der Kemp et al., 2002) and interactions with fast muons (Petrenko et al., 2016). The in situ produced 14C in the gas phase mainly forms 14CO2 and 14CO, with a smaller fraction forming 14CH4; other simple organics may account for up to 25 % of total in situ 14C (Dyonisius et al., 2023; Hoffman, 2016; van der Kemp et al., 2002; Fang et al., 2021).
Applications of ice core 14C measurements depend on the ability to separately characterize the contributions from the in situ and trapped atmospheric components. However, in glacial ice, these two 14C components exist in a combined form and cannot be separated analytically. Therefore, for applications where the trapped atmospheric 14C component is of interest, the in situ component must be independently constrained and corrected for and vice versa. The in situ 14C content in ice at a snow accumulation site is influenced by both the production of 14C and its retention in the firn grains. In situ production rates are highest near the surface (Fig. 1), but 14C produced in the firn layer can be lost to the atmosphere via the interconnected porosity (e.g., Petrenko et al., 2013b; van der Kemp et al., 2000). While the balance of evidence now indicates that most in situ 14C produced in the firn is not retained (Petrenko et al., 2013b, and references therein), there has been no work to date that has been able to fully characterize the production and movement of in situ 14C throughout the entire firn column.
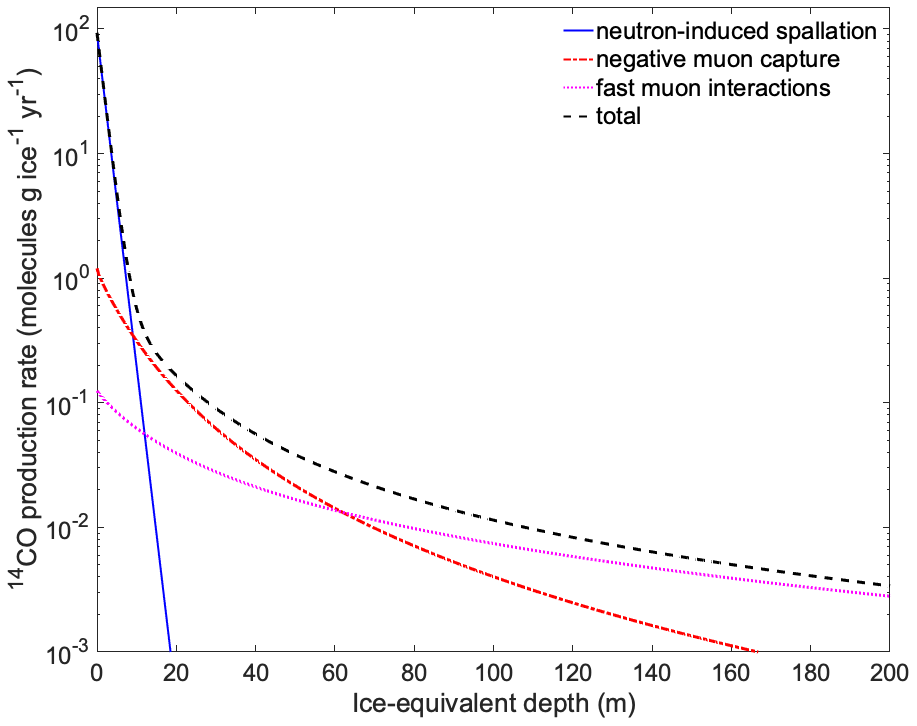
Figure 1Predicted 14CO production rate versus depth. The 14CO production rates versus depth in ice by the neutron and muon mechanisms, calculated for the Greenland Summit location. Production rate from neutrons is calculated using Eq. (3) as described in Sect. 3.2.1. Production rates for the muon mechanisms are calculated using Eqs. (6) and (7) as described in Sect. 3.2.2, using best-estimate fμ values from Dyonisius et al. (2023).
Of the trace gas species known to be affected by in situ 14C in ice (CO2, CO and CH4), the ratio of in situ to trapped atmospheric 14C is highest for 14CO, making this the best target for studies of in situ 14C processes. One of the main aims of this study is therefore to use new measurements of 14CO in the firn matrix (ice grains) and open porosity (firn air) to provide a detailed quantitative characterization of in situ 14C retention in and leakage from the ice grains in firn. In ice below the firn zone, 14CO is also of interest for paleoenvironmental applications. The trapped atmospheric component of 14CO can provide information about the past atmospheric oxidative capacity because atmospheric 14CO serves as an integrating proxy for hydroxyl radical abundance (e.g., Jöckel and Brenninkmeijer, 2002; Petrenko et al., 2021). The in situ component of 14CO in ice is also of interest for studies of the past galactic cosmic ray (GCR) flux because, at sites with low snow accumulation rates, the in situ component is much larger than the trapped atmospheric component and has the potential to record GCR changes without the confounding influences of solar, geomagnetic, climate and carbon cycle variations (Petrenko et al., 2024).
All in situ cosmogenic 14C (including 14CO) that is produced below the firn zone is retained in the ice, and at these larger depths the 14C production occurs via the muon mechanisms only (Fig. 1). The interpretation of ice core 14CO measurements for the above applications therefore requires a good understanding of the muogenic 14CO production rates. Dyonisius et al. (2023) and Petrenko et al. (2016) made measurements of 14CO in relatively shallow (0–72 m) ice obtained from the ablation zone of Taylor Glacier, Antarctica. The relatively old age (>50 ka) of this ice ensured that 14CO in the samples originated exclusively from in situ cosmogenic production during ice transport within the glacier, allowing for constraints on muogenic 14CO production rates. However, relatively large uncertainties in ice flow trajectories within the glacier translated into relatively large uncertainties in 14CO production rates (up to 30 % for the fast muon mechanism). Dyonisius et al. (2023) measured 14CO2 and 14CH4 in addition to 14CO and found that the overall in situ cosmogenic 14C production rate for these species in ice by muons is 4–5 times smaller than the total 14C production rate predicted from prior laboratory and field studies for quartz (Heisinger et al., 2002a; Heisinger et al., 2002b; Lupker et al., 2015). The second main aim of this study is therefore to test the Dyonisius et al. (2023) muogenic 14CO production rates in ice at a site with very different characteristics and to place tighter constraints on these production rates.
2.1 Overview of samples
The study site (72.66° N, 38.58° W; 3214 m above sea level) was located ≈ 10 km to the NW of Summit Station in central Greenland. Four different types of samples were collected for use in this study: (1) firn air samples, (2) firn matrix samples containing only negligible amounts of trapped air, (3) combined firn matrix and bubbly-ice samples within the lock-in zone (LIZ; the depth range where most of the bubble trapping process happens, e.g., Buizert, 2013; ≈ 68–80 m at Summit), and (4) samples of bubbly ice below the LIZ to ≈ 135 m depth.
2.2 Firn air sample collection and analyses
Firn air samples were collected in May 2013 from a borehole drilled with a 3 in. (7.62 cm) electromechanical ice core drill at depth levels between 0 and 80 m (Table S1). Firn air was sampled using the US firn air sampling device (FASD; Battle et al., 1996) following established techniques (Buizert et al., 2012). For the purposes of 14CO measurements, air samples and accompanying procedural blanks were collected into 35 L electropolished stainless steel canisters. For the 14CO procedural blanks, clean ambient air from a cylinder was run into the FASD through a tube containing a Sofnocat 423 reagent (Molecular Products) to remove all CO, including 14CO. CO dry-air mole fraction (xCO) in the 14CO samples was measured at the University of Rochester (UR) by gas chromatography (GC) with hot mercuric oxide reduction and photometric absorption (Peak Performer 1 from Peak Labs), and δ13C-CO was measured at the Institute of Arctic and Alpine Research (INSTAAR) (Vimont et al., 2017; Table S1). Additional firn air samples were also collected into 2.5 L glass flasks and 34 L stainless steel canisters for a range of supporting measurements (not shown) that allowed for characterizing firn gas transport at this site. Further details on firn air samples and associated analyses were presented in the “Supplementary information” of Hmiel et al. (2020).
2.3 Firn matrix and LIZ sample collection
Samples for investigating the in situ cosmogenic 14CO content in the firn matrix (ice grains) at shallower than 60 m (Table S2) were collected in May–June 2014 and 2015 using techniques similar to prior large-volume firn and ice core 14CO measurements (Petrenko et al., 2016, 2013b). Firn for the surface sample was cut in a snow pit with clean handsaws, while for deeper samples it was recovered from multiple adjacent boreholes using the 24 cm diameter Blue Ice Drill (Kuhl et al., 2014). The firn was loaded into a large 670 L ice melter (Petrenko et al., 2008, 2013b), the melter was evacuated to ≈ 3 mbar and then ≈ 130 mbar of ultrapure N2 was added as a flush gas. The evacuate–flush sequence was then repeated, followed by a final evacuation to 1–2 mbar and a subsequent injection of a standard gas into the melter. The standard gas is needed as a carrier because the shallow firn matrix contains very little trapped air. The standard gas was passed through Sofnocat to remove all CO (including 14CO) for samples collected in 2015 (36 and 53 m samples) but not for samples collected in 2014 (surface to 20 m; Table S3). The firn was then melted, the gases were equilibrated between the headspace and the water by recirculating the air through the water via a bubbler manifold at the melter bottom for 30 min, and the headspace air was then transferred to 35 L electropolished stainless steel canisters using diaphragm pumps.
Samples from the LIZ (Table S2) were obtained in May–June 2015 from two adjacent boreholes using the Blue Ice Drill. These samples contain more trapped air than shallower firn but less than bubbly ice below the firn zone. While the procedure for the melt extraction of gases for LIZ samples was almost identical to the procedure for firn matrix samples, the amount of standard gas added to the ice melter (via Sofnocat to remove CO and 14CO) for each melt extraction was adjusted so that the effective total air content for these samples approximately matched the effective total air content from the firn matrix and bubbly-ice samples (Table S2). Additionally, the standard gas used for the LIZ samples contained an artificially high mole fraction of Ne (≈ 1800 µmol mol−1) to help constrain the fraction of the collected sample air originating from the standard gas.
Several procedural blank tests (“water blanks” in Tables S2–S4) were collected in both the 2014 and 2015 seasons as follows. Following a sample melt extraction, the meltwater was purged with ultrapure air at ≈ 2 L STP min−1 (standard temperature and pressure) flow via Sofnocat and the bubbler manifold for ≈ 75 min to remove any remaining dissolved 14CO. Next, a standard gas was introduced to the melter headspace, approximately matching the volume of air obtained in real melt extractions. For the 2014 field campaign, the same standard gas was used for the water blanks as for the firn matrix samples, without flowing the gas through Sofnocat in both cases (Table S3). This standard gas also contained ≈ 100 µmol mol−1 of Kr and ≈ 50 µmol mol−1 of Xe. For the 2015 campaign, two different standard gases were used for the water blanks, both of which were passed through Sofnocat when introduced to the melter (same as for all 2015 firn matrix and LIZ samples). The standard gas used for 2015 water blank 1 was the same standard gas as was used for the 2015 firn matrix samples and also contained ≈ 100 µmol mol−1 of Kr and ≈ 50 µmol mol−1 of Xe. The artificially high Kr and Xe allow for accurate characterization of gas partitioning between the water and headspace in the ice melter (Petrenko et al., 2016, 2013b). The standard gas used for 2015 water blank 2 was the same standard gas as was used for the 2015 LIZ samples.
2.4 Bubbly-ice sample collection and analyses of air from firn matrix, LIZ and bubbly-ice samples
Samples of bubbly ice (ice below the LIZ) were collected in May–June 2015 from two to three adjacent boreholes using the Blue Ice Drill (Table S2). Sample handling and melt extraction of air for bubbly-ice samples were very similar to the procedures for firn matrix samples and LIZ samples described above, except that no standard gas was added to the melter as a carrier.
Air samples obtained from melt extractions of firn matrix, LIZ and bubbly ice and accompanying procedural blanks were measured for δ13C-CO at INSTAAR (Table S3) (Vimont et al., 2017), as well as for mole fractions of SF6, CFC-11 and CFC-12 at the Scripps Institution of Oceanography (SIO; not shown) to confirm the absence of significant contamination by ambient air. The xCO in 2014 samples was measured by gas chromatography (GC) with hot mercuric oxide reduction and photometric absorption (Peak Performer 1 from Peak Labs), and that in 2015 samples was measured by cavity ring-down spectroscopy (Picarro G2401) at UR (Table S3). , , and were measured at SIO (Bereiter et al., 2018; not shown) for all samples and blanks that were collected with the use of standard gases that contained high Kr and Xe. was also measured at SIO in 2015 LIZ samples and 2015 water blank 2, which were all collected with the use of the high-Ne standard gas (not shown).
2.5 Sample processing and measurement for 14CO
Methods used for processing and measurements of 14CO in ambient air (Petrenko et al., 2021), firn air (Hmiel et al., 2020) and ice core air samples (Dyonisius et al., 2020; Hmiel et al., 2020) have been previously described; here we provide a brief summary and details specific to the samples presented in this study. In a first step, air in the 35 L canisters containing samples and field procedural blanks is diluted at UR to reduce the 14C activity of CO, bringing the 14C activity into the range of commonly used 14C measurement standards (0–135 pMC, percent modern carbon). This is accomplished via the addition of a standard gas (“dilution gas” in Tables S1 and S3) that has high xCO (10.29 ± 0.13 µmol mol−1) and low 14C (<1 pMC) activity. The dilution also increases the CO carbon mass (to ≈ 33 µg C for 2013 samples and ≈ 18 µg C for 2014 and 2015 samples), which is needed for precise 14C measurements. The diluted samples and blanks are then run through an air-processing system at UR that cryogenically dries the air and removes carbon-containing trace gases other than CO and CH4, followed by CO oxidation over platinized quartz wool at 175 °C (CH4 passes through unaffected) and cryogenic trapping and purification of CO-derived CO2. This CO2 is subsequently converted to graphite at the Australian Nuclear Science and Technology Organisation (ANSTO), and 14C activity is measured on the 10MV ANTARES (Australian National Tandem Research Accelerator) accelerator mass spectrometer (AMS) (Smith et al., 2010; Tables S1 and S3). Sets of commensurately sized 14C standards and blanks are prepared at ANSTO and accompany the samples through graphitization and measurement. Two to three larger (≈ 100 µg C) samples of the high-xCO dilution gas were also processed and measured together with each sample set. This allowed for characterizing the slight growth of 14CO in the dilution gas over the years (Tables S1 and S3) resulting from in situ cosmogenic 14CO production in the air cylinder (Lowe et al., 2002).
2.6 Corrections for procedural effects and calculation of sample [14CO]
The detailed approaches for calculating 14CO concentration ([14CO]) and for correcting for procedural effects have been previously presented (Dyonisius et al., 2020; Hmiel et al., 2020; Petrenko et al., 2016, 2013b, 2021). For the reader's convenience we also provide a brief description here. The [14CO] in firn matrix and bubbly-ice samples is calculated using
where [14CO] is the number of 14CO molecules g−1 ice, pMC is the sample or blank 14C activity in percent modern carbon (Stuiver and Polach, 1977), λ is the 14C decay constant (1.216 × 10⁻⁴ yr−1), y is the year of measurement, δ13C is the δ13C of CO in the sample or blank, 0.975 is a factor arising from 14C activity normalization to δ13C of −25 ‰ associated with pMC, 1.1694 × 10⁻¹² is the ratio corresponding to the absolute international 14C standard activity (Hippe and Lifton, 2014), 22 400 is the number of cubic centimeters STP of gas per mole, NA is the Avogadro constant and V is the air content in cubic centimeters STP per gram of ice. For firn air samples and blanks, the air content term does not apply and [14CO] is given in units of 14CO molecules per cubic centimeter STP of air instead.
As the 14C measurements are made on diluted samples, it is [14CO] in the diluted sample air that is initially calculated using xCO and δ13C of CO in diluted samples. The pMC values used for this calculation (Tables S1 and S3) are values that have been empirically corrected for processing effects at ANSTO using measurements of commensurately sized 14C standards and blanks (Petrenko et al., 2021); this correction has a 0 %–2 % effect for samples in this study. The calculation is then repeated to determine the [14CO] contribution in the diluted samples that is due to the high-xCO, low-14C dilution gas, and this contribution is then subtracted from the total. The remaining [14CO] is further corrected for the effect of air dilution associated with adding the dilution gas to the samples (Petrenko et al., 2021; Tables S1 and S4).
The field procedural blanks collected during each season (Tables S1–S4) characterize all or most of the extraneous [14CO] in the samples, which is mainly due to in situ 14CO production in the canisters containing sample air during storage and transport prior to sample processing. For 2013 firn air samples, the procedural blanks are fully representative of all extraneous 14CO in the samples. However, the blanks were collected 11 d apart, and procedural blank 1 shows significantly higher [14CO] due to the 11 extra days of in situ 14CO production in the canister during storage at the high-altitude Summit site (Table S1). The procedural blank correction for the 2013 samples therefore accounted for differences in exposure time at Summit based on the sample collection date and in situ 14CO growth rate at Summit as determined from the two procedural blanks. Fully corrected firn air sample 14CO values are shown in Table S1 and Fig. 3.
For 2014 and 2015 samples, several corrections are needed beyond the dilution correction. First, [14CO] for both samples and blanks is corrected for the effect of gas dissolution in the ice melter (<1 % effect; Table S4) using solubility equilibrium parameters determined from . The samples are next corrected for extraneous [14CO] as characterized by procedural blanks from the same field campaign (Table S4). For 2014, the same standard gas was used in all sample and blank extractions, and this gas was not passed through Sofnocat to remove 14CO. For this set of samples, there was no significant difference in [14CO] between procedural blank 1 (start of season) and procedural blank 2 (end of season). This is because 14CO was being produced in situ in the sample and blank canisters at the same rate as it was being produced in the 2014 standard gas cylinder. For this reason, for 2014 samples the average [14CO] for procedural blanks was subtracted from sample [14CO]. For 2015, the standard gases used for samples and blanks were passed through Sofnocat, removing all 14CO. Because of this, the blank correction for 2015 samples accounted for differences in exposure time at Summit using the same approach as for 2013 samples.
There are two additional sources of extraneous 14CO in the 2014 and 2015 samples that the field procedural blanks do not characterize. First, the field procedural blanks do not properly mimic heating of the ice melter walls and associated CO outgassing. Second, xCO in trapped air in Greenland ice is known to be affected by (non-cosmogenic) in situ production in the ice likely originating from organic impurities (Faïn et al., 2014, 2022). Both the xCO contribution and the 14C activity of this extraneous CO are needed to estimate the contribution to [14CO]. This extraneous xCO contribution for firn matrix samples (Table S3) is calculated by subtracting the average xCO of the field procedural blanks for the same season from sample xCO. For LIZ and bubbly-ice samples (which do contain trapped air), we use a Northern Hemisphere high-latitude xCO history compiled by Hmiel et al. (2020) based on direct atmospheric observations as well as firn air and ice core measurements (Haan and Raynaud, 1998; Petrenko et al., 2013a, and references therein) to predict expected xCO in trapped air. For bubbly ice, the additional extraneous xCO contribution from outgassing from hot melter walls and in situ CO production in the ice (Table S3) is estimated as follows:
For LIZ samples, the calculation is similar but with the expected xCO from trapped air estimated based on the xCO atmospheric history and the fraction of air in the sample arising from air bubbles as determined from measurements (more trapped air lowers the ratio in these samples that used a high-Ne standard gas to supplement air content). The 14C activity of the extraneous CO is uncertain; we thus use a value of 50 pMC and a 2σ uncertainty of 50 pMC, allowing for the full range from 14C-free to 14C-modern. The relative effect of the correction for this extraneous 14CO is large for the surface sample (39 %), small for bubbly-ice samples (2 %–3 %) and intermediate (3 %–11 %) for other samples; this correction contributes significantly to overall uncertainty (Table S4).
Shallow firn above the LIZ contains a small amount of trapped air, possibly in microbubbles (e.g., Siegenthaler et al., 2005). As this microbubble air is not well understood and is not included in the closed porosity parameterization we use in our model (Sect. 3.1), we further correct [14CO] in the firn matrix samples for microbubble air. The amount of microbubble air is estimated from the comparison of measured and values with those expected from the solubility equilibrium in the ice melter (addition of trapped air lowers the and ratios in these samples that use a high-Kr, high-Xe gas as a carrier). The magnitude of the correction for 14CO from microbubbles is 0.6 %–2 % (Table S4). As a final step in the calculation for 2014 and 2015 samples, the fully corrected [14CO] (in units of 14CO molecules cm−3 STP) is converted to 14CO content g−1 ice (Table S4; Fig. 3) via multiplying by the effective air content in the samples (V in Eq. 1; in cm3 STP g−1 ice; Table S2). For the firn matrix and LIZ samples, the air content is determined based on the sampled ice mass and recovered amount of air. For bubbly-ice samples, the air content is taken as 0.0904 cm3 STP g−1 ice, which is the average value for the last 2000 years from the nearby Greenland Ice Core Project (GRIP) ice core (Raynaud et al., 1997). The firn model is tuned to match the same air content in ice below the LIZ.
3.1 Overview of the firn model used for the Greenland Summit site
Interpretation of 14CO results is done using an established firn gas transport model – the Centre for Ice and Climate (CIC) model from Buizert et al. (2012), which has been modified for this study to include production and movement of in situ 14C (Sect. 3.2); herein referred to as the “firn model”. The model assumes a steady-state, isothermal firn column with an accumulation rate of 0.235 m ice equivalent yr−1, a temperature of −31 °C, firn densities based on a fit to the Summit density measurements by Adolph and Albert (2014), and a vertical diffusivity profile that is calibrated using firn air measurements of several traces gases with known atmospheric histories. The model simulates transport of trace gas mole fractions in the open and closed porosity (air bubbles) and can extend to depths below the firn zone. The total air content in the firn model below close-off (where all the air has been trapped into bubbles) is tuned to match the value of 0.0904 cm3 STP g−1 ice from Raynaud et al. (1997) as mentioned above.
The method for tuning the depth–diffusivity profile is as described in the Supplement to Buizert et al. (2012), with a few modifications for the Summit site as follows. (1) The 14CO2 was not used as a tracer gas due to uncertainty about the magnitude of in situ cosmogenic 14CO2 production. (2) δ15N2 was also not used due to an observed thermal-fractionation signal from recent warming and seasonal temperature gradients (e.g., Severinghaus et al., 2001) that are not well captured by the steady-state model. (3) N2O was included as a tracer gas using a recently developed multi-site reconstruction from firn air (Prokopiou et al., 2017). (4) All Northern Hemisphere atmospheric histories for trace gases used in model tuning were updated through December 2015 with monthly mean flask measurements from Summit Station by NOAA Earth System Research Laboratories (ESRL) (Dlugokencky et al., 2018; Petron et al., 2018) and converted to the most recent NOAA measurement scales (Hall et al., 2014).
Firn gas transport models consider layer thinning by densification but do not normally consider additional ice thinning related to deformation by ice flow because such thinning effects are typically very small in the firn column. As our measurements extend to ≈ 130 m, however, the effects of flow-related thinning do need to be considered for the deepest samples. Measurements that could provide a complete ice age–depth scale (and a complete empirical thinning function) are unfortunately not available at our site. However, Hmiel et al. (2020; see their “Supplementary information”) used age tie points from continuous flow chemistry analyses on sections of ice cores from our site between 67–98 m depth to show that a constant accumulation rate of 0.235 m ice equivalent yr−1 in the model yields an excellent match to these tie points. Hmiel et al. (2020) further showed that these same age–depth tie points can be matched well in a Dansgaard–Johnsen (DJ) thinning model (Dansgaard and Johnsen, 1969) that uses a constant accumulation rate of 0.246 m ice equivalent yr−1. For the purposes of the firn model, we use the accumulation rate of 0.235 m ice equivalent yr−1, as this also yields a good match to trace gas measurements. However, we apply a small depth correction for ice deeper than 112 m, where the age–depth scales for the scenario with a constant accumulation rate of 0.235 m ice equivalent yr−1 and the DJ model scenario with 0.246 m ice equivalent yr−1 start to diverge significantly. This correction adjusts the depths used for in situ 14CO calculations to those predicted by the DJ model scenario, resulting in a 1.25 m shallower depth in the model for the range of the deepest (130 m) sample and a ≈ 1 % increase in model-calculated 14CO content for that sample.
3.2 Parameterization of in situ cosmogenic 14CO in the firn model
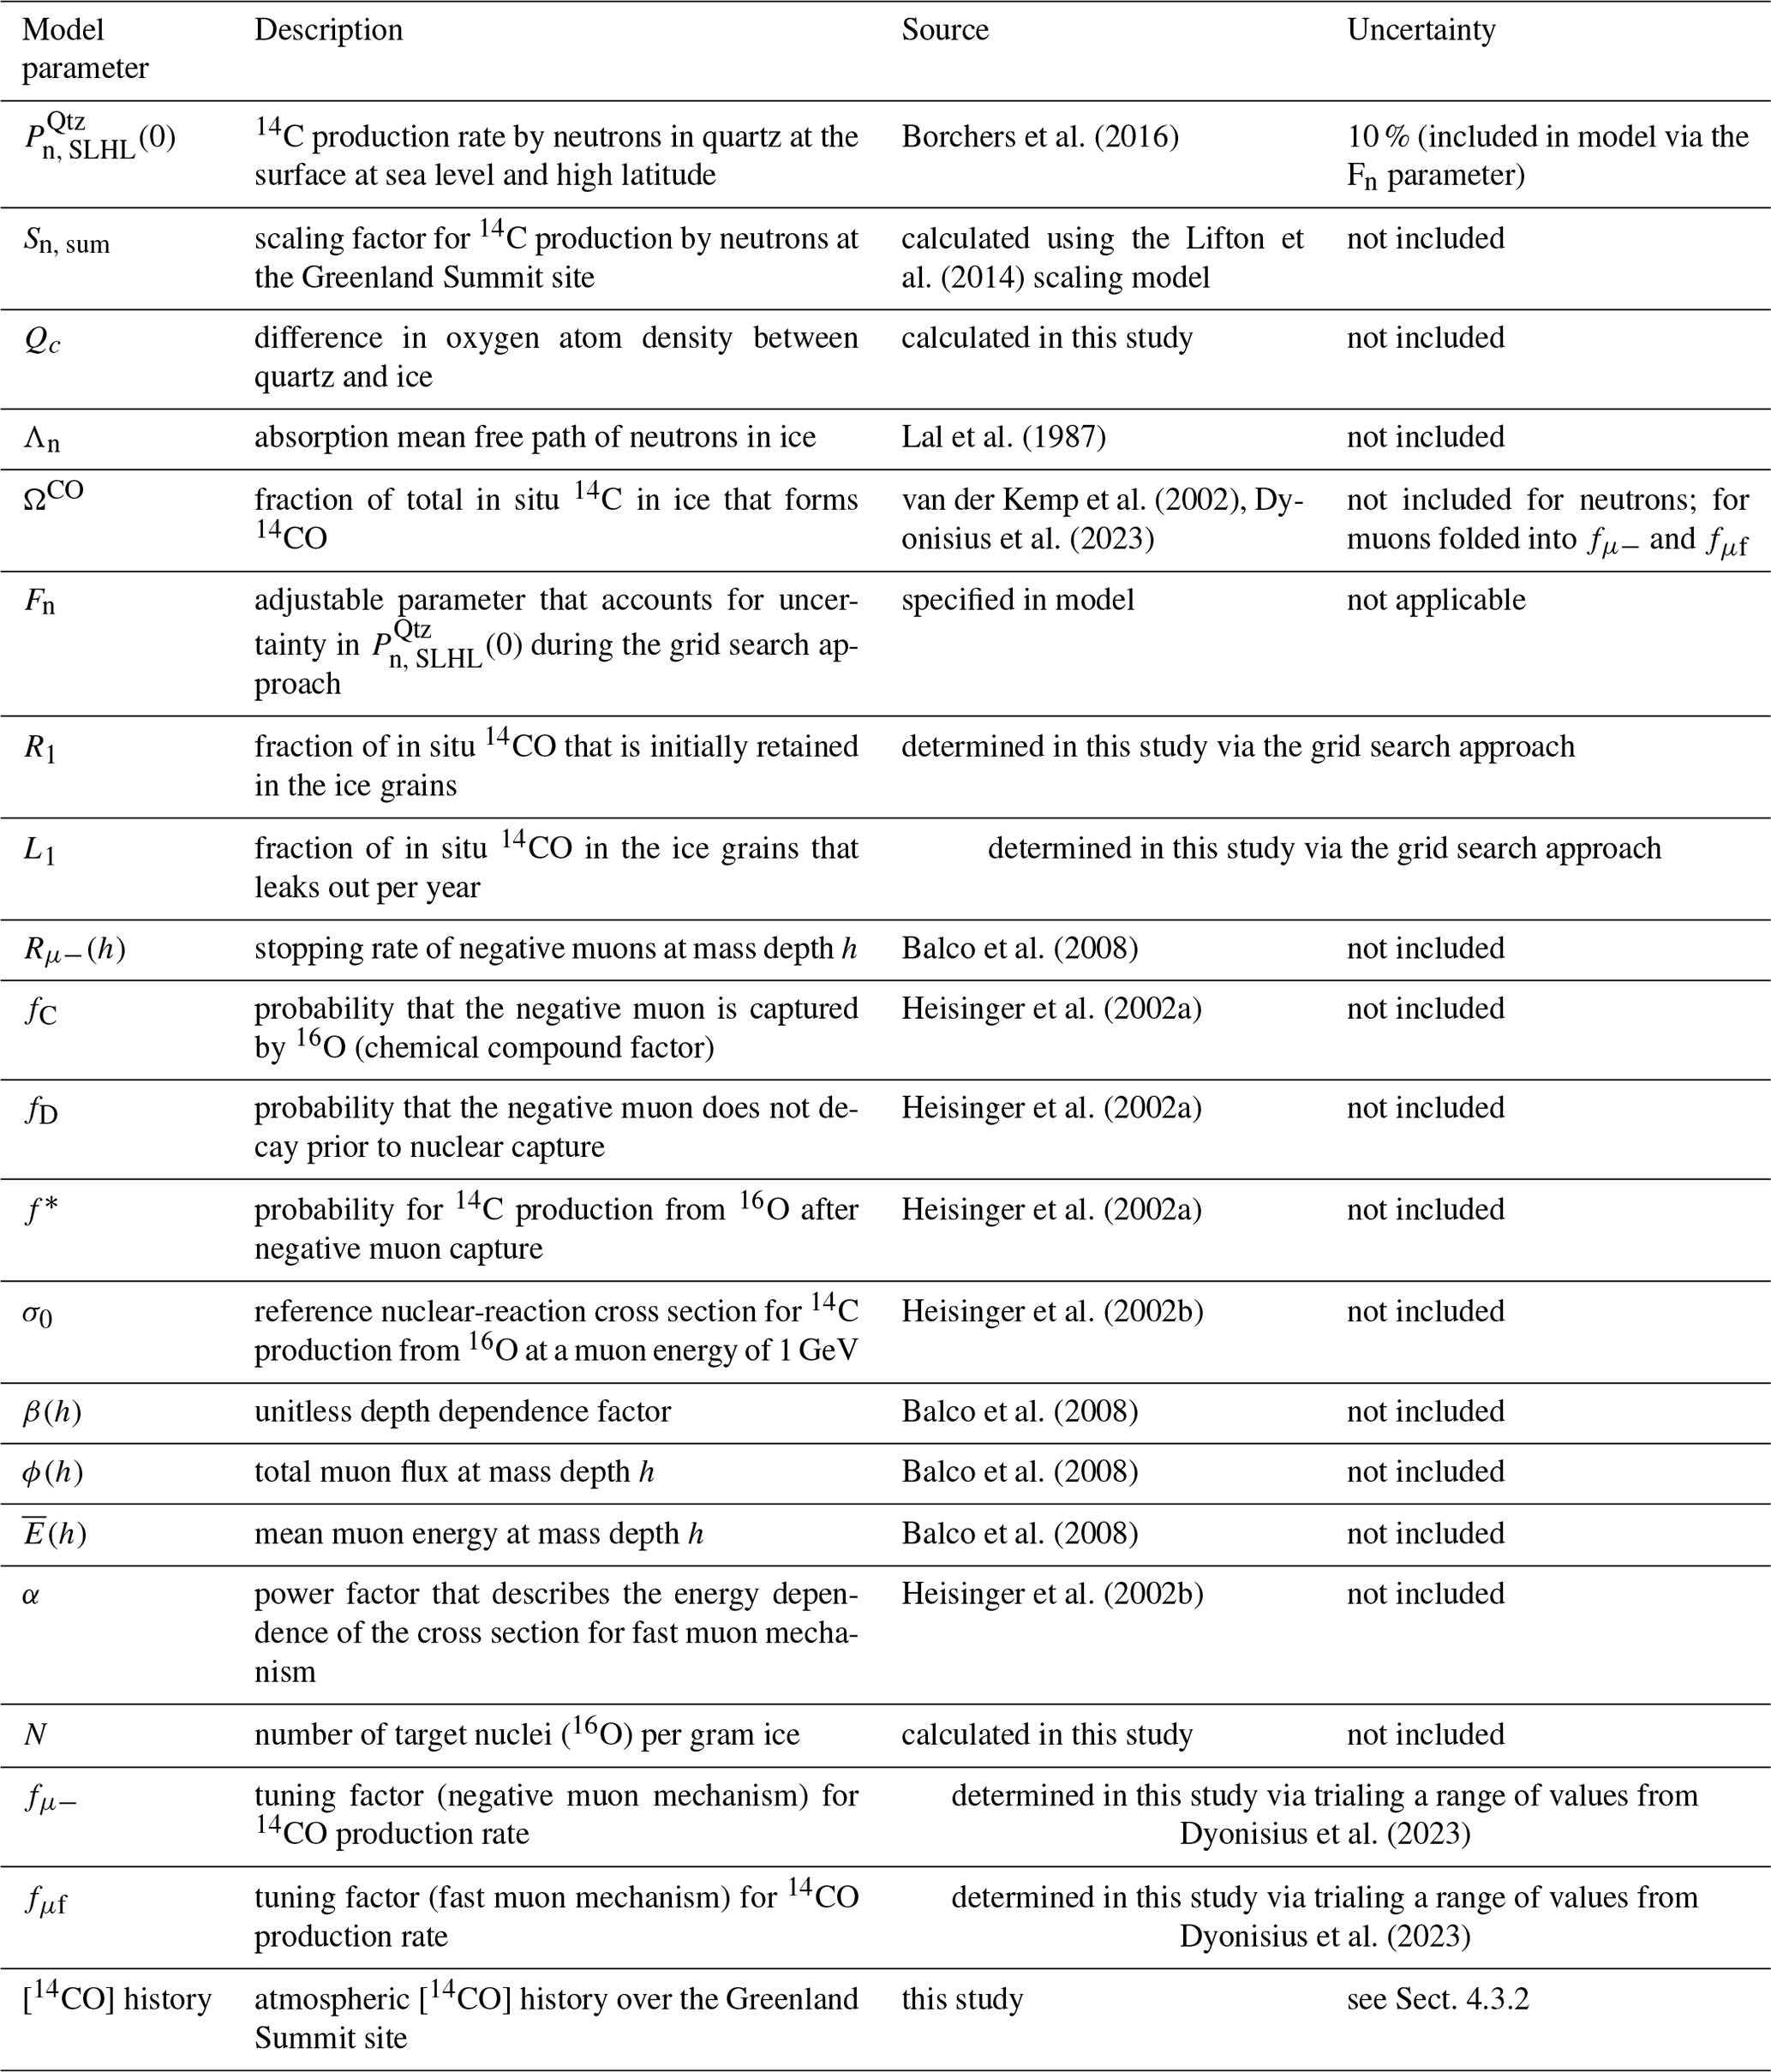
The firn model accounts for in situ 14C production in the ice grains by secondary cosmic ray neutrons and muons, for the fraction of this 14C that forms 14CO as well as for any loss of this 14C from the ice grains via leakage into the open porosity (firn air) or closed porosity (air bubbles). Figure 1 illustrates 14CO production rates by secondary cosmic ray neutrons and muons versus depth at Summit, and the following sections describe how in situ cosmogenic 14CO was implemented in the model for the purposes of this study, with an overview of the relevant model parameters presented in Table 1.
Table 1Summary of model parameters involved in calculations of 14CO.
3.2.1 14CO production by neutrons
In situ 14C production rate by neutron-induced spallation of 16O has been well constrained from measurements in near-surface quartz samples (Borchers et al., 2016; Young et al., 2014); these 14C production rates for a sea level high-latitude (SLHL) site () can be translated to ice () by accounting for the difference in oxygen atom density (atoms g−1) between quartz and ice (Qc, factor of 1.667). The subscript n denotes the neutron mechanism for 14C production. Surface production rates at different locations are estimated as a function of surface pressure and geomagnetic latitude using established “scaling models” (e.g., Desilets et al., 2006; Lifton et al., 2014; Stone, 2000) which use measurements and/or models of the secondary cosmic ray flux in the atmosphere. In this study, we use the scaling model of Lifton et al. (2014) for neutron-induced 14C production to determine the scaling factor for our site (Sn,Sum). The SLHL production rate of 12.76 molecules g−1 Qtz yr−1 from the CRONUS-Earth project (Cosmic Ray produced Nuclides on Earth; Borchers et al., 2016) is used for . This value was chosen as it was calculated using the same scaling model (Lifton et al., 2014) as used in this study; production rate differences between scaling models are on the order of ±10 % and generally agree within measurement uncertainty for high-latitude locations.
We use a value of ΩCO=0.31 for the fraction of total in situ 14C in ice that forms 14CO (Dyonisius et al., 2023; van der Kemp et al., 2002). We note that this value is based on prior measurements in ice where part or all of the in situ 14C originated from production via the muon mechanisms. However, since all newly produced “hot” in situ 14C atoms have to lose most of their energy prior to reacting (regardless of production mechanism), there is no a priori reason why the partitioning of in situ 14C would be different for different production mechanisms.
The 14C production from neutrons declines exponentially with increasing mass depth (h, in g cm−2); we use a value of 150 g cm−2 for the absorption mean free path Λn of neutrons in ice (e.g., Lal et al., 1987; van de Wal et al., 2007). The model also includes an adjustable parameter Fn that allows for tuning the model production rate within uncertainties. These parameters are combined to calculate the 14CO production rate by neutrons (in 14CO molecules g−1 ice yr−1) as a function of mass depth h:
As can be seen in Fig. 1, 14CO production by neutrons is only significant in the top ≈ 10 m ice equivalent depth. Neutron fluxes at high-latitude sites are modulated by the heliospheric magnetic field, and over the range of ice ages (≈ 500 years) that correspond to the sampled depth range (≈ 0–130 m), the Lifton et al. (2014) model predicts variability in Pn(0) at Summit of up to ≈ 25 %. However, for deeper ice samples (which would have been most affected by the temporal Pn(0) change), the neutron-produced contribution to total 14CO is 20 % or less. As temporal variations in Pn(0) have a much smaller effect on total 14CO than uncertainties in other parameters such as muogenic production rates and the atmospheric [14CO] history, we assume no temporal variability in Pn(0) for the purposes of this study.
3.2.2 14CO production by muons
For in situ 14C production from 16O via the muon mechanisms, we use the parameterizations developed by Heisinger et al. (2002a, b) as implemented in MATLAB by Balco et al. (2008) (also Model 1A in Balco, 2017), herein referred to as the “Balco model”, with all relevant parameters adjusted for ice. Briefly, the Heisinger et al. (2002a) production rate (in 14C atoms g−1 yr−1) parameterization for the negative muon capture mechanism is
where Rμ−(h) is the stopping rate of negative muons (muons g−1 yr−1) at mass depth h, fC is the chemical compound factor representing the probability that the stopped muon is captured by one of the target atoms, fD is the probability that the negative muon does not decay in the K shell before nuclear capture and f∗ is the effective probability for production of the cosmogenic nuclide of interest after μ− capture by the target nucleus. We use the f values given by Heisinger et al. (2002a) for production of 14C from 16O in ice.
Heisinger et al. (2002b) parameterizes production rate from fast muons as
where σ0 is the reference nuclear-reaction cross section at a muon energy of 1 GeV (cm2), ϕ(h) is the total muon flux at mass depth h (muons cm−2 yr−1 sr−1), β(h) is a unitless mass-depth dependence factor, is the mean muon energy at mass depth h (GeV), α is a power factor that describes the energy dependence of the cross section (we use α=0.75, consistent with Dyonisius et al., 2023, and Heisinger et al., 2002b) and N is the number of target nuclei per gram target mineral.
The above muogenic production rate parameterizations are incorporated within the Balco model, which also provides the needed altitude scaling of muon fluxes and energies based on atmospheric pressure at Summit. The 14CO production rate via the negative muon and fast muon mechanisms as a function of mass depth h is then calculated as
where is the total 14C production rate (in atoms g−1 yr−1) from the respective muon mechanism at mass depth h and surface pressure P and fμ− and fμf are dimensionless tuning factors that account for (1) the fraction of total 14C that forms 14CO (ΩCO) and (2) the adjustment factor for the production rate. This definition of fμ− and fμf is consistent with the Dyonisius et al. (2023) study of muogenic 14CO production rates in ice at Taylor Glacier, Antarctica. Figure 1 illustrates the predicted muogenic 14CO production rates at a range of depths at Summit.
Only muons with sufficiently high energy can penetrate the Summit firn column to the depths (70–80 m) where the first impermeable ice layers start to form and in situ 14C retention in the ice/firn starts to increase. The primary cosmic rays responsible for the production of such higher-energy muons are of a sufficiently high energy so as to be insensitive to solar modulation (Petrenko et al., 2024). We therefore do not assume any temporal variability in muon fluxes.
3.2.3 14C retention, leakage and decay
The firn model defines two reservoirs within the ice grains to contain the in situ produced 14C (Fig. 2). The partitioning of 14C between these reservoirs is numerically defined by coefficients R0 and R1, representing the fraction of in situ produced 14C entering each reservoir. For each reservoir, the model also defines leakage coefficients L0 and L1 which represent the fraction of total in situ 14C that leaks out of the respective reservoir per year (for L1) or per time step (for L0). We introduce these two reservoirs because a preliminary analysis showed that using a single ice grain reservoir does not provide a good fit to the observations; physical justification for these two reservoirs is discussed in Sect. 4.2. The relative partitioning of leaked 14C between open and closed porosity scales with the relative volumes of open and closed porosity in the model at a given depth such that the fraction leaked into the open pores equals and the fraction leaked into the closed pores is , where sop and scl are the open and closed porosity, respectively, and the total porosity is (Fig. 2). Any 14CO that leaks into the closed porosity is retained permanently, and 14CO that leaks into the open pores can escape the firn via upward diffusion into the atmosphere.
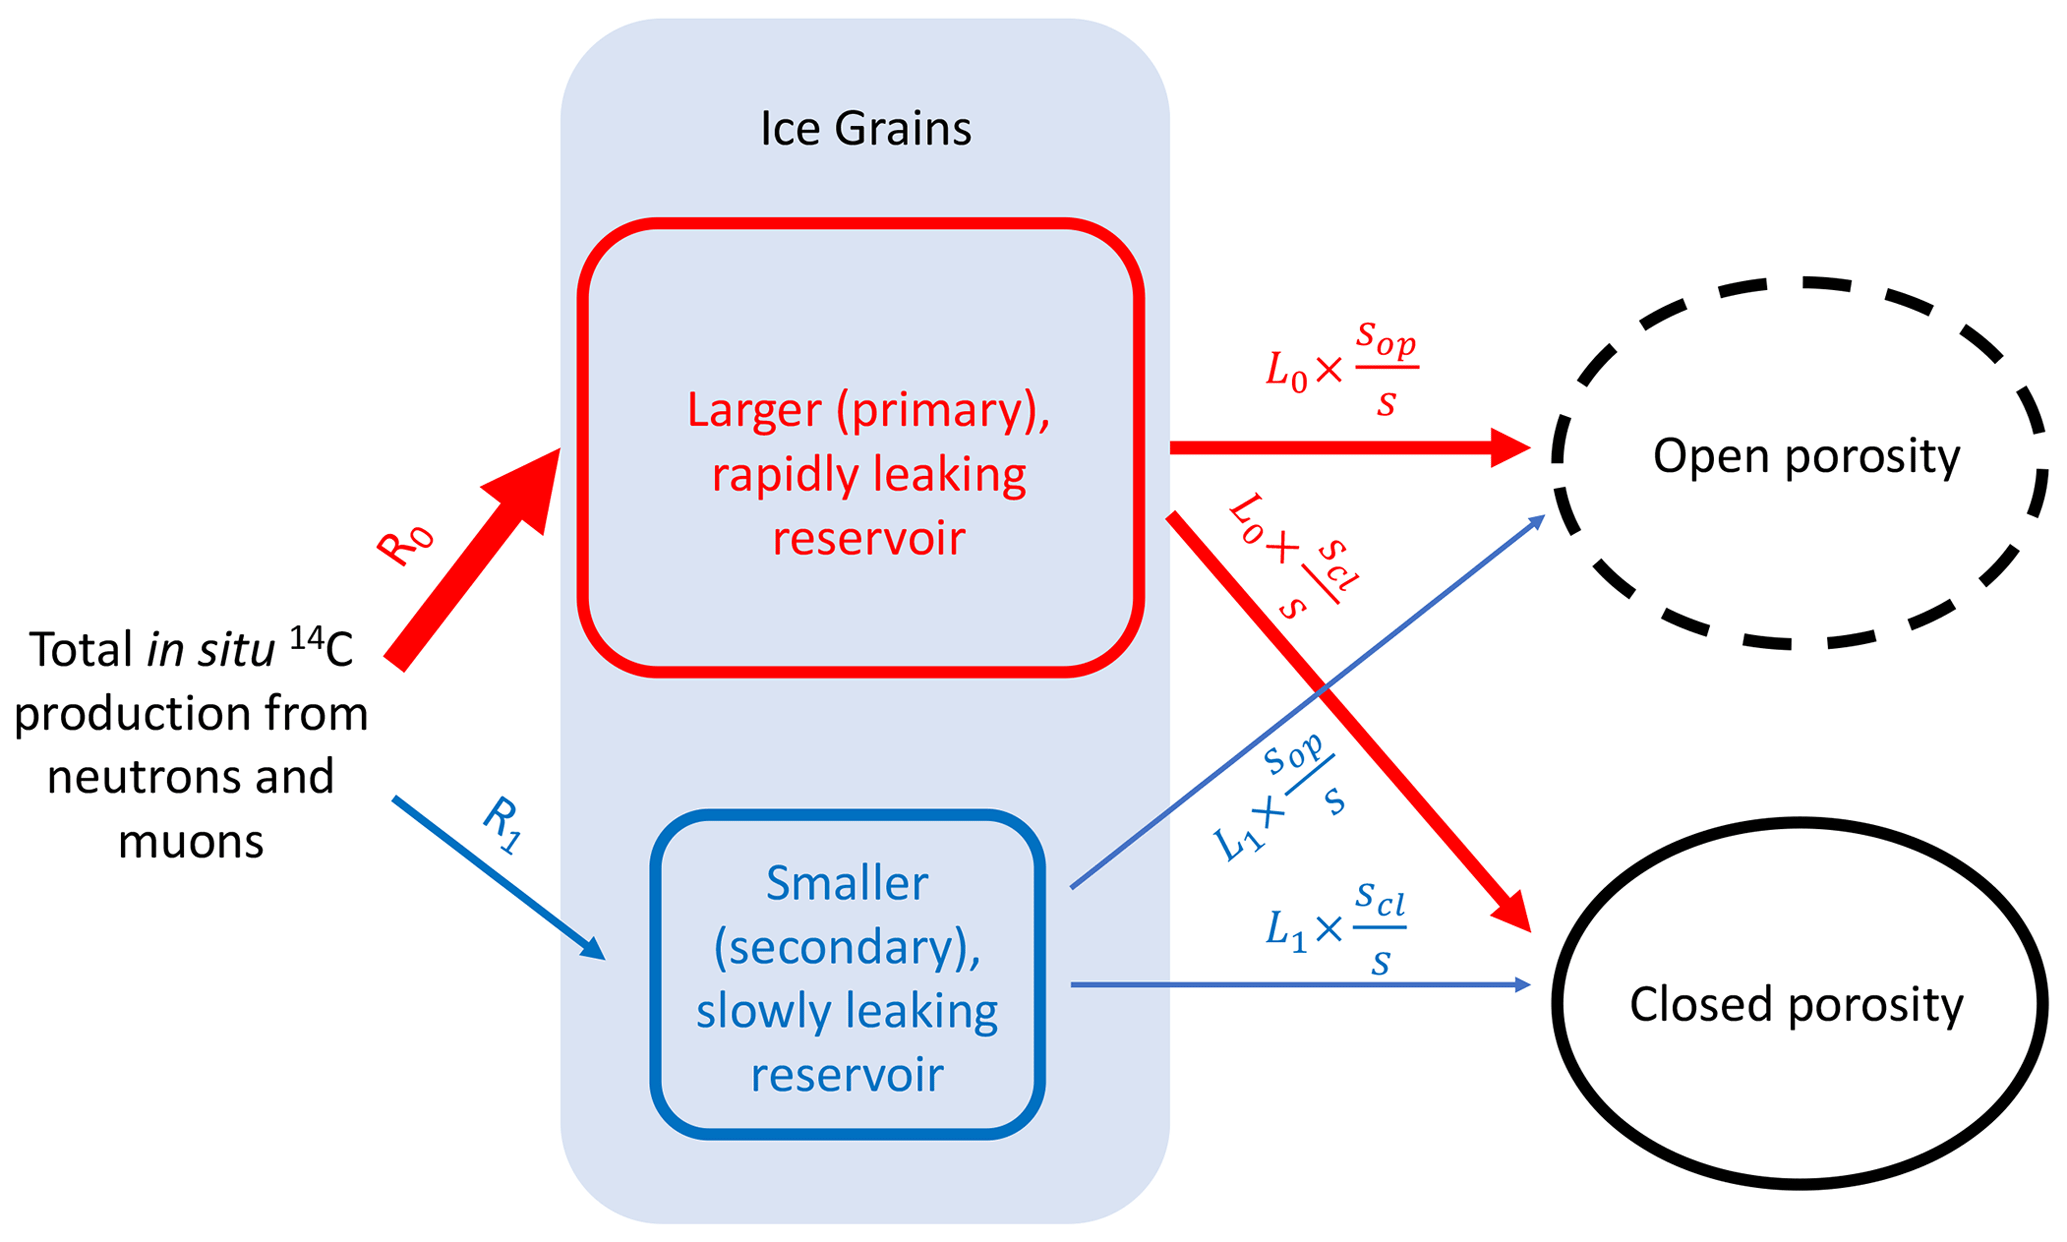
Figure 2Conceptual diagram of model parameterization of in situ 14C partitioning between ice grain reservoirs and leakage into porosity.
Prior studies have found that the majority of in situ cosmogenic 14C produced in the upper firn column is lost to the atmosphere and not retained through firn densification into ice (e.g., de Jong et al., 2004; Petrenko et al., 2013b; Smith et al., 2000). The model accounts for the rapid loss of most 14C from ice grains by defining the leakage coefficient L0 of the primary reservoir so that all 14C in this reservoir is lost to porosity at every model time step (time step of 0.5 years). In tuning the model, we find that the partitioning coefficient R0 is close to 1, which means that for a given model time step the majority of the in situ 14C produced at all depths is sorted into the primary reservoir, and all of it leaks from the ice grains into the porosity. In the upper firn, which is dominated by open porosity, this 14C typically escapes to the atmosphere, whereas in the LIZ the in situ 14C that leaks from the grains into the open and closed porosity is inhibited from exchange with the atmosphere due to limited vertical diffusion. For ice below bubble close-off (∼ 80 m at Summit), there is no longer any open porosity in the model, and thus any in situ 14C that leaks out of the ice grains must leak into the closed porosity.
This parameterization enables tuning of the in situ 14C content in the firn matrix to match the observations by specifying the secondary reservoir partitioning and leakage coefficients (R1, L1), while the primary reservoir partitioning coefficient is determined from the conservation of mass () and its leakage coefficient L0 is fixed as described above.
Radioactive decay of 14C is considered using the standard exponential decay equation with a decay constant of 1.210 × 10⁻⁴ yr−1, corresponding to a 14C half-life of 5730 years (Godwin, 1962). Finally, the downward advection of ice is considered at each time step by adding a new ice parcel (with no in situ 14C content) at the uppermost box of the model, shifting each ice parcel downwards by one box of the depth resolution and removing the bottommost ice parcel.
As is described in Sect. 4 below, the firn model is used in combination with the measurements to constrain the possible ranges of four parameters relevant to production and retention of 14CO in the firn and ice (R1, L1, fμ− and fμf). While the model has a large number of parameters, we note that for most of these parameters the values are either available from prior studies or determined outside of the model (Table 1). We note further that we only constrain/tune two model parameters at once ([R1, L1] or [fμ−, fμf]).
4.1 Main features of results and overview of the approach for constraining in situ 14CO parameters
Figure 3 shows the measurements after all corrections in ice grains + closed porosity (Fig. 3a) and in firn air (Fig. 3b) together with an example of a firn model fit. First, we discuss [14CO] in the ice grains and closed porosity (Fig. 3a). In the shallow firn (0–60 m), the amount of closed porosity is very small and both the measurements and the model represent [14CO] in the ice grains only. The [14CO] first increases rapidly with depth to a peak in the 10–20 m depth range, mainly due to 14CO production by the neutron mechanism. The [14CO] then declines gradually with depth through the shallow firn to a minimum at ≈ 60 m. As firn layers move downwards via the processes of continued snow accumulation at the surface, densification and ice flow, the layers carry with them the ice grain 14CO content they acquired above. Further, 14CO production continues (by muons) at intermediate firn depths (20–60 m). Therefore, the fact that 14CO content in the ice grains decreases rather than increases with increasing depth between 20 and 60 m indicates slow 14CO leakage out of the ice grains. The 14C radioactive decay is far too slow to explain this, as the ice layers traverse the entire firn column at the Greenland Summit site in only ≈ 200 years. The [14CO] then increases rapidly with depth in the LIZ (≈ 69–80 m), mainly reflecting the air-trapping process that moves 14CO from the open into the closed pores. Below ≈ 80 m, no further air trapping takes place (air is already all in trapped bubbles) and the continued more gradual increase in [14CO] with depth is due to production by deep-penetrating muons.
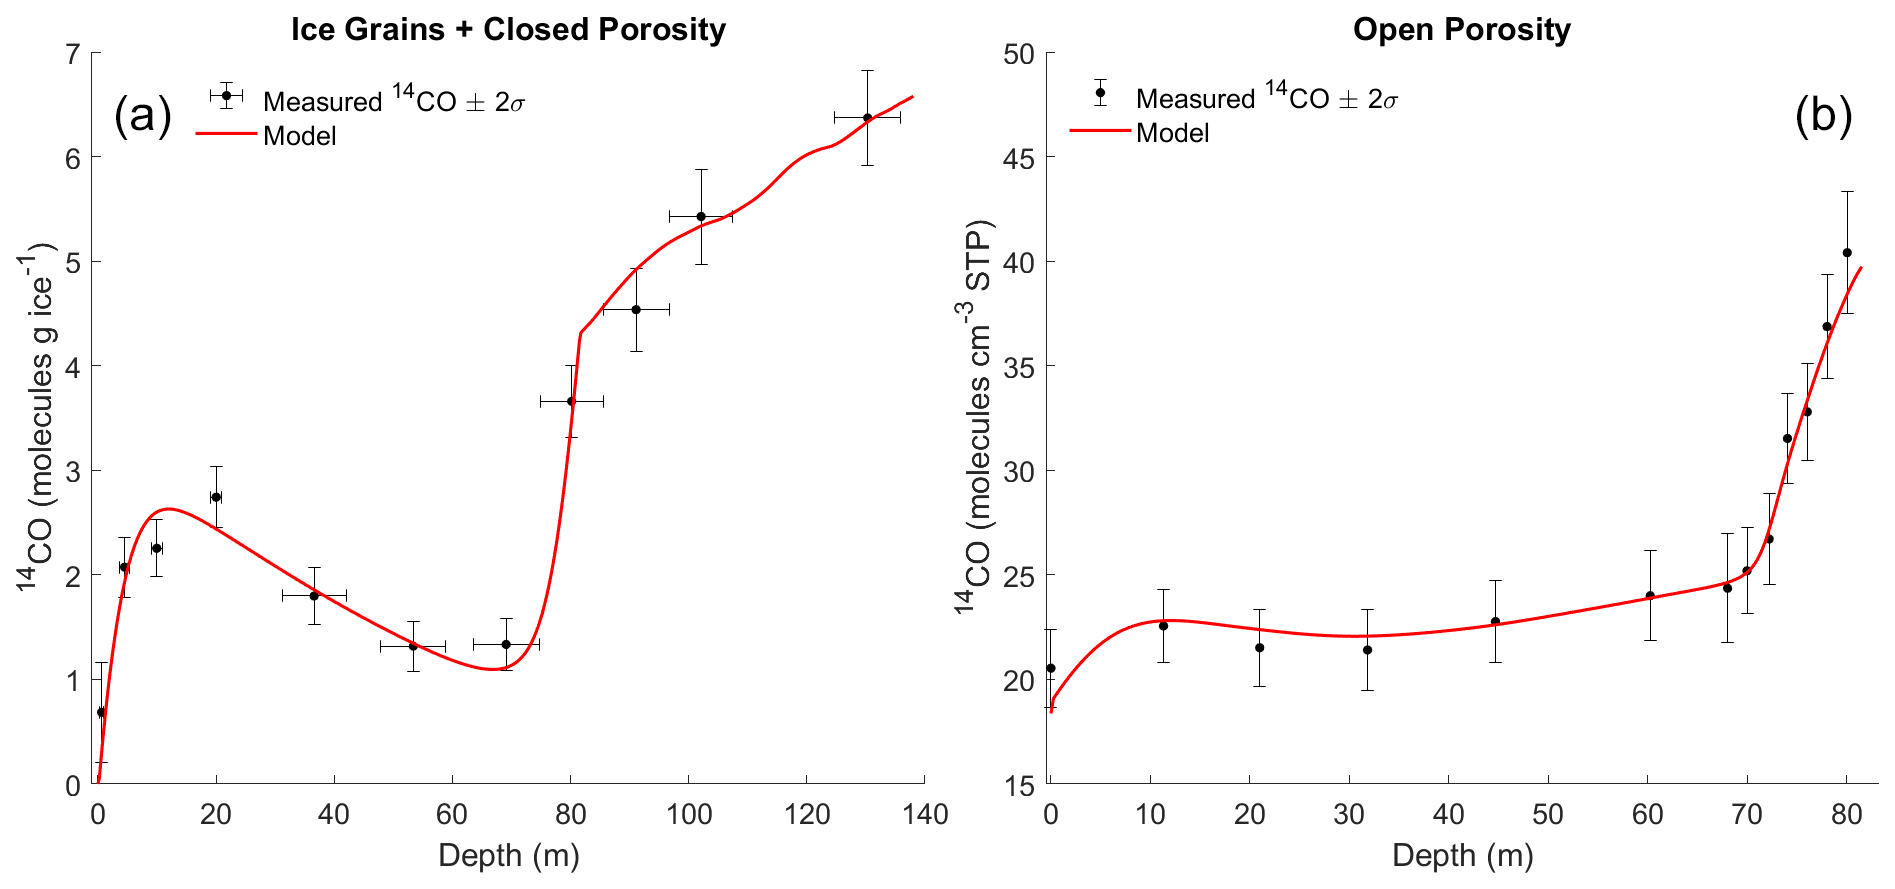
Figure 314CO measurements at Summit. The [14CO] measured at Summit in ice grains + closed porosity (a) and in open porosity (firn air) (b), together with an example of our firn model fit to the data. Measured values are after all corrections (Table S4).
Second, we look at the open porosity [14CO] profile (Fig. 3b). It shows a small peak at ≈ 10 m, representing the previous winter's seasonal maximum in atmospheric [14CO]. Firn air [14CO] increases gradually with depth between 30–70 m. This reflects the fact that at deeper levels in the firn, the diffusive gas exchange with the atmosphere is relatively slower, allowing some of the 14CO produced by the muon mechanisms to accumulate. Firn air [14CO] increases rapidly in the LIZ, as the impermeable ice layers present in the LIZ almost completely stop vertical gas diffusion, trapping all 14CO that is produced by muons at these depth levels.
The different tuning parameters in the firn model are each constrained most strongly by different depth ranges of the [14CO] profile. Because firn shallower than ≈ 60 m contains almost no closed porosity, [14CO] in the firn matrix in this depth range is sensitive only to in situ production, retention and leakage rates. Further, production rates in the shallowest firn (≈ 0–10 m) are 1–2 orders of magnitude higher than rates in mid-depth firn (≈ 40 m), and in the shallowest firn production is dominated by the neutron mechanism (Fig. 1). As neutron 14C production rates as well as the 14CO fraction of total 14C are well constrained (Sect. 3.2.1), this allows us to use measurements in the 0–60 m depth range to constrain the key relevant parameters in the firn model: R1, the fraction of produced 14CO that initially stays in the ice grains, and L1, the leakage rate of this initially retained 14CO into porosity (Fig. 2). As mentioned above, and L0=1, so these parameters are not tuned in the model.
The [14CO] in LIZ firn air and in bubbly ice below the LIZ is mainly sensitive to muogenic production rates and to a lesser extent the atmospheric [14CO] history. We therefore use the [14CO] measurements in this depth range to provide improved constraints on the muogenic 14CO production rates. Model [14CO] in ice grains and closed porosity in the LIZ is extremely sensitive to model characterization of the air-bubble-trapping process. As this characterization is imperfect, we do not use firn/ice samples from the LIZ (70 and 80 m samples in Tables S2–S4) for constraining in situ 14CO parameters.
4.2 Retention and leakage of in situ cosmogenic 14CO in the firn
To constrain the best-estimate and possible range of values of the R1 and L1 parameters, we employ a grid search approach that involves repeated runs of the firn model while varying these parameters within reasonable ranges determined from preliminary manual tuning of the model to observations. In addition to varying R1 and L1, the grid search also varies Fn (the adjustment factor for production rate from neutrons; Sect. 3.2.1). The grid search scans over values for Fn ranging from 0.9 to 1.1 at an interval of 0.01, for R1 ranging from 0.3 % to 0.7 % at an interval of 0.02 % and for L1 ranging from 0.3 % yr−1 to 1.3 % yr−1 at an interval of 0.05 %. For the purposes of this grid search, the muogenic 14CO production rate adjustment factors fμ− and fμf are 0.068 and 0.085, respectively, following the best-estimate values from Taylor Glacier measurements (Dyonisius et al., 2023). We also trialed lower fμ− and fμf values of 0.0584 and 0.0633 that are more consistent with 14CO observations in ice below the LIZ (Sect. 4.3); this did not affect the results of this grid search for optimization of the R1 and L1 parameters. In total, the grid search amounts to all permutations of 21 different values for each of Fn, L1 and R1, resulting in 213=9261 simulations.
The best-estimate set of parameters minimizes the model–data mismatch for the firn matrix samples (0–60 m depth range; mismatch defined by the reduced χ2 value) for the case where Fn=1 (Fig. 4a, purple trace). The best-estimate value for R1 is 0.46 %, and the best-estimate value for L1 is 0.60 % yr−1. To define an uncertainty range of these parameters, we accept all solutions from the grid search where the model calculates 14CO within a 2σ bound of the best solution. The 2σ bound is the mean 2σ analytical uncertainty for the firn matrix 14CO measurements, and the range of these accepted solutions is represented by the blue shading in Fig. 4a. The contour of accepted solutions in the R1–L1 space is shown in Fig. 4b. We also determined which combinations of parameters (from the accepted set of solutions) result in the minimum and maximum 14CO content in ice below the LIZ, as this is important for constraining fμ− and fμf values (Sect. 4.3). The results of the grid search are summarized in Table 2.
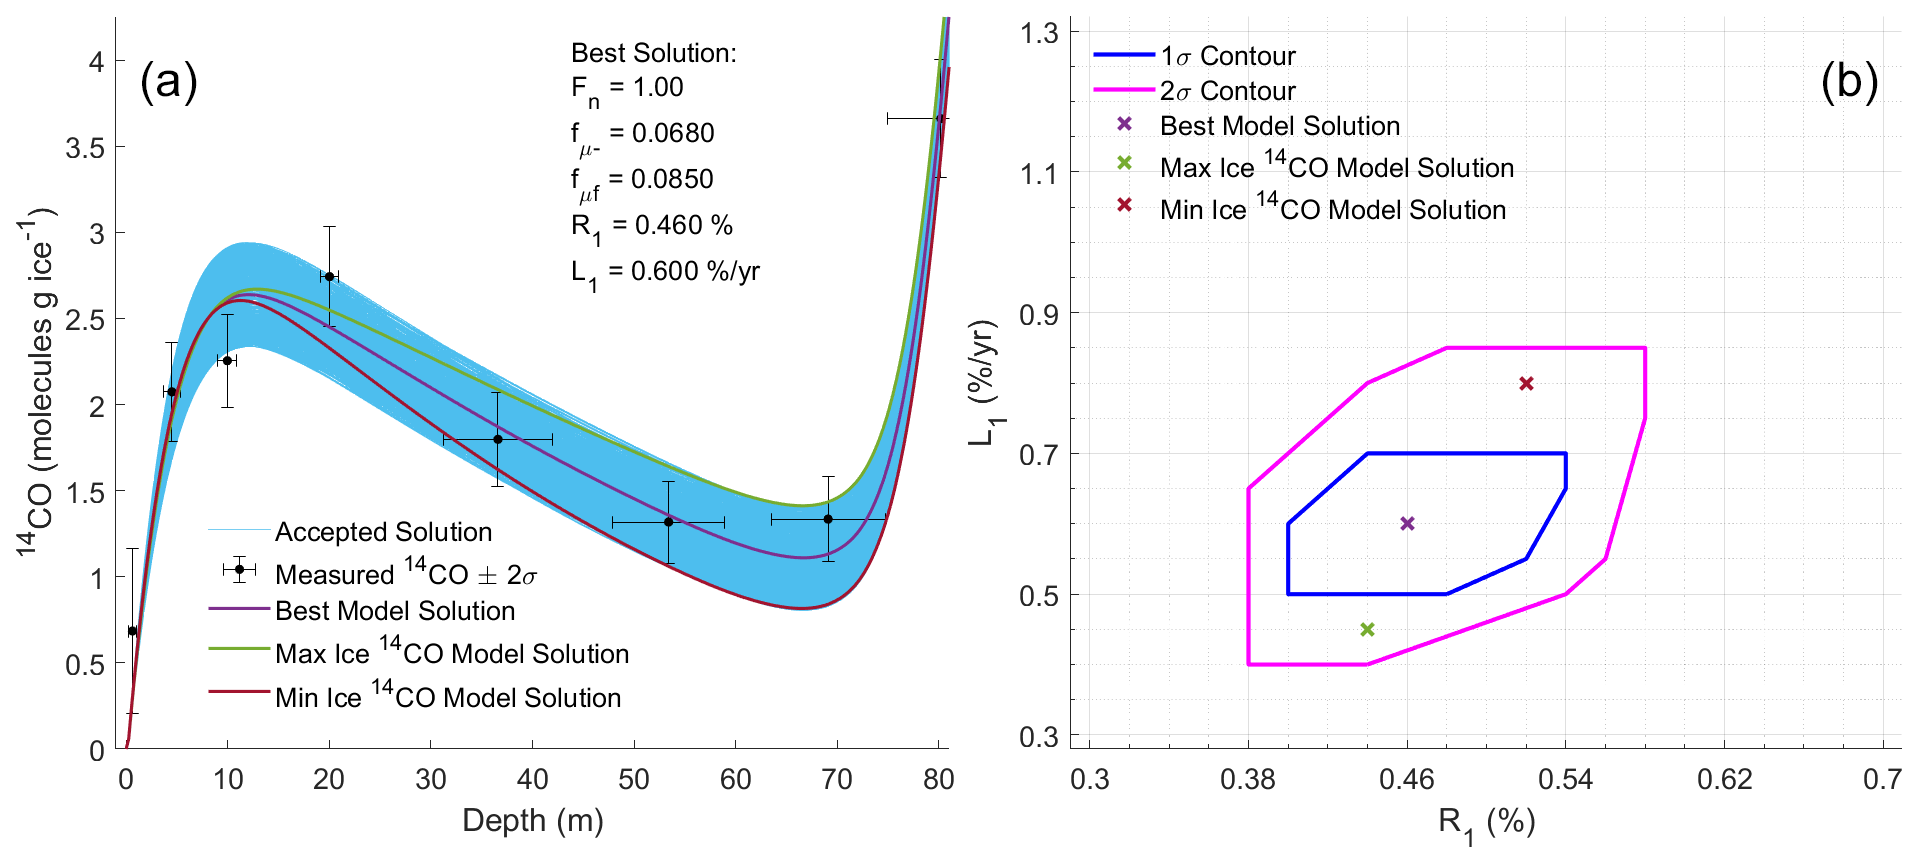
Figure 4Constraints on 14CO retention and leakage in Summit firn. Panel (a) shows results for the firn matrix samples that were used to provide the constraints, together with the set of accepted solutions (blue envelope), as well as the best-fit (minimum χ2) solution and the accepted solutions that yield minimum (“Min Ice”) or maximum (“Max Ice”) 14CO content in ice below the LIZ. Panel (b) shows the set of accepted solutions as well as the best, Min Ice and Max Ice solutions in R1–L1 space. R1 is the fraction of produced 14CO that initially stays in the ice grains, and L1 is the leakage rate of this initially retained 14CO.
Table 2Results of the grid search for R1 and L1 parameters in the firn matrix. Note that the values listed for Fn under the 2σ range column are not determined from the grid search but rather assumed based on published uncertainty estimates for 14C production rates by neutrons (Sect. 3.2.1.).
Previous discussions of low retention of in situ cosmogenic 14C in the firn focused on mechanisms such as firn sublimation and recrystallization in combination with wind ventilation (e.g., Lal et al., 2001; Petrenko et al., 2013b). However, our results are quantitatively consistent with a mechanism that involves a very rapid (<1 year) loss from the ice grains of >99 % of produced 14C, which is too fast to be explained by recrystallization or ventilation. The observation of the rapid loss of almost all in situ 14C from the ice grains is also consistent with the results of the in situ 14C production rate comparison between the Antarctic blue-ice areas of Taylor Glacier (Dyonisius et al., 2023; Petrenko et al., 2016) and Scharffenbergbotnen (van der Kemp et al., 2002) that Dyonisius et al. (2023) conducted. The Taylor Glacier results included 14CO measurements that were obtained with the same method as this study as well as 14CO2 measurements that used an ice sublimation technique, while the Scharffenbergbotnen 14CO and 14CO2 measurements were made using a dry-extraction technique. There has been concern with dry-extraction measurements with regard to an incomplete release of in situ 14C from the ice grains (Smith et al., 2000; van der Kemp et al., 2002). However, if almost all in situ 14C is rapidly transferred to the air porosity after production, then the dry-extraction technique would be expected to give equivalent results.
We hypothesize that the rapid loss of in situ 14C from ice grains is mainly driven by diffusion of the 14C-containing gas molecules (14CO, 14CH4, 14CO2). While we are not aware of prior estimates of CO diffusivity through ice, both measurement-based estimates and estimates based on molecular dynamics simulations indicate that gases with smaller molecular diameters diffuse faster through ice than gases with larger molecular diameters (e.g., Patterson and Saltzman, 2021, and references therein). There are estimates of gas diffusivity through ice available for CH4 (Ikeda-Fukazawa et al., 2004; Noguchi et al., 2019) and O2 (Ikeda-Fukazawa et al., 2005). CH4 has a slightly larger molecular diameter than CO, while O2 has a slightly smaller molecular diameter (Severinghaus and Battle, 2006); thus diffusivity estimates for CH4 and O2 should be indicative of the possible range for CO diffusivity through ice. Noguchi et al. (2019) experimentally determined the diffusivity of CH4 through ice at 257 K, with m2 s−1. Ikeda-Fukazawa et al. (2004) used molecular dynamics simulations to estimate CH4 diffusivity, with average of m2 s−1, in fairly good agreement with the experimental estimate. To be conservative, we take the lower estimate (Ikeda-Fukazawa et al., 2004) and recalculate it (following the temperature dependence in Ikeda-Fukazawa et al., 2004) for the temperature of the Greenland Summit site (−31 °C; Buizert, 2013). This yields m2 s−1.
For O2, Ikeda-Fukazawa et al. (2005) used molecular dynamics simulations to estimate the diffusivity through ice as a function of temperature. This relationship yields m2 s−1. The Ikeda-Fukazawa et al. (2005) estimates were recently called into question by Oyabu et al. (2021), who used observations of diffusive smoothing of the signal with depth in the Dome Fuji ice core to show that the permeation coefficients (product of diffusivity and solubility) of O2 as estimated by Ikeda-Fukazawa et al. (2005) are likely too high (by a factor of ≈ 5 at 242 K). If we assume that this difference in permeation coefficients is due to overestimates of diffusivity, we can lower the Ikeda-Fukazawa et al. (2005) value by a factor of 5 to yield m2 s−1. As we consider the question of whether gas diffusion can be fast enough to explain the observed rapid loss of in situ 14CO from ice grains at Summit, we use this diffusivity estimate (lowest of the set of values discussed above) to be conservative. The characteristic timescale for diffusion can be estimated as , where L is the diffused distance and D is the diffusivity. Taking a typical firn grain radius as 3 mm (Linow et al., 2012), the timescale for diffusion out of the firn grain is then 0.05 years (18 d), which is sufficiently fast to be consistent with our observations.
If our hypothesis is correct, then the rate of rapid loss of in situ 14C from the firn grains would be site dependent, with less rapid loss predicted at colder sites. If we use the temperature dependence of CH4 diffusivity from Ikeda-Fukazawa et al. (2004), then the diffusivity in ice at a very cold ice core site such as Dome C ( °C) would be ≈ 7 times lower than at the Greenland Summit site. However, this lower diffusivity would still be sufficient to allow for complete loss of in situ 14C from firn grains on a timescale of faster than 1 year. The lack of retention of in situ 14C in the firn even at cold sites is consistent with findings from prior measurements of 14CO and 14CO2 in the Dome C ice core using a dry-extraction technique (de Jong et al., 2004).
Regarding the ≈ 0.5 % of in situ produced 14CO that is not lost rapidly from the firn matrix, it may be possible that this 14CO becomes trapped in microbubbles or at dislocations or grain boundaries in the ice lattice. Microbubbles (closed porosity in firn above the lock-in zone) have been observed at ice core sites in both Antarctica (e.g., Siegenthaler et al., 2005) and Greenland (Petrenko et al., 2013b; this study; see Table S2) and would be expected to retain 14CO in the same way as bubbles in deeper ice. Further movement of 14CO from microbubbles to open porosity would be controlled by the gas permeation coefficient (product of diffusivity and solubility). As solubility of gases in ice is very low (e.g., Patterson and Saltzman, 2021, and references therein), this process is slow. This is different from the situation of 14CO immediately following in situ production, as in this case 14CO is already in the ice lattice and only diffusivity matters. Dislocations and grain boundaries tend to concentrate impurities (e.g., Stoll et al., 2021, and references therein), and it may be possible that interactions with other impurities help to retain 14CO molecules. This trapped 14CO could then be released more slowly (as mentioned above, our best-estimate leakage rate for this slow process is 0.6 % yr−1) as the microbubbles disintegrate or as dislocations and grain boundaries come in contact with porosity via the relatively slow process of recrystallization.
4.3 Production rates from muon mechanisms
4.3.1 Approach for constraining production rates from muon mechanisms
In this study, we require the determined muogenic 14CO production rates to be consistent with both Taylor Glacier (Dyonisius et al., 2023) and Summit measurements. Dyonisius et al. (2023) determined the possible set of fμ−–fμf pairs via comparison of predictions from an ice flow model for Taylor Glacier that included in situ 14CO production with Taylor Glacier measurements. We take the set of fμ−– fμf pairs from Dyonisius et al. (2023) that represents the 2σ range (3851 pairs) and perform repeated runs of the model, comparing the model 14CO results with measurements in ice below the LIZ and in firn air in the LIZ. As different sets of fμ−– fμf pairs yield optimal solutions for ice and LIZ firn air, we define the “best” and accepted range of fμ−–fμf pairs separately for ice and LIZ air. In each case, the reduced χ2 value is once again used to define the best fμ−–fμf pair. The accepted sets of fμ−–fμf pairs are those that yield model solutions that fall within the 2σ uncertainty bound from the best solution. The 2σ uncertainty bound is defined separately for ice and LIZ firn air and is equal to the mean 2σ measurement uncertainty for samples within the depth range used for the model–data comparison. The final accepted set of fμ−–fμf pairs represents the overlap between the sets accepted for ice and for LIZ firn air.
As discussed above, the 14CO content in bubbly ice below the LIZ and in LIZ firn air is sensitive to the atmospheric [14CO] history in addition to muogenic 14C production rates. We use several possible atmospheric [14CO] scenarios (Sect. 4.3.2) to ensure that we are capturing the full possible range of accepted of fμ−–fμf pairs. For each [14CO] scenario, we repeat the firn model runs for each fμ−–fμf pair from Dyonisius et al. (2023). Finally, the choice of retention and leakage parameters does have a small impact on the 14CO content in bubbly ice below the LIZ. We therefore also repeat the above sets of firn model runs with R1, L1 and Fn parameters set to either the best-estimate values or the min or the max values in Table 2.
4.3.2 Atmospheric [14CO] history scenarios
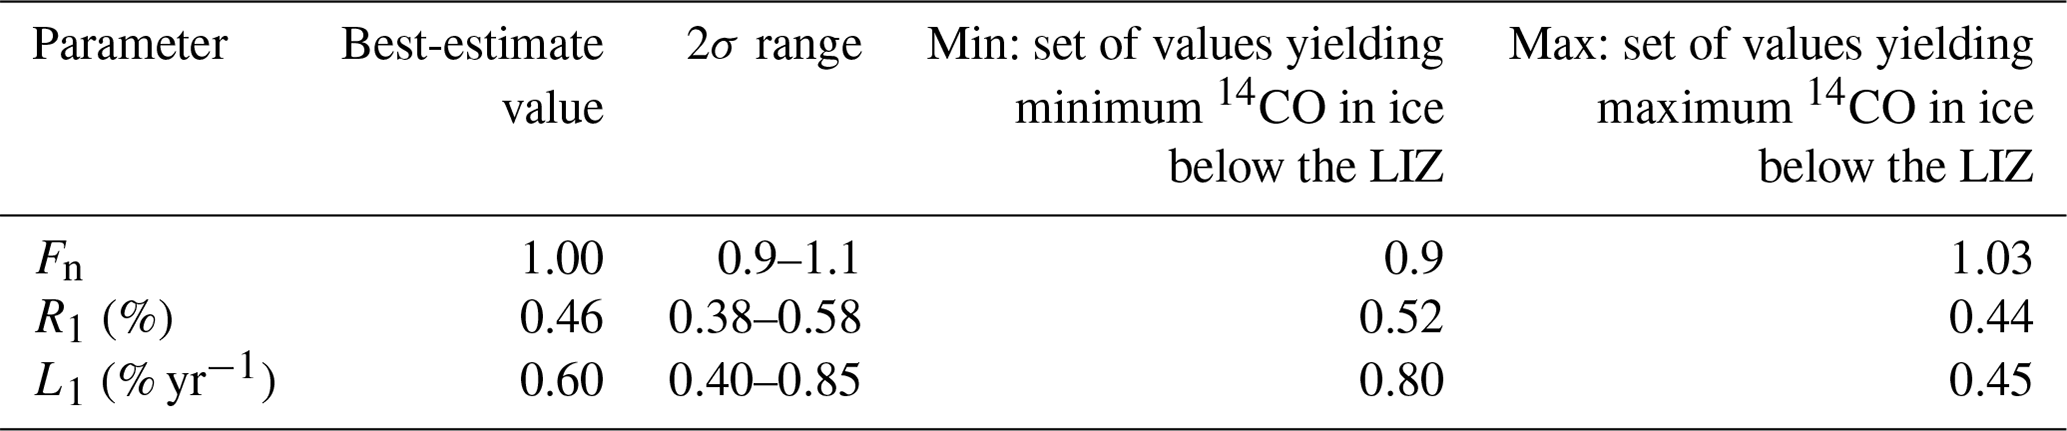
The “baseline” atmospheric [14CO] history for the Greenland Summit site used in this study (Fig. 5, scenario 1) was developed by Hmiel et al. (2020) and discussed in their “Supplementary information”. This history is based on atmospheric 14C production as indicated by the sunspot group number and was constructed as follows. We used the longest available record of atmospheric [14CO] measurements from Manning et al. (2005) (from New Zealand and Antarctica) and the sunspot group number record from Svalgaard and Schatten (2016). For the period of overlap between these two records, we applied a linear regression of the annual sunspot group number and a 12-month moving average of the Southern Hemisphere (SH) [14CO] measurements corrected for the secondary [14CO] component (∼ 10 %) that arises from CH4 and non-CH4 hydrocarbon oxidation and biomass burning (Manning et al., 2005). This yields the Southern Hemisphere (SH) [14CO]–sunspot group number relationship, which is then applied to the earlier part of the sunspot group number record to construct a SH cosmogenic [14CO] history. A constant offset of +6.98 molecules cm−3 STP is then applied to the SH [14CO] history to account for the higher mean annual [14CO] at the Greenland Summit site as compared to the SH as well as for the secondary component of [14CO] (e.g., Jöckel and Brenninkmeijer, 2002). Lastly, the seasonal cycle in [14CO] (not shown in Fig. 5) is developed from fitting a harmonic function to the available records of Northern Hemisphere [14CO] from the high-latitude sites of Alert, Ny-Ålesund and Barrow (Jöckel and Brenninkmeijer, 2002). The [14CO] seasonal cycle amplitude and the constant Greenland–SH offset were optimized by trialing a range of values in the firn model to minimize the reduced χ2 metric for the difference between model and firn air [14CO] observations in the 0–60 m depth range.
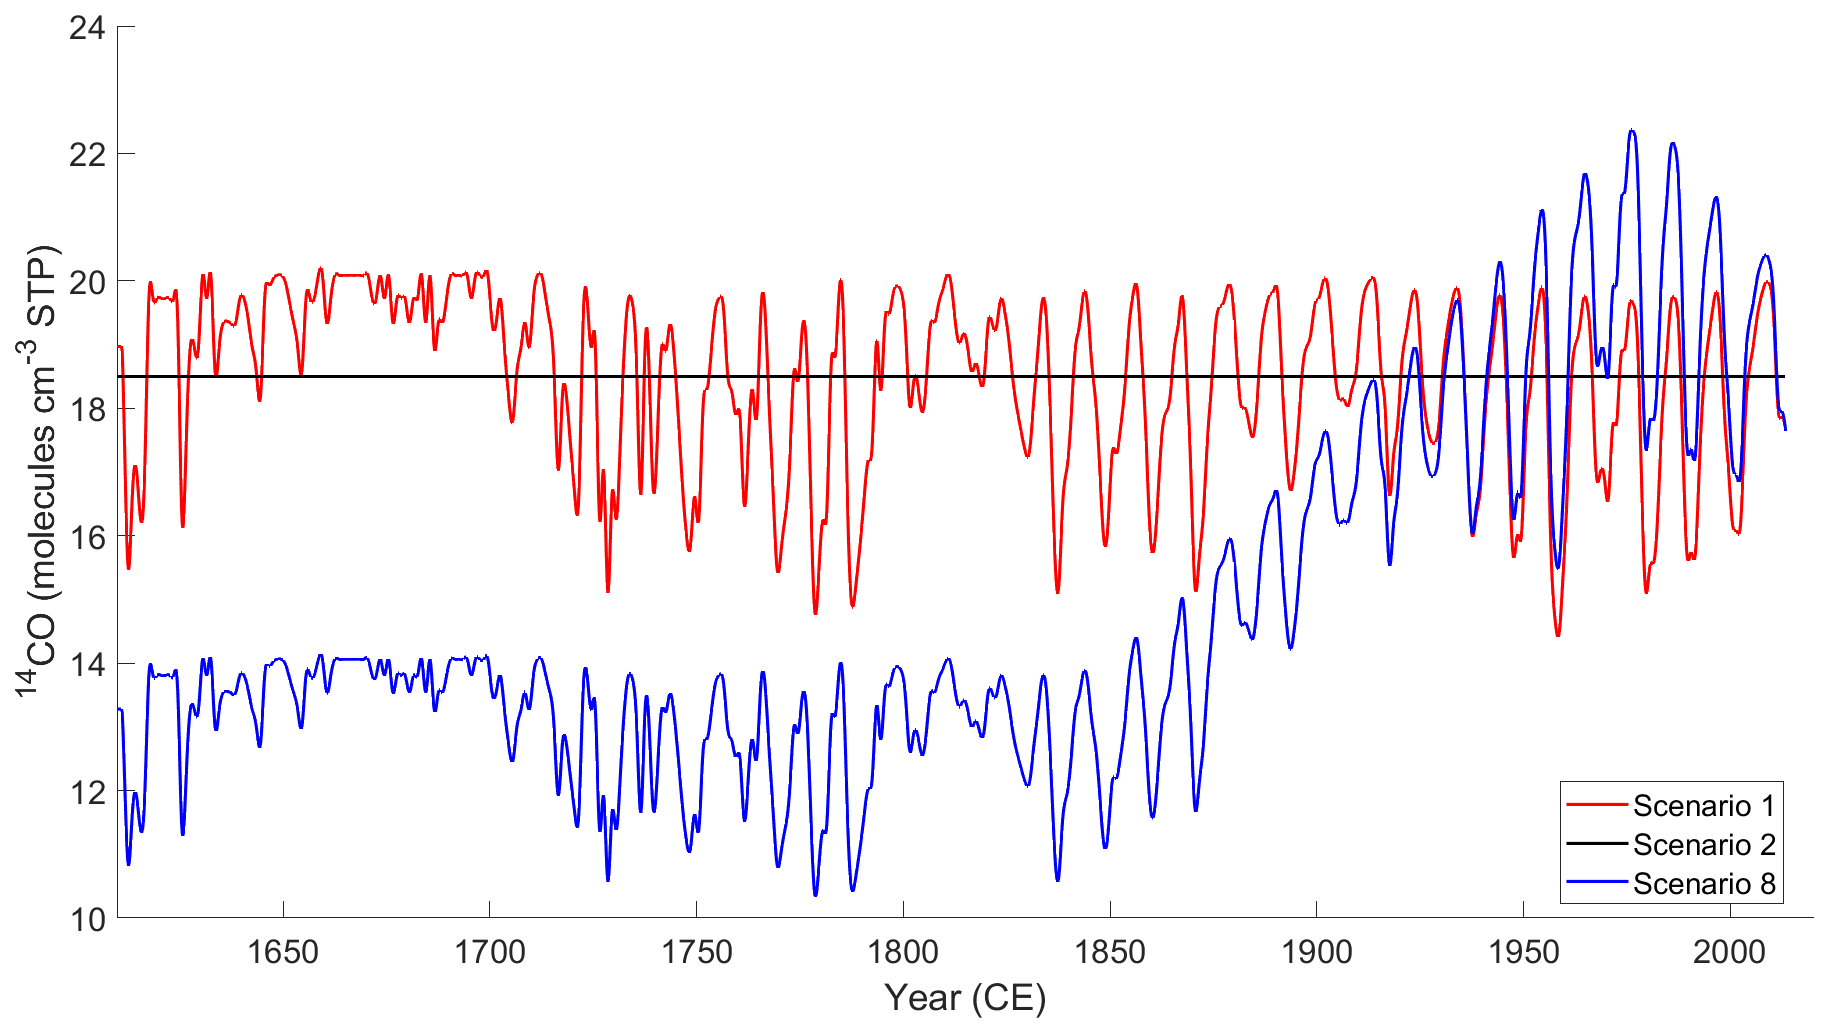
Figure 5Paleoatmospheric [14CO] scenarios. Visualization of some of the paleoatmospheric 14CO history scenarios used in constraining muogenic 14CO production tuning factors fμ− and fμf. Scenario names in the figure caption correspond to the list in Sect. 4.3.2.
While the baseline atmospheric [14CO] history at Summit described above takes into account variations in the atmospheric 14C production rate, atmospheric [14CO] is also sensitive to variations in hydroxyl radical concentrations ([OH]); stratosphere-to-troposphere transport (STT); and, to a lesser extent, changes in secondary 14CO sources such as CH4 and volatile organic compound (VOC) oxidation and biomass burning (e.g., Jöckel and Brenninkmeijer, 2002). Variability in global [OH] is relatively well constrained via observations of methyl chloroform back to the mid-1990s (e.g., Montzka et al., 2011; no large changes) but more uncertain further back in time. With regard to STT, we investigated the sensitivity of [14CO] over Greenland to changes in the Brewer–Dobson circulation using a preliminary implementation of 14CO in the GEOS-Chem chemical transport model. A preindustrial run was compared with a 4xCO2 run in GEOS-Chem (the Brewer–Dobson circulation is expected to intensify with warming), and no significant change in [14CO] over Greenland was found.
However, to ensure that plausible fμ−–fμf pairs were not excluded, we still allowed for relatively large (up to 30 %) variability in [14CO] as compared to the baseline scenario to account for possibilities such as Northern Hemisphere [OH] variations prior to the 1990s in response to large changes in emissions of reactive species, increasing uncertainty in the atmospheric 14C production rates further back in time and possible changes in the frequency of stratospheric air intrusions. The [14CO] atmospheric history scenarios we trialed differed as follows from the baseline scenario:
-
baseline scenario
-
constant [14CO] at all times at 18.5 molecules cm−3 STP
-
+15 % change from the baseline at all times
-
−15 % change from the baseline at all times
-
−30 % change from the baseline at all times
-
a linear increase in [14CO] back in time from baseline [14CO] in 2013, reaching +15 % at 1980, then a linear decrease further back in time, reaching −15 % at 1850 as compared to the baseline, with −15 % from the baseline for ages older than 1850
-
same temporal structure as 6, except for variations of +30 % in 1980 and −30 % at 1850 and older
-
same temporal structure as 6, except for variations of +15 % in 1980 and −30 % at 1850 and older.
4.3.3 Results for muogenic 14CO production rate tuning factors fμ− and fμf
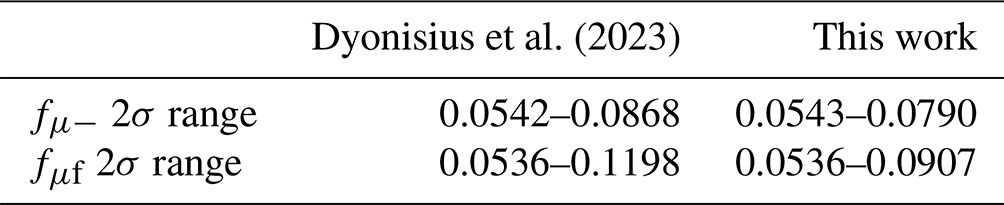
Figure 6 shows the results for the trialed combination of atmospheric [14CO] history and R1, L1 and Fn parameters that yields the largest accepted set of fμ−–fμf pairs. This set, which yields solutions that give a good fit to the measurements in both bubbly ice and LIZ firn air, is bounded by the blue contour in Fig. 6c. Table 3 compares the 2σ ranges for fμ− and fμf values between this study and Dyonisius et al. (2023). As can be seen, the Summit results are consistent with most of the fμ− range from the Taylor Glacier (TG) study but only with approximately the lower half of the fμf range. This is not surprising – the Taylor Glacier results for fμf had larger relative uncertainties, due mainly to uncertainties in the depth of ice transport in the glacier over the last few thousand years. Our results are consistent with the relatively shallower Taylor Glacier flowlines considered in Dyonisius et al. (2023).
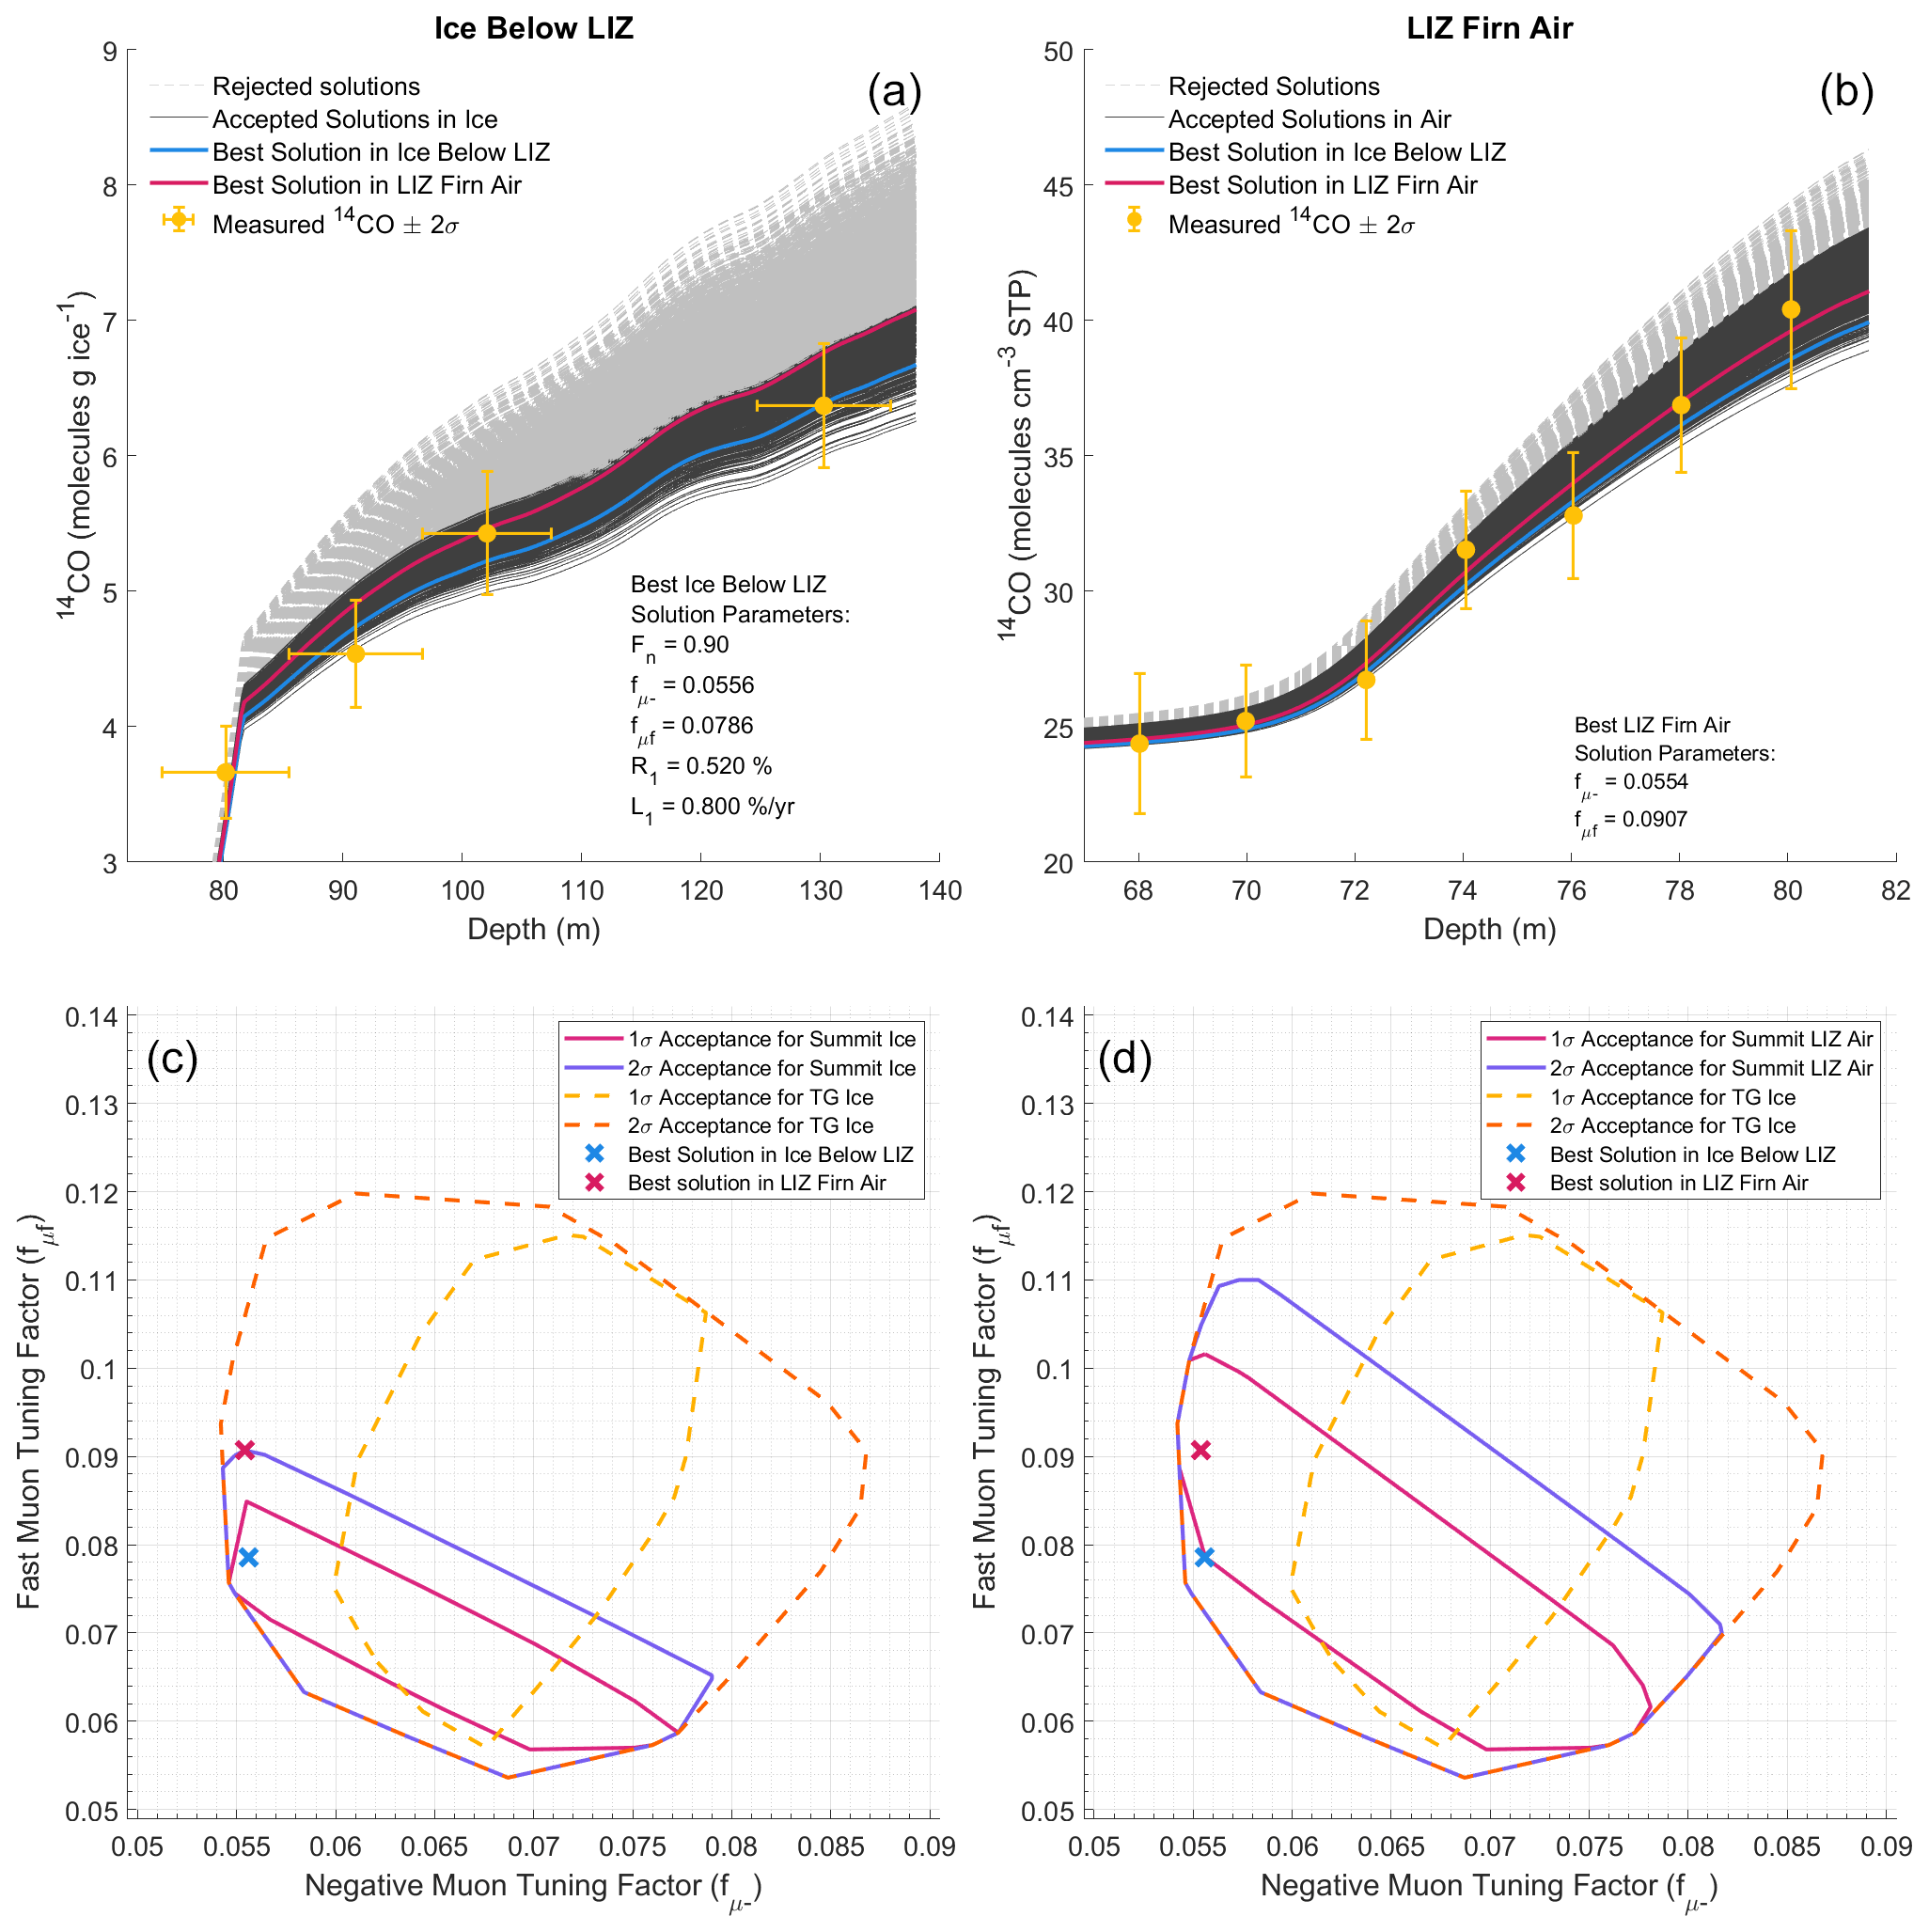
Figure 6Constraints on fμ− and fμf values. Results from repeated runs of the firn model with the full set of fμ−–fμf pairs from Dyonisius et al. (2023). In the shown model runs, atmospheric [14CO] history scenario 8 (see Sect. 4.3.2) was used, along with the set of Fn, R1 and L1 values that yield minimum 14CO content in ice below the LIZ (Table 2). Panel (a) shows the model run results for 14CO content in ice below the LIZ, and panel (b) shows the results for LIZ firn air. Panels (c) (ice) and (d) (LIZ firn air) show the corresponding contours of accepted sets of fμ−–fμf values.
Table 3Comparison of fμ ranges from Dyonisius et al. (2023) and this work.
We note that the atmospheric [14CO] history scenarios that result in the best model fit to both the bubbly-ice and LIZ firn air measurements all contain significant temporal variability, with [14CO] around 1980 that is higher than predicted from estimated atmospheric 14CO production rates and [14CO] prior to ≈ 1920 that is lower than predicted (Sect. 4.3.2 and Fig. 5). Such variability, if real, may be indicative of long-term changes in Northern Hemisphere hydroxyl radical concentrations and could be investigated more effectively at a site with a very high accumulation rate (e.g., southeastern Greenland dome; Iizuka et al., 2017) where the in situ 14CO component would be minimized.
4.3.4 Discussion of implications for muogenic 14C production rates
Because Dyonisius et al. (2023) observed a constant in situ production ratio, our results also indirectly confirm their finding that muogenic 14C production rates for 14C-bearing gases in ice appear to be much lower than total 14C production rates predicted from studies of quartz. Dyonisius et al. (2023) considered this discrepancy and were able to rule out the following as possible explanations: (1) analytical issues with ice core 14C measurements (good agreement between independent methods), (2) much higher historical ice ablation rates as compared to modern ones (not supported by paleoclimate data; also for the Greenland Summit site the ice chronology is very well determined, so the accumulation rate is not in question), (3) fμf of 0 and a much higher fμ− (this would be consistent with 14C results from a rock core but is not consistent with ice core data), (4) the unmeasured organic fraction of in situ 14C in ice explaining the difference (organic fraction is <25 %, so this is too small), and (5) a value used for α (0.75; see Eq. 5) which is too small (using an upper-end value for α does not change the results appreciably).
If there was a process that destroyed 14CO to a significant extent in ice at the Greenland Summit site and other previously sampled locations, biasing the ice core measurements low, this could help to reconcile the observed muogenic 14C production rate difference between ice and quartz. Such a chemical or biological process would very likely be temperature and/or impurity dependent and, therefore, site dependent. There are two previously published ice core 14CO data sets using different methodology from two different locations in Antarctica, Scharffenbergbotnen (van der Kemp et al., 2002) and Taylor Glacier (Dyonisius et al., 2023), and these agree with each other with regard to production rates within uncertainties, as do the Greenland Summit site and Taylor Glacier. An additional new 14CO data set from Law Dome, Antarctica, is also consistent with the muogenic production rates determined here (Petrenko et al., 2023). Further, while CO in Greenland ice cores is known to be affected by in situ production, CO in Antarctic ice cores appears to be generally well preserved, and there is no evidence of CO destruction in either Greenland or Antarctic ice cores (e.g., Faïn et al., 2022, 2023; Haan et al., 1998). This process therefore seems highly unlikely to explain the ice–quartz disagreement.
Partitioning of hot in situ 14C atoms among different species in the polar ice cores is unlikely to be site dependent because impurities are present in Greenland and Antarctic ice cores at trace levels (on the order of parts per million or lower), so the probability of a hot 14C atom bonding with atoms other than O and H is very low. The agreement among different ice core sites with regard to 14CO production rates suggests constant partitioning of muogenic in situ 14C. Variations in hot 14C partitioning in ice therefore also seem unlikely to explain the ice–quartz disagreement.
It may in principle be possible that gas-phase ice core 14C measurements (14CO + 14CO2 + 14CH4) are missing the majority of in situ 14C if the majority of this 14C is present as non-gas species. While the organic fraction of 14C mentioned above seems too small to be the main explanation, it may be possible that other forms of inorganic carbon (HCO, CO) play a role.
This study has provided the most comprehensive characterization to date of the production, movement and retention of in situ cosmogenic 14CO in the firn layer of an accumulation site. Our results conclusively show that only a very small fraction (<0.6 %) of total in situ cosmogenic 14CO that is produced in the ice grains initially stays in the ice grains. Measurements in the firn matrix indicate that the vast majority of in situ 14CO is lost very rapidly to the open porosity in the firn. Gas diffusion through ice appears to be the most likely process responsible for this rapid loss. Our firn matrix measurements also conclusively demonstrate that there is a second, much slower process for loss of in situ 14CO from the ice grains that occurs on timescales that could be consistent with the process of firn recrystallization. More measurements from different ice core sites would provide further insight into 14C loss and retention processes and would allow for explicit inclusion of these physical processes into future models of in situ 14C in the firn.
While the uncertain atmospheric [14CO] history over Greenland translates into increased uncertainties in the determination of muogenic 14CO production rates in ice, we were nevertheless able to further narrow the possible range of these production rates. These findings help to lay the groundwork for ice core studies of past atmospheric [14CO] and past cosmic ray flux, as well as for ice core studies that use other 14C-containing gases for applications such as examining the past atmospheric methane budget (using 14CH4) and the past carbon cycle (using 14CO2). Finally, our results continue to highlight the apparent discrepancy in muogenic 14C production rates determined from studies of gases in ice versus those determined from studies of quartz. No clear explanation for this discrepancy currently exists, although it is possible that studies of ice to date have missed some of the species that in situ 14C partitions into. Future studies that provide more comprehensive characterization of 14C in ice cores (including gas species and non-gas organic and inorganic carbon species) as well as laboratory studies involving muon irradiation of ice samples may be helpful in resolving this disagreement. For completeness, future studies could also explicitly consider uncertainties in all muogenic 14C production parameters, such as muon fluxes and energies.
Code for the firn model used in this study is available from the authors upon request.
All the data presented in this study are available in the tables in the Supplement, as well as from the National Science Foundation (NSF) Arctic Data Center at https://doi.org/10.18739/A2599Z216 (Petrenko et al., 2020).
The supplement related to this article is available online at: https://doi.org/10.5194/tc-18-3363-2024-supplement.
VVP designed the study, with input from BH, CB and JPS. BH, VVP, MND, PP, AMS, CB, MP and MD planned and prepared the field campaigns. BH, VVP, MND, PP, CB, AMS, RB, LD, MD, MP, JAM, MK, XF and AA carried out the fieldwork and sample collection. BH, AMS, BY, QH, VVP, RB, JPS, CH, RFW and IV performed or assisted with sample processing and measurements. BH, VVP, CB, AMS, MND, JPS and LTM analyzed and interpreted the results. VVP and BH wrote the manuscript, with input from all other authors.
The contact author has declared that none of the authors has any competing interests.
Publisher’s note: Copernicus Publications remains neutral with regard to jurisdictional claims made in the text, published maps, institutional affiliations, or any other geographical representation in this paper. While Copernicus Publications makes every effort to include appropriate place names, the final responsibility lies with the authors.
This article is part of the special issue “Ice core science at the three poles (CP/TC inter-journal SI)”. It is a result of the IPICS 3rd Open Science Conference, Crans-Montana, Switzerland, 2–7 October 2022.
We thank the U.S. Ice Drilling Program for support activities through the NSF (cooperative agreement no. 1836328). We thank Polar Field Services and the 109th Airlift Wing of the New York Air National Guard for providing field logistical support. We thank Sylvia Englund Michel for providing measurements of δ13C in the dilution gas, Joseph McConnell for providing age tie points for the ice cores, and John Patterson and Richard Alley for helpful discussions.
This research has been supported by a US NSF award (grant no. ARC-1203779 to Vasilii V. Petrenko) and the Packard Fellowship for Science and Engineering (to Vasilii V. Petrenko).
This paper was edited by Hubertus Fischer and reviewed by two anonymous referees.
Adolph, A. C. and Albert, M. R.: Gas diffusivity and permeability through the firn column at Summit, Greenland: measurements and comparison to microstructural properties, The Cryosphere, 8, 319–328, https://doi.org/10.5194/tc-8-319-2014, 2014.
Balco, G.: Production rate calculations for cosmic-ray-muon-produced 10Be and 26Al benchmarked against geological calibration data, Quat. Geochronol., 39, 150–173, 2017.
Balco, G., Stone, J. O., Lifton, N. A., and Dunai, T. J.: A complete and easily accessible means of calculating surface exposure ages or erosion rates from 10Be and 26Al measurements, Quat. Geochronol., 3, 174–195, 2008.
Battle, M., Bender, M., Sowers, T., Tans, P. P., Butler, J. H., Elkins, J. W., Ellis, J. T., Conway, T., Zhang, N., Lang, P., and Clarke, A. D.: Atmospheric gas concentrations over the past century measured in air from firn at the South Pole, Nature, 383, 231–235, 1996.
Bereiter, B., Kawamura, K., and Severinghaus, J. P.: New methods for measuring atmospheric heavy noble gas isotope and elemental ratios in ice core samples, Rapid Comm. Mass Spectrom., 32, 801–814, 2018.
Borchers, B., Marrero, S., Balco, G., Caffee, M., Goehring, B., Lifton, N., Nishiizumi, K., Phillips, F., Schaefer, J., and Stone, J.: Geological calibration of spallation production rates in the CRONUS-Earth project, Quat. Geochronol., 31, 188–198, 2016.
Buizert, C.: Studies of Firn Air. In: The Encycl. of Quatern. Sci., edited by: Elias, S. A., Elsevier, Amsterdam, ISBN 978-0-444-53642-6, 2013.
Buizert, C., Martinerie, P., Petrenko, V. V., Severinghaus, J. P., Trudinger, C. M., Witrant, E., Rosen, J. L., Orsi, A. J., Rubino, M., Etheridge, D. M., Steele, L. P., Hogan, C., Laube, J. C., Sturges, W. T., Levchenko, V. A., Smith, A. M., Levin, I., Conway, T. J., Dlugokencky, E. J., Lang, P. M., Kawamura, K., Jenk, T. M., White, J. W. C., Sowers, T., Schwander, J., and Blunier, T.: Gas transport in firn: multiple-tracer characterisation and model intercomparison for NEEM, Northern Greenland, Atmos. Chem. Phys., 12, 4259–4277, https://doi.org/10.5194/acp-12-4259-2012, 2012.
Dansgaard, W. and Johnsen, S. J.: A Flow Model and a Time Scale for the Ice Core from Camp Century, Greenland, J. Glaciol., 8, 215–223, 1969.
de Jong, A. F. M., Alderliesten, C., van der Borg, K., van der Veen, C., and van De Wal, R. S. W.: Radiocarbon analysis of the EPICA Dome C ice core: no in situ 14C from the firn observed, Nucl. Instr. Meth. B, 223–224, 516–520, 2004.
Desilets, D., Zreda, M., and Prabu, T.: Extended scaling factors for in situ cosmogenic nuclides: New measurements at low latitude, Earth Planet. Sci. Lett., 246, 265–276, 2006.
Dlugokencky, E. J., Lang, P. M., Crotwell, A. M., Mund, J., Crotwell, M. J., and Thoning, K.: NOAA GML CH4 surface flask data, https://gml.noaa.gov/dv/iadv/, last access: December 2018.
Dyonisius, M. N., Petrenko, V. V., Smith, A. M., Hua, Q., Yang, B., Schmitt, J., Beck, J., Seth, B., Bock, M., Hmiel, B., Vimont, I., Menking, J. A., Shackleton, S. A., Baggenstos, D., Bauska, T. K., Rhodes, R. H., Sperlich, P., Beaudette, R., Harth, C., Kalk, M., Brook, E. J., Fischer, H., Severinghaus, J. P., and Weiss, R. F.: Old carbon reservoirs were not important in the deglacial methane budget, Science, 367, 907–910, 2020.
Dyonisius, M. N., Petrenko, V. V., Smith, A. M., Hmiel, B., Neff, P. D., Yang, B., Hua, Q., Schmitt, J., Shackleton, S. A., Buizert, C., Place, P. F., Menking, J. A., Beaudette, R., Harth, C., Kalk, M., Roop, H. A., Bereiter, B., Armanetti, C., Vimont, I., Englund Michel, S., Brook, E. J., Severinghaus, J. P., Weiss, R. F., and McConnell, J. R.: Using ice core measurements from Taylor Glacier, Antarctica, to calibrate in situ cosmogenic 14C production rates by muons, The Cryosphere, 17, 843–863, https://doi.org/10.5194/tc-17-843-2023, 2023.
Faïn, X., Chappellaz, J., Rhodes, R. H., Stowasser, C., Blunier, T., McConnell, J. R., Brook, E. J., Preunkert, S., Legrand, M., Debois, T., and Romanini, D.: High resolution measurements of carbon monoxide along a late Holocene Greenland ice core: evidence for in situ production, Clim. Past, 10, 987–1000, https://doi.org/10.5194/cp-10-987-2014, 2014.
Faïn, X., Rhodes, R. H., Place, P., Petrenko, V. V., Fourteau, K., Chellman, N., Crosier, E., McConnell, J. R., Brook, E. J., Blunier, T., Legrand, M., and Chappellaz, J.: Northern Hemisphere atmospheric history of carbon monoxide since preindustrial times reconstructed from multiple Greenland ice cores, Clim. Past, 18, 631–647, https://doi.org/10.5194/cp-18-631-2022, 2022.
Faïn, X., Etheridge, D. M., Fourteau, K., Martinerie, P., Trudinger, C. M., Rhodes, R. H., Chellman, N. J., Langenfelds, R. L., McConnell, J. R., Curran, M. A. J., Brook, E. J., Blunier, T., Teste, G., Grilli, R., Lemoine, A., Sturges, W. T., Vannière, B., Freitag, J., and Chappellaz, J.: Southern Hemisphere atmospheric history of carbon monoxide over the late Holocene reconstructed from multiple Antarctic ice archives, Clim. Past, 19, 2287–2311, https://doi.org/10.5194/cp-19-2287-2023, 2023.
Fang, L., Jenk, T. M., Singer, T., Hou, S., and Schwikowski, M.: Radiocarbon dating of alpine ice cores with the dissolved organic carbon (DOC) fraction, The Cryosphere, 15, 1537–1550, https://doi.org/10.5194/tc-15-1537-2021, 2021.
Godwin, H.: Half-life of Radiocarbon, Nature, 195, 984, https://doi.org/10.1038/195984a0, 1962.
Haan, D. and Raynaud, D.: Ice core record of CO variations during the last two millennia: atmospheric implications and chemical in- teractions within the Greenland ice, Tellus B, 50, 253–262, 1998.
Hall, B. D., Engel, A., Mühle, J., Elkins, J. W., Artuso, F., Atlas, E., Aydin, M., Blake, D., Brunke, E.-G., Chiavarini, S., Fraser, P. J., Happell, J., Krummel, P. B., Levin, I., Loewenstein, M., Maione, M., Montzka, S. A., O'Doherty, S., Reimann, S., Rhoderick, G., Saltzman, E. S., Scheel, H. E., Steele, L. P., Vollmer, M. K., Weiss, R. F., Worthy, D., and Yokouchi, Y.: Results from the International Halocarbons in Air Comparison Experiment (IHALACE), Atmos. Meas. Tech., 7, 469–490, https://doi.org/10.5194/amt-7-469-2014, 2014.
Heisinger, B., Lal, D., Jull, A. J. T., Kubik, P., Ivy-Ochs, S., Knie, K., and Nolte, E.: Production of selected cosmogenic radionuclides by muons: 2. Capture of negative muons, Earth Planet. Sci. Lett., 200, 357–369, 2002a.
Heisinger, B., Lal, D., Jull, A. J. T., Kubik, P., Ivy-Ochs, S., Neumaier, S., Knie, K., Lazarev, V., and Nolte, E.: Production of selected cosmogenic radionuclides by muons 1. Fast muons, Earth Planet. Sci. Lett., 200, 345–355, 2002b.
Hippe, K. and Lifton, N. A.: Calculating Isotope Ratios and Nuclide Concentrations for in Situ Cosmogenic 14C Analyses, Radiocarbon, 56, 1167–1174, 2014.
Hmiel, B., Petrenko, V. V., Dyonisius, M. N., Buizert, C., Smith, A. M., Place, P. F., Harth, C., Beaudette, R., Hua, Q., Yang, B., Vimont, I., Michel, S. E., Severinghaus, J. P., Etheridge, D., Bromley, T., Schmitt, J., Faïn, X., Weiss, R. F., and Dlugokencky, E.: Preindustrial 14CH4 indicates greater anthropogenic fossil CH4 emissions, Nature, 578, 409–412, 2020.
Hoffman, M.: Micro radiocarbon dating of the particulate organic carbon fraction in Alpine glacier ice: method refinement, critical evaluation and dating applications, PhD Thesis, University of Heidelberg, https://doi.org/10.11588/heidok.00020712, 2016.
Iizuka, Y., Miyamoto, A., Hori, A., Matoba, S., Furukawa, R., Saito, T., Fujita, S., Hirabayashi, M., Yamaguchi, S., Fujita, K., and Takeuchi, N.: A firn densification process in the high accumulation dome of southeastern Greenland, Arct. Antarct. Alp. Res., 49, 13–27, 2017.
Ikeda-Fukazawa, T., Kawamura, K., and Hondoh, T.: Mechanism of molecular diffusion in ice crystals, Mol. Simulat., 30, 973–979, 2004.
Ikeda-Fukazawa, T., Fukumizu, K., Kawamura, K., Aoki, S., Nakazawa, T., and Hondoh, T.: Effects of molecular diffusion on trapped gas composition in polar ice cores, Earth Planet. Sc. Lett., 229, 183–192, 2005.
Jöckel, P. and Brenninkmeijer, C. A. M.: The seasonal cycle of cosmogenic 14CO at the surface level: A solar cycle adjusted, zonal-average climatology based on observations, J. Geophys. Res., 107, 4656, https://doi.org/10.1029/2001JD001104, 2002.
Kuhl, T. W., Johnson, J. A., Shturmakov, A. J., Goetz, J. J., Gibson, C. J., and Lebar, D. A.: A new large-diameter ice-core drill: the Blue Ice Drill, Ann. Glaciol., 55, 1–6, https://doi.org/10.3189/2014AoG68A009, 2014.
Lal, D., Nishiizumi, K., and Arnold, J. R.: Insitu Cosmogenic 3H, 14C, and 10Be for Determining the Net Accumulation and Ablation Rates of Ice Sheets, J. Geophys. Res., 92, 4947–4952, 1987.
Lal, D., Jull, A. J. T., Donahue, D. J., Burtner, D., and Nishiizumi, K.: Polar Ice Ablation Rates Measured Using Insitu Cosmogenic 14C, Nature, 346, 350–352, 1990.
Lal, D., Jull, A. J. T., Donahue, D. J., Burr, G. S., Deck, B., Jouzel, J., and Steig, E.: Record of cosmogenic in situ produced 14C in Vostok and Taylor Dome ice samples: Implications for strong role of wind ventilation processes, J. Geophys. Res., 106, 31933–31941, 2001.
Lifton, N., Sato, T., and Dunai, T. J.: Scaling in situ cosmogenic nuclide production rates using analytical approximations to atmospheric cosmic-ray fluxes, Earth Planet. Sc. Lett., 386, 149–160, 2014.
Linow, S., Horhold, M. W., and Freitag, J.: Grain-size evolution of polar firn: a new empirical grain growth parameterization based on X-ray microcomputer tomography measurements, J. Glaciol., 58, 1245–1252, 2012.
Lowe, D. C., Levchenko, V. A., Moss, R. C., Allan, W., Brailsford, G. W., and Smith, A. M.: Assessment of “storage correction” required for in situ 14CO production in air sample cylinders, Geophys. Res. Lett., 29, GL014719, https://doi.org/10.1029/2002GL014719, 2002.
Lupker, M., Hippe, K., Wacker, L., Kober, F., Maden, C., Braucher, R., Bourles, D., Romani, J. R. V., and Wieler, R.: Depth-dependence of the production rate of in situ 14C in quartz from the Leymon High core, Spain, Quat. Geochronol., 28, 80–87, 2015.
Manning, M. R., Lowe, D. C., Moss, R. C., Bodeker, G. E., and Allan, W.: Short-term variations in the oxidizing power of the atmosphere, Nature, 436, 1001–1004, 2005.
Montzka, S. A., Krol, M., Dlugokencky, E., Hall, B., Jockel, P., and Lelieveld, J.: Small Interannual Variability of Global Atmospheric Hydroxyl, Science, 331, 67–69, 2011.
Noguchi, M., Tachibana, S., and Nagahara, H.: Diffusivity and solubility of methane in ice Ih, Geochem. J., 53, 83–89, 2019.
Oyabu, I., Kawamura, K., Uchida, T., Fujita, S., Kitamura, K., Hirabayashi, M., Aoki, S., Morimoto, S., Nakazawa, T., Severinghaus, J. P., and Morgan, J. D.: Fractionation of and in the Antarctic ice sheet during bubble formation and bubble–clathrate hydrate transition from precise gas measurements of the Dome Fuji ice core, The Cryosphere, 15, 5529–5555, https://doi.org/10.5194/tc-15-5529-2021, 2021.
Patterson, J. D. and Saltzman, E. S.: Diffusivity and Solubility of H2 in Ice Ih: Implications for the Behavior of H2 in Polar Ice, J. Geophys. Res., 126, e2020JD033840, https://doi.org/10.1029/2020JD033840, 2021.
Petrenko, V. V., Severinghaus, J. P., Brook, E. J., Mühle, J., Headly, M., Harth, C., Schaefer, H., Reeh, N., Weiss, R., Lowe, D. C., and Smith, A. M.: A novel method for obtaining very large ancient air samples from ablating glacial ice for analyses of methane radiocarbon, J. Glaciol., 54, 233–244, 2008.
Petrenko, V. V., Martinerie, P., Novelli, P., Etheridge, D. M., Levin, I., Wang, Z., Blunier, T., Chappellaz, J., Kaiser, J., Lang, P., Steele, L. P., Hammer, S., Mak, J., Langenfelds, R. L., Schwander, J., Severinghaus, J. P., Witrant, E., Petron, G., Battle, M. O., Forster, G., Sturges, W. T., Lamarque, J.-F., Steffen, K., and White, J. W. C.: A 60 yr record of atmospheric carbon monoxide reconstructed from Greenland firn air, Atmos. Chem. Phys., 13, 7567–7585, https://doi.org/10.5194/acp-13-7567-2013, 2013a.
Petrenko, V. V., Severinghaus, J. P., Smith, A. M., Riedel, K., Baggenstos, D., Harth, C., Orsi, A., Hua, Q., Franz, P., Takeshita, Y., Brailsford, G. W., Weiss, R. F., Buizert, C., Dickson, A., and Schaefer, H.: High-precision 14C measurements demonstrate production of in situ cosmogenic 14CH4 and rapid loss of in situ cosmogenic 14CO in shallow Greenland firn, Earth Planet. Sc. Lett., 365, 190–197, 2013b.
Petrenko, V. V., Severinghaus, J. P., Schaefer, H., Smith, A. M., Kuhl, T., Baggenstos, D., Hua, Q., Brook, E. J., Rose, P., Kulin, R., Bauska, T., Harth, C., Buizert, C., Orsi, A., Emanuele, G., Lee, J. E., Brailsford, G., Keeling, R., and Weiss, R. F.: Measurements of 14C in ancient ice from Taylor Glacier, Antarctica constrain in situ cosmogenic 14CH4 and 14CO production rates, Geochim. Cosmochim. Ac., 177, 62–77, 2016.
Petrenko, V. V., Smith, A. M., Schaefer, H., Riedel, K., Brook, E., Baggenstos, D., Harth, C., Hua, Q., Buizert, C., Schilt, A., Faïn, X., Mitchell, L., Bauska, T., Orsi, A., Weiss, R. F., and Severinghaus, J. P.: Minimal geological methane emissions during the Younger Dryas–Preboreal abrupt warming event, Nature, 548, 443–446, 2017.
Petrenko, V., Severinghaus, J., and Brook, E.: 2013–2015 ice core and firn air studies of carbon-14 and bubble closure at Summit, Greenland, Arctic Data Center [data set], https://doi.org/10.18739/A2599Z216, 2020.
Petrenko, V. V., Smith, A. M., Crosier, E. M., Kazemi, R., Place, P., Colton, A., Yang, B., Hua, Q., and Murray, L. T.: An improved method for atmospheric 14CO measurements, Atmos. Meas. Tech., 14, 2055–2063, https://doi.org/10.5194/amt-14-2055-2021, 2021.
Petrenko, V., Neff, P., Etheridge, D., Smith, A., Buizert, C, Murray, L., Trudinger, C., Shi, M., Crosier, E., Hmiel, B., Thornton, D., Jong, L., van Ommen, T., Curran, M., Moy, A., Plummer, C., Nation, M., Beaudette, R., Harth, Langenfelds, R., Mitrevski, B., Dyonisius, M., Ng, J., Severinghaus, J. P., and Weiss, R.: Insights into the preindustrial atmospheric methane sources and sinks from 14CH4 and 14CO measurements at Law Dome, Antarctica, AGU Fall Meeting, San Francisco, December 2023, https://agu.confex.com/agu/fm23/meetingapp.cgi/Paper/1391486 (last access: July 2024), 2023.
Petrenko, V. V., BenZvi, S., Dyonisius, M., Hmiel, B., Smith, A. M., and Buizert, C.: The potential of in situ cosmogenic 14CO in ice cores as a proxy for galactic cosmic ray flux variations, EGUsphere [preprint], https://doi.org/10.5194/egusphere-2023-3126, 2024.
Petron, G., Lang, P. M., and Dlugokencky, E.: NOAA GML Carbon Monoxide surface flask data, https://gml.noaa.gov/dv/iadv/, last access: December 2018.
Prokopiou, M., Martinerie, P., Sapart, C. J., Witrant, E., Monteil, G., Ishijima, K., Bernard, S., Kaiser, J., Levin, I., Blunier, T., Etheridge, D., Dlugokencky, E., van de Wal, R. S. W., and Röckmann, T.: Constraining N2O emissions since 1940 using firn air isotope measurements in both hemispheres, Atmos. Chem. Phys., 17, 4539–4564, https://doi.org/10.5194/acp-17-4539-2017, 2017.
Raynaud, D., Chappellaz, J., Ritz, C., and Martinerie, P.: Air content along the Greenland Ice Core Project core: A record of surface climatic parameters and elevation in central Greenland, J. Geophys. Res., 102, 26607–26613, 1997.
Severinghaus, J. P. and Battle, M. O.: Fractionation of gases in polar ice during bubble close-off: New constraints from firn air Ne, Kr and Xe observations, Earth Planet. Sci. Lett., 244, 474–500, 2006.
Severinghaus, J. P., Grachev, A., and Battle, M.: Thermal fractionation of air in polar firn by seasonal temperature gradients, Geochem. Geophys. Geosys., 2, 2000GC000146, https://doi.org/10.1029/2000GC000146, 2001.
Siegenthaler, U., Monnin, E., Kawamura, K., Spahni, R., Schwander, J., Stauffer, B., Stocker, T. F., Barnola, J. M., and Fischer, H.: Supporting evidence from the EPICA Dronning Maud Land ice core for atmospheric CO2 changes during the past millennium, Tellus B, 57, 51–57, 2005.
Smith, A. M., Levchenko, V. A., Etheridge, D. M., Lowe, D. C., Hua, Q., Trudinger, C. M., Zoppi, U., and Elcheikh, A.: In search of in-situ radiocarbon in Law Dome ice and firn, Nucl. Instrum. Meth. B, 172, 610–622, 2000.
Smith, A. M., Hua, Q., Williams, A., Levchenko, V., and Yang, B.: Developments in micro-sample 14C AMS at the ANTARES AMS facility, Nucl. Instrum. Meth. B, 268, 919–923, 2010.
Stoll, N., Eichler, J., Horhold, M., Shigeyama, W., and Weikusat, I.: A Review of the Microstructural Location of Impurities in Polar Ice and Their Impacts on Deformation, Front. Earth Sci., 8, 615613, https://doi.org/10.3389/feart.2020.615613, 2021.
Stone, J. O.: Air pressure and cosmogenic isotope production, J. Geophys. Res., 105, 23753–23759, 2000.
Stuiver, M. and Polach, H. A.: Reporting of 14C Data – Discussion, Radiocarbon, 19, 355–363, 1977.
Svalgaard, L. and Schatten, K. H.: Reconstruction of the Sunspot Group Number: The Backbone Method, Sol. Phys., 291, 2653–2684, 2016.
van de Wal, R. S. W., Meijer, H. A. J., de Rooij, M., and van der Veen, C.: Radiocarbon analyses along the EDML ice core in Antarctica, Tellus B, 59, 157–165, 2007.
van der Kemp, W. J. M., Alderliesten, C., van der Borg, K., Holmlund, P., de Jong, A. F. M., Karlof, L., Lamers, R. A. N., Oerlemans, J., Thomassen, M., and van de Wal, R. S. W.: Very little in situ produced radiocarbon retained in accumulating Antarctic ice, Nucl. Instrum. Meth. B, 172, 632–636, 2000.
van der Kemp, W. J. M., Alderliesten, C., van der Borg, K., de Jong, A. F. M., Lamers, R. A. N., Oerlemans, J., Thomassen, M., and van de Wal, R. S. W.: In situ produced 14C by cosmic ray muons in ablating Antarctic ice, Tellus B, 54, 186–192, 2002.
Vimont, I. J., Turnbull, J. C., Petrenko, V. V., Place, P. F., Karion, A., Miles, N. L., Richardson, S. J., Gurney, K., Patarasuk, R., Sweeney, C., Vaughn, B., and White, J. W. C.: Carbon monoxide isotopic measurements in Indianapolis constrain urban source isotopic signatures and support mobile fossil fuel emissions as the dominant wintertime CO source, Elem. Sci. Anth., 5, 63, https://doi.org/10.1525/elementa.136, 2017.
Wilson, A. T. and Donahue, D. J.: Ams Radiocarbon Dating of Ice – Validity of the Technique and the Problem of Cosmogenic Insitu Production in Polar Ice Cores, Radiocarbon, 34, 431–435, 1992.
Young, N. E., Schaefer, J. M., Goehring, B., Lifton, N., Schimmelpfennig, I., and Briner, J. P.: West Greenland and global in situ 14C production-rate calibrations, J. Quatern. Sci., 29, 401–406, 2014.
- Abstract
- Introduction to 14C in glacial ice and firn and motivation for studies of 14CO in ice
- Sample collection, analyses and calculation of 14CO concentration
- Model characterization of firn and ice 14CO
- Results and discussion
- Conclusions
- Code availability
- Data availability
- Author contributions
- Competing interests
- Disclaimer
- Special issue statement
- Acknowledgements
- Financial support
- Review statement
- References
- Supplement