the Creative Commons Attribution 4.0 License.
the Creative Commons Attribution 4.0 License.
 | 24 Jul 2024
Greenland's firn responds more to warming than to cooling
Megan Thompson-Munson
Jennifer E. Kay
Bradley R. Markle
The porous layer of snow and firn on the Greenland Ice Sheet stores meltwater and limits the rate at which the ice sheet contributes to sea level rise. This buffer is threatened in a warming climate. To better understand the nature and timescales of firn's response to air temperature change on the Greenland Ice Sheet, we use a physics-based model to assess the effects of atmospheric warming and cooling on Greenland's firn air content in idealized climate experiments. We identify an asymmetric response of Greenland's firn to air temperature: firn loses more air content due to warming compared to the amount gained from commensurate cooling. 100 years after a 1 °C temperature perturbation, warming decreases the spatially integrated air content by 9.7 %, and cooling increases it by 8.3 %. In dry firn, this asymmetry is driven by the highly nonlinear relationship between temperature and firn compaction, as well as the dependence of thermal conductivity on the composition of the firn. The influence of liquid water accentuates this asymmetry. In wet firn areas, melt increases nonlinearly with atmospheric warming, thus enhancing firn refreezing and further warming the snowpack through increased latent heat release. Our results highlight the vulnerability of Greenland firn to temperature change and demonstrate that firn air content is more efficiently depleted than generated. This asymmetry in the temperature–firn relationship may contribute to the overall temporally asymmetric mass change of the Greenland Ice Sheet in a changing climate across many timescales.
- Article
(11341 KB) - Full-text XML
- BibTeX
- EndNote


The Greenland Ice Sheet exhibits temporally asymmetric mass changes closely tied to temperature changes (Alley et al., 2010). Specifically, the ice sheet gradually gains mass in periods of cooling and rapidly loses mass in periods of warming (Alley et al., 2010; Broecker and Van Donk, 1970). Mass change occurs through the combination of ice discharge across grounding lines and mass fluxes at the ice sheet surface. The energy balance at the surface controls the production of meltwater that eventually runs off to contribute to sea level rise.
While atmospheric warming drives enhanced meltwater runoff on Greenland (Hanna et al., 2008), not all meltwater generated at the surface runs off into the ocean. A layer of porous snow and firn covers most of the ice sheet and partly buffers the contribution to sea level rise by storing meltwater (Harper et al., 2012). Firn is the transitional material between fresh snow and glacial ice, and its porous nature allows for the retention of meltwater in pore space (Pfeffer et al., 1991). When melting occurs in areas covered by firn, the meltwater can percolate into the snowpack and remain liquid within a firn aquifer (Forster et al., 2014) or refreeze within the pore space (Pfeffer et al., 1991). In either case, firn can store meltwater if pore space is available, and it can limit and/or delay the ice sheet's contribution to sea level rise (Harper et al., 2012).
The efficiency of firn to retain meltwater depends on firn properties like air content. Changes to firn air content are in part driven by compaction, in which overburden stress compresses firn. Air temperature and accumulation have strong controls on the compaction rate (Herron and Langway, 1980) and lead to temporal variations in both density (e.g., Vandecrux et al., 2018) and air content (e.g., Thompson-Munson et al., 2023b). Compaction is the primary means of densification in the colder dry areas of Greenland, but the presence of meltwater in warmer areas introduces additional processes that alter firn properties. When meltwater fills and refreezes within the firn it releases latent heat that increases the firn temperature and enhances the compaction rate (Pfeffer and Humphrey, 1996). Thus, firn air content is reduced by both the occupation of pore space by water and the intensified compaction from the latent heat released during the refreezing of that meltwater.
Recent observed warming in Greenland demonstrates the importance of firn–climate interactions. Greenland has experienced rising temperatures (Trusel et al., 2018), and the influence of this atmospheric warming on the firn layer has been observed. For example, meltwater percolation and refreezing have caused recent firn warming in several regions of the ice sheet (Charalampidis et al., 2016; Humphrey et al., 2012; Polashenski et al., 2014). In the high-melt areas of southeast Greenland where firn has warmed enough to substantially reduce its cold content, reduced refreezing of meltwater has led to the expansion of firn aquifers (Horlings et al., 2022). Atmospheric warming and enhanced meltwater production have also increased the firn–ice content through the refreezing of meltwater within the firn (Graeter et al., 2018; de la Peña et al., 2015). With enough refreezing, discontinuous ice lenses and layers can grow into near-surface, low-permeability ice slabs that block access to deeper pore space (Machguth et al., 2016) and amplify runoff (MacFerrin et al., 2019). Recent high-melt years are responsible for the expansion and thickening of these ice slabs (Jullien et al., 2023) as well as the resultant reduced permeability that inhibits meltwater retention in the firn (Culberg et al., 2021). These climate-driven changes have caused a reduction of Greenland's firn air content since the early 2000s (Thompson-Munson et al., 2023b), especially along the western margin of the ice sheet (Vandecrux et al., 2019).
Our current climate offers the opportunity to observe firn–climate interactions influenced by a warming atmosphere. However, advancing our understanding of these interactions in a cooling climate using modern observations is not possible. Yet, Greenland firn's behavior in a cooling climate is equally important to understand and is especially interesting to contrast with firn behavior in a warming climate. Thus, the primary goal of this work is to contrast the processes affecting the firn response to atmospheric warming and cooling using modern modeling tools. Our work provides additional insights into firn's influence on ice sheet mass changes in response to air temperature change that are not available from the modern instrumental record. From our modeling, we find that firn processes contribute to the overall asymmetry of the Greenland Ice Sheet response to atmospheric warming and cooling. Specifically, temperature–firn interactions amplify pore-space loss more in a warming climate than they amplify pore-space gain in a cooling climate. This asymmetric air temperature influence on firn pore space has important implications for Greenland mass loss and gain.
2.1 Firn model description
We use a single-column, multi-layer, physics-based model called SNOWPACK (Bartelt and Lehning, 2002; Lehning et al., 2002a, b) to simulate time-evolving firn properties across the entire Greenland Ice Sheet. Previous studies have used SNOWPACK to model snow and firn processes in both Antarctica (Banwell et al., 2023; Dunmire et al., 2020, 2024; Keenan et al., 2021; Maclennan et al., 2023; Van Wessem et al., 2021; Wever et al., 2022) and Greenland (Dunmire et al., 2021; Groot Zwaaftink et al., 2013; Izeboud et al., 2020; Steger et al., 2017; Thompson-Munson et al., 2023b; Van Tricht et al., 2016). This one-dimensional model uses a meteorological dataset as input and operates within a Lagrangian framework in which a new layer is added when precipitation occurs. The density of the new layer is calculated from the atmospheric forcing and considers the effects of blowing snow on compaction (Keenan et al., 2021; Wever et al., 2022). Within the simulated firn column, densification is calculated with a constitutive relationship between stress and strain in snow, and SNOWPACK solves the partial differential equations that describe mass, energy, and momentum conservation (Bartelt and Lehning, 2002; Lehning et al., 2002b). Snow and firn microstructure governs physical properties like the thermal conductivity and is captured in the model's description of grain radius, bond radius, sphericity, and dendricity (Lehning et al., 2002a).
SNOWPACK contains its own surface energy balance scheme, which is used to calculate the upper boundary condition for the firn temperature. It uses this energy balance model to calculate melt in a way that incorporates several processes, including accumulation, snow–albedo feedback, percolation, and latent heat release (Wever et al., 2014, 2015, 2016). To represent the vertical flow of liquid water throughout the firn, we apply a bucket scheme in which liquid water is moved downward when a layer's water-holding capacity is exceeded. While other more complex approaches to governing meltwater percolation exist (e.g., Wever et al., 2014), we choose the simpler and more computationally efficient bucket scheme because its performance is not substantially different from others (Verjans et al., 2019) and allows us to use SNOWPACK with a setup that has been previously evaluated (Thompson-Munson et al., 2023b). Following existing work, we use a variable-thickness layer merging scheme (Steger et al., 2017), a surface roughness of 0.002 m, and stability corrections from Michlmayr et al. (2008) and Stearns and Weidner (1993). Additional explanations of the modeling framework can be found in Thompson-Munson et al. (2023b), which uses the same model parameters and settings as the present work.
2.2 Firn model atmospheric forcing
We use atmospheric reanalysis data from the Modern-Era Retrospective Analysis for Research and Applications version 2 (MERRA-2, Gelaro et al., 2017) as the foundation to force our idealized SNOWPACK firn model experiments. MERRA-2 (available 1980–present) is a global, gridded reanalysis product with a horizontal resolution of 0.5° latitude by 0.625° longitude. We focus this study on the Greenland Ice Sheet and use only grid cells with a MERRA-2 ice coverage of at least 50 %.
The SNOWPACK firn model requires several atmospheric variables as input and uses the MeteoIO library (Bavay and Egger, 2014) to prepare the MERRA-2 forcing data. Since SNOWPACK requires input at half-hourly time steps, the hourly MERRA-2 data are converted to a higher frequency using nearest-neighbor and linear interpolations. MeteoIO reads in 15 MERRA-2 variables (Global Modeling and Assimilation Office (GMAO), 2015d, b, c, a) and, for each grid cell, outputs a time series of air temperature, humidity, zonal wind, meridional wind, incoming shortwave radiation, incoming longwave radiation, precipitation, and the precipitation phase. We use these prepared atmospheric forcing data as the basis for generating the synthetic forcings.
2.3 Firn model experiments
For our idealized experiments, we require a realistic but constant climate forcing with a complete seasonal and diurnal cycle but no interannual variability or trends. To generate this synthetic forcing, we select hourly MERRA-2 data from a 1-year period spanning 1 January 1991 through 31 December 1991 (Fig. A1). We choose this period because the net change in firn air content over this year-long period is negligible (Thompson-Munson et al., 2023b), which limits the potential introduction of significant trends in the atmospheric data to the synthetic forcing. We verified that this choice of the model year has a negligible impact on the control climate and on the idealized atmospheric warming and cooling experiments (not shown).
To spin up SNOWPACK, we force the model with this synthetic constant climate (MERRA-2 data from the year 1991) until at least 150 m of snow, firn, and ice has accumulated or the bottom 50 m of the simulated firn column is solid ice (density = 910 kg m−3) with a firn depth of at least 10 m. This 50 m threshold is greater than in the similar spin-up procedures used in Banwell et al. (2023) and Thompson-Munson et al. (2023b) in order to achieve a baseline snow, firn, and ice column in equilibrium that lacks any long-term trends. This procedure also filters out model grid cells that do not meet our chosen ice thickness and firn depth thresholds, which removes some ablation zone grid cells and leaves us with 1724 locations for running temperature experiments.
After the model spin-up, we run SNOWPACK for 100 years with the same constant climate of the year 1991 repeated 100 times. This initial century represents the control period. We then assess the influence of idealized temperature changes on the firn by running the model for an additional 100 years with a stepwise air temperature perturbation included. For a warming experiment, we increase the 2 m air temperature by 1 °C at t=100 years. In a cooling experiment, we decrease the 2 m air temperature by 1 °C at t=100 years. As such, each of the 1724 grid cells has a 100-year control period preceding 100-year warming and cooling periods. Note that we do not alter any other forcing variables, and we use “air temperature” to refer to 2 m air temperature. We assess how air temperature perturbations impact the firn air content, which we calculate in the same manner as in Thompson-Munson et al. (2023b) and assume that all pore space is available for storing meltwater.
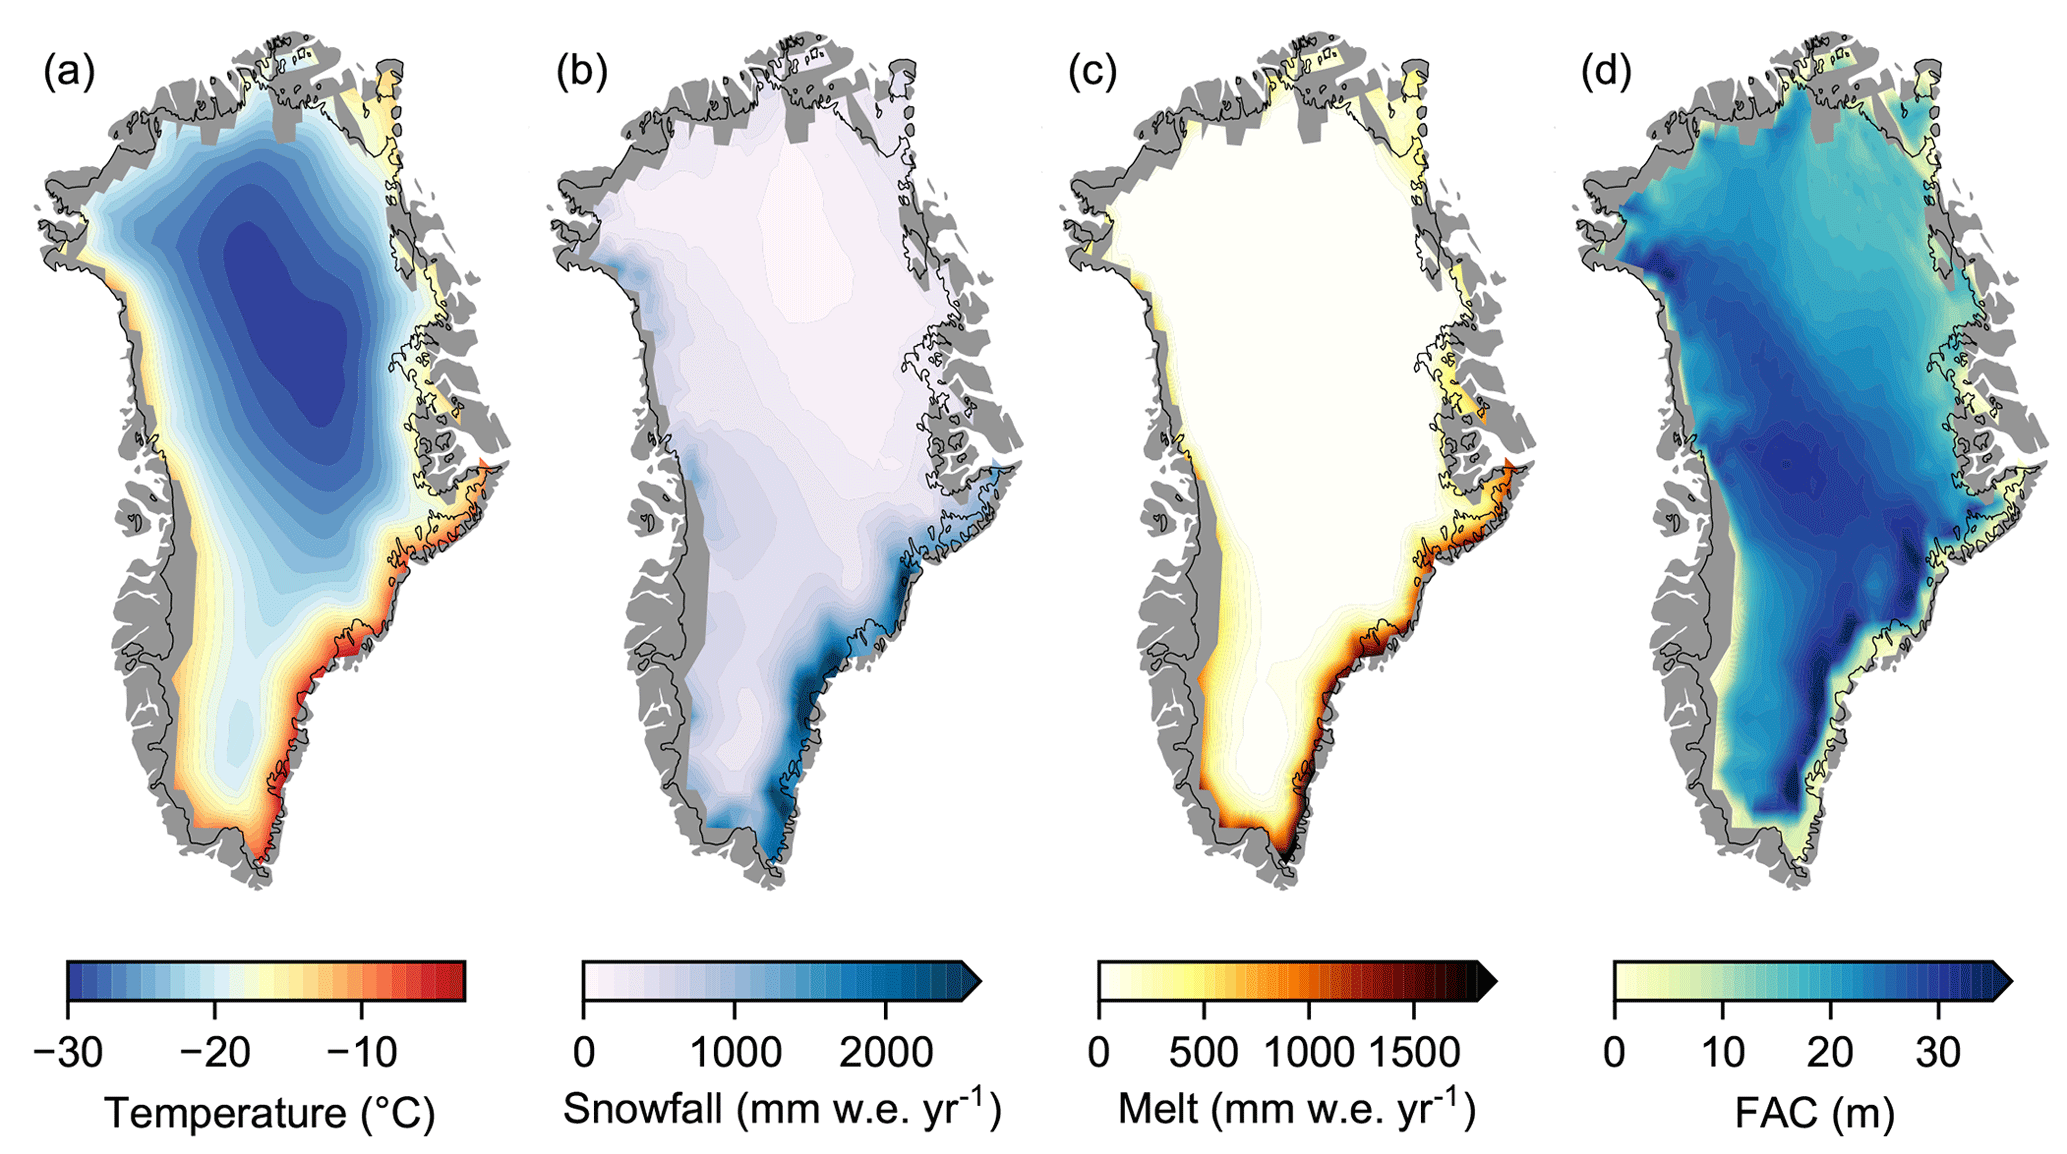
Figure 1Greenland Ice Sheet mean annual (a) temperature, (b) snowfall, (c) melt, and (d) firn air content (FAC) from the 100-year control climate (i.e., the 1991 climate) prior to the warming and cooling experiments. The thin black line represents the ice sheet outline. The data have been interpolated to more easily show spatial patterns. The original forcing resolution can be seen in Fig. 8.
3.1 Response of Greenland firn air content to idealized atmospheric warming and cooling
We first present the modeled ice sheet and climate mean state during the control period (i.e., for the 1991 climate) prior to any atmospheric warming or cooling to confirm the model behaves as expected (Fig. 1). The control air temperature and snowfall are both generated from MERRA-2 and reflect the geometry and topography of the ice sheet (Fig. 1a, b). Consistent with observations and other climate models (e.g., Hanna et al., 2021), the highest temperatures are along the low-elevation margins, and the lowest temperatures are found in the high-elevation ice sheet interior (Fig. 1a). The warmest areas within the model domain are along the steep southeastern margin, which is also where orographic precipitation causes the highest snowfall rates (>1000 mm w.e. yr−1) on the ice sheet (Fig. 1b). Moderate snowfall rates (500–1000 mm w.e. yr−1) occur in the south and along the western margin, but rates are very low (<500 mm w.e. yr−1) in Greenland's interior and in much of the north. While the temperature and snowfall are derived from MERRA-2 and used to force the SNOWPACK firn model, the melt and firn air content are calculated by the model (Fig. 1c, d). The most melt occurs in the southeast, and little to no melt is found in the ice sheet interior (Fig. 1c). Spatial variations in firn air content reflect the combined effect of snowfall and melt (Fig. 1d). We ensure that the idealized atmospheric forcing can produce firn air content values within the range of those previously simulated, and we find a mean a spatially integrated firn air content of 19.9±8.3 m and 35 621 km3, respectively, consistent with results from the SNOWPACK study that uses the same parameters over Greenland (Thompson-Munson et al., 2023b). In the present study's control period, firn air content ranges from 0.2 to 40.4 m. The highest values occur where snowfall is high but melt is low, and the lowest values are found along the margins in warm, high-melt areas (Fig. 1).
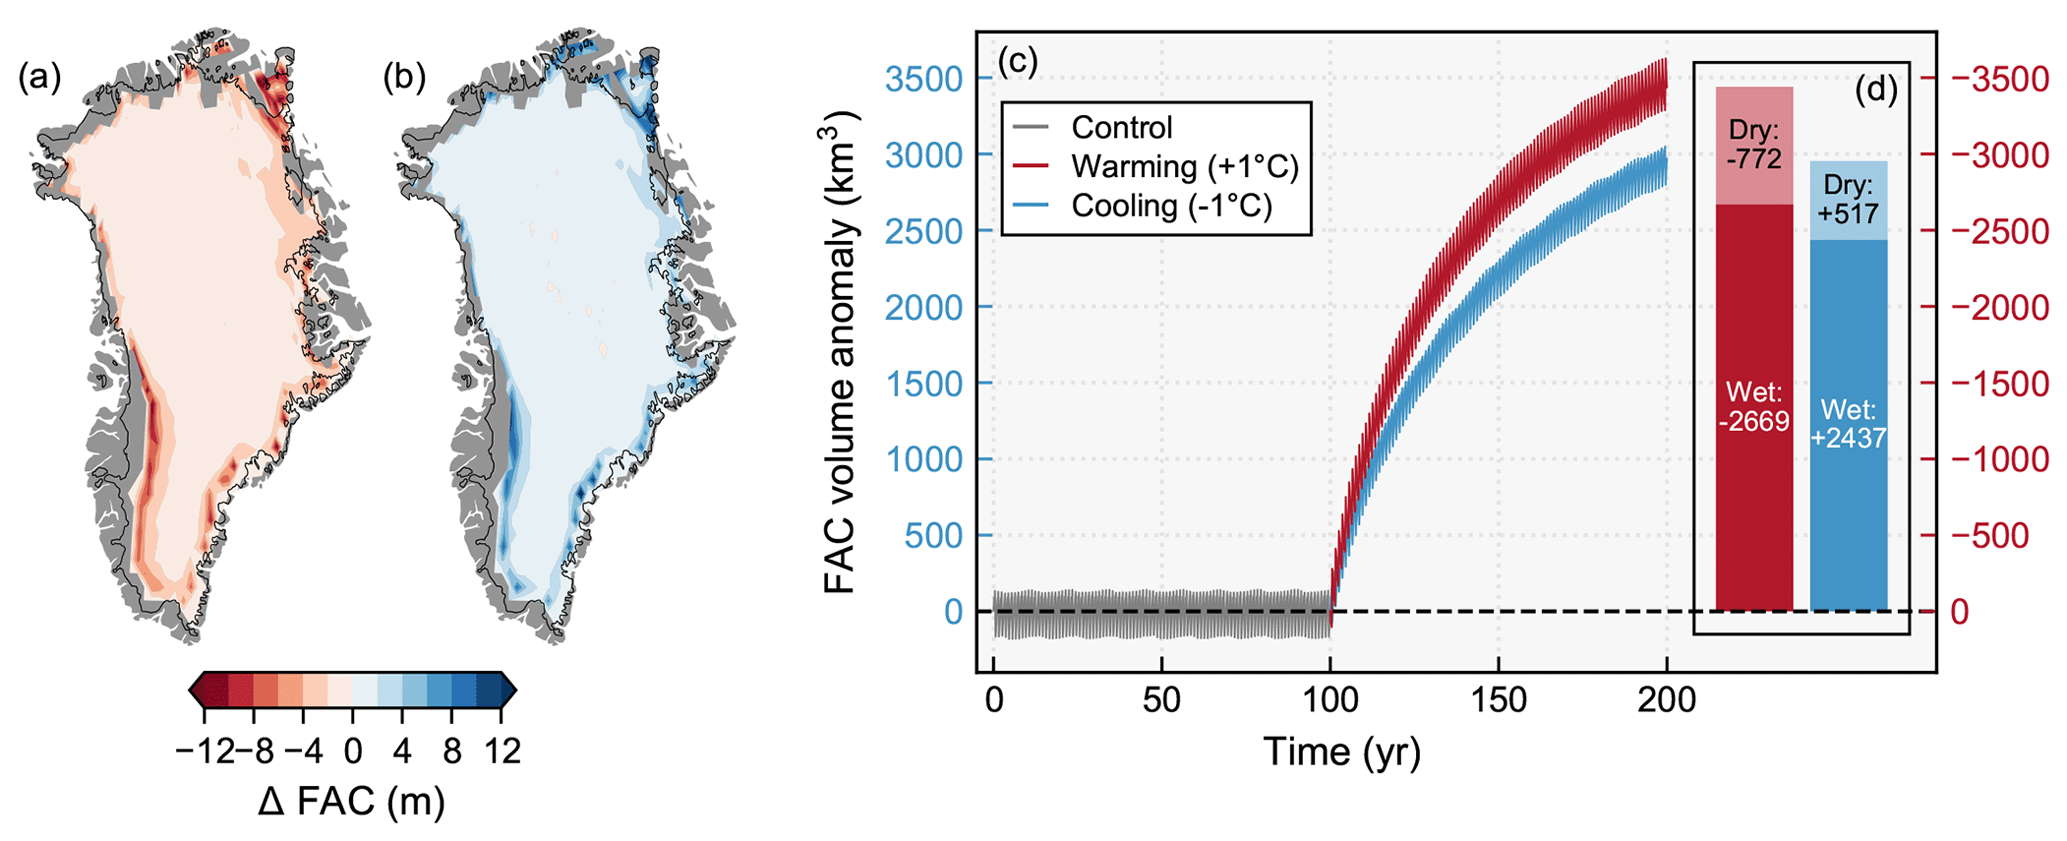
Figure 2Change in firn air content (FAC) for the Greenland Ice Sheet calculated as the final firn air content minus the mean of the control conditions for (a) warming by 1 °C and (b) cooling by 1 °C. The thin black line represents the ice sheet outline. The data have been interpolated to more easily show spatial patterns. The original forcing resolution can be seen in Fig. 8. (c) Time series of the firn air content volume anomaly integrated over the full ice sheet for the control (gray line), warming (red line), and cooling (blue line) periods. The control period and cooling experiment use the positive values on the left y axis and the warming experiment uses the negative values on the right y axis. (d) Changes in spatially integrated firn air content in km3 at the end of the experiments partitioned into wet firn (melt is present) and dry firn (melt is not present) areas for warming (red) and cooling (blue).
We next examine the changes in firn air content in response to idealized atmospheric warming and cooling. When perturbed from the control state (Fig. 1), idealized warming causes depletion of firn air content (Fig. 2a), while idealized cooling causes generation of firn air content (Fig. 2b) in all modeled grid cells in Greenland. The largest changes in both warming and cooling experiments occur along the margins of the ice sheet but slightly inland from the edge of the model domain since firn is not present at the lowest elevations. Warming and cooling also both lead to substantial change in the southwest where melt rates are high and in the southeast where snowfall is high (Fig. 1). While the firn air content responses to warming and cooling by 1 °C are opposite, they are not equal in magnitude (Fig. 2c). At the end of the experiments, the spatially integrated firn air content changes by −9.7 % (−3441 km3) in the warming scenario and by +8.3 % (+2954 km3) in the cooling scenario. The standard deviation of post-perturbation spatially integrated firn air content is also greater in warming (891 km3) than in cooling (769 km3).
In addition to responses integrated over the entire ice sheet, we also contrast the firn response where melt exists (“wet firn”) and where it does not exist (“dry firn”). The majority of firn air content change in both experiments occurs in wet firn rather than dry firn (Fig. 2d). Of the 3441 km3 of air volume lost to warming, 78 % (2669 km3) of the change occurs in wet firn and 22 % (772 km3) occurs in dry firn. For the 2954 km3 gained in cooling, 82 % (2437 km3) of the change occurs in wet firn and 18 % (517 km3) occurs in dry firn. Idealized warming causes a greater change in both wet and dry firn, and the change in wet firn is greater than the change in dry firn for both warming and cooling.
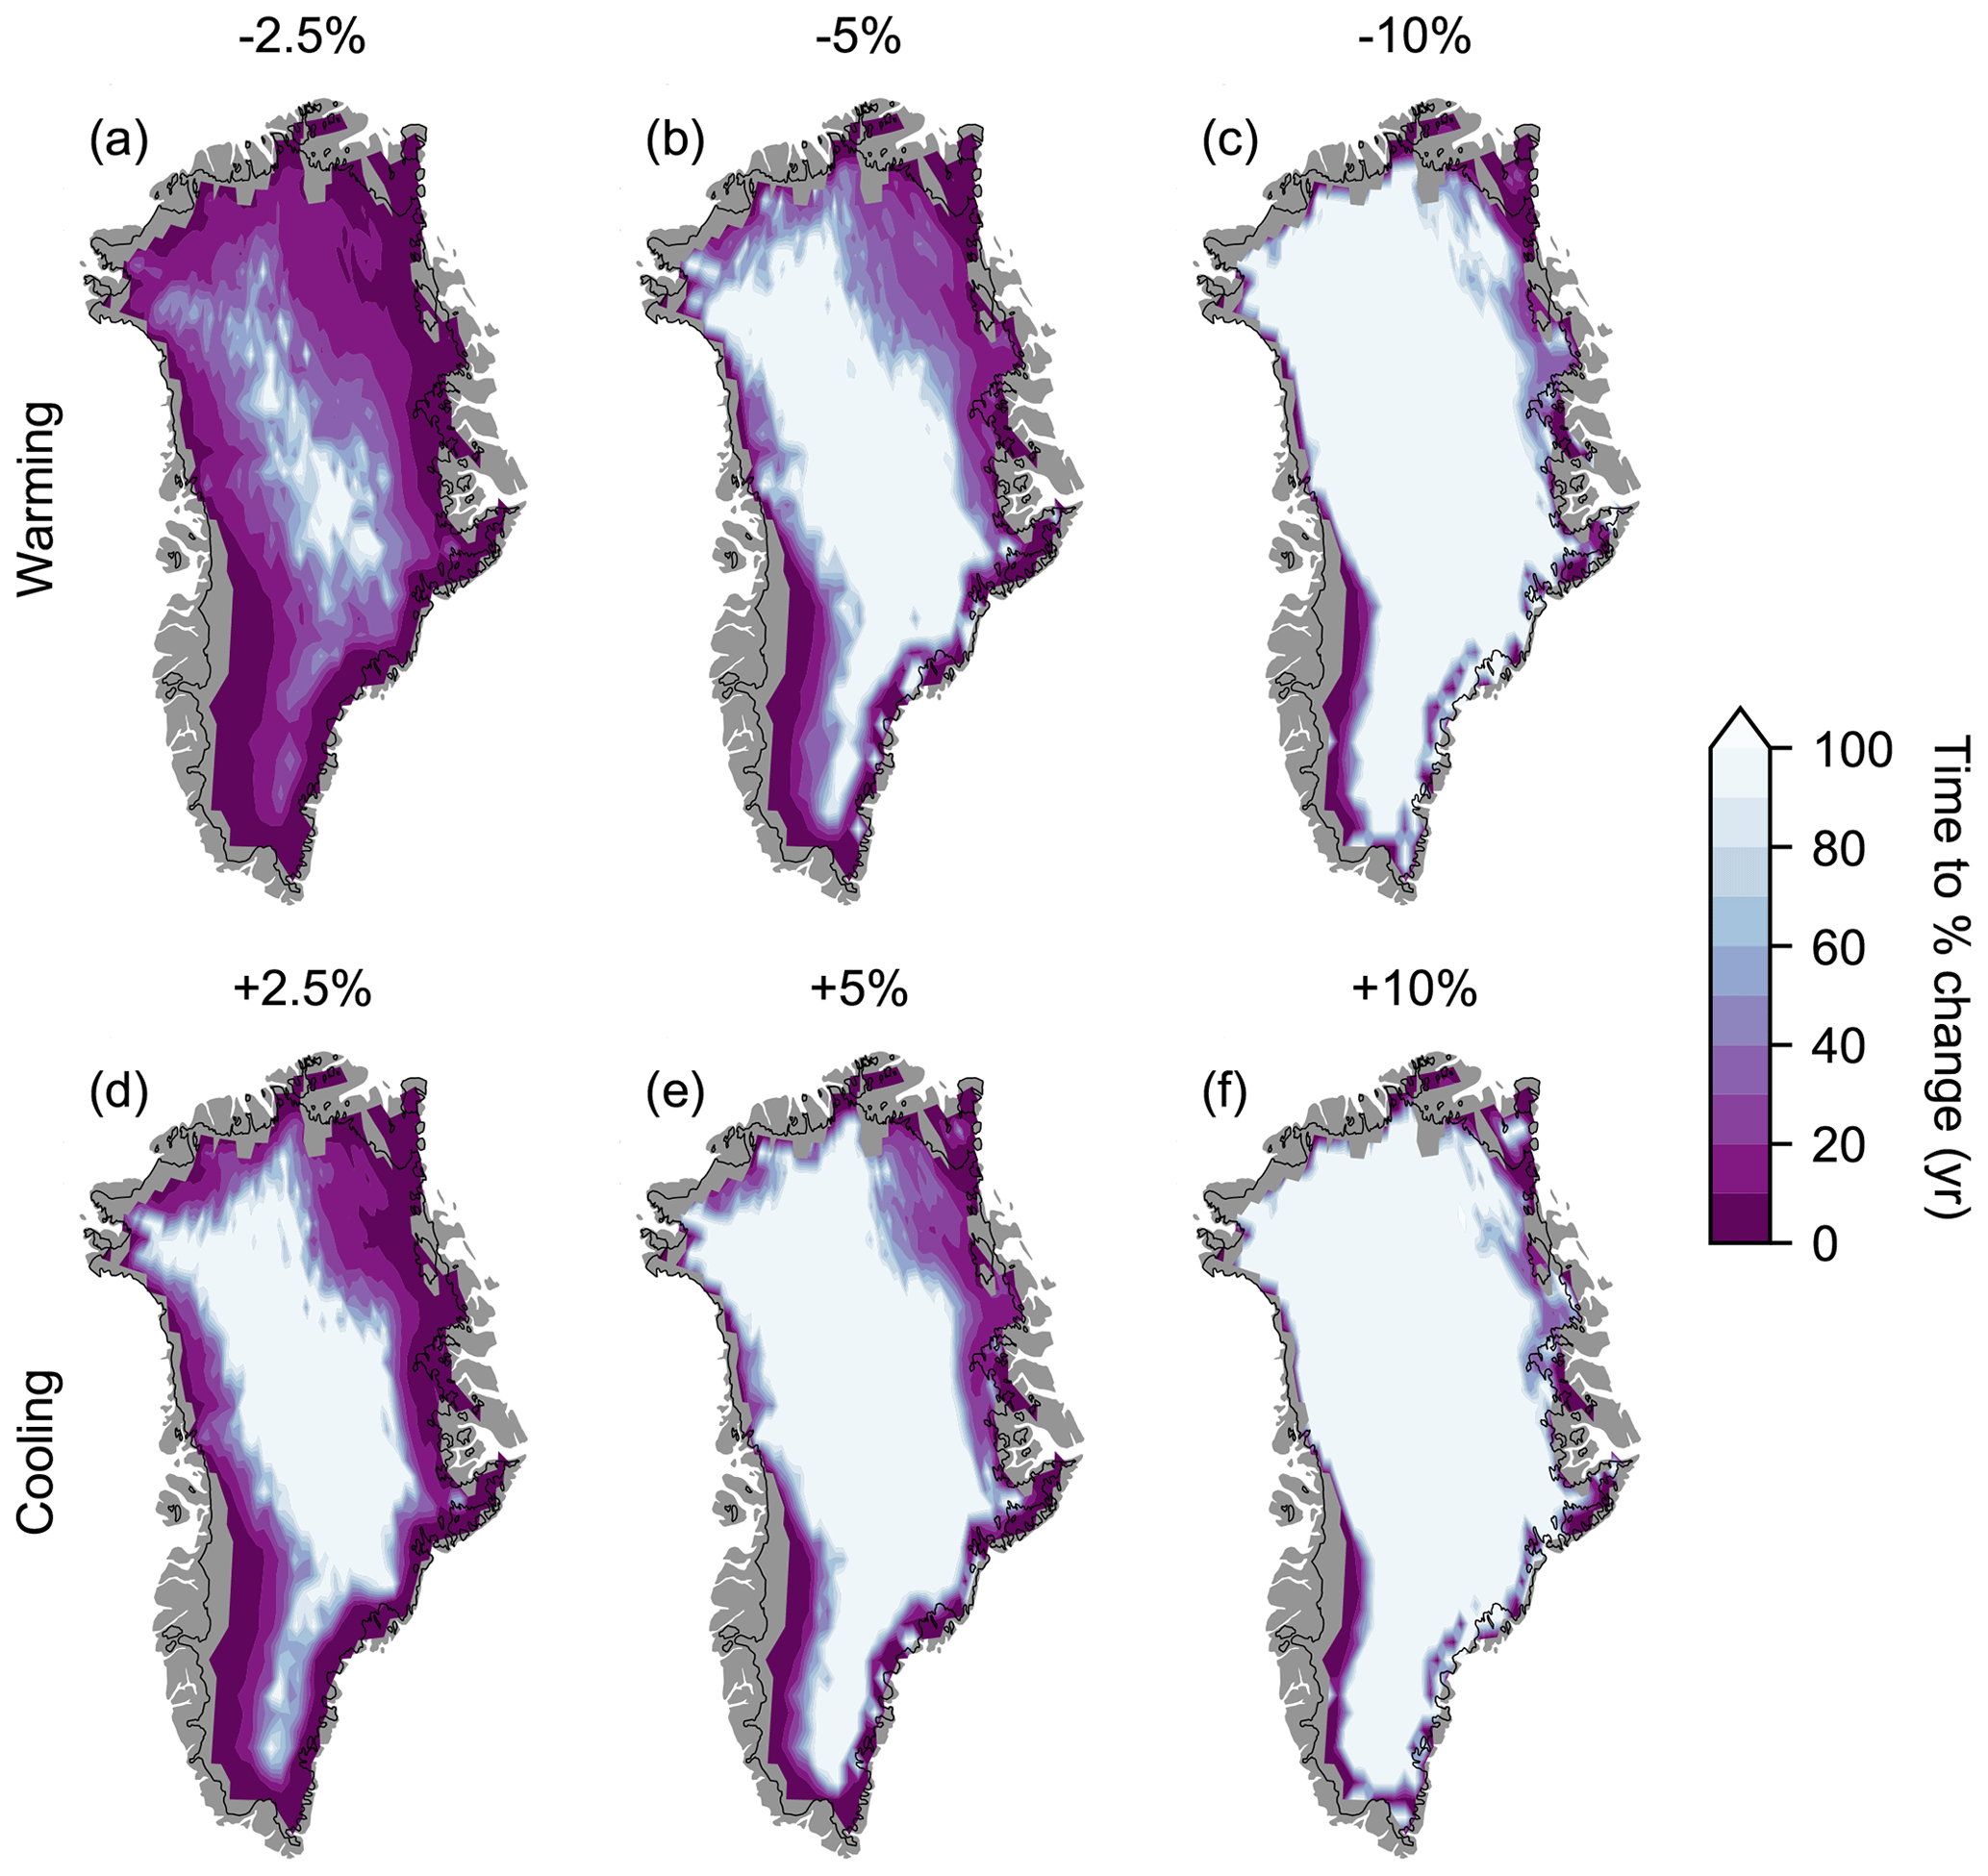
Figure 3Elapsed time to reach a given percent change (shown above each panel) in firn air content following the control mean. Results are shown from both (a–c) warming by 1 °C and (d–f) cooling by 1 °C. The lightest shading indicates that the given percent change has not been achieved within the 100-year warming or cooling experiment, and thus the elapsed time is >100 years. The thin black line represents the ice sheet outline. The data have been interpolated to more easily show spatial patterns. The original forcing resolution can be seen in Fig. 8.
To explore the timescales of firn air content changes, we contrast the rates of firn air content changes in response to atmospheric warming and cooling. In both experiments, firn air content rapidly changes in the years immediately following the temperature perturbation, and then the rate of change decreases with time as an equilibrium is slowly approached but not fully met within the 100-year experiment (Fig. 2c). We explore the spatial dependence on the rate of change by calculating the time elapsed until a given percent change is reached following the warming or cooling perturbation (Fig. 3). For all three values investigated (±2.5 %, ±5 %, ±10 %), more grid cells achieve the given percent change within the 100 years following the perturbation in warming (Fig. 3a–c) compared to cooling (Fig. 3d–f). Following warming, firn air content changes by at least 2.5 % in 97 % of the grid cells compared to 73 % due to cooling. For warming and cooling, 69 % and 51 %, respectively, of the locations change by at least 5 % within 100 years. Finally, only 36 % of the grid cells in the warming scenarios and 28 % in cooling reach a 10 % change in firn air content by the end of the simulations. Therefore, the firn air content response to warming is faster than its response to cooling. In both perturbation scenarios, the time required for firn air content to reach a given percent change is greatest in the interior (Fig. 3). The margins respond more quickly, with most grid cells reaching a ±2.5 %, ±5 %, or ±10 % change within a few decades. Notably, the southwest and northeast have some of the shortest elapsed times until a percent change is reached, and most grid cells in those areas change by at least ±10 % within 100 years.
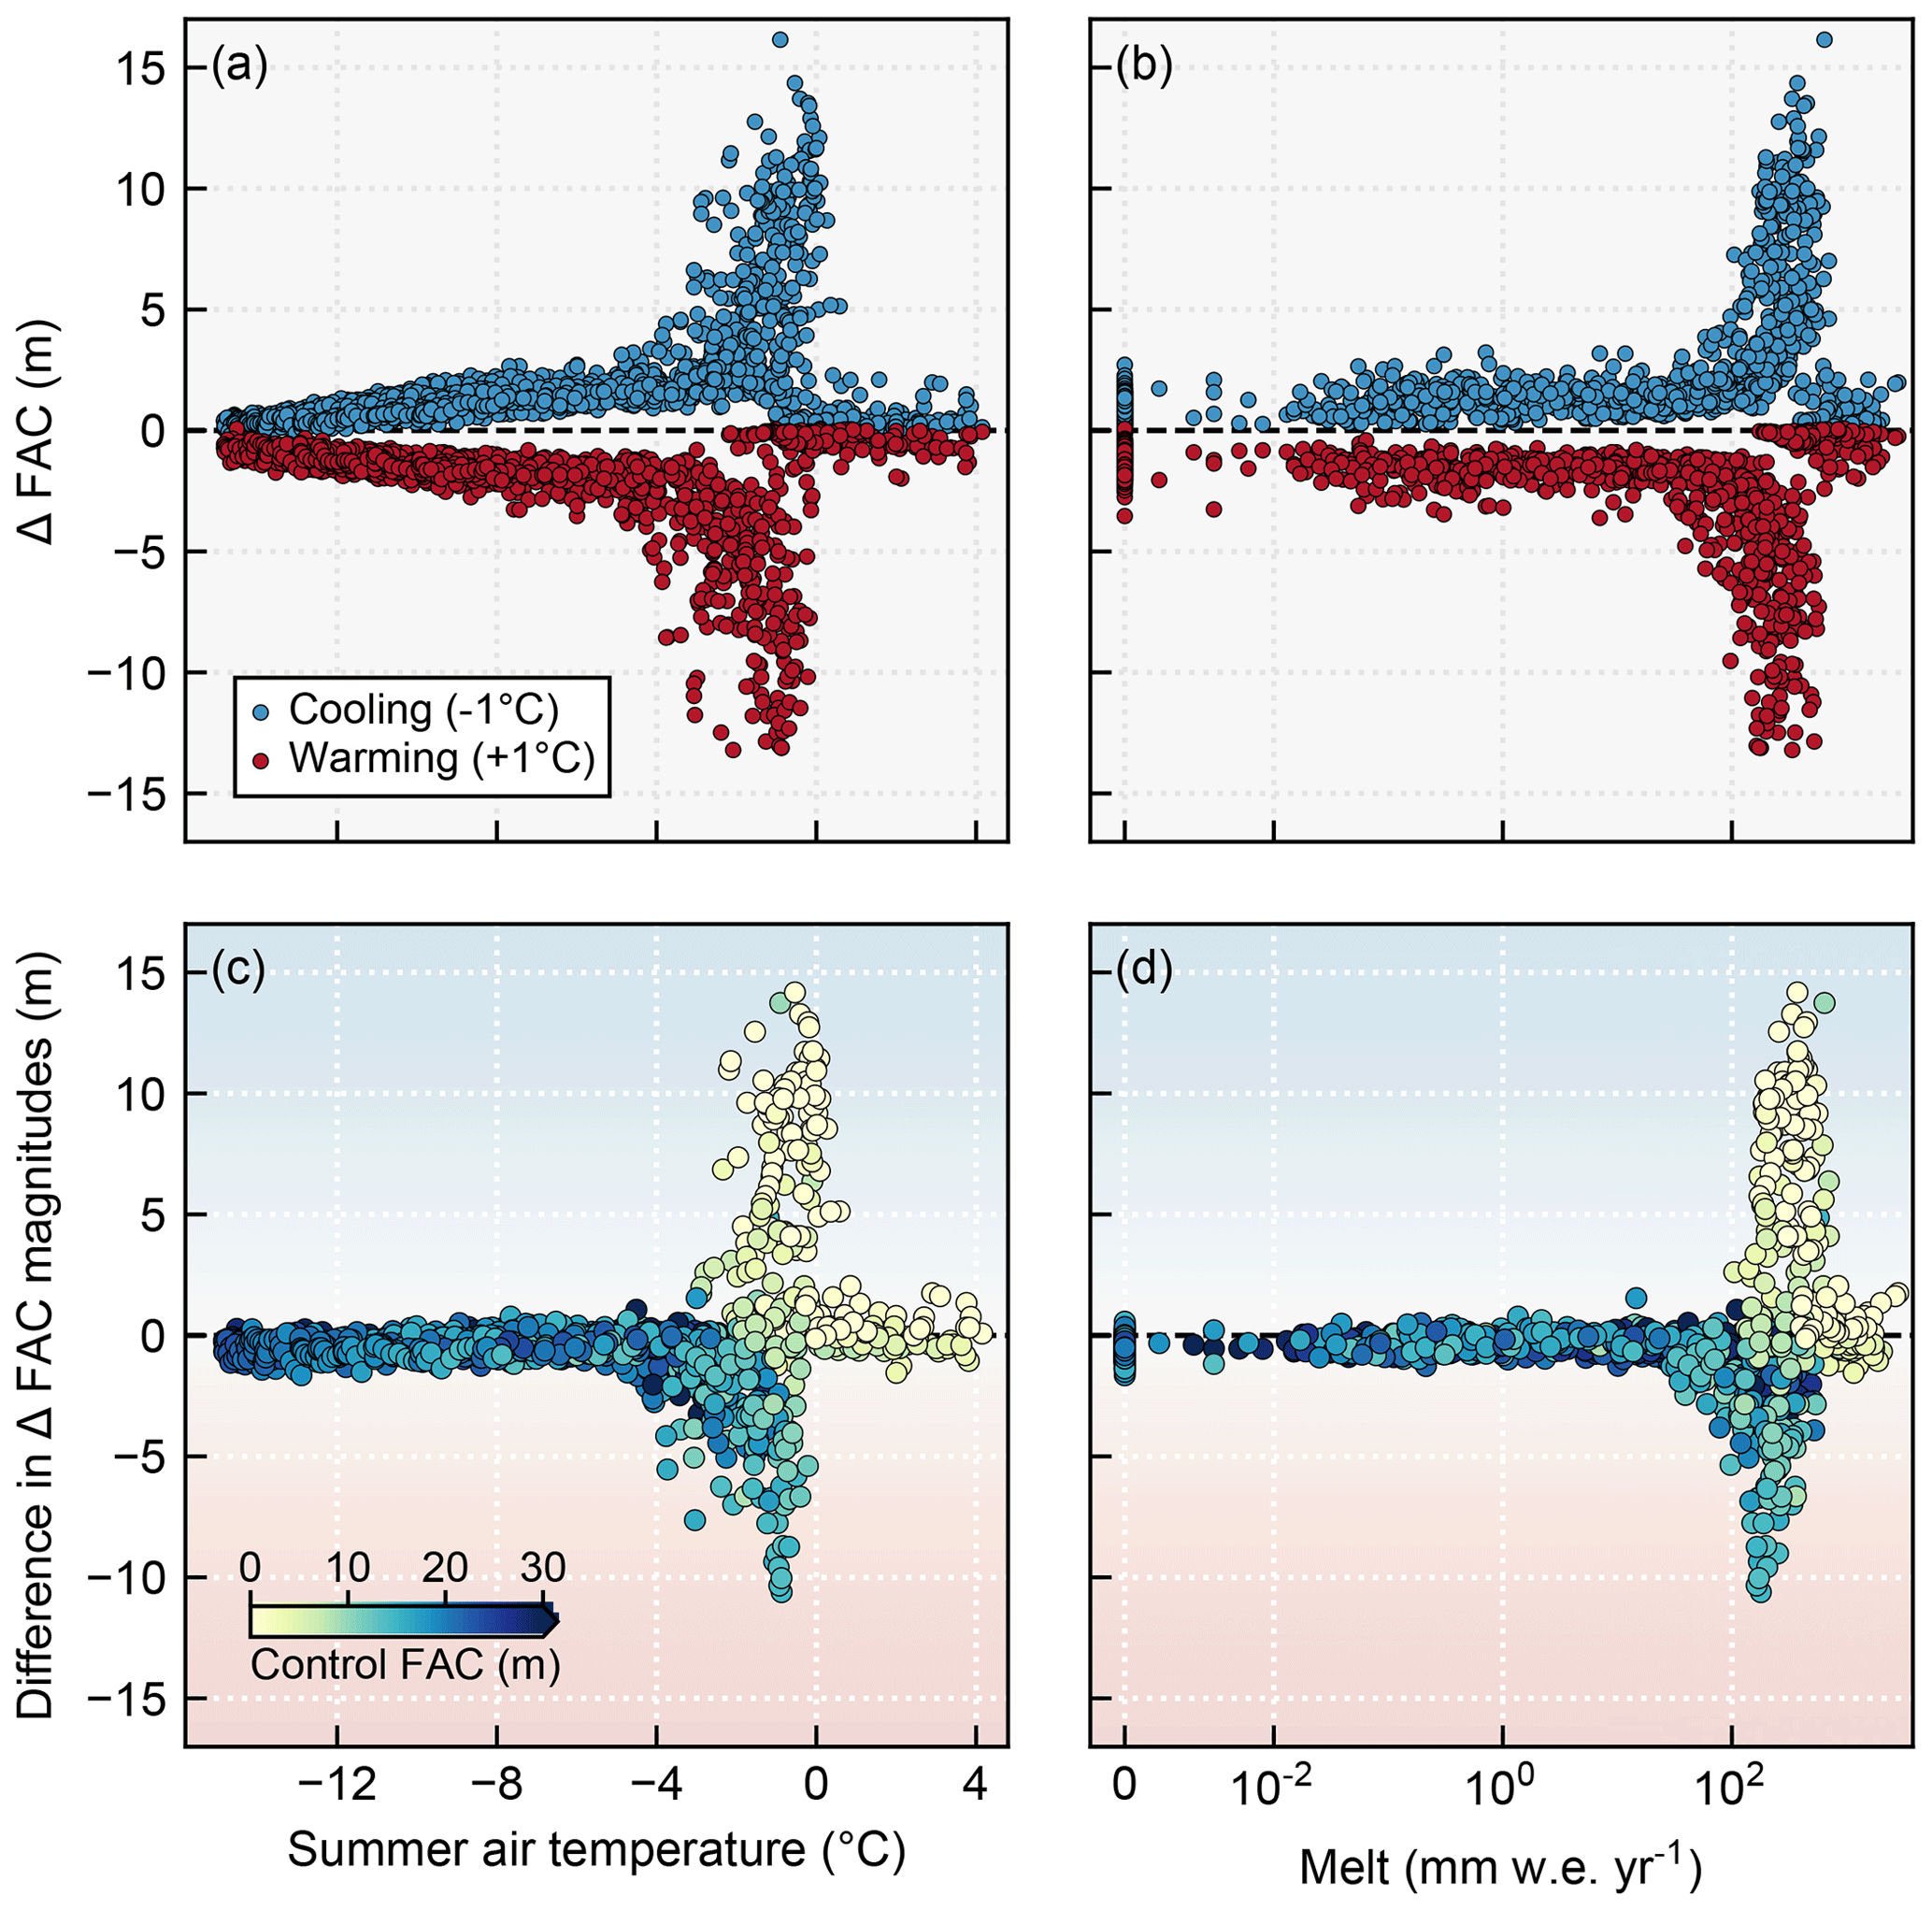
Figure 4(a, b) The change in firn air content (FAC) for each grid cell calculated as the final value minus the control mean as a function of the control mean (a) summer air temperature and (b) melt. Blue markers indicate the effect of cooling and red indicates the effect of warming. (c, d) The difference in the magnitudes of firn air content changes due to warming and cooling. The difference is calculated as the magnitude of the cooling change minus the magnitude of the warming change such that positive values indicate a greater response to cooling (blue background shading) and negative values indicate a greater response to warming (red background shading). The markers are colored by the control mean firn air content. Note the semi-logarithmic x scales used for melt in (b) and (d).
3.2 Drivers of Greenland firn air content changes
To understand the drivers of firn's response to idealized atmospheric warming and cooling, we examine firn changes as functions of control period summer air temperature and melt (Fig. 4). We first present the response of the colder (summer air temperatures °C) and drier (melt <50 mm w.e. yr−1) firn where the control period firn air content tends to be high (Fig. 4c, d). In these relatively cold and dry locations, the magnitude of the firn air content response to both warming and cooling is small (<5 m) but increases approximately linearly as summer air temperature increases (Fig. 4a). In contrast, the very low melt rates appear to have very little influence on the magnitude of the response (Fig. 4b). The effects of atmospheric warming and cooling are opposite, and their strengths are nearly equal, though the effect of warming is persistently slightly larger in magnitude (Fig. 4c, d). While this colder and drier firn has a relatively small response governed primarily by summer air temperature alone, this is not the case for the warmer and wetter areas (Fig. 4a, b). For regions with summer air temperatures between about −4 and 1 °C and with melt rates between about 50 and 600 mm w.e. yr−1, firn air content changes are very large (up to 16 m). Unlike in cold and dry firn, warm and wet firn responses to warming and cooling are not approximately equal in magnitude. Rather, the warming effect is greater where firn air content initially exists (≥1 m) in the control period, and the cooling response is greater where the control period firn air content is close to 0 m (Fig. 4c, d). At the very warmest and wettest locations (e.g., summer temperatures >1 °C and melt rates >600 mm w.e. yr−1), very little change in firn air content occurs in either warming or cooling, as very little air content initially exists (<1 m; Fig. 4c, d).
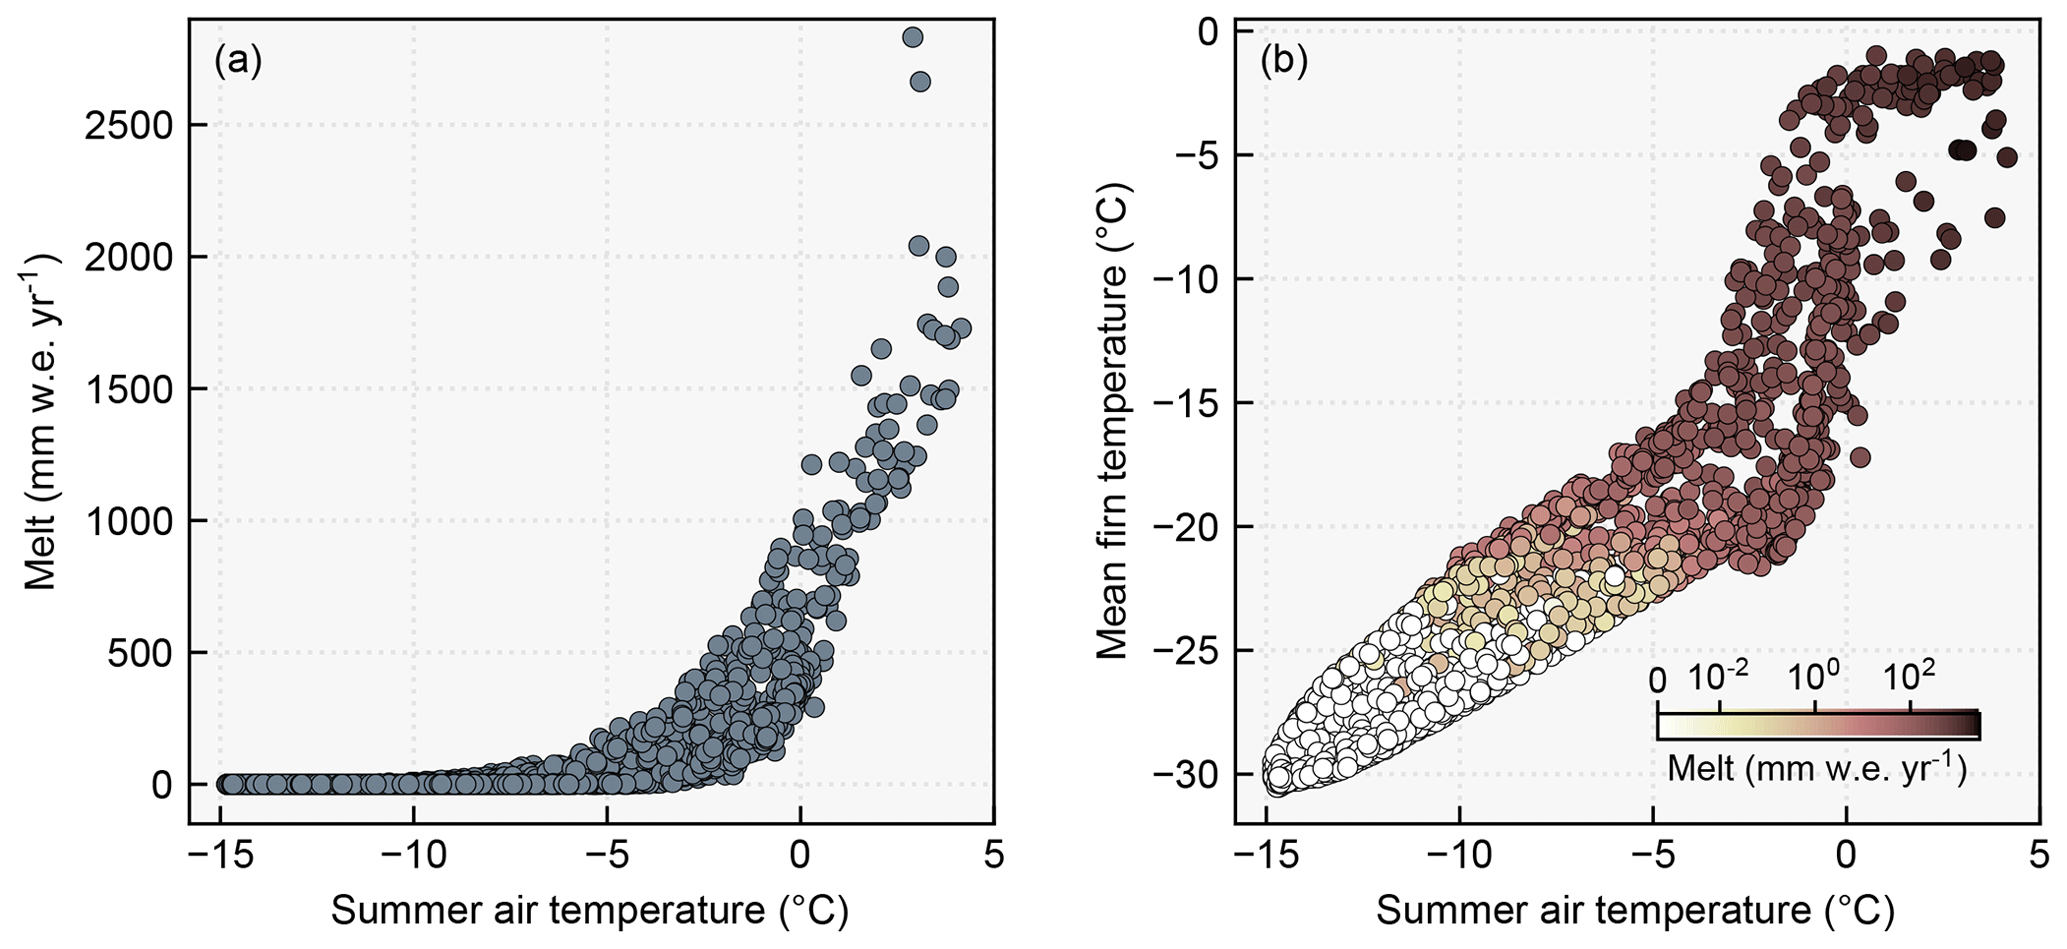
Figure 5Control mean (a) melt and (b) firn temperature as functions of the control mean summer air temperature for all modeled locations. The color of the points in (b) represents the control mean melt.
The similar effect of summer air temperature and melt on firn air content demonstrates the important connection between these two surface variables. Within the control period, areas with high summer air temperature have exponentially more melt (Fig. 5a). An additional nonlinear relationship exists between the control mean summer air temperature and mean temperature of the firn layer. Firn temperature increases approximately linearly with the air temperature in colder grid cells where melt is nonexistent or very small (Fig. 5b). However, when the air temperature exceeds °C, there is dramatic change in the relationship between air temperature and firn temperature. Unlike the air temperature and melt, which are both altered in the perturbation experiments either directly or via the model's surface energy balance, snowfall and rainfall are unchanged in our experimental design. Thus, as expected, only weak relationships exist between firn air content changes and these precipitation variables (Fig. A2).
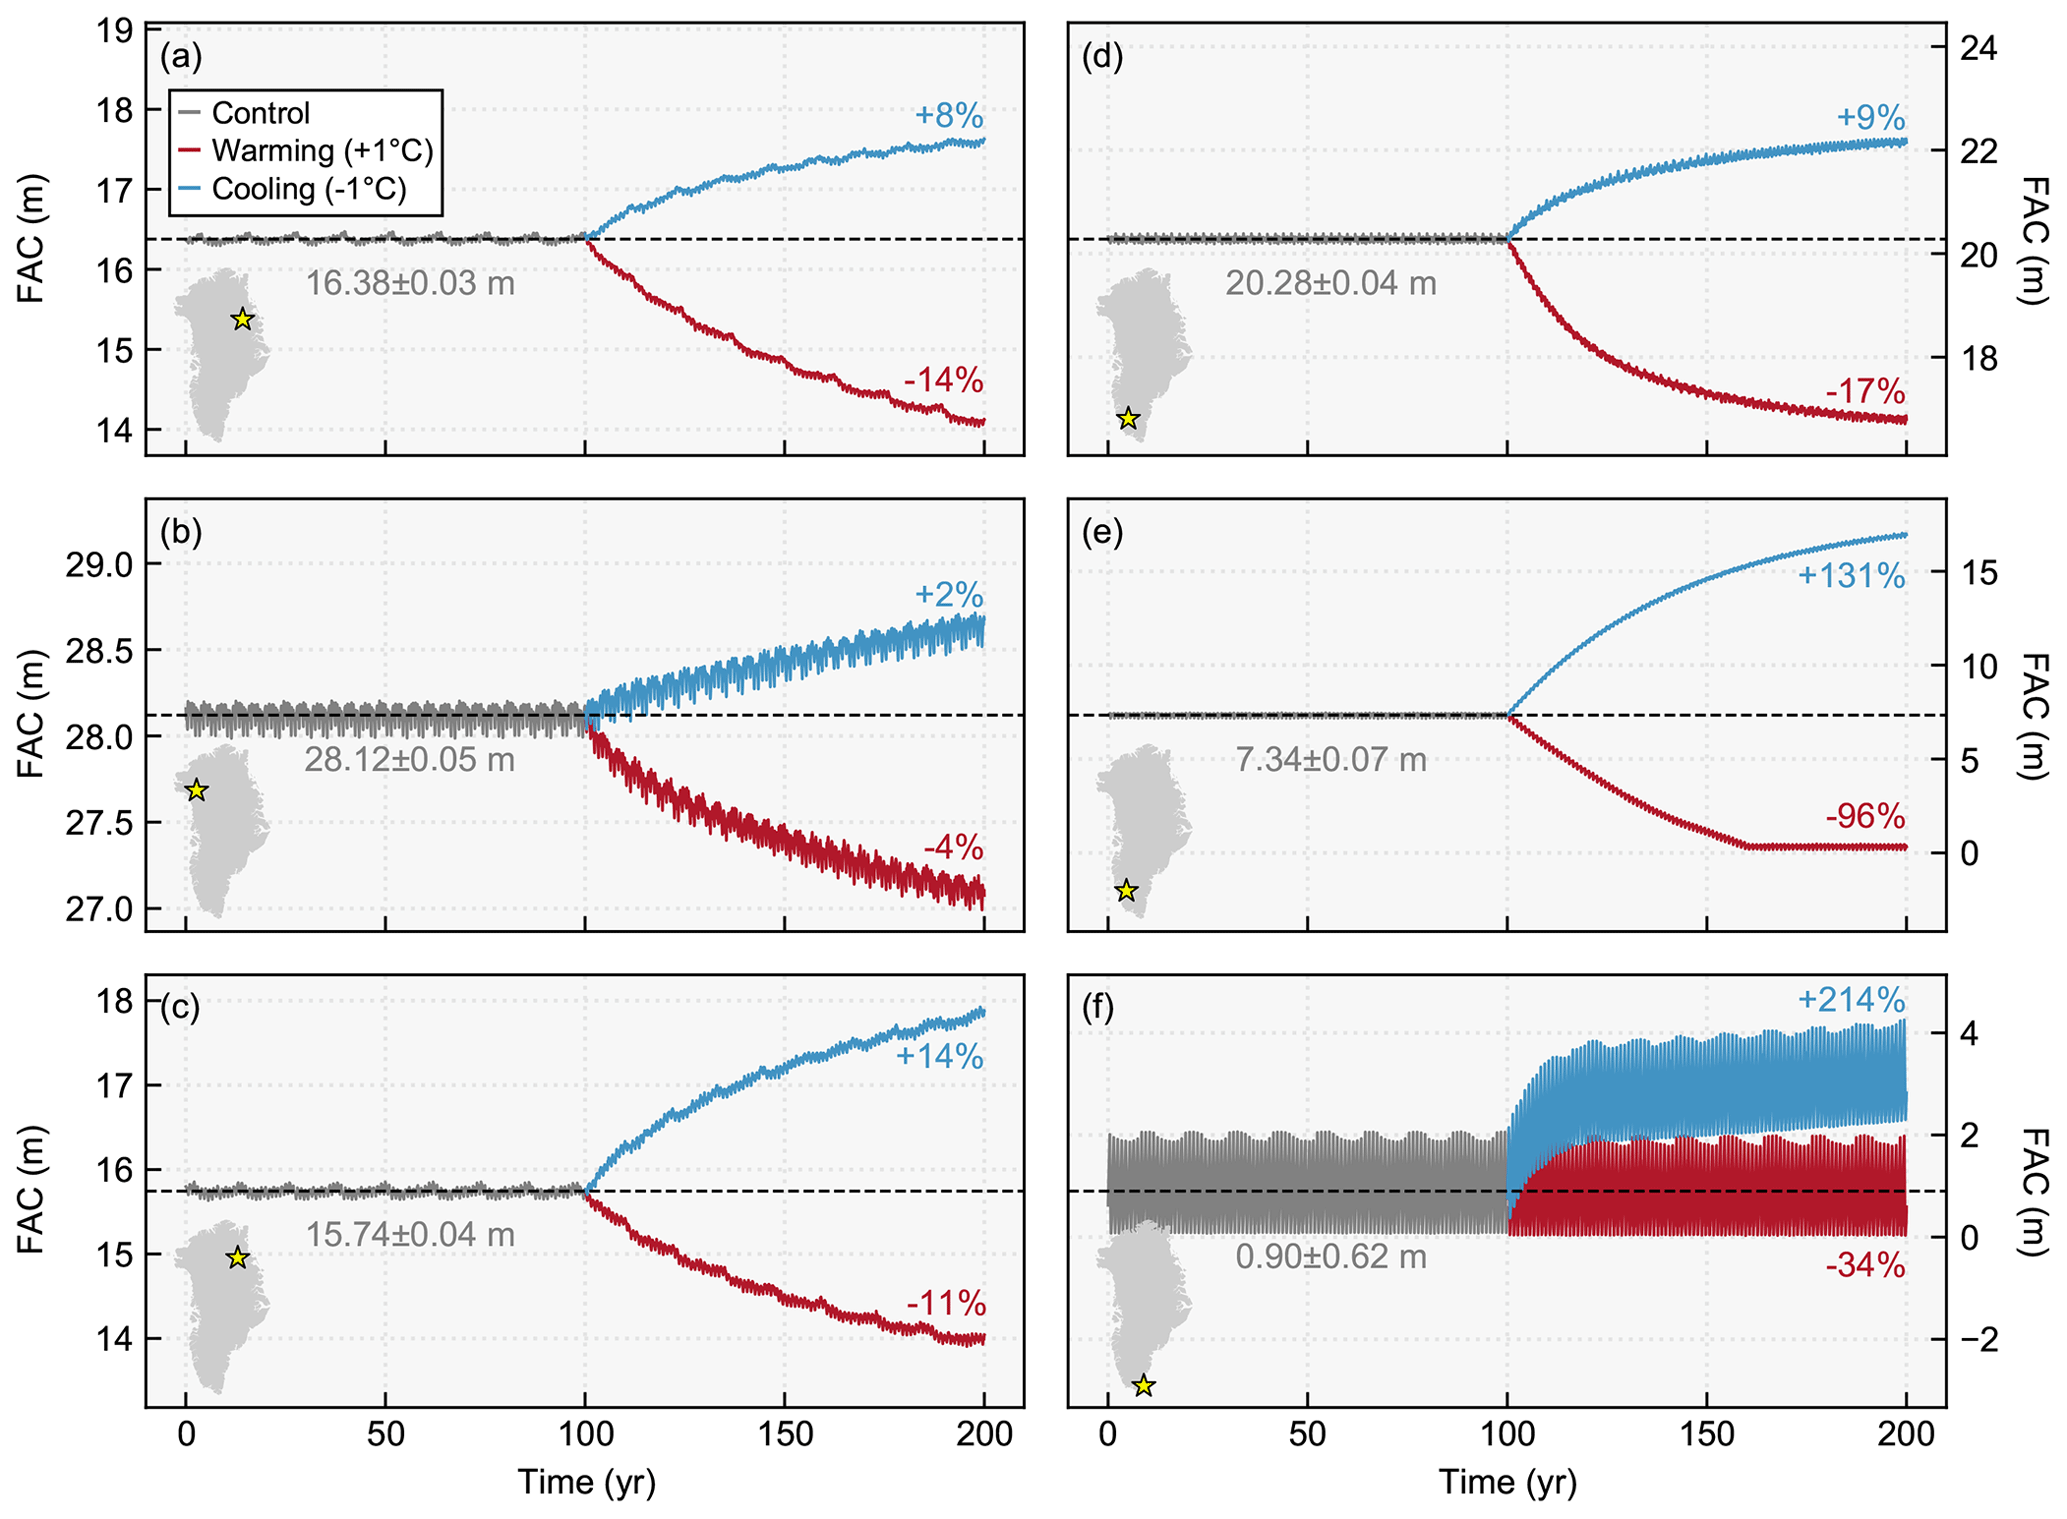
Figure 6Firn air content (FAC) over time in the control period (gray line), warming experiment (red line), and cooling experiment (blue line) from six locations shown in the inset maps as yellow stars. Numbers in gray show the mean and standard deviation of the firn air content in the control period, and red and blue percentages show the total percent change due to warming and cooling, respectively. Note the different y-axis scales. Also note that the approximately decadal oscillations in the time series are a result of leap years affecting the 14 d model output frequency and are not real signals within the data.
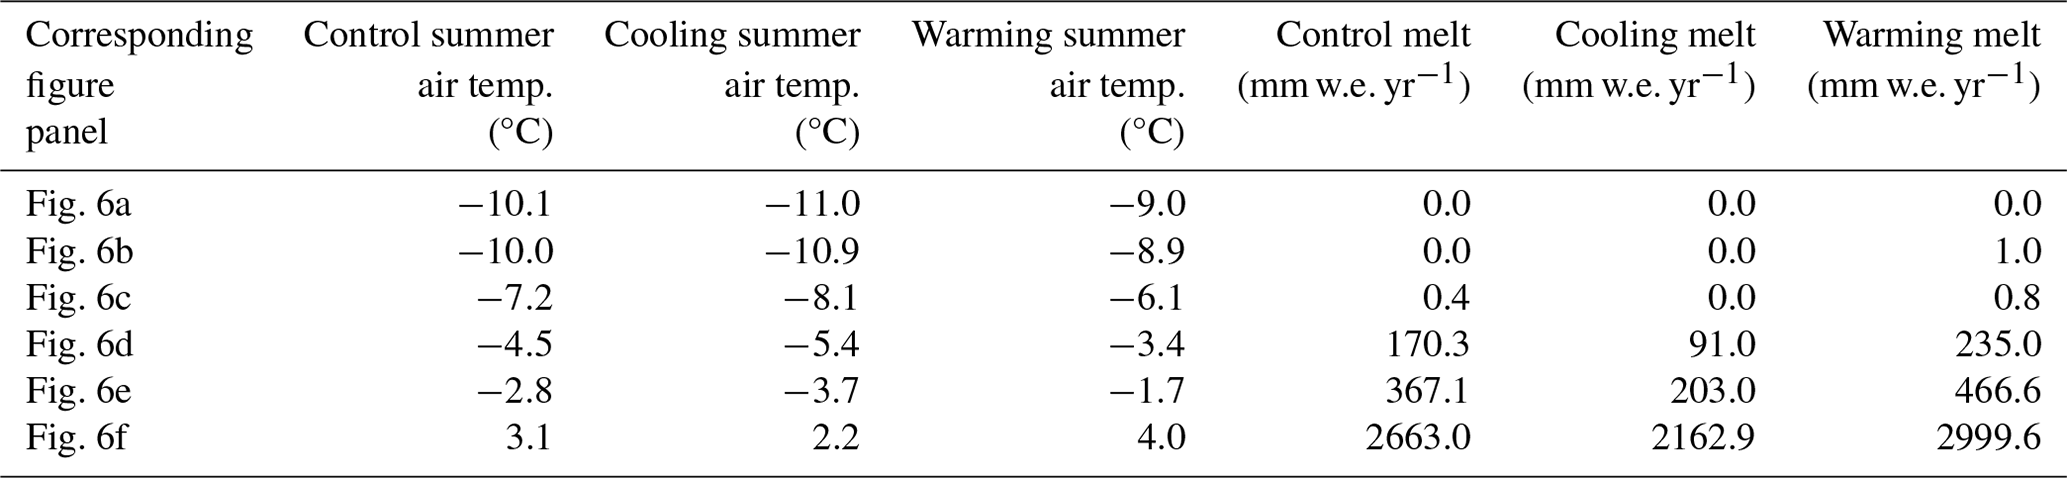
Table 1Mean summer air temperature and annual melt in the control, cooling, and warming scenarios for the six examples shown in Fig. 6.
3.3 Characterizing the diversity of local responses to temperature change
Having provided an ice-sheet-wide assessment, we next provide examples of firn air content responses from six locations with distinct mean and final states (Fig. 6). The six examples highlight the large range of summer air temperatures and melt rates as well as their impact on firn air content (Table 1). They also demonstrate the complex interplay of the physical processes controlling firn in SNOWPACK. The coldest of these locations experiences no melt in the control, cooling, or warming conditions and therefore represents a completely dry firn response (Fig. 6a). Atmospheric warming leads to a 14 % decrease in the control firn air content of 16.38 m, and cooling leads to an 8 % increase by the end of the simulation. This greater response to warming is typical for the dry ice sheet interior, and many grid cells exhibit a similar evolution of firn air content due to warming and cooling. In the next example, the control and cooling experiments produce no melt, but the warming experiment leads to a small amount of melt that transitions the firn in this location from dry to wet (Fig. 6b). The control firn air content of 28.12 m decreases by 4 % due to warming and increases by 2 % due to cooling. Figure 6c depicts firn air content responses to the opposite wet–dry situation in which the control period and warming experiment experience melt but the cooling experiment decreases the air temperatures enough to eliminate melt and convert the wet firn to dry firn. In this case, the control firn air content of 15.74 m changes more due to cooling (+14 %) compared to warming (−11 %).
The final three examples are from warmer locations that experience melt in the control, warming, and cooling experiments (Fig. 6d–f). Where the control firn air content is 20.28 m and the mean summer air temperature throughout the 200 years is below 0 °C, atmospheric warming leads to a much stronger firn air content change (−17 %) compared to cooling (+9 %) (Fig. 6d). Figure 6e shows firn air content results from a similar location on the ice sheet as in Fig. 6d, but here the control melt is more than twice as large. This results in a lower control firn air content of 7.34 m that is almost fully depleted due to warming (−96 %) but more than doubles due to cooling (+131 %). This is an example of a firn-air-content-limited response that occurs along most of the accumulation zone margin where the control firn air content is low enough that warming fully depletes it. The final example is from a location where the control mean summer air temperature is above the melting point and there is almost no firn air content to begin with (0.90 m) (Fig. 6f). The relative changes in firn air content appear to be large (−34 % from warming and +214 % from cooling), but the absolute changes are very small as warming almost fully depletes the firn air content and cooling increases it by a few meters.
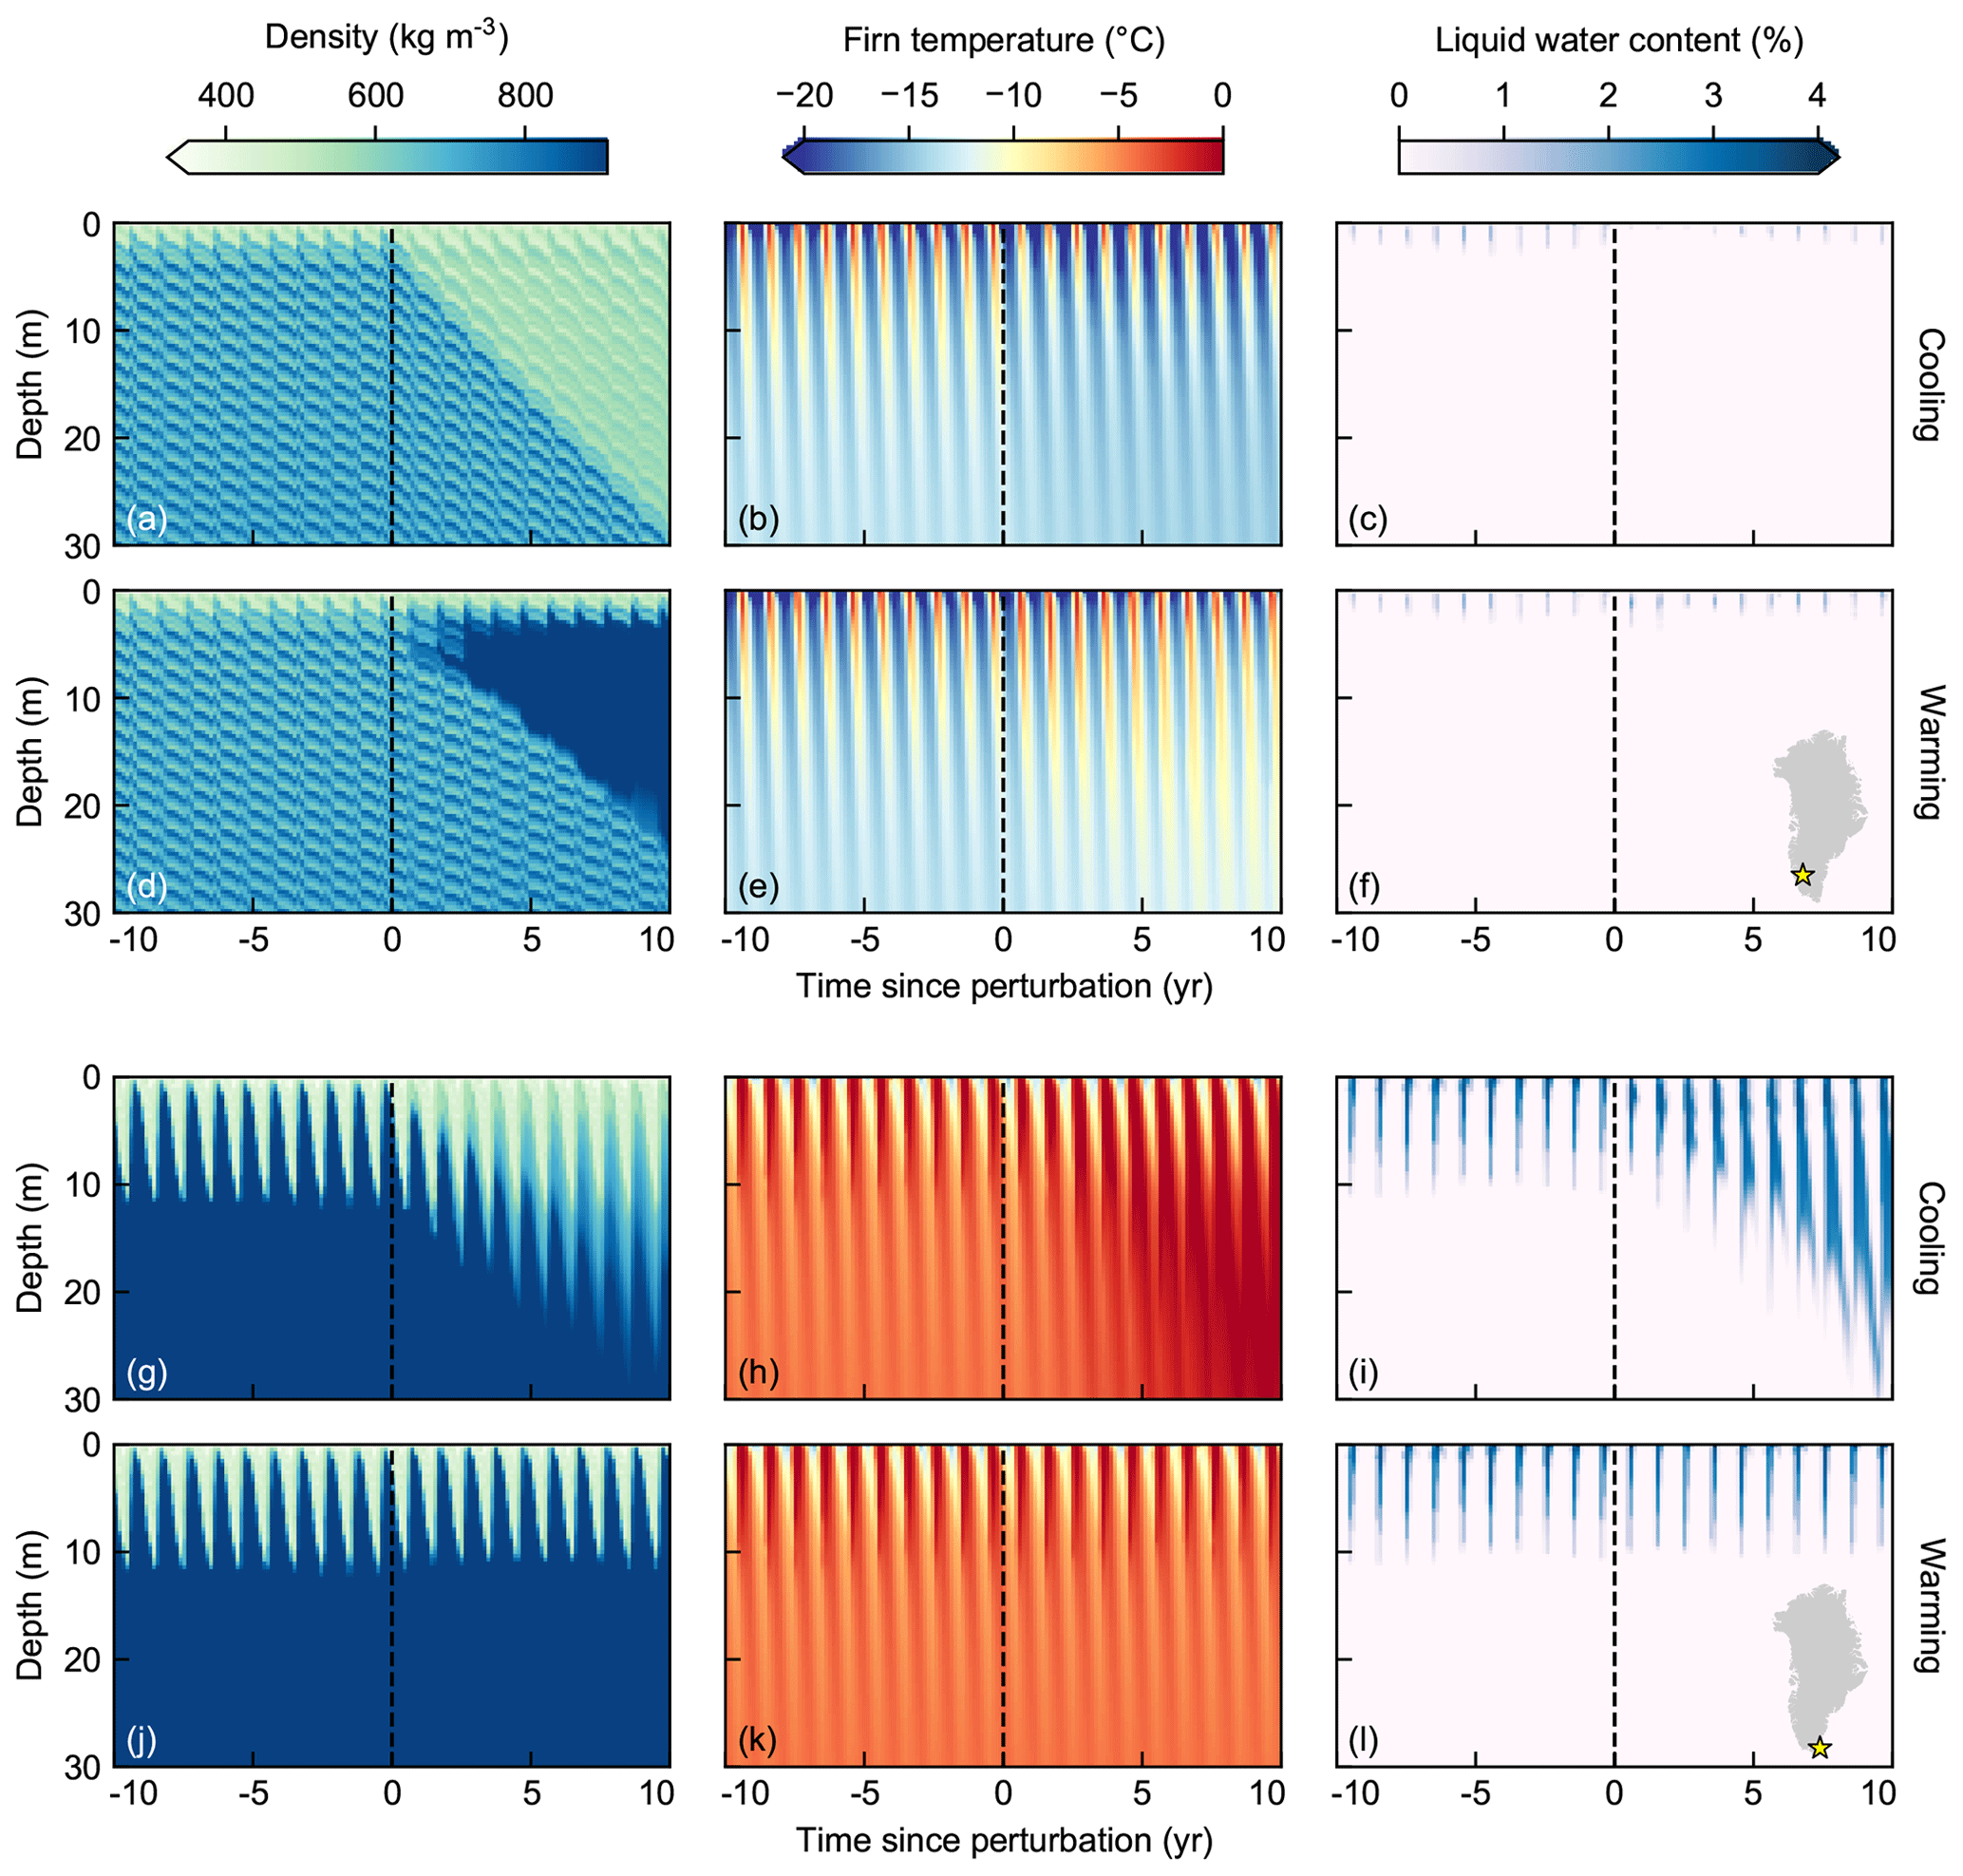
Figure 7Time–depth plots showing firn properties (density, firn temperature, and liquid water content) for the upper 30 m of the firn column for the 10 years before and after the temperature perturbation (vertical dashed black line) for two example locations. (a–f) Results from a grid cell in southwest Greenland as seen in Fig. 6e. (g–l) Results from a grid cell in southeast Greenland as seen in Fig. 6f. The responses to cooling are shown in panels (a)–(c) and (g)–(i), and the responses to warming are shown in panels (d)–(f) and (j)–(l). Inset maps in panels (f) and (l) show each example's location on the ice sheet as a yellow star.
To explore the complexities that meltwater introduces to the structure and properties of the firn, we examine the subsurface firn properties for the 10 years before and after the temperature perturbation for the two wettest and warmest local examples in Fig. 6 (Fig. 6e, f). We first explore the simpler of the two cases in which the effects of atmospheric warming and cooling are more easily explained. Here, control state summer air temperatures (−2.8 °C) and melt rates (367.1 mm w.e. yr−1) are low enough to enable comparatively high firn air content (7.34 m) before perturbations are applied (Fig. 6e). In the upper 30 m of the firn column, the control density is less than ice density (910 kg m−3 in the model) and has a strong seasonal signal that is preserved in buried layers over time (Fig. 7a, d). Following cooling, the density decreases and the denser control period layers are buried with time (Fig. 7a). The firn is also colder throughout the year (Fig. 7b), and the small amount of liquid water generated in the summer in the upper few meters decreases (Fig. 7c). Warming leads to opposite responses, with density (Fig. 7d) and temperature (Fig. 7e) increasing and liquid water content showing a slight increase and then minimal change (Fig. 7f). In this case, the firn temperatures in the summer reach the melting point and the firn layer turns to ice with a thin layer of snow on the surface.
We also examine the subsurface properties for a more complex location where almost no firn air content initially exists (0.9 m) and the mean annual summer air temperature is above the melting point (3.1 °C) before the temperature perturbation (Fig. 6f). Here near the equilibrium line, the upper 30 m is almost entirely ice with a layer of snowfall that almost completely melts away in the summer (Fig. 7g, j). When the air temperature decreases, the density decreases with time as new snow is not entirely melted away (Fig. 7g). This new addition of porous material creates open pore space for meltwater to be stored rather than run off the surface. As such, the liquid water content in the firn actually increases due to cooling (Fig. 7i). Water within the firn layer can remain a liquid at 0 °C or refreeze and release latent heat, which means that the firn temperature increases due to cooling (Fig. 7h). Since so little firn air content initially exists and the air temperatures are already above 0 °C, the warming scenario creates very little change in the firn properties (Fig. 7j–l).
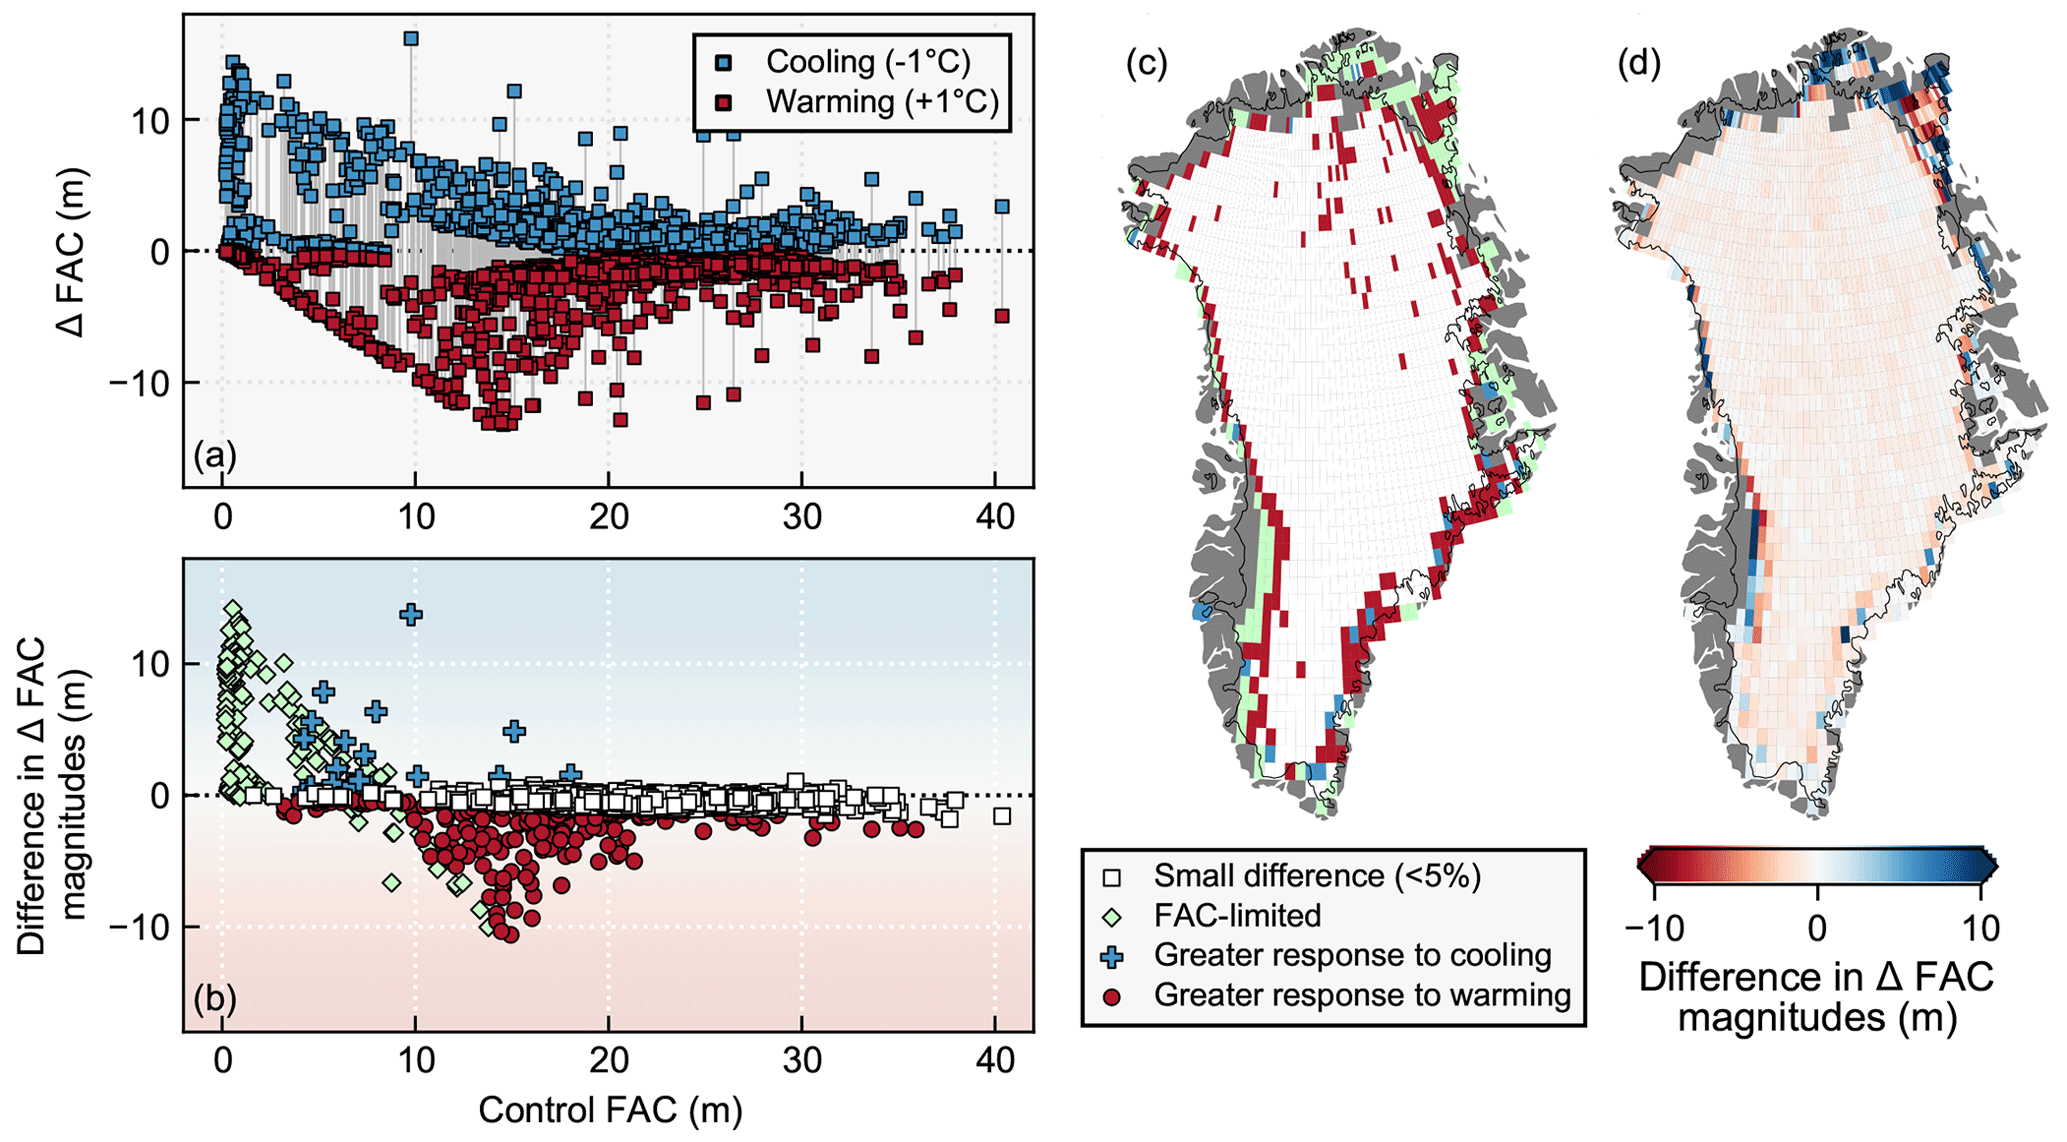
Figure 8Types of firn air content (FAC) response relationships across the ice sheet. (a) The change in firn air content for each grid cell calculated as the final value minus the control mean as a function of the control mean firn air content. Blue markers indicate the effect of cooling and red indicates the effect of warming; vertical gray lines connect the warming and cooling responses from each grid cell. (b) The difference in the magnitudes of firn air content changes due to warming and cooling. The difference is calculated as the magnitude of the cooling change minus the magnitude of the warming change such that positive values indicate a greater response to cooling (blue background shading) and negative values indicate a greater response to warming (red background shading). The different marker shapes and colors differentiate the four types of responses shown in the legend to the right. (c) Locations of the different response types across the ice sheet. (d) The difference in magnitudes of firn air content change due to cooling and warming shown in map view. The thin black line in (c) and (d) represents the ice sheet outline.
Having explored the detailed responses of firn in a few examples, we now characterize the relative strength of the atmospheric warming and cooling effects for each modeled location on the ice sheet. We use the mean firn air content in the control period and the magnitudes of firn air content change to categorize each location into one of four “response relationships” (Fig. 8). In a small difference response relationship, the difference in magnitudes of firn air content change due to cooling and warming is <5 %. Most grid cells fall into this category with 1282 of the 1724 grid cells having a similar gain of firn air content due to cooling as the loss due to warming (Fig. 8c). It is worth noting that even in these cases where the responses to warming and cooling differ by a small amount, the response to warming is slightly but persistently greater in magnitude (Fig. 8b, d). The effect of warming outweighs that of cooling even where the firn air content changes are small. A significantly greater warming response relationship describes 235 grid cells and occurs when the effect of warming outweighs that of cooling by at least 5 %. In comparison, a greater cooling response relationship describes just 22 grid cells. The final category representing 185 grid cells is a firn-air-content-limited response, in which either the control firn air content is less than 1 m or warming depletes it to less than 1 m. Since firn air content cannot be negative, the response to warming has a lower bound of 0 m but the response to cooling is unlimited (Fig. 8a), meaning that these air-content-limited responses tend to occur where the mean firn air content in the control period is very low (Fig. 8b). Categorizing each experiment pair into these four bins allows us to discuss spatial patterns in response strengths (Fig. 8c). The margins of the ice sheet are characterized by either a greater response to warming, a greater response to cooling, or a firn-air-content-limited response. For the most part, the typically dry ice sheet interior has a response relationship with small differences (<5 %) between warming and cooling. Although these locations are defined by a similar-magnitude response, the vast majority of these grid cells have a slightly greater response to warming than to cooling when comparing absolute magnitudes of the responses (Fig. 8d).
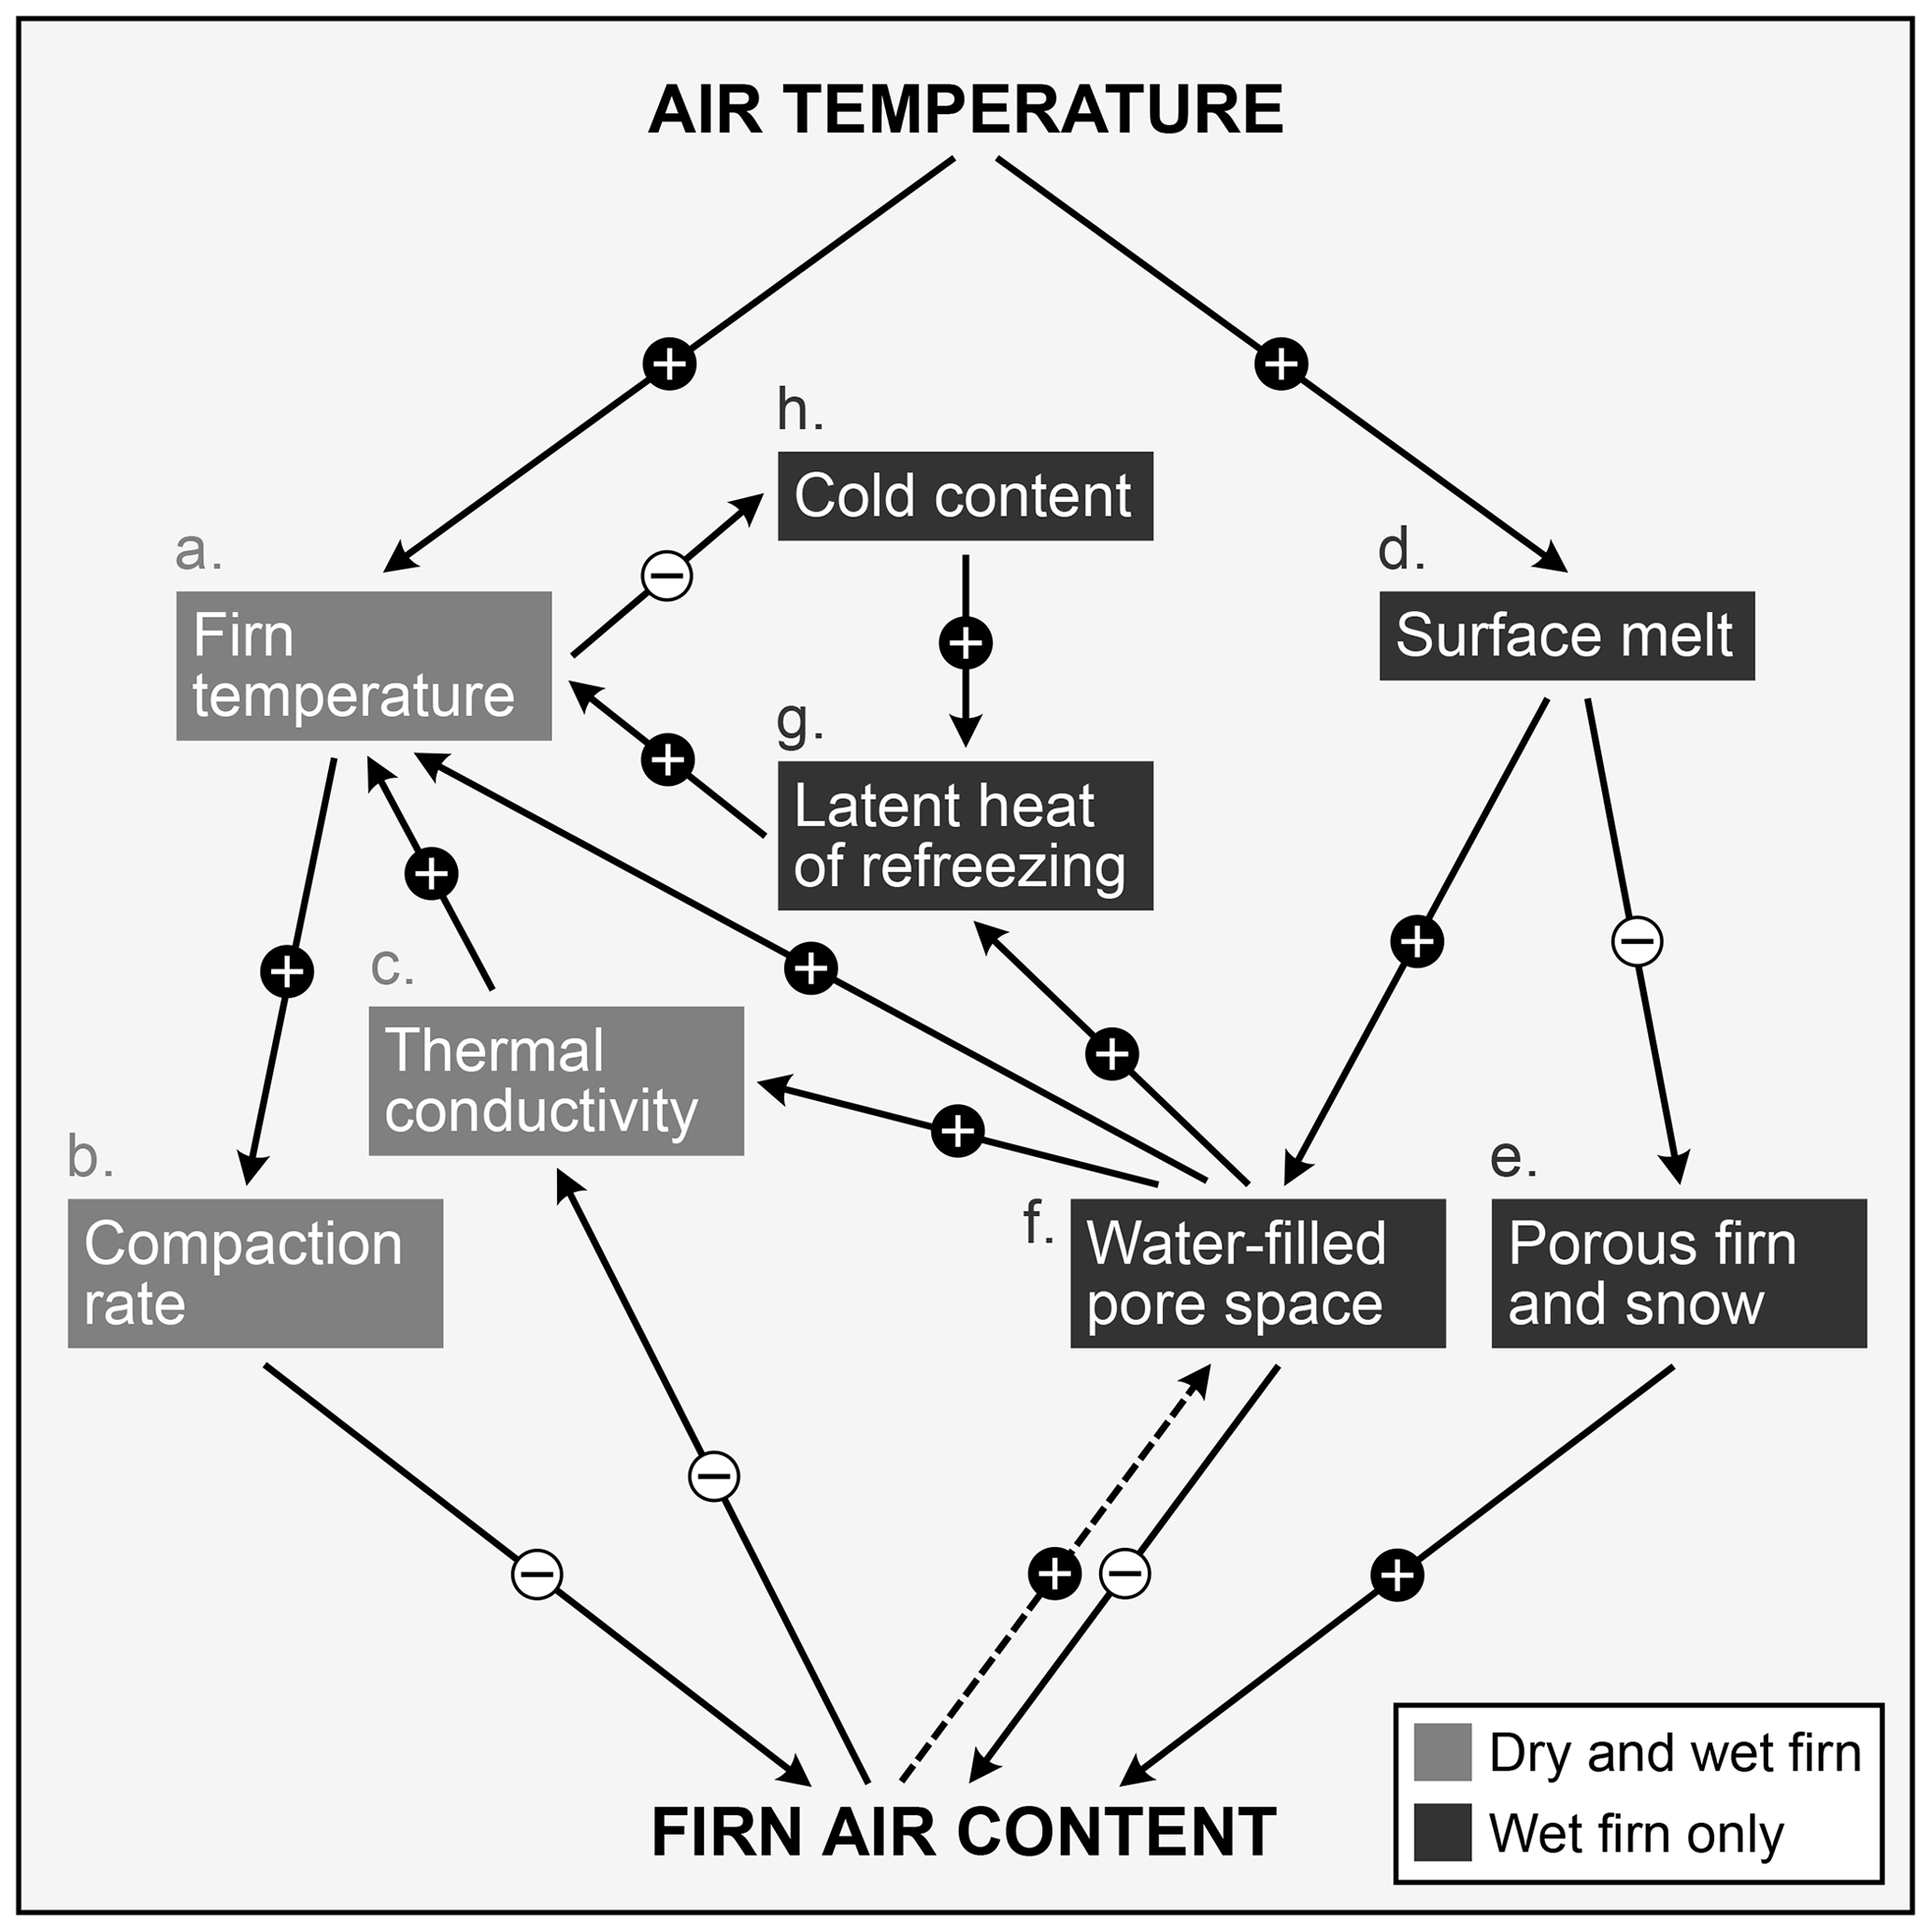
Figure 9Schematic of air-temperature-driven interactions within the firn layer. Arrows with plus signs indicate a direct relationship, while arrows with minus signs indicate an inverse relationship. The dashed arrow represents a relationship that only exists where runoff occurs and firn air content increases. Dark gray boxes show processes occurring in the presence of melt (i.e., in wet firn only) and light gray boxes show processes occurring in both dry and wet firn.
4.1 Temperature–firn interactions responsible for firn air content changes
Having described the variety of firn responses to atmospheric warming and cooling, we now summarize the major pathways through which air temperature can alter firn air content. Figure 9 highlights many of these surface and subsurface processes that act together to produce the wide array of firn responses seen in our warming and cooling experiments. We have identified three categories of processes altering firn air content: (1) dry firn compaction (Fig. 9a, b), (2) thermal property changes (Fig. 9c, g, h), and (3) meltwater production (Fig. 9d, e, f). A change in the compaction rate is the simplest and primary mechanism of changing firn air content in dry firn. When the air warms and causes the firn to warm (Fig. 9a), the compaction rate, which is nonlinearly related to temperature, increases (Fig. 9b). This response means that the firn compresses faster and firn air content ultimately decreases. In the case of decreasing the air temperature, the firn cools and slows the compaction rate, and the firn air content is higher than in the initial state. Additionally, increasing air content reduces the bulk thermal conductivity (Fig. 9c), allowing faster heat transport to deeper layers in the case of warming and slower transport due to cooling.
While the temperature–compaction relationship is the only major mechanism for firn air content in dry firn to change, the introduction of meltwater adds complexity to the system. Wet firn's air content is dependent on the changing compaction rate, but also on processes related to surface melt and meltwater percolation. Increasing the air temperature causes melting (Fig. 9d) through a nonlinear relationship identified in both this work (Fig. 5) and others (e.g., Trusel et al., 2018). The process of melting removes porous material (Fig. 9e) and fills pore space with meltwater (Fig. 9f), thus reducing firn air content. However, complexities arise from the presence and interactions of meltwater within the firn. When the liquid water replaces air, it increases the thermal conductivity (Fig. 9c) and the bulk temperature of the firn (Fig. 9a). If the water refreezes, it releases latent heat (Fig. 9g) that further increases the firn temperature (Fig. 9a) and compaction rate (Fig. 9b) (Pfeffer and Humphrey, 1996). For refreezing to occur, cold content (i.e., the energy required to bring firn to 0 °C) must be available (Vandecrux et al., 2020). Increasing the firn temperature reduces the cold content (Fig. 9h), which could limit refreezing and therefore the release of latent heat. However, cold content may be drawn from deeper firn via thermal conduction, so this negative feedback that buffers the effect of latent heat is likely minimal (Vandecrux et al., 2020).
Opposite to warming, decreasing the air temperature leads to less melt, which reduces the loss of porous material and reduces the amount of meltwater entering pore space (Fig. 9). With less meltwater occupying pore space, there is less liquid available for refreezing. As such, less latent heat is released. However, the availability of cold content in colder firn may allow for more refreezing and latent heat release that then warms the firn and enhances compaction. Whether firn temperature is ultimately decreased from advection or increased from amplified refreezing is dependent on the initial state of the firn and leads to the variety of responses across the ice sheet (e.g., Fig. 8). The example of firn property changes due to cooling in Figs. 7f and 8g–i is reflective of these complex subsurface interactions. In the control simulation for this wet firn grid cell, most melt becomes runoff since so little pore space exists. Cooling the air temperature allows for less loss of porous material and thus more meltwater storage capacity. The increased meltwater within the firn increases the thermal conductivity, firn temperature, and latent heat released from refreezing. As such, this is an example of atmospheric cooling leading to an initial increase in firn air content that then results in a warmer firn layer due to meltwater storage.
4.2 Implications of an asymmetric relationship
The key finding of this work is that the loss of firn air content due to atmospheric warming is greater than the gain in firn air content due to cooling when integrated across the Greenland Ice Sheet. We identify this asymmetry in both wet and dry firn, and we attribute it to (1) the nonlinear relationship between firn temperature and compaction rate, (2) the nonlinear relationship between air temperature and melt, (3) the additional warming of firn from the latent heat released from refreezing, and (4) the dependency of the thermal conductivity on the material composition. Many of these processes have been found to govern the response times of firn to climate change (Kuipers Munneke et al., 2015). The interplay of these relationships drives the variability of responses modeled across the ice sheet. Previous studies have examined the effects of idealized forcing perturbations on firn in theoretical frameworks (Kuipers Munneke et al., 2015; Meyer and Hewitt, 2017) or with a few example locations (Arthern and Wingham, 1998; Li and Zwally, 2015). Our work expands on these studies to demonstrate the range of firn responses across Greenland, which depend on mean state climate variables like summer air temperature and melt. Despite the variability in responses, we find that on average Greenland's firn air content is more sensitive to warming than to cooling in most climate conditions and in both wet and dry areas.
An additional and important contributor to Greenland's asymmetric firn response is the immediate buffering effect of cooling in very warm and wet areas. Storage of meltwater in newly created pore space reduces surface runoff but does not provide a long-term buffer. In a cooling climate, this mechanism may slow or stall the growth of the ice sheet's meltwater retention capacity. On the other hand, loss of pore space through atmospheric warming does not face a similar obstacle. The firn air content response may be limited by the amount of initial air available, but where loss of pore space is not possible, mass loss occurs and warming still affects runoff. While this negative feedback dampens the effect of cooling, no such limitation exists for warming. This is demonstrated through the rapid expansion of the ablation zone responsible for recent surface runoff in Greenland (Noël et al., 2019; Tedstone and Machguth, 2022). Our findings similarly demonstrate the rapid effects from warming, but the asymmetric firn response implies that the reversal of this process in a cooling climate would occur more slowly.
More broadly, our findings provide an additional mechanism that contributes to the asymmetric growth and decay of ice sheets. Fyke et al. (2018) describe several processes that play a role in this asymmetry, such as the melt–elevation and melt–albedo positive feedback loops that can enhance ice sheet mass loss. These two feedbacks primarily relate to the ablation zone and lower-elevation areas experiencing melt. However, we present a mechanism that acts in the accumulation zone. Since wet firn and dry firn processes are both nonlinearly related to temperature, the asymmetric temperature–firn response operates in all areas where firn exists. Although the asymmetric response describes firn air content changes rather than mass changes, the two are closely related through the firn's meltwater retention capability (Harper et al., 2012). Further, these nonlinearities are largest at the edges of the accumulation zone: that is, the regions that can transition from an accumulation zone into an ablation zone or back. These processes suggest that the ablation zone can grow in area more quickly than it can shrink. Thus, we describe an asymmetry in the behavior of Greenland's firn that may contribute to the ice sheet's overall asymmetric mass changes.
This work also provides important insight into how Greenland firn evolves not only in our modern warming climate, but also in a cooling climate. Much research has been conducted on the signature of recent atmospheric warming on the firn layer, but fewer opportunities exist to observe the effects of cooling. Though not directly assessing decreasing air temperatures, Rennermalm et al. (2022) found that recently depleted pore space can be temporarily recovered with several years of average or below-average melt. Our work shows similar generation of pore space as cooling reduces melt and compaction rates. In a cooling climate, we expect firn to respond more slowly and to a lesser degree when compared to modern observations of firn air content depletion. As such, in the absence of changes to other climate variables, a greater degree of cooling is required to achieve the same strength of firn response in warming. This suggests that reversing the effects of modern climate change through air temperature change alone would require disproportionately more cooling.
4.3 Study limitations
The idealized design of the study provides important insights into firn–climate interactions, but like all idealized designs it has strengths and limitations that are important to acknowledge. The universally applied stepwise perturbation itself is simple to implement and interpret. In addition to being simple, this step-change experimental design enables direct quantification of response timescale. The inspiration for this step-function design comes from widely used climate sensitivity experiments that assess climate response to instantaneously changing carbon dioxide concentrations (e.g., Manabe and Wetherald, 1975; Sherwood et al., 2020) as well as firn modeling experiments quantifying the response times of idealized firn to atmospheric perturbations (Kuipers Munneke et al., 2015). While much can be learned, we are also fully aware of the limitations of our idealized experiments. Although the idealized climate we apply is based on observations, it does not represent a realistic 200-year climate. Temperature change is highly unlikely to occur equally across the entire ice sheet in the span of a single time step (30 min) and remain unchanged for a century. We only examine the effects of changing a single forcing variable, but several atmospheric properties are likely to vary in realistic climate change scenarios. We choose air temperature because of its strong impact on both dry and wet firn properties as well as its relationships with surface melt and runoff that have driven recent mass loss (Van Angelen et al., 2013). Additionally, we use firn air content because it is indicative of the meltwater storage capacity of the ice sheet. However, not all air-filled pore space is available for storing meltwater since access may be blocked by low-permeability ice slabs that seal off deeper, porous firn (MacFerrin et al., 2019). In this work, we do not distinguish between accessible and inaccessible firn air content. Finally, we only consider how temperature perturbations alter two key firn processes: compaction and melt. However, we note that other firn processes are altered by a change in air temperature. For example, we do not explore the effects of sublimation because it is tied to both humidity and wind speed in addition to temperature (Lenaerts et al., 2019). Still, we acknowledge that surface mass balance processes like sublimation affect firn air content and are altered by the prescribed temperature perturbations.
This study uses idealized warming and cooling experiments to characterize the response of simulated Greenland firn to air temperature change. We rely on a physics-based firn model run with an idealized forcing, which allows us to isolate the effect of temperature perturbations of equal magnitude (1 °C) but opposite sign on firn air content. We find that Greenland firn air content loss from atmospheric warming is greater than the gain from cooling both locally and integrated across the ice sheet, and we attribute this asymmetry to the nonlinear effects of temperature on firn processes. The variable magnitudes of local firn air content responses to warming and cooling result from the mean state climate as well as the complex interplay of temperature–firn interactions. Our results agree with modern observations of firn air content depletion from warming, but they offer new insight into firn air content changes in a cooling climate. By examining both atmospheric warming and cooling, we identify an important asymmetry in firn that likely contributes to the overall asymmetric mass changes of the Greenland Ice Sheet. Based on our interpretation of these findings, reversing the effects of recent warming on firn air content, melt, and runoff would require a greater degree of cooling.
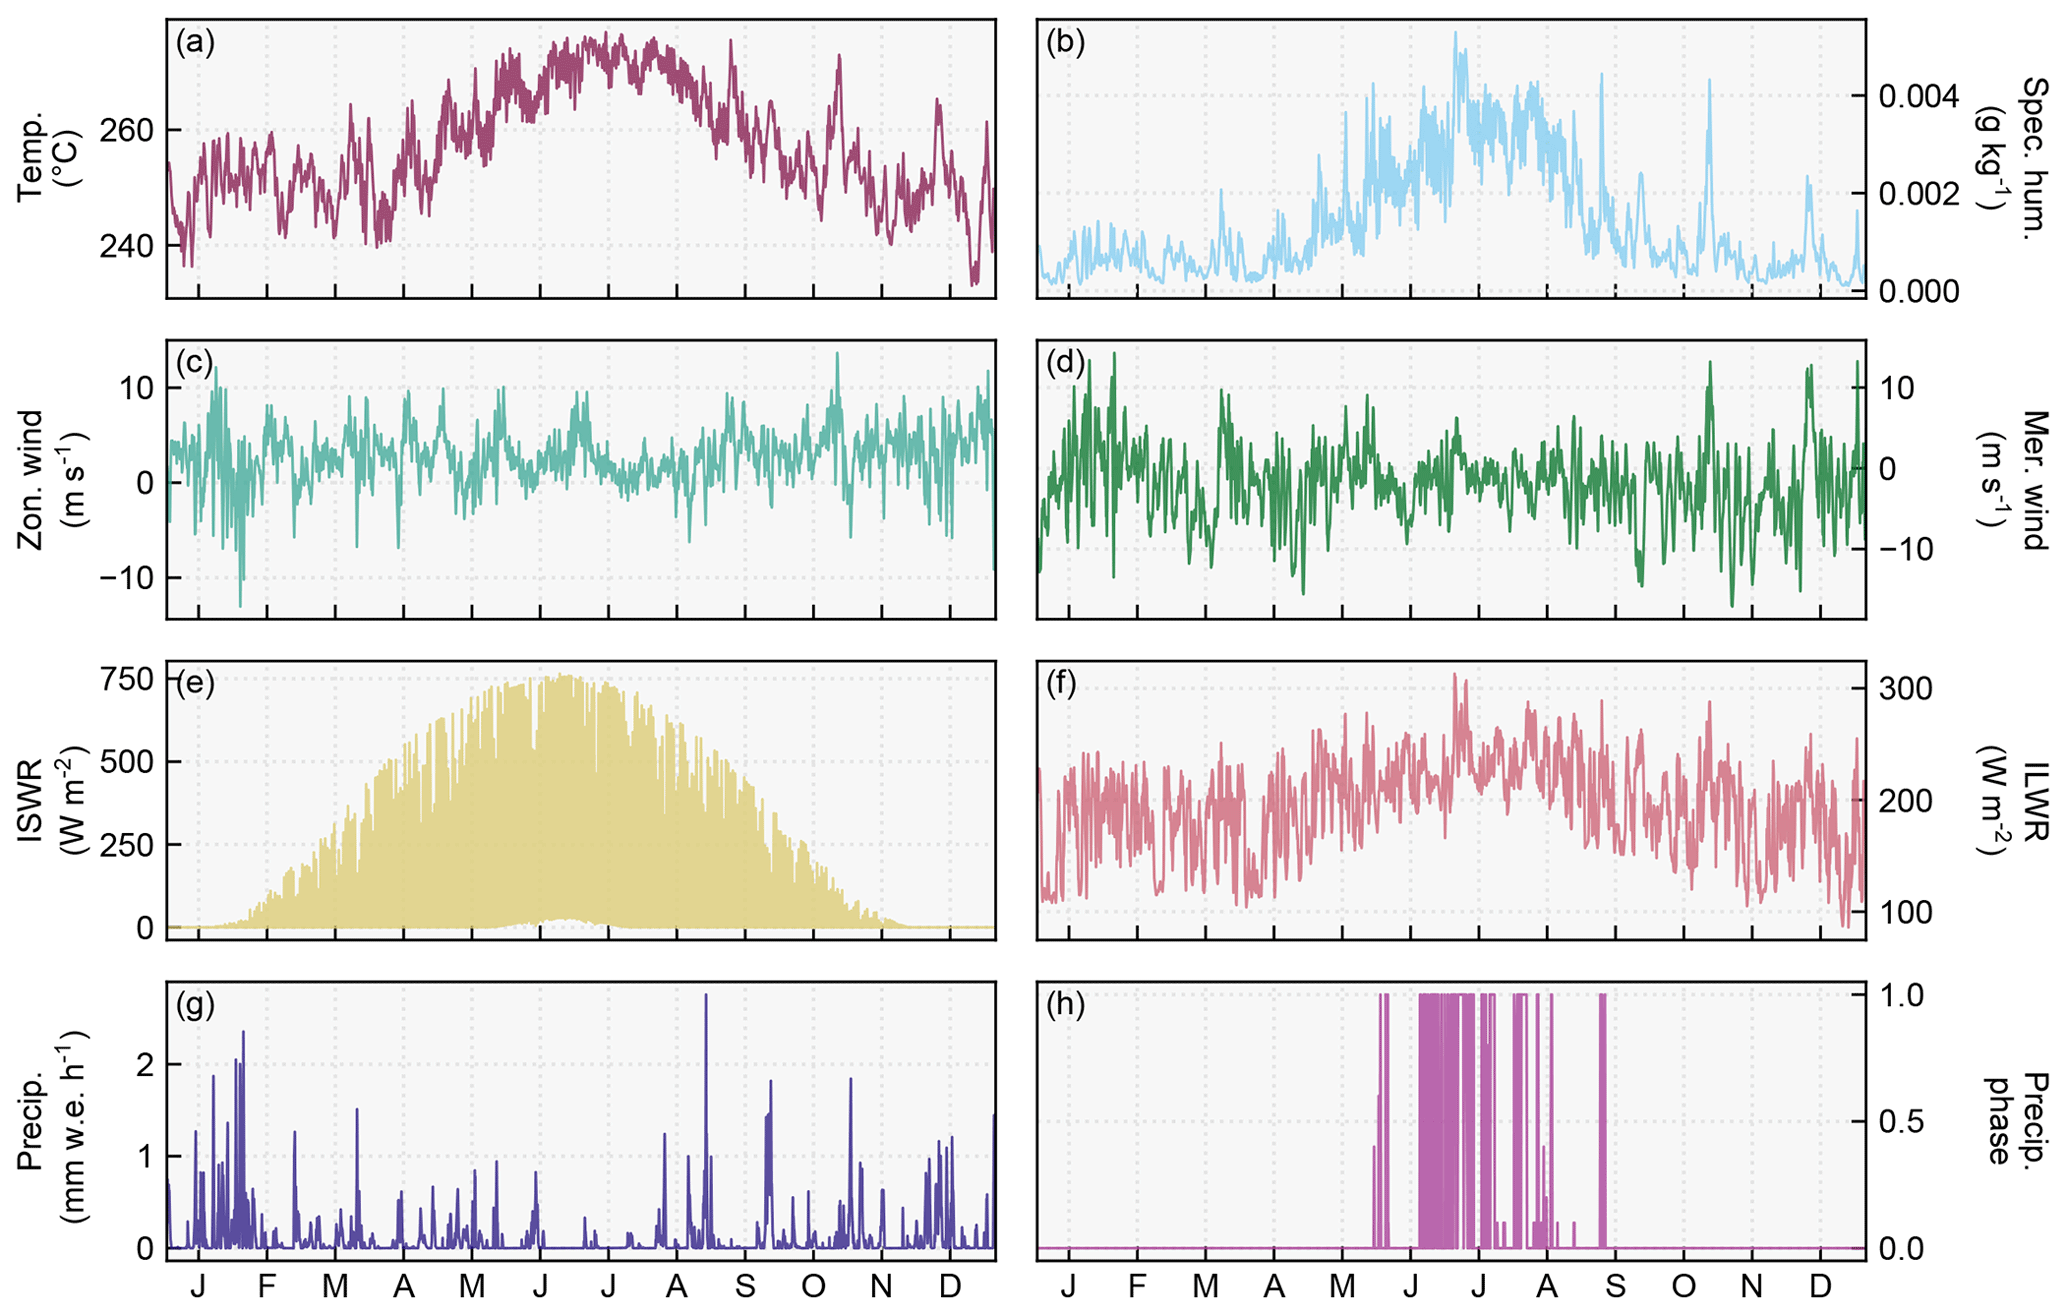
Figure A1Example of 1 year (1991) of hourly unperturbed atmospheric forcing data for a single location (69.5° N, 27.5° W). (a) Air temperature, (b) specific humidity, (c) zonal wind, (d) meridional wind, (e) incoming shortwave radiation, (f) incoming longwave radiation, (g) precipitation, and (h) precipitation phase. The precipitation phase is a fractional value ranging from 0 to 1, where 0 is all solid precipitation and 1 is all liquid precipitation.
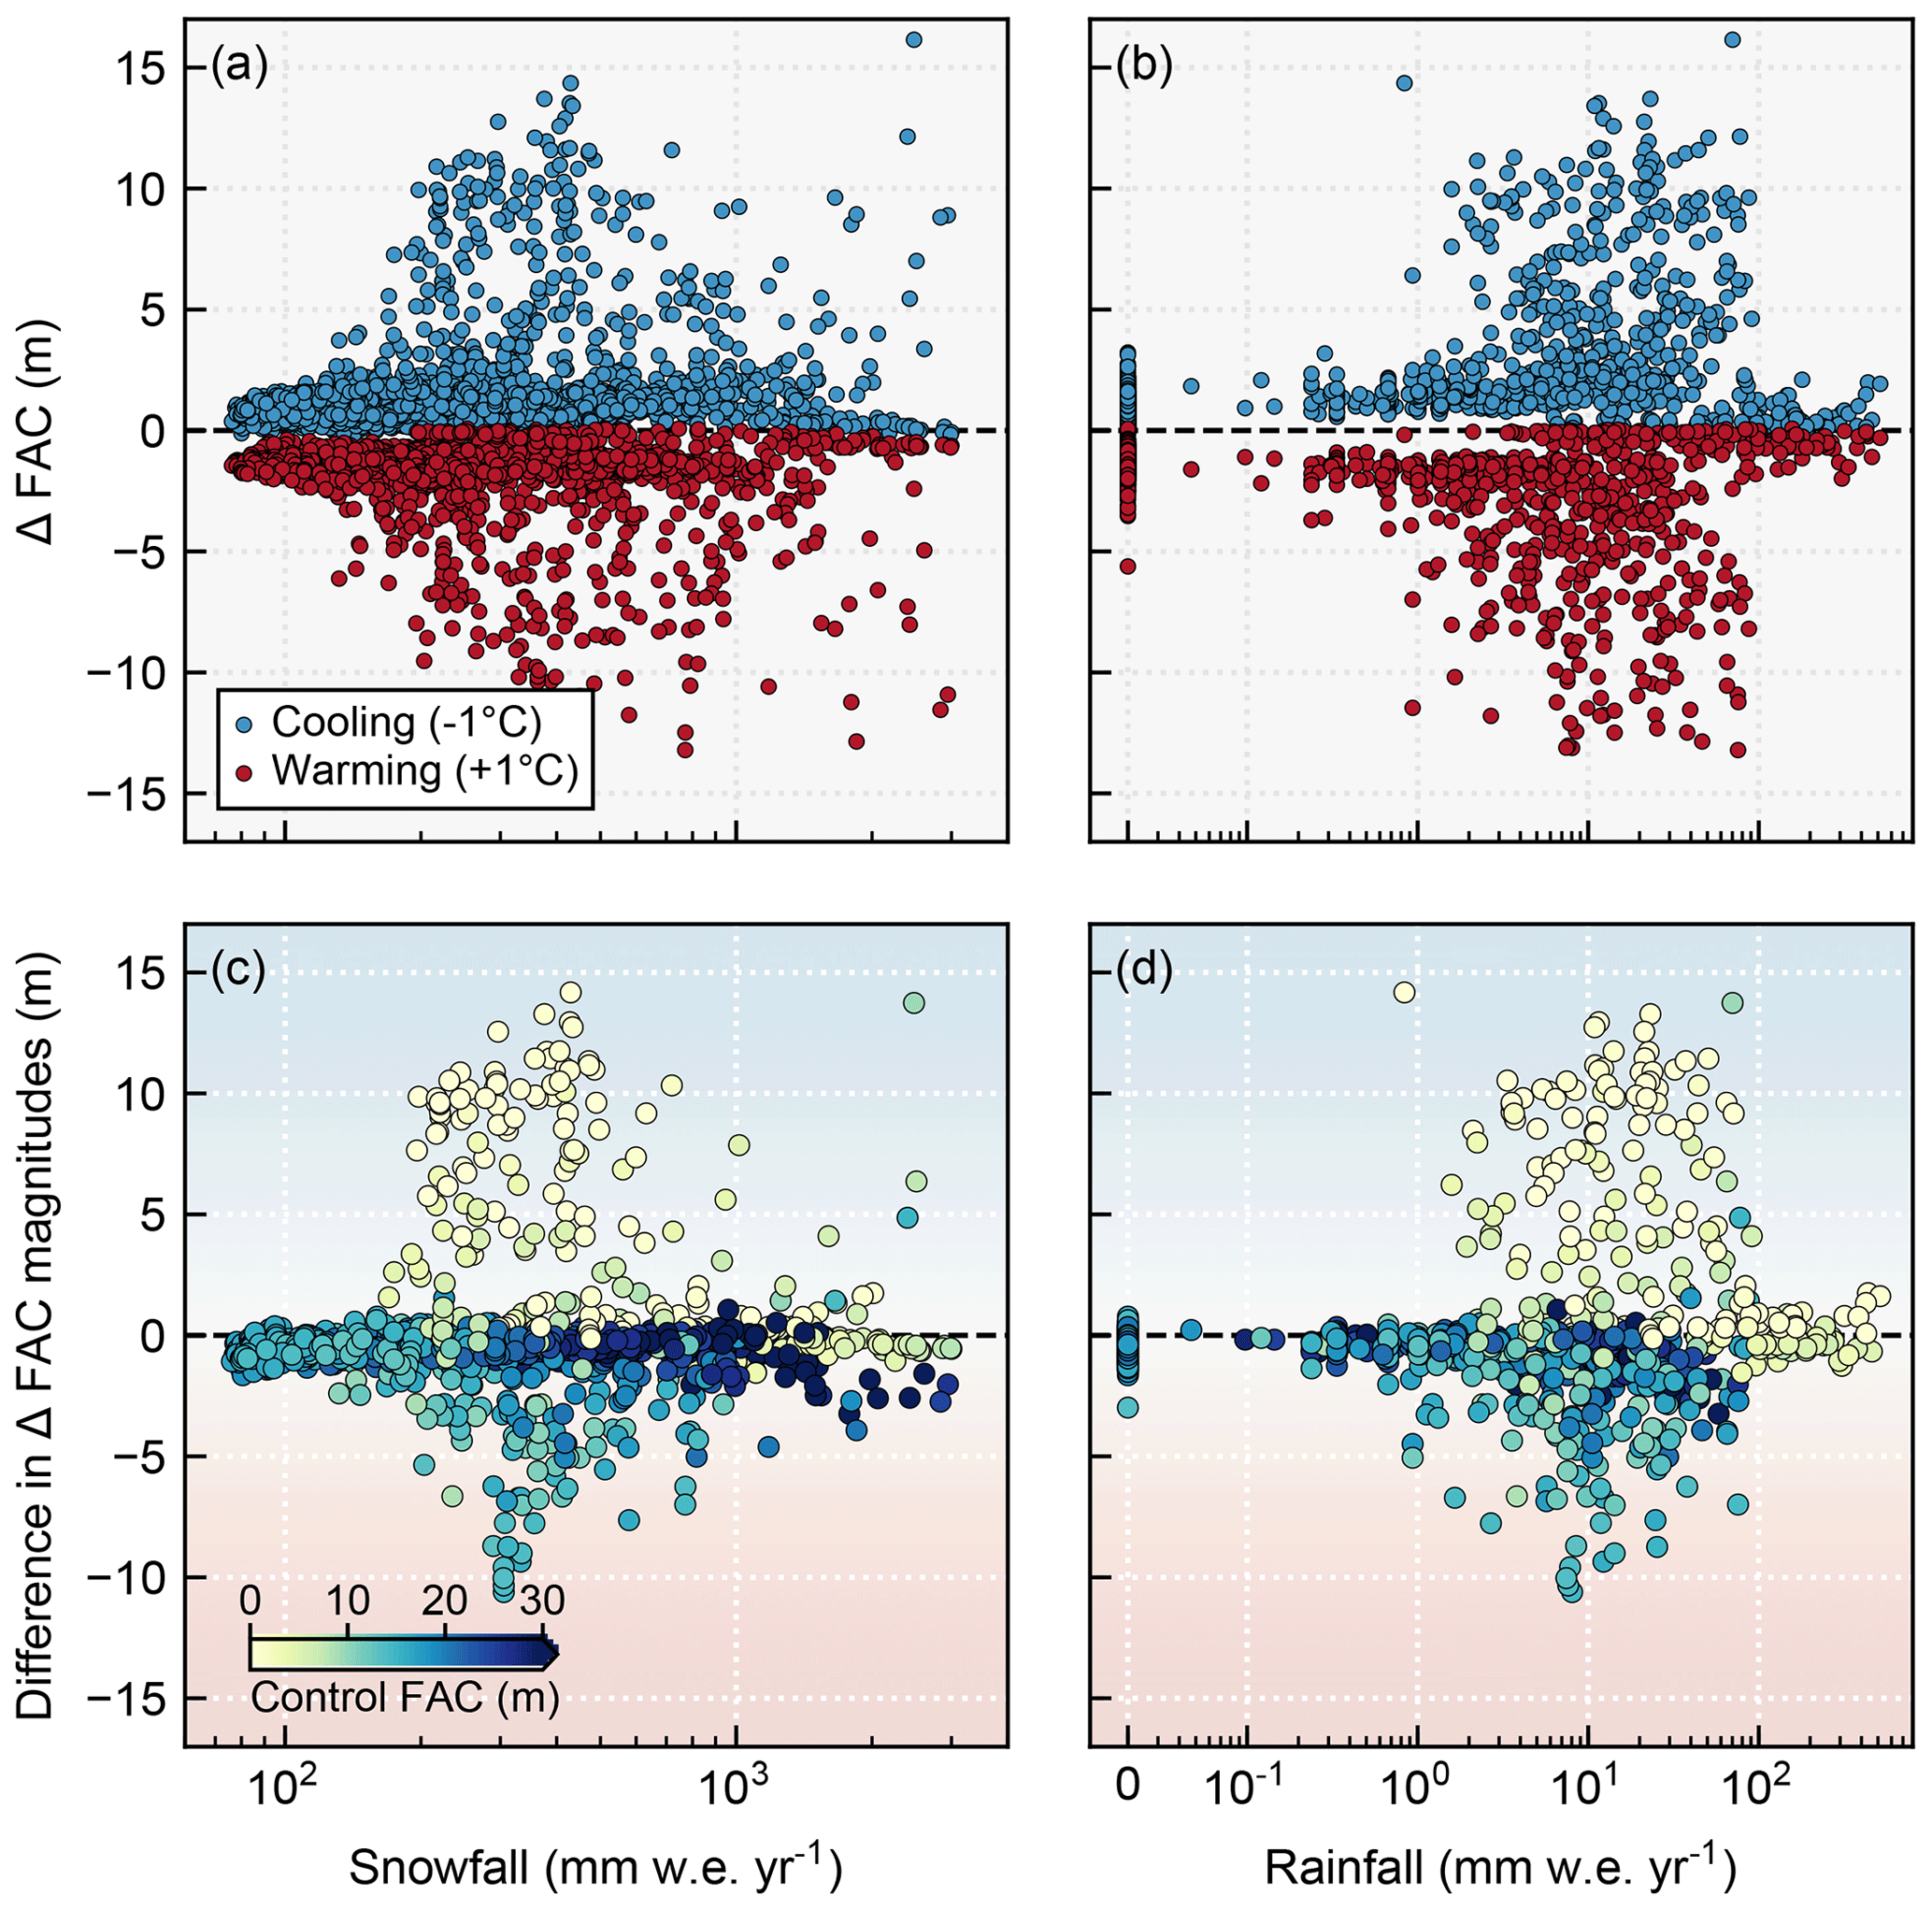
Figure A2(a, b) The change in firn air content (FAC) for each grid cell calculated as the final value minus the control mean as a function of the control mean (a) snowfall and (b) rainfall. Blue markers indicate the effect of cooling and red indicates the effect of warming. (c, d) The difference in the magnitudes of firn air content changes due to warming and cooling. The difference is calculated as the magnitude of the cooling change minus the magnitude of the warming change such that positive values indicate a greater response to cooling (blue background shading) and negative values indicate a greater response to warming (red background shading). The markers are colored by the control mean firn air content. Note the semi-logarithmic x scales used in all panels.
MeteoIO and SNOWPACK are software programs published under the GNU LGPLv3 license by the WSL Institute for Snow and Avalanche Research SLF, Davos, Switzerland, at https://gitlabext.wsl.ch/snow-models/snowpack (WSL, 2022). The code and data used to generate the figures for this paper are available on Zenodo at https://doi.org/10.5281/zenodo.10069583 (Thompson-Munson et al., 2023a). Due to their large size, the forcing dataset and raw model output are stored on the University of Colorado's PetaLibrary, which is not publicly available. As such, please contact the authors for access to the raw data. All code used to generate model output for this work is available at https://doi.org/10.5281/zenodo.12701498 (Kay, 2024).
MTM, JEK, and BRM all designed the study and contributed to the writing of the manuscript. MTM generated the forcing data, ran the model, and processed the output data.
The contact author has declared that none of the authors has any competing interests.
Publisher's note: Copernicus Publications remains neutral with regard to jurisdictional claims made in the text, published maps, institutional affiliations, or any other geographical representation in this paper. While Copernicus Publications makes every effort to include appropriate place names, the final responsibility lies with the authors.
The authors acknowledge Nander Wever for his help setting up SNOWPACK, Colin Meyer for his helpful discussions, and all referees for their feedback. This work utilized the Alpine high-performance computing resource at the University of Colorado Boulder. Alpine is jointly funded by the University of Colorado Boulder, the University of Colorado Anschutz, and Colorado State University. Data storage is supported by the University of Colorado Boulder PetaLibrary.
This research has been supported by the National Aeronautics and Space Administration (NASA) Earth Sciences Division (grant no. 80NSSC20K1727) and the Cooperative Institute for Research in Environmental Sciences (CIRES).
This paper was edited by Brice Noël and reviewed by Erin Pettit and two anonymous referees.
Alley, R. B., Andrews, J. T., Brigham-Grette, J., Clarke, G. K. C., Cuffey, K. M., Fitzpatrick, J. J., Funder, S., Marshall, S. J., Miller, G. H., Mitrovica, J. X., Muhs, D. R., Otto-Bliesner, B. L., Polyak, L., and White, J. W. C.: History of the Greenland Ice Sheet: paleoclimatic insights, Quat. Sci. Rev., 29, 1728–1756, https://doi.org/10.1016/j.quascirev.2010.02.007, 2010.
Arthern, R. J. and Wingham, D. J.: The Natural Fluctuations of Firn Densification and Their Effect on the Geodetic Determination of Ice Sheet Mass Balance, Clim. Change, 40, 605–624, https://doi.org/10.1023/A:1005320713306, 1998.
Banwell, A. F., Wever, N., Dunmire, D., and Picard, G.: Quantifying Antarctic-Wide Ice-Shelf Surface Melt Volume Using Microwave and Firn Model Data: 1980 to 2021, Geophys. Res. Lett., 50, e2023GL102744, https://doi.org/10.1029/2023GL102744, 2023.
Bartelt, P. and Lehning, M.: A physical SNOWPACK model for the Swiss avalanche warning Part I: numerical model, Cold Reg. Sci. Technol., 23, 23–145, https://doi.org/10.1016/S0165-232X(02)00074-5, 2002.
Bavay, M. and Egger, T.: MeteoIO 2.4.2: a preprocessing library for meteorological data, Geosci. Model Dev., 7, 3135–3151, https://doi.org/10.5194/gmd-7-3135-2014, 2014.
Broecker, W. S. and Van Donk, J.: Insolation changes, ice volumes, and the O18 record in deep-sea cores, Rev. Geophys., 8, 169–198, https://doi.org/10.1029/RG008i001p00169, 1970.
Charalampidis, C., Van As, D., Colgan, W. T., Fausto, R. S., Macferrin, M., and Machguth, H.: Thermal tracing of retained meltwater in the lower accumulation area of the Southwestern Greenland ice sheet, Ann. Glaciol., 57, 1–10, https://doi.org/10.1017/aog.2016.2, 2016.
Culberg, R., Schroeder, D. M., and Chu, W.: Extreme melt season ice layers reduce firn permeability across Greenland, Nat. Commun., 12, 2336, https://doi.org/10.1038/s41467-021-22656-5, 2021.
de la Peña, S., Howat, I. M., Nienow, P. W., van den Broeke, M. R., Mosley-Thompson, E., Price, S. F., Mair, D., Noël, B., and Sole, A. J.: Changes in the firn structure of the western Greenland Ice Sheet caused by recent warming, The Cryosphere, 9, 1203–1211, https://doi.org/10.5194/tc-9-1203-2015, 2015.
Dunmire, D., Lenaerts, J. T. M., Banwell, A. F., Wever, N., Shragge, J., Lhermitte, S., Drews, R., Pattyn, F., Hansen, J. S. S., Willis, I. C., Miller, J., and Keenan, E.: Observations of Buried Lake Drainage on the Antarctic Ice Sheet, Geophys. Res. Lett., 47, e2020GL087970, https://doi.org/10.1029/2020GL087970, 2020.
Dunmire, D., Banwell, A. F., Wever, N., Lenaerts, J. T. M., and Datta, R. T.: Contrasting regional variability of buried meltwater extent over 2 years across the Greenland Ice Sheet, The Cryosphere, 15, 2983–3005, https://doi.org/10.5194/tc-15-2983-2021, 2021.
Dunmire, D., Wever, N., Banwell, A. F., and Lenaerts, J. T. M.: Antarctic-wide ice-shelf firn emulation reveals robust future firn air depletion signal for the Antarctic Peninsula, Commun. Earth Environ., 5, 1–13, https://doi.org/10.1038/s43247-024-01255-4, 2024.
Forster, R. R., Box, J. E., Van den Broeke, M. R., Miège, C., Burgess, E. W., Van Angelen, J. H., Lenaerts, J. T. M., Koenig, L. S., Paden, J., Lewis, C., Gogineni, S. P., Leuschen, C., and McConnell, J. R.: Extensive liquid meltwater storage in firn within the Greenland ice sheet, Nat. Geosci., 7, 95–98, https://doi.org/10.1038/ngeo2043, 2014.
Fyke, J., Sergienko, O., Löfverström, M., Price, S., and Lenaerts, J. T. M.: An Overview of Interactions and Feedbacks Between Ice Sheets and the Earth System, Rev. Geophys., 56, 361–408, https://doi.org/10.1029/2018RG000600, 2018.
Gelaro, R., McCarty, W., Suárez, M. J., Todling, R., Molod, A., Takacs, L., Randles, C. A., Darmenov, A., Bosilovich, M. G., Reichle, R., Wargan, K., Coy, L., Cullather, R., Draper, C., Akella, S., Buchard, V., Conaty, A., Silva, A. M. da, Gu, W., Kim, G.-K., Koster, R., Lucchesi, R., Merkova, D., Nielsen, J. E., Partyka, G., Pawson, S., Putman, W., Rienecker, M., Schubert, S. D., Sienkiewicz, M., and Zhao, B.: The Modern-Era Retrospective Analysis for Research and Applications, Version 2 (MERRA-2), J. Climate, 30, 5419–5454, https://doi.org/10.1175/JCLI-D-16-0758.1, 2017.
Global Modeling and Assimilation Office (GMAO): MERRA-2 tavg1_2d_slv_Nx: 2d,1-Hourly,Time-Averaged,Single-Level,Assimilation,Single-Level Diagnostics V5.12.4, Greenbelt, MD, USA, Goddard Earth Sciences Data and Information Services Center (GES DISC) [data set], https://doi.org/10.5067/VJAFPLI1CSIV, 2015a.
Global Modeling and Assimilation Office (GMAO): MERRA-2 tavg1_2d_int_Nx: 2d,1-Hourly, Time-Averaged, Single-Level,Assimilation, Vertically Integrated Diagnostics V5.12.4, Greenbelt, MD, USA, Goddard Earth Sciences Data and Information Services Center (GES DISC) [data set], https://doi.org/10.5067/Q5GVUVUIVGO7, 2015b.
Global Modeling and Assimilation Office (GMAO): MERRA-2 tavg1_2d_rad_Nx: 2d,1-Hourly, Time-Averaged, Single-Level, Assimilation, Radiation Diagnostics V5.12.4, Greenbelt, MD, USA, Goddard Earth Sciences Data and Information Services Center (GES DISC) [data set], https://doi.org/10.5067/Q9QMY5PBNV1T, 2015c.
Global Modeling and Assimilation Office (GMAO): MERRA-2 tavg1_2d_slv_Nx: 2d, 1-Hourly, Time-Averaged, Single-Level, Assimilation, Single-Level Diagnostics V5.12.4, Greenbelt, MD, USA, Goddard Earth Sciences Data and Information Services Center (GES DISC) [data set], https://doi.org/10.5067/7MCPBJ41Y0K6, 2015d.
Graeter, K. A., Osterberg, E. C., Ferris, D. G., Hawley, R. L., Marshall, H. P., Lewis, G., Meehan, T., McCarthy, F., Overly, T., and Birkel, S. D.: Ice Core Records of West Greenland Melt and Climate Forcing, Geophys. Res. Lett., 45, 3164–3172, https://doi.org/10.1002/2017GL076641, 2018.
Groot Zwaaftink, C. D., Cagnati, A., Crepaz, A., Fierz, C., Macelloni, G., Valt, M., and Lehning, M.: Event-driven deposition of snow on the Antarctic Plateau: analyzing field measurements with SNOWPACK, The Cryosphere, 7, 333–347, https://doi.org/10.5194/tc-7-333-2013, 2013.
Hanna, E., Huybrechts, P., Steffen, K., Cappelen, J., Huff, R., Shuman, C., Irvine-Fynn, T., Wise, S., and Griffiths, M.: Increased Runoff from Melt from the Greenland Ice Sheet: A Response to Global Warming, J. Climate, 21, 331–341, https://doi.org/10.1175/2007JCLI1964.1, 2008.
Hanna, E., Cappelen, J., Fettweis, X., Mernild, S. H., Mote, T. L., Mottram, R., Steffen, K., Ballinger, T. J., and Hall, R. J.: Greenland surface air temperature changes from 1981 to 2019 and implications for ice-sheet melt and mass-balance change, Int. J. Climatol., 41, E1336–E1352, https://doi.org/10.1002/joc.6771, 2021.
Harper, J., Humphrey, N., Pfeffer, W. T., Brown, J., and Fettweis, X.: Greenland ice-sheet contribution to sea-level rise buffered by meltwater storage in firn, Nature, 491, 240–243, https://doi.org/10.1038/nature11566, 2012.
Herron, M. M. and Langway, C. C.: Firn Densification: An Empirical Model, J. Glaciol., 25, 373–385, https://doi.org/10.3189/S0022143000015239, 1980.
Horlings, A. N., Christianson, K., and Miège, C.: Expansion of Firn Aquifers in Southeast Greenland, J. Geophys. Res.-Earth Surf., 127, e2022JF006753, https://doi.org/10.1029/2022JF006753, 2022.
Humphrey, N. F., Harper, J. T., and Pfeffer, W. T.: Thermal tracking of meltwater retention in Greenland's accumulation area, J. Geophys. Res.-Earth Surf., 117, F01010, https://doi.org/10.1029/2011JF002083, 2012.
Izeboud, M., Lhermitte, S., Van Tricht, K., Lenaerts, J. T. M., Van Lipzig, N. P. M., and Wever, N.: The Spatiotemporal Variability of Cloud Radiative Effects on the Greenland Ice Sheet Surface Mass Balance, Geophys. Res. Lett., 47, e2020GL087315, https://doi.org/10.1029/2020GL087315, 2020.
Jullien, N., Tedstone, A. J., Machguth, H., Karlsson, N. B., and Helm, V.: Greenland Ice Sheet Ice Slab Expansion and Thickening, Geophys. Res. Lett., 50, e2022GL100911, https://doi.org/10.1029/2022GL100911, 2023.
Kay, J.: code for Thompson-Munson et al.: Greenland's firn responds more to warming than to cooling (2024, The Cryosphere), Zenodo [code], https://doi.org/10.5281/zenodo.12701499, 2024.
Keenan, E., Wever, N., Dattler, M., Lenaerts, J. T. M., Medley, B., Kuipers Munneke, P., and Reijmer, C.: Physics-based SNOWPACK model improves representation of near-surface Antarctic snow and firn density, The Cryosphere, 15, 1065–1085, https://doi.org/10.5194/tc-15-1065-2021, 2021.
Kuipers Munneke, P., Ligtenberg, S. R. M., Suder, E. A., and Van den Broeke, M. R.: A model study of the response of dry and wet firn to climate change, Ann. Glaciol., 56, 1–8, https://doi.org/10.3189/2015AoG70A994, 2015.
Lehning, M., Bartelt, P., Brown, B., and Fierz, C.: A physical SNOWPACK model for the Swiss avalanche warning Part III: meteorological forcing, thin layer formation and evaluation, Cold Reg. Sci. Technol., 16, 169–184, https://doi.org/10.1016/S0165-232X(02)00072-1, 2002a.
Lehning, M., Bartelt, P., Brown, B., Fierz, C., and Satyawali, P.: A physical SNOWPACK model for the Swiss avalanche warning Part II. Snow microstructure, Cold Reg. Sci. Technol., 21, 47–167, https://doi.org/10.1016/S0165-232X(02)00073-3, 2002b.
Lenaerts, J. T. M., Medley, B., Van den Broeke, M. R., and Wouters, B.: Observing and Modeling Ice Sheet Surface Mass Balance, Rev. Geophys., 57, 376–420, https://doi.org/10.1029/2018RG000622, 2019.
Li, J. and Zwally, H. J.: Response times of ice-sheet surface heights to changes in the rate of Antarctic firn compaction caused by accumulation and temperature variations, J. Glaciol., 61, 1037–1047, https://doi.org/10.3189/2015JoG14J182, 2015.
MacFerrin, M., Machguth, H., Van As, D., Charalampidis, C., Stevens, C. M., Heilig, A., Vandecrux, B., Langen, P. L., Mottram, R., Fettweis, X., Van den Broeke, M. R., Pfeffer, W. T., Moussavi, M. S., and Abdalati, W.: Rapid expansion of Greenland's low-permeability ice slabs, Nature, 573, 403–407, https://doi.org/10.1038/s41586-019-1550-3, 2019.
Machguth, H., MacFerrin, M., Van As, D., Box, J. E., Charalampidis, C., Colgan, W., Fausto, R. S., Meijer, H. A. J., Mosley-Thompson, E., and Van de Wal, R. S. W.: Greenland meltwater storage in firn limited by near-surface ice formation, Nat. Clim. Change, 6, 390–393, https://doi.org/10.1038/nclimate2899, 2016.
Maclennan, M. L., Lenaerts, J. T. M., Shields, C. A., Hoffman, A. O., Wever, N., Thompson-Munson, M., Winters, A. C., Pettit, E. C., Scambos, T. A., and Wille, J. D.: Climatology and surface impacts of atmospheric rivers on West Antarctica, The Cryosphere, 17, 865–881, https://doi.org/10.5194/tc-17-865-2023, 2023.
Manabe, S. and Wetherald, R. T.: The Effects of Doubling the CO2 Concentration on the climate of a General Circulation Model, J. Atmos. Sci., 32, 3–15, https://doi.org/10.1175/1520-0469(1975)032<0003:TEODTC>2.0.CO;2, 1975.
Meyer, C. R. and Hewitt, I. J.: A continuum model for meltwater flow through compacting snow, The Cryosphere, 11, 2799–2813, https://doi.org/10.5194/tc-11-2799-2017, 2017.
Michlmayr, G., Lehning, M., Koboltschnig, G., Holzmann, H., Zappa, M., Mott, R., and Schöner, W.: Application of the Alpine 3D model for glacier mass balance and glacier runoff studies at Goldbergkees, Austria, Hydrol. Process., 22, 3941–3949, https://doi.org/10.1002/hyp.7102, 2008.
Noël, B., Van de Berg, W. J., Lhermitte, S., and Van den Broeke, M. R.: Rapid ablation zone expansion amplifies north Greenland mass loss, Sci. Adv., 5, eaaw0123, https://doi.org/10.1126/sciadv.aaw0123, 2019.
Pfeffer, W. T. and Humphrey, N. F.: Determination of timing and location of water movement and ice-layer formation by temperature measurements in sub-freezing snow, J. Glaciol., 42, 292–304, https://doi.org/10.3189/S0022143000004159, 1996.
Pfeffer, W. T., Meier, M. F., and Illangasekare, T. H.: Retention of Greenland runoff by refreezing: Implications for projected future sea level change, J. Geophys. Res.-Oceans, 96, 22117–22124, https://doi.org/10.1029/91JC02502, 1991.
Polashenski, C., Courville, Z., Benson, C., Wagner, A., Chen, J., Wong, G., Hawley, R., and Hall, D.: Observations of pronounced Greenland ice sheet firn warming and implications for runoff production, Geophys. Res. Lett., 41, 4238–4246, https://doi.org/10.1002/2014GL059806, 2014.
Rennermalm, A. K., Hock, R., Covi, F., Xiao, J., Corti, G., Kingslake, J., Leidman, S. Z., Miège, C., Macferrin, M., Machguth, H., Osterberg, E., Kameda, T., and McConnell, J. R.: Shallow firn cores 1989–2019 in southwest Greenland's percolation zone reveal decreasing density and ice layer thickness after 2012, J. Glaciol., 68, 431–442, https://doi.org/10.1017/jog.2021.102, 2022.
Sherwood, S. C., Webb, M. J., Annan, J. D., Armour, K. C., Forster, P. M., Hargreaves, J. C., Hegerl, G., Klein, S. A., Marvel, K. D., Rohling, E. J., Watanabe, M., Andrews, T., Braconnot, P., Bretherton, C. S., Foster, G. L., Hausfather, Z., von der Heydt, A. S., Knutti, R., Mauritsen, T., Norris, J. R., Proistosescu, C., Rugenstein, M., Schmidt, G. A., Tokarska, K. B., and Zelinka, M. D.: An Assessment of Earth's Climate Sensitivity Using Multiple Lines of Evidence, Rev. Geophys., 58, e2019RG000678, https://doi.org/10.1029/2019RG000678, 2020.
Stearns, C. R. and Weidner, G. A.: Sensible and Latent Heat Flux Estimates in Antarctica, in: Antarctic Meteorology and Climatology: Studies Based on Automatic Weather Stations, American Geophysical Union (AGU), 109–138, 1993.
Steger, C. R., Reijmer, C. H., Van den Broeke, M. R., Wever, N., Forster, R. R., Koenig, L. S., Kuipers Munneke, P., Lehning, M., Lhermitte, S., Ligtenberg, S. R. M., Miège, C., and Noël, B. P. Y.: Firn Meltwater Retention on the Greenland Ice Sheet: A Model Comparison, Front. Earth Sci., 5, 3, https://doi.org/10.3389/feart.2017.00003, 2017.
Tedstone, A. J. and Machguth, H.: Increasing surface runoff from Greenland's firn areas, Nat. Clim. Change, 12, 672–676, https://doi.org/10.1038/s41558-022-01371-z, 2022.
Thompson-Munson, M., Kay, J., and Markle, B.: Modeled Greenland firn properties in warming and cooling experiments, Zenodo [data set], https://doi.org/10.5281/zenodo.10069583, 2023a.
Thompson-Munson, M., Wever, N., Stevens, C. M., Lenaerts, J. T. M., and Medley, B.: An evaluation of a physics-based firn model and a semi-empirical firn model across the Greenland Ice Sheet (1980–2020), The Cryosphere, 17, 2185–2209, https://doi.org/10.5194/tc-17-2185-2023, 2023b.
Trusel, L. D., Das, S. B., Osman, M. B., Evans, M. J., Smith, B. E., Fettweis, X., McConnell, J. R., Noël, B. P. Y., and Van den Broeke, M. R.: Nonlinear rise in Greenland runoff in response to post-industrial Arctic warming, Nature, 564, 104–108, https://doi.org/10.1038/s41586-018-0752-4, 2018.
Van Angelen, J. H., M. Lenaerts, J. T., Van den Broeke, M. R., Fettweis, X., and Van Meijgaard, E.: Rapid loss of firn pore space accelerates 21st century Greenland mass loss, Geophys. Res. Lett., 40, 2109–2113, https://doi.org/10.1002/grl.50490, 2013.
Vandecrux, B., Fausto, R. S., Langen, P. L., Van As, D., MacFerrin, M., Colgan, W. T., Ingeman-Nielsen, T., Steffen, K., Jensen, N. S., Møller, M. T., and Box, J. E.: Drivers of Firn Density on the Greenland Ice Sheet Revealed by Weather Station Observations and Modeling, J. Geophys. Res.-Earth Surf., 123, 2563–2576, https://doi.org/10.1029/2017JF004597, 2018.
Vandecrux, B., MacFerrin, M., Machguth, H., Colgan, W. T., van As, D., Heilig, A., Stevens, C. M., Charalampidis, C., Fausto, R. S., Morris, E. M., Mosley-Thompson, E., Koenig, L., Montgomery, L. N., Miège, C., Simonsen, S. B., Ingeman-Nielsen, T., and Box, J. E.: Firn data compilation reveals widespread decrease of firn air content in western Greenland, The Cryosphere, 13, 845–859, https://doi.org/10.5194/tc-13-845-2019, 2019.
Vandecrux, B., Fausto, R. S., Van As, D., Colgan, W., Langen, P. L., Haubner, K., Ingeman-Nielsen, T., Heilig, A., Stevens, C. M., MacFerrin, M., Niwano, M., Steffen, K., and Box, J. E.: Firn cold content evolution at nine sites on the Greenland ice sheet between 1998 and 2017, J. Glaciol., 66, 591–602, https://doi.org/10.1017/jog.2020.30, 2020.
Van Tricht, K., Lhermitte, S., Lenaerts, J. T. M., Gorodetskaya, I. V., L'Ecuyer, T. S., Noël, B., Van den Broeke, M. R., Turner, D. D., and Van Lipzig, N. P. M.: Clouds enhance Greenland ice sheet meltwater runoff, Nat. Commun., 7, 10266, https://doi.org/10.1038/ncomms10266, 2016.
van Wessem, J. M., Steger, C. R., Wever, N., and van den Broeke, M. R.: An exploratory modelling study of perennial firn aquifers in the Antarctic Peninsula for the period 1979–2016, The Cryosphere, 15, 695–714, https://doi.org/10.5194/tc-15-695-2021, 2021.
Verjans, V., Leeson, A. A., Stevens, C. M., MacFerrin, M., Noël, B., and van den Broeke, M. R.: Development of physically based liquid water schemes for Greenland firn-densification models, The Cryosphere, 13, 1819–1842, https://doi.org/10.5194/tc-13-1819-2019, 2019.
Wever, N., Fierz, C., Mitterer, C., Hirashima, H., and Lehning, M.: Solving Richards Equation for snow improves snowpack meltwater runoff estimations in detailed multi-layer snowpack model, The Cryosphere, 8, 257–274, https://doi.org/10.5194/tc-8-257-2014, 2014.
Wever, N., Schmid, L., Heilig, A., Eisen, O., Fierz, C., and Lehning, M.: Verification of the multi-layer SNOWPACK model with different water transport schemes, The Cryosphere, 9, 2271–2293, https://doi.org/10.5194/tc-9-2271-2015, 2015.
Wever, N., Würzer, S., Fierz, C., and Lehning, M.: Simulating ice layer formation under the presence of preferential flow in layered snowpacks, The Cryosphere, 10, 2731–2744, https://doi.org/10.5194/tc-10-2731-2016, 2016.
Wever, N., Keenan, E., Amory, C., Lehning, M., Sigmund, A., Huwald, H., and Lenaerts, J. T. M.: Observations and simulations of new snow density in the drifting snow-dominated environment of Antarctica, J. Glaciol., 69, 1–18, https://doi.org/10.1017/jog.2022.102, 2022.
WSL: MeteoIO and SNOWPACK, License: GNU LHPLv3, Institute for Snow and Avalanche Research SLF, Davos, Switzerland, WSL [code], https://gitlabext.wsl.ch/snow-models/snowpack, last access: 1 November 2022.