the Creative Commons Attribution 4.0 License.
the Creative Commons Attribution 4.0 License.
 | 19 Jul 2024
Widespread increase in discharge from west Antarctic Peninsula glaciers since 2018
Benjamin J. Davison
Anna E. Hogg
Carlos Moffat
Michael P. Meredith
Benjamin J. Wallis
Many glaciers on the Antarctic Peninsula have retreated and accelerated in recent decades. Here we show that there has been a widespread, quasi-synchronous, and sustained increase in grounding line discharge from glaciers on the west coast of the Antarctic Peninsula since 2018. Overall, the west Antarctic Peninsula discharge trends increased by over a factor of 3, from 50 Mt yr−2 during 2017 to 2020 up to 160 Mt yr−2 in the years following, leading to a 7.4 % increase in grounding line discharge since 2017. The acceleration in discharge was concentrated at glaciers connected to deep, cross-shelf troughs hosting warm-ocean waters, and the acceleration occurred during a period of anomalously high subsurface water temperatures on the continental shelf. Given that many of the affected glaciers have retreated over the past several decades in response to ocean warming, thereby highlighting their sensitivity to ocean forcing, we argue that the recent period of anomalously warm water was likely a key driver of the observed acceleration. However, the acceleration also occurred during a time of anomalously high atmospheric temperatures and glacier surface runoff, which could have contributed to speed-up by directly increasing basal water pressure and, by invigorating near-glacier ocean circulation, increasing submarine melt rates. The spatial pattern of glacier acceleration therefore provides an indication of glaciers that are exposed to warm-ocean water at depth and/or have active surface-to-bed hydrological connections; however, many stages in the chain of events leading to glacier acceleration, and how that response is affected by glacier-specific factors, remain insufficiently understood. Both atmospheric and ocean temperatures in this region and its surroundings are likely to increase further in the coming decades; therefore, there is a pressing need to improve our understanding of recent changes in Antarctic Peninsula glacier dynamics in response atmospheric and oceanic changes in order to improve projections of their behaviour over the coming century.
- Article
(7818 KB) - Full-text XML
- BibTeX
- EndNote


The Antarctic Peninsula (AP) hosts over 800 tidewater glaciers which collectively hold an ice mass equivalent to 69 ± 5 mm of global sea level rise (Huss and Farinotti, 2014). Substantial changes in glacier and ice shelf area have occurred across the AP since the mid-20th century (Cook and Vaughan, 2010; Doake and Vaughan, 1991; Rott et al., 1996). Many studies have focused on changes to AP ice shelves, including the retreat of Wordie Ice Shelf from 1966 to 1989 (Doake and Vaughan, 1991; Vaughan and Doake, 1996), Prince Gustav Ice Shelf during 1989 to 1995 (Cooper, 1997), Larsen A in 1995 (Rott et al., 1996), Larsen B in 2002 (Rack and Rott, 2004; Scambos et al., 2003), and Wilkins Ice Shelf in 2008 (Braun et al., 2009). These changes in ice shelf area have generally been attributed to rising surface air temperatures, leading to extensive melt ponding, hydrofracture, and rapid successive calving of elongate icebergs parallel to the ice shelf edge (Scambos et al., 2009). Glacier acceleration and thinning has followed the collapse of these ice shelves due to loss of ice shelf buttressing – the Larsen B tributary glaciers have become a heavily researched example of this response (Rignot et al., 2004; Scambos et al., 2004; Wuite et al., 2015; Rott et al., 2018; Seehaus et al., 2018). Although the well-documented initial acceleration and subsequent deceleration of those glaciers was substantial, measurements of AP mass change over recent decades remain uncertain because of very large uncertainties in bed elevation and surface mass balance (Rignot et al., 2019; Gardner et al., 2018; Hansen et al., 2021; Rott et al., 2018), though recent efforts to downscale regional climate model output has led to significant improvements (Noël et al., 2023).
Outside of ice shelf tributary glaciers, tidewater glaciers on the AP have received less research attention. The majority of such glaciers on the west coast have retreated since at least the 1980s (Cook et al., 2005; Cook and Vaughan, 2010; Cook et al., 2014), seemingly in response to increased flow of relatively warm (> 1 °C) Circumpolar Deep Water (CDW) onto the continental shelf south of Bransfield Strait (Cook et al., 2016). Glaciers in the southwest AP draining into the George VI Ice Shelf and Bellingshausen Sea have accelerated (Hogg et al., 2017) and thinned (Wouters et al., 2015) since the late 2000s. In addition to these long-term changes in area, speed, and thickness, many glaciers along the west AP coast appear to undergo seasonal changes in ice velocity (Wallis et al., 2023b; Boxall et al., 2022), which may be driven by changes in surface and upper-layer ocean temperature, surface-derived meltwater flow at the ice–bed interface, changes in sea ice coverage, or some combination thereof. Pulses of meltwater supply to the ice–bed interface, caused by rapid supraglacial lake drainage or extreme melt events, may cause some glaciers on the AP to undergo rapid, short-lived accelerations (Tuckett et al., 2019); but, insofar as they do occur, they remain challenging to detect (Rott et al., 2020).
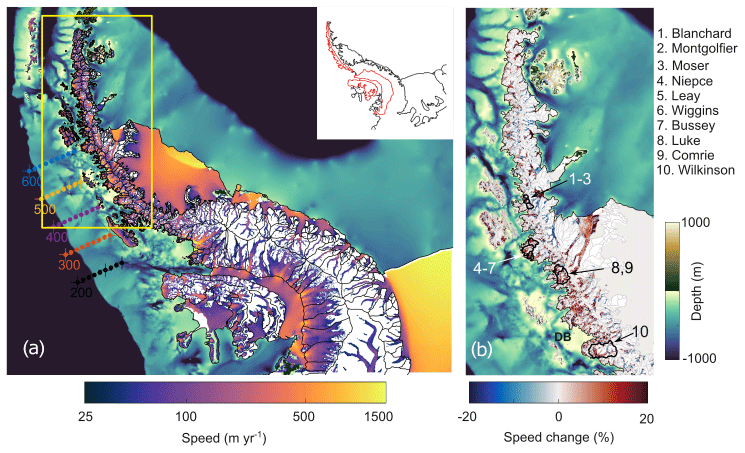
Figure 1Study area overview. (a) April 2014 to April 2024 mean ice speed and bathymetry (Morlighem et al., 2020) of the Antarctic Peninsula. Routinely repeated conductivity–temperature–depth (CTD) stations from the Palmer Long-Term Ecological Research (LTER) programme shown by numbered and coloured dots. The crossed dots indicate CTD stations acquired since 2009. Glacier drainage basins (Cook et al., 2014) are outlined in black, and the inset shows basins Hp-I and west Graham Land outlined in red. (b) Ice speed change between the periods 1 April 2017 to 1 September 2020 and 1 April 2020 to 1 September 2023 as a percentage of the long-term average speed. DB (b) indicates Darbel Bay.
More recently, a large and sustained acceleration and retreat of Cadman Glacier on the west AP has been documented (Wallis et al., 2023a). This acceleration and retreat began in 2018 during a period of anomalously high subsurface ocean temperatures on the continental shelf, due to an incursion of warm CDW. While the glaciers immediately adjacent to Cadman Glacier were protected from this incursion of warm CDW by shallow sills, many glaciers on the west AP will not have such protective sills, raising the possibility of a more widespread response of glaciers on the west AP. Identifying and attributing such a response is important because understanding the drivers of grounded ice speed change is informative for interpreting present-day glacier mass changes and for reducing uncertainties in projections of future glacier mass change. In this study, we examine changes in ice speed, grounding line discharge, terminus positions, and ocean temperature along a substantial section of the west AP (Fig. 1) during this period of anomalously high atmospheric and subsurface ocean temperature.
2.1 Grounding line discharge
Grounding line discharge is the rate of mass flowing across the glacier grounding line towards the sea. In the case of tidewater glaciers with relatively stable termini, it approximates the calving flux. We use the dataset of Davison et al. (2023a), which provides a monthly average grounding line discharge through 16 flux gates located between 3 and 6 km upstream of the MEaSUREs grounding line (Mouginot et al., 2017); readers are referred to Davison et al. (2023a) for full methodological details. For the purposes of this study, we use the “FrankenBed” version of the discharge dataset, which uses a 100 m × 100 m bedrock grid for the Antarctic Peninsula (Huss and Farinotti, 2014), removes firn air content using the Institute for Marine and Atmospheric Research Utrecht Firn Densification Model (Veldhuijsen et al., 2022) and accounts for changes in surface elevation over time using time-dependent polynomial fits to observed surface elevation changes posted on a 5 km × 5 km grid at quarterly intervals (Shepherd et al., 2019). The correction for firn air content affects the total grounding line discharge through each basin but has no impact on the trends in grounding line discharge. The correction for changes in surface elevation results in an overall 1 % decrease in grounding line discharge from 1996 to 2021, and thus is not expected to significantly affect grounding line discharge trends at the majority of glaciers examined here. Some glaciers on the west AP, such as Cadman Glacier, have undergone substantial thinning in recent years (Wallis et al., 2023a), and those changes are included in this dataset. During the study period (2017 to 2023), all the discharge estimates are calculated using 100 m × 100 m velocity estimates derived from intensity tracking of the Sentinel-1 6 and 12 d image pairs, making them particularly suitable for resolving changes in speed on the relatively narrow outlet glaciers of the AP. The discharge dataset includes the discharge time series for all glacier basins on the AP, as defined by Cook et al. (2014). In this study, we restrict our analysis to 569 glaciers in the west AP, which we define as basins whose centre coordinate falls within west Graham Land or basin Hp-I, as defined by Mouginot et al. (2017) (Fig. 1).
2.2 Discharge change point
For each tidewater glacier basin on the west AP, we used change point analysis to identify the single most substantial change in grounding line discharge linear trends since 2017. Change points were defined as the time at which the linear discharge trends before and after the change point differ the most. To reduce aliasing seasonal discharge variability, we excluded change points falling within 20 months (25 %) of the beginning or end of the study period. For all basins, we calculated the linear discharge trend before and after the identified change point to highlight glaciers that underwent a trend acceleration or even a trend reversal. Although we calculate a change point for all glaciers, we note that not all glaciers underwent a significant change in discharge. To identify glaciers with a significant acceleration, we isolated basins where the discharge trend during the second period was positive, at least 50 % greater than during the first period, and where the P value of the trend during the second period was less than 0.1 – we chose not to restrict our analysis just to basins with more significant trends (e.g. P < 0.05) because of the short time periods over which trends were calculated. We then further tested for the sensitivity of the timing of the change point by incrementing the change point in 1-month intervals for 3 months on either side of the initial change point. Only glaciers for which each of the above conditions were met using all seven change points were considered to have undergone a significant, sustained discharge trend change that was not sensitive to seasonal variability. Throughout this study, we present discharge trends and trend changes for all glaciers identified as having undergone a significant and sustained discharge trend change, focusing on the timing and spatial distribution of those changes with respect to changes in atmospheric and oceanic conditions. Furthermore, 10 of those glaciers with the strongest changes in discharge trend (locations in Fig. 1) were selected for detailed examination and for demonstration of the discharge trend changes.
2.3 Terminus positions
For each of the 10 example glaciers, we measured interannual changes in the glacier terminus position by delineating termini in all available cloud-free Sentinel-2 imagery between February and May each year from 2016 to 2023. Higher-frequency measurements show that there is seasonal terminus advance and retreat along the west AP, with the most advanced positions generally occurring at the end of the austral winter, and the most retreated positions occurring at the end of summer (Wallis et al., 2023b). By focusing on Sentinel-2 imagery from February to May, our measurements approximate the seasonally most retreated position while avoiding the difficulties posed by low-radar backscatter during the melt events and by the digital elevation model artefacts that can affect Sentinel-1 Ground Range Detected (GRD) imagery in this area of steep topography. We perform the terminus delineations in the Google Earth Engine Digitisation Tool (GEEDiT) and use the multi-centreline method in the Margin change Quantification Tool (MaQiT) to calculate the width-averaged terminus position change for each glacier (Lea, 2018). When calculating the width-averaged terminus position change, we only include sections of the terminus delineated at every measurement epoch.
2.4 Atmospheric and ocean temperature change
We extract daily 2 m atmospheric temperatures over the west AP from 1979 through 2023 from ERA5 reanalyses (Hersbach et al., 2020) and calculate daily anomalies relative to the 1979–2008 daily climatology. We calculate ocean temperature anomalies along five conductivity–temperature–depth (CTD) sections occupied during the Palmer Long-Term Ecological Research (LTER) programme (Smith et al., 1995). The Palmer LTER CTD dataset provides quasi-annual snapshots of conservative ocean temperature, typically during January, along transects from beyond the continental shelf break to near the west AP coastline. For this study, we selected the five transects occupied most frequently (locations in Fig. 1), each separated by approximately 100 km, extending from Marguerite Bay in the south to Palmer Basin in the north. In 2009, the Palmer LTER programme extended its sampling grid latitudinally but reduced its cross-shore resolution (Fig. 1). Here, we calculate conservative temperature anomalies during each cruise relative to the 1999–2008 mean for each transect, during which time the programme was still using the high-resolution grid. We also examine daily runoff time series from 5 km × 5 km resolution RACMO2.3p2 (van Wessem et al., 2018).
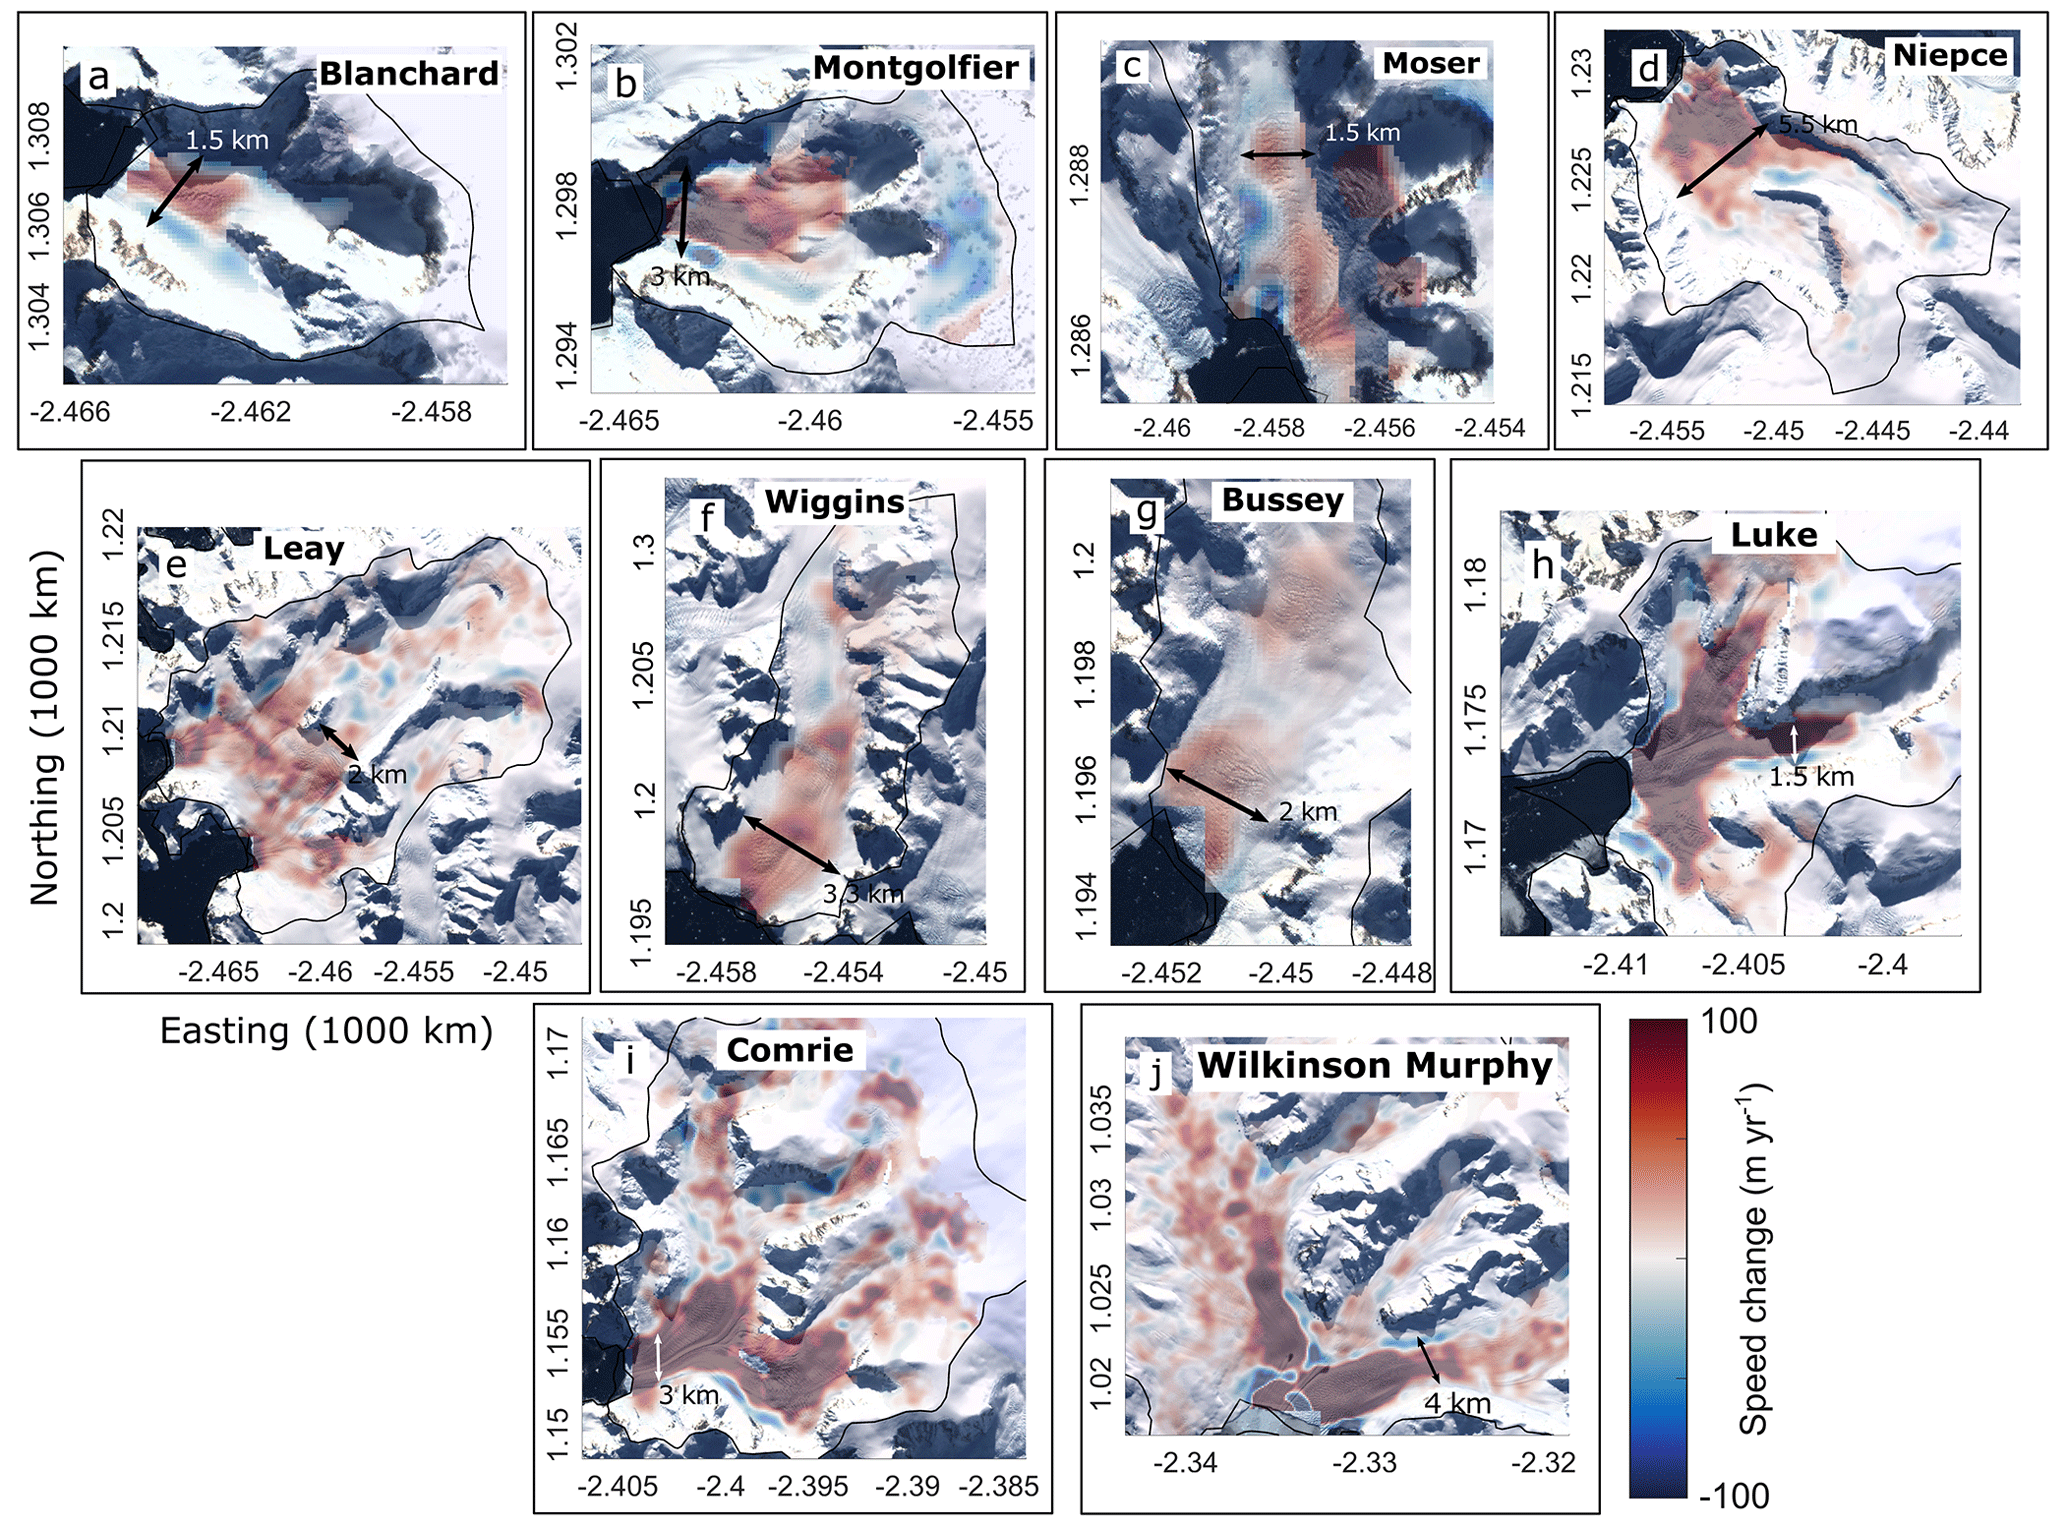
Figure 2Speed change in the selected glaciers between the periods 1 April 2017 to 1 September 2020 and 1 April 2020 to 1 September 2023. (a) Whitecloud, (b) Blanchard, (c) Montgolfier, (d) Moser, (e) Bolton, (f) Niépce, (g) Leay, (h) Wiggins, (i) Bussey, (j) Luke, (k) Comrie, and (l) Wilkinson–Murphy. The background is the 15 m × 15 m Landsat Image Mosaic of Antarctica (Bindschadler et al., 2008).
3.1 Acceleration in grounding line discharge
We observe widespread changes in speed on the AP between the April 2017 to September 2020 and April 2020 to September 2023 periods (Figs. 1b and 2). Many tidewater glaciers draining the west AP have accelerated by 5 % to 20 % since April 2017, leading to an overall 7 Gt yr−1 (7.4 %) increase in west AP grounding line discharge. This acceleration was most pronounced in the fast-flowing trunks of the larger outlet glaciers and was clearest at Montgolfier Glacier, Niépce Glacier, Luke Glacier, Comrie Glacier, and Wilkinson–Murphy Glacier, where speeds increased by over 20 % (Fig. 2). At some glaciers, such as Blanchard Glacier and Montgolfier Glacier, we observe deceleration in the shear margins and around high-elevation ice falls (Fig. 2b and c), which we hypothesise is due to shear margin weakening and dynamic thinning, respectively.
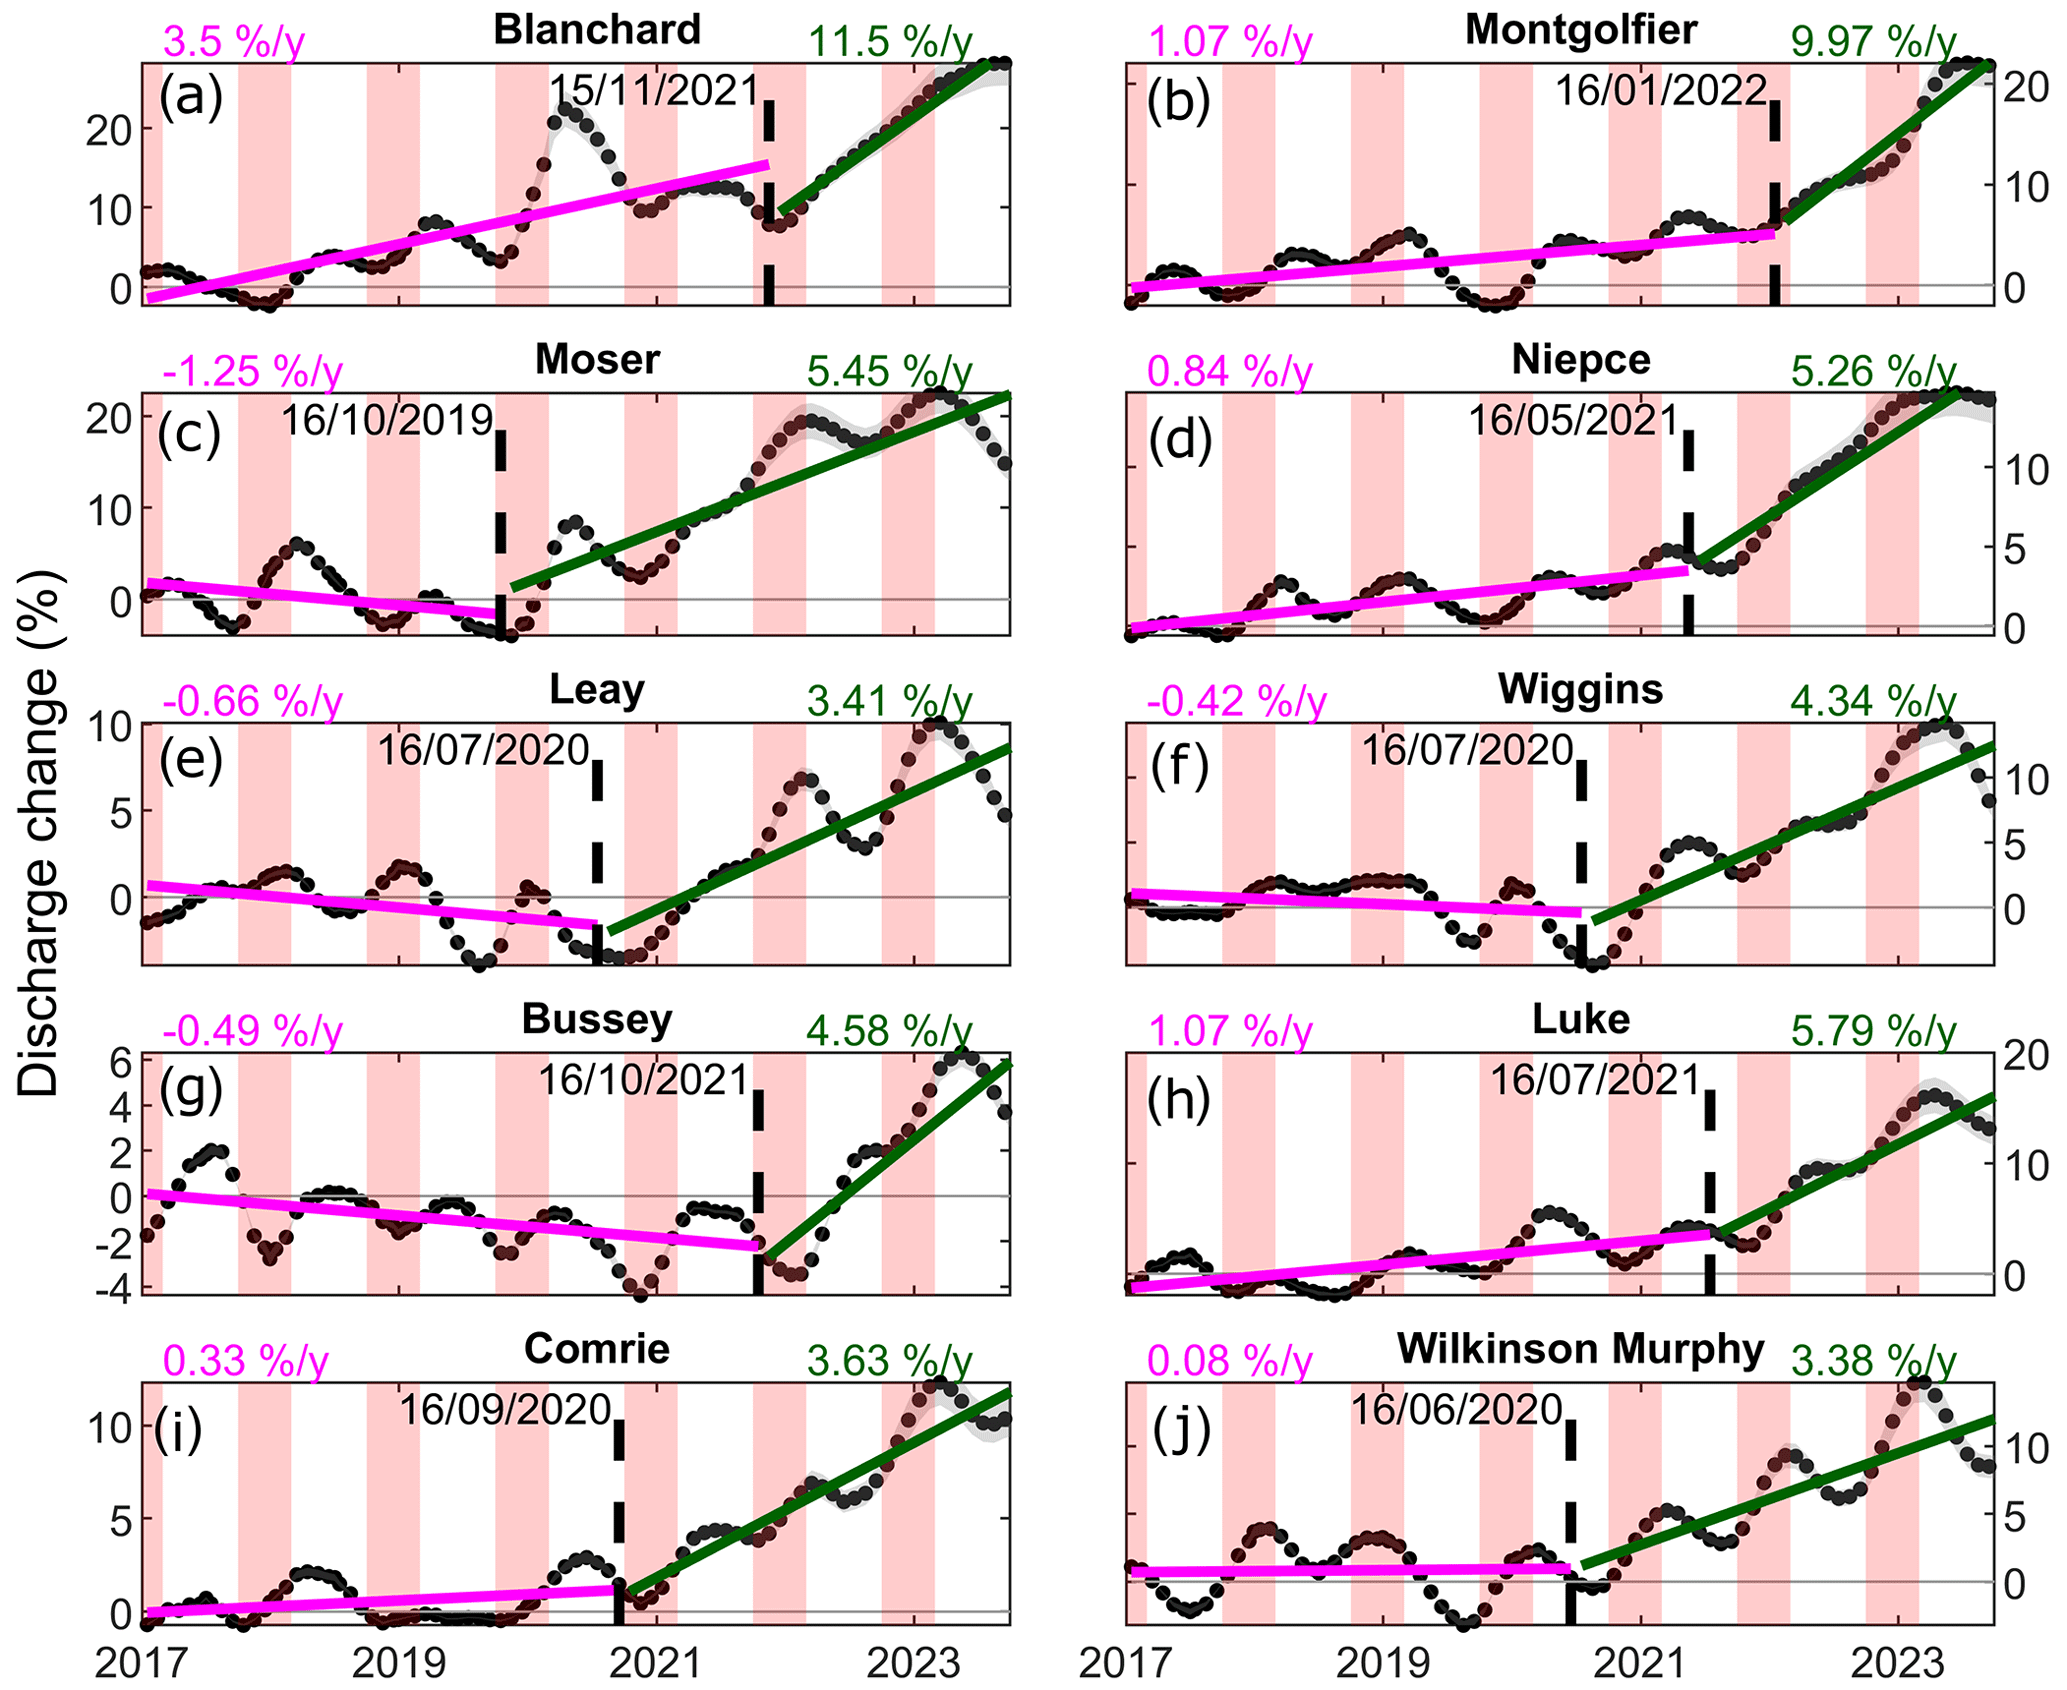
Figure 3Grounding line discharge change at selected glaciers. In each panel, grounding line discharge change (relative to the 2017 mean) and associated error are shown as black dots and grey shading. The timing of the change in discharge trend is shown by the dashed line with the date labelled. The linear trends before and after the change point are shown in magenta and green, respectively. The red shading indicates the austral summer (December through February).
Throughout the observation period, grounding line discharge increased at 177 basins on the west AP, such that it was significantly correlated with time (R2 ≥ 0.5 and P < 0.05), while 49 basins underwent an overall decrease in grounding line discharge. For some basins, the discharge increase is relatively steady and is part of a longer-term trend – these glaciers are not the focus of this study. We instead focus on glaciers that underwent a notable increase in linear discharge trends between 2018 and 2021 (Figs. 3 to 5). To illustrate these linear trend increases, grounding line discharge at Wilkinson–Murphy Glacier remained steady at 2017 levels, with fluctuations in the magnitude smaller than 5 % from 2017 to June 2020, after which discharge increased at a rate of 3.4 % yr−1 to a maximum around 10 % greater than 2017 levels (Fig. 3j). Similarly, the positive trends in discharge at Montgolfier Glacier, Niépce Glacier, and Luke Glacier all increased by more than a factor of 5 between May 2021 and January 2022 (Fig. 3b, d, and h). Some glaciers, such as Moser Glacier, Leay Glacier, and Bussey Glacier transitioned from a period of weakly declining discharge to very strongly increasing discharge during this broad period of acceleration (Fig. 3c, e, and g).
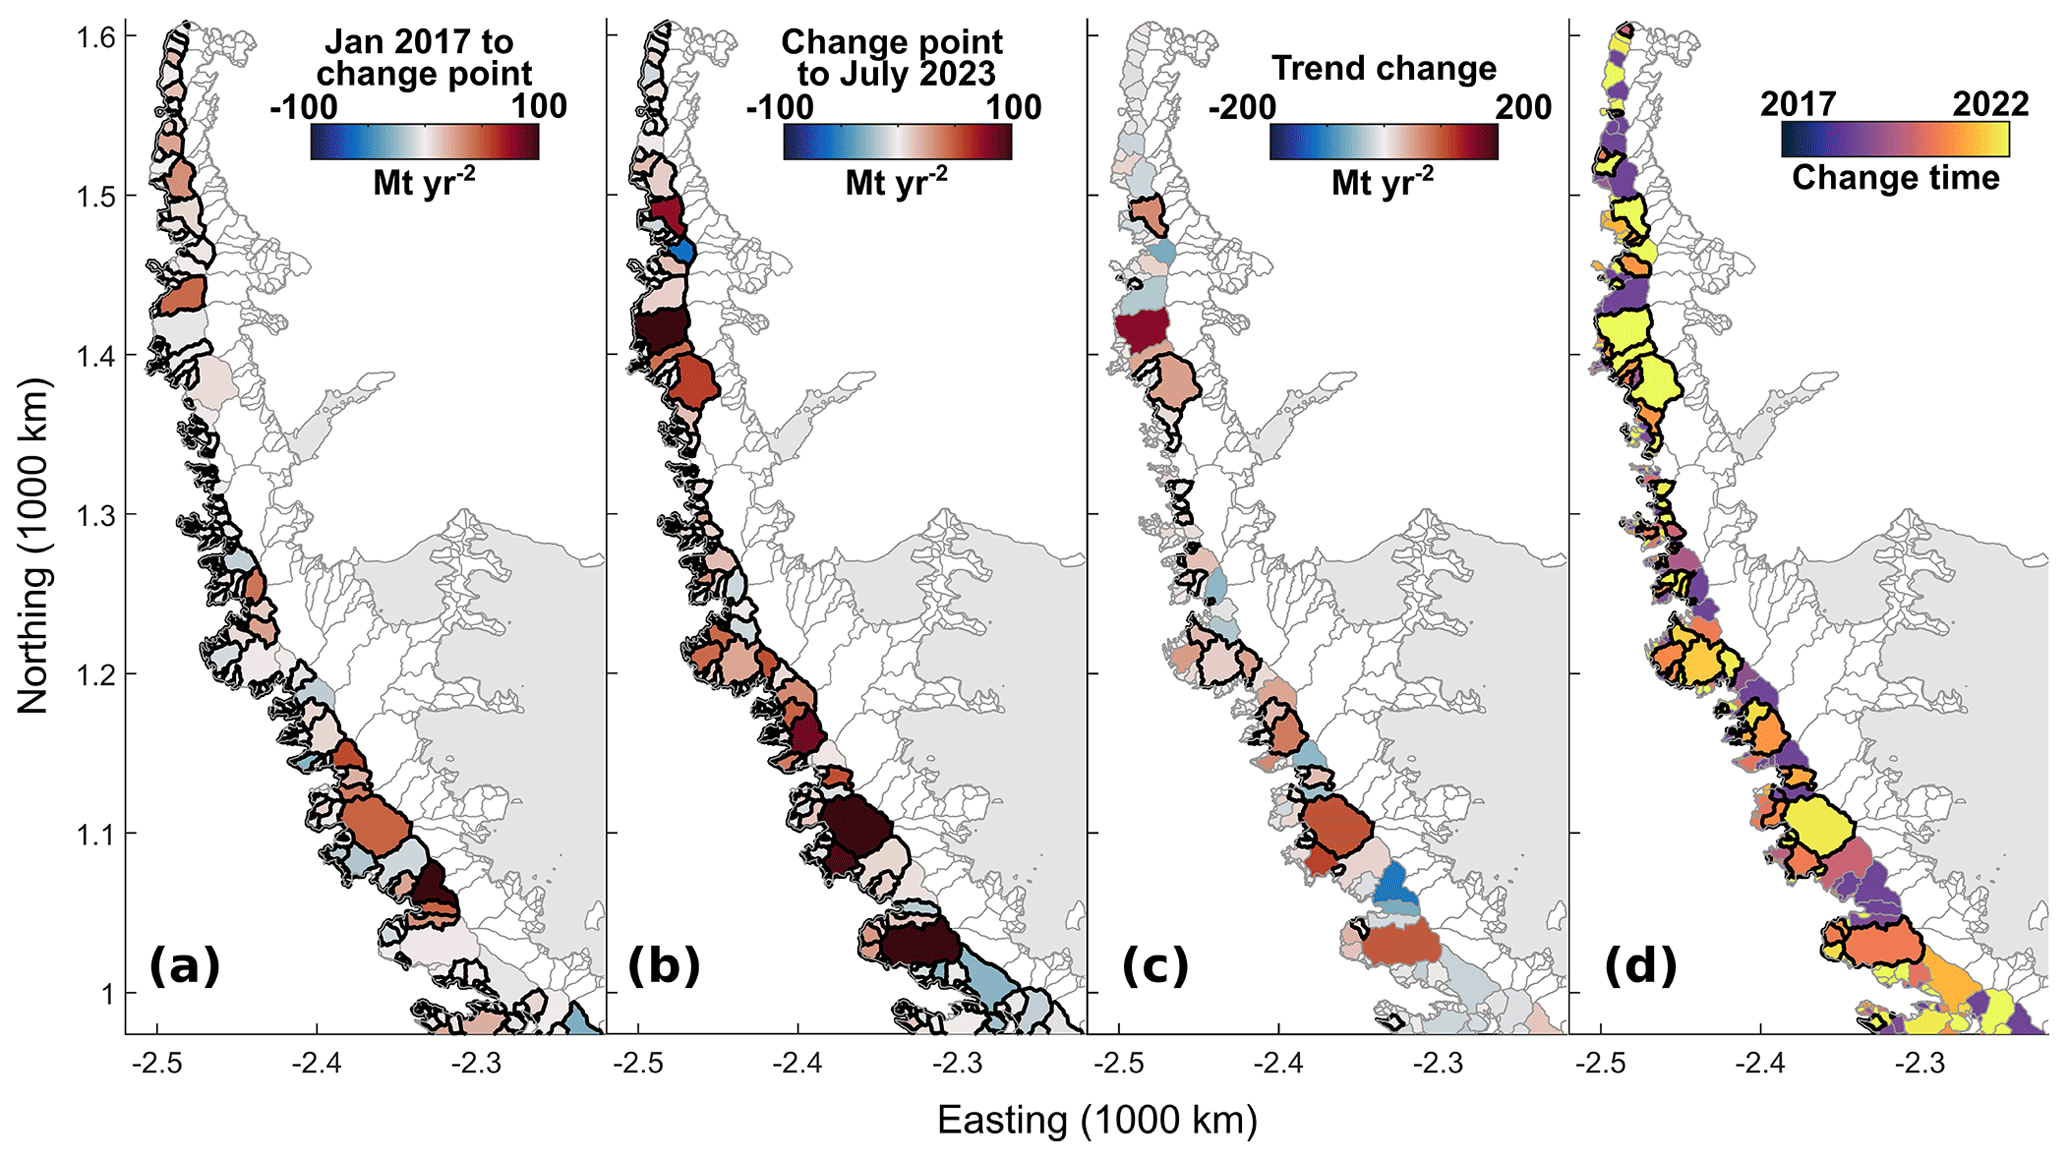
Figure 4Overview of discharge trend changes. (a) Linear trend in discharge from January 2017 to the change point for each basin on the west coast of the Antarctic Peninsula. (b) Linear trend in discharge from the change point to July 2023. (c) The change in discharge trend before and after the change point, with positive values indicating a trend increase. (d) The timing of the discharge trend change. Basins with significant trends (P < 0.05; (a, b)) or significant trend increases (see text for details; (c, d)) are outlined in black.
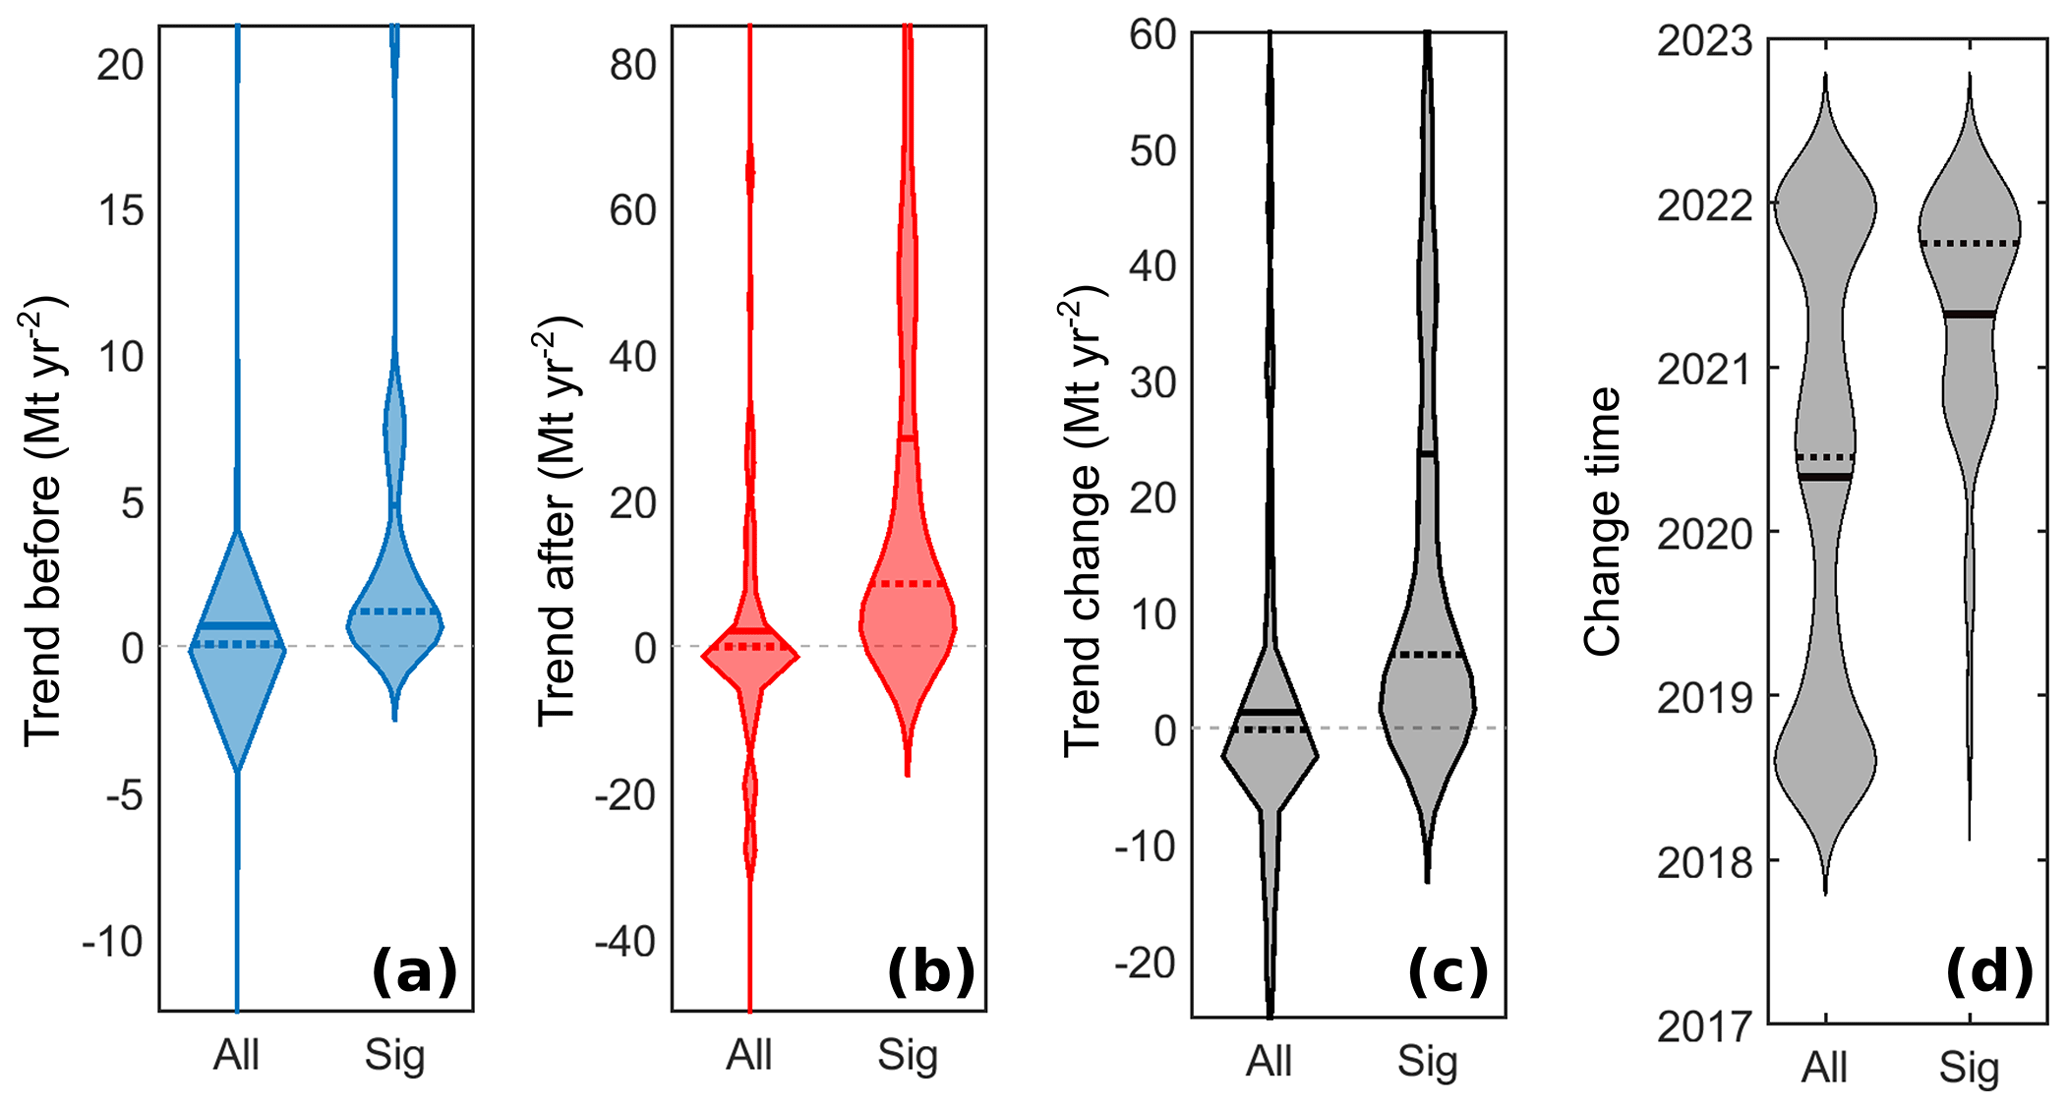
Figure 5Violin plot overview of discharge trend changes. (a) Linear trend in discharge from January 2017 to the change point for each basin on the west coast of the Antarctic Peninsula. (b) Linear trend in discharge from the change point to July 2023. (c) The change in discharge trend before and after the change point, with positive values indicating a trend increase. (d) The timing of the discharge trend change. Basins with significant trend increases (see text for details) are labelled “Sig”. Note the change in the y-axis scale between panel (a) and panel (b).
These large increases in linear discharge trends are widespread along the west AP (Figs. 4 and 5). Overall, 97 of the 569 glaciers on the west AP exhibited a 50 % or greater increase in linear discharge trend. Of those 97 glaciers, 42 were insensitive to the timing of the discharge change point within a 7-month period. In comparison, only 7 glaciers underwent a significant decrease in discharge trend when calculated using the same methods. There is a clear spatial pattern to these increases in linear discharge trends; the majority of glaciers north of Blanchard Glacier and south of Wilkinson–Murphy Glacier have generally had little change in the discharge trend since 2017. The majority of glaciers that underwent a significant increase in discharge were located in the central west AP, between Blanchard and Wilkinson–Murphy glaciers. Within the central west AP, there appears to be some clustering to the discharge changes. Some areas, such as Darbel Bay (location in Fig. 1), host several glaciers that appear to have little change in discharge. In the case of Darbel Bay, the bathymetry is shallow (< 100 m based on BedMachine v3; Morlighem et al., 2020), limiting the transport of warm CDW to the coast. However, other “low responders” do not always coincide with areas of shallow bathymetry and sometimes have responsive neighbouring glaciers. As in Wallis et al. (2023a), these cases may reflect the presence of shallow bathymetric sills not captured by BedMachine v3, which would act as barriers to incursions of warm water below the sill depth (Bao and Moffat, 2024).
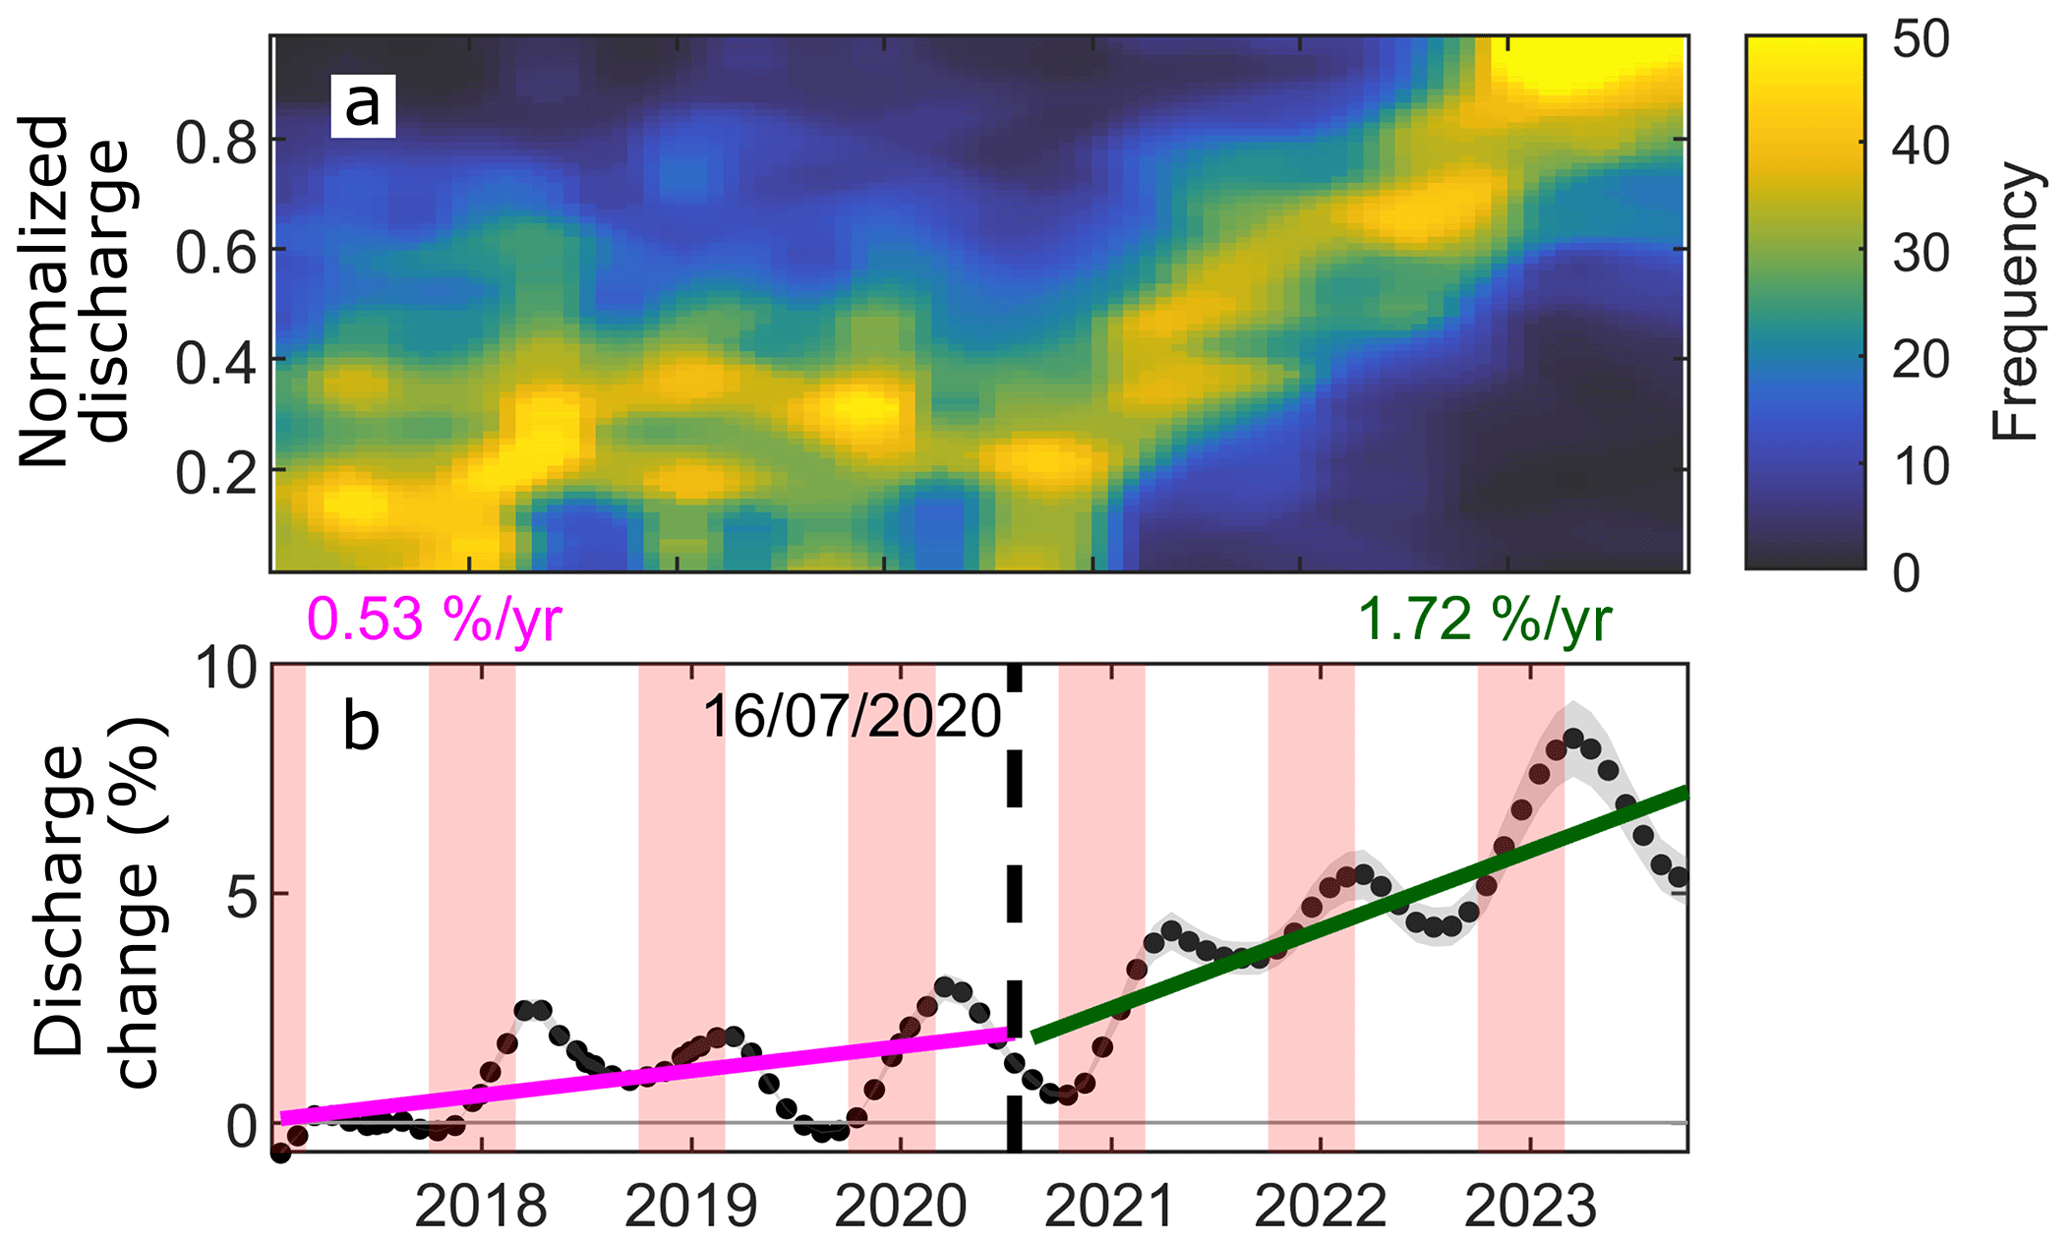
Figure 6Discharge change across the west Antarctic Peninsula. (a) Frequency density of normalised discharge time series. Only west AP basins with a trend increase of more than 50 % (N = 97) were included to illustrate the synchronicity of the acceleration. (b) Grounding line discharge change (relative to the 2017 mean) of west Graham Land and associated error are shown as black dots and grey shading. The dashed line shows the timing of the change in discharge trend. The magenta and green lines show the linear trends before and after the change point. The red shading indicates the austral summer (December through February).
There is broad consistency in the timing of discharge trend changes amongst west AP glaciers (Figs. 4 to 6). A vast majority of glaciers with significant discharge trend increases began to accelerate between November 2020 and November 2021 (Figs. 5d and 6), though there is spread around this period (Figs. 3, 4d, and 5d). Prior to the change point for each glacier, there was a range of discharge trends, with some glaciers decelerating, accelerating, or remaining approximately steady with less discharge than in 2023 (Figs. 5 and 6). Since the 2020/2021 austral summer, however, there has been a widespread, quasi-synchronous acceleration in glaciers along a large section of the central west AP, leading to peak discharge at or near the end of our observations in 2023 (Fig. 6).
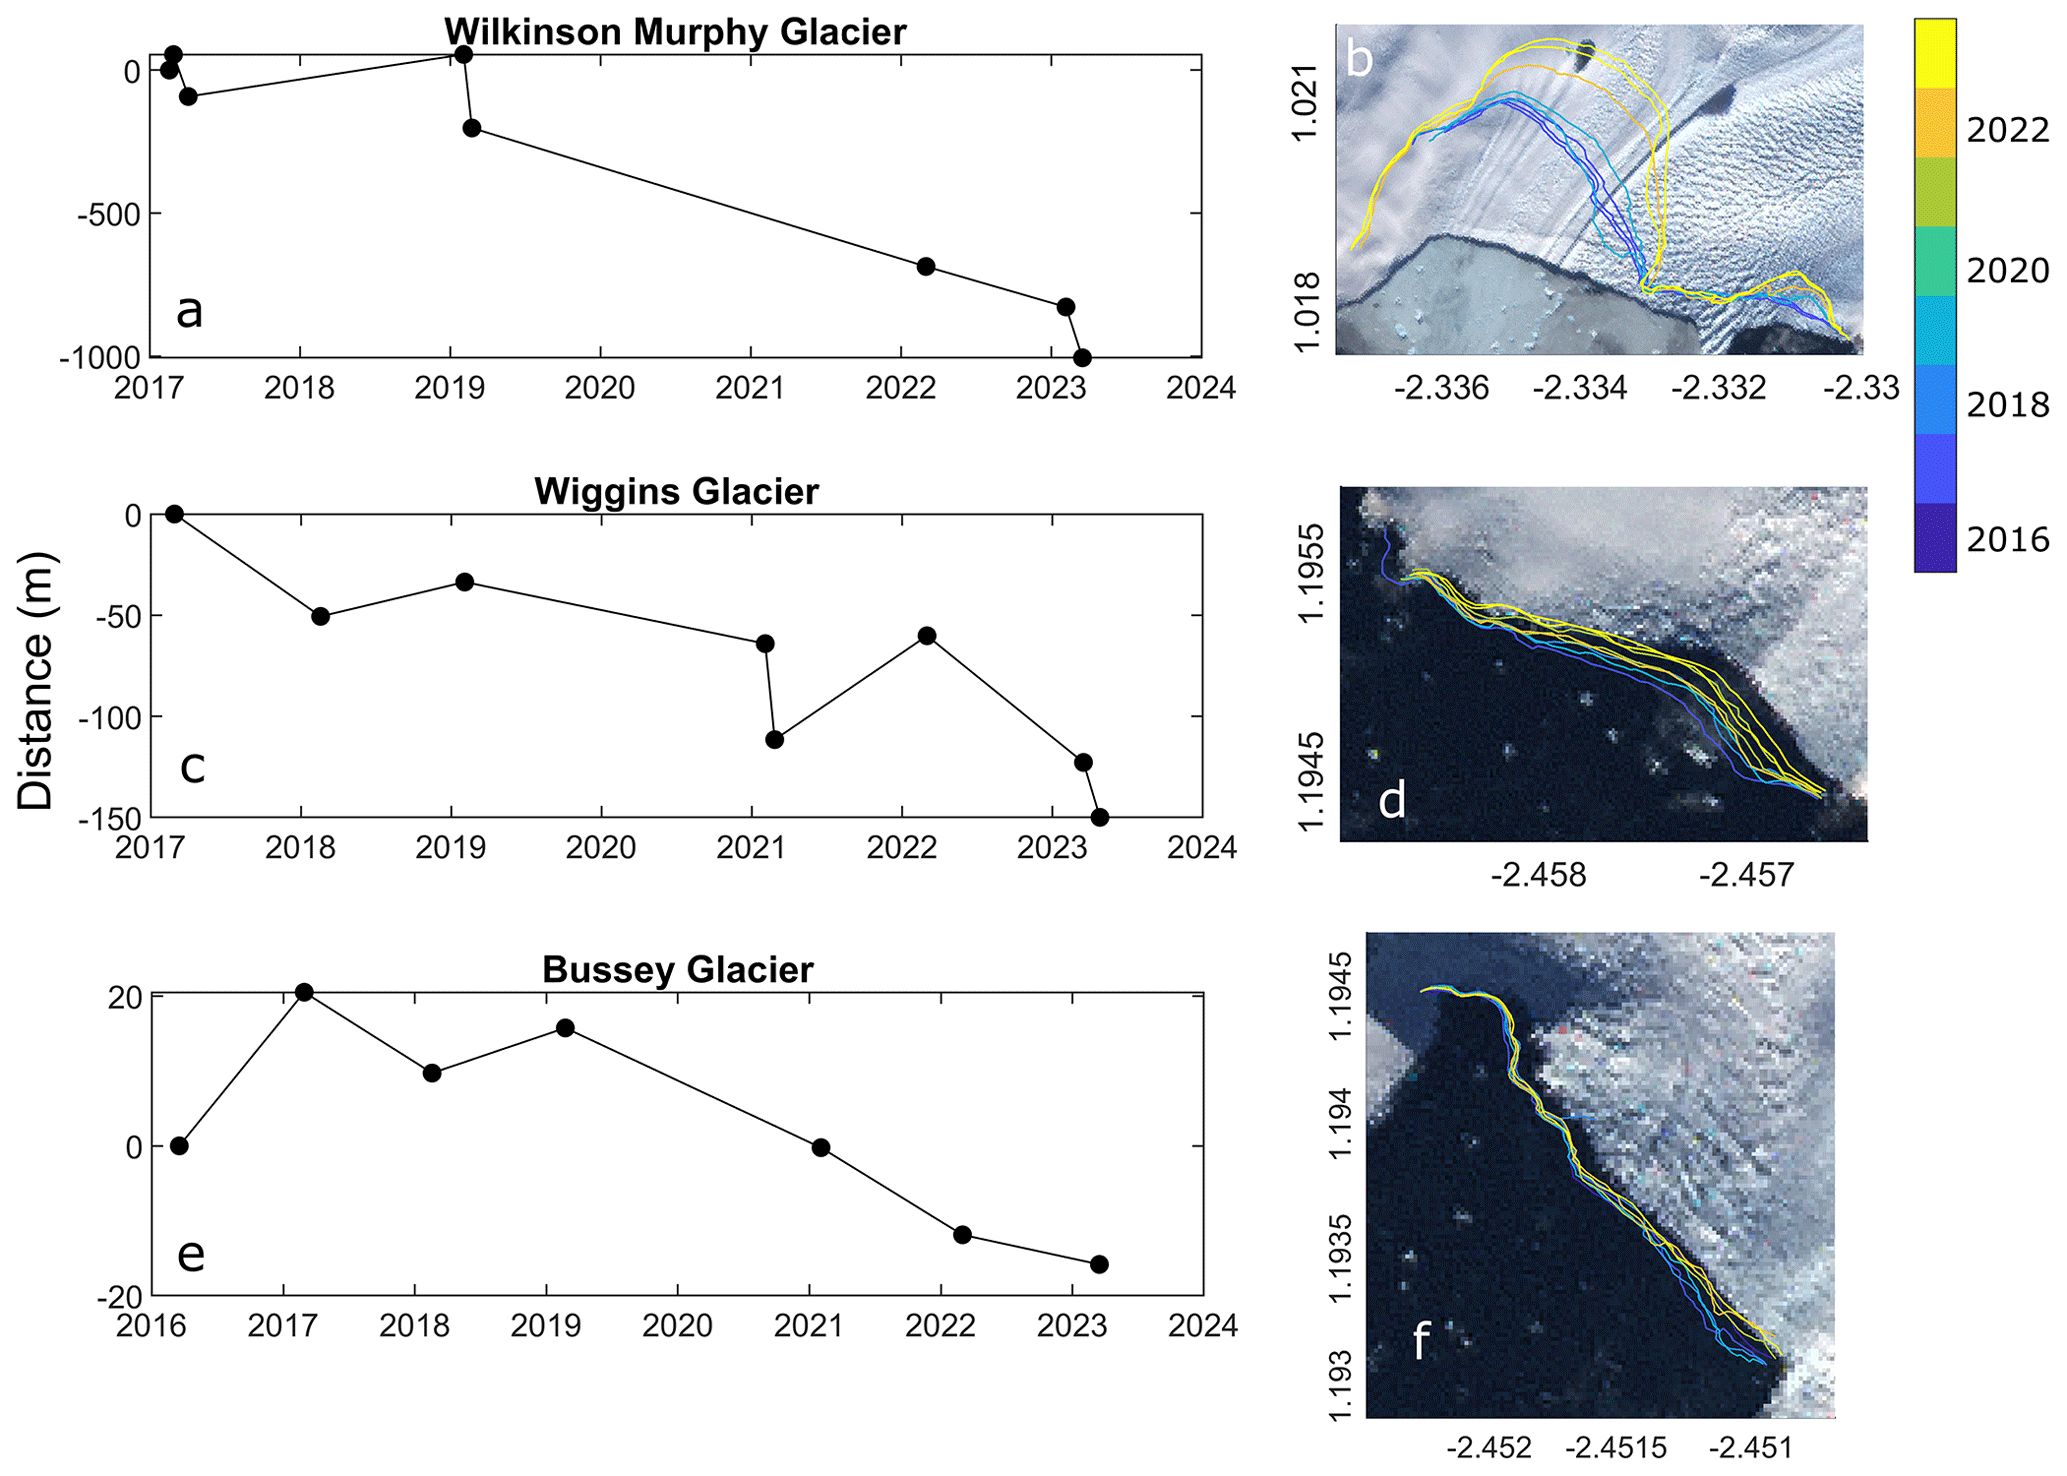
Figure 7Overview of terminus position changes at four of the selected glaciers. The left column (a, c, e) shows the width-averaged terminus position change relative to the first measurement. The right column (b, d, f) illustrates the location of the terminus at each measurement time, overlaid on the 15 m × 15 m Landsat Image Mosaic of Antarctica (Bindschadler et al., 2008). The units in panels (b), (d), and (f) are 1000 km, and the projection is South Polar Stereographic (EPSG 3031).
3.2 Terminus position change
We examined changes in terminus position at the end of the austral summer from 2016 to 2023 at our 10 example glaciers. Perhaps surprisingly, inter-annual terminus position changes at 7 of the 10 selected glaciers are negligible or not discernible from seasonal fluctuations in terminus position (not shown). Bussey Glacier exhibited modest but clear retreat of just 20 m on average and by 150 m on its true left margin (Fig. 7). Wiggins Glacier experienced slightly greater retreat of over 100 m averaged across the width of the terminus and by approximately 240 m at the most affected section (Fig. 6). Wilkinson–Murphy Glacier has retreated by 1 km on average since 2017 and by over 1.5 km across much of its fast-flowing centre (Fig. 7). The timing of terminus position changes at these glaciers broadly coincides with the observed changes in grounding line discharge, with the majority of retreat having occurred since 2019.
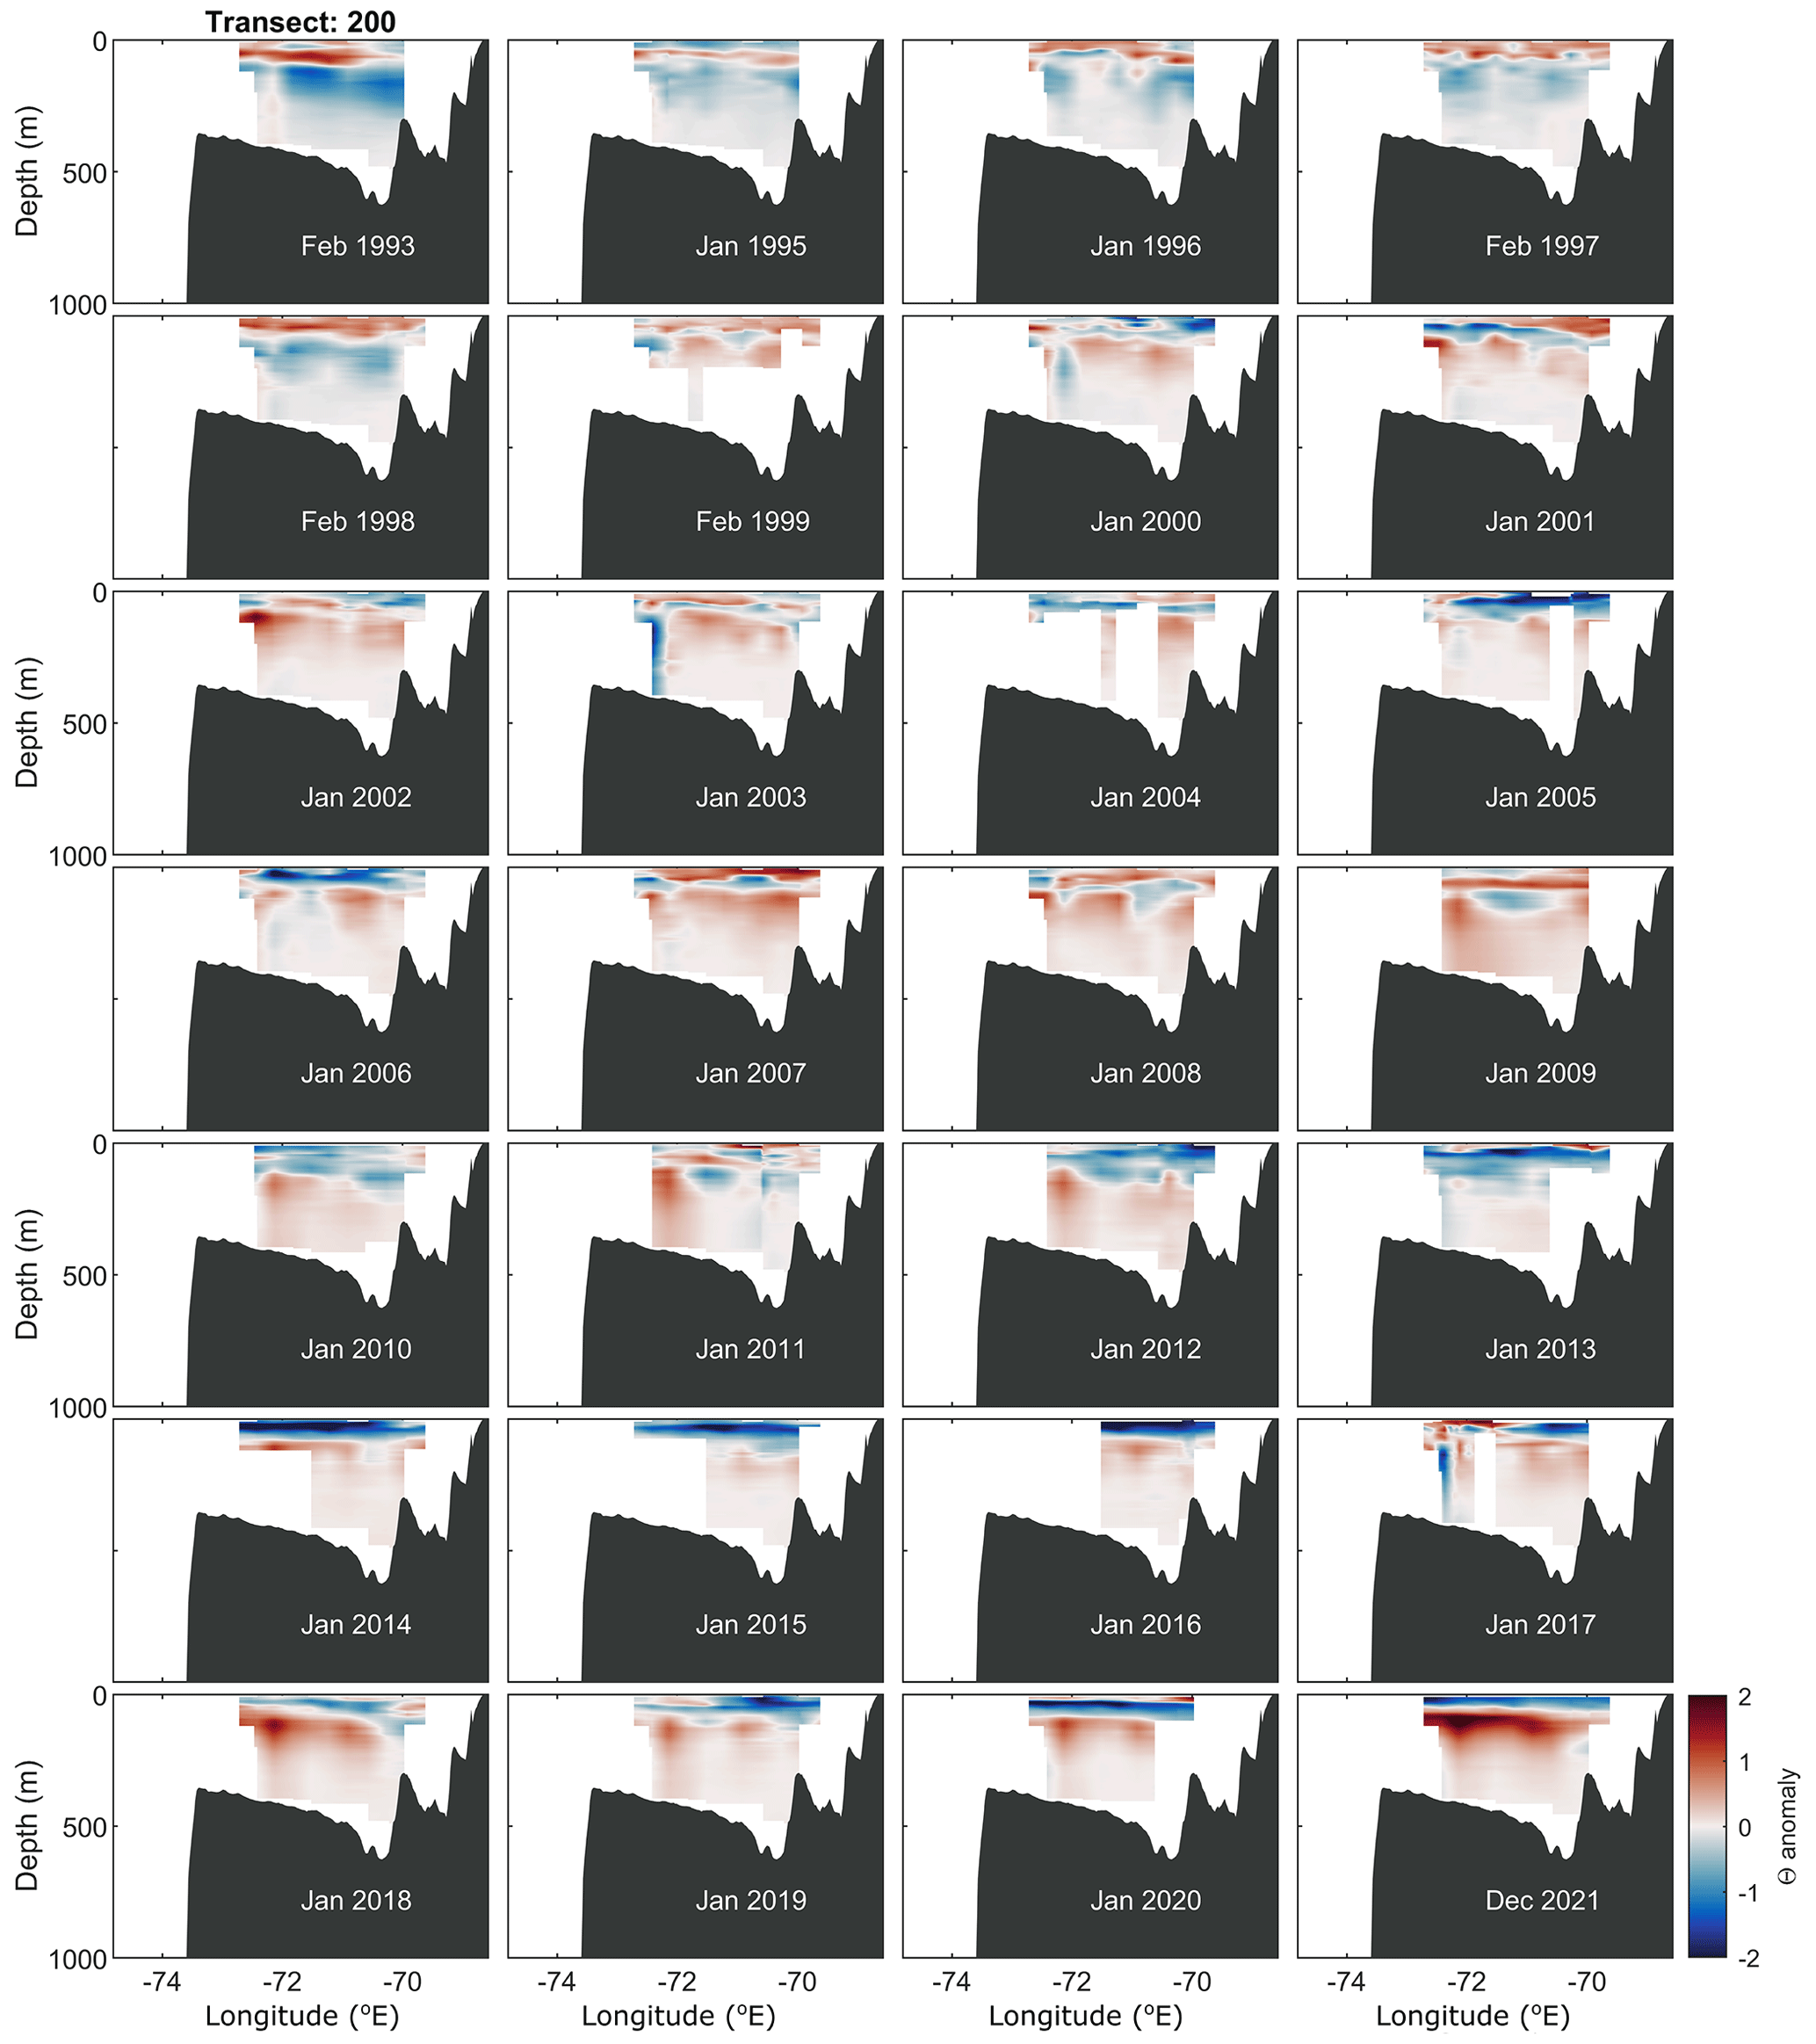
Figure 8Conservative temperature anomalies relative to the 1999–2008 mean along transect 200. The vertical dashed grey lines indicate individual cast locations – note that the panel outlines obscure casts at the transect endpoints. The dark grey shading is topography from BedMachine v3 (Morlighem et al., 2020), and the Antarctic Peninsula coast is on the right.
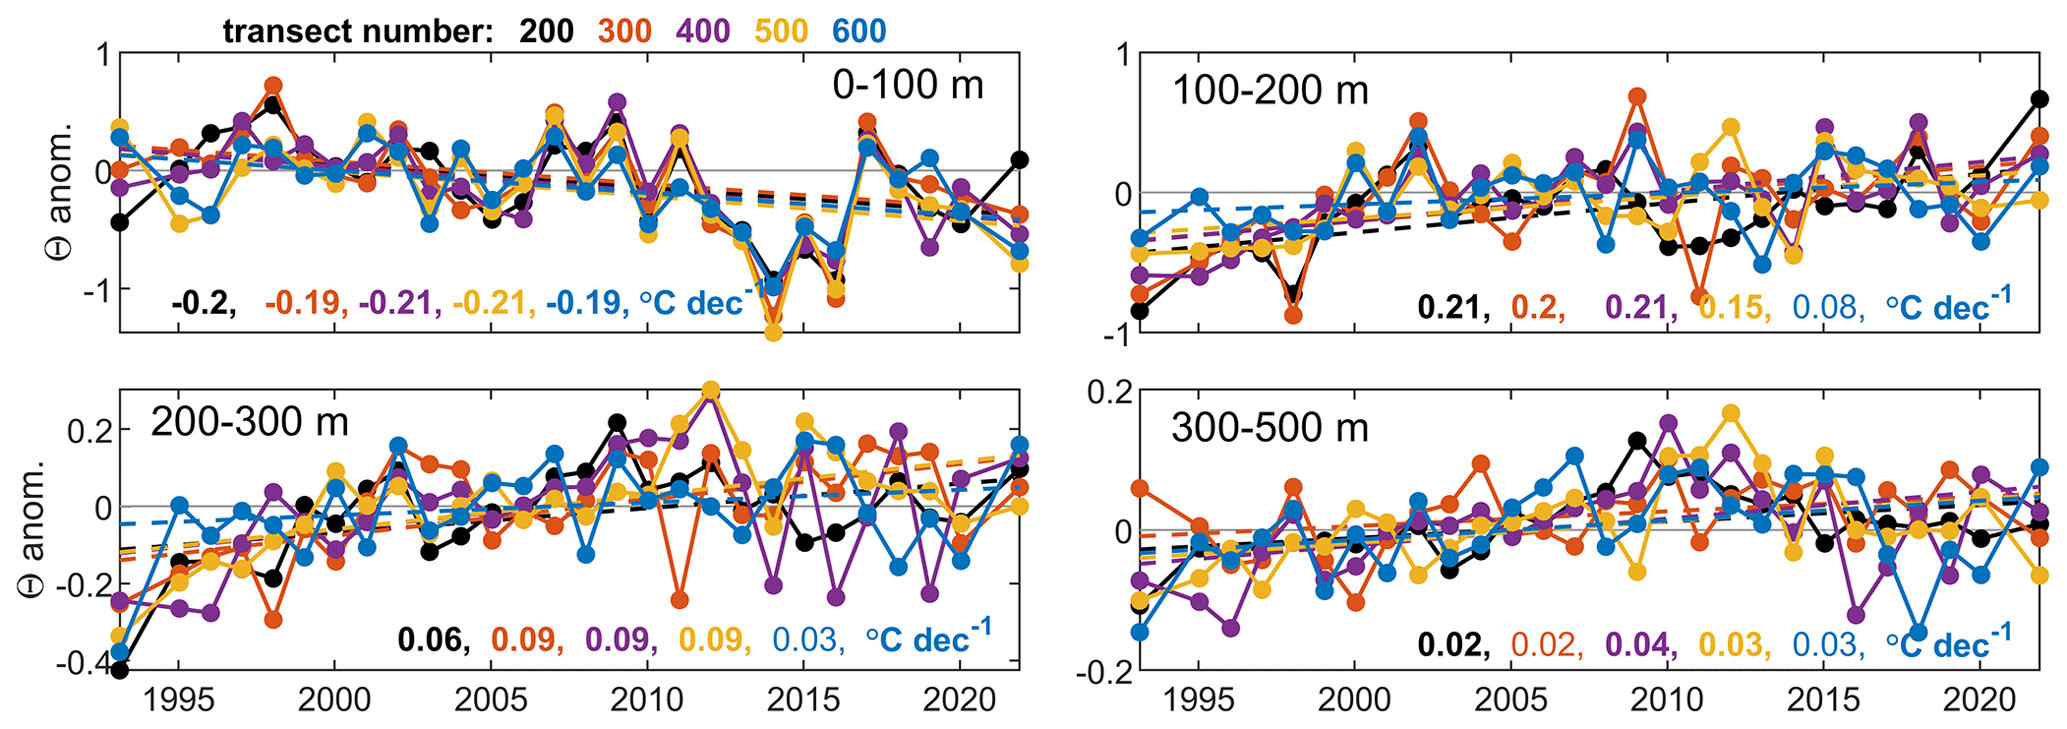
Figure 9Conservative temperature anomaly time series. Each panel illustrates the time series of conservative temperature anomalies within the given depths for each transect. The robust linear trends in temperature for each transect are quoted and significant trends (P < 0.05) are in bold.
3.3 Ocean temperature change
The conservative temperature anomalies from the Palmer LTER CTD transects (locations in Fig. 1) clearly show a warming trend on the west AP continental shelf below 100 m from 1993 to 2021 and a cooling trend above 100 m (Figs. 8 and 9). The significant linear trends in water temperature across all transects range from 0.02 to 0.21 °C dec−1. Of particular relevance to this study is that from 2018 to 2021 there was a positive temperature anomaly at 100 to 200 m depth that built to a peak of over 1 °C above the long-term average in December 2021, with an anomaly maximum around 100 m depth (Figs. 8 and 9). There is variability superimposed on these trends; for example, there was a period of more rapid warming below 100 m during the 1990s. In addition, the summers of 2013 through to 2017 were generally cooler than the summers of 2007 through to 2009 along transect 200 (Fig. 8). These patterns are well documented by several other publications (e.g. Cook et al., 2016; Martinson et al., 2008), and the warm periods are associated with sea ice coverage changes and wind-driven CDW warming and shoaling within the Antarctic Circumpolar Current (Moffat and Meredith, 2018; Schmidtko et al., 2014), allowing more and warmer CDW to access the continental shelf.
Many glaciers on the west AP have been retreating over recent decades (Cook et al., 2005). This retreat appears to have a strong latitudinal pattern, with southern glaciers retreating faster, driven by a long-term increase in subsurface ocean temperatures (Cook et al., 2016; Meredith and King, 2005), caused in turn by warming, shoaling, and greater penetration of CDW onto the continental shelf (Moffat and Meredith, 2018). In addition, many of the west AP glaciers are clearly responsive to shorter-term changes in ocean temperature and, possibly, surface melt supply, resulting in seasonal changes in ice velocity and terminus position (Wallis et al., 2023b; Boxall et al., 2022). Therefore, it is reasonable to assume that the west AP glaciers could be responsive to multi-year anomalies in subsurface ocean temperature and/or meltwater supply. Our observations reveal a widespread, quasi-synchronous, and sustained increase in grounding line discharge across the west AP centred around the austral summer of 2021 (Figs. 3 to 6). The response is concentrated in the central west AP, where warm CDW accesses the glaciers via deep, cross-shelf troughs in the continental shelf. The majority of glaciers further north, which are not exposed to CDW, exhibit muted or no change in grounding line discharge trends (Fig. 4c). There is variability in the timing and magnitude of glacier response along the coast, which will be governed by individual glacier geometry (Seehaus et al., 2018) and proximal fjord bathymetry (Wallis et al., 2023a; Bao and Moffat, 2024), as well as the competition between distinct processes (e.g. cross-shelf transport and modification of CDW vs. transport of cold water from the Weddell Sea around the tip of the Peninsula) setting the subsurface ocean temperature (Moffat and Meredith, 2018; Venables et al., 2017). In places, this results in very different responses between neighbouring glaciers and, for some glaciers, a continuation of their longer-term discharge trends (Fig. 4).
The widespread, quasi-synchronous, and sustained nature of the discharge change points to a regional, sustained forcing. The hydrographic observations show that there was a widespread and coherent increase in subsurface ocean temperatures on the continental shelf from 2018 onwards, centred at 100 to 200 m depth and extending to the ocean bed on the continental shelf (Figs. 8 and 9). We do not have observations from the waters immediately adjacent to any of the west AP tidewater glaciers, so we do not have direct evidence that the anomalously warm waters came into contact with the tidewater glaciers and elevated submarine melt rates. However, the Palmer LTER data indicate that anomalously warm, modified CDW was present across the continental shelf south of Bransfield Strait during the 2018 to 2021 period, including in the deep, glacially carved troughs that connect the shelf edge to the west AP glaciers (Cook et al., 2016; Arndt et al., 2013; Couto et al., 2017). In addition, diverse local CTD measurements along the west AP have documented the presence of CDW in the immediate proximity to glacier termini in the same region (Meredith et al., 2022; Venables et al., 2023), demonstrating that CDW does penetrate to parts of the coast. It is therefore highly likely that the anomalously warm water present on the continental shelf from 2018 to at least 2021 came into widespread contact with the west AP glaciers south of Bransfield Strait.
Assuming that this contact did happen and that there was no commensurate drop in current velocity at the ice–ocean interface, we would expect terminus submarine melt rates to increase. Glacier terminus depths along the west AP are poorly mapped, but the available data indicate that many glaciers are several hundred metres thick at the terminus (Cook et al., 2016; Arndt et al., 2013). Glaciers with grounding lines deeper than 100 m would have been exposed to the anomalously warm CDW during each austral summer since 2018, likely leading to enhanced undercutting. The temperature anomalies were greatest around 100 to 200 m depth; therefore, the enhancement of undercutting would lead to more pronounced quasi-linear or step-like undercuts for glaciers shallower than 200 m and parabolic undercuts for more deeply grounded glaciers. Comparable undercut profiles have been observed at glaciers in Greenland in the presence of similar vertical temperature profiles (Fried et al., 2015; Rignot et al., 2015).
The majority of theoretical and numerical perspectives (Slater et al., 2021; Ma and Bassis, 2019; Benn et al., 2017; Krug et al., 2015; O'Leary and Christoffersen, 2013) suggest that such profiles of undercutting can amplify calving, leading to retreat and glacier acceleration. We observe retreat at just 3 of our 10 example glaciers, only one of which (Wilkinson–Murphy Glacier) was very substantial. We do not have terminus position measurements at the tens of other west AP glaciers that accelerated since the austral summer of 2020/2021. In the absence of terminus retreat, more rapid submarine melting must be balanced by faster ice velocities (Krug et al., 2015), such that the position of the calving front becomes a function of the velocity and thickness of the upstream ice rather than the driver of upstream ice velocity changes (Benn et al., 2007).
If enhanced submarine melting were the primary driver of the glacier acceleration, then the spatial pattern of glacier acceleration would provide information about the pathways by which the warm water accessed the west AP coastline. Most of the glaciers that accelerated were located between Adelaide and Anvers islands, where several deep troughs provide a direct pathway across the shelf along which CDW intrusions can access the central west AP (Cook et al., 2016; Arndt et al., 2013; Couto et al., 2017). Some glaciers, such as Blanchard Glacier, located further north, where CDW influence on deep water temperatures is at least seasonal (Wang et al., 2022), also accelerated. Such instances likely reflect the convoluted topographic routes that dissect the west AP shelf and the competition between CDW and Weddell Sea waters on deep-water temperatures, among other processes. The majority of the northernmost glaciers along the west AP, which drain into Bransfield Strait and are not exposed to warm CDW, showed weak or no acceleration. In addition, we observe acceleration at some glaciers that, according to bathymetry products (Morlighem et al., 2020), are grounded in shallow water. For example, Luke Glacier and Comrie Glacier (locations in Fig. 1) are essentially land-terminating in BedMachine v3 yet are several hundred metres thick in an independent thickness product (Huss and Farinotti, 2014). These and other similar sites may therefore indicate regions to target in future bathymetric mapping efforts or at least regions for improvement in future bed topographic assimilation efforts.
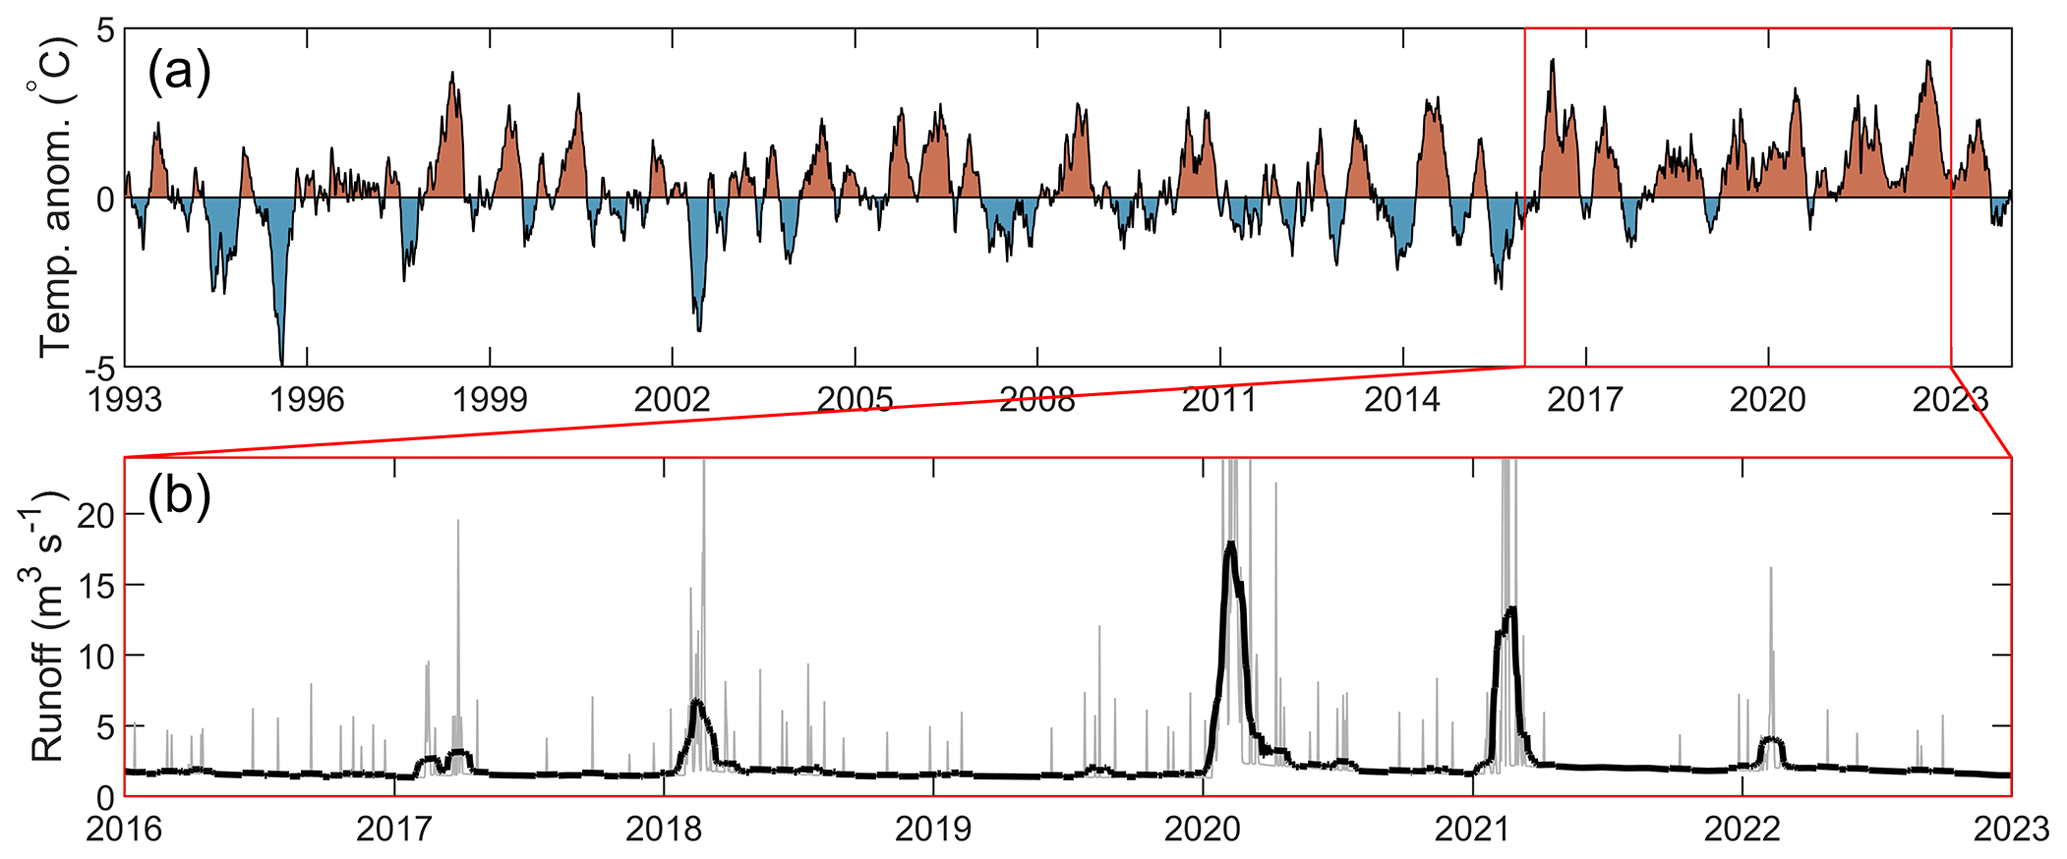
Figure 10Atmospheric conditions over the west Antarctic Peninsula. (a) The 2 m atmospheric temperature anomalies relative to the 1979–2008 daily climatology over the west AP from ERA5 reanalysis. The anomalies are smoothed with a 90 d moving window. (b) Modelled runoff from a 5 km × 5 km run of RACMO2.3p2, integrated over the west AP, from 2016 to 2023. Daily runoff is plotted grey and 30 d smoothed runoff in black. Panel (a) was plotted using the anomaly function in MATLAB (Greene, 2024).
At most depths along the central west AP continental shelf, the conservative temperature anomalies since 2018 were similar to, or slightly larger than, other warm periods in the late 2000s (Fig. 9), so it is possible that ocean forcing alone was not sufficient to drive the observed acceleration. In addition to warming ocean waters, ERA5 atmospheric temperatures over the west AP have been anomalously high for a persistent period since 2016 (Fig. 10a). There were record-high atmospheric temperatures over the AP in February 2020 and 2022 (Gorodetskaya et al., 2023; Francelino et al., 2021). These heatwaves caused record-high levels of snowmelt and rainfall (Gorodetskaya et al., 2023) that in turn led to extreme melt ponding, for example, on the George VI and Larsen C ice shelves in 2020 (Banwell et al., 2021; Bevan et al., 2020). Output from RACMO2.3p2 (van Wessem et al., 2018) – a 5.5 km regional climate model – shows that there is a modest amount of runoff (i.e. snowmelt that does not refreeze in the firn) from the west AP (Fig. 10b. The presence of plumes along the west AP coastline (Rodrigo et al., 2016) provides strong evidence that at least some of this surface-derived meltwater and runoff does reach the ice–bed interface and is discharged at the grounding line. Theoretical perspectives (e.g. Jenkins, 2011; Slater et al., 2016) and numerous observational and modelling studies from other regions (e.g. Jackson et al., 2017; Sutherland et al., 2019; Straneo et al., 2011; Carroll et al., 2016) show that the turbulent mixing and entrainment induced by subglacial discharge-driven plumes increases glacier submarine melt rates. The RACMO2.3p2 runoff data indicate that runoff was much higher during February 2020 and 2021 than during the preceding years; this would drive more vigorous plumes and faster submarine melt rates, potentially amplifying the effect of the observed warmer subsurface waters (Slater and Straneo, 2022).
In addition to modifying submarine melt rates, surface-to-bed meltwater injection could directly increase glacier speeds by increasing basal water storage and by transiently increasing basal water pressure and basal sliding rates. There is some evidence from Sentinel-1 ice velocity estimates supporting the relevance of this process on the AP over weekly to seasonal timescales, based on the co-occurrence of periods of elevated speed with periods of meltwater availability inferred from regional climate model output (Tuckett et al., 2019; Wallis et al., 2023b; Boxall et al., 2022). However, care must be taken to avoid aliasing apparent velocity changes caused by melt-induced changes in radar penetration depth (Rott et al., 2020). There is a large body of evidence that meltwater-induced accelerations on other ice masses generally have little impact on annual ice displacement because of meltwater-induced subglacial drainage mechanisms that result in compensatory periods of slower ice flow (e.g. Sole et al., 2013). On the AP, there are insufficient observations of meltwater-induced ice flow variations to determine whether similar compensatory subglacial drainage mechanisms also operate there. It is possible that the combination of moderately thick, fast-flowing ice, low meltwater supply, thick snowpack, and potentially extensive firn aquifers (Van Wessem et al., 2021) may result in qualitatively different meltwater-induced ice velocity changes compared to those observed elsewhere. In addition, the extreme meltwater production in 2020 and 2022 may have reduced firn pore space, allowing more surface-derived meltwater to penetrate to the ice–bed interface in subsequent lower-melt years. Further satellite observations and field-based studies are required to characterise the surface-to-bed hydrological drainage systems and the mechanisms through which they affect ice flow on the AP.
The widespread increase in grounding line discharge of the west AP presented in this study has implications for glacier mass balance. Although the glaciers on the AP are small compared to their neighbours in parts of west Antarctica, they are changing rapidly, such that AP contributed 14 % of Antarctica's total mass loss from 1992 to 2020 (Otosaka et al., 2023). Previous work has linked warming subsurface ocean waters to widespread glacier retreat along the west AP (Cook et al., 2016), and more recent work has further shown an ocean-driven ice tongue collapse and acceleration in Cadman Glacier on the west AP (Wallis et al., 2023a). The observations presented in this study build on this understanding by showing a widespread, quasi-synchronous acceleration in grounding line discharge along the west AP linked to a period of anomalously high air and subsurface ocean temperatures. Unless the surface mass balance increased commensurately, this recent acceleration in west AP glaciers will accelerate the rate of west AP mass loss, contributing to faster rates of sea level rise. In addition, the increase in grounding line discharge constitutes an increased solid freshwater input to the Bellingshausen Sea, which numerical modelling suggests can increase ocean heat transport to west Antarctic ice shelves, potentially leading to faster submarine melt rates (Flexas et al., 2022).
During the past half-century, tidewater glaciers on the west coast of the Antarctic Peninsula have retreated in response to rising subsurface ocean temperatures, and they remain responsive to seasonal changes in atmospheric and ocean temperatures. This study identifies a widespread, quasi-synchronous, and sustained increase in grounding line discharge of many glaciers along the west coast of the Antarctic Peninsula around the 2020/2021 austral summer. In many cases, grounding line discharge trends more than doubled and led to 5 % to 20 % increases in grounding line discharge over a 2.5-year period. The acceleration in grounding line discharge occurred at a time of anomalously high, though not exceptional, subsurface ocean temperatures on the continental shelf, which would have increased terminus submarine melt rates and could have driven the observed glacier acceleration. The co-occurrence of record-high air temperatures and surface melting may have contributed to the glacier acceleration by increasing surface-to-bed meltwater delivery, potentially amplifying submarine melt rates and directly increasing glacier sliding speeds. In the absence of in situ observations on the glacier surface and in the waters immediately adjacent to glacier calving fronts, there remain many uncertainties regarding the chain of events leading to this period of glacier acceleration, but we are hopeful that future campaigns to improve seafloor mapping, to acquire near-glacier hydrographic measurements, and to measure glacier velocity in situ will provide important new understanding of the processes driving changes in ice flow on the Antarctic Peninsula. Nevertheless, it is clear that the recent period of anomalous atmospheric and ocean temperatures have, together or in isolation, driven a widespread and sustained acceleration in many west AP glaciers. Given that the atmosphere and ocean in the region are projected to warm further in the coming decades, we recommend further research in this area to improve our understanding of glacier response to changing environmental conditions across the Antarctic Peninsula.
The grounding line discharge dataset is available on Zenodo (https://doi.org/10.5281/zenodo.10417864, Davison et al., 2023b). The Palmer LTER dataset was compiled for a previous study and made available on Zenodo (https://doi.org/10.5281/zenodo.10009821, Wallis et al., 2023c). BedMachine v3 (Morlighem et al., 2020) is available from https://doi.org/10.5067/FPSU0V1MWUB6 (Morlighem, 2022). The Antarctica Peninsula basin shapefiles (Cook et al., 2014) are available from https://doi.org/10.5281/zenodo.12755132 (Davison, 2024). The Landsat Image Mosaic of Antarctica (Bindschadler et al., 2008) is available from https://lima.usgs.gov/access.php (last access: 17 July 2024). ERA5 reanalysis (Hersbach et al., 2020) is available from https://doi.org/10.24381/cds.adbb2d47 (Hersbach et al., 2023).
BJD conceived the study, performed the analysis, and wrote the paper. BJW and CM compiled the raw CTD data into a format more amenable for analysis. All authors discussed the results and implications and contributed to the preparation of the paper.
The contact author has declared that none of the authors has any competing interests.
Publisher's note: Copernicus Publications remains neutral with regard to jurisdictional claims made in the text, published maps, institutional affiliations, or any other geographical representation in this paper. While Copernicus Publications makes every effort to include appropriate place names, the final responsibility lies with the authors.
We are grateful to the creators of the open-access satellite imagery, datasets, and tools used in this study and to the crews of all cruises involved in producing the Palmer LTER dataset. We particularly thank Rich Iannuzzi and Michael Cappola for the initial quality control of the LTER dataset. Data processing was undertaken on ARC3 and ARC4, which are part of the high-performance computing facilities at the University of Leeds, UK.
Benjamin J. Davison and Anna E. Hogg have been supported by ESA through the Polar+ Ice Shelves project (grant no. ESA-IPL-POE-EF-cb-LE-2019-834) and the SO-ICE project (grant no. ESA AO/1-10461/20/I-NB), by NERC via the DeCAdeS project (grant no. NE/T012757/1), and by the UK EO Climate Information Service (grant no. NE/X019071/1). Benjamin J. Wallis has been supported by the Panorama NERC Doctoral Training Partnership (grant no. NE/S007458/1). The Palmer LTER program is supported by NSF-OPP (grant no. 2026045).
This paper was edited by Felicity McCormack and reviewed by two anonymous referees.
Arndt, J. E., Schenke, H. W., Jakobsson, M., Nitsche, F. O., Buys, G., Goleby, B., Rebesco, M., Bohoyo, F., Hong, J., Black, J., Greku, R., Udintsev, G., Barrios, F., Reynoso-Peralta, W., Taisei, M., and Wigley, R.: The international bathymetric chart of the Southern Ocean (IBCSO) version 1.0–A new bathymetric compilation covering circum-Antarctic waters, Geophys. Res. Lett., 40, 3111–3117, https://doi.org/10.1002/grl.50413, 2013.
Banwell, A. F., Datta, R. T., Dell, R. L., Moussavi, M., Brucker, L., Picard, G., Shuman, C. A., and Stevens, L. A.: The 32-year record-high surface melt in 2019/2020 on the northern George VI Ice Shelf, Antarctic Peninsula, The Cryosphere, 15, 909–925, https://doi.org/10.5194/tc-15-909-2021, 2021.
Bao, W. and Moffat, C.: Impact of shallow sills on circulation regimes and submarine melting in glacial fjords, The Cryosphere, 18, 187–203, https://doi.org/10.5194/tc-18-187-2024, 2024.
Benn, D. I., Warren, C. R., and Mottram, R. H.: Calving processes and the dynamics of calving glaciers, Earth-Sci. Rev., 82, 143–179, https://doi.org/10.1016/j.earscirev.2007.02.002, 2007.
Benn, D. I., Aström, J., Zwinger, T., Todd, J., Nick, F. M., Cook, S., Hulton, N. R. J., and Luckman, A.: Melt-under-cutting and buoyancy-driven calving from tidewater glaciers: New insights from discrete element and continuum model simulations, J. Glaciol., 63, 691–702, https://doi.org/10.1017/jog.2017.41, 2017.
Bevan, S., Luckman, A., Hendon, H., and Wang, G.: The 2020 Larsen C Ice Shelf surface melt is a 40-year record high, The Cryosphere, 14, 3551–3564, https://doi.org/10.5194/tc-14-3551-2020, 2020.
Bindschadler, R., Vornberger, P., Fleming, A., Fox, A., Mullins, J., Binnie, D., Paulsen, S. J., Granneman, B., and Gorodetzky, D.: The Landsat Image Mosaic of Antarctica, Remote Sens. Environ., 112, 4214–4226, https://doi.org/10.1016/j.rse.2008.07.006, 2008.
Boxall, K., Christie, F. D. W., Willis, I. C., Wuite, J., and Nagler, T.: Seasonal land-ice-flow variability in the Antarctic Peninsula, The Cryosphere, 16, 3907–3932, https://doi.org/10.5194/tc-16-3907-2022, 2022.
Braun, M., Humbert, A., and Moll, A.: Changes of Wilkins Ice Shelf over the past 15 years and inferences on its stability, The Cryosphere, 3, 41–56, https://doi.org/10.5194/tc-3-41-2009, 2009.
Carroll, D., Sutherland, D. A., Hudson, B., Moon, T., Catania, G. A., Shroyer, E. L., Nash, J. D., Bartholomaus, T. C., Felikson, D., Stearns, L. A., Noël, B. P. Y., and van den Broeke, M. R.: The impact of glacier geometry on meltwater plume structure and submarine melt in Greenland fjords, Geophys. Res. Lett., 43, 9739–9748, https://doi.org/10.1002/2016GL070170, 2016.
Cook, A. J. and Vaughan, D. G.: Overview of areal changes of the ice shelves on the Antarctic Peninsula over the past 50 years, The Cryosphere, 4, 77–98, https://doi.org/10.5194/tc-4-77-2010, 2010.
Cook, A. J., Fox, A. J., Vaughan, D. G., and Ferrigno, J. G.: Retreating glacier fronts on the Antarctic Peninsula over the past half-century, Science, 308, 541–544, https://doi.org/10.1126/science.1104235, 2005.
Cook, A. J., Vaughan, D. G., Luckman, A. J., and Murray, T.: A new Antarctic Peninsula glacier basin inventory and observed area changes since the 1940s, Antarct. Sci., 26, 614–624, https://doi.org/10.1017/S0954102014000200, 2014.
Cook, A. J., Holland, P. R., Meredith, M. P., Murray, T., Luckman, A., and Vaughan, D. G.: Ocean forcing of glacier retreat in the western Antarctic Peninsula, Science, 353, 283–286, https://doi.org/10.1126/science.aae0017, 2016.
Cooper, A. P. R.: Historical observations of Prince Gustav ice shelf, Polar Rec., 33, 285–294, https://doi.org/10.1017/S0032247400025389, 1997.
Couto, N., Martinson, D. G., Kohut, J., and Schofield, O.: Distribution of Upper Circumpolar Deep Water on the warming continental shelf of the West Antarctic Peninsula, J. Geophys. Res.-Oceans, 122, 5306–5315, https://doi.org/10.1002/2017JC012840, 2017.
Davison, B.: Antarctic Peninsula basins – Cook et al. (2014), Zenodo [data set], https://doi.org/10.5281/zenodo.12755132, 2024.
Davison, B. J., Hogg, A. E., Slater, T., and Rigby, R.: Antarctic Ice Sheet grounding line discharge from 1996 through 2023, Earth Syst. Sci. Data Discuss. [preprint], https://doi.org/10.5194/essd-2023-448, in review, 2023a.
Davison, B., Hogg, A., Slater, T., and Rigby, R.: Antarctic Ice Sheet grounding line discharge from 1996 through 2023, Zenodo [data set], https://doi.org/10.5281/zenodo.10417864, 2023b.
Doake, C. S. M. and Vaughan, D. G.: Rapid disintegration of the Wordie Ice Shelf in response to atmospheric warming, Nature, 350, 328–330, https://doi.org/10.1038/350328a0, 1991.
Flexas, M. M., Thompson, A. F., Schodlok, M. P., Zhang, H., and Speer, K.: Antarctic Peninsula warming triggers enhanced basal melt rates throughout West Antarctica, Sci. Adv., 8, 1–12, https://doi.org/10.1126/sciadv.abj9134, 2022.
Francelino, M. R., Schaefer, C., de Los Milagros Skansi, M., Colwell, S., Bromwich, D. H., Jones, P., King, J. C., Lazzara, M. A., Renwick, J., Solomon, S., Brunet, M., and Cerveny, R. S.: WMO evaluation of two extreme high temperatures occurring in February 2020 for the antarctic peninsula region, B. Am. Meteorol. Soc., 102, E2053–E2061, https://doi.org/10.1175/BAMS-D-21-0040.1, 2021.
Fried, M. J., Catania, G. A., Bartholomaus, T. C., Duncan, D., Davis, M., Stearns, L. A., Nash, J., Shroyer, E., and Sutherland, D.: Distributed subglacial discharge drives significant submarine melt at a Greenland tidewater glacier, Geophys. Res. Lett., 42, 9328–9336, https://doi.org/10.1002/2015GL065806, 2015.
Gardner, A. S., Moholdt, G., Scambos, T., Fahnstock, M., Ligtenberg, S., van den Broeke, M., and Nilsson, J.: Increased West Antarctic and unchanged East Antarctic ice discharge over the last 7 years, The Cryosphere, 12, 521–547, https://doi.org/10.5194/tc-12-521-2018, 2018.
Gorodetskaya, I. V, Durán-alarcón, C., González-herrero, S., Clem, K. R., Zou, X., Rowe, P., Imazio, P. R., Campos, D., Santos, C. L., Dutrievoz, N., and Wille, J. D.: Record-high Antarctic Peninsula temperatures and surface melt in February 2022: a compound event with an intense atmospheric river, npj Clim. Atmos. Sci., 6, https://doi.org/10.1038/s41612-023-00529-6, 2023.
Greene, C. A.: Chad Greene (2024), anomaly, MATLAB Central File Exchange, https://www.mathworks.com/matlabcentral/fileexchange/61327-anomaly (last access: 17 July 2024), 2024.
Hansen, N., Langen, P. L., Boberg, F., Forsberg, R., Simonsen, S. B., Thejll, P., Vandecrux, B., and Mottram, R.: Downscaled surface mass balance in Antarctica: impacts of subsurface processes and large-scale atmospheric circulation, The Cryosphere, 15, 4315–4333, https://doi.org/10.5194/tc-15-4315-2021, 2021.
Hersbach, H., Bell, B., Berrisford, P., Hirahara, S., Horányi, A., Muñoz-Sabater, J., Nicolas, J., Peubey, C., Radu, R., Schepers, D., Simmons, A., Soci, C., Abdalla, S., Abellan, X., Balsamo, G., Bechtold, P., Biavati, G., Bidlot, J., Bonavita, M., De Chiara, G., Dahlgren, P., Dee, D., Diamantakis, M., Dragani, R., Flemming, J., Forbes, R., Fuentes, M., Geer, A., Haimberger, L., Healy, S., Hogan, R. J., Hólm, E., Janisková, M., Keeley, S., Laloyaux, P., Lopez, P., Lupu, C., Radnoti, G., de Rosnay, P., Rozum, I., Vamborg, F., Villaume, S., and Thépaut, J. N.: The ERA5 global reanalysis, Q. J. Roy. Meteor. Soc., 146, 1999–2049, https://doi.org/10.1002/qj.3803, 2020.
Hersbach, H., Bell, B., Berrisford, P., Biavati, G., Horányi, A., Muñoz Sabater, J., Nicolas, J., Peubey, C., Radu, R., Rozum, I., Schepers, D., Simmons, A., Soci, C., Dee, D., and Thépaut, J.-N.: ERA5 hourly data on single levels from 1940 to present, Copernicus Climate Change Service (C3S) Climate Data Store (CDS) [data set], https://doi.org/10.24381/cds.adbb2d47, 2023.
Hogg, A. E., Shepherd, A., Cornford, S. L., Briggs, K. H., Gourmelen, N., Graham, J. A., Joughin, I., Mouginot, J., Nagler, T., Payne, A. J., Rignot, E., and Wuite, J.: Increased ice flow in Western Palmer Land linked to ocean melting, Geophys. Res. Lett., 44, 4159–4167, https://doi.org/10.1002/2016GL072110, 2017.
Huss, M. and Farinotti, D.: A high-resolution bedrock map for the Antarctic Peninsula, The Cryosphere, 8, 1261–1273, https://doi.org/10.5194/tc-8-1261-2014, 2014.
Jackson, R. H., Shroyer, E. L., Nash, J. D., Sutherland, D. A., Carroll, D., Fried, M. J., Catania, G. A., Bartholomaus, T. C., and Stearns, L. A.: Near-glacier surveying of a subglacial discharge plume: Implications for plume parameterizations, Geophys. Res. Lett., 44, 6886–6894, https://doi.org/10.1002/2017GL073602, 2017.
Jenkins, A.: Convection-Driven Melting near the Grounding Lines of Ice Shelves and Tidewater Glaciers, J. Phys. Oceanogr., 41, 2279–2294, https://doi.org/10.1175/JPO-D-11-03.1, 2011.
Krug, J., Durand, G., Gagliardini, O., and Weiss, J.: Modelling the impact of submarine frontal melting and ice mélange on glacier dynamics, The Cryosphere, 9, 989–1003, https://doi.org/10.5194/tc-9-989-2015, 2015.
Lea, J. M.: The Google Earth Engine Digitisation Tool (GEEDiT) and the Margin change Quantification Tool (MaQiT) – simple tools for the rapid mapping and quantification of changing Earth surface margins, Earth Surf. Dynam., 6, 551–561, https://doi.org/10.5194/esurf-6-551-2018, 2018.
Ma, Y. and Bassis, J. N.: The Effect of Submarine Melting on Calving From Marine Terminating Glaciers, J. Geophys. Res.-Earth, 124, 334–346, https://doi.org/10.1029/2018JF004820, 2019.
Martinson, D. G., Stammerjohn, S. E., Iannuzzi, R. A., Smith, R. C., and Vernet, M.: Western Antarctic Peninsula physical oceanography and spatio-temporal variability, Deep-Res. Pt. II, 55, 1964–1987, https://doi.org/10.1016/j.dsr2.2008.04.038, 2008.
Meredith, M. P. and King, J. C.: Rapid climate change in the ocean west of the Antarctic Peninsula during the second half of the 20th century, Geophys. Res. Lett., 32, 1–5, https://doi.org/10.1029/2005GL024042, 2005.
Meredith, M. P., Inall, M. E., Alexander Brearley, J., Ehmen, T., Sheen, K., Munday, D., Cook, A., Retallick, K., Van Landeghem, K., Gerrish, L., Annett, A., Carvalho, F., Jones, R., Naveira Garabato, A. C., Bull, C. Y. S., Wallis, B. J., Hogg, A. E., and Scourse, J.: Internal tsunamigenesis and ocean mixing driven by glacier calving in Antarctica, Sci. Adv., 8, 1–11, https://doi.org/10.1126/sciadv.add0720, 2022.
Moffat, C. and Meredith, M.: Shelf-ocean exchange and hydrography west of the Antarctic Peninsula: A review, Philos. T. R. Soc. A, 376, 20170164, https://doi.org/10.1098/rsta.2017.0164, 2018.
Morlighem, M.: MEaSUREs BedMachine Antarctica, Version 3, Boulder, Colorado USA, NASA National Snow and Ice Data Center Distributed Active Archive Center [data set], https://doi.org/10.5067/FPSU0V1MWUB6, 2022.
Morlighem, M., Rignot, E., Binder, T., Blankenship, D., Drews, R., Eagles, G., Eisen, O., Ferraccioli, F., Forsberg, R., Fretwell, P., Goel, V., Greenbaum, J. S., Gudmundsson, H., Guo, J., Helm, V., Hofstede, C., Howat, I., Humbert, A., Jokat, W., Karlsson, N. B., Lee, W. S., Matsuoka, K., Millan, R., Mouginot, J., Paden, J., Pattyn, F., Roberts, J., Rosier, S., Ruppel, A., Seroussi, H., Smith, E. C., Steinhage, D., Sun, B., Broeke, M. R. va. den, Ommen, T. D. va., Wessem, M. van, and Young, D. A.: Deep glacial troughs and stabilizing ridges unveiled beneath the margins of the Antarctic ice sheet, Nat. Geosci., 13, 132–137, https://doi.org/10.1038/s41561-019-0510-8, 2020.
Mouginot, J., Scheuchl, B., and Rignot, E.: MEaSUREs Antarctic Boundaries for IPY 2007-2009 from Satellite Radar, Version 2, NASA Natl. Snow Ice Data Cent. Distrib. Act. Arch. Cent. [data set], Boulder, Color., USA, https://doi.org/10.5067/AXE4121732AD, 2017.
Noël, B., van Wessem, J. M., Wouters, B., Trusel, L., Lhermitte, S., and van den Broeke, M. R.: Higher Antarctic ice sheet accumulation and surface melt rates revealed at 2 km resolution, Nat. Commun., 14, 7949, https://doi.org/10.1038/s41467-023-43584-6, 2023.
O'Leary, M. and Christoffersen, P.: Calving on tidewater glaciers amplified by submarine frontal melting, The Cryosphere, 7, 119–128, https://doi.org/10.5194/tc-7-119-2013, 2013.
Otosaka, I. N., Shepherd, A., Ivins, E. R., Schlegel, N.-J., Amory, C., van den Broeke, M. R., Horwath, M., Joughin, I., King, M. D., Krinner, G., Nowicki, S., Payne, A. J., Rignot, E., Scambos, T., Simon, K. M., Smith, B. E., Sørensen, L. S., Velicogna, I., Whitehouse, P. L., A, G., Agosta, C., Ahlstrøm, A. P., Blazquez, A., Colgan, W., Engdahl, M. E., Fettweis, X., Forsberg, R., Gallée, H., Gardner, A., Gilbert, L., Gourmelen, N., Groh, A., Gunter, B. C., Harig, C., Helm, V., Khan, S. A., Kittel, C., Konrad, H., Langen, P. L., Lecavalier, B. S., Liang, C.-C., Loomis, B. D., McMillan, M., Melini, D., Mernild, S. H., Mottram, R., Mouginot, J., Nilsson, J., Noël, B., Pattle, M. E., Peltier, W. R., Pie, N., Roca, M., Sasgen, I., Save, H. V., Seo, K.-W., Scheuchl, B., Schrama, E. J. O., Schröder, L., Simonsen, S. B., Slater, T., Spada, G., Sutterley, T. C., Vishwakarma, B. D., van Wessem, J. M., Wiese, D., van der Wal, W., and Wouters, B.: Mass balance of the Greenland and Antarctic ice sheets from 1992 to 2020, Earth Syst. Sci. Data, 15, 1597–1616, https://doi.org/10.5194/essd-15-1597-2023, 2023.
Rack, W. and Rott, H.: Pattern of retreat and disintegration of the Larsen B ice shelf, Antarctic Peninsula, Ann. Glaciol., 39, 505–510, https://doi.org/10.3189/172756404781814005, 2004.
Rignot, E., Casassa, G., Gogineni, P., Krabill, W., Rivera, A., and Thomas, R.: Accelerated ice discharge from the Antarctic Peninsula following the collapse of Larsen B ice shelf, Geophys. Res. Lett., 31, 2–5, https://doi.org/10.1029/2004GL020697, 2004.
Rignot, E., Fenty, I., Xu, Y., Cai, C., and Kemp, C.: Undercutting of marine-terminating glaciers in West Greenland, Geophys. Res. Lett., 42, 5909–5917, https://doi.org/10.1002/2015GL064236, 2015.
Rignot, E., Mouginot, J., Scheuchl, B., Van Den Broeke, M., Van Wessem, M. J., and Morlighem, M.: Four decades of Antarctic ice sheet mass balance from 1979–2017, P. Natl. Acad. Sci. USA, 116, 1095–1103, https://doi.org/10.1073/pnas.1812883116, 2019.
Rodrigo, C., Giglio, S., and Varas, A.: Glacier sediment plumes in small bays on the Danco Coast, Antarctic Peninsula, Antarct. Sci., 28, 395–404, https://doi.org/10.1017/S0954102016000237, 2016.
Rott, H., Skvarca, P., and Nagler, T.: Rapid collapse of northern Larsen Ice Shelf, Antarctica, Science, 271, 788–792, https://doi.org/10.1126/science.271.5250.788, 1996.
Rott, H., Abdel Jaber, W., Wuite, J., Scheiblauer, S., Floricioiu, D., van Wessem, J. M., Nagler, T., Miranda, N., and van den Broeke, M. R.: Changing pattern of ice flow and mass balance for glaciers discharging into the Larsen A and B embayments, Antarctic Peninsula, 2011 to 2016, The Cryosphere, 12, 1273–1291, https://doi.org/10.5194/tc-12-1273-2018, 2018.
Rott, H., Wuite, J., De Rydt, J., Gudmundsson, G. H., Floricioiu, D., and Rack, W.: Impact of marine processes on flow dynamics of northern Antarctic Peninsula outlet glaciers, Nat. Commun., 11, 10–12, https://doi.org/10.1038/s41467-020-16658-y, 2020.
Scambos, T., Fricker, H. A., Liu, C. C., Bohlander, J., Fastook, J., Sargent, A., Massom, R., and Wu, A. M.: Ice shelf disintegration by plate bending and hydro-fracture: Satellite observations and model results of the 2008 Wilkins ice shelf break-ups, Earth Planet. Sc. Lett., 280, 51–60, https://doi.org/10.1016/j.epsl.2008.12.027, 2009.
Scambos, T. A., Hulbe, C., and Fahnestock, M.: Climate-induced ice shelf disintegration in the Antarctic Peninsula, in: Antarctic Peninsula Climate Variability: Historical and Paleoenvironmental Perspectives, vol. 79, 79–92, https://doi.org/10.1029/AR079p0079, 2003.
Scambos, T. A., Bohlander, J. A., Shuman, C. A., and Skvarca, P.: Glacier acceleration and thinning after ice shelf collapse in the Larsen B embayment, Antarctica, Geophys. Res. Lett., 31, 2001–2004, https://doi.org/10.1029/2004GL020670, 2004.
Schmidtko, S., Heywood, K. J., Thompson, A. F., and Aoki, S.: Multidecadal warming of Antarctic waters, Science, 346, 1227–1231, https://doi.org/10.1126/science.1256117, 2014.
Seehaus, T., Cook, A. J., Silva, A. B., and Braun, M.: Changes in glacier dynamics in the northern Antarctic Peninsula since 1985, The Cryosphere, 12, 577–594, https://doi.org/10.5194/tc-12-577-2018, 2018.
Shepherd, A., Gilbert, L., Muir, A. S., Konrad, H., McMillan, M., Slater, T., Briggs, K. H., Sundal, A. V., Hogg, A. E., and Engdahl, M. E.: Trends in Antarctic Ice Sheet Elevation and Mass, Geophys. Res. Lett., 46, 8174–8183, https://doi.org/10.1029/2019GL082182, 2019.
Slater, D. A. and Straneo, F.: Submarine melting of glaciers in Greenland amplified by atmospheric warming, Nat. Geosci., 15, 794–799, https://doi.org/10.1038/s41561-022-01035-9, 2022.
Slater, D. A., Goldberg, D. N., Nienow, P. W., and Cowton, T. R.: Scalings for Submarine Melting at Tidewater Glaciers from Buoyant Plume Theory, J. Phys. Oceanogr., 46, 1839–1855, https://doi.org/10.1175/JPO-D-15-0132.1, 2016.
Slater, D. A., Benn, D. I., Cowton, T. R., Bassis, J. N., and Todd, J. A.: Calving Multiplier Effect Controlled by Melt Undercut Geometry, J. Geophys. Res.-Earth, 126, 1–17, https://doi.org/10.1029/2021JF006191, 2021.
Smith, R., Baker, K., Fraser, W., Hofmann, E., Karl, D., Klink, J., Quentin, L., Prezelin, B., Ross, R., Trivelpiece, W., and Vernet, M.: The Palmer LTER: A Long-Term Ecological Research Program at Palmer Station, Antarctica, Oceanography, 8, 77–86, https://doi.org/10.5670/oceanog.1995.01, 1995.
Sole, A., Nienow, P., Bartholomew, I., Mair, D., Cowton, T., Tedstone, A., and King, M. A.: Winter motion mediates dynamic response of the Greenland Ice Sheet to warmer summers, Geophys. Res. Lett., 40, 3940–3944, https://doi.org/10.1002/grl.50764, 2013.
Straneo, F., Curry, R. G., Sutherland, D. a., Hamilton, G. S., Cenedese, C., Våge, K., and Stearns, L. a.: Impact of fjord dynamics and glacial runoff on the circulation near Helheim Glacier, Nat. Geosci., 4, 322–327, https://doi.org/10.1038/ngeo1109, 2011.
Sutherland, D. A., Jackson, R. H., Kienholz, C., Amundson, J. M., Dryer, W. P., Duncan, D., Eidam, E. F., Motyka, R. J., and Nash, J. D.: Direct observations of submarine melt and subsurface geometry at a tidewater glacier, Science, 365, 369–374, https://doi.org/10.1126/science.aax3528, 2019.
Tuckett, P. A., Ely, J. C., Sole, A. J., Livingstone, S. J., Davison, B. J., van Wessem, M. J., and Howard, J.: Rapid accelerations of Antarctic Peninsula outlet glaciers driven by surface melt, Nat. Commun., 10, https://doi.org/10.1038/s41467-019-12039-2, 2019.
van Wessem, J. M., van de Berg, W. J., Noël, B. P. Y., van Meijgaard, E., Amory, C., Birnbaum, G., Jakobs, C. L., Krüger, K., Lenaerts, J. T. M., Lhermitte, S., Ligtenberg, S. R. M., Medley, B., Reijmer, C. H., van Tricht, K., Trusel, L. D., van Ulft, L. H., Wouters, B., Wuite, J., and van den Broeke, M. R.: Modelling the climate and surface mass balance of polar ice sheets using RACMO2 – Part 2: Antarctica (1979–2016), The Cryosphere, 12, 1479–1498, https://doi.org/10.5194/tc-12-1479-2018, 2018.
van Wessem, J. M., Steger, C. R., Wever, N., and van den Broeke, M. R.: An exploratory modelling study of perennial firn aquifers in the Antarctic Peninsula for the period 1979–2016, The Cryosphere, 15, 695–714, https://doi.org/10.5194/tc-15-695-2021, 2021.
Vaughan, D. and Doake, C. S. M.: Recent retreat of ice shelves on the Antarctic Peninsula, Nature, 379, 328–331, 1996.
Veldhuijsen, S. B. M., van de Berg, W. J., Brils, M., Kuipers Munneke, P., and van den Broeke, M. R.: Characteristics of the 1979–2020 Antarctic firn layer simulated with IMAU-FDM v1.2A, The Cryosphere, 17, 1675–1696, https://doi.org/10.5194/tc-17-1675-2023, 2023.
Venables, H., Meredith, M. P., Hendry, K. R., ten Hoopen, P., Peat, H., Chapman, A., Beaumont, J., Piper, R., Miller, A. J., Mann, P., Rossetti, H., Massey, A., Souster, T., Reeves, S., Fenton, M., Heiser, S., Pountney, S., Reed, S., Waring, Z., Clark, M., Bolton, E., Mathews, R., London, H., Clement, A., Stuart, E., Reichardt, A., Brandon, M., Leng, M., Arrowsmith, C., Annett, A., Henley, S. F., and Clarke, A.: Sustained year-round oceanographic measurements from Rothera Research Station, Antarctica, 1997–2017, Sci. Data, 10, 1–13, https://doi.org/10.1038/s41597-023-02172-5, 2023.
Venables, H. J., Meredith, M. P., and Brearley, J. A.: Modification of deep waters in Marguerite Bay, western Antarctic Peninsula, caused by topographic overflows, Deep-Sea Res. Pt. II, 139, 9–17, https://doi.org/10.1016/j.dsr2.2016.09.005, 2017.
Wallis, B. J., Hogg, A. E., Meredith, M. P., Close, R., Hardy, D., McMillan, M., Wuite, J., Nagler, T., and Moffat, C.: Ocean warming drives rapid dynamic activation of marine-terminating glacier on the west Antarctic Peninsula, Nat. Commun., 14, 7535, https://doi.org/10.1038/s41467-023-42970-4, 2023a.
Wallis, B. J., Hogg, A. E., van Wessem, J. M., Davison, B. J., and van den Broeke, M. R.: Widespread seasonal speed-up of west Antarctic Peninsula glaciers from 2014 to 2021, Nat. Geosci., 16, 231–237, https://doi.org/10.1038/s41561-023-01131-4, 2023b.
Wallis, B. J., Hogg, A. E., Meredith, M. P., Close, R., Hardy, D., McMillan, M., Wuite, J., Nagler, T., and Moffat, C.: Data for Ocean warming drives rapid dynamic activation of marine-terminating glacier on the west Antarctic Peninsula (Version 1), Zenodo [data set], https://doi.org/10.5281/zenodo.10009821, 2023c.
Wang, X., Moffat, C., Dinniman, M. S., Klinck, J. M., Sutherland, D. A., and Aguiar-González, B.: Variability and Dynamics of Along-Shore Exchange on the West Antarctic Peninsula (WAP) Continental Shelf, J. Geophys. Res.-Oceans, 127, e2021JC017645, https://doi.org/10.1029/2021JC017645, 2022.
Wouters, B., Martin-Español, A., Helm, V., Flament, T., Van Wessem, J. M., Ligtenberg, S. R. M., Van Den Broeke, M. R., and Bamber, J. L.: Dynamic thinning of glaciers on the Southern Antarctic Peninsula, Science, 348, 899–903, https://doi.org/10.1126/science.aaa5727, 2015.
Wuite, J., Rott, H., Hetzenecker, M., Floricioiu, D., De Rydt, J., Gudmundsson, G. H., Nagler, T., and Kern, M.: Evolution of surface velocities and ice discharge of Larsen B outlet glaciers from 1995 to 2013, The Cryosphere, 9, 957–969, https://doi.org/10.5194/tc-9-957-2015, 2015.