the Creative Commons Attribution 4.0 License.
the Creative Commons Attribution 4.0 License.
 | 03 Jul 2024
Assessing the key concerns in snow storage: a case study for China
Xing Wang
Jiawen Ren
Dahe Qin
Huilin Li
Snow security plays a crucial role in ensuring the success of winter sports events and supporting the ski industry. One effective approach to enhancing snow reliability is through snow storage. Despite its potential benefits, investigations of snow storage in China have been limited. To address this gap, we implemented snow storage covered with geotextiles at two venues, namely the Big Air Shougang (BAS) in Beijing for the Beijing 2022 Winter Olympic Games and the National Biathlon Center (NBC) in Chongli for the Beijing 2022 Winter Paralympic Games, in response to possible extreme meteorological conditions. To assess the key concerns associated with snow storage, ablation (the process of snow loss) and snow properties, we introduced a fine-snow-pile monitoring system and the SNOWPACK model. Our observations revealed that, by 18 February, the snow pile at BAS had lost 158.6 m3 of snow (equivalent to 6.7 % of the initial volume). Subsequently, the accelerated ablation was influenced by meteorological conditions and a thin geotextile layer. Between 16 January and 15 April, the snow pile at BAS experienced a total loss of 1242.9 m3 of snow (corresponding to 52.7 % of the original volume). Regarding snow properties, no significant variations were modeled at the study sites, except for the upper part of the snow piles. Notably, the evaporation of the geotextiles contributed to slowing the ablation process. Consequently, we discourage the use of impermeable coverage schemes for snow storage. Instead, the thickness of the cover played a vital role in preserving the snow pile. At Beijing and Chongli, the 0.7 and 0.4 m thick cover layers, respectively, were found to protect approximately half of the snow pile height over the summer season. Importantly, the evolution of snow properties was consistent across the different cover thicknesses. The findings of our study have implications for the ski industry in China, as they provide valuable insights into snow storage techniques and their impact on snow reliability.
- Article
(7710 KB) - Full-text XML
-
Supplement
(520 KB) - BibTeX
- EndNote


Snow storage is the conservation of snow covered with thermal insulation materials over a period, following the principles of low environmental impact and cost-effectiveness (Lintzén and Knutsson, 2018; Grünewald et al., 2018). Winter sports, such as skiing, are highly sensitive to climate change, and the effects of global warming and uncertain winter snowfall can significantly impact winter sports events and the ski industry. In this context, snow storage is considered a more reliable approach than snowmaking for ensuring snow security, as the latter requires specific weather conditions such as low air temperature, relative humidity, and wind speed (Spandre et al., 2017; Olefs et al., 2010). Implementing snow storage not only ensures smooth competition but also portrays a positive image in terms of snow security and the professionalism of event hosts (Grünewald et al., 2018). Snow storage has successfully been used in various major winter sports events in the past to tackle unpredictable meteorological conditions, including events such as cross-country skiing in Davos, Altay, and Vuokatti; the Biathlon World Cup in Östersund; the Ski Jumping World Cup in Titisee-Neustadt; and the 2014 Winter Olympics in Sochi (Grünewald et al., 2018; Lintzén and Knutsson, 2018; Pestereva, 2014). Additionally, ski resorts in Scandinavia, the Alps, and Canada have used snow storage for several years. In past warm ski seasons, the ski season length, skiable terrain, snow properties, and snowmaking days were reported to have decreased in Canada (Rutty et al., 2017). As climate change continues, snow reliability is expected to decrease, particularly for low- and middle-altitude ski resorts (Demiroglu et al., 2016; Willibald et al., 2021).
Snowmaking and snow storage have become essential elements of modern snow management in ski resorts (Steiger and Scott, 2020; Weiss et al., 2019). Snow storage serves as a complementary solution to address the limitations of snowmaking due to meteorological conditions and resource constraints. By using snow storage, ski resorts can ensure an exact opening date for the ski season and even extend the season when snowmaking is not feasible or efficient. For instance, in Piteå, nearly 2500 m3 of snow covered with bark was stored to guarantee an early start for the ski track opening (Lintzén, 2012). Grünewald et al. (2018) demonstrated the use of a snow pile covered with sawdust for cross-country skiing in Switzerland. Weiss et al. (2019) explored the feasibility of snow storage in the northern United States. An approach that involves collecting natural snow from winter and spring snowfall events and storing it for ski track construction could help reduce electricity and water consumption for snowmaking. Geotextiles have been shown to decrease the total ablation of snow and ice by around 60 % in an Austrian glacier ski resort (Olefs and Fischer, 2008). Furthermore, there is increasing interest in using stored natural snow for summer building refrigeration (Hamada et al., 2012; Kumar et al., 2016; Skogsberg and Nordell, 2001).
Snow storage can be carried out using four different methods: indoor storage, on-ground storage, open-pit storage, and underground storage (Skogsberg and Nordell, 2006). These approaches aim to alter the snow surface energy balance and slow down the melting rate of snow piles. Indoor and open-pit storage methods are particularly useful for extracting cold energy from snow, making them suitable for building refrigeration purposes (Hamada et al., 2007; Moe, 2018). However, storing snow in open pits and underground is limited by site constraints, and indoor storage is not practical for large-scale snow storage. As a result, the most commonly employed method in the ski industry is storing snow on the ground with thermal insulation materials, providing flexibility in implementation. For instance, Ter-Zakaryan et al. (2019) stored snow on a ski track at the end of the ski season. At glacier ski resorts, the approach involves placing insulation materials directly on top of the natural snow when it reaches its maximum height and removing the materials before the first persistent snowfall occurs in late summer or early autumn (Olefs and Fischer, 2008). On the other hand, glacier-free ski resorts collect natural and/or artificial snow, groom it, and store it with thicker insulation materials (Weiss et al., 2019).
However, detailed research on snow storage for the ski industry, especially in Asia, is still limited. Many aspects of snow storage, such as snow properties, localized storage schemes, and the evolution of snow piles, have not been thoroughly investigated. We undertook snow storage to address this knowledge gap and ensure snow safety during the Beijing 2022 Winter Olympic Games and Beijing 2022 Winter Paralympic Games in case of extreme meteorological conditions. Using a terrestrial laser scanner, we obtained high-resolution repeated geometrical data of the snow piles. Additionally, we conducted continuous monitoring of the thermal conditions of the snow piles, a detail not frequently found in the published literature. This comprehensive analysis allows for a thorough examination and evaluation of the evolution of snow piles and the factors affecting them. We also explored snow storage over the summer season in Beijing and Chongli, which are regions with a high concentration of Chinese ski areas (An et al., 2019). In summary, the main objectives of this study are (i) to investigate the evolution of snow piles and the factors influencing them; (ii) to assess the performance of the SNOWPACK model in conjunction with investigation data from China, particularly in mid-latitude and low-altitude regions; and (iii) to identify significant considerations in snow storage based on the aforementioned investigation and validation of the SNOWPACK model. By accomplishing these aims, we aim to provide a comprehensive technical procedure and knowledge of snow storage and its effects, given the rapid growth of the Chinese ski industry.
We implemented snow storage at two venues, namely the Big Air Shougang (BAS) and the National Biathlon Center (NBC), to ensure a smooth competition process. BAS, located in the central urban area of Beijing, served as the venue for Winter Olympic skiing events. The storage site (39.908° N, 116.147° E; 75.8 m a.s.l.) is 0.36 km away to the south of the track of BAS (Fig. 1a and b), on clear and flat soil ground. Such a short distance facilitates the transportation of stored snow. The surrounding buildings and fences provided additional wind protection of the snow pile. Snow production for storage began on 26 December 2021 and continued until 11 January 2022, using two snow fan guns. The shape of the snow pile was adjusted by moving the snow fan guns. On 3 January 2022, we started installing an automatic meteorological station and thermal sensors and gathering the initial snow density data. Taking into account various factors, including meteorological conditions, material availability, and construction considerations, a 0.004 m thin reflective layer (geotextile) was used to cover the snow pile on 21 January 2022. The geotextiles were securely fastened and connected using white ropes. Finally, in late April, BAS staff removed the snow pile.
As for the NBC, it is situated in Chongli District, approximately 52.63 km northeast of Zhangjiakou. At this location, the snow pile (40.912° N, 115.469° E; 1639.5 m a.s.l.) was established adjacent to the Para tracks by adjusting the snow fan guns and covering the pile with a 0.004 m thin geotextile on 20 January 2022 (Fig. 1d and e). Rocks wrapped in geotextiles and white ropes were used to secure the geotextile layer. The site at the NBC also had clear soil ground but was harder compared to the BAS site. Additionally, it was surrounded by mountains on the east and west sides. Snow production for storage occurred between 12 and 16 January 2022, benefiting from lower air temperatures. A monitoring system for snow storage, similar to the one used at the BAS pile, was installed. In early March, the stored snow was removed for groomers to prepare the track for Para cross-country skiing and Para biathlon.
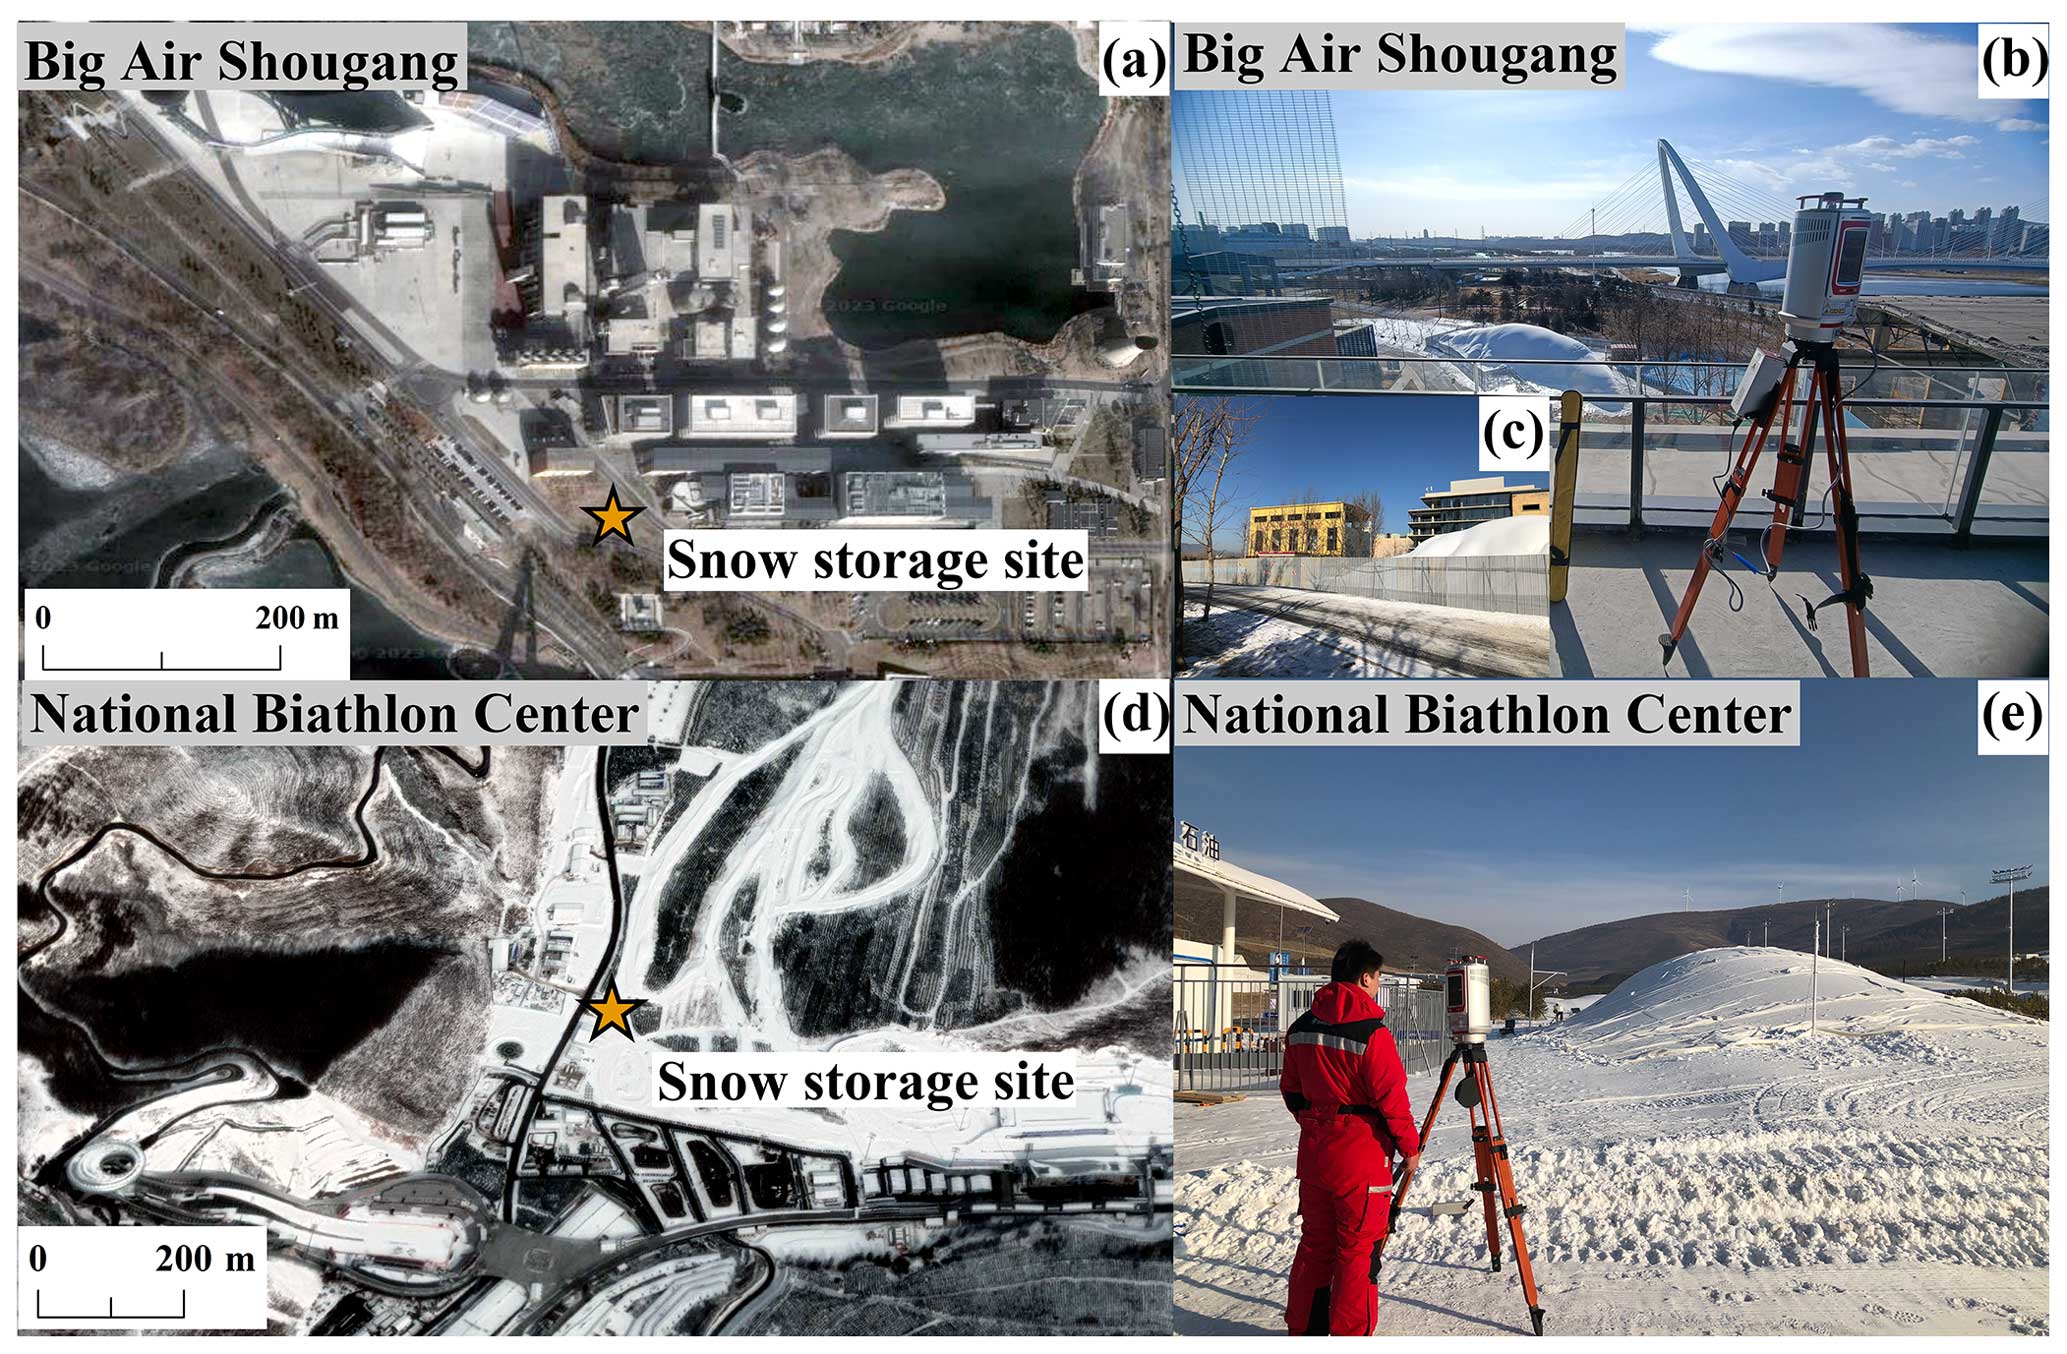
Figure 1Snow storage at the Big Air Shougang (BAS) and the National Biathlon Center (NBC), 2022. Snow storage sites at BAS (a) and the NBC (d) (satellite images from © Google Earth). The snow pile before being covered on 16 January 2022 at BAS (b). The fences encasing the BAS snow pile (c). The snow pile covered with geotextile on 20 January 2022 at the NBC (e) (photos provided by Xing Wang).
3.1 Meteorological data
The main meteorological conditions surrounding the snow piles were recorded using two automatic meteorological stations, which were installed adjacent to the snow piles on 10 and 20 January 2022, at BAS and the NBC, respectively. Due to venue management restrictions, the heights of the sensors were maintained at 2–3 m above the ground. The parameters, measured at a 15 min resolution, included air temperature, relative humidity, incoming and outgoing shortwave radiation and longwave radiation, wind speed, maximum wind speed, and wind direction. Precipitation data were obtained from the Mentougou national meteorological station (39.888° N, 116.156° E; 85.5 m a.s.l.), located 2.35 km away from the BAS storage site, and the Chongli national meteorological station (40.954° N, 115.269° E; 1239.8 m a.s.l.), situated 17.44 km away from the NBC site. Additionally, long-term meteorological data from these national stations for the year 2021 were acquired from the National Meteorological Information Centre to assess snow storage over the summer season. Since incoming shortwave radiation data were unavailable for the Mentougou and the Chongli national meteorological stations, this information was provided by the Daxing national meteorological station (39.718° N, 116.354° E; 37.5 m a.s.l.) for Beijing and the Zhangbei national meteorological station (41.150° N, 114.700° E; 1393.3 m a.s.l.) for Chongli.
3.2 Snow pile data
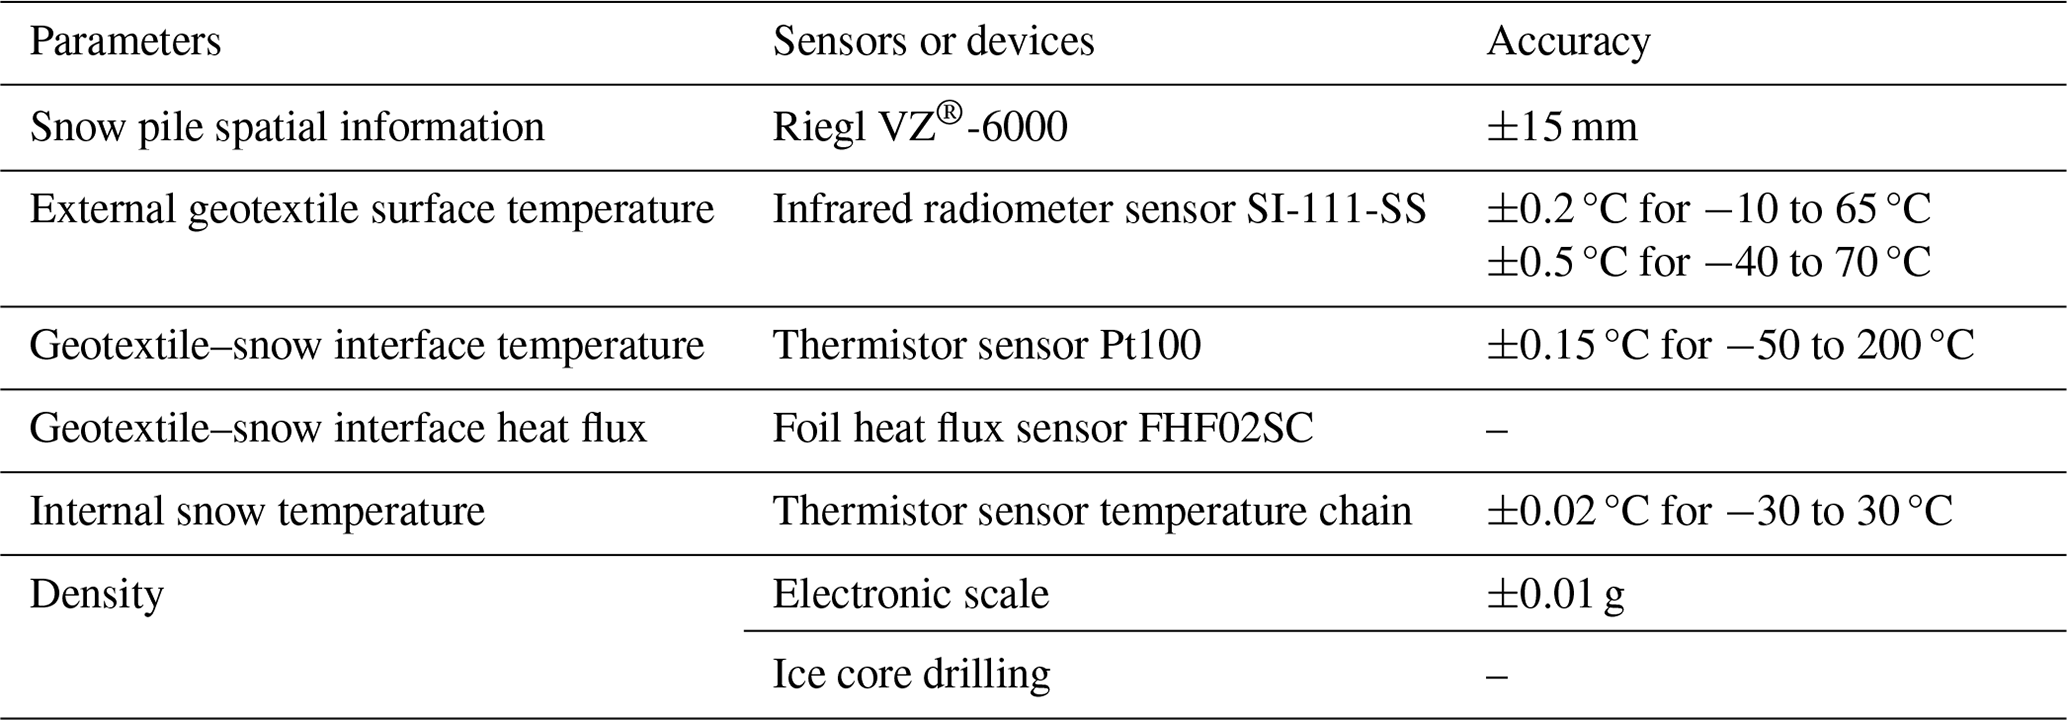
A monitoring system for snow piles was established, and the information regarding monitoring parameters, sensors, and devices can be found in Table 1. The repeated geometrical data of the snow piles were obtained using a Riegl VZ®-6000 Class 3B terrestrial laser scanner (TLS). Four temporal terrestrial laser scanning data surveys were performed at BAS on 16 January (TLS1), 18 February (TLS2), 9 March (TLS3), and 15 April (TLS4) 2022, respectively. As for the NBC, one terrestrial laser scanning survey was performed on 20 January 2022, and no additional data were available for subsequent times. A series of sensors were installed to continuously monitor the thermal conditions of the snow piles. In January 2022, the snow density was measured 3 m below the top surface using ice core drilling with extension rods at both BAS and the NBC. Further details can be found in the Supplement.
Table 1Information on snow pile monitoring parameters, sensors, and devices at BAS and the NBC.
3.3 TLS data processing
Geographic analysis cannot directly use the raw point clouds exported from the TLS. Therefore, we employed the RiSCAN PRO® v 2.14 software (Riegl Laser Measurement Systems, 2022) for post-processing, with most operations automated. Initially, we removed noise points with low reflectance and/or high deviation, as well as points isolated from all scan stations, to eliminate their impact on subsequent registrations. At this stage, the point clouds from each scan station were treated as independent entities. The second step involved automatic registration to combine these individual point clouds. Subsequently, a fine-scale registration was achieved through multi-station adjustment based on plane patches derived from the point clouds. In the third step, the registered point clouds were transformed into a global coordinate system (UTM 50N) using tie points created from ground control points. Lastly, we exported the processed point clouds, filtered to 0.01 m in the x, y, and z directions (octree mode), in the LAS format. These exported point clouds were then used to generate 0.05 m resolution digital surface models (DSMs) using Esri ArcMap 10.6. The geographic analysis and processing of these DSMs were conducted in Esri ArcMap 10.6.
3.4 Snow model
The SNOWPACK model is a one-dimensional physical model that uses a finite-element method to provide a detailed description of mass and energy exchange between snow, the atmosphere, and soil (Bartelt and Lehning, 2002; Luetschg et al., 2008). It has been widely used to study snow evolution (Wever et al., 2015; Horton and Haegeli, 2022; Keenan et al., 2021). For our study, we employed the SNOWPACK model to simulate the top-position evolution of the snow piles where the geotextile–snow interfaces were fitted with sensors and unaffected by geotextile overlaps at both BAS and the NBC. Additionally, the model was used to simulate snow storage at the tops of the snow piles over the summer season.
In the SNOWPACK model, the meteorological forcing data were obtained from nearby automatic meteorological stations at BAS and the NBC. The initial densities and temperatures of the snow layers were based on measurements, while the initial snow grain radius and liquid water content were set to 1 mm and 3 %, respectively, based on experiences and previous studies (Grünewald et al., 2018). The SNOWPACK model allows for the inclusion of other materials as the topmost layer, with specified mechanical and thermal properties (Olefs and Lehning, 2010; Grünewald et al., 2018; Luetschg et al., 2008). All other materials are represented as a three-component porous matrix (solid, void, and water). Valuable information on snow storage simulation has been provided by Rinderer (2009) and Grünewald et al. (2018). For the 0.004 m thin geotextile layer, the initial density and thermal conductivity were set at 111.1 kg m−3 and 0.06 W m−1 K−1, respectively, while other properties were obtained from the literature (Rinderer, 2009). In the simulation of snow storage over the summer season, an all-sky algorithm was applied to generate incoming longwave radiation, satisfying the meteorological requirements of the SNOWPACK model. The properties of the sawdust and straw chip layers in the model were assumed to be the same as described in previous studies (Rinderer, 2009; Grünewald et al., 2018), except for the thermal properties and densities, which were taken from a previous study (Wang et al., 2021).
4.1 Meteorological conditions and snow properties
Figure 2 presents the daily mean meteorological parameters from the two nearby automatic meteorological stations during specific periods: 11 January to 27 April 2022, at BAS, and 21 January to 13 March 2022, at the NBC. A significant difference in mean air temperatures was observed between 21 January and 13 March at the two snow storage sites, with 1.5 °C at BAS and −11.1 °C at the NBC. Trends of increasing and then decreasing air temperatures and relative humidity were noted during the Winter Olympic competition days (WOcd) at BAS (7 to 15 February) and the NBC (5 to 19 February) (Fig. 2a and c). The air temperature gradually rose between the WOcd and the Paralympic competition days (WO-WPcd) at the NBC (20 February to 4 March), which was not favorable for snowmaking. In contrast, the variations in relative humidity were conducive to snowmaking during the same period (Fig. 2c). Overall, the wet-bulb temperature remained well below the threshold for snowmaking, indicating the availability of artificial snow before the Paralympic competition days (WPcd) at the NBC. The mean air temperature, relative humidity, incoming shortwave radiation, and incoming longwave radiation for the entire record at BAS were 5.9 °C, 40.6 %, 160.8 W m−2, and 287.2 W m−2, respectively, while those at the NBC were −11.1 °C, 56.7 %, 157.3 W m−2, and 200.3 W m−2, respectively. The mean wind speed was 0.5 m s−1 at BAS and 1 m s−1 at the NBC. The predominant wind directions were opposed at BAS and the NBC (Fig. 2e and f), possibly due to local topography. Precipitation was scarce, resulting in reduced track maintenance needs, with cumulative precipitation of 36.7 mm at BAS and 14.2 mm at the NBC.
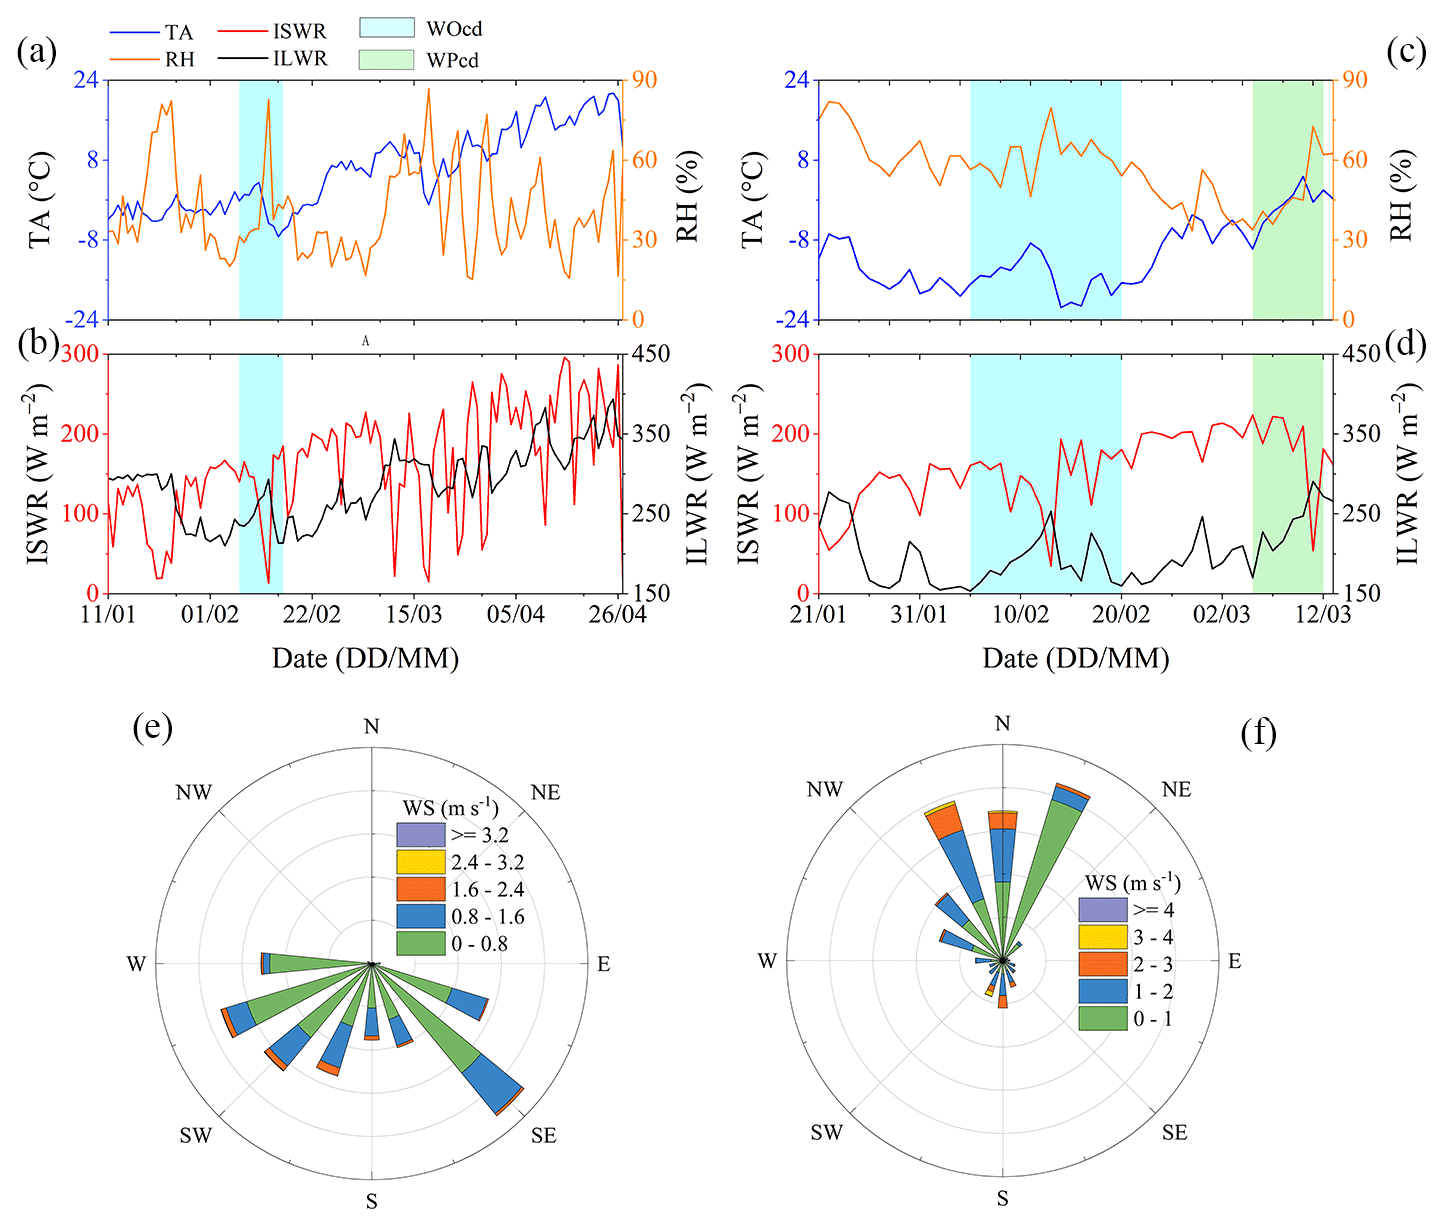
Figure 2Daily mean meteorological conditions at BAS (a, b, e) (January–April 2022) and the NBC (c, d, f) (January–March 2022). (a, c) The blue and orange lines represent air temperature (TA) and relative humidity (RH), respectively. (b, d) The red and black lines indicate incoming shortwave radiation (ISWR) and incoming longwave radiation (ILWR), respectively. (e, f) Wind speed (WS) and wind direction (WD). The vertical light-cyan shading signifies the Winter Olympic competition days (WOcd) at BAS (7 to 15 February) and the NBC (5 to 19 February). The vertical light-green shading signifies the Winter Paralympic competition days (WPcd) at the NBC (5 to 13 March). BAS is not a Winter Paralympic venue.
On 16 January, three groups of snow cores were extracted and weighed from 3 m below the top surface of the snow pile at BAS. The mean density of the snow cores (1 m below the top surface) was 459.5 kg m−3 at BAS. The mean density increased with depth, but the values at 2 and 3 m were similar, at 533.5 and 538.7 kg m−3, respectively. Similarly, at the NBC, the mean densities at 1, 2, and 3 m below the top surface were 478.1, 515.3, and 529.0 kg m−3, respectively. When snow falls on the ground, continuous changes in grain size, shape, and cohesion affect the physical properties of the snow. On 7 January, 7 February, 20 February, and 11 March, an increase in grain size over time with low cohesion on the top surface was observed at BAS. On 20 February, an “ice layer” formed by freezing top surface meltwater existed 0.1–0.2 m below the top surface. This layer is characterized by low permeability and porosity (Colbeck, 1982), meaning that less heat from the surface is transferred by the meltwater to the snow below the ice layer. The pores above the ice layer were gradually filled with liquid water, and horizontal flow might have occurred (Colbeck, 1972).
4.2 Digital surface models (DSMs) and mass changes derived from TLS data
Four TLS surveys were conducted to generate DSMs at BAS (Fig. 3e–h), which were then used for hillshade rendering (Fig. 3a–d) and mass change analysis (Fig. 3i–k). However, only one TLS survey was available at the NBC, so no change analysis was provided. The absolute snow pile volume required a bare-ground elevation model, which was unavailable for both BAS and the NBC. Therefore, it was approximated through interpolation based on nearby ground. The initial snow pile volume at BAS was 2356.6 m3. Due to limitations of the snow storage site, the shape of the snow pile was long and narrow, resulting in a high upper surface area-to-volume ratio of 0.63. The snow pile edges with low snow pile heights in a large area may also explain this high value. Additionally, the snow pile surface was noticeably uneven over time (Fig. 3a–d), caused by the nonuniform melting between the geotextile overlaps and other parts. Beyond the WOcd, a TLS survey was performed on 18 February at BAS, revealing a slight volume change of 158.6 m3 snow loss between 16 January (TLS1) and 18 February (TLS2). From the second survey (18 February) to the third survey (9 March), 304.2 m3 of snow was lost, and a significant snow volume loss of 780.1 m3 occurred from 9 March (TLS3) to 15 April (TLS4). This considerable snow volume loss after the WOcd was expected, and the accelerated melting was mainly influenced by meteorological conditions. The thin geotextile layer could not provide adequate protection as air temperature rose (Olefs and Lehning, 2010; Rinderer, 2009). Furthermore, fouling on the external geotextile surface decreased shortwave radiation reflectivity. The snow pile showed an evident tendency of increasing ablation on the long sides, particularly the southwest side (Fig. 3i–k). Three main factors contributed to this tendency: coverage, wind, and shortwave radiation. An air layer existed between the snow surface and geotextile on the long sides due to the geometry, while the overlap facilitated air circulation between the internal and external geotextile layers, promoting heat exchange without thermal resistance from the geotextile layer. Wind erosion also contributed to increased snow volume loss, with the southwest side being windward of the snow pile (Fig. 2e), while the northeast side was leeward, leading to convective heat exchange differences. In the morning, buildings obscured the direct shortwave radiation reaching the northeast side, but it remained unimpeded when the sun was in the south, southwest, and west orientations (Fig. 1a). Densification and ablation affected the snow pile height variations. The model result showed a 6.0 % increased density on 15 April. Consequently, melting accounted for 1101.5 m3 of snow volume reduction, while densification contributed to 141.4 m3 of snow volume reduction. The DSM and hillshade rendering at the NBC are shown in Fig. 4a and b, respectively, with an initial snow pile volume of 2995.2 m3, which was 638.6 m3 larger than that of BAS.
There are noticeable negative values in snow pile height and snow pile height variations at the edges of the snow pile for different reasons. In Fig. 3e–h, this occurs because the bare-ground interpolation is higher than the actual ground, as evident from the expansion of the negative area over time. In Fig. 3i, the negative values result from the presence of natural snow. In Fig. 3j and k, irregular stacks of geotextiles appear to be the primary reason. On 18 February, we observed that natural snow on the long sides accumulated at the edges of the snow pile due to gravity, and at that time, the artificial snow beneath the geotextile was slightly lost. Instead, most of the artificial snow at the edges disappeared, and wind caused the geotextiles to form irregular stacks on 9 March and 15 April. Since the negative areas have low a snow pile height, they have a minor impact on volume analysis and are treated as zero.
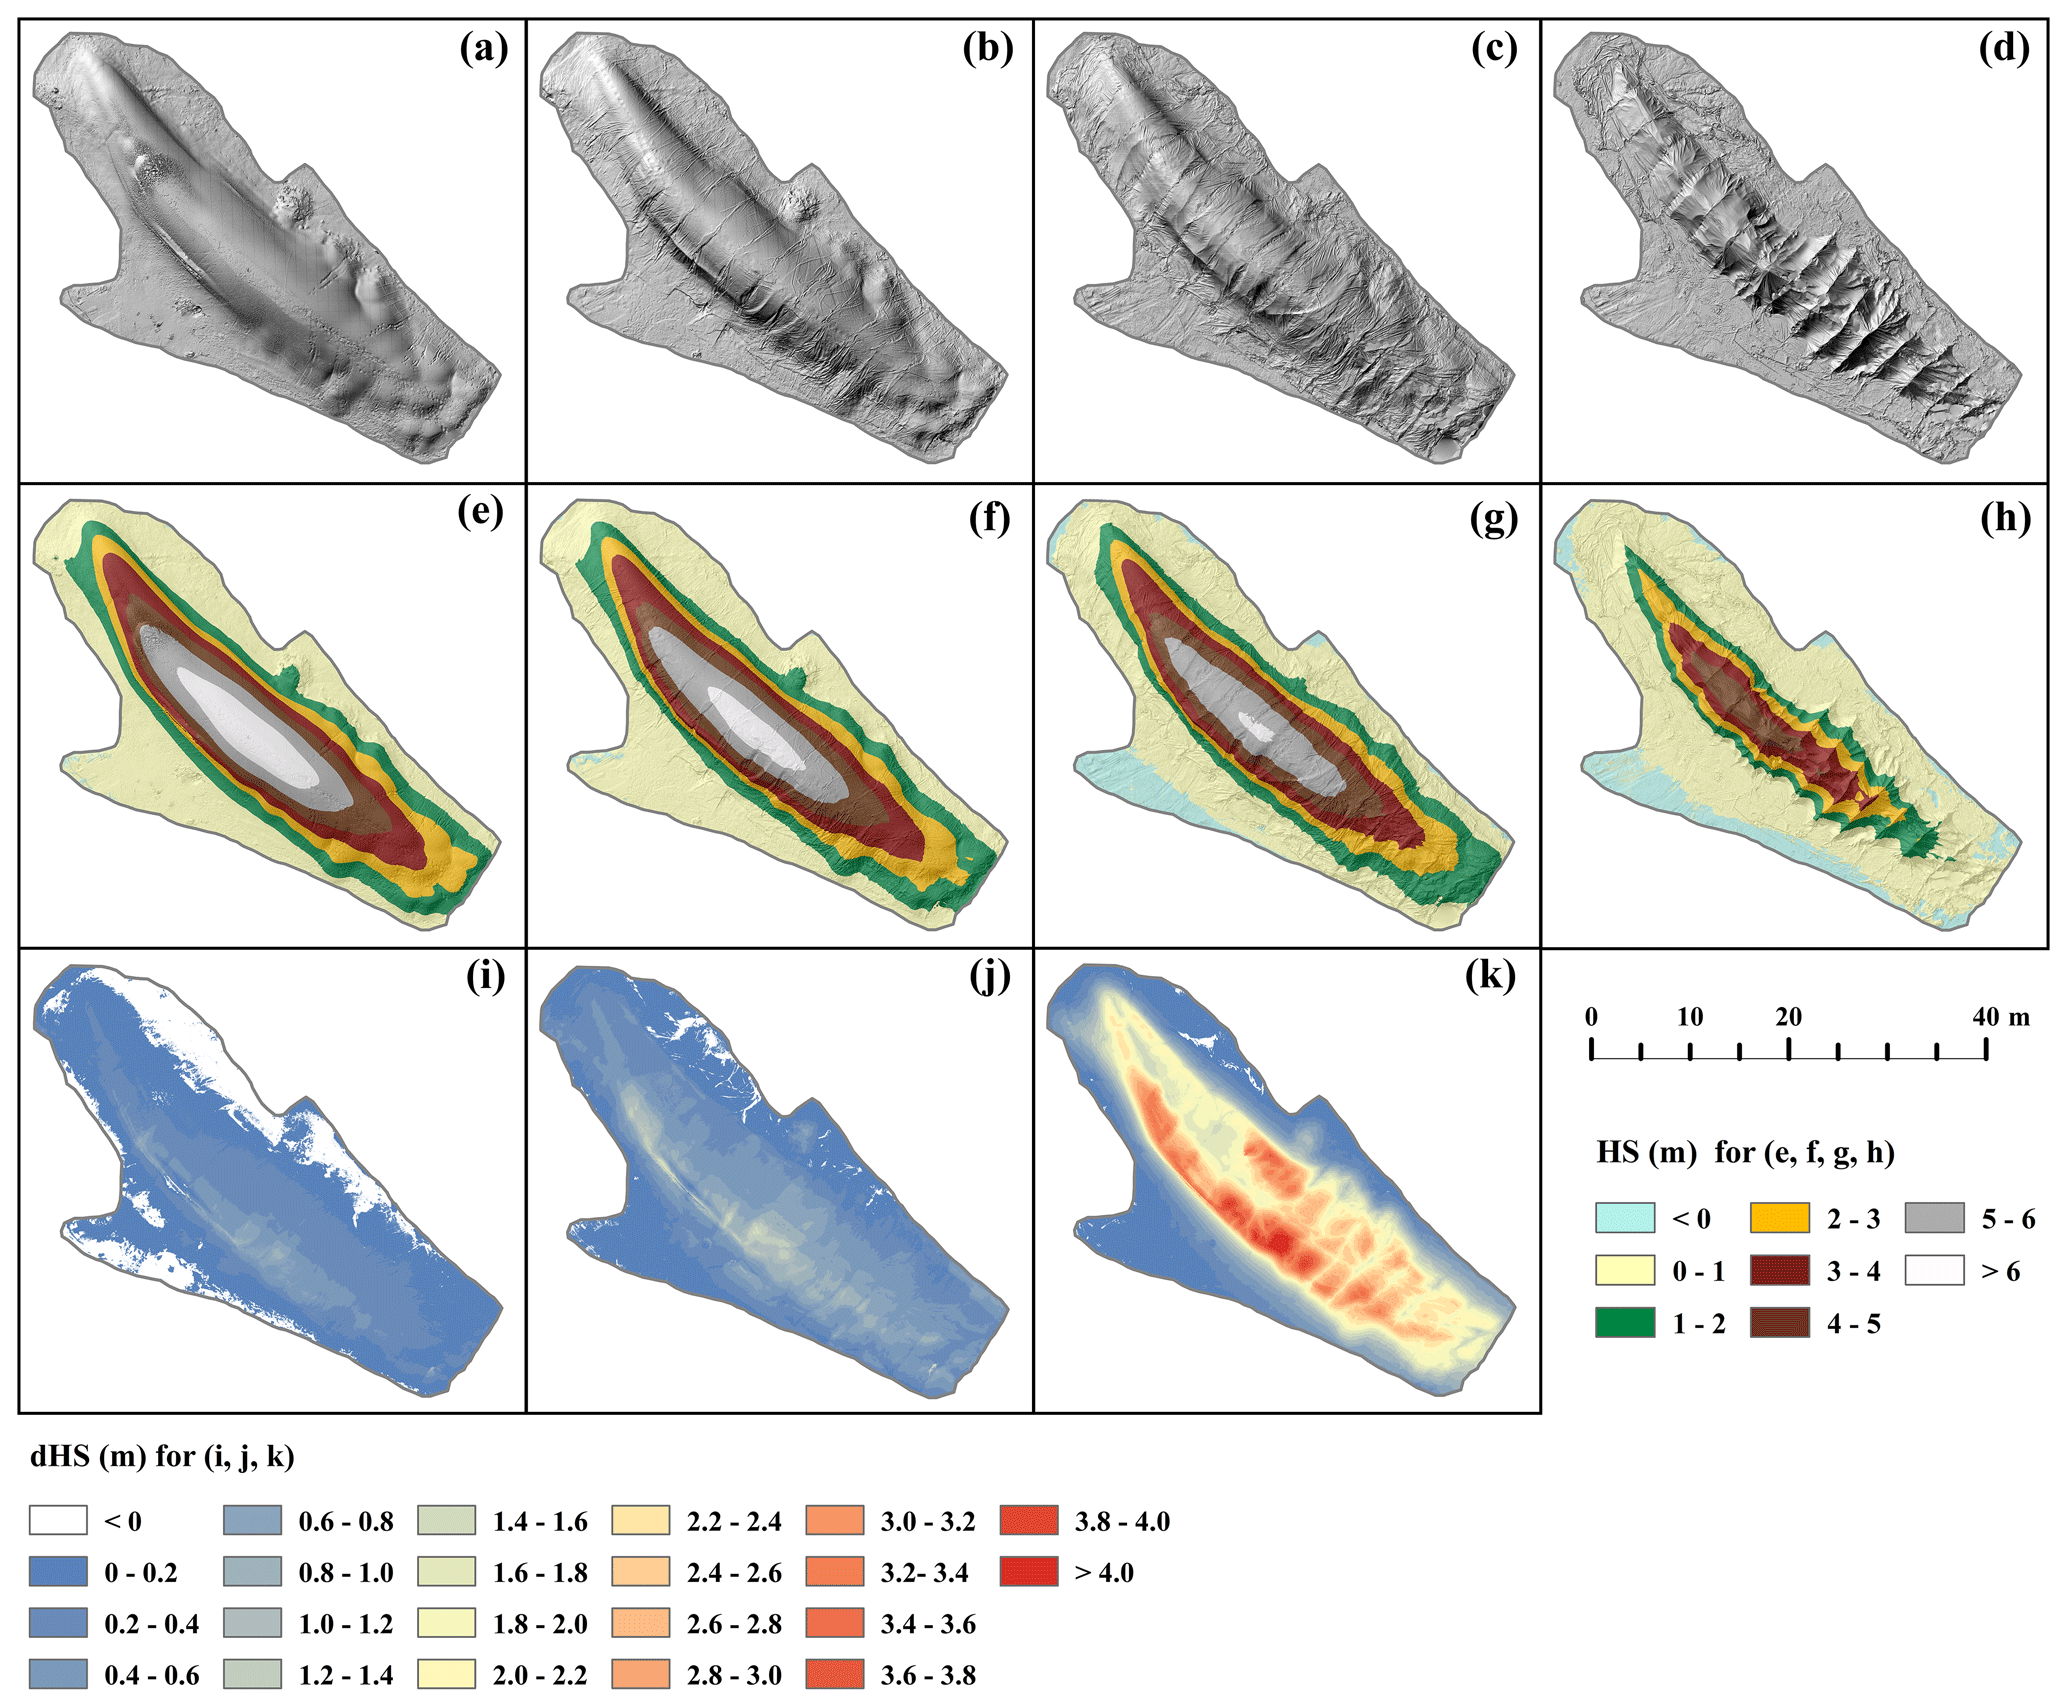
Figure 3The BAS snow pile. Hillshade rendering based on the TLS-derived DSMs on 16 January (TLS1) (a), 18 February (TLS2) (b), 9 March (TLS3) (c), and 15 April (TLS4) (d) 2022. The spatial distribution of the snow pile height (HS) referenced by the interpolated ground for TLS1 (e), TLS2 (f), TLS3 (g), and TLS4 (h). The spatial distribution of snow pile height variations (dHS) for TLS1–TLS2 (i), TLS1–TLS3 (j), and TLS1–TLS4 (k).
4.3 Measured snow pile thermal regime
The external geotextile surface temperatures on the southwest side of the snow pile at BAS were found to be more sensitive to meteorological conditions than those on the northeast side (Fig. 5a), likely due to factors such as wind, radiation, and the presence of an air layer. The slight difference in external geotextile surface temperatures along the long sides before 25 January at BAS can be explained by two aspects (Fig. 5a). First, the snow pile was not immediately covered until 21 January, so the data represented the snow surface temperature on the long sides between 17 and 20 January. Second, a snowfall event between 21 and 24 January resulted in the geotextile surface being covered with natural snow, which subsequently led to a re-recording of the snow surface temperature. Phase transitions on the snow surface can moderate temperature variations. According to hourly temperature data from 17 January to 24 April, the mean peak temperatures on both long sides occurred simultaneously at 14:00 UTC+8, with 0.9 °C on the northeast side and 1.1 °C on the southwest side at BAS, influenced by incoming shortwave radiation, air temperature, and terrain shadowing. The underlying snow surface, longwave radiation, and evaporation strongly cooled the external geotextile surface. The external geotextile surface temperatures were lower than the air temperatures at both BAS and the NBC. The mean external geotextile surface temperatures on the two sides were nearly equal (Fig. 5b), with −19.7 °C on the northwest side and −19.4 °C on the short southwest side at the NBC. At the NBC, the maximum hourly temperature on the northwest side occurred at 14:30 UTC+8 with −11.9 °C, half an hour later than the southwest side with −10.8 °C.
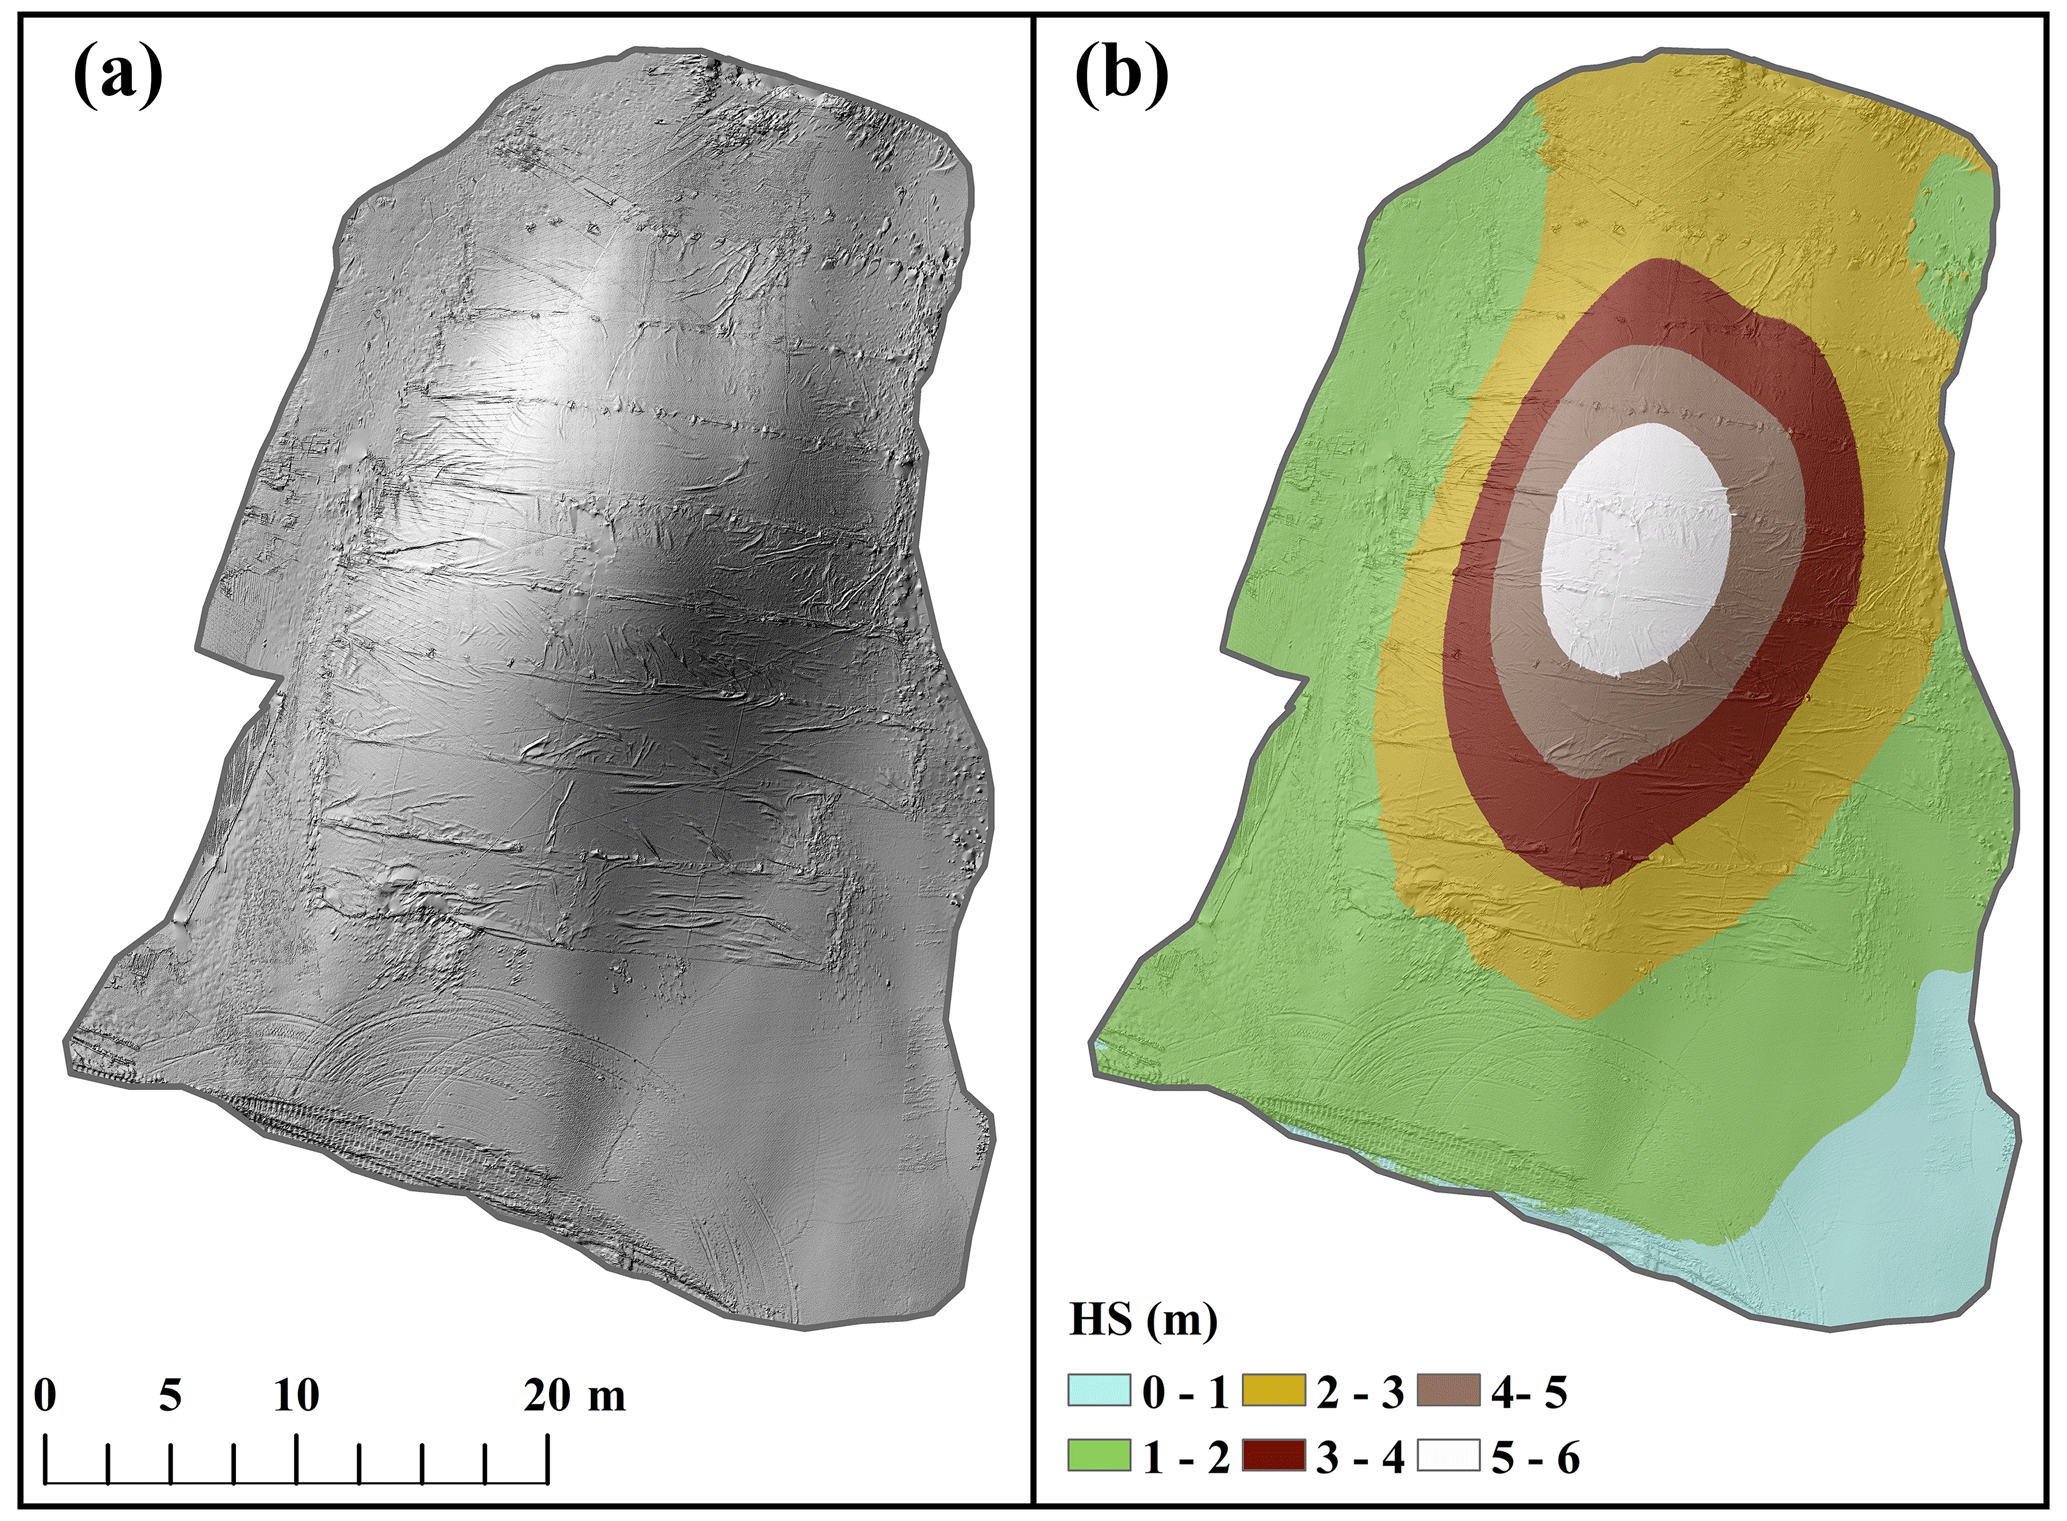
Figure 4The NBC snow pile. Hillshade rendering based on the TLS-derived DSM on 20 January 2022 (a). The spatial distribution of the snow pile height (HS) referenced by the interpolated ground (b).
The temperatures at the top geotextile–snow interfaces and at various depths within the snow piles are shown in Fig. 6a and b at BAS and the NBC, respectively. At BAS, temperatures at the upper snow pile clearly fluctuated due to meteorological conditions, whereas the peaks and valleys of the temperature curves at the central snow pile, especially at the 2.45 m depth, tended to diminish. Diurnal variations can be detected at the interface and at a depth of 0.2 m with delayed peak temperatures (5 h of time lag) for TLS1–TLS2, while the 0.45 m depth reaches a 13 h time lag (Fig. S1 in the Supplement). Regarding the mean hourly temperatures during the same period, temperatures above 0 °C were observed at 13:00 (0.3 °C) and 14:00 UTC+8 (0.2 °C) at the top geotextile–snow interface, indicating surface melting occurred. In contrast, the maximum temperature at a depth of 0.2 m occurred at 18:00 UTC+8 (−3.4 °C). The temperature gradients between different depths (ranging from 0.2 to 2.45 m with 0.25 m intervals) and the top geotextile–snow interface showed an increasing trend followed by a decrease for TLS1–TLS2, with the transition occurring at a depth of 0.7 m with a value of 4.4 °C m−1. The depth of 0.2 m exhibited the smallest temperature gradient (1.7 °C m−1) due to its proximity to the boundary, which facilitates heat and mass transfer. For TLS1–TLS2, the temperature gradient at a depth of 2.45 m was 2.0 °C m−1. From 8 March onwards, a reversal in the temperature gradient direction was observed, leading to a change in the direction of heat and water vapor flow dominated by the temperature gradient. The temperatures increased over time and eventually exceeded 0 °C, which can be explained by rising air temperature and the thermistor sensors being less distant from the surface or possibly exposed. The temperature curve in Fig. 6a suggests that the recorded location decreased by 2.45 m on approximately 24 April.
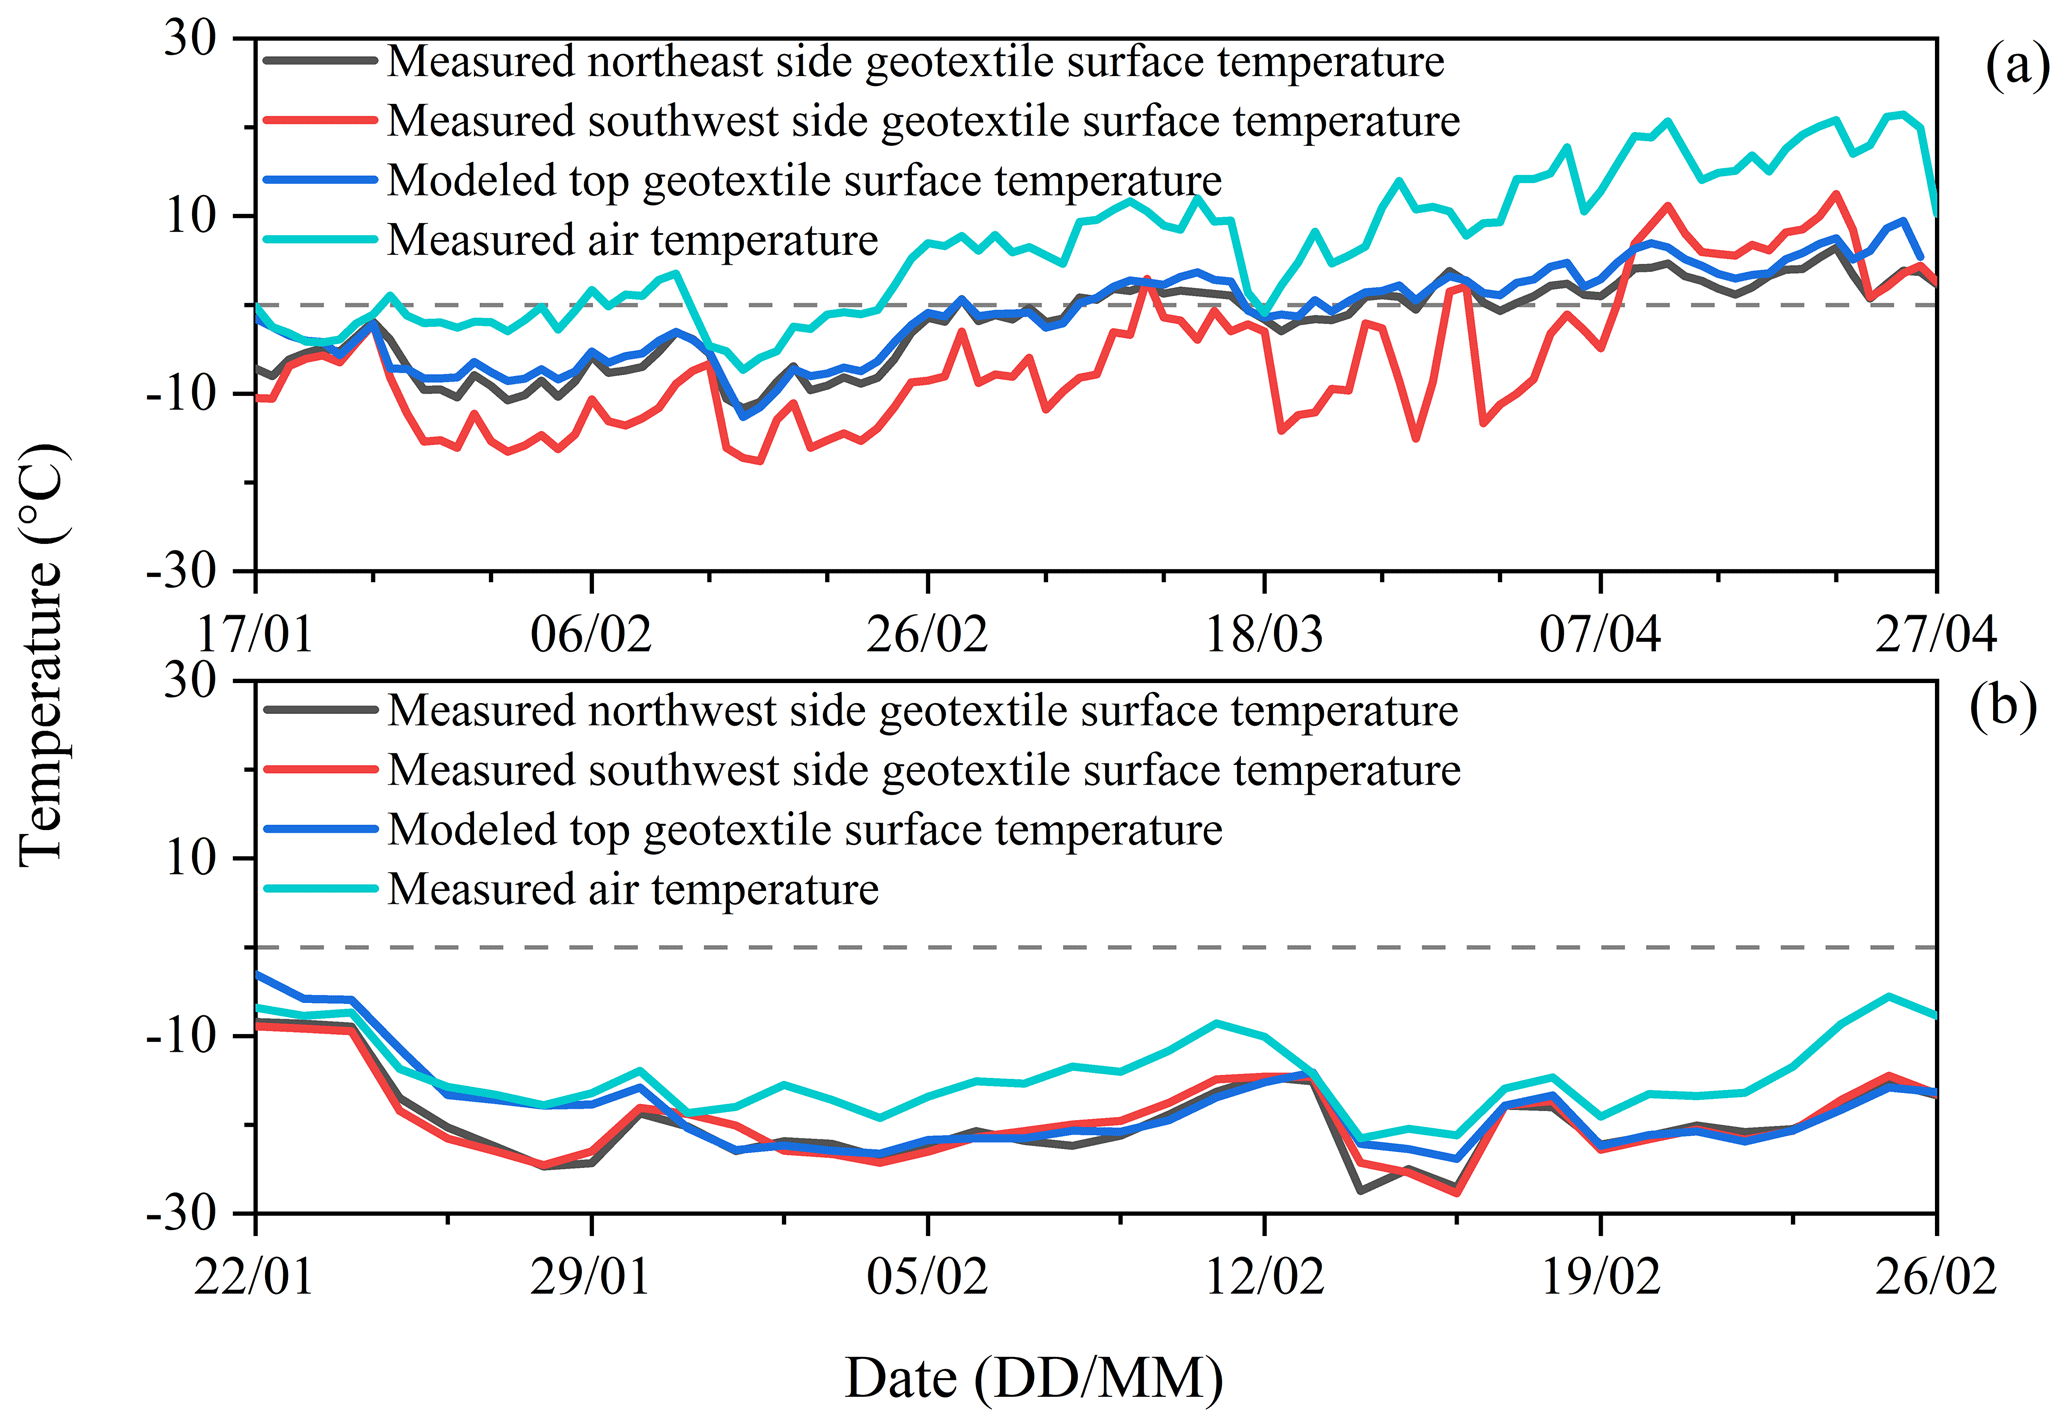
Figure 5Daily mean measured external geotextile surface temperatures on snow piles sides and modeled external geotextile surface temperatures on top of snow piles at BAS (a) and the NBC (b) 2022. The horizontal dashed line indicates 0 °C.
At the NBC, no diurnal temperatures above 0 °C were observed either at the geotextile–snow interface or within the snow pile (at depths ranging from 0.25 to 2.25 m, with a 0.25 m interval). At the interface and the 0.25 m depth, temperature trends increased, decreased, and then increased again during the WOcd and WO-WPcd. However, temperatures at the 2.25 m depth did not follow these trends observed in the upper snow pile but instead continuously decreased. This phenomenon is primarily due to the attenuation and lag of temperature waves by the snow layers. Compared with BAS, the snow pile at the NBC experienced more significant temperature gradients between the geotextile–snow interface and several depths. Additionally, the temperature gradient decreased with depth, with a value of 6.1 °C m−1 at the 2.25 m depth during the pre-competition days (Pre-WOcd) at the NBC. Given the similar initial conditions of snow piles at BAS and the NBC, the temperature differences within snow piles are mainly caused by the meteorological conditions.
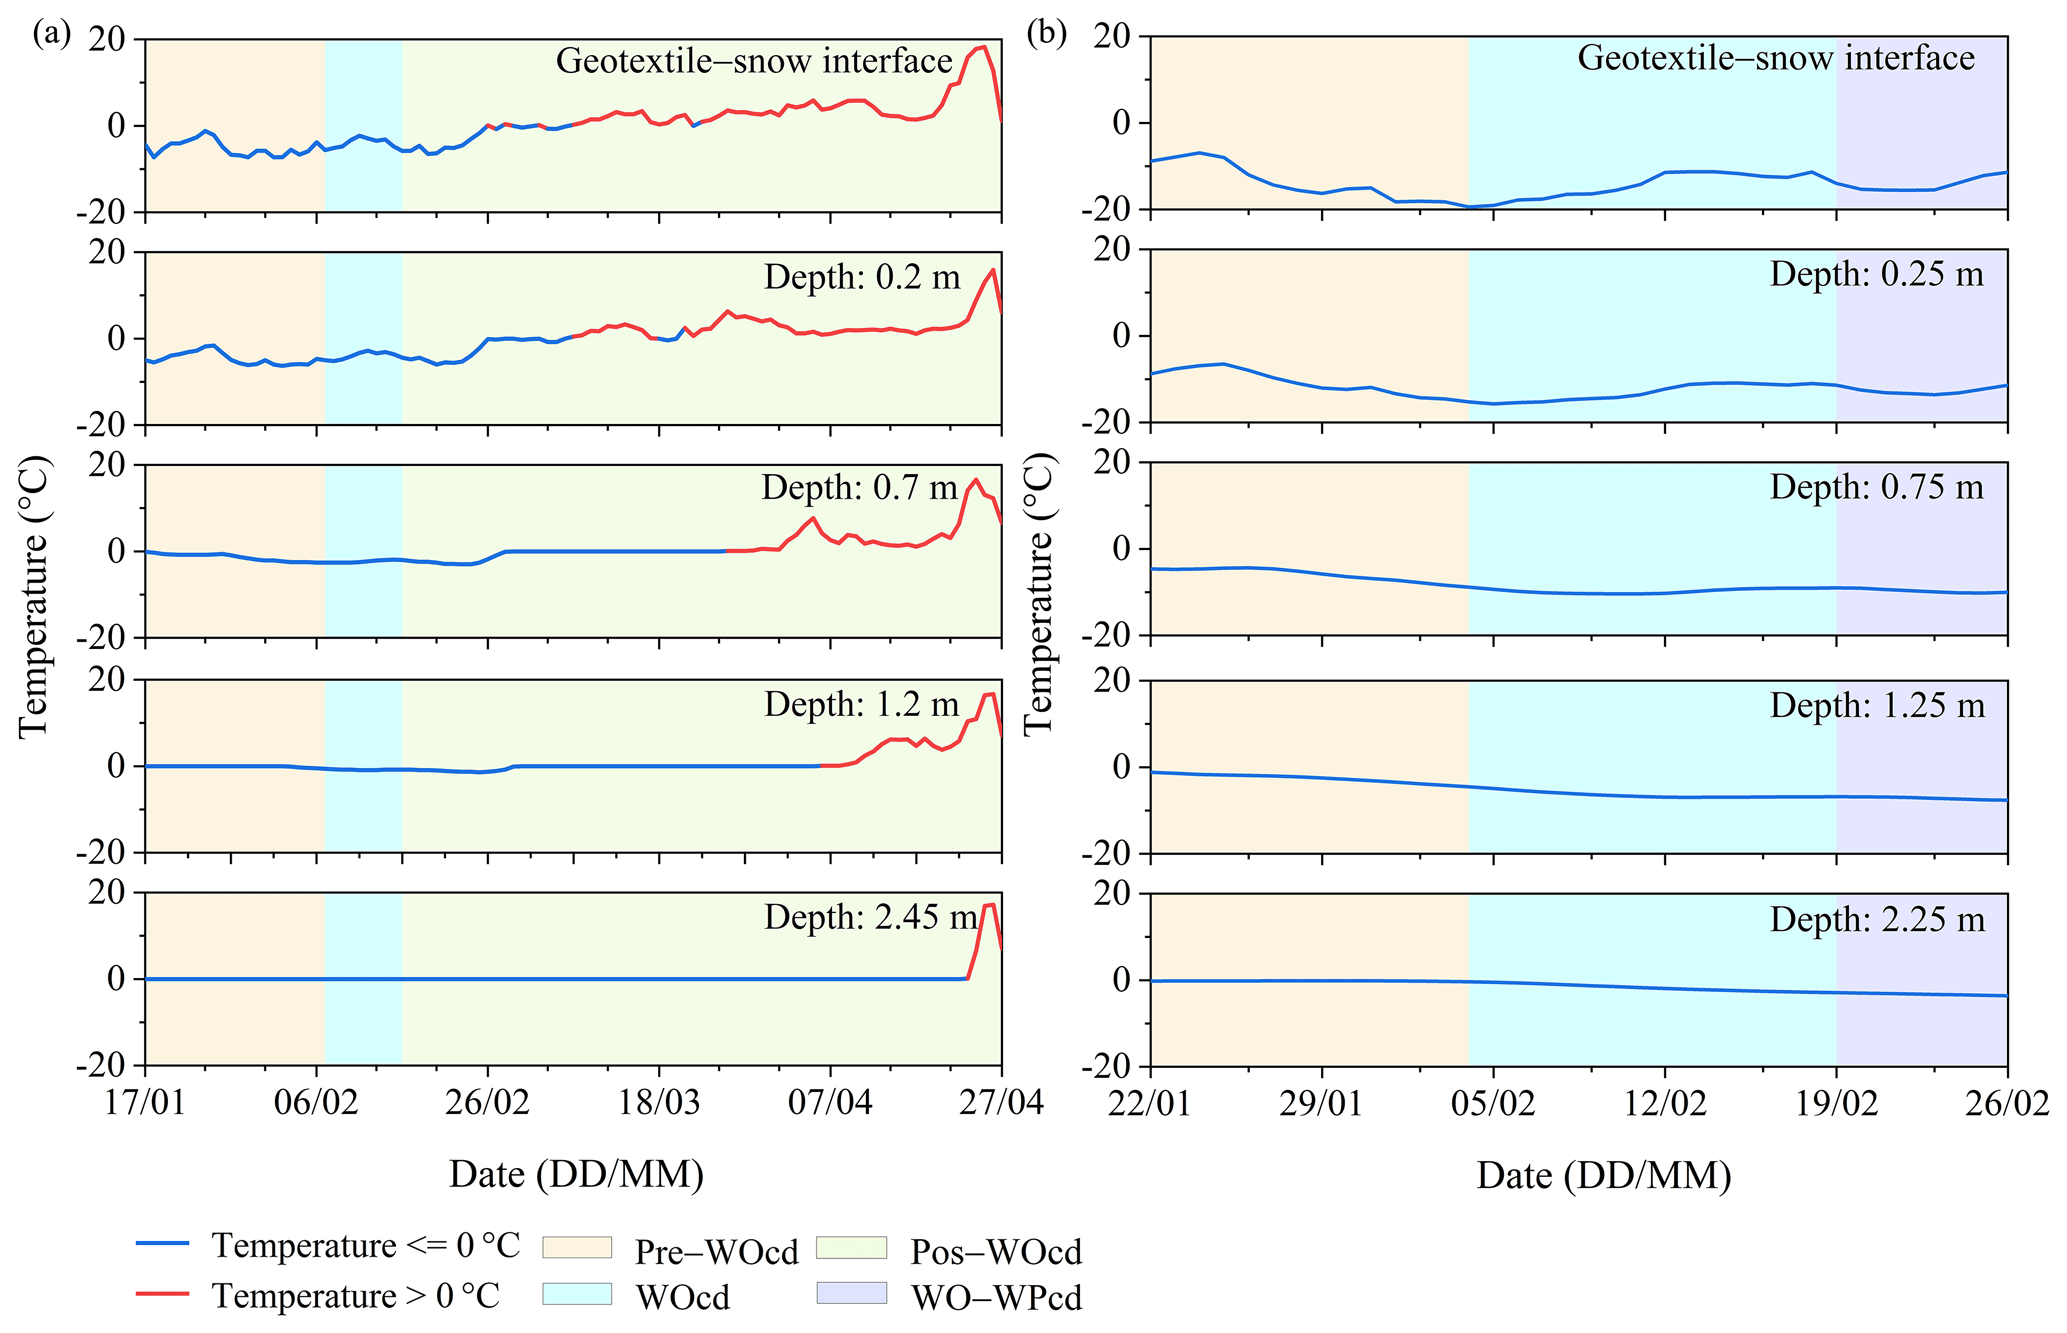
Figure 6Daily mean measured temperatures at the top geotextile–snow interfaces and different depths in snow piles at BAS (a) and the NBC (b) 2022.
4.4 Modeled snow pile height and snow properties
We focused on modeling the top-position evolution of the two snow piles, where the geotextile–snow interfaces were equipped with sensors and unaffected by geotextile overlaps. This approach allowed us to parameterize the boundary conditions easily, irrespective of overlaps, air layers, and air circulation between the internal and external geotextile layers. Furthermore, it enabled a meaningful comparison between the modeled external geotextile temperatures and the measured geotextile–snow interface temperatures. The snow pile heights were determined using 0.05 m resolution grids, derived from five terrestrial laser scanning surveys, where temperature measurements were conducted at the geotextile–snow interface encompassed by the grids. The initial snow pile heights were 646.4 cm at BAS and 572.4 cm at the NBC. We also considered terrain shadowing caused by surrounding buildings in the model (Bavay and Egger, 2014). Figure 7a illustrates the modeled temporal evolution of height for the two snow piles. At BAS, the modeled snow pile height dropped by 268.2 cm between 17 January and 27 April. Due to lower air temperatures, the modeled snow pile at the NBC experienced slight ablation from 22 January to 4 March. The modeled downward trend aligns with the measured heat flux at the top geotextile–snow interface at BAS (Figs. 7a and S2). However, the model slightly underestimated the measured snow pile height drop on 15 April (Fig. 7b). The deviations between modeled and measured snow pile height drops were −10 cm (−34 %), −5 cm (−19 %), and 1 cm (1 %) for the periods 16 January to 18 February, 18 February to 9 March, and 9 March to 15 April, respectively. As air temperatures rose (Fig. 2), the gap between modeled and measured snow pile height drops diminished, eventually trending towards overestimation, a deviation consistent with previous studies (Olefs and Lehning, 2010; Grünewald et al., 2018). Interestingly, at lower air temperatures, the model underestimated the measured snow pile height drops for the first (−1.9 °C) and second (4.6 °C) periods. There are three possible explanations for this: (i) the wind speed being recorded as lower than the actual wind speed due to the weather station being positioned lower than the fences and thereby subject to the shielding effect of the fences (Fig. 1c), (ii) the fouling on the external geotextile surface, and (iii) inherent limitations of the model itself. At higher air temperatures, the wind speed and fouling reasons appeared not to alter the model overestimation for the third period (11.0 °C). On 24 April, the modeled snow pile height dropped by 249.5 cm, consistent with temperature indicators at a depth of 245 cm within the snow pile, indicating a drop in the snow pile height of approximately 245 cm (Fig. 6a). To investigate the differences between covered and uncovered snow piles, we established two scenarios in the SNOWPACK model (Fig. 7a). Compared to the uncovered scenario, the geotextile offered protection for 45 % of the snow pile height on 27 April at BAS. Minor disparities between the uncovered and covered snow pile height were detected in the early stages. However, it would be premature to infer from these results that the geotextile played a negligible role during these periods, as wind erosion on the southwest side of the snow pile was observed at BAS on 7 February, with a maximum difference of 12 cm between covered and uncovered snow surfaces (Fig. S3).
Initially, the modeled mean liquid water content of the geotextile cover was zero until 25 February, after which it reached a mean of 5.5 % at BAS. Diurnal variations can be detected in the later period, peaking at 41 %. An examination of the flux components revealed that net longwave radiation was the most significant expenditure in the earlier period, while the latent heat (−44.38 W m−2) was lower than the net longwave radiation (−27.04 W m−2) in the later period. This contrast suggests that the liquid water content of the geotextile contributes to the latent heat and reduces ablation. At the NBC, the mean liquid water content of the geotextile cover was zero, resulting in a small latent heat value (Fig. 9). The liquid water content in the snow layers of both piles showed no significant variation, except for the upper part of the snow piles. In Fig. 7c and d, we present the modeled snow density for the covered snow piles at BAS and the NBC, respectively. The low porosity (mean = 44 %) of the initial snow layers contributed to slight variations in snow pile density at both BAS and the NBC compared to the seasonal snow cover. Assuming the initial snow density within the lower part of the snow pile is the same as at 3 m depth, the snow density increased by 6.4 % at BAS on 27 April and by 2.2 % at the NBC on 4 March.
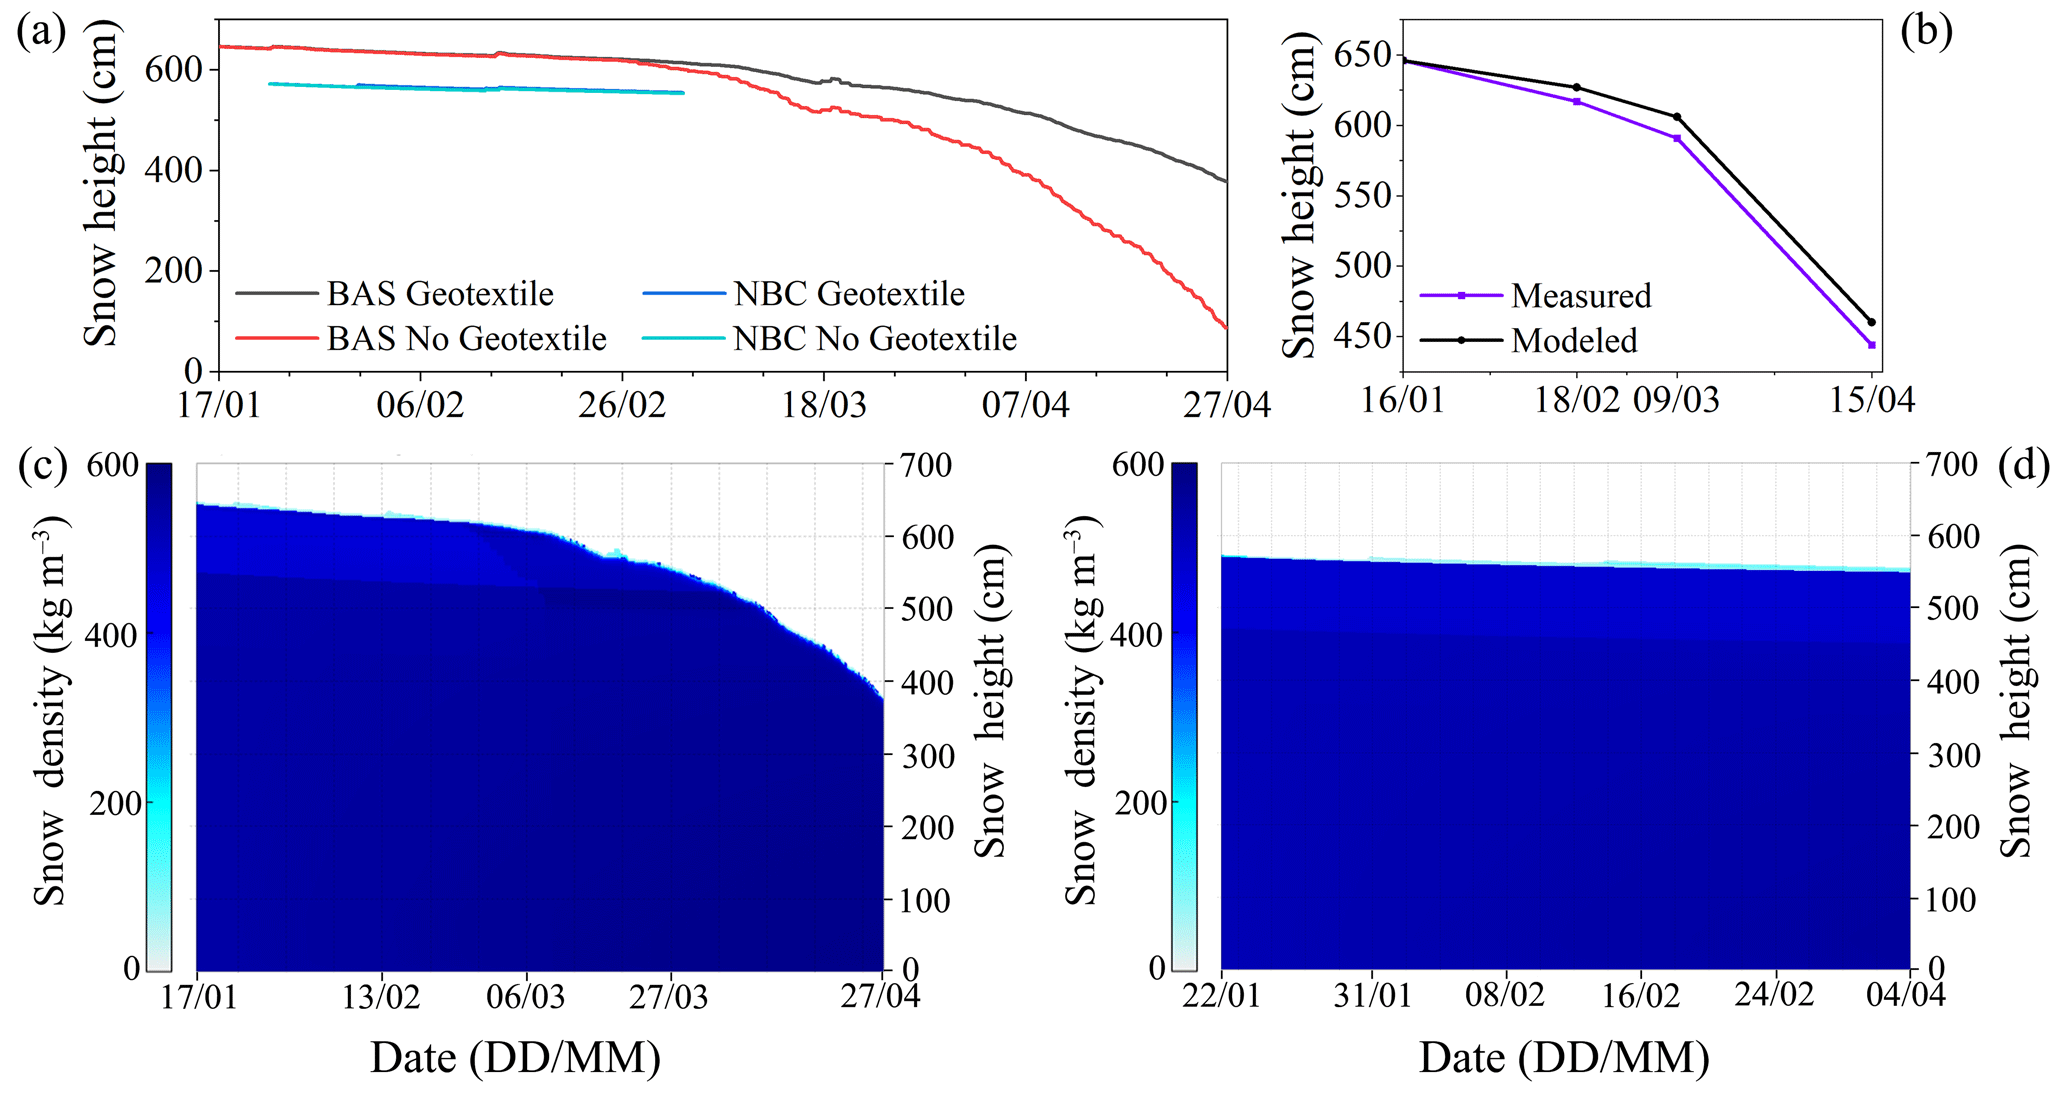
Figure 7Measured and modeled snow piles' evolution. (a) Modeled snow pile height evolution for covered (“Geotextile”) and uncovered (“No Geotextile”) conditions at BAS and the NBC, 2022. Measured snow pile height for four terrestrial laser scanning surveys and corresponding modeled values at BAS (b). Modeled snow density for covered snow piles at BAS (c) and the NBC (d).
4.5 Modeled top external geotextile surface temperatures and energy balance
Figure 5 demonstrates that the model effectively captured the trends in external geotextile surface temperatures. Before 25 January, tiny differences between the modeled top external geotextile surface temperatures and the measured external surface temperatures on the snow pile sides were detected at BAS due to snowfall. Early simulations were limited by initial conditions and the model itself, leading to unreliable results. This insight may help explain the differences between the modeled top external geotextile surface temperatures and the measured external surface temperatures on the snow pile sides before 31 January at the NBC. Figure 8 presents the modeled top surface temperatures (covered and uncovered) and the measured top geotextile–snow interface temperatures at BAS and the NBC. The relationship between the modeled top external geotextile surface and the measured top geotextile–snow interface temperatures can be used to evaluate the model performance. The top external geotextile surface temperatures above 0 °C were generally underestimated (mean modeled geotextile surface temperature = 2.8 °C, mean interface temperature = 2.9 °C) at BAS. Contrary to the external geotextile surface temperature, the additional heat is used for melting snow instead of raising the snow surface temperature when the bare-snow surface temperature reaches around 0 °C (Fig. 8). Between 17 January and 27 April at BAS, the modeled mean top external geotextile surface temperature was −1.0 °C, while at the NBC, it was −18.2 °C between 22 January and 26 February.
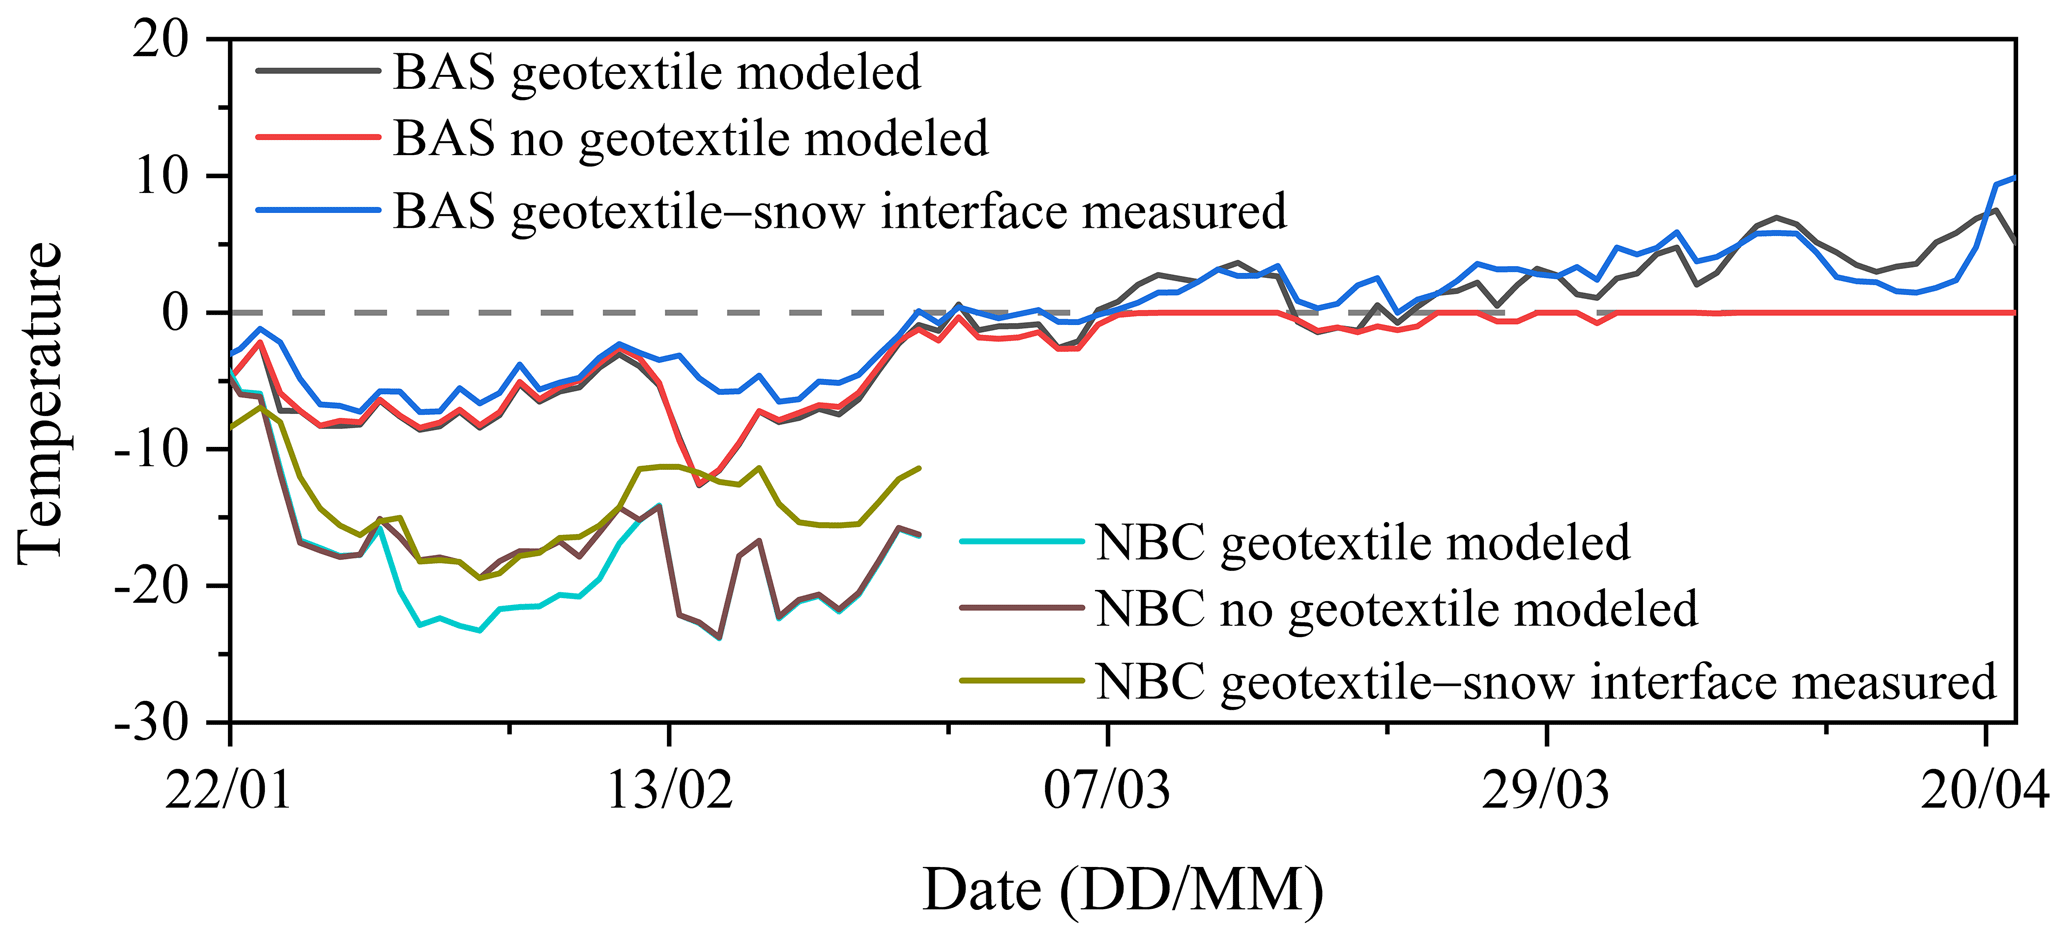
Figure 8Daily mean modeled top surface temperatures for covered, uncovered, and measured top geotextile–snow interfaces at BAS and the NBC in 2022. The horizontal dashed line indicates 0 °C.
Important energy balance analysis (Fig. 9) reveals that covered snow piles had lower fluxes than uncovered piles for all components at BAS. The most significant energy expenditure component at BAS between 17 January and 27 April was latent heat, indicating that the evaporation of wet geotextile significantly contributed to protecting the snow pile. In contrast, the net longwave radiation was the most significant expenditure component at the NBC. The largest incoming component at BAS was sensible heat, which differs from high-latitude and/or high-altitude regions (Grünewald et al., 2018; Olefs and Lehning, 2010). This contrast highlights the need for improvement of the thermal insulation capacity of a cover layer in mid-latitude and low-altitude regions. Furthermore, considering the enhanced snowmaking capabilities and more favorable snowfall conditions in high-latitude and/or high-altitude regions, the importance of snow storage escalates in mid-latitude and low-altitude regions. The contribution of heat from rain was minimal, with 0.01 W m−2 at BAS and 0 W m−2 at the NBC. The energy balance components at the NBC illustrate the conditions for covered and uncovered snow piles under 0 °C air temperature. The mean external geotextile surface temperature (−18.2 °C) was lower than the bare-snow surface temperature (−16.9 °C), and both were below the air temperature (−14.5 °C), resulting in greater sensible heat and net longwave radiation for the covered snow pile. Due to higher reflectivity, the net shortwave radiation for a covered snow pile was lower than that for an uncovered one. The magnitude of incoming energy components was small, and the incoming components were dampened when passing through the geotextile cover. When the external geotextile surface temperature is higher than the bare snow surface temperature (i.e., air temperature is above 0 °C), the conditions are reversed. The sensible heat, latent heat, and net longwave radiation of the covered snow pile are lower than those of the uncovered pile. As a result, the differences in snow pile height increase between covered and uncovered snow piles (Fig. 7a).
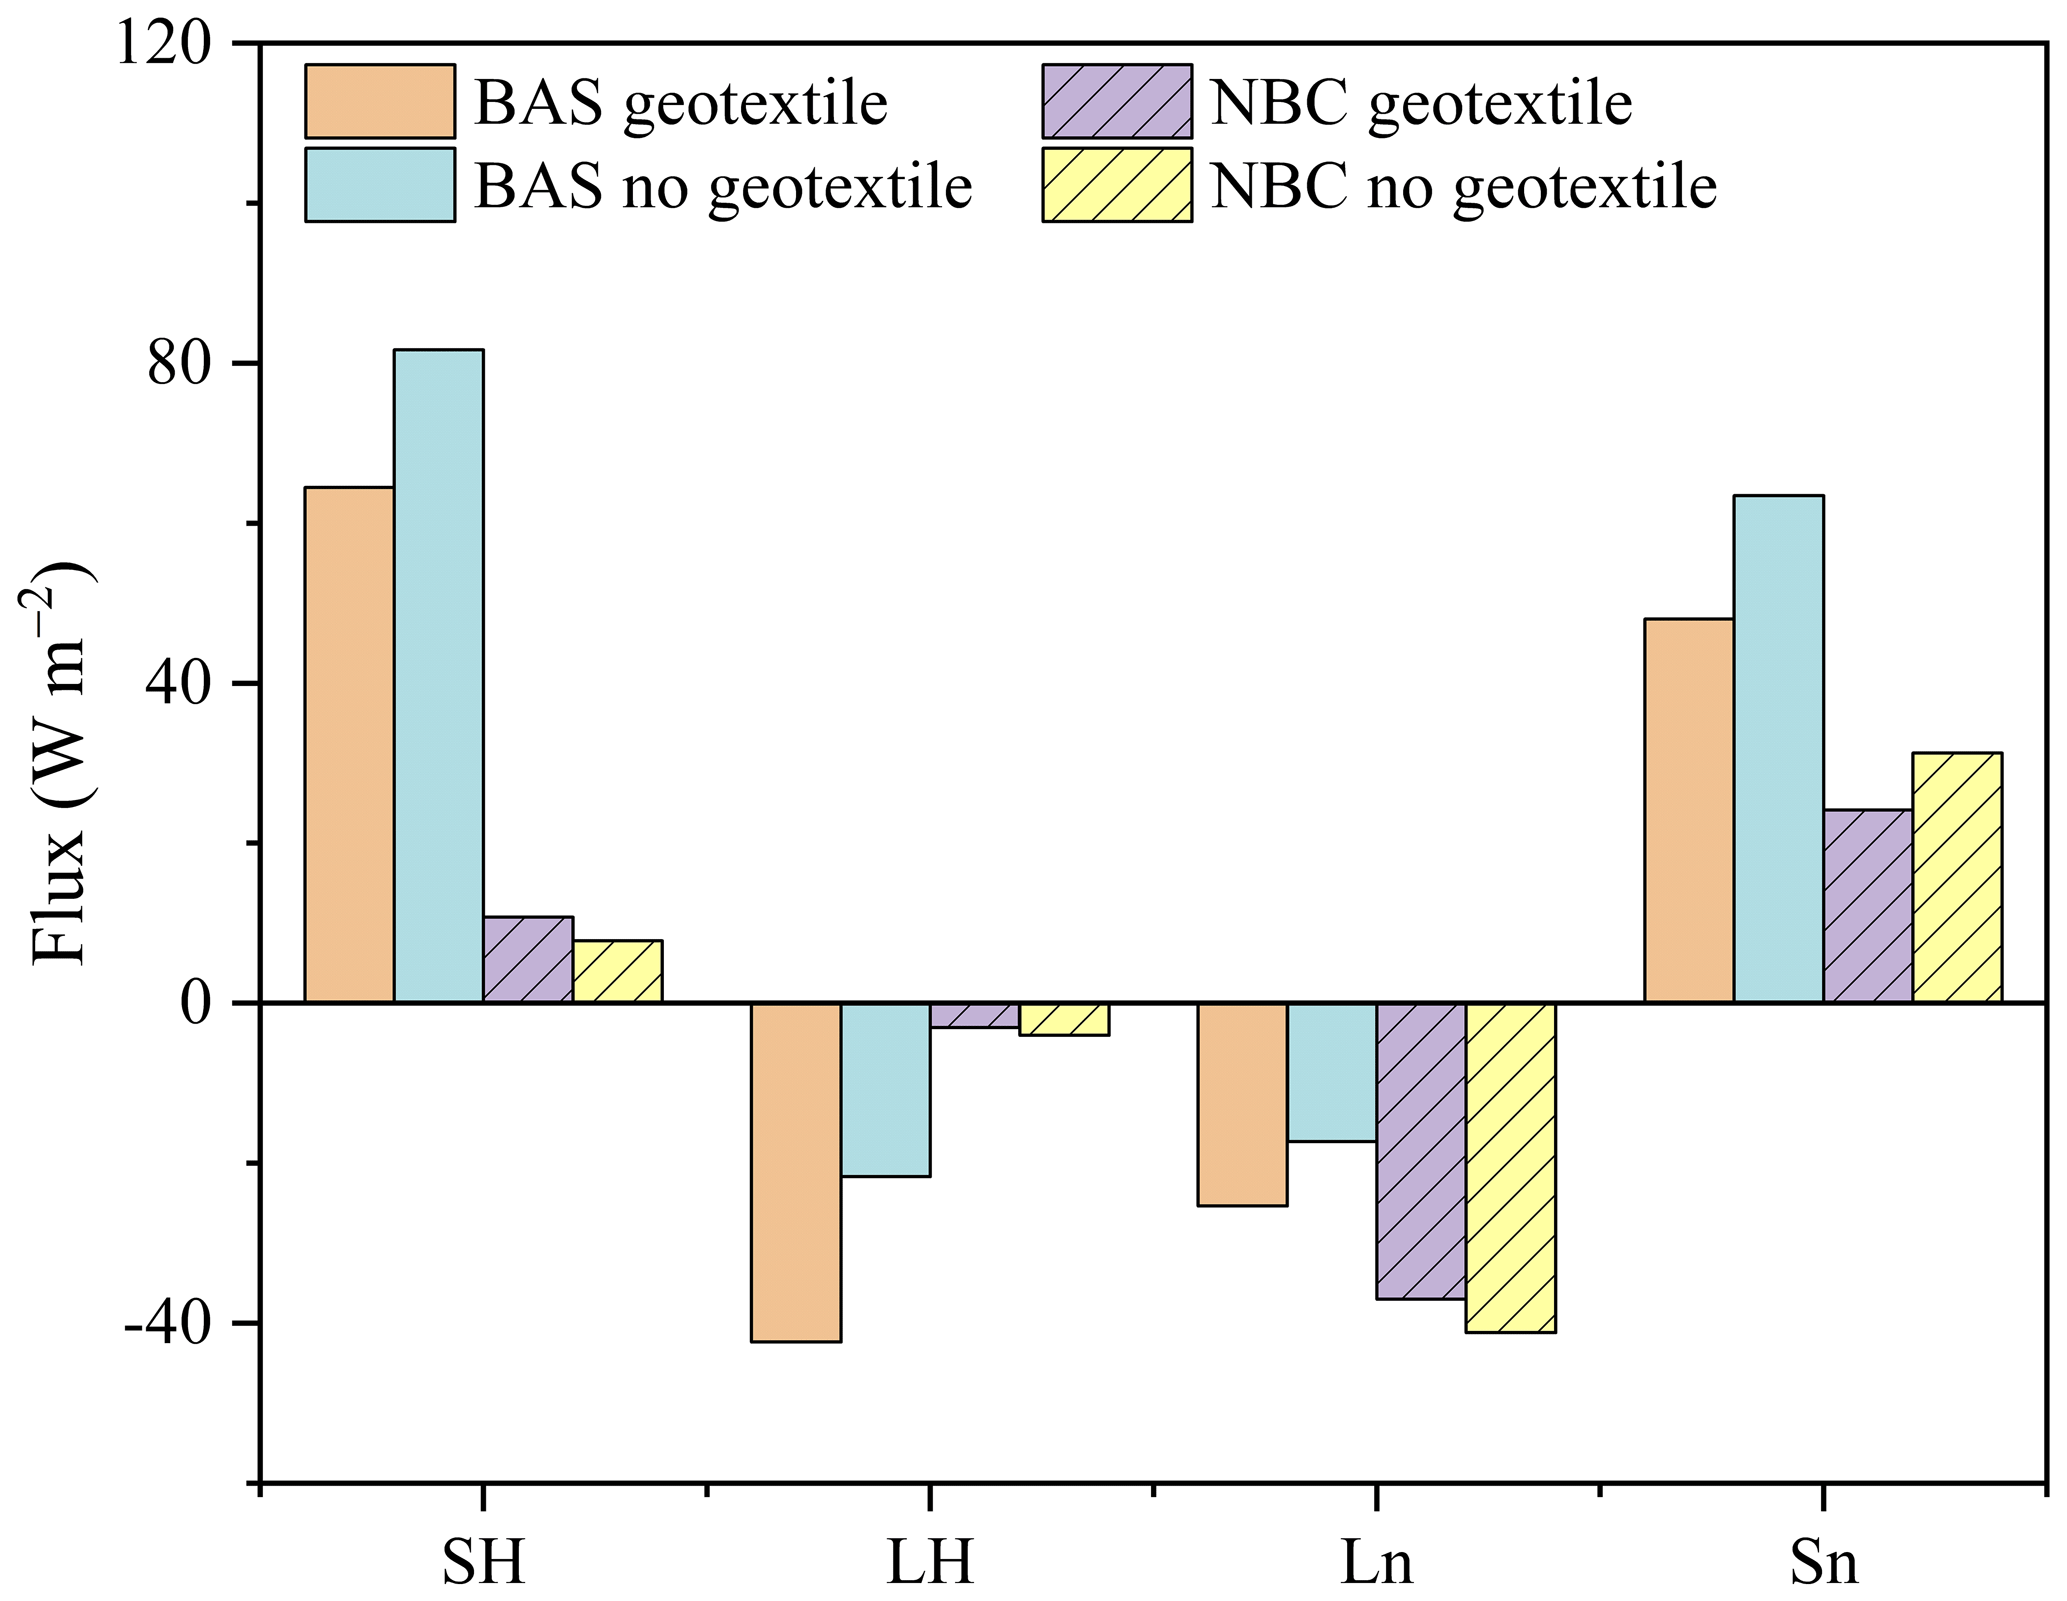
Figure 9Important energy balance components for covered and uncovered conditions at BAS between 17 January and 27 April 2022 and the NBC between 22 January and 4 March 2022. SH stands for sensible heat, LH for latent heat, Ln for net longwave radiation, and Sn for net shortwave radiation.
4.6 Snow storage over the summer season in the Beijing and Chongli regions
Short-term snow storage is rarely employed in ski resort management strategies, while preserving snow over the summer season is a critical practice for ski resorts (Grünewald et al., 2018; Ter-Zakaryan et al., 2019; Weiss et al., 2019). Considering the numerous ski resorts and venues in the Beijing and Chongli regions, it is imperative to investigate the evolution of snow piles over the summer season in these areas. The primary meteorological data for this investigation were obtained from the Mentougou and Chongli national meteorological stations between January and October 2021. To ensure environmental friendliness and ease of shaping, natural thermal insulation materials were considered, with straw being a preferred choice due to its reliable thermal insulation performance and easy availability in northern China. For practical and cost-effectiveness reasons, a combination of two layers of thermal insulation materials was used, consisting of geotextile to reflect incoming shortwave radiation and straw chips. Additionally, sawdust was included to examine differences in comparison to straw chips. It is worth noting that, in terms of density, straw chips and sawdust are larger than traditional foam insulation materials (Wang et al., 2021), resulting in their higher thermal storage capacity.
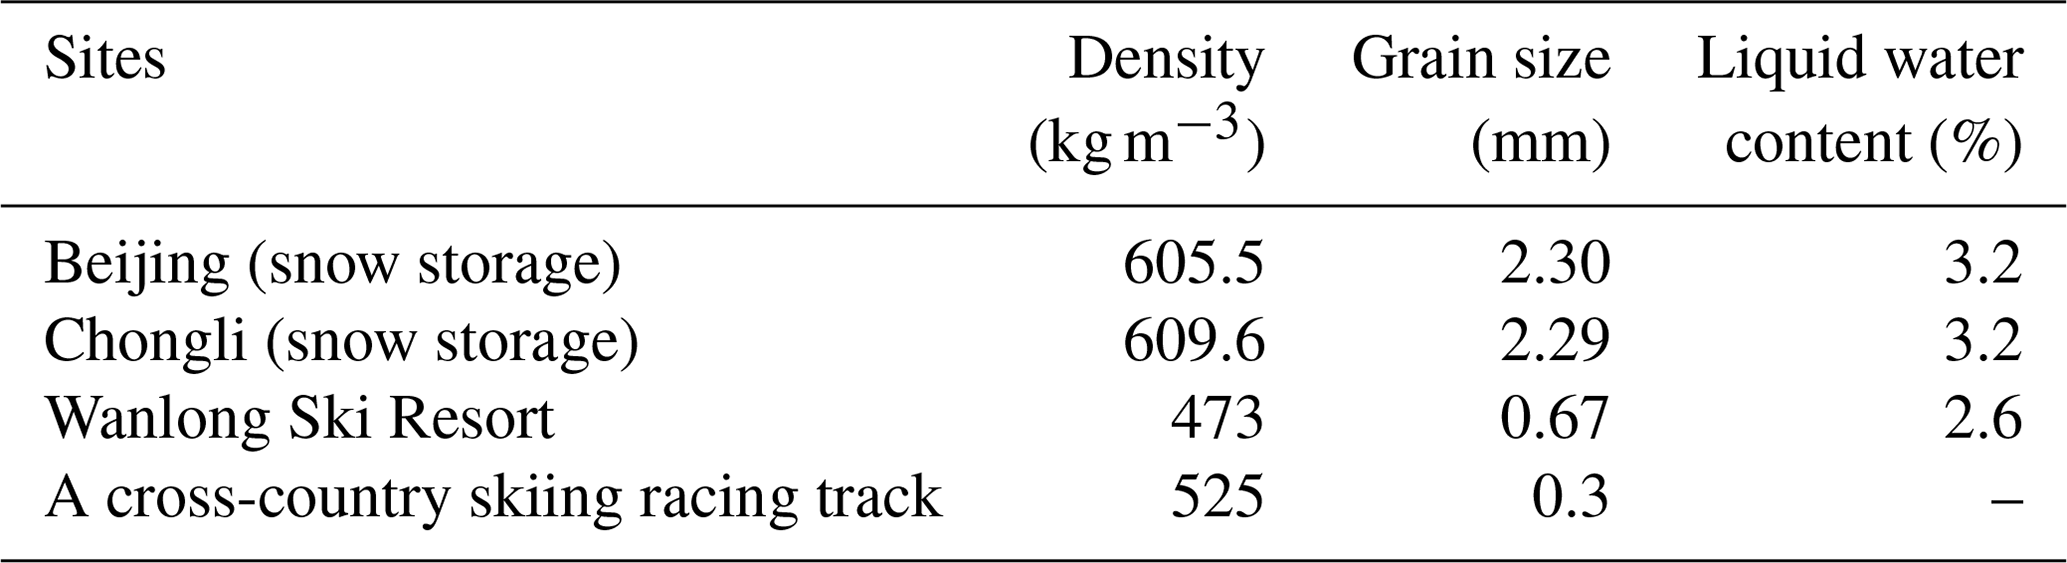
In the SNOWPACK settings, we determined an initial height of 7 m, a snowpack temperature of 0 °C, and densities following the snow pile at BAS. Figure 10 illustrates the modeled top snow pile height variations with different thicknesses in Beijing and Chongli from 1 January and 31 October 2021. Considering the thin geotextile layer (0.004 m), the second layer thickness is considered to be the overall cover layer thickness. To maintain at least half of the snow pile height over the summer season in Beijing, a minimum cover layer thickness of 0.7 m was required, while in Chongli, this value was 0.4 m. Apart from ablation, snow properties, including density, grain size, and liquid water content, are crucial for ski industry applications. The results show minor variations in snow properties over the summer season between cover layer thicknesses of 0.7 to 1.1 m in Beijing and 0.4 to 1.1 m in Chongli. The mean snow densities, grain sizes, and liquid water contents for snow storage were higher than those of the ski track surface layers (Table 2), indicating that the stored snow can be used for the bottom and the middle layers of the ski track. Generally, as the cover layer thickness increased, the increase in snow pile height became less significant. Moreover, as the cover layer thickness increased, the snow pile height curves in two places kept getting closer, indicating that the large thickness contributes to snow pile height being incredibly insensitive to meteorological conditions. The above phenomena can be explained from a heat transfer perspective (Wang et al., 2021; Grünewald et al., 2018). The remaining snow pile height with a sawdust cover was slightly higher than that of a straw chip cover.
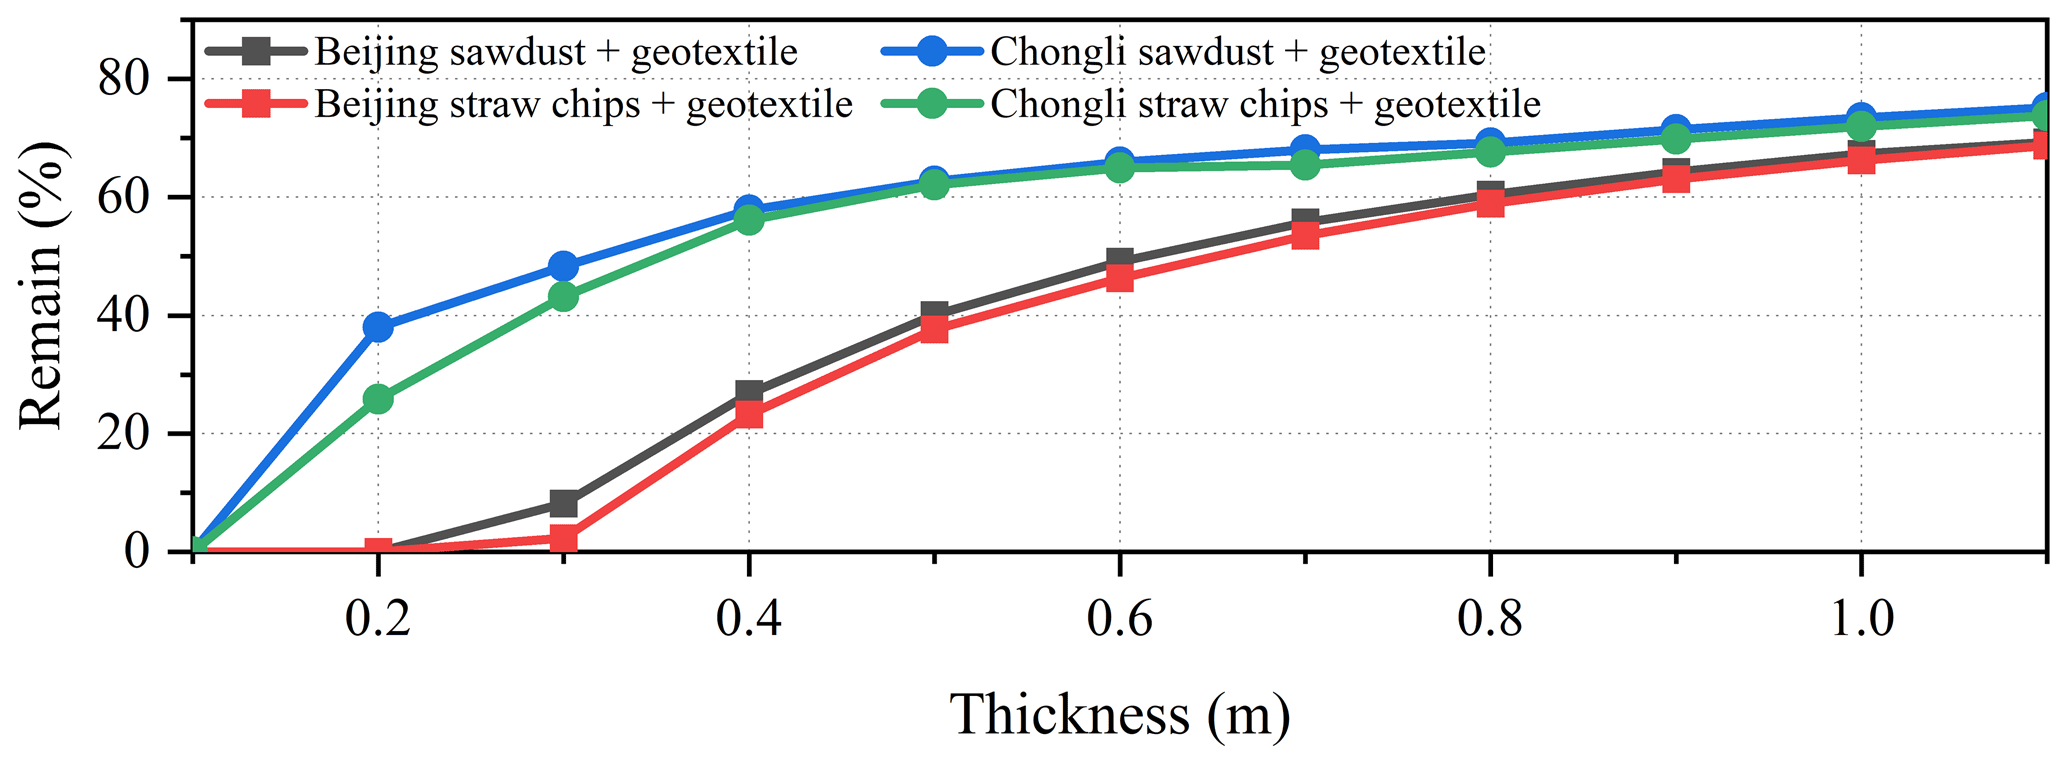
Figure 10The modeled remaining snow pile height varies with different cover thickness at Beijing and Chongli between January and October 2021. Cover layer: sawdust overlain by geotextile (a reflective layer) or straw chips overlain by geotextile (a reflective layer).
Table 2Modeled snow properties for snow storage over the summer season on 31 October 2021 and measured snow properties at the Wanlong Ski Resort, China (density and liquid water content were measured by a snow fork instrument for 0.2 m below a track surface; grain size was measured by the Anyty 3R-V500IR/UV series optical microscope for 0.7 m below a track surface), and a cross-country skiing racing track, Canada (Wagner and Horel, 2011).
5.1 Evaluations of snow storage sensitivity to the main meteorological conditions, cover layer parameters, and snow pile initial conditions
To examine how snow pile height responds to key meteorological conditions, we input various scenarios into the model based on measurements at BAS from 17 January to 27 March. The results reveal that the snow pile height was most sensitive to air temperature (Fig. 11a), which is expected due to the limitations of geotextile thickness (thickness = 0.004 m). Geotextile is an insulation material with excellent thermal parameters, superior to sawdust (thickness = 0.3–0.8 m), which is commonly applied in snow storage (Grünewald et al., 2018; Lintzén and Knutsson, 2018). Thickness is a vital parameter for heat transfer, and thus it affects the heat resistance, thermal storage capacity, time lag, and decrement factor of the cover layer (Ozel, 2013; Wang et al., 2021). However, very high thicknesses, in the range of tens of centimeters, are impractical for geotextile due to construction and cost limitations. These limitations prevent geotextile from adapting effectively to snow storage under higher air temperatures. Wind speed and incoming shortwave radiation had less impact on snow pile height (Fig. 11b and c). The high shortwave radiation reflectivity of geotextile reduces its sensitivity to incoming shortwave radiation. The increased precipitation slightly changed the snow pile height (Fig. 11d). During the modeling period, solid precipitation constituted 70 % of the total precipitation, which interacted with the geotextile surface through heat exchange, melting, evaporation, and sublimation for cooling. However, even when the model was run with 15 times the measured precipitation (380 mm) to exclude the low sensitivity caused by low measured precipitation, the reduction in ablation was minimal, with an increase of only 15 cm in snow pile height.
The cover layer parameters play a crucial role in the model performance, some of which can be obtained from the literature rather than direct measurements (Lintzén and Knutsson, 2018). In order to explore the impact of cover layer parameters, we selected thermal conductivity, specific heat capacity, reflectivity, and thickness as variable parameters in the model. The results demonstrate that the thermal parameters of the geotextile contributed minimally to ablation mitigation. In contrast, geotextile reflectivity proved critical (Fig. 11e), where a reflectivity of 0.9 decreased ablation by 21 %, while a reflectivity of 0.4 increased it by 35 %. This underscores the importance of precise settings for geotextile reflectivity in the model. With a configuration of 18 geotextile layers (total thickness = 0.072 m), ablation was reduced by 12 % (Fig. 11f). However, this effect is insignificant compared to the construction difficulty. The 0.4 m thick geotextile layer, the main sawdust thickness in snow storage, reduced ablation significantly by 78 %.
Snow pile initial conditions also affect the ablation, and these variations are attributed to grooming practices and local meteorological conditions. Figure 11g and h demonstrate that the snow pile height increased with density, while it decreased with liquid water content. In the density sensitivity experiments, the liquid water content and grain size were kept constant; that is, the density changed the volume fractions of ice and air. Conversely, in the liquid water content experiments, the density remained constant, but the volume fractions of water, air, and ice varied. These results indicate the positive impact of grooming practices on snow storage.
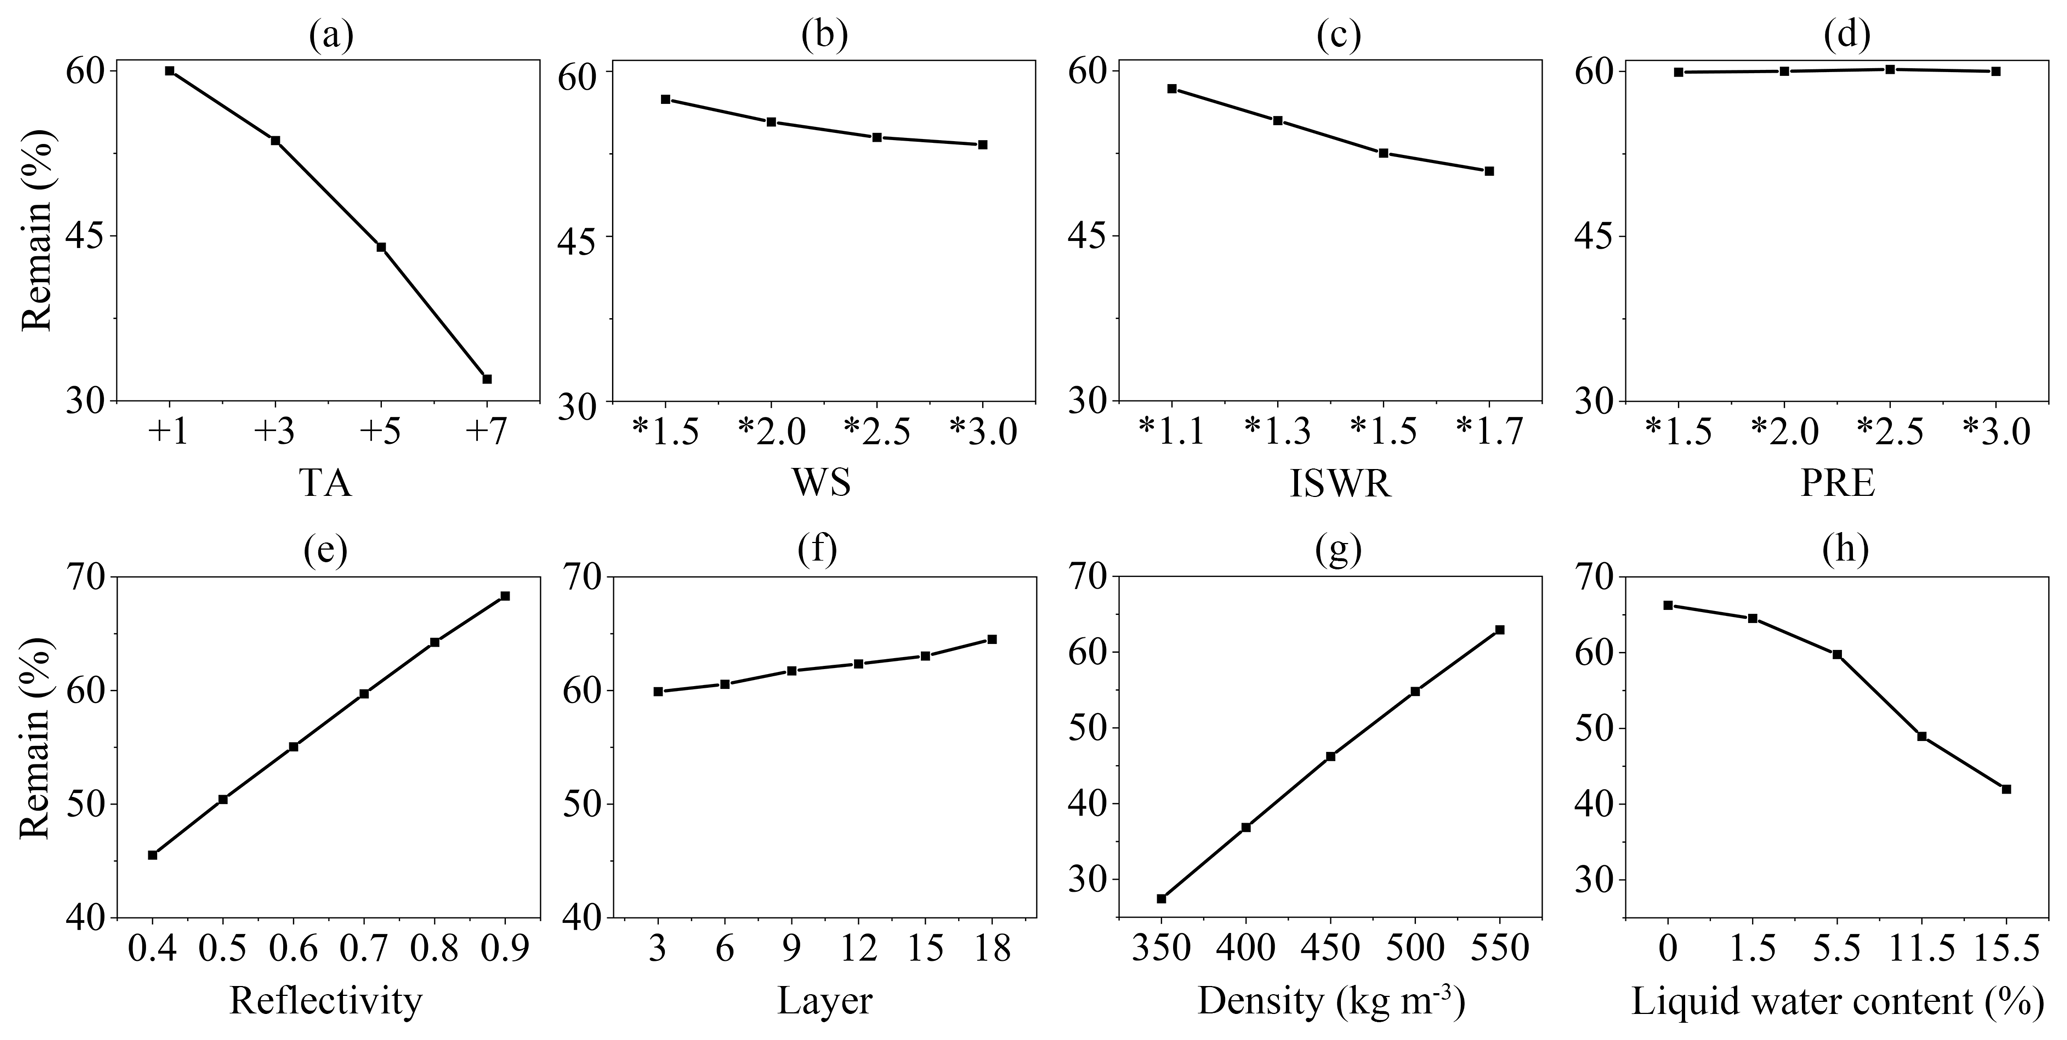
Figure 11Model sensitivity to the main meteorological conditions, cover layer parameters, and snow pile initial conditions. (a) Air temperature. (b) Wind speed. (c) Incoming shortwave radiation. (d) Precipitation. (e) Reflectivity. (f) The number of cover layers. (g) Snow density. (h) Snow liquid water content, corresponding to a general classification (Fierz et al., 2009).
5.2 SNOWPACK model and limitations
The model result showed a good agreement with the measured snow pile height on 15 April 2022 yet showed inconsistent deviations across three validation periods between 16 January and 15 April, with the final period tending to overestimate the snow pile height drop. Interestingly, the external geotextile temperatures above 0 °C were generally underestimated, and the mean temperature was also underestimated for the final period (mean modeled top external geotextile surface temperature = 3.2 °C, mean measured top geotextile–snow interface temperature = 4.1 °C). This indicates that the overestimation of the snow pile height drop is due to varying deviations in estimating multiple physical sub-processes driving snow ablation.
Simulations were not conducted for the snow pile sides for various reasons. Firstly, the lateral variations and the influence of radiation and wind make it challenging to obtain accurate boundary conditions on the snow pile sides (Grünewald et al., 2018). Additionally, the lack of uniformity between the geotextile and snow surface, due to, for example, air layers and overlaps, further complicates the boundary conditions, making it difficult to quantify these factors with high resolution at the snow pile sides. In a snow storage simulation study, it is difficult to obtain high-resolution boundary conditions on a snow pile scale. Moreover, we decided not to explore other snow cover models in snow storage because of this considerable extra effort and because we wanted to focus on the analysis and evaluation of snow pile evolution and test the SNOWPACK model performance in mid-latitude and low-altitude regions, with the aim of providing a tool for feasibility analysis in China.
Naturally, snow properties are a crucial consideration, especially in major winter sports events, encompassing factors like grain size, density, and liquid water content. However, conducting manual snow profiles to assess snow properties requires disturbing the snow piles, leading to a reduction in stored snow and an acceleration of ablation. Finding alternative methods to assess snow properties without damaging the snow piles would be beneficial.
This study investigated snow storage cases for the Beijing 2022 Winter Olympic Games and Paralympic Games, with a particular emphasis on two key aspects: ablation and snow properties. The 1-D SNOWPACK model was first evaluated for snow storage covered with geotextile in the mid-latitude and low-altitude regions. Meteorological data were obtained from automatic stations near the snow storage sites and national meteorological stations, while the geometry and thermal regime of the snow piles were obtained through terrestrial laser scanning surveys and thermal sensors, respectively.
The study draws several important conclusions regarding snow storage in China: (a) a significant loss of 1242.9 m3 of snow volume (52.7 % of the initial volume) occurred between 16 January and 15 April at BAS. The geotextile effectively protected the snow pile during Pre-WOcd and WOcd at BAS. However, beyond February, using geotextile alone for snow storage proved unfeasible due to substantial losses. (b) The SNOWPACK model demonstrated its capability to accurately reproduce the snow pile evolution in mid-latitude and low-altitude regions of China. While there was a slight underestimation (7 %) in the top snow pile height drop at BAS, the model exhibited excellent agreement with the measured snow pile height, especially considering the sensitivity to deviations of a thin geotextile layer. (c) There were minimal variations in the liquid water contents and densities of the snow layers at BAS and the NBC, except for in the upper parts of the snow piles. (d) The evaporation at the geotextile surface played a significant role in protecting the snow pile. Consequently, impermeable coverage schemes for snow storage are not recommended. (e) The study revealed that 0.4 m thick cover layers could protect half of the snow pile height in Chongli between January and October 2022, while in Beijing, the required thickness increased to 0.7 m. The evolution of snow properties over the summer, with different thicknesses and sites, exhibited consistent patterns.
While large-scale snow storage requires substantial investment and determination, the specific quantitative economic effects of snow storage remain unknown. In future studies, it would be beneficial to consider factors such as transportation, thermal insulation materials, human resources, construction machinery, snowmaking, and ski resort income when assessing the economic impacts of snow storage. Additionally, further research on the snow pile sides could provide valuable insights. Given the importance of snow reliability for ski resorts in southern China, characterized by short snowmaking hours and high wet-bulb temperatures, further study could explore short-term snow storage for this region.
All raw data can be provided by the corresponding author upon request.
The supplement related to this article is available online at: https://doi.org/10.5194/tc-18-3017-2024-supplement.
DQ, FW, and JR conceived the idea and contributed to the overall framing of the study. XW wrote the manuscript and collected, processed, and analyzed data. HL contributed to the implementation of the model. JR and FW revised the manuscript. All authors discussed the results and contributed to editing the manuscript.
The contact author has declared that none of the authors has any competing interests.
Publisher’s note: Copernicus Publications remains neutral with regard to jurisdictional claims made in the text, published maps, institutional affiliations, or any other geographical representation in this paper. While Copernicus Publications makes every effort to include appropriate place names, the final responsibility lies with the authors.
We want to thank our editor, Carrie Vuyovich, and our reviewers. The authors acknowledge the support work of Chunhai Xu, Fanglong Wang, Jiazhen Huang, Jianxin Mou, Xiaoying Yue, and Xin Zhang from the Key Laboratory of Cryospheric Science and Frozen Soil Engineering. Importantly, we thank Mathias Bavay from the WSL Institute for Snow and Avalanche Research SLF for SNOWPACK model guidance.
This research has been supported by the Science and Technology program of Gansu Province (grant nos. 23ZDFA017 and 22ZD6FA005), the National Key R&D Program of China (grant no. 2020YFF0304400), the Third Comprehensive Scientific Expedition of Xinjiang Uyghur Autonomous Region (grant no. 2022xjkk0802), and the State Key Laboratory of Cryospheric Science (grant no. SKLCS-ZZ-2022).
This paper was edited by Carrie Vuyovich and reviewed by two anonymous referees.
An, H., Xiao, C., and Ding, M.: The spatial pattern of ski areas and its driving factors in China: a strategy for healthy development of the ski industry, Sustainability-Basel, 11, 3138, https://doi.org/10.3390/su11113138, 2019.
Bartelt, P. and Lehning, M.: A physical SNOWPACK model for the Swiss avalanche warning: Part I: numerical model, Cold Reg. Sci. Technol., 35, 123–145, https://doi.org/10.1016/S0165-232X(02)00074-5, 2002.
Bavay, M. and Egger, T.: MeteoIO 2.4.2: a preprocessing library for meteorological data, Geosci. Model Dev., 7, 3135–3151, https://doi.org/10.5194/gmd-7-3135-2014, 2014.
Colbeck, S.: A theory of water percolation in snow, J. Glaciol., 11, 369–385, https://doi.org/10.3189/S0022143000022346, 1972.
Colbeck, S. C.: An overview of seasonal snow metamorphism, Rev. Geophys., 20, 45–61, https://doi.org/10.1029/RG020i001p00045, 1982.
Demiroglu, O. C., Turp, M. T., Ozturk, T., and Kurnaz, M. L.: Impact of climate change on natural snow reliability, snowmaking capacities, and wind conditions of ski resorts in Northeast Turkey: A dynamical downscaling approach, Atmosphere-Basel, 7, 52, https://doi.org/10.3390/atmos7040052, 2016.
Fierz, C., Armstrong, R. L., Durand, Y., Etchevers, P., Greene, E., McClung, D. M., Nishimura, K., Satyawali, P. K., and Sokratov, S. A.: The international classification for seasonal snow on the ground, UNESCO-IHP, Paris, France, https://unesdoc.unesco.org/ark:/48223/pf0000186462 (last access: 27 June 2024), 2009.
Grünewald, T., Wolfsperger, F., and Lehning, M.: Snow farming: conserving snow over the summer season, The Cryosphere, 12, 385–400, https://doi.org/10.5194/tc-12-385-2018, 2018.
Hamada, Y., Nakamura, M., and Kubota, H.: Field measurements and analyses for a hybrid system for snow storage/melting and air conditioning by using renewable energy, Appl. Energ., 84, 117–134, https://doi.org/10.1016/j.apenergy.2006.07.002, 2007.
Hamada, Y., Nagata, T., Kubota, H., Ono, T., and Hashimoto, Y.: Study on a snow storage system in a renovated space, Renew. Energ., 41, 401–406, https://doi.org/10.1016/j.renene.2011.11.012, 2012.
Horton, S. and Haegeli, P.: Using snow depth observations to provide insight into the quality of snowpack simulations for regional-scale avalanche forecasting, The Cryosphere, 16, 3393–3411, https://doi.org/10.5194/tc-16-3393-2022, 2022.
Keenan, E., Wever, N., Dattler, M., Lenaerts, J. T. M., Medley, B., Kuipers Munneke, P., and Reijmer, C.: Physics-based SNOWPACK model improves representation of near-surface Antarctic snow and firn density, The Cryosphere, 15, 1065–1085, https://doi.org/10.5194/tc-15-1065-2021, 2021.
Kumar, V., Hewage, K., Haider, H., and Sadiq, R.: Techno-economic performance evaluation of building cooling systems: A study of snow storage and conventional chiller systems, Cold Reg. Sci. Technol., 130, 8–20, https://doi.org/10.1016/j.coldregions.2016.07.004, 2016.
Lintzén, N.: Snow storage in Piteå 2012, Luleå tekniska universitet, Luleå, https://www.diva-portal.org/smash/get/diva2:997675/FULLTEXT01.pdf (last access: 27 June 2024), 2012.
Lintzén, N. and Knutsson, S.: Snow storage–Modelling, theory and some new research, Cold Reg. Sci. Technol., 153, 45–54, https://doi.org/10.1016/j.coldregions.2018.04.015, 2018.
Luetschg, M., Lehning, M., and Haeberli, W.: A sensitivity study of factors influencing warm/thin permafrost in the Swiss Alps, J. Glaciol., 54, 696–704, https://doi.org/10.3189/002214308786570881, 2008.
Moe, J. M.: Using stored snow as cooling at Oslo Airport, Norway, Proceedings of the Institution of Civil Engineers – Civil Engineering, 171, 11–16, https://doi.org/10.1680/jcien.17.00041, 2018.
Olefs, M. and Fischer, A.: Comparative study of technical measures to reduce snow and ice ablation in Alpine glacier ski resorts, Cold Reg. Sci. Technol., 52, 371–384, https://doi.org/10.1016/j.coldregions.2007.04.021, 2008.
Olefs, M. and Lehning, M.: Textile protection of snow and ice: Measured and simulated effects on the energy and mass balance, Cold Reg. Sci. Technol., 62, 126–141, https://doi.org/10.1016/j.coldregions.2010.03.011, 2010.
Olefs, M., Fischer, A., and Lang, J.: Boundary Conditions for Artificial Snow Production in the Austrian Alps, J. Appl. Meteorol. Clim., 49, 1096–1113, https://doi.org/10.1175/2010JAMC2251.1, 2010.
Ozel, M.: Determination of optimum insulation thickness based on cooling transmission load for building walls in a hot climate, Energ. Convers. Manage., 66, 106–114, https://doi.org/10.1016/j.enconman.2012.10.002, 2013.
Pestereva, N. M.: Modern engineering technology to adapt to the adverse weather and climatic conditions at mountain ski resorts, Life Sci. J., 11, 800–804, 2014.
RIEGL Laser Measurement Systems: Operating & Processing Software RISCAN PRO for Riegl 3D Laser Scanners, http://www.riegl.com/uploads/tx_pxpriegldownloads/RiSCAN-PRO_DataSheet_2022-10-07.pdf (last access: 27 June 2024), 2022.
Rinderer, T.: Snowfarming–Experimenteller Vergleich und numerische Modellierung zweier Isoliermethoden zur Konservierung von Schnee, Thesis, Ludwig Maximilians-Universität München, München, Germany, 2009.
Rutty, M., Scott, D., Johnson, P., Pons, M., Steiger, R., and Vilella, M.: Using ski industry response to climatic variability to assess climate change risk: An analogue study in Eastern Canada, Tourism Manage., 58, 196–204, https://doi.org/10.1016/j.tourman.2016.10.020, 2017.
Skogsberg, K. and Nordell, B.: The Sundsvall hospital snow storage, Cold Reg. Sci. Technol., 32, 63–70, https://doi.org/10.1016/S0165-232X(00)00021-5, 2001.
Skogsberg, K. and Nordell, B.: Snow cooling in Sweden, International Conference on Thermal Energy Storage 2006, New Jersey, America, http://ltu.diva-portal.org/smash/record.jsf?pid=diva2%3A1001819&dswid=-3600 (last access: 27 June 2024), 2006.
Spandre, P., François, H., Thibert, E., Morin, S., and George-Marcelpoil, E.: Determination of snowmaking efficiency on a ski slope from observations and modelling of snowmaking events and seasonal snow accumulation, The Cryosphere, 11, 891–909, https://doi.org/10.5194/tc-11-891-2017, 2017.
Steiger, R. and Scott, D.: Ski tourism in a warmer world: Increased adaptation and regional economic impacts in Austria, Tourism Manage., 77, 104032, https://doi.org/10.1016/j.tourman.2019.104032, 2020.
Ter-Zakaryan, K., Grigoryan, A., Medvedev, A., Efimov, B., and Poserenin, A.: Snow insulation and conservation systems, Construction and Architecture: Theory and Practice for the innovation Development, Kislovodsk, Russia, 1–5 October 2019, 01038, https://doi.org/10.1051/e3sconf/201913801038, 2019.
Wagner, W. and Horel, J.: Observations and simulations of snow surface temperature on cross-country ski racing courses, Cold Reg. Sci. Technol., 66, 1–11, https://doi.org/10.1016/j.coldregions.2010.12.003, 2011.
Wang, X., Qin, D. H., Ren, J. W., and Wang, F. T.: Numerical estimation of thermal insulation performance of different coverage schemes at three places for snow storage, Advances in Climate Change Research, 12, 903–912, https://doi.org/10.1016/j.accre.2021.10.003, 2021.
Weiss, H. S., Bierman, P. R., Dubief, Y., and Hamshaw, S. D.: Optimization of over-summer snow storage at midlatitudes and low elevation, The Cryosphere, 13, 3367–3382, https://doi.org/10.5194/tc-13-3367-2019, 2019.
Wever, N., Schmid, L., Heilig, A., Eisen, O., Fierz, C., and Lehning, M.: Verification of the multi-layer SNOWPACK model with different water transport schemes, The Cryosphere, 9, 2271–2293, https://doi.org/10.5194/tc-9-2271-2015, 2015.
Willibald, F., Kotlarski, S., Ebner, P. P., Bavay, M., Marty, C., Trentini, F. V., Ludwig, R., and Grêt-Regamey, A.: Vulnerability of ski tourism towards internal climate variability and climate change in the Swiss Alps, Sci. Total Environ., 784, 147054, https://doi.org/10.1016/j.scitotenv.2021.147054, 2021.
- Abstract
- Introduction
- Study sites and snow storage for the Beijing 2022 Winter Olympic Games and Paralympic Games
- Data and methods
- Results
- Discussion
- Conclusions and perspectives
- Data availability
- Author contributions
- Competing interests
- Disclaimer
- Acknowledgements
- Financial support
- Review statement
- References
- Supplement