the Creative Commons Attribution 4.0 License.
the Creative Commons Attribution 4.0 License.
 | 11 Jun 2024
Review article: Melt-affected ice cores for polar research in a warming world
Elizabeth R. Thomas
Christoph Nehrbass-Ahles
Anja Eichler
Eric Wolff
Melting polar and alpine ice sheets in response to global warming pose ecological and societal risks but will also hamper our ability to reconstruct past climate and atmospheric composition across the globe. Since polar ice caps are crucial environmental archives but highly sensitive to ongoing climate warming, the Arctic and Antarctic research community is increasingly faced with melt-affected ice cores, which are already common in alpine settings of the lower latitudes.
Here, we review the characteristics and effects of near-surface melting on ice-core records, focusing on a polar readership and making recommendations for melt-prone study regions. This review first covers melt layer formation, identification and quantification of melt, and structural characteristics of melt features. Subsequently, it discusses effects of melting on records of chemical impurities, i.e. major ions, trace elements, black carbon, and organic species as well as stable water isotopic signatures, gas records, and applications of melt layers as environmental proxies.
Melting occurs during positive surface energy balance events, which are shaped by global to local meteorological forcing, regional orography, glacier surface conditions and subsurface characteristics. Meltwater flow ranges from homogeneous wetting to spatially heterogeneous preferential flow paths and is determined by temperature, thermal conductivity and stratigraphy of the snowpack. Melt layers and lenses are the most common consequent features in ice cores and are usually recorded manually or using line scanning. Chemical ice-core proxy records of water-soluble species are generally less preserved than insoluble particles such as black carbon or mineral dust due to their strong elution behaviour during percolation. However, high solubility in ice as observed for ions like F−, Cl−, NH or ultra-trace elements can counteract the high mobility of these species due to burial in the ice interior. Stable water isotope records like δ18O are often preserved but appear smoothed if significant amounts of meltwater are involved. Melt-affected ice cores are further faced with questions about the permeability of the firn column for gas movement, and gas concentrations can be increased through dissolution and in situ production. Noble gas ratios can be useful tools for identifying melt-affected profile sections in deep ice. Despite challenges for ice-core climate reconstruction based on chemical records, melt layers are a proxy of warm temperatures above freezing, which is most sensitive in the dry snow and percolation zone.
Bringing together insights from snow physics, firn hydrology, and ice-core proxy research, we aim to foster a more comprehensive understanding of ice cores as climate and environmental archives, provide a reference on how to approach melt-affected records, and raise awareness of the limitations and potential of melt layers in ice cores.
- Article
(7616 KB) - Full-text XML
-
Supplement
(288 KB) - BibTeX
- EndNote


Polar ice cores are widely recognised for their ability to archive past climates on local to global and sub-annual to multi-millennial scales (EPICA Community Members, 2004; WAIS Divide Project Members, 2013; NEEM community members, 2013). Beyond the polar regions, ice cores from alpine glaciers, ice fields or lower-elevation coastal domes and islands (Porter et al., 2021; Winski et al., 2018; Thomas et al., 2021; Fritzsche et al., 2005) provide an opportunity to reconstruct more local and regional climatic change. Rising global temperatures (IPCC, 2021) and accelerated melting of the most vulnerable parts of the cryosphere (IPCC, 2019) cause glaciers across the globe to shrink, thereby hampering our ability to reconstruct past climate from ice cores across the globe.
On the snow surface of a glacier, melting and refreezing leave an imprint on the snowpack, i.e. typically centimetre-thick, bubble-free melt lenses and layers with fuzzy edges (Fig. 1). Wind abrasion, deposition hiatus, and other factors, which are still under discussion, can also lead to distinct, millimetre-thick, high-density bubble-free layers like wind crusts and glaze that are structurally similar to melt layers (Fegyveresi et al., 2018; Frezzotti et al., 2002; Orsi et al., 2015; Weinhart et al., 2021; Zhang et al., 2023), but water is absent during the formation process. Presence and impact of the water phase are what makes melt a major constraint for the selection of ice-core drilling sites. While melting is rare and related alterations of climate indicators are still of little concern to some researchers working on ice cores from central Antarctica, key climate proxy records like δ18O have already been obliterated through melting in numerous low-latitude high-altitude glaciers (Thompson et al., 2021) and are gradually deteriorating at (sub-)polar sites like Svalbard (Spolaor et al., 2024). Unlike the original climate signatures preserved under dry conditions, palaeoclimate reconstructions based on ice cores from melt-affected drilling sites require caution and have been hampered by insufficient knowledge about the effects of melting on ice-core proxy records and how to correct for them in the past. In recent decades, alpine ice-core scientists faced with this issue regularly have made significant advances regarding the interpretation of melt-affected ice-core records (Avak et al., 2018). Improvements have also been made on the wider subject of snowmelt with interdisciplinary methodical approaches ranging from detection with remote sensing (Alimasi et al., 2020; Dell et al., 2021; Bell et al., 2017) to field-based snow pits (Moran and Marshall, 2009; Spolaor et al., 2021; Avak et al., 2019), firn sintering and elution experiments (Cragin et al., 1996; Trachsel et al., 2019), modelling (Hu et al., 2021), and ice-core studies (Orsi et al., 2015; Avak et al., 2018; Vega et al., 2016). However, among polar ice-core scientists, there is still only limited agreement about the informational value of melt-affected ice cores. On the one hand, chemical records of refrozen melt layers are often considered lost or altered and likely to lead to misinterpretations of proxy records (Koerner, 1997). On the other hand, these structural features have been used as proxies for warm summer temperatures in multiple studies from the Arctic and Antarctic (Das and Alley, 2008; Koerner and Fisher, 1990; Abram et al., 2013).
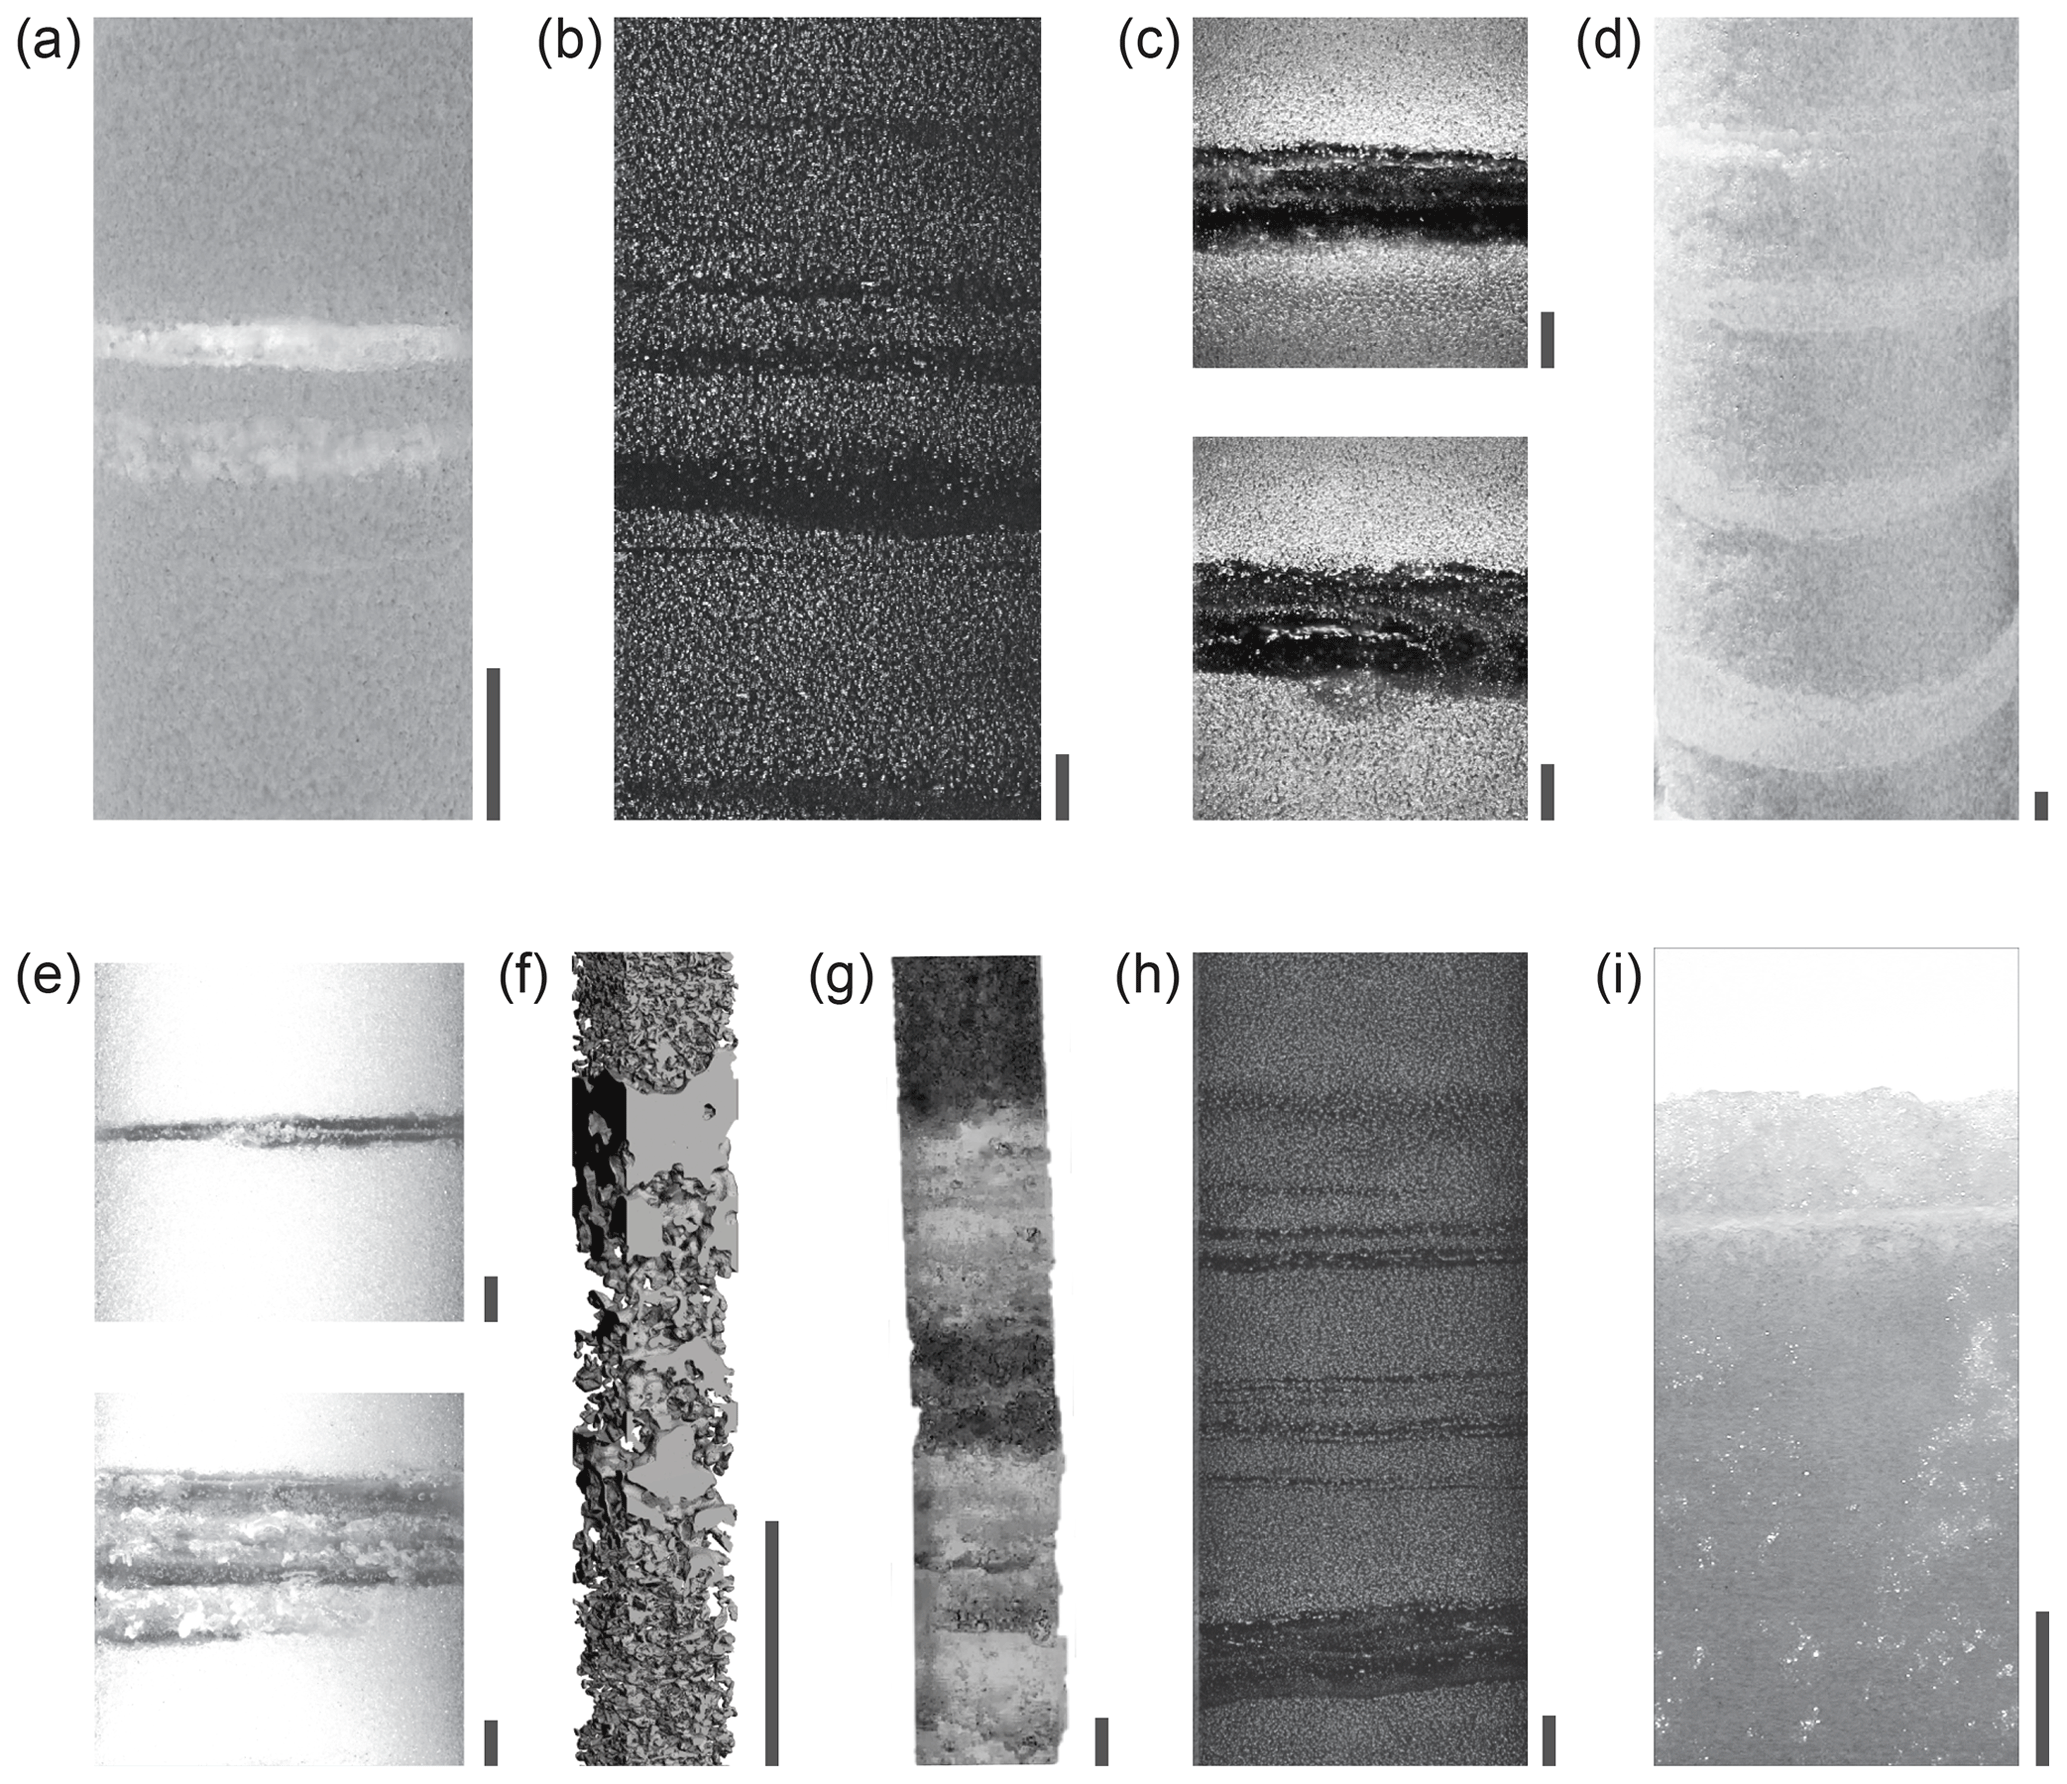
Figure 1Examples of melt layers reported in snow and ice profiles from around the world using various techniques. The grey scale bar at the bottom right of each panel equals 1 cm, and the top of each snow, firn, or ice section is at the top of each panel: (a) two melt layers, 4–6 mm thick, from the NEEM Greenland ice core at ∼ 44.3 m depth (digital photo, credit Kaitlin Keegan, Orsi et al., 2015); (b) sequence of melt layers ranging from 3 to 13 mm at EastGRIP, Greenland ice core, at ∼ 138.04 m depth (line scan image, Westhoff et al., 2022, CC-BY 4.0); (c) two distinct melt layers ∼ 15–20 mm thick at RECAP, Renland Ice Cap, at 78.1–79.2 m depth (line scan image, Taranczewski et al., 2019); (d) four ∼ 20–35 mm melt layers at 0.3–0.5 m depth in an ice core from the Agassiz Ice Cap, Canada (digital photo, credit James Zheng, Fisher et al., 2012, reproduced with permission from Elsevier); (e) varying appearances of 3–7 and 25–41 mm melt layers in an ice core from Mount Hunter, Alaska (digital photo, Winski et al., 2018); (f) ∼ 15–20 mm melt at ∼ 0.04 m depth in surface snowpack from Davos, Swiss Alps (3D X-ray tomography scan, Heggli et al., 2011); (g) segment at ∼ 3 m depth from the Young Island ice core with melt >45 mm thick (digital photo, Moser et al., 2021, CC-BY 4.0); (h) melt sequence between 133.82 and 133.92 m depth in the ice core from James Ross Island, Antarctic Peninsula (line scan image, Abram et al., 2013, reproduced with permission from SNCSC); (i) a 1 mm melt layer in the surface snow at 0.008 m depth at Siple Dome, Antarctica (digital photo, Das and Alley, 2005).
In the past, studies about melt in ice cores were focused on alpine settings (Eichler et al., 2001; Kang et al., 2008; Yuanqing et al., 2001; Avak et al., 2018). Such mountain glaciers around the Earth are vanishing (IPCC, 2019), because a rise in local equilibrium lines driven by global heating exposes most of their surfaces to melt as a cause of ablation. At the extreme end, the fear that melt may make ice cores from some sites unusable has motivated the Ice Memory Initiative (Ginot et al., 2021). Among (sub-)polar ice-core researchers, increasing temperatures have sparked interest in drivers of snowmelt and firn hydrology in the Arctic and Antarctic, where the firn is generally cold even though melting may occur. For example, in Greenland, the extensive melt event in 2012 (Nghiem et al., 2012) was followed up by record melt in 2019 (Tedesco and Fettweis, 2020), and rain-driven melt reached Greenland Summit in August 2021 (Box et al., 2022). The increase in Greenland ice sheet melting (IPCC, 2019) and rainfall (Niwano et al., 2021) is expected to continue in a warming climate. Even in Antarctica, recent melt events (Nicolas et al., 2017) have raised concerns about a reduction in firn refreezing capacity, potential hydro-fracturing, and ice shelf instability (Bell et al., 2017; Gilbert and Kittel, 2021; Kuipers Munneke et al., 2014b; Wille et al., 2019).
Surface melt events are rare in Antarctica and mostly restricted to the Antarctic Peninsula (Van Wessem et al., 2016), coasts (Nicolas et al., 2017), low-elevation sites (Thomas et al., 2021), and ice shelves (Zou et al., 2021; Banwell et al., 2021). However, those regions are the most sensitive to climate change, and assessing the frequency and characteristics of Antarctic and sub-Antarctic melt events is crucial for constraining the (surface) mass balance of Antarctica and future sea level rise at large. In addition, the amplified warming of the polar regions is expected to continue and even accelerate depending on the greenhouse gas concentration trajectories in the next few decades (Trusel et al., 2015). Though total surface melting seems to have decreased slightly in the Antarctic Peninsula in the first 2 decades of the 21st century, winter melt events are becoming more frequent (Zheng et al., 2020), and the global temperature rise leading to melt will affect a growing number of alpine to polar ice-core drilling locations, more frequently, with larger intensity, and at higher elevation further inland (Gilbert and Kittel, 2021; Nicolas et al., 2017; Clem et al., 2020; Winski et al., 2018).
Bridging the gap between alpine expertise on how to handle melt in ice cores and less melt-acquainted polar ice-core scientists is urgently needed, because understanding the drivers of recent climate changes, in particular increased melt and melt-driven changes in Antarctic mass balance, is paramount. With increasing interest in the role of sea ice (Thomas et al., 2019), atmospheric circulation (Wille et al., 2019), and tropical teleconnections (Nicolas et al., 2017), the research field is increasingly looking to the fringes of the Antarctic ice sheet. The demand for (sub-)polar ice-core profiles from low-elevation, coastal and island regions means that effects of melt on ice-climate proxy records cannot always be avoided. The polar ice-core community urgently needs to prepare for ice-core science under warming conditions.
It is the aim of this review to bring together insights from snow physics, firn hydrology, and ice-core proxy research in order to present the status quo on the influence of melt on ice proxy preservation and subsequently make suggestions for future projects in melt-prone study regions. This paper provides a detailed literature review regarding external drivers of melt events (Sect. 2.1); physics of melt layer formation and behaviour during snow metamorphism (Sect. 2.2); identification and quantification of melt (Sect. 2.3); structural characteristics of melt features (Sect. 3.1); effects of melting on records of chemical impurities, i.e. major ions, trace elements, black carbon (BC), and organic species (Sect. 3.2), stable water isotopic signatures (Sect. 3.3), and the gas record (Sect. 3.4); and applications of melt layers as environmental proxies (Sect. 3.5). Here, we review the formation, manifestation, and interpretation of melt chronologically and focus on those aspects of near-surface melting, which are important for ice-core research. Englacial or basal melt phenomena as well as glacier-wide melt assessment based on remote sensing are beyond the scope of this study. Finally, this study aims to learn from alpine ice-core scientists and contribute to a more comprehensive understanding among polar researchers of the limitations and potential of melt features in ice cores.
2.1 Drivers of melt
Generally, melting takes place whenever sufficient energy is available to cause a phase change from ice to water. The components of this surface energy balance (SEB) contributing to this surplus can be expressed as shown in the following equation Eq. 1:
where M denotes the energy available for heating ice at sub-zero temperatures or melting temperate ice, SW refers to incoming (↓) and outgoing (↑) shortwave radiation, LW is longwave radiation, turbulent fluxes comprise sensible heat flux (H) and latent heat flux of water vapour (L), R is the sensible energy supplied by rain, and G is the ground heat flux. Numerous studies have assessed the surface energy balance and how to model the underlying processes (Hock, 2005). Here, we focus on the environmental context of the SEB, because each component of the SEB is driven by global-to-local meteorological forcing (Kinnard et al., 2008) and its interactions with the surface and subsurface properties of the glacier (Fig. 2).
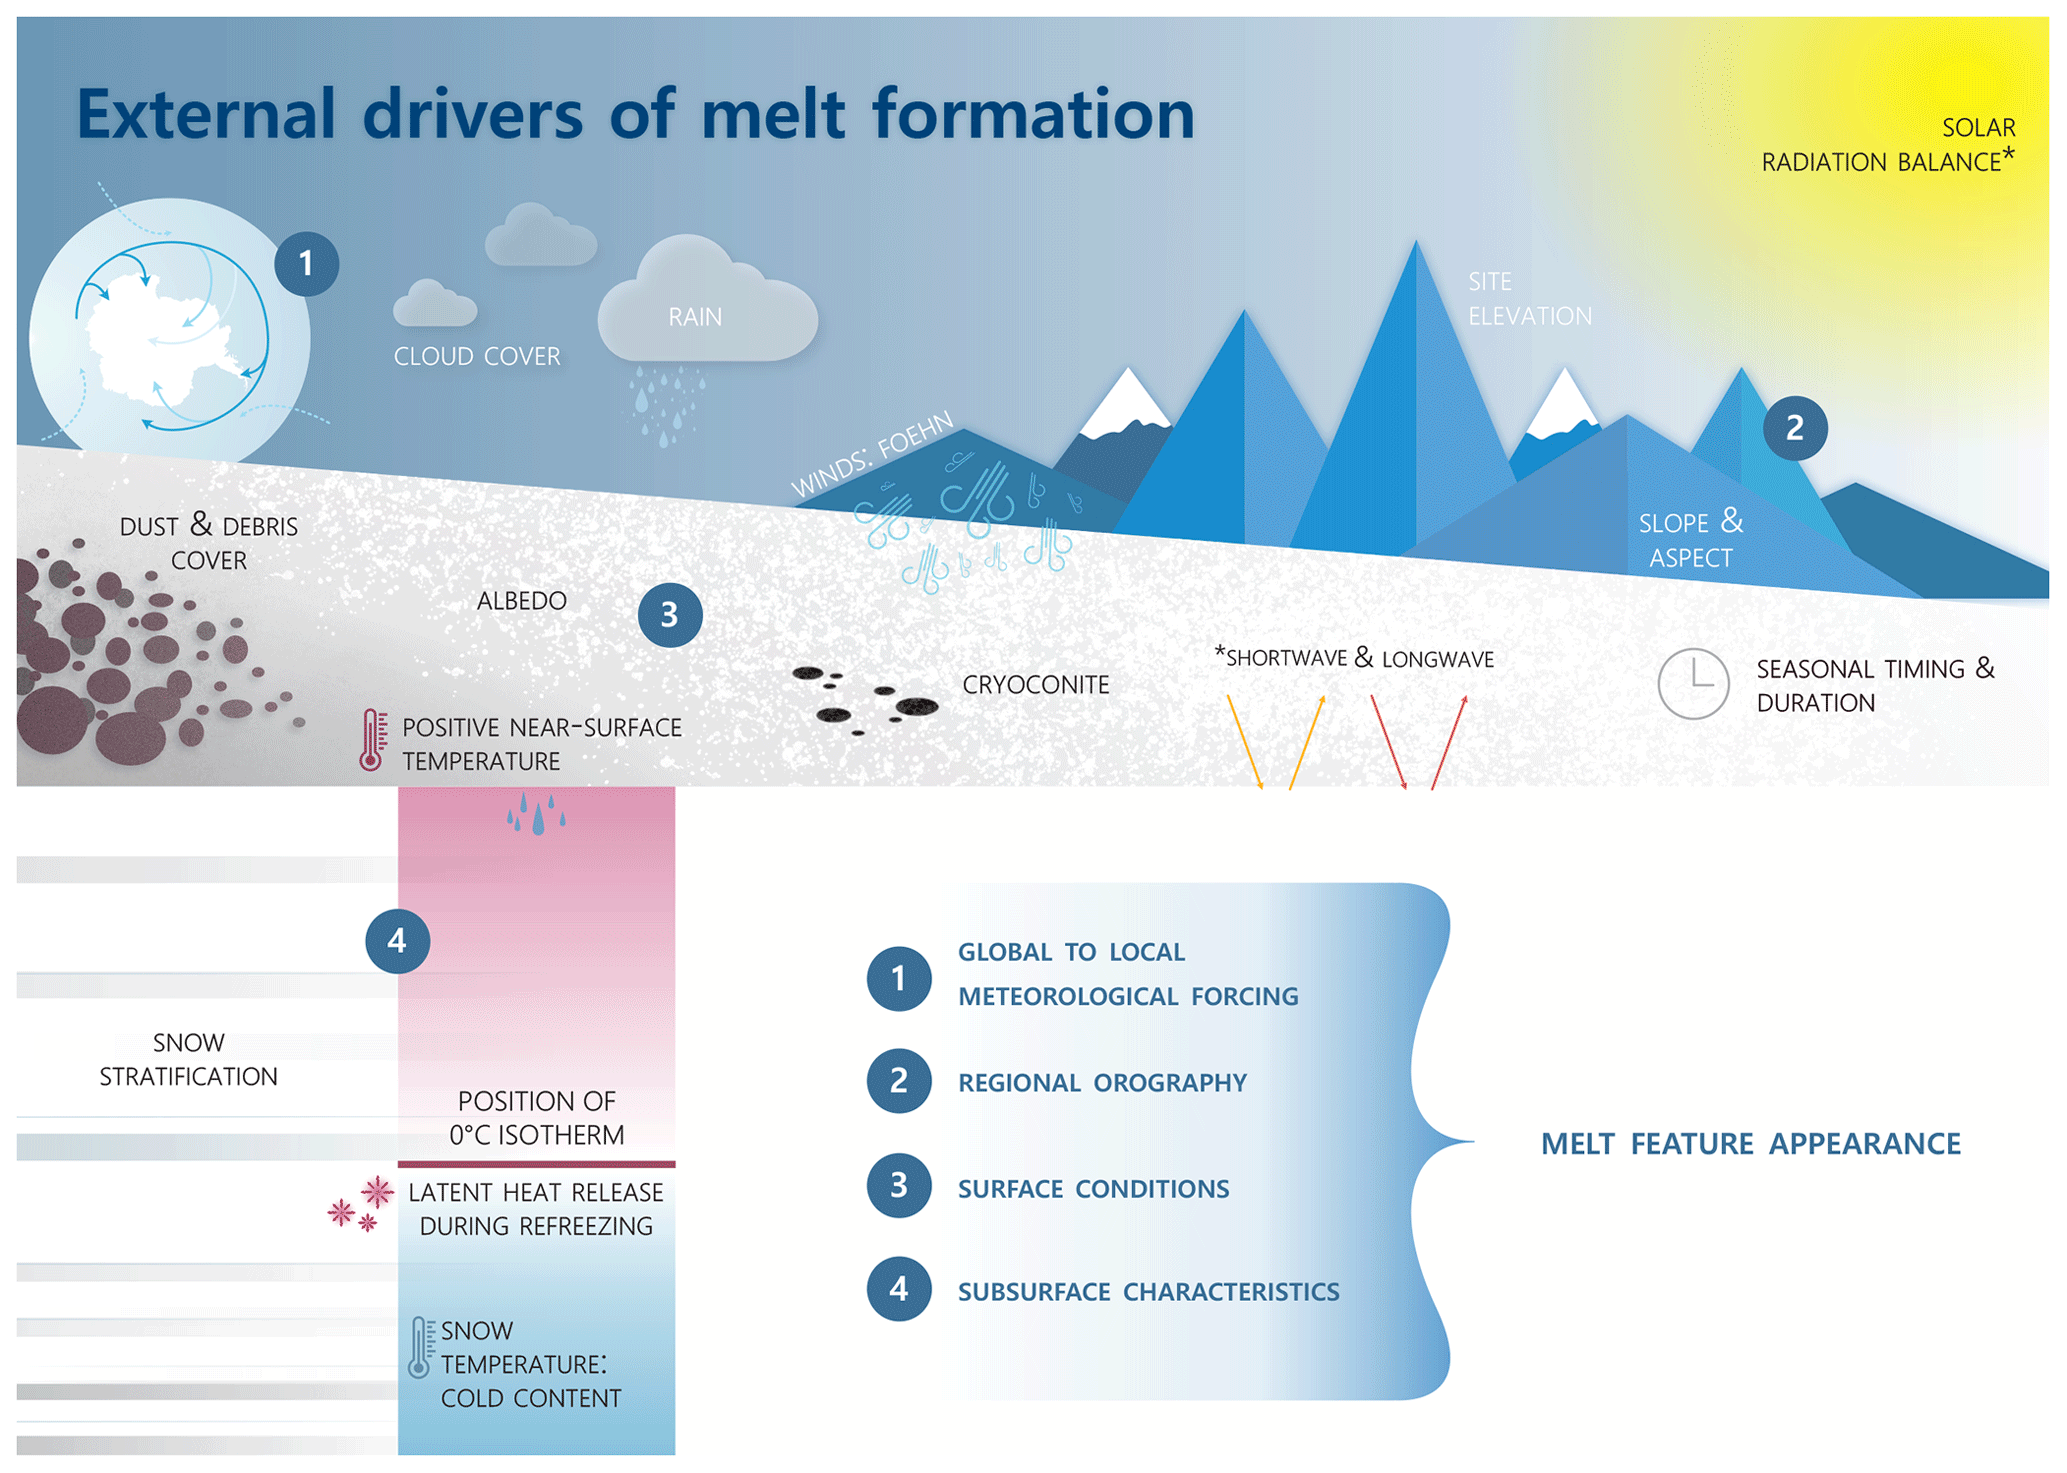
Figure 2Schematic overview of the diverse, external drivers and constraints of near-surface snowmelt discussed in Sect. 2.1, including global to local meteorological forcing, regional orography, surface conditions, and subsurface characteristics.
Positive air temperatures are the primary, non-linearly related trigger of melt and a well-established, integrated proxy for melt intensity (Abram et al., 2013; Hock, 2003; Bell et al., 2018). Warm air can be linked to various components of the SEB. Melt rates of up to 4 mm water equivalent (w.e.) per day have been recorded on the East Antarctic Peninsula and attributed to warm air advection in combination with foehn wind effects (Van Den Broeke, 2005). Warm air advection is shaped by synoptic-scale atmospheric circulation patterns like high-pressure blockages, which facilitate moist–warm air intrusions (e.g. the West Antarctic Ice Sheet, WAIS, Scott et al., 2019). Similar importance of atmospheric blocking has been observed for Greenland melt (Hanna et al., 2013, 2014; McLeod and Mote, 2016). Linear-shaped air intrusions are often referred to as “atmospheric rivers” and correlate highly with melt production in both Greenland and Antarctica (Neff, 2018; Wille et al., 2019). The association is especially strong in Antarctica during winter (Wille et al., 2019) and, for example, an atmospheric river is considered responsible for the observed extensive melt in West Antarctica in 2016 (Wille et al., 2019). The atmospheric forcing of melt events also includes near-surface winds (Cullather and Nowicki, 2018). Foehn events are characterised by clear-sky shortwave radiation together with advection of warm, dry air and occur episodically through gravity winds on the lee slopes of mountain ranges like the Antarctic Peninsula (Elvidge and Renfrew, 2016). These foehn winds are coupled to the position and strength of the circumpolar westerly wind belt (Datta et al., 2019) and can lead to spatially inhomogeneous melt events (Bell et al., 2018). Melting can also be caused by the “blanketing effect” of a cloud cover (Cullather and Nowicki, 2018; Hahn et al., 2020; Scott et al., 2019), which increases the downwelling longwave radiation balance. In this regard, the altitude and phase type of the clouds prevailing at the site play a key role in the net radiation effect. Low-altitude, mixed-phase clouds warm the glacier surface and vice versa.
Such meteorological constellations in the Antarctic are dynamically tied to the climate of the tropics (Winski et al., 2018). When examining melt in ice cores, even such long-distance teleconnections should be taken into account. For example, the strength and position of the Amundsen Sea Low (ASL) are coupled to tropical climate through the El Niño–Southern Oscillation (ENSO) teleconnection, and summer melt in West Antarctica has been linked to strong El Niño (Nicolas et al., 2017; Wille et al., 2019).
In addition to the meteorological and climatological drivers of melt events, the regional-to-local shape of an ice body determine its melt response. As the lateral and vertical extents of an ice sheet affect the trajectories of air masses circulating around it, ice sheet geometry is to be considered a factor in melt occurrence (Das and Alley, 2008). Melt conditions can also vary across short distances, because the regional-scale meteorological drivers described above interact with local site characteristics (Fig. 2). Glacier orography, including slope, aspect, and elevation, plays a significant role in the local SEB (Arnold et al., 2006; Olson and Rupper, 2019; Hahn et al., 2020). For example, the warming of katabatic winds during its downflow has been shown to enhance melt production, especially at the grounding line of an East Antarctic glacier during summer, facilitated by positive wind–albedo and melt–albedo feedbacks through the exposure of blue ice and bedrock (Lenaerts et al., 2017; Bell et al., 2018).
Melt is further driven by site-specific surface snow characteristics (Fig. 2). Snow exposed at the surface undergoes processes like wind-driven redistribution, temperature gradient and isothermal metamorphism, which alter the size and shape of the deposit and in turn the surface albedo. While fresh snow exhibits albedo values of ∼ 0.8, aged snow shows lower values around 0.4 (Dirmhirn and Eaton, 1975) and dirty snow even lower values <0.2 (Warren, 2019; Conway et al., 1996). Thereby, albedo is coupled to melt by positive feedback (Thackeray and Fletcher, 2016). That is, a lowering of the surface albedo reinforces the tendency for melting and leads to a further albedo decrease. For example, forest fires produce significant amounts of BC and reduce the surface albedo even at distant sites like interior Greenland, a coupling that is expected to increase with climate change (Keegan et al., 2014). Also, debris cover and cryoconite (Fountain et al., 2004), dark-coloured dust containing soot and microorganisms, can lower the albedo and enhance local melt production (Mattson et al., 1993). A debris cover can also act as an insulating active layer if it is sufficiently thick (Rowan et al., 2021; Reznichenko et al., 2010).
All of this shows that the drivers of a positive SEB and melt events are not uniform. They must be assessed for individual sites and ice-core records within their respective complex climatic contexts. The details of the melt process and its subsurface progression will be discussed in Sect. 2.2.
2.2 Physics of melt layer formation and dynamics during snow metamorphism
The analysis of melt-affected ice core records is preceded by understanding the physicochemical process of melting ice, which has been investigated extensively since the 19th century (Faraday, 1859; Sánchez et al., 2017). Sánchez et al. (2017) recently presented evidence that melting takes place in a “bilayer-by-bilayer” fashion leading to a nanometre-thick quasi-liquid layer (QLL) at the ice–air interface (Slater and Michaelides, 2019). As these features already exist within the ice matrix on a grain scale at temperatures below the melting point of the wider snowpack, they are also called “pre-melting” (Bishop et al., 2009).
On a larger scale, the surface snow starts to melt when the energy balance is positive sufficiently long enough to raise at least parts of the ice matrix to 0 °C, and it ends when the energy balance below the 0 °C isotherm is negative again. This duration threshold is reached within a few hours to less than 1 d, as has been recorded for Hansbreen in Svalbard by Laska et al. (2016). Therefore, modelling of melt processes must aim for hourly or at least sub-daily resolution. Furthermore, Koh and Jordan (1995) showed that radiation-forced temperature maxima and melting can occur a few centimetres below the snowpack surface, especially in low-density snow. Since the surface energy conditions vary significantly over short timescales, e.g. during diurnal cycles, “melt–freeze” features (referred to as melt features hereafter) tend to develop accordingly (Colbeck, 1982).
Melting leads to wet metamorphism, during which liquid water is available and acts as a carrier of thermal energy, which accelerates post-depositional alteration of the affected snow layers. Wet metamorphism is generally isothermal (Brun, 1989; Wakahama, 1968, 1975), characterised by a rise in grain size and density caused by recrystallisation, and increasing liquid water content softens the snow (Colbeck, 1982). This process leads to the key structural characteristics of melt features in ice cores, which is discussed in Sect. 3.1.
Melt generated near the snow surface can penetrate into the underlying snowpack (Westhoff et al., 2022). The progression of the percolation front depends on the local thermodynamic and hydrological conditions and has been modelled and observed to varying degrees from alpine to polar sites (Graeter et al., 2018; Meyer and Hewitt, 2017). Meltwater infiltration into deeper, older snow makes percolation a secondary process leading to mixed snow compositions and climatic signatures, e.g. of summer melt in winter snow (Moore et al., 2005). For similar reason, infiltration beyond the current annual layer is an issue when interpreting ice-core proxy and melt layer records, so that using multi-year averages of melt indices has been recommended previously (Graeter et al., 2018). Furthermore, positive-degree-day (PDD) sums are a common tool for quantifying ablation due to temperatures above the melting point (Hock, 2003). With PDD values normalised to a single day (°C day), Das and Alley (2005) estimated +5.22 °C as the temperature for a West Antarctic site, above which it is probable that percolation of a single melt event reaches into the accumulation of the previous year. However, this parameter requires site-specific assessment. The rate of melt production further governs the exposure period of snow to melt liquid (Taylor et al., 2001) through the “saturation, refreezing capacity, and drainage processes” within the firn (Samimi et al., 2020). This is important when it comes to interpreting chemical records from melt-affected ice cores.
In addition to the energy balance at the snow surface and gravitation in general, the speed and type of meltwater flow are determined by characteristics of the subsurface, including (1) temperature, (2) thermal conductivity, and (3) stratigraphy of the snowpack. (1) Cold subsurface temperatures of the snowpack, the so-called “cold content”, are a strong constraint for snowmelt production (Jennings et al., 2018). Depending on the cold content, large amounts of energy might be needed to raise the snow temperature to melting point and delay the progression of the melting front at the 0 °C isotherm to deeper layers. (2) According to Pfeffer and Humphrey (1998), the balance between melting and refreezing is also driven by the thermal conductivity of the ice matrix, which in turn depends on the firn density. High densities allow for more freezing and vice versa. (3) Snow column stratigraphy affects the direction of flow through capillary and hydrological forces. Neighbouring snow deposits can differ significantly in terms of microstructure, e.g. grain size and porosity, and so do their capillary characteristics and permeability. It is due to this difference in capillary resistance that fine to coarse transitions are well known for retarding vertical meltwater percolation (Pfeffer and Humphrey, 1996), but differences in capillary characteristics can lead to lateral meltwater suction too. McDowell et al. (2023) have recently identified a two-way feedback between pre-existing microstructural transitions in firn, which facilitate melt infiltration and wet metamorphism locally, and more ice layers. Hydrological barriers can also be high-density layers like wind crusts (Das and Alley, 2005) or pre-existing melt layers (Samimi et al., 2020), and both are frequent features in alpine to polar settings. Furthermore, progression of melt is halted not only by fully melt-filled refrozen pores, but also by closed pore connections (Humphrey et al., 2021). Taken together, snow conditions constraining the flow are expected to lead to sharper contacts between melt layer and adjacent firn.
Based on these factors, which determine the flow path of least resistance, percolation takes place in different ways (Hirashima et al., 2019). Homogeneous wetting, also known as matrix flow, tends to occur in temperate snow with less dominant stratigraphic boundaries, and the thawing front progresses laterally uniformly, while at colder, stratigraphically complex sites, lateral and vertical flow alternates spatially and temporally (Williams et al., 2010; Pfeffer and Humphrey, 1996). Preferential flow takes place where meltwater flow instabilities occur at the wetting front (Leroux and Pomeroy, 2017; Hirashima et al., 2014, 2017; Parlange, 1974). In this case, capillary pressure of advancing vertically exceeds the capillary pressure of expanding laterally. Dye experiments have frequently been used to visualise this stepwise advance of preferential flow paths (PFPs) along the stratigraphy (Avanzi et al., 2016; Clerx et al., 2022). They also highlight where melt layers do not form directly at the surface but at greater depth. At Neumayer Station in Dronning Maud Land, meltwater has been documented to refreeze 50–100 cm below the snow surface during summer (Kaczmarska et al., 2006). Given that the flow conditions are a continuum between these two extremes and vary widely between sites and seasons, different structural characteristics of melt in ice cores must be expected (Sect. 3.1). Furthermore, ice cores only capture a very small area, and whether the derived melt records are representative should be corroborated by larger-scale stratigraphic analyses of the subsurface, e.g. using multiple snow trenches or ground-penetrating radar.
Other general physical implications of melting for glaciers and glaciology include melt–freeze cycles changing the thermal structure within the snowpack, i.e. (sub)surface warming (Humphrey et al., 2012; Mattea et al., 2021), because freezing 1 g of water raises the temperature of 160 g of adjacent snow by 1 °C through the release of latent heat (Cuffey and Paterson, 2010). In extreme cases, this can lead to the development of highly permeable firn aquifers (Koenig et al., 2014; Kuipers Munneke et al., 2014a; Miller et al., 2020). In addition, meltwater percolation, especially through PFPs, advects heat to deeper, sub-zero snow sections. At sites with preferential percolation, borehole temperatures can therefore be ambiguous (Pfeffer and Humphrey, 1996).
Since melt complicates firn densification through metamorphism rates differing between affected and unaffected sections, linear densification curve fits solely dependent on the overlying snow burden (Herron and Langway, 1980) are not sufficient to predict internal density variations caused by melt. Improved understanding of firn meltwater retention (Vandecrux et al., 2020) and densification models (Ligtenberg et al., 2011) are therefore crucial, and differences in temporal resolution between unaffected firn and melt layers need to be taken into account when interpreting melt-affected ice cores (Moser et al., 2021).
Refrozen melt layers further reduce the permeability of the snow column, i.e. acting as impermeable barriers to percolation. The development of a stratigraphic boundary in turn encourages more ice aggregation at the top and/or bottom of the ice layer and reinforces this effect. Though pneumatic testing has the potential to uncover horizontal and vertical firn permeability in situ (Sommers et al., 2017), the effective permeability of refrozen melt layers for percolation is under debate. On the one hand, they can be partly permeable when warmed to the melting point and can allow for meltwater penetrating beyond these features (Samimi et al., 2020; Lliboutry, 1996). On the other hand, thick ice slabs are expected to be impermeable, because heat transfer in temperate, saturated firn is low (Samimi et al., 2020). Though the development of impermeable ice slabs leads to temporary retention of melt, it also may reduce the firn's capabilities for meltwater storage (Vandecrux et al., 2019) and enhance runoff (Machguth et al., 2016; Pfeffer et al., 1991).
2.3 Identification and quantification of melt
2.3.1 Melt feature records from ice cores
In ice cores, past near-surface melt events are commonly identified as visually distinct features that have been buried within the profile (Fig. 1). Distinction is either made manually during ice core processing in the cold laboratory, where some melt layers can be clearly seen by eye or by using line scanners (Kinnard et al., 2008; Svensson et al., 2005; Dey et al., 2022; Brown et al., 2023). Thus, long-term melt history records from Canada (Koerner and Fisher, 1990), Greenland (Westhoff et al., 2022), Alaska (Winski et al., 2018), Arctic Russia (Fritzsche et al., 2005), and the Antarctic Peninsula (Abram et al., 2013) have been acquired.
Traditionally, the description of firn sections with melt features tends to be binary, as sections “affected” or “unaffected” by melt. The resolution ranges between micrometres and a few millimetres, depending on sight or camera capabilities. An issue with this and other structural identification approaches is their inability to discriminate between very thin melt layers and other fine, high-density, and bubble-free features like glaze (Albert et al., 2004; Fegyveresi et al., 2018; Frezzotti et al., 2002) and wind crusts (Sommer et al., 2018; Weinhart et al., 2021). While their discrimination requires further investigation, Westhoff et al. (2022), for example, applied a thickness threshold of 1.5 mm as an upper limit for wind crusts and considered features >1.5 mm to be melt-induced.
Furthermore, two melt sections of equal thickness imply equal intensity of the melt events, even though various factors shape the melt layer appearance (Sect. 2.1 and 2.2). Thickness-based melt estimates do not reflect this complexity and have been shown to significantly overestimate melt proportion in comparison to melt constrained by line-scan-derived density (Dey et al., 2022). Both visual processing and line scanning are limited to air-bubble-containing ice in the topmost few hundred metres of ice above the bubble-to-clathrate transition zone (Neff, 2014), within which the air bubbles start to disappear as the air starts to form clathrates. Within this transition zone, the visual differences between melt and non-melt sections (bubble density) vanish. However, this is generally not an issue for shallower, alpine ice cores and is only relevant to deep polar ice cores.
Limitations inherent to the features are that (1) both rain-on-snow events and a non-accumulative positive surface energy balance can cause identical features in ice cores, (2) it remains unclear whether a thick melt feature with internal variability resulted from one larger melt phase or several shorter events (Fig. 1), and (3) it has been shown that melt percolation of a single event can lead to several melt horizons (Westhoff et al., 2022). Given that ice cores are single-point records of highly dynamic and spatially heterogeneous environments (Zuhr et al., 2021), their representativity must be validated locally, and obtained melt history records must be interpreted with caution. Quantitative melt estimates are commonly derived from the frequency and thickness of melt layers. Here, thinning of melt features due to burial-induced densification and glacier flow needs to be taken into account. A first melt parameter that does so is “melt frequency” (MF), defined as the number of melt events per depth (metre) or time unit (Kinnard et al., 2008; Kaczmarska et al., 2006; Alley and Anandakrishnan, 1995). This melt frequency can be used for calculating a second parameter, “melt features percent” (MFP, Eq. 2), i.e. the percentage of melt-affected ice (Mice) of the annual layer (A) in terms of mass (Koerner, 1977a; Winski et al., 2018). The thickness-based approaches will lead to different profiles of the derived melt quantity (Supplement Table S1).
In addition to the structural identification, chemical characteristics can be used to identify melt layers in ice cores. Methods based on the magnesium–sodium ratio (Watanabe et al., 2015; Li et al., 2006), chloride–sodium ratio (Eichler et al., 2001), trace-element concentration ratios (Avak et al., 2018), dissolved ion fraction percentage (Wu et al., 2018), and radionuclide content (Pinglot et al., 2003) help to identify melt and constrain its effects. Rod-like inclusions (>30 µm) in ice layers have recently been suggested as indicators of large amounts of refrozen meltwater (Kawakami et al., 2022). Total air content, and in particular noble gas measurements, have even proven valuable for detecting melt where it generally cannot be detected visually like in deep, clathrated ice (Orsi et al., 2015; NEEM community members, 2013).
2.3.2 Modelling and remote sensing: potential and limitations for melt identification
Various modelling and remote sensing approaches for the identification and quantification of melt exist, which can support ice core studies in the field. Hock (2005) previously reviewed different types of melt models using the SEB. Such SEB models have great potential but are sometimes hampered by a lack of meteorological data beyond temperature. Simpler PDD models based on the relationship between melt and temperature (Krenke and Khodakov, 1966) are more commonly applied. However, they struggle to implement the small-scale spatial complexity of melt in heterogeneous topography as well as the continuously changing meteorological and snowpack conditions, which hinders the detailed depiction of melt events.
Remote sensing has become a very influential way of assessing melt occurrence in Antarctica, because it allows us to investigate large spatial coverages in the most remote region on Earth. Optical imagery (e.g. Landsat 8, Sentinel-2) and passive microwave sensors, which rely on the change in dielectric properties at the glacier surface (e.g. ICESat-2), are widely used today (Fricker et al., 2021; Dell et al., 2021). The short time span of such satellite observations (maximum since the 1980s) is a significant limitation for studying changes in climate that take place on decadal to centennial timescales. Furthermore, the detection of surface melt events is directly dependent on the method sensitivity and chosen threshold, which can lead to the confusion of fresh melt events with retained subsurface liquid (Dell et al., 2021).
3.1 Structural characteristics of melt features in ice cores
Melting near the snow surface leaves a physical imprint on the stratigraphy of the glacier. Here, we discuss the appearance of melt features in snow, firn, and bubbly ice, where structural differences are visible (Fig. 1). As these melt features are buried under new layers of snow, they participate in the snow–firn densification process as well as ice thinning at greater depth. Melt features in deep ice, where high hydrostatic pressure forces air bubbles into clathrates and bubble-free melt sections are practically impossible to detect visually, are addressed in Sects. 2.3.1 and 3.4.
Similar to glacier hydrology studies (Bell et al., 2018), which describe a variety of surface melt features on a macroscopic scale, it must be noted that traces of melt in ice cores can differ greatly (Fig. 1). A first common characteristic of melt-affected ice-core sections is their distinctly higher density caused by wet metamorphism, speeding up the compaction of the snowpack. This corresponds to lower porosity and permeability than the adjacent firn. Secondly, melt features generally contain few air bubbles (Orsi et al., 2015; Langway and Shoji, 1990; Das and Alley, 2005). While some studies state that melt layers are entirely bubble-free, some include bubble-sparse (Koerner, 1989; Ahn et al., 2008) or very coarse-grained yet bubble-containing sections in their definition of melt-affected ice (MacDonell et al., 2021). Depending on the speed of melt infiltration and freeze-off, the degree of degassing in the affected firn has been suggested to vary. That is, slower freeze-off allows for more degassing and consequently fewer, smaller air bubbles in the melt-affected section (Ahn et al., 2008). Therefore, under rapid percolation, air from the open-porous firn can get trapped and merge to enlarged, irregular-shaped bubbles during the freezing process. These differ from regular air bubbles unaffected by melt, which stem from long-term metamorphism and tend to have more circular shapes resulting from specific surface area reduction.
The impact of recrystallisation on granulometry during melt phases has been used by MacDonell et al. (2021) to categorize melt layers as fine- (<1 mm), medium- (1–2 mm), or large-grained (>3 mm). Another parameter to describe melt features in greater detail is the nature of their top and bottom boundaries with the neighbouring firn. While many polar studies describe sharp contacts between non-melt and melt-affected sections (Das and Alley, 2005), irregular boundaries have also been observed (Fritzsche et al., 2005). MacDonell et al. (2021) observed “diffuse, sinuous, and planar” contacts. The factors determining between homogeneous wetting and preferential flow, e.g. cold content and stratigraphy of the snowpack (Sect. 2.2), also drive melt layer prominence (Culberg et al., 2021).
While melt layers are frequently reported as “sub-horizontal” in ice cores with a limited sampling area, the different meltwater flow regimes discussed in Sect. 2.2 can lead to both horizontal and vertical features. Lateral flow is responsible for both discontinuous melt lenses and extensive melt layers (Das and Alley, 2005). Lateral connectivity of melt features is a useful parameter for describing the different degrees of melt impact on the snow stratigraphy, even at a glacier scale (Culberg et al., 2021). At the same time, even when ice layers are continuous across a core, they cannot be assumed to be horizontally uniform (Kameda et al., 1995), and observations from a single ice core are not necessarily representative of the regional melting conditions.
Typical estimates for melt layer thickness are in the range of millimetres to decimetres (Langway and Shoji, 1990; Orsi et al., 2015; Das and Alley, 2005), but their extent varies according to the site-specific, short-term meteorological, and snowpack conditions. At Site J, southern Greenland, ∼ 38 % of melt layers were ≤2 mm thick (Kameda et al., 1995), with features up to 210 mm raising the mean melt thickness to ∼ 10.8 mm. Thereby, 20–100 mm clusters of melt features are common within the ice cores from Site J (Kameda et al., 1995). In a Belukha ice core from the Siberian Altai, melt layers are mostly <10 mm thick with a few outliers >40 mm (Okamoto et al., 2011). Ice layers up to 85 mm thick have been recorded in an ice core from Mt Yulong on the south-eastern Tibetan Plateau (Yuanqing et al., 2001). Melt features in the first sub-Antarctic ice core from Young Island are on average 64 mm in thickness with a maximum of 580 mm (Moser et al., 2021; Thomas et al., 2021). At James Ross Island, Antarctic Peninsula, the mean vertical extent of melt layers is 32 mm (Abram et al., 2013).
These examples highlight two issues of melt layer records from ice cores: (1) whether close clusters of melt layers and inter-layering of ice and firn are counted individually or collectively as one thicker melt-affected section is subjective to the processing team and can vary based on the eyesight or sample cut; (2) whether thick melt features are the result of a single heavy melt event or a sequence of smaller melt events is indistinguishable during ice-core processing and requires further investigation of their internal stratigraphy.
Vertical melt features, so-called melt pipes or flow fingers, are direct evidence of percolation and distinct pathways for liquid beyond the 0 °C wetting front (Pfeffer and Humphrey, 1998; Williams et al., 2010). Previous assessments of their diameter summarised by Williams et al. (2010) range from ∼ 36 mm (Marsh and Woo, 1984), generally 50–150 mm and ≤10 mm for low-intensity events early in the season (McGurk and Kattelmann, 1988) to 10–400 mm (Campbell et al., 2006). Their spacing is irregular, with estimates ranging from every 30 to 60 mm to hundreds of millimetres in between. Due to their limited horizontal extent, these features are hard to depict in ice cores with a diameter of ≤10 cm. Furthermore, stratigraphic boundaries can cause discontinuities of vertical flow features (Williams et al., 2010).
After all, the diverse appearance and structural characteristics of melt features in ice cores are not only influenced by the meteorological and energy balance conditions at the glacier surface but also strongly depend on the subsurface characteristics, which determine the meltwater flow (Fig. 3).
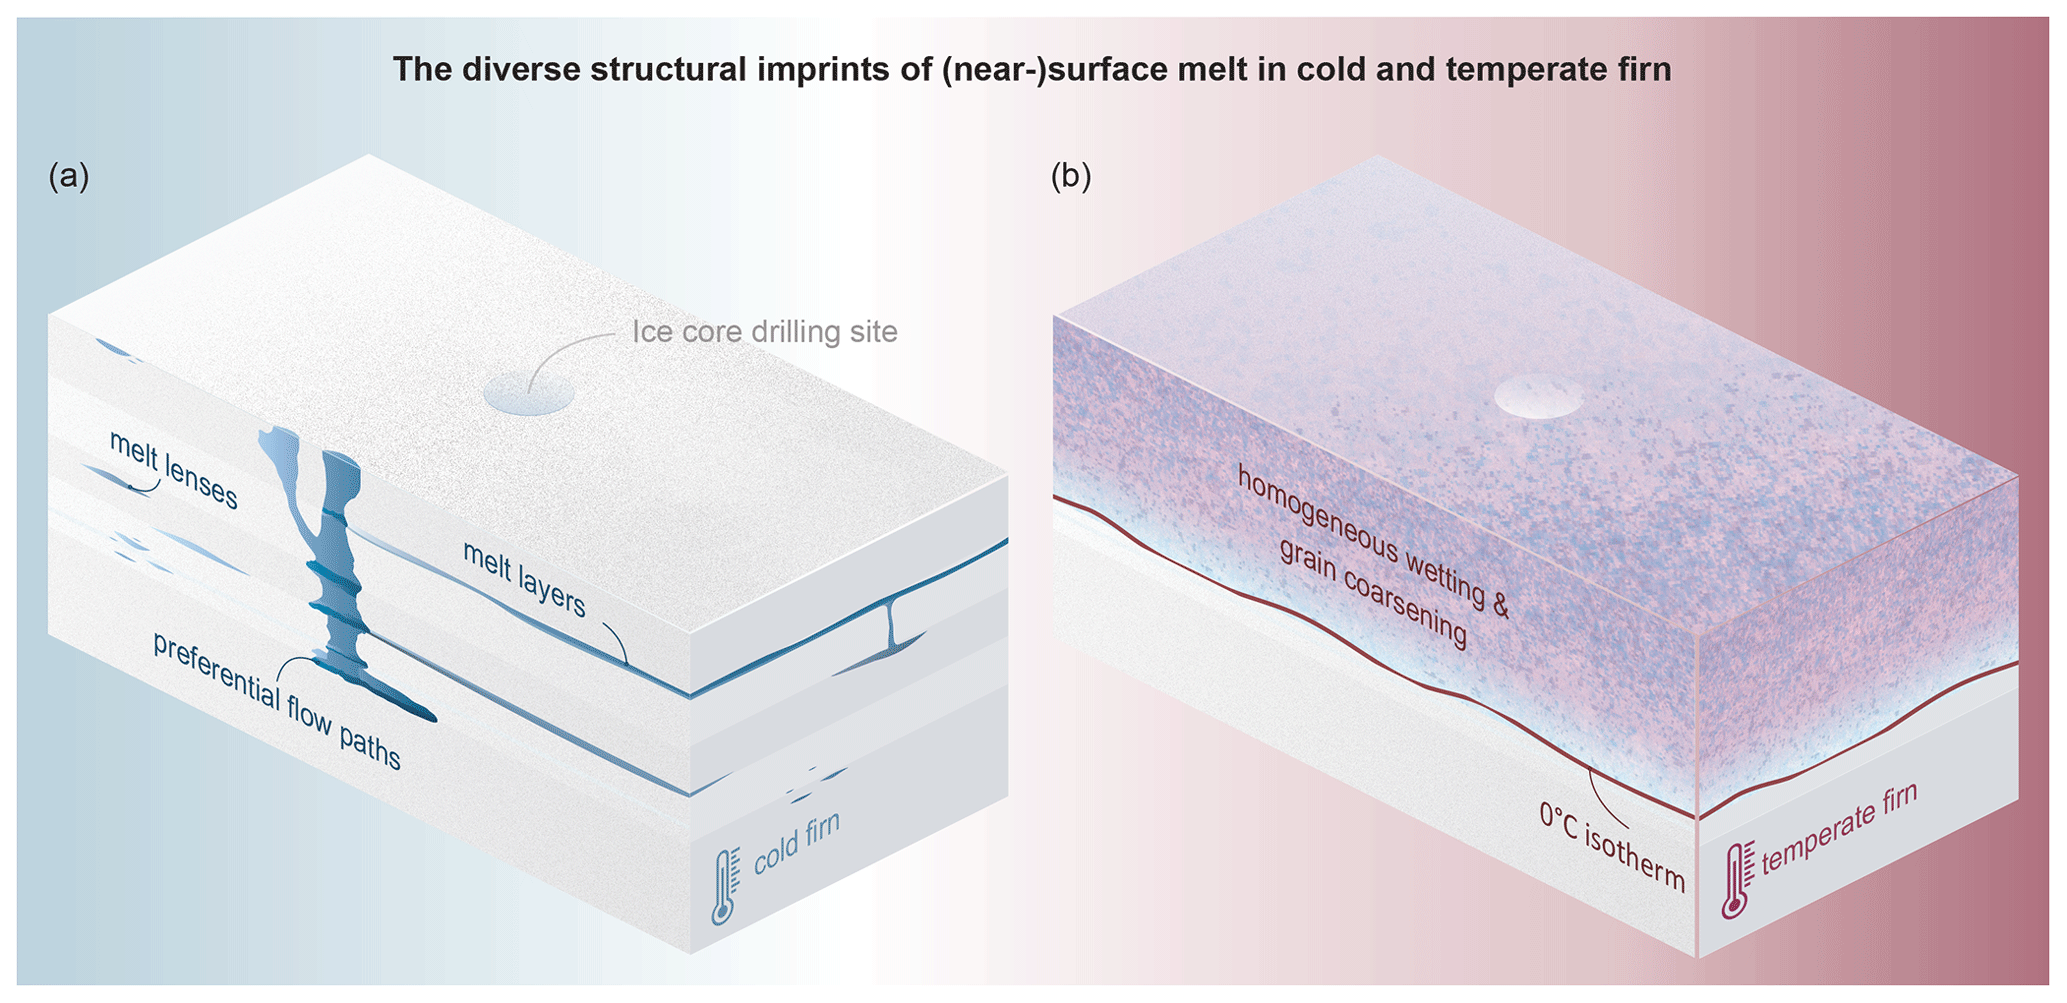
Figure 3Examples of structural imprints of melt for the extreme scenarios of (a) cold firn and (b) temperate subsurface. Subsurface temperatures influence the meltwater flow through the differing refreezing capacity of the snowpack and therefore can lead to different melt features in firn. The profiles above show extreme examples of (a) cold firn with distinct melt layers, lenses, and vertical flow fingers and (b) temperate snow characterised by more homogeneous progression of the melting front and widespread grain coarsening. A continuum between these extremes allows for unique site- and event-specific structural manifestations of melt events under natural conditions.
Further investigation of commonalities and differences among melt features will facilitate the development of a standardised description and identification scheme for melt-affected ice cores. This includes a more detailed structural description of melt layers in ice cores from various climates, including their natural variability, how to handle the interplay of melt and firn, or how to interpret thicker melt layers seemingly resulting from several events.
3.2 Melt-affected chemical proxy records
Melting has diverse effects on ice-core records of e.g. major ions, trace elements, organic compounds, or BC. Depending on the chemical species, study site, and amount of melting, anything between a drastic disturbance and fully preserved records has been reported in the literature. For example, NH (Trachsel et al., 2019; Avak et al., 2019), BC (Osmont et al., 2018; Pavlova et al., 2015; Festi et al., 2021), 3H (Pinglot et al., 2003), and low-abundance water-soluble and insoluble trace elements (Wong et al., 2013) appear to be rather preserved. On the other hand, melt-induced alteration is a substantial issue for H2O2 (Moser et al., 2021), major ions like SO and Ca2+ (Eichler et al., 2001; Li et al., 2006; Virkkunen et al., 2007), and high-abundance water-soluble trace elements (Avak et al., 2018, 2019).
Chemical impurities in the snow or firn part of a glacier can be, to varying degrees, eluted from their original position of deposition and enriched either in a deeper layer during refreezing or in the meltwater run-off. Whether impurity species are displaced within or lost from a profile depends on the refreezing capacity of the subsurface, which can be anything between predominantly cold firn to generally temperate snow and firn. Elution has been a research topic since the 1970s, because it leads to an environmentally relevant “ion flush” from snowpacks at the start of the melt season (Costa and Pomeroy, 2019; Johannessen and Henriksen, 1978; Johannessen et al., 1977; Tsiouris et al., 1985). In this context, “preferential elution” of certain ions compared to others has been observed, and a multitude of elution sequences for major ions has been published (Table 1 and references therein).
Table 1Chronological overview of studies on elution behaviour and sequences of major ions conducted in the field and laboratory using firn and ice-core sections, snow and meltwater composition measurements, and elution experiments. Elution sequences show strongly affected species to the left and more stable impurities to the right. Note that different study conditions and presentations of elution in the referenced literature complicate a direct comparison.
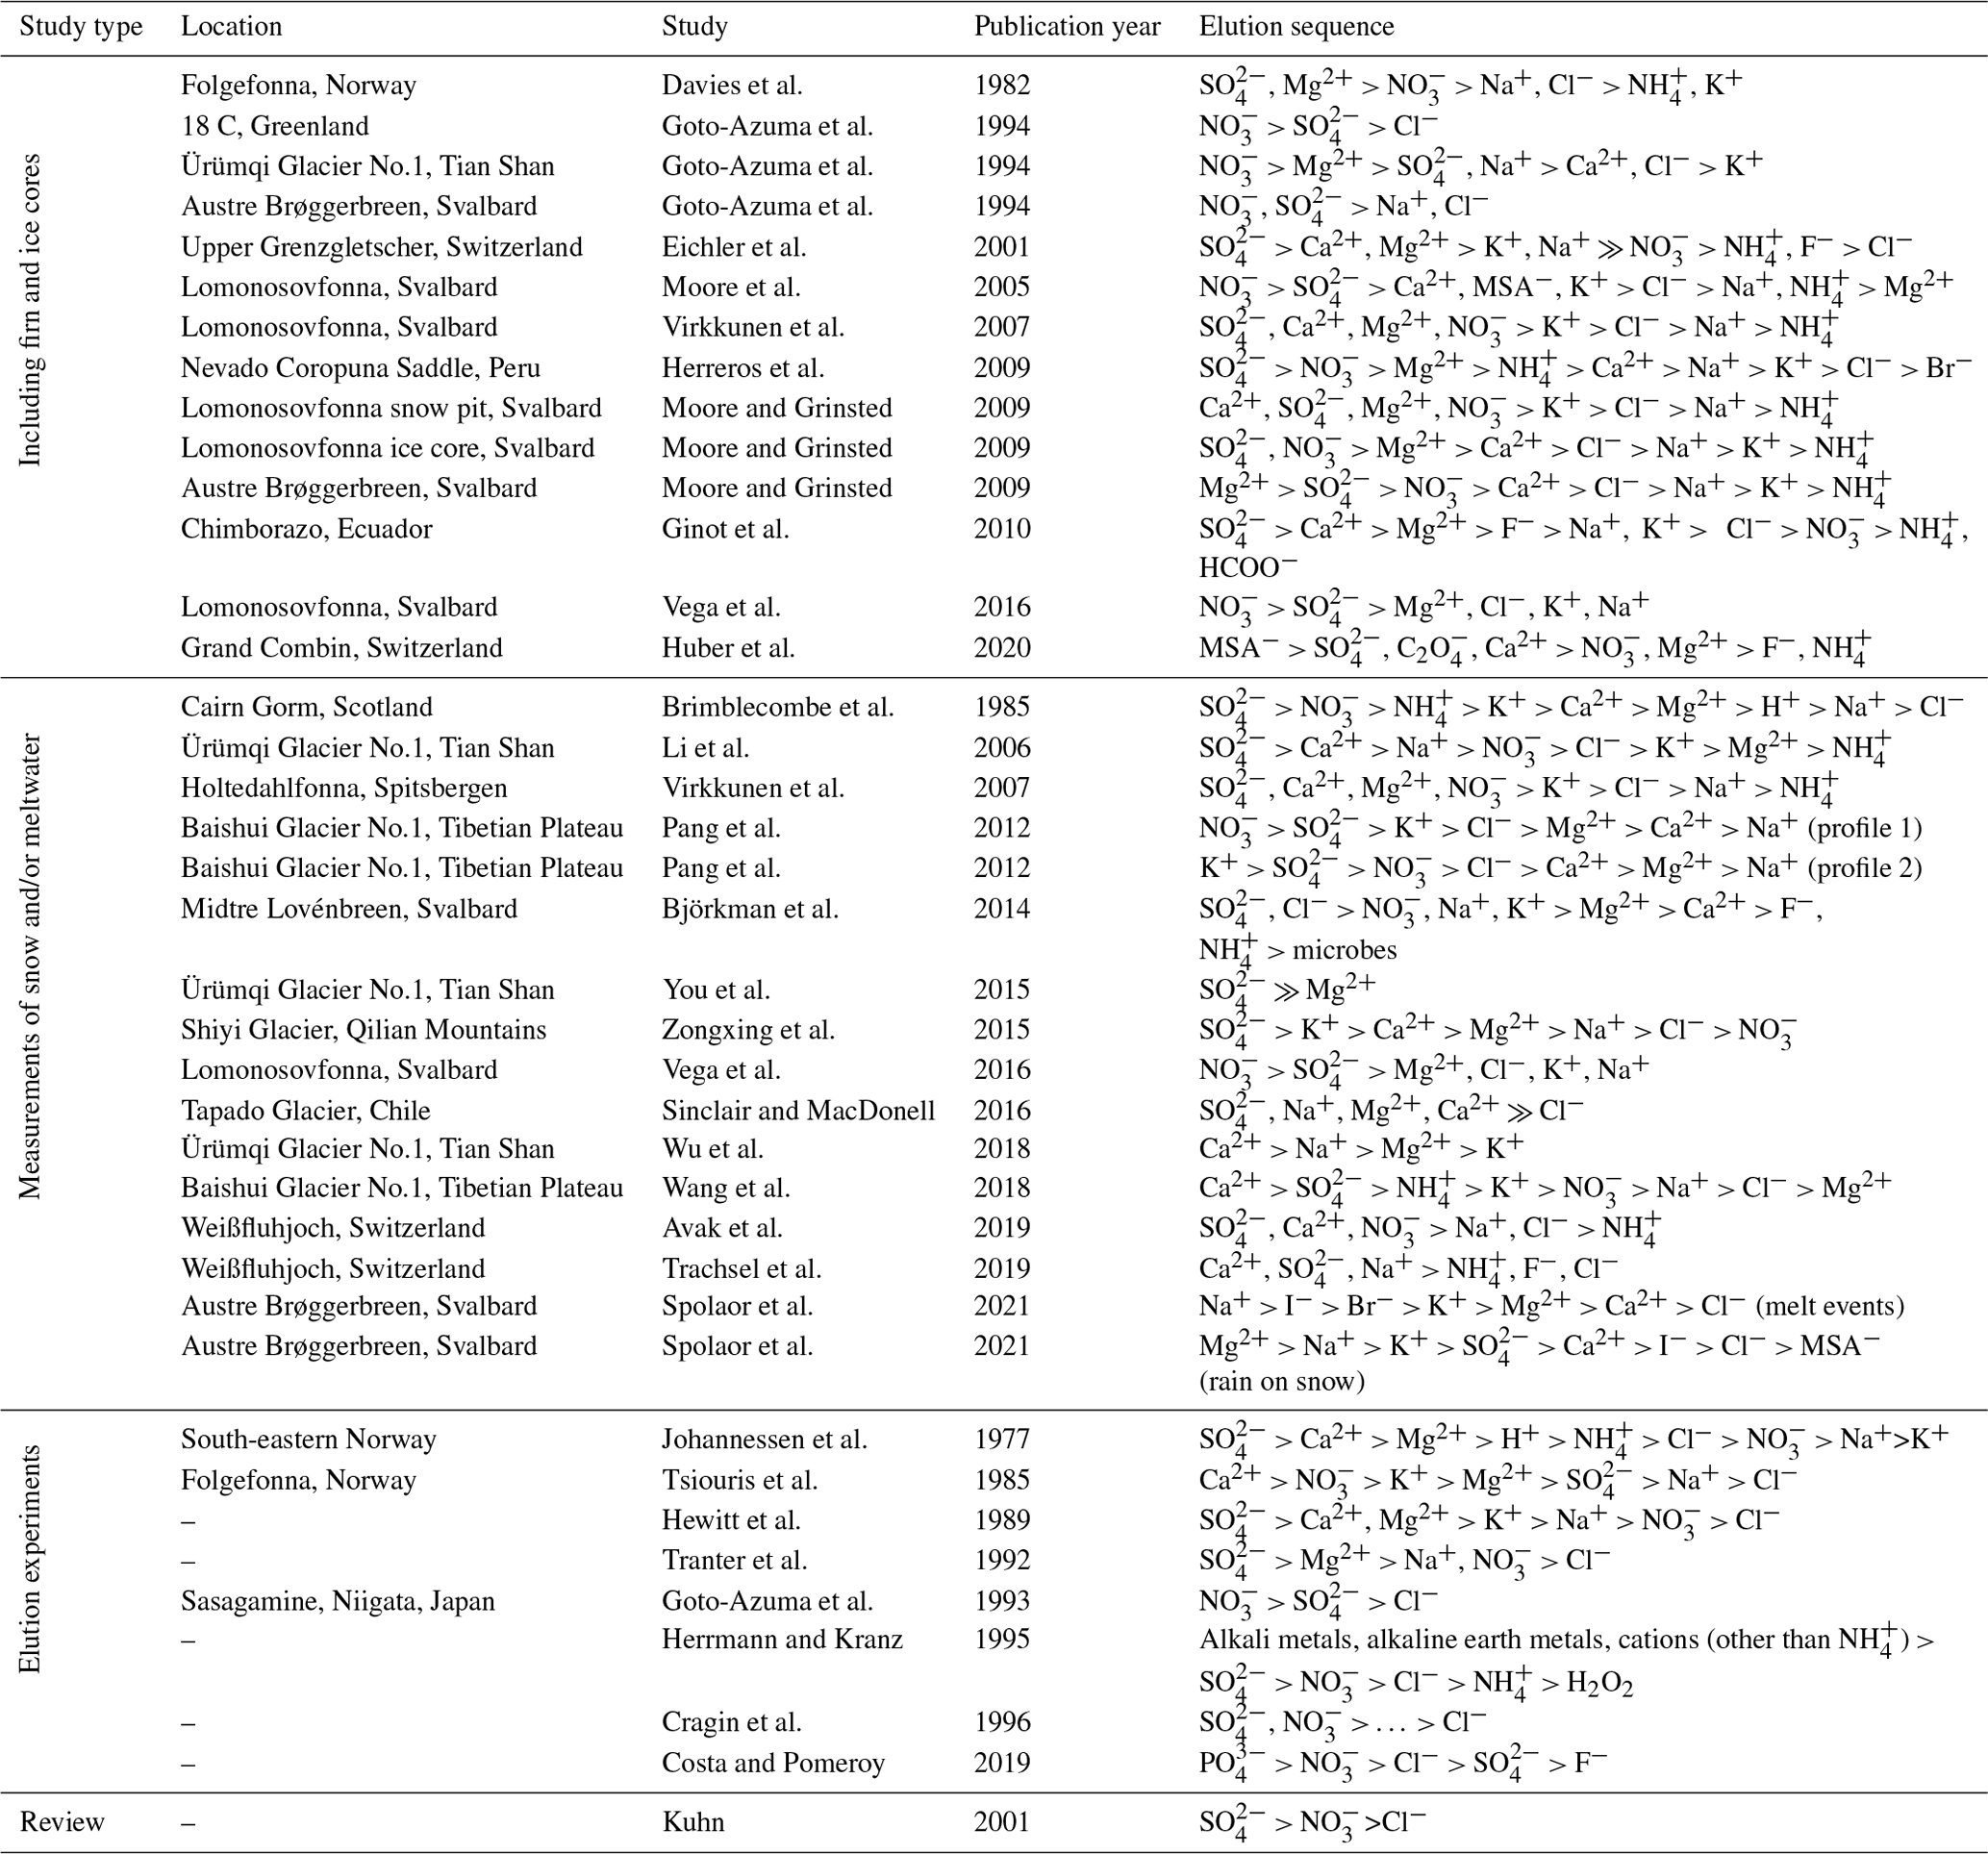
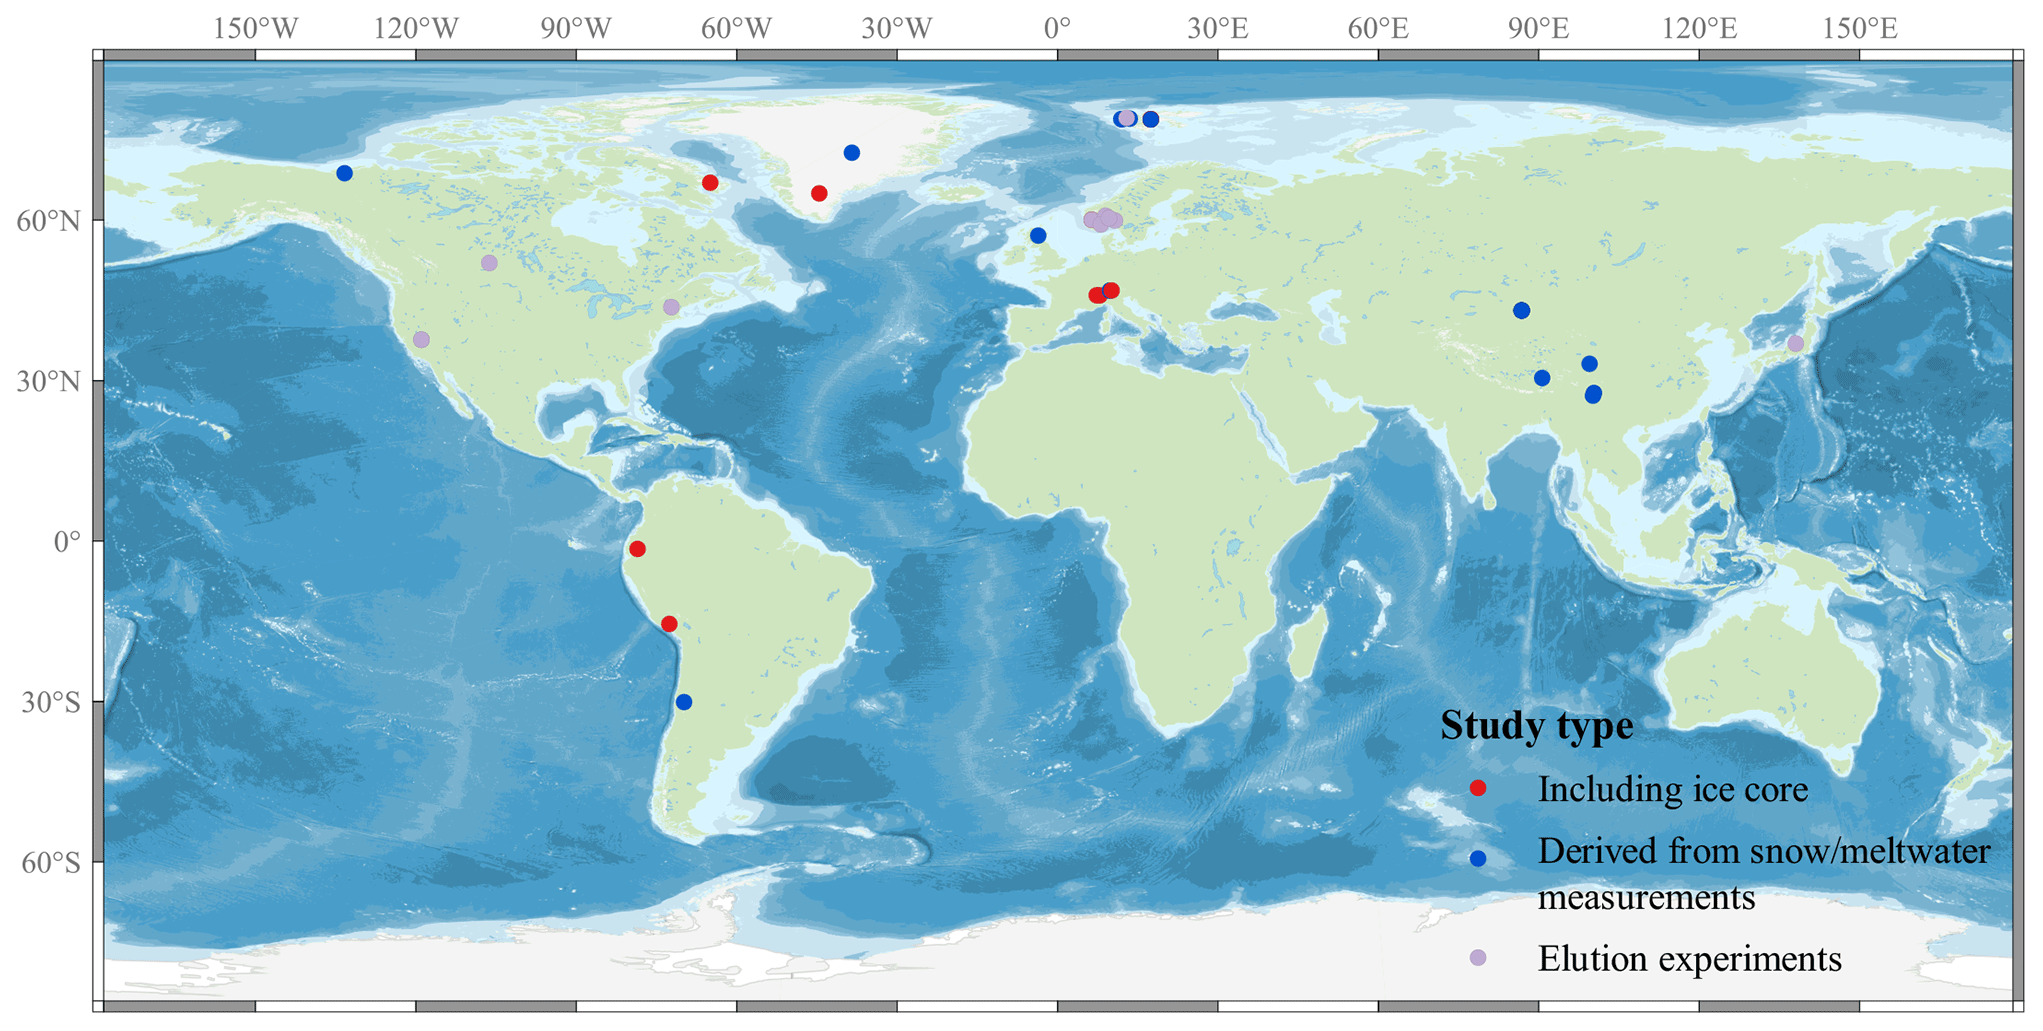
Figure 4Overview of the study sites, where the effects of melting on major ion chemistry have been investigated using ice cores (red), snow and meltwater measurements in the field (blue), and elution experiments in the laboratory and field (light purple).
The elution sequences presented in Table 1 have been obtained from natural and synthetic snow and ice samples in field and laboratory experiments, e.g. lysimeter measurements, at various sites as well as from modelling approaches (Fig. 4). Related to the different sites and study conditions and to the sample material of varying age and composition, there is partial disagreement in the exact position of ions in the sequence. Nevertheless, sulfate and calcium tend to be among the ions eluted more quickly, while fluoride, chloride, and ammonium appear to be more stable (Table 1, Fig. 5). Since snow has been shown to reveal no chromatographic properties, this is not due to a potential retention of latter species in the snow and firn with respect to former ones during elution (Cragin et al., 1996; Hewitt et al., 1989; Tranter et al., 1986). Instead, several other factors shaping the elution sequences of different major ions and other chemical species have been identified.
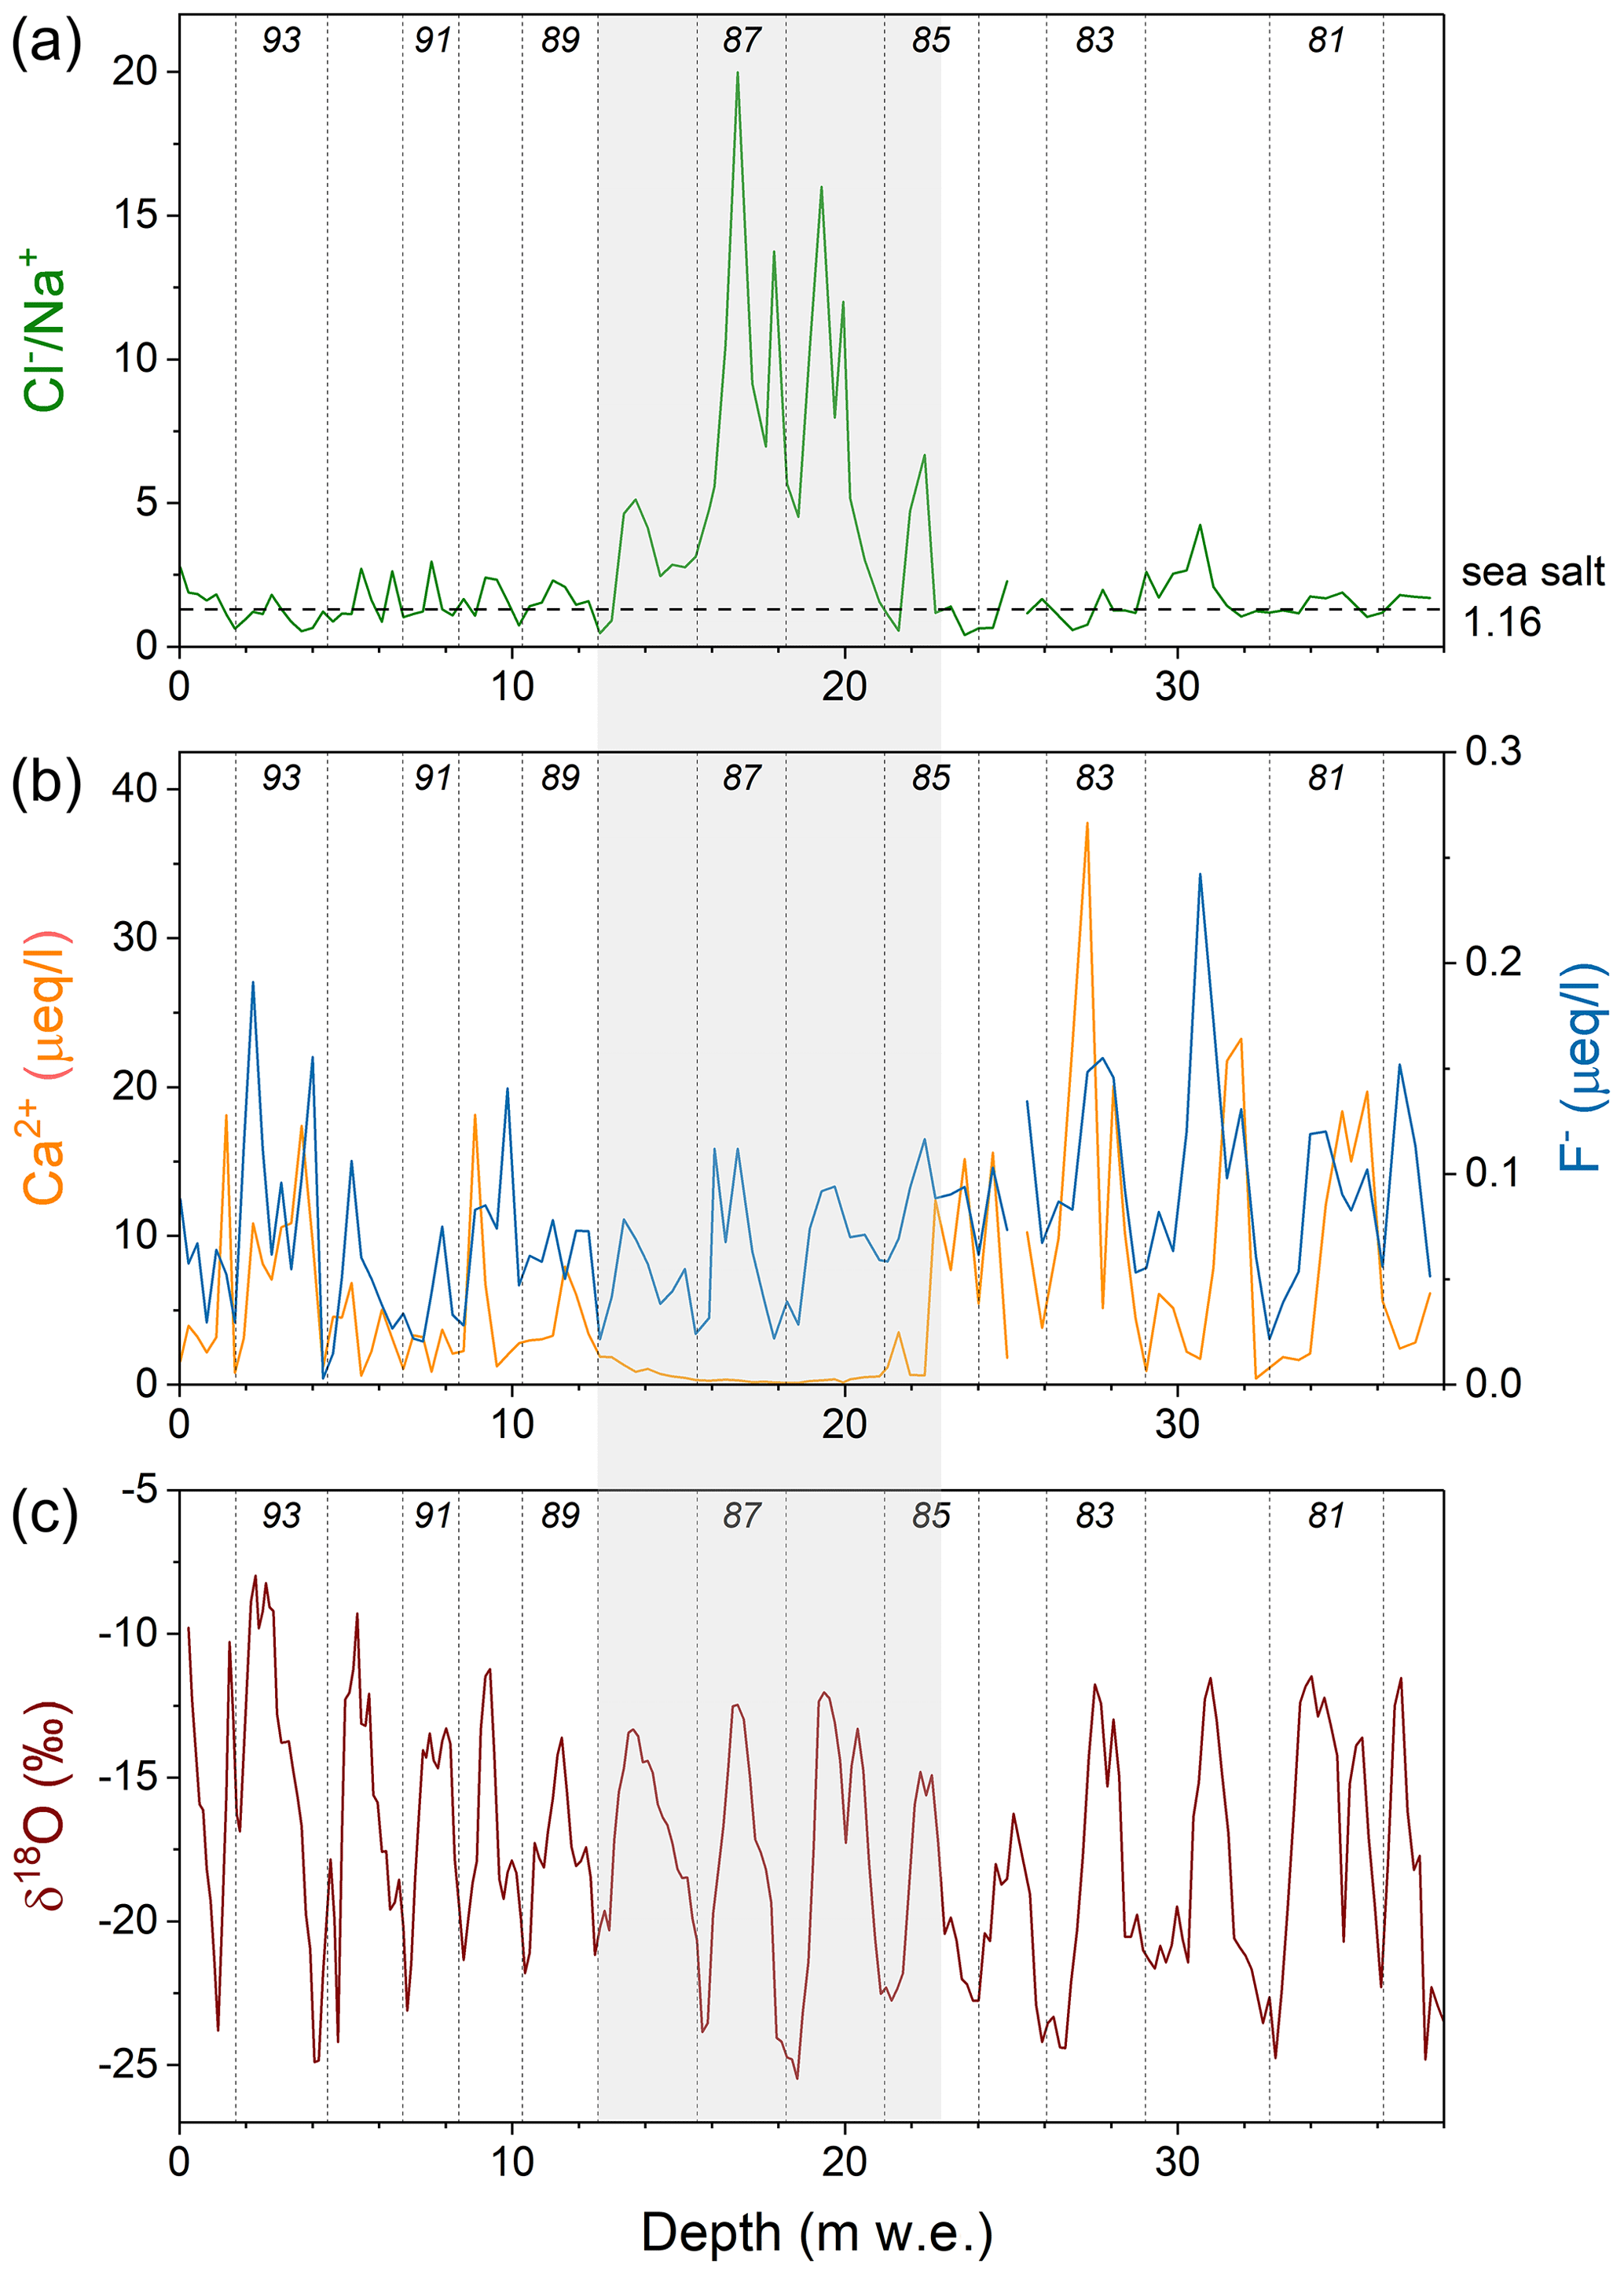
Figure 5Records of the ratio (green), Ca2+ (orange) and F− (blue) concentrations, and δ18O (brown) within the upper 38 m w.e. of an ice core from the Grenzgletscher (Swiss Alps, Eichler et al., 2001), covering the time period 1980–1994 (individual years are indicated with dotted lines): meltwater inflow through a crevasse system led to (a) high ratios, exceeding the sea-salt ratio (1.16, dashed line) in the melt-disturbed range (grey background) and (b) preferential elution of Ca2+ compared to F−, with the latter still showing well-preserved concentration seasonality in the depth range ∼ 12–23 m w.e., (c), whereas δ18O is mainly undisturbed. Observations suggest a lack of refreezing of the percolating meltwater but drainage along the firn–ice transition.
The primary determining factor in the behaviour of impurities during elution is their solubility in water (Meyer and Wania, 2011; Fig. 6) and ice (Avak et al., 2019). High solubility in ice, e.g. observed for F−, Cl−, and NH, allows for chemical species to be incorporated into the ice lattice during snow metamorphism and thereby reduces their availability to meltwater elution (Cragin et al., 1996; Trachsel et al., 2019; Eichler et al., 2001), while high solubility in water enhances their mobility during melt events. Insoluble micro-particles are less affected by displacement to deeper layers of the snowpack and can show melt-induced peaks at former surfaces (Koerner, 1997, 1977b). Meyer and Wania (2011) modelled the elution behaviour of organic compounds from a homogeneous snowpack and distinguished four elution types (Fig. 6): (a) impurities strongly soluble in water are released quickly after melt onset, (b) particulate matter and surface-adsorbed impurities elute last, (c) meltwater concentrations of species that are partly water-soluble and partly sorbed to ice grain surfaces increase gradually with melt duration, and (d) bimodal impurities that can behave both like the dissolved type (a) and particulate type (b), showing peak concentrations at the beginning and end of the snowmelt season.
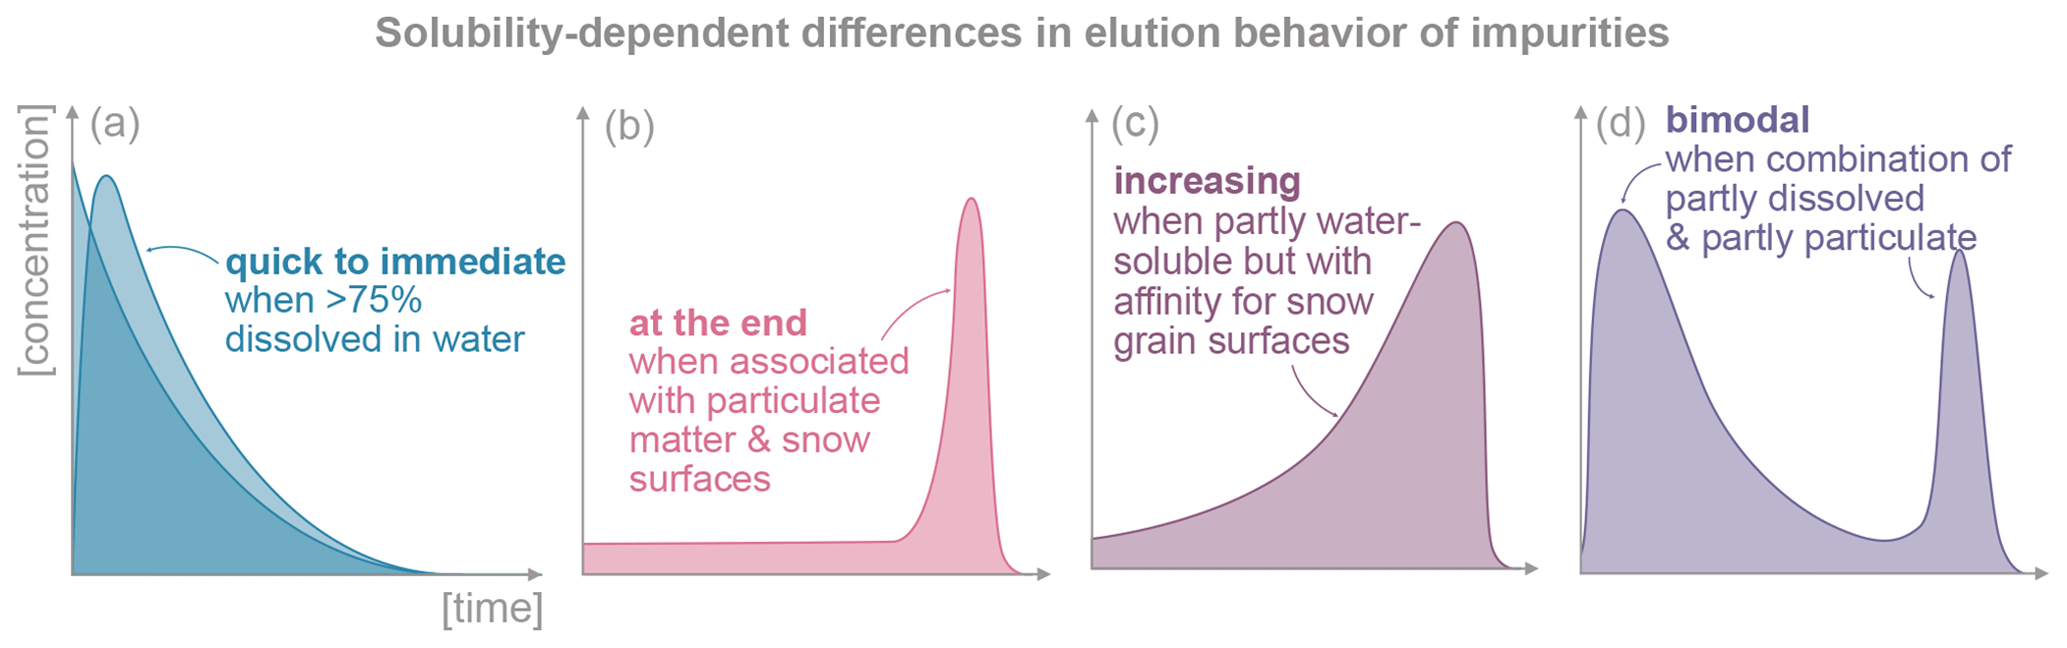
Figure 6Differences in behaviour during melt elution of (a) water-soluble impurities, (b) particle-bound matter, (c) species that are partly water-soluble and partly sorbed to ice grain surfaces, and (d) impurities combining the dissolved type (a) and particulate type (b). This is a schematic summary based on modelling of organic compounds during melt by Meyer and Wania (2011).
In addition to their solubility in water and ice, (1) snow characteristics prior to melting, (2) snow metamorphism, and (3) the character of the melt process itself can subordinately influence the elution behaviour of impurities (Fig. 7).
Initially, precipitation formation or atmospheric scavenging processes influence the chemical composition of the snow and its absolute ion concentrations and thus the impurity behaviour during elution. The initial position of impurities within the ice–air matrix depends on whether they act as condensation nuclei during snow crystal formation (placed within crystals) or are scavenged and found in the exterior of snow grains (Tsiouris et al., 1985; Trachsel et al., 2019). However, even ions that have been deposited together like Na+ and Cl− (sea-salt aerosol) showed partially different behaviour during leaching (Eichler et al., 2001), and metamorphism subdues this factor post-depositionally. Since only a certain number of impurities can be incorporated into the ice lattice, absolute concentrations affect the number of ions placed at grain boundaries, where they are more available to interaction with meltwater (Fig. 7, right – 1). Less abundant (partially) water-soluble trace elements appear to be more stable than the ones with higher absolute concentrations (Avak et al., 2019, 2018; Li et al., 2006).
The physical location of impurities within the ice matrix is relevant beyond the initial position and undergoes changes with ageing during snow metamorphism (Fig. 7, right – 2; Kuhn, 2001; Moore et al., 2005; Pohjola et al., 2002; Trachsel et al., 2019; Tsiouris et al., 1985). Earlier studies suggest that diurnal melt–freeze cycles generally enhance the availability of ions to leaching during percolation (Johannessen and Henriksen, 1978; Goto-Azuma et al., 1994). However, it has been shown that rearrangement behaviour during metamorphism differs among impurities (Hewitt et al., 1989; Trachsel et al., 2019; Cragin et al., 1996), mainly depending on their solubility in ice (Avak et al., 2019; Eichler et al., 2001). For ions, this solubility in ice is influenced by their size and charge (Moore and Grinsted, 2009) but also by the capability to form volatile compounds, which is e.g. significant for Cl−, F−, NO, and NH (Eichler et al., 2001; Li et al., 2006). On this basis, Cl−, NH, and F− tend to be incorporated into the ice matrix during advancing metamorphism (Eichler et al., 2001; Ginot et al., 2010; Moore et al., 2005; Trachsel et al., 2019), whereas SO and Ca2+ tend to be excluded and are more readily available to meltwater relocation. The effect of metamorphism on the preservation or loss of ions in the snowpack becomes increasingly apparent with longer duration of metamorphism (Cragin et al., 1996; Trachsel et al., 2019; Brimblecombe et al., 1987).
Furthermore, the temperature-gradient metamorphism conditions, especially absolute (diurnal mean) air temperatures and their diurnal variability (Virkkunen et al., 2007; Li et al., 2006), distinguish between constructive and deconstructive metamorphism, influence the near-surface snow grain shape, and indirectly constrain the availability of impurities at grain boundaries through the snow surface area (Fig. 7, right 2). Constructive metamorphism leads to hoar and faceted crystals with a higher specific surface area, and the solubility-driven separation between the interior and exterior of a snow grain is less effective than during deconstructive metamorphism in rounded grains (Cragin et al., 1996). A temperature gradient is generally necessary to achieve recrystallisation rates that lead to significant chemical re-arrangement (Trachsel et al., 2019).
Differences in meltwater flow type, melt rate, addition of rain on snow, and snow structure make the character of the melt event itself a shaping factor in the elution behaviour of ions (Fig. 7, right 3). Costa and Pomeroy (2019) documented that preferential flow paths speed up the release of SO and NO from the snowpack. A slower melt rate leads to higher ionic pulses (Davis et al., 1995), because it allows for longer interaction with and leaching of the snow. Similarly, melt events without rain on snow appear to be more efficient in eluting SO and NO, because PFPs developing under these circumstances result from microscale flow structures (Tranter et al., 1992; Costa and Pomeroy, 2019) that differ from hydrologically constrained PFPs during rain-on-snow events. Furthermore, the snow texture (e.g. specific surface area, SSA) strongly affects the hydrological permeability, and less to impermeable layers can lead to the retaining and refreezing of ion-enriched meltwater within the profile (Pfeffer and Humphrey, 1996).
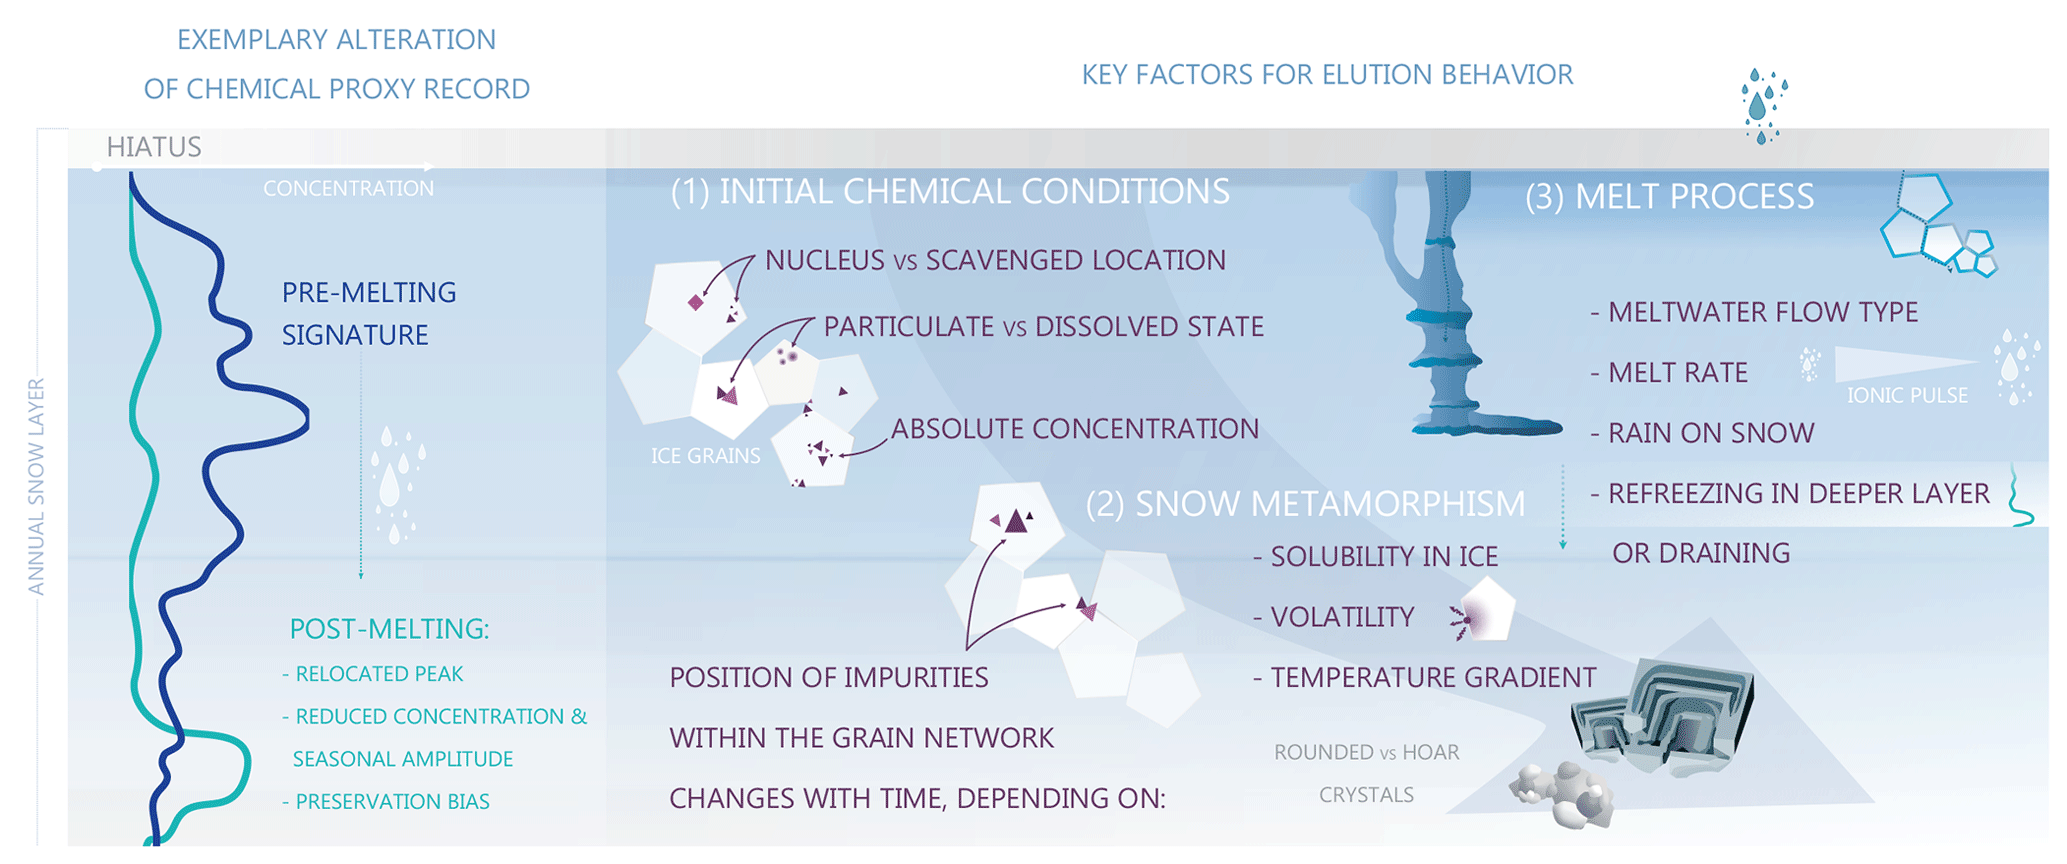
Figure 7Schematic display of issues associated with melt-affected ice-core chemistry using a qualitative drawing (left), and key factors in the elution behaviour of impurities (right) include (1) initial chemical conditions of the deposited snow, (2) segregation of impurities during snow metamorphism, and (3) the melt process itself.
Melt-induced alteration of chemical ice-core proxy records has further been assessed using ion elution factors (Moore and Grinsted, 2009), ion ratios like (Iizuka et al., 2002; Watanabe et al., 2015) and (e.g. Fig. 5, Eichler et al., 2001), and the dissolved fraction percentage (DFP, Wu et al., 2018; Zhang et al., 2013). Comparing concentrations of a chemical species in a snow layer before and after a melt event is the basis of elution factor quantification (Moore and Grinsted, 2009). The ion ratio approaches indicate melt-affected profile sections based on the differing elution factor of two ions like Mg2+ and Na+, which have a common source at the investigated site. The DFP is defined as
Changes in the preserved ion-to-microparticle ratio of the soluble (Xdis) and insoluble (Xinsol) fractions as formulated in Eq. (3) reflect the intensity of post-depositional alteration through melting when the source and composition of the impurities are homogeneous in a layer prior to melting (Zhang et al., 2013). When compared against DFP values of non-melt-affected parts from the same site, lowered DFP signatures reflect the mobility of dissolved insoluble impurities and the immobility of insoluble impurities during elution (Figs. 6 and 7). Therefore, site-specific influences on the behaviour of chemical species used for the and ion ratios and DFP must be considered. While the elution factor and or ratio calculations are easier in their application, the DFP has the advantage that it can identify gradual stages of elution.
Finally, the question remains to which extent and in which way climate and environmental information is still preserved in melt-affected chemical records. Firstly, dating melt-affected ice cores has proven challenging in locations ranging from alpine (Pavlova et al., 2015; Festi et al., 2021) through to sub-Antarctic sites like Young Island (Moser et al., 2021). In this context, the melt-induced hiatus in the ice-core layering during melt events (Koerner, 1997) is a major issue. If sufficient summer precipitation is altered or removed (Yuanqing et al., 2001), it can lead to a seasonal bias of the net annual layer towards winter accumulation. In addition, the resolution in melt-affected chemical records can be lowered from seasonal to (multi-)annual (Vega et al., 2016; Moore and Grinsted, 2009) due to a reduction in soluble ion concentrations and the amplitudes of seasonal proxies like hydrogen peroxide (Davies et al., 1982; Huber et al., 2020; Moser et al., 2021). Consequently, annual layer counting as a dating approach can be severely hampered in melt-affected soluble impurity records. However, using chemical species less affected by meltwater percolation, such as NH, insoluble trace elements, and particulate records like BC, has already proven valuable for dating melt-affected ice (Avak et al., 2019; Neff et al., 2012; Pavlova et al., 2015). With regard to more confined dating horizons, 137Cs cannot be used due to its melt-induced relocation, but 3H (Pinglot et al., 2003; Van Der Wel et al., 2011) and 210Pb (Gäggeler et al., 2020; Neff et al., 2012) remain viable as dating tools.
Both (1) percolation extent and (2) species-dependent elution behaviour must be considered in order to decide which melt-affected chemical impurity records can still be used for environmental reconstructions and how they can be used.
Elution length determines the preserved resolution of melt-affected chemical impurity records. Annual means of environmental proxies remain suitable where melt is seasonally confined. For example, this is the case at Lomonosovfonna in Svalbard (Pohjola et al., 2002; Moore et al., 2005; Vega et al., 2016), Penny Ice Cap (Grumet et al., 1998), and Combatant Col at Mount Waddington in Canada (Neff et al., 2012). If percolation affects more than one annual layer, multi-year averages are more reliable, e.g. at Severnaya Zemlya in the Eurasian Arctic (Weiler et al., 2005), Holtedahlfonna (Beaudon et al., 2013) or Austfonna in Svalbard (Tarussov, 1992).
Among major ions, vertical concentration profiles of NH, F−, and Cl− are generally better preserved than those of Ca2+ and SO (Table 1). Thus, NH is preferred to SO for reconstructing anthropogenic changes, and Cl− is preferred to Na+ for investigating sea-salt changes. For trace elements (TEs), it has been shown that insoluble, particle-bound TEs are rather immobile (Wong et al., 2013; Gabrieli et al., 2011; Avak et al., 2018, 2019), whereas relocation of water-soluble TEs depends on their absolute concentration levels, with ultra TEs being better preserved. Thus, past changes in dust input can be established more reliably using rare-earth elements (REEs) instead of Ba, Mg, or Ca records. Pb, Cu, Sb, and Ag are still applicable for anthropogenic reconstructions, whereas Cd and Zn are less reliable proxies. Looking at organic species, the few available studies show widely differing responses to meltwater input, depending on whether the organic material consists of dissolved, hydrophobic, or adsorbed species (Schöndorf and Herrmann, 1987; Meyer and Wania, 2011; Simmleit et al., 1986). For example, polychlorinated biphenyls lean towards relocation (Pavlova et al., 2015), and of the selected monocarboxylic and dicarboxylic acids and α-carbonyls, only methylglyoxal showed potential as a better-preserved organic aerosol proxy in melt-affected records (Müller-Tautges et al., 2016). Regarding particulate impurities like BC (and pollen), preserved annual cycles in temperate glaciers suggest that BC and pollen can still provide an important environmental proxy, even under strong melting conditions (Pavlova et al., 2015; Festi et al., 2021; Takeuchi et al., 2019). Consequently, BC appears to be more suitable, e.g. for reconstructing the forest-fire history compared to organic fire proxies prone to leaching such as P-hydroxybenzoic acid (Müller-Tautges et al., 2016).
It must be noted that the observed meltwater persistence of certain species at one location is not directly transferrable to ice-core archives from other sites (e.g. Table 1). Since the impurity response to post-depositional melting processes is shaped by numerous factors, like impurity concentrations, chemical composition, mineralogy, or amount of meltwater, it may vary between remote and polluted regions, different climate conditions, or with the distance to deserts and oceans. Thus, the preservation of chemical species, in each case, requires site-specific assessment.
3.3 Stable water isotope (SWI) signatures affected by melt
Isotopic fractionation is fundamental to the interpretation of stable water isotopes (Gat, 1996) as climate proxies in ice cores, and an extensive body of ice-core scientific literature starting with the pioneering work by Dansgaard (1964) exists on this topic. Here, we solely discuss alterations of SWI through melting and refreezing, because the fractionation of heavier and lighter isotopes takes place during phase changes, so that melting and refreezing in the snowpack play a significant role (Koerner et al., 1973). Due to isotopic exchange between liquid water and the surrounding ice matrix, the linear slope between the abundance of δ18O and δ2H is considered altered (Ham et al., 2019; Lee et al., 2020). While normally displaying a slope of 8, it is often lowered in melt-affected ice (Souchez and Jouzel, 1984). For this reason, melt-affected SWI signatures have been considered biased (Moran and Marshall, 2009; Koerner et al., 1973), i.e. enriched in heavy isotopes 18O and 2H. The presence of liquid water further leads to smoothing of the stable water isotopic records in snow pits and ice cores (Nye, 1998; Kang et al., 2008; Matsuoka and Naruse, 1999), “with the degree of smoothing dependent on the amount of melting and percolation” (Pohjola et al., 2002; Arnason et al., 1973). Another effect of percolation frequently discussed is the redistribution of isotopic signatures into deeper layers, which causes the mixing of signatures from different seasons (Koerner, 1997; Fig. 7). Both altered fractionation and signal percolation can lead to an amplitude reduction or entire loss of the seasonal cycle preserved in stable water isotope ratios like δ18O (Rempel et al., 2001; Moran and Marshall, 2009; Yuanqing et al., 2001; Shiraiwa et al., 2002).
The preservation of deposited isotopic signatures depends on the interplay of various factors and remains a subject of research. If percolation is mainly pore flow and leaves the ice matrix intact, for example when the liquid–ice contact time is short, the SWI signal is less affected. Percolation depth is another important factor in δ18O preservation, as melting and refreezing limited to the surface leads to distinct ice layers (Sects. 2.2 and 3.1), which can act as impermeable barriers for diffusion caused by movement of water vapour (Van Der Wel et al., 2011). The study argues that ice cores affected by short-term melt and refreezing events, which divide the snow column into separate pore spaces, could exhibit more reliable stable water isotope records, because water vapour diffusion between the spaces is prohibited.
Several studies from SWI records at melt-affected sites proved to reliably record past temperature changes with seasonal resolution, e.g. in the Swiss Alps (Eichler et al., 2001; Fig. 5) and Patagonia (Schwikowski et al., 2013), or at annual resolution, e.g. in Canada (Neff et al., 2012), Svalbard (Pohjola et al., 2002; Van Der Wel et al., 2011), and Siberian Altai (Okamoto et al., 2011). Where percolation is not restricted to annual layers, multi-year averages could still be used. For example, long-term (>5-year) climate variability is currently still preserved at Holtedahlfonna, Svalbard, despite seasonal variability being lost (Spolaor et al., 2024). When considering millennial-scale features, the δ18O ratios in a melt-affected part of the North Greenland Eemian Ice Drilling (NEEM) ice core seem unaffected (NEEM community members, 2013). By contrast, at Quelccaya Ice Cap in Peru, strong meltwater-related smoothing of the annual signal and an increase in the SWI ratios between two cores drilled in 1976 and 1991 has been observed, rendering the reconstruction of past temperature from SWI ratios impossible at this site (Thompson et al., 1993). Similarly, severe smoothing issues and loss of δ18O as a dating tool and climate proxy have been reported at Hielo Patagónico Norte, South America (Matsuoka and Naruse, 1999), and numerous other low-latitude high-altitude glaciers (Thompson et al., 2021, and references therein). The recent study by Spolaor et al. (2024) highlights how intensifying melt has gradually degraded the SWI records from Holtedahlfonna, Svalbard, over the course of less than a decade. Thus, the reliability of SWI records from melt-affected ice cores as climate proxies is strongly dependent on the study site and progressing melt conditions.
3.4 Gas records affected by melt
Atmospheric air entering the snow at the surface diffuses through the snow and firn reaching the bottom of the firn column much more quickly than snow of the same age. In the so-called lock-in zone, the pore space within the firn closes off, thereby trapping the air at 50–100 m below the snow surface, depending on local conditions (Neff, 2014). This leads to an absolute age difference between the ice and gas phases, commonly referred to as delta age (Schwander and Stauffer, 1984), which depends on the vertical compaction of the firn column, mainly a function of snow accumulation at the surface, and can range from decades for higher accumulation sites to many millennia for the East Antarctic Plateau (Veres et al., 2013; Bazin et al., 2013; Buizert et al., 2015).
In contrast to the chemical parameters discussed in Sect. 3.3, samples of atmospheric air trapped in tiny bubbles in the ice matrix are only indirectly affected by melt. The influence of melt layers in the firn column on the movement of air and bubble enclosure characteristics remains poorly understood (Keegan et al., 2019, 2014; Trudinger et al., 1997). Assuming that melt layers behave similarly to (very) dense layers of firn, published research on gas diffusion in non-melt-affected firn suggests the following:
-
Discontinuous melt layers may act as a vertical barrier and enhance horizontal air flow, thereby potentially reducing the effects of gravitational settling (Birner et al., 2018; Craig et al., 1988). However, in non-extreme cases, melt lenses likely cannot completely prohibit air diffusion.
-
Frequent melt layers may leave a lasting effect on firn metamorphism (Keegan et al., 2019), potentially changing the pore volume and increasing the height of the lock-in zone. The latter would cause younger air to be trapped earlier, leading to a decrease in the mean age of the trapped air. That is, it may widen the gas age distribution in closed bubbles (Mitchell et al., 2015).
Focusing on the gases contained, melt layers differ from non-melt-affected ice found below the lock-in zone in three important ways. Most importantly, air is dissolved in the meltwater following Henry's law. Depending on the speed of refreezing, not all of these gases will degas, and some fraction will remain trapped in the refrozen melt feature. The relative amount fractions of key gas species used for palaeoclimatic reconstructions, including carbon dioxide (CO2), methane (CH4), and the noble gases argon (Ar), krypton (Kr), and xenon (Xe), increase by differing amounts relative to the atmospheric levels in liquid water (Neftel et al., 1983; Orsi et al., 2015; Ahn et al., 2008). In a melt layer, the CO2 amount fraction may increase by up to 2 orders of magnitude relative to the atmospheric amount fraction with equilibrium levels at ≥16 000 ppm at 0 °C (Ahn et al., 2008; Weiss, 1974), so even trace amounts of melt have the potential to significantly alter atmospheric CO2 reconstructions. Note that, over centuries to many millennia, the gas trapped in the melt layer will slowly diffuse into the surrounding layers of firn and ice driven by a large concentration gradient and alter the composition of trapped air once the melt layer has passed the lock-in zone, thereby also altering the gas composition in the surrounding ice on the centimetre scale (Ahn et al., 2008). The same issue of gas dissolution is encountered during wet extraction commonly used for CH4 amount fraction measurements and requires a dissolution correction, while the dry-extraction or sublimation methods typically used for CO2 measurements prevent this as no water is present in these cases. The absolute gas concentrations in melt-affected profiles depend on (1) the speed at which melt refreezes, (2) the gas equilibration while passing through the firn column, and (3) the amount of atmospheric air trapped in the melt layers during bubble enclosure (Stauffer et al., 1985).
Secondly, the presence of liquid water may trigger the production of CO2, CH4, and nitrous oxide (N2O) of non-atmospheric origin in the ice, either by acid–carbonate reaction (Delmas, 1993; Tschumi and Stauffer, 2000; Orsi et al., 2015; Ahn et al., 2008), oxidation or biodegradation of organic compounds (Tschumi and Stauffer, 2000; Lee et al., 2020), or microbial production (Lee et al., 2020; NEEM community members, 2013). Together with the solubility-related increase in greenhouse gases, amount fractions as high as 2000 ppm CO2 (Neftel et al., 1983; Ahn et al., 2008), 1200 ppb CH4, and 150 ppb N2O (NEEM community members, 2013) above background levels for Greenlandic ice cores have been reported. The production potential for the Antarctic ice core is much lower due to the overall lower dust deposition but is still sufficient to significantly alter the atmospheric amount fractions (Ahn et al., 2008).
Lastly, total air content (TAC) is often interpreted as driven by, among other effects, the elevation of the glacier surface. That is, higher elevation is associated with lower TAC as the barometric air pressure decreases with altitude (Delmotte et al., 1999; Martinerie et al., 1992). However, a reduced TAC may also be indirectly caused by a melt feature because the presence of impermeable ice, i.e. the refrozen melt layer, has replaced porous firn and thereby lowered the volume of pore space in melt-affected firn in the lock-in zone. This may lead to up to 40 % reduction in TAC (Stauffer et al., 1985), even though this reduction does not seem to be consistent throughout different melt features and ice cores. TAC within a melt layer likely depends on the speed at which the meltwater refreezes, with faster rates being associated with higher TAC due to less time available for degassing of the gas solved in the water phase (NEEM community members, 2013; Orsi et al., 2015; Ahn et al., 2008). Observations from the Greenland NEEM ice core during the Eemian Interglacial show that TAC varies more strongly during warm phases, with more frequent melt events (NEEM community members, 2013).
The effects described above can be used to identify and quantify depth sections affected by melt. While the presence of a melt layer may lead to a major increase in greenhouse gas amount fractions, excessive amounts of greenhouse gases alone are not sufficient to identify melt, because of the potential for in situ production in the absence of liquid water (Tschumi and Stauffer, 2000; Schilt et al., 2010b). Noble gases, on the other hand, are not produced in situ. The solubility of the noble gases Kr and Xe is approximately 2 and 4 times greater than for Ar and has proven to be a sensitive tool for confirming suspected melt in deep sections of the Greenland NEEM ice core (Orsi et al., 2015). Orsi et al. (2015) showed that and of melt-affected depth sections, 44 ± 12 ‰ and 109 ± 34 ‰ (n=6), were significantly higher than the background levels of unaffected ice, 13 ± 2 ‰ and 24 ± 4 ‰. Based on only two samples, Ahn et al. (2008) reported even greater sensitivities for and of melt-affected sections in excess of 100 ‰ and 250 ‰, respectively. If the presence of even small amounts of melt is suspected, a pre-emptive scan of the ice for hidden melt is a sensitive tool. Unfortunately, the necessity of preparing discrete samples, large ice sample requirements (typically 2–3 × 50–60 g), and a limited daily sample throughput of the noble gas method (Orsi et al., 2015) do not allow for a systematic implementation. It should be noted that the noble gas method cannot quantify the melt intensity.
Aside from noble gases, low TAC could be interpreted as an indicator of melt, as has been suggested based on TAC simulation (Plach et al., 2021; Vudayagiri et al., 2018). However, this method requires evidence of a significant TAC decrease for visible melt layers for the studied ice core, and the TAC for melt layers may be very similar to non-melt-affected ice (Orsi et al., 2015).
So far, only two lower-elevation Antarctic ice cores with small amounts of melt have been used for gas reconstructions. Firstly, the Law Dome ice core was drilled on an isolated dome at 1370 m above sea level close to the continental edge of East Antarctica and contains ≤5 melt layers (Etheridge et al., 1996; Trudinger et al., 1997). Secondly, the Siple Dome ice core is located on the West Antarctic Ice Sheet at an altitude of 620 m and shows numerous melt layers (Ahn et al., 2004; Ahn and Brook, 2014; Das and Alley, 2005). Visible melt layers have been avoided during sampling for gas reconstructions for both ice cores. According to Ahn et al. (2004), the possibility can further not be excluded that the observed absolute offsets between CO2 measurements from Siple Dome relative to EPICA Dome C may stem from in situ production.
Though melt layers are less rare in Greenland (Chappellaz et al., 1997; Neftel et al., 1983; NEEM community members, 2013; Alley and Anandakrishnan, 1995), ice cores from central Greenland have been used for gas reconstructions (Blunier and Brook, 2001; Schilt et al., 2010a). In such high-altitude ice cores, the occurrence of melt features is likely limited to the Holocene and Last Interglacial warm periods, and records covering the Last Glacial are affected to a lesser extent. However, CO2 reconstructions from Greenland are considered unreliable due to significant in situ production of non-atmospheric CO2, which takes place in the ice sheet over time, even in the absence of liquid water (Tschumi and Stauffer, 2000).
3.5 Current applications of melt layers as proxies
The primary application of melt layers in ice cores is as qualitative and quantitative temperature proxy (Kameda et al., 1995; Alley and Anandakrishnan, 1995; Okamoto et al., 2011). It is based on the non-linear relationship between the frequency and thickness of melt features and temperatures above freezing and has led to melt-temperature records from alpine to polar sites (Das and Alley, 2008; Fujita et al., 2021; Abram et al., 2013). Comparisons between melt layer and δ18O records (Grumet et al., 2001; Koerner et al., 1973; Henderson et al., 2006) and nearby weather stations and reanalysis data (Fujita et al., 2021) have been used to show the coherence of derived temperature records. Thereby, it has been noted that the occurrence of melt features depicts complex dynamics at any ice-core site (Alley and Anandakrishnan, 1995). While melt is assumed to reflect summer temperature conditions rather than annual mean temperature (Koerner and Fisher, 1990; Koerner, 1977a; Herron et al., 1981), the relevance of winter melt events is not to be underestimated for alpine to coastal polar sites (Zheng et al., 2020), especially since winter temperatures are rising more quickly than summer temperatures at mid-latitude and Arctic sites (Graham et al., 2017). An increasing number of melt layers can be caused by (a) an absolute temperature rise during one or several seasons of the year, (b) enhanced variability of temperatures during at least one season, or (c) a combination of both (Das and Alley, 2008). Changes in external parameters like the elevation of ice cap surfaces can also affect the local climate and melt conditions (Das and Alley, 2008; Fig. 2). Furthermore, the near-surface and subsurface firn conditions affect the prominence of melt features, with melt layers appearing more distinctly in cold firn than in homogeneously wetted, temperate firn (see Sects. 2.2 and 3.1). All factors discussed in Sect. 2 affect the frequency and thickness of melt features and are helpful context for quantitatively interpreting melt layer profiles. Against this background, certain sites and glacier facies like the lower accumulation zone, where melting occurs but does not percolate through the entire annual layer, are more sensitive to the melt threshold and therefore more suitable sites for melt records than others (Abram et al., 2013). Given the uncertainty induced by percolation, Westhoff et al. (2022) have cautioned against the interpretation of melt layer profiles as annually resolved temperature proxy records and recommended ≥10-year averages. Using the dependency of melt occurrence on warm temperatures, Okamoto et al. (2011) were also able to show that the melt feature percentage correlates with the terminus retreat rate of a neighbouring glacier.
Besides the simple occurrence of melt layers, significant potential lies in the structural characteristics of melt features as proxies for environmental conditions. Based on the physics of melt layer formation, structural characteristics of melt features are expected to differ dependent on the meteorological setting and local climate, which leave an imprint on the near-surface snow (Fig. 3). Early studies have shown that warm summers were characterised by coarser-grained superimposed ice than colder summers with fine-grained firn (Koerner, 1970; Koerner et al., 1973). Future studies of melt-affected ice cores could describe the structural variability of melt features in ice cores in greater detail and thereby provide new insights into the processes shaping melt features.
Another emerging research area comes from the relationship between forest fires, consequential BC dust distribution, and enhanced glacier melt (Keegan et al., 2014; Kaspari et al., 2015). Given that BC is a reliable tracer of forest fires, even in melt-affected areas (Osmont et al., 2020), comparing BC and melt feature records could reveal new aspects for interpreting melt features as proxies.
Global temperature is rising and melting will affect a growing number of alpine to polar ice-core drilling locations, more frequently, at higher elevations and further inland. For this reason, we have conducted a literature review, bringing together snow physics, firn hydrology, and ice-core proxy research to study melt-affected ice cores.
Melt events are driven by local to global meteorology and climate, glacier surface characteristics like the albedo, and hydro-thermal conditions of the snow and firn column. Melting and refreezing are governed by the surplus of energy available and follow approximately the 0 °C isotherm. Identification of melt layers usually takes place either manually during ice-core processing, discriminating between melt-affected and unaffected firn sections, or using digital line scanning, which provides higher-resolution insights into melt characteristics. Approaches like this show the diverse structural imprints of snowmelt on the ice–air matrix, ranging from homogeneously wetted horizons to distinct melt layers and preferential flow fingers. Those develop depending on the dynamic interplay of atmosphere and subsurface conditions and have potential as environmental proxies.
Preferential elution is the primary issue of melt-affected ice-core chemistry. Dominated by solubility of the impurities in water and ice, a multitude of factors, including snow chemistry before melting, metamorphism, and meltwater flow conditions, determines the availability of impurities to relocation or removal during melt events. Thus, the preservation of chemical species strongly differs with the study site. Where significant amounts of liquid water are present, the fractionation slope for stable water isotopes () is reduced, and affected records often show an amplitude reduction in the seasonal cycle, biased values, and smoothing of the signal. Altered total air content and gas concentrations must be considered for melt-affected gas records in ice cores.
Despite these limitations of melt-affected ice cores, melt layers have been successfully applied as qualitative (above 0 °C) and quantitative temperature proxies (using MFP as an indicator of surface temperature). Approaches ranging from using ion ratios (e.g. ) and the dissolved fraction percentage in the upper ice column to noble gases xenon and krypton in deep ice help to identify the extent of ice profiles affected by melting and refreezing.
Our literature study shows that melting poses both challenges and potential for ice-core interpretation and dating approaches and also that the diversity of melt features and effects is of interest for comprehensive and site-specific investigation. Learning from the advances of alpine ice-core science, the following adaptations have been shown to be helpful in ensuring high-quality ice-core research under warming conditions.
-
(Re-)assessing the thermal and hydrological conditions of the subsurface prior to drilling helps to direct ice-core analysis to predominantly cold, poly-thermal, or temperate ice.
-
Sampling fresh (near-)surface snow throughout the seasonal cycle aids establishing a baseline of impurity levels prior to melting, and in situ snowmelt infiltration experiments using dye can be used to parameterise relocation depth site-specifically.
-
High-resolution structural analysis of ice cores (e.g. line scanning), more detailed melt logs including feature characteristics, and systematic assessments of melt indicators (e.g. DFP, ion ratio) provide useful context to better understand chemical records.
-
Prioritisation of impurities less mobile during melt events like ammonium, BC, insoluble and low-abundance (partially) water-soluble trace elements as dating tools and environmental proxies and use of multi-year averages where melt percolates beyond an annual layer lead to more reliable environmental reconstructions.
With this review, we contribute to a growing body of literature aiming to foster a comprehensive understanding of signal formation in ice cores and to improve their climatic interpretations. We hope to raise awareness among (polar) ice-core researchers about melt features in ice cores, how to identify and investigate them in greater detail, and how to gauge the limitations and potential of melt-affected profiles for ice-core climate reconstructions.
As no new data were created for this literature review, data availability is not applicable to this article. Figure 4 was made with Natural Earth. Figure 5 was made using data from Eichler et al. (2001).
The supplement related to this article is available online at: https://doi.org/10.5194/tc-18-2691-2024-supplement.
DEM and ERT conceptualised the study. DEM organised the project and conducted the literature analysis fundamental to this study. ERT and EW supervised the project. DEM prepared the initial draft, and all the co-authors contributed to reviewing and editing the manuscript, including the figures.
The contact author has declared that none of the authors has any competing interests.
Publisher’s note: Copernicus Publications remains neutral with regard to jurisdictional claims made in the text, published maps, institutional affiliations, or any other geographical representation in this paper. While Copernicus Publications makes every effort to include appropriate place names, the final responsibility lies with the authors.
The authors wish to thank Margit Schwikowski, who was consulted and who provided experienced external advice for Sect. 3.2 on melt-affected chemistry records. The authors would also like to acknowledge the editorial support from Kerim Nisancioglu and thank Veijo Pohjola and an anonymous reviewer for their valuable suggestions. The melt layer images used in Fig. 1a and i have been reprinted from J. Glaciol., and the melt layer image in Fig. 1f has been reprinted from the Annals of Glaciology with the permission of the International Glaciological Society. The image used in Fig. 1d is reprinted from Global and Planetary Change Volumes 84–85 (Fisher et al.). Recent melt rates of Canadian Arctic ice caps are the highest in 4 millennia, 3–7 (2012), with permission from Elsevier. The melt layer sequence in Fig. 1h is reprinted from Nature Geoscience Volume 6 (Abram et al.). Acceleration of snowmelt in an Antarctic Peninsula ice core during the 20th century, 404–411 (2013), with permission from Springer Nature.
Dorothea Elisabeth Moser was supported by BAS Cambridge and the NERC C-CLEAR Doctoral Training Programme (grant no. NE/S007164/1). Elizabeth R. Thomas received core funding from NERC to the British Antarctic Survey's Ice Dynamics and Palaeoclimate programme. Eric Wolff is supported by a Royal Society Professorship.
This paper was edited by Kerim Nisancioglu and reviewed by Veijo Pohjola and one anonymous referee.
Abram, N. J., Mulvaney, R., Wolff, E. W., Triest, J., Kipfstuhl, S., Trusel, L. D., Vimeux, F., Fleet, L., and Arrowsmith, C.: Acceleration of snow melt in an Antarctic Peninsula ice core during the twentieth century, Nat. Geosci., 6, 404–411, https://doi.org/10.1038/ngeo1787, 2013.
Ahn, J. and Brook, E. J.: Siple Dome ice reveals two modes of millennial CO2 change during the last ice age, Nat. Commun., 5, 3723, https://doi.org/10.1038/ncomms4723, 2014.
Ahn, J., Wahlen, M., Deck, B. L., Brook, E. J., Mayewski, P. A., Taylor, K. C., and White, J. W. C.: A record of atmospheric CO2 during the last 40,000 years from the Siple Dome, Antarctica ice core, J. Geophys. Res.-Atmos., 109, D13305, https://doi.org/10.1029/2003JD004415, 2004.
Ahn, J., Headly, M., Wahlen, M., Brook, E. J., Mayewski, P. A., and Taylor, K. C.: CO2 Diffusion in Polar Ice: Observations from Naturally Formed CO2 Spikes in the Siple Dome (Antarctica) Ice Core, J. Glaciol., 54, 685–695, https://doi.org/10.3189/002214308786570764, 2008.
Albert, M., Shuman, C., Courville, Z., Bauer, R., Fahnestock, M., and Scambos, T.: Extreme firn metamorphism: impact of decades of vapor transport on near-surface firn at a low-accumulation glazed site on the East Antarctic plateau, Ann. Glaciol., 39, 73–78, https://doi.org/10.3189/172756404781814041, 2004.
Alimasi, N., Enomoto, H., and Hirasawa, N.: Spatiotemporal variation of ice sheet melting in the Antarctic coastal marginal zone and the influence of ice lenses and rain using satellite microwave observation, Polar Sci., 25, 100561, https://doi.org/10.1016/j.polar.2020.100561, 2020.
Alley, R. B. and Anandakrishnan, S.: Variations in melt-layer frequency in the GISP2 ice core: implications for Holocene summer temperatures in central Greenland, Ann. Glaciol., 21, 64–70, https://doi.org/10.3189/S0260305500015615, 1995.
Arnason, B., Buason, T., Martinec, J., and Theodorsson, P.: Movement of water through snow pack traced by deuterium and tritium, IAHS-AISH P., 107, 299–312, https://iahs.info/uploads/dms/107023.pdf (last access: 16 May 2024), 1973.
Arnold, N. S., Rees, W. G., Hodson, A. J., and Kohler, J.: Topographic controls on the surface energy balance of a high Arctic valley glacier, J. Geophys. Res.-Earth, 111, F02011, https://doi.org/10.1029/2005JF000426, 2006.
Avak, S. E., Schwikowski, M., and Eichler, A.: Impact and implications of meltwater percolation on trace element records observed in a high-Alpine ice core, J. Glaciol., 64, 877–886, https://doi.org/10.1017/jog.2018.74, 2018.
Avak, S. E., Trachsel, J. C., Edebeli, J., Brütsch, S., Bartels-Rausch, T., Schneebeli, M., Schwikowski, M., and Eichler, A.: Melt-Induced Fractionation of Major Ions and Trace Elements in an Alpine Snowpack, J. Geophys. Res.-Earth, 124, 1647–1657, https://doi.org/10.1029/2019JF005026, 2019.
Avanzi, F., Hirashima, H., Yamaguchi, S., Katsushima, T., and De Michele, C.: Observations of capillary barriers and preferential flow in layered snow during cold laboratory experiments, The Cryosphere, 10, 2013–2026, https://doi.org/10.5194/tc-10-2013-2016, 2016.
Banwell, A. F., Datta, R. T., Dell, R. L., Moussavi, M., Brucker, L., Picard, G., Shuman, C. A., and Stevens, L. A.: The 32-year record-high surface melt in 2019/2020 on the northern George VI Ice Shelf, Antarctic Peninsula, The Cryosphere, 15, 909–925, https://doi.org/10.5194/tc-15-909-2021, 2021.
Bazin, L., Landais, A., Lemieux-Dudon, B., Toyé Mahamadou Kele, H., Veres, D., Parrenin, F., Martinerie, P., Ritz, C., Capron, E., Lipenkov, V., Loutre, M.-F., Raynaud, D., Vinther, B., Svensson, A., Rasmussen, S. O., Severi, M., Blunier, T., Leuenberger, M., Fischer, H., Masson-Delmotte, V., Chappellaz, J., and Wolff, E.: An optimized multi-proxy, multi-site Antarctic ice and gas orbital chronology (AICC2012): 120–800 ka, Clim. Past, 9, 1715–1731, https://doi.org/10.5194/cp-9-1715-2013, 2013.
Beaudon, E., Moore, J. C., Martma, T., Pohjola, V. A., Van De Wal, R. S. W., Kohler, J., and Isaksson, E.: Lomonosovfonna and Holtedahlfonna ice cores reveal east-west disparities of the Spitsbergen environment since AD 1700, J. Glaciol., 59, 1069–1083, https://doi.org/10.3189/2013JoG12J203, 2013.
Bell, R. E., Chu, W., Kingslake, J., Das, I., Tedesco, M., Tinto, K. J., Zappa, C. J., Frezzotti, M., Boghosian, A., and Lee, W. S.: Antarctic ice shelf potentially stabilized by export of meltwater in surface river, Nature, 544, 344–348, https://doi.org/10.1038/nature22048, 2017.
Bell, R. E., Banwell, A. F., Trusel, L. D., and Kingslake, J.: Antarctic surface hydrology and impacts on ice-sheet mass balance, Nat. Clim. Change, 8, 1044–1052, https://doi.org/10.1038/s41558-018-0326-3, 2018.
Birner, B., Buizert, C., Wagner, T. J. W., and Severinghaus, J. P.: The influence of layering and barometric pumping on firn air transport in a 2-D model, The Cryosphere, 12, 2021–2037, https://doi.org/10.5194/tc-12-2021-2018, 2018.
Bishop, C. L., Pan, D., Liu, L. M., Tribello, G. A., Michaelides, A., Wang, E. G., and Slater, B.: On thin ice: surface order and disorder during pre-melting, Faraday Discuss., 141, 277–292, https://doi.org/10.1039/B807377P, 2009.
Björkman, M., Zarsky, J., Kühnel, R., Hodson, A., Sattler, B., and Psenner, R.: Microbial Cell Retention in a Melting High Arctic Snowpack, Svalbard, Arct. Antarct. Alp. Res., 46, 471–482, https://doi.org/10.1657/1938-4246-46.2.471, 2014.
Blunier, T. and Brook, E. J.: Timing of Millennial-Scale Climate Change in Antarctica and Greenland During the Last Glacial Period, Science, 291, 109–112, https://doi.org/10.1126/science.291.5501.109, 2001.
Box, J. E., Wehrlé, A., van As, D., Fausto, R. S., Kjeldsen, K. K., Dachauer, A., Ahlstrøm, A. P., and Picard, G.: Greenland Ice Sheet Rainfall, Heat and Albedo Feedback Impacts From the Mid-August 2021 Atmospheric River, Geophys. Res. Lett., 49, e2021GL097356, https://doi.org/10.1029/2021GL097356, 2022.
Brimblecombe, P., Tranter, M., Abrahams, P., Davies, T., and Vincent, C.: Relocation and Preferential Elution of Acidic Solute through the Snowpack of a Small, Remote, High-Altitude Scottish Catchment, Ann. Glaciol., 7, 141–147, https://doi.org/10.3189/S0260305500006066, 1985.
Brimblecombe, P., Clegg, S. L., Davies, T. D., Shooter, D., and Tranter, M.: Observations of the preferential loss of major ions from melting snow and laboratory ice, Water Res., 21, 1279–1286, https://doi.org/10.1016/0043-1354(87)90181-3, 1987.
Brown, J. W., Moser, D. E., Emanuelsson, D. B., and Thomas, E. R.: Visual Stratigraphy-Based Age Scale Developed for the Shallow Mount Siple Firn Core, Antarctica, Geosciences, 13, 85, https://doi.org/10.3390/geosciences13030085, 2023.
Brun, E.: Investigation on wet-snow metamorphism in respect of liquid-water content, Ann. Glaciol., 13, 22–26, https://doi.org/10.3189/S0260305500007576, 1989.
Buizert, C., Cuffey, K. M., Severinghaus, J. P., Baggenstos, D., Fudge, T. J., Steig, E. J., Markle, B. R., Winstrup, M., Rhodes, R. H., Brook, E. J., Sowers, T. A., Clow, G. D., Cheng, H., Edwards, R. L., Sigl, M., McConnell, J. R., and Taylor, K. C.: The WAIS Divide deep ice core WD2014 chronology – Part 1: Methane synchronization (68–31 ka BP) and the gas age–ice age difference, Clim. Past, 11, 153–173, https://doi.org/10.5194/cp-11-153-2015, 2015.
Campbell, F. M. A., Nienow, P. W., and Purves, R. S.: Role of the supraglacial snowpack in mediating meltwater delivery to the glacier system as inferred from dye tracer investigations, Hydrol. Process., 20, 969–985, https://doi.org/10.1002/hyp.6115, 2006.
Chappellaz, J., Brook, E., Blunier, T., and Malaizé, B.: CH4 and δ18O of O2 records from Antarctic and Greenland ice: A clue for stratigraphic disturbance in the bottom part of the Greenland Ice Core Project and the Greenland Ice Sheet Project 2 ice cores, J. Geophys. Res.-Oceans, 102, 26547–26557, https://doi.org/10.1029/97JC00164, 1997.
Clem, K. R., Fogt, R. L., Turner, J., Lintner, B. R., Marshall, G. J., Miller, J. R., and Renwick, J. A.: Record warming at the South Pole during the past three decades, Nat. Clim. Change, 10, 762–770, https://doi.org/10.1038/s41558-020-0815-z, 2020.
Clerx, N., Machguth, H., Tedstone, A., Jullien, N., Wever, N., Weingartner, R., and Roessler, O.: In situ measurements of meltwater flow through snow and firn in the accumulation zone of the SW Greenland Ice Sheet, The Cryosphere, 16, 4379–4401, https://doi.org/10.5194/tc-16-4379-2022, 2022.
Colbeck, S. C.: An Overview of Seasonal Snow Metamorphism, Reviews of Geophysics and Space Sciences, 20, 45–61, https://doi.org/10.1029/RG020i001p00045, 1982.
Conway, H., Gades, A., and Raymond, C. F.: Albedo of dirty snow during conditions of melt, Water Resour. Res., 32, 1713–1718, https://doi.org/10.1029/96WR00712, 1996.
Costa, D. and Pomeroy, J. W.: Preferential meltwater flowpaths as a driver of preferential elution of chemicals from melting snowpacks, Sci. Total Environ., 662, 110–120, https://doi.org/10.1016/j.scitotenv.2019.01.091, 2019.
Cragin, J. H., Hewitt, A. D., and Colbeck, S. C.: Grain-scale mechanisms influencing the elution of ions from snow, Atmos. Environ., 30, 119–127, https://doi.org/10.1016/1352-2310(95)00232-N, 1996.
Craig, H., Horibe, Y., and Sowers, T.: Gravitational Separation of Gases and Isotopes in Polar Ice Caps, Science, 242, 1675–1678, https://doi.org/10.1126/science.242.4886.1675, 1988.
Cuffey, K. and Paterson, W. S. B.: The Physics of Glaciers, 4th edn., Academic Press, Amsterdam, 693 pp., ISBN 9780123694614, 2010.
Culberg, R., Schroeder, D. M., and Chu, W.: Extreme melt season ice layers reduce firn permeability across Greenland, Nat. Commun., 12, 2336, https://doi.org/10.1038/s41467-021-22656-5, 2021.
Cullather, R. I. and Nowicki, S. M. J.: Greenland Ice Sheet surface melt and its relation to daily atmospheric conditions, J. Climate, 31, 1897–1919, https://doi.org/10.1175/JCLI-D-17-0447.1, 2018.
Dansgaard, W.: Stable isotopes in precipitation, Tellus, 16, 436–468, https://doi.org/10.3402/tellusa.v16i4.8993, 1964.
Das, S. B. and Alley, R. B.: Characterization and formation of melt layers in polar snow: observations and experiments from West Antarctica, J. Glaciol., 51, 307–312, https://doi.org/10.3189/172756505781829395, 2005.
Das, S. B. and Alley, R. B.: Rise in frequency of surface melting at Siple Dome through the Holocene: Evidence for increasing marine influence on the climate of West Antarctica, J. Geophys. Res.-Atmos., 113, D02112, https://doi.org/10.1029/2007JD008790, 2008.
Datta, R. T., Tedesco, M., Fettweis, X., Agosta, C., Lhermitte, S., Lenaerts, J. T. M., and Wever, N.: The Effect of Foehn-Induced Surface Melt on Firn Evolution Over the Northeast Antarctic Peninsula, Geophys. Res. Lett., 46, 3822–3831, https://doi.org/10.1029/2018GL080845, 2019.
Davies, T., Vincent, C., and Brimblecombe, P.: Preferential elution of strong acids from a Norwegian ice cap, Nature, 300, 161–163, https://doi.org/10.1038/300161a0, 1982.
Davis, R. E., Petersen, C. E., and Bales, R. C.: Ion flux through a shallow snowpack: effects of initial conditions and melt sequences, IAHS-AISH P., 228, 115, https://iahs.info/uploads/dms/10016.115-126-228-Davis.pdf (last access: 16 May 2024), 1995.
Dell, R. L., Banwell, A. F., Willis, I. C., Arnold, N. S., Halberstadt, A. R. W., Chudley, T. R., and Pritchard, H. D.: Supervised classification of slush and ponded water on Antarctic ice shelves using Landsat 8 imagery, J. Glaciol., 68, 401–414, https://doi.org/10.1017/jog.2021.114, 2021.
Delmas, R. J.: A natural artefact in Greenland ice-core CO2 measurements, Tellus B, 45B, 391–396, https://doi.org/10.3402/tellusb.v45i4.15737, 1993.
Delmotte, M., Raynaud, D., Morgan, V., and Jouzel, J.: Climatic and glaciological information inferred from air-content measurements of a Law Dome (East Antarctica) ice core, J. Glaciol., 45, 255–263, https://doi.org/10.3189/S0022143000001751, 1999.
Dey, R., Thamban, M., Laluraj, C. M., Mahalinganathan, K., Redkar, B. L., Kumar, S., and Matsuoka, K.: Application of visual stratigraphy from line-scan images to constrain chronology and melt features of a firn core from coastal Antarctica, J. Glaciol., 69, 179–190, https://doi.org/10.1017/jog.2022.59, 2022.
Dirmhirn, I. and Eaton, F.: Some Characteristics of the Albedo of Snow, J. Appl. Meteorol. Climatol., 14, 375–379, https://doi.org/10.1175/1520-0450(1975)014<0375:SCOTAO>2.0.CO;2, 1975.
Eichler, A., Schwikowski, M., and Gäggeler, H. W.: Meltwater-induced relocation of chemical species in Alpine firn, Tellus B, 53, 192–203, https://doi.org/10.3402/tellusb.v53i2.16575, 2001.
Elvidge, A. D. and Renfrew, I. A.: The Causes of Foehn Warming in the Lee of Mountains, B. Am. Meteorol. Soc., 97, 455–466, https://doi.org/10.1175/BAMS-D-14-00194.1, 2016.
EPICA Community Members: Eight glacial cycles from an Antarctic ice core, Nature, 429, 623–628, https://doi.org/10.1038/nature02599, 2004.
Etheridge, D. M., Steele, L. P., Langenfelds, R. L., Francey, R. J., Barnola, J. M., and Morgan, V. I.: Natural and anthropogenic changes in atmospheric CO2 over the last 1000 years from air in Antarctic ice and firn, J. Geophys. Res.-Atmos., 101, 4115–4128, https://doi.org/10.1029/95JD03410, 1996.
Faraday, M.: On regelation, and on the conservation of force, The London, Edinburgh, and Dublin Philosophical Magazine and Journal of Science, 17, 162–169, https://doi.org/10.1080/14786445908642645, 1859.
Fegyveresi, J. M., Alley, R. B., Muto, A., Orsi, A. J., and Spencer, M. K.: Surface formation, preservation, and history of low-porosity crusts at the WAIS Divide site, West Antarctica, The Cryosphere, 12, 325–341, https://doi.org/10.5194/tc-12-325-2018, 2018.
Festi, D., Schwikowski, M., Maggi, V., Oeggl, K., and Jenk, T. M.: Significant mass loss in the accumulation area of the Adamello glacier indicated by the chronology of a 46 m ice core, The Cryosphere, 15, 4135–4143, https://doi.org/10.5194/tc-15-4135-2021, 2021.
Fisher, D., Zheng, J., Burgess, D., Zdanowicz, C., Kinnard, C., Sharp, M., and Bourgeois, J.: Recent melt rates of Canadian arctic ice caps are the highest in four millennia, Glob. Planet. Change, 84–85, 3–7, https://doi.org/10.1016/j.gloplacha.2011.06.005, 2012.
Fountain, A. G., Tranter, M., Nylen, T. H., Lewis, K. J., and Mueller, D. R.: Evolution of cryoconite holes and their contribution to meltwater runoff from glaciers in the McMurdo Dry Valleys, Antarctica, J. Glaciol., 50, 35–45, https://doi.org/10.3189/172756504781830312, 2004.
Frezzotti, M., Gandolfi, S., and Urbini, S.: Snow megadunes in Antarctica: Sedimentary structure and genesis, J. Geophys. Res.-Atmos., 107, 4344, https://doi.org/10.1029/2001JD000673, 2002.
Fricker, H. A., Arndt, P., Brunt, K. M., Datta, R. T., Fair, Z., Jasinski, M. F., Kingslake, J., Magruder, L. A., Moussavi, M., Pope, A., Spergel, J. J., Stoll, J. D., and Wouters, B.: ICESat-2 Meltwater Depth Estimates: Application to Surface Melt on Amery Ice Shelf, East Antarctica, Geophys. Res. Lett., 48, e2020GL090550, https://doi.org/10.1029/2020GL090550, 2021.
Fritzsche, D., Schütt, R., Meyer, H., Miller, H., Wilhelms, F., Opel, T., and Savatyugin, L. M.: A 275 year ice-core record from Akademii Nauk ice cap, Severnaya Zemlya, Russian Arctic, Ann. Glaciol., 42, 361–366, https://doi.org/10.3189/172756405781812862, 2005.
Fujita, K., Matoba, S., Iizuka, Y., Takeuchi, N., Tsushima, A., Kurosaki, Y., and Aoki, T.: Physically Based Summer Temperature Reconstruction From Melt Layers in Ice Cores, Earth and Space Science, 8, e2020EA001590, https://doi.org/10.1029/2020EA001590, 2021.
Gabrieli, J., Carturan, L., Gabrielli, P., Kehrwald, N., Turetta, C., Cozzi, G., Spolaor, A., Dinale, R., Staffler, H., Seppi, R., dalla Fontana, G., Thompson, L., and Barbante, C.: Impact of Po Valley emissions on the highest glacier of the Eastern European Alps, Atmos. Chem. Phys., 11, 8087–8102, https://doi.org/10.5194/acp-11-8087-2011, 2011.
Gäggeler, H. W., Tobler, L., Schwikowski, M., and Jenk, T. M.: Application of the radionuclide 210Pb in glaciology-an overview, J. Glaciol., 66, 447–456, https://doi.org/10.1017/jog.2020.19, 2020.
Gat, J. R.: Oxygen and Hydrogen Isotopes in the Hydrological Cycle, Annu. Rev. Earth Planet. Sci., 24, 225–262, https://doi.org/10.1146/annurev.earth.24.1.225, 1996.
Gilbert, E. and Kittel, C.: Surface Melt and Runoff on Antarctic Ice Shelves at 1.5 °C, 2 °C, and 4 °C of Future Warming, Geophys. Res. Lett., 48, e2020GL091733, https://doi.org/10.1029/2020GL091733, 2021.
Ginot, P., Schotterer, U., Stichler, W., Godoi, M. A., Francou, B., and Schwikowski, M.: Influence of the Tungurahua eruption on the ice core records of Chimborazo, Ecuador, The Cryosphere, 4, 561–568, https://doi.org/10.5194/tc-4-561-2010, 2010.
Ginot, P., Chappellaz, J., Barbante, C., Schwikowski, M., and Ohlmann, A.-C.: Ice Memory, EGU General Assembly 2021, online, 19–30 Apr 2021, EGU21-8842, https://doi.org/10.5194/egusphere-egu21-8842, 2021.
Goto-Azuma, K., Nakawo, M., Shimizu, M., Azuma, N., Nakayama, M., and Yokoyama, K.: Temporal changes in chemical stratigraphy of snow cover, Ann. Glaciol., 18, 85–91, https://doi.org/10.3189/s0260305500011307, 1993.
Goto-Azuma, K., Nakawo, M., Jiankang, H., and Watanabe, O.: Melt-induced relocation of ions in glaciers and in a seasonal snowpack, IAHS-AISH P., 223, 287–297, https://iahs.info/uploads/dms/9816.287-297-223-Goto-Azuma.pdf (last access: 16 May 2024), 1994.
Graeter, K. A., Osterberg, E. C., Ferris, D. G., Hawley, R. L., Marshall, H. P., Lewis, G., Meehan, T., McCarthy, F., Overly, T., and Birkel, S. D.: Ice Core Records of West Greenland Melt and Climate Forcing, Geophys. Res. Lett., 45, 3164–3172, https://doi.org/10.1002/2017GL076641, 2018.
Graham, R. M., Cohen, L., Petty, A. A., Boisvert, L. N., Rinke, A., Hudson, S. R., Nicolaus, M., and Granskog, M. A.: Increasing frequency and duration of Arctic winter warming events, Geophys. Res. Lett., 44, 6974–6983, https://doi.org/10.1002/2017GL073395, 2017.
Grumet, N. S., Wake, C. P., Zielinski, G. A., Fisher, D., Koerner, R., and Jacobs, J. D.: Preservation of glaciochemical time-series in snow and ice from the Penny Ice Cap, Baffin Island, Geophys. Res. Lett., 25, 357–360, https://doi.org/10.1029/97GL03787, 1998.
Grumet, N. S., Wake, C. P., Mayewski, P. A., Zielinski, G. A., Whitlow, S. I., Koerner, R. M., Fisher, D. A., and Woollett, J. M.: Variability of Sea-Ice Extent in Baffin Bay over the Last Millennium, Climatic Change, 49, 129–145, https://doi.org/10.1023/A:1010794528219, 2001.
Hahn, L. C., Hofer, S., Parfitt, R., and Ummenhofer, C. C.: Importance of Orography for Greenland Cloud and Melt Response to Atmospheric Blocking, J. Climate, 33, 4187–4206, https://doi.org/10.1175/JCLI-D-19-0527.1, 2020.
Ham, J. Y., Hur, S. Do, Lee, W. S., Han, Y., Jung, H., and Lee, J.: Isotopic variations of meltwater from ice by isotopic exchange between liquid water and ice, J. Glaciol., 65, 1035–1043, https://doi.org/10.1017/jog.2019.75, 2019.
Hanna, E., Jones, J. M., Cappelen, J., Mernild, S. H., Wood, L., Steffen, K., and Huybrechts, P.: The influence of North Atlantic atmospheric and oceanic forcing effects on 1900-2010 Greenland summer climate and ice melt/runoff, Int. J. Climatol., 33, 862–880, https://doi.org/10.1002/joc.3475, 2013.
Hanna, E., Fettweis, X., Mernild, S. H., Cappelen, J., Ribergaard, M. H., Shuman, C. A., Steffen, K., Wood, L., and Mote, T. L.: Atmospheric and oceanic climate forcing of the exceptional Greenland ice sheet surface melt in summer 2012, Int. J. Climatol., 34, 1022–1037, https://doi.org/10.1002/joc.3743, 2014.
Heggli, M., Köchle, B., Matzl, M., Pinzer, B. R., Riche, F., Steiner, S., Steinfeld, D., and Schneebeli, M.: Measuring snow in 3-D using X-ray tomography: Assessment of visualization techniques, Ann. Glaciol., 52, 231–236, https://doi.org/10.3189/172756411797252202, 2011.
Henderson, K., Laube, A., Gäggeler, H. W., Olivier, S., Papina, T., and Schwikowski, M.: Temporal variations of accumulation and temperature during the past two centuries from Belukha ice core, Siberian Altai, J. Geophys. Res.-Atmos., 111, D03104, https://doi.org/10.1029/2005JD005819, 2006.
Herreros, J., Moreno, I., Taupin, J.-D., Ginot, P., Patris, N., De Angelis, M., Ledru, M.-P., Delachaux, F., and Schotterer, U.: Environmental records from temperate glacier ice on Nevado Coropuna saddle, southern Peru, Adv. Geosci., 22, 27–34, https://doi.org/10.5194/adgeo-22-27-2009, 2009.
Herrmann, R. and Kranz, J.: Release of Major Ions and Hydrogen Peroxide from Homogeneous, Melting Snow, Hydrol. Res., 26, 359–368, https://doi.org/10.2166/nh.1995.0020, 1995.
Herron, M., Herron, S., and Langway, C.: Climatic signal of ice melt features in southern Greenland, Nature, 293, 389–391, https://doi.org/10.1038/293389a0, 1981.
Herron, M. M. and Langway, C. C.: Firn densification: an empirical model, J. Glaciol., 25, 373–385, https://doi.org/10.3189/S0022143000015239, 1980.
Hewitt, A. D., Cragin, J. H., and Colbeck, S. C.: Does Snow Have Chromatographic Properties?, in: Proceedings of the 46th Annual Eastern Snow Conference, Quebec City, Quebec, 8–9 June 1989, 165–171, https://static1.squarespace.com/static/58b98f7bd1758e4cc271d365/t/5ce46fd6516d140001ccc7e0/1558474716521/01+A.D.+Hewitt%2C+J.H.+Cragin%2C+S.C.+Colbeck.pdf (last access: 16 May 2024), 1989.
Hirashima, H., Yamaguchi, S., and Katsushima, T.: A multi-dimensional water transport model to reproduce preferential flow in the snowpack, Cold. Reg. Sci. Technol., 108, 80–90, https://doi.org/10.1016/j.coldregions.2014.09.004, 2014.
Hirashima, H., Avanzi, F., and Yamaguchi, S.: Liquid water infiltration into a layered snowpack: evaluation of a 3-D water transport model with laboratory experiments, Hydrol. Earth Syst. Sci., 21, 5503–5515, https://doi.org/10.5194/hess-21-5503-2017, 2017.
Hirashima, H., Avanzi, F., and Wever, N.: Wet-Snow Metamorphism Drives the Transition From Preferential to Matrix Flow in Snow, Geophys. Res. Lett., 46, 14548–14557, https://doi.org/10.1029/2019GL084152, 2019.
Hock, R.: Temperature index melt modelling in mountain areas, J. Hydrol., 282, 104–115, https://doi.org/10.1016/S0022-1694(03)00257-9, 2003.
Hock, R.: Glacier melt: A review of processes and their modelling, Prog. Phys. Geogr., 29, 362–391, https://doi.org/10.1191/0309133305pp453ra, 2005.
Hu, Z., Kuipers Munneke, P., Lhermitte, S., Izeboud, M., and van den Broeke, M.: Improving surface melt estimation over the Antarctic Ice Sheet using deep learning: a proof of concept over the Larsen Ice Shelf, The Cryosphere, 15, 5639–5658, https://doi.org/10.5194/tc-15-5639-2021, 2021.
Huber, C. J., Eichler, A., Brütsch, S., Jenk, T. M., Gabrieli, J., Barbante, C., and Schwikowski, M.: Melting influenced signal preservation at Grand Combin Glacier, in: Laboratory of Environmental Chemistry Annual Report 2020, edited by: Schwikowski, M. and Ammann, M., Paul Scherrer Institut, Villingen, 25–25, https://www.psi.ch/en/luc/annual-reports (last access: 16 May 2024), 2020.
Humphrey, N. F., Harper, J. T., and Pfeffer, W. T.: Thermal tracking of meltwater retention in Greenland's accumulation area, J. Geophys. Res.-Earth, 117, F01010, https://doi.org/10.1029/2011JF002083, 2012.
Humphrey, N. F., Harper, J. T., and Meierbachtol, T. W.: Physical limits to meltwater penetration in firn, J. Glaciol., 67, 952–960, https://doi.org/10.1017/jog.2021.44, 2021.
Iizuka, Y., Igarashi, M., Kamiyama, K., Motoyama, H., and Watanabe, O.: Ratios of in snowpack and an ice core at Austfonna ice cap, Svalbard, as an indicator of seasonal melting, J. Glaciol., 48, 452–460, https://doi.org/10.3189/172756502781831304, 2002.
IPCC: IPCC Special Report on the Ocean and Cryosphere in a Changing Climate, Cambridge University Press, Cambridge, United Kingdom and New York, NY, USA, 755 pp., https://doi.org/10.1017/9781009157964, 2019.
IPCC: Climate Change 2021: The Physical Science Basis. Contribution of Working Group I to the Sixth Assessment Report of the Intergovernmental Panel on Climate Change, edited by: Masson-Delmotte, V., Zhai, P., Pirani, A., Connors, S. L., Péan, C., Berger, S., Caud, N., Chen, Y., Goldfarb, L., Gomis, M. I., Huang, M., Leitzell, K., Lonnoy, E., Matthews, J. B. R., Maycock, T. K., Waterfield, T., Yelekçi, O., Yu, R., and Zhou, B., Cambridge University Press, Cambridge, United Kingdom and New York, NY, USA, 2391 pp., https://doi.org/10.1017/9781009157896, 2021.
Jennings, K. S., Kittel, T. G. F., and Molotch, N. P.: Observations and simulations of the seasonal evolution of snowpack cold content and its relation to snowmelt and the snowpack energy budget, The Cryosphere, 12, 1595–1614, https://doi.org/10.5194/tc-12-1595-2018, 2018.
Johannessen, M. and Henriksen, A.: Chemistry of Snow Meltwater: Changes in Concentration During Melting, Water Resour. Res., 14, 615–619, https://doi.org/10.1029/WR014i004p00615, 1978.
Johannessen, M., Dale, T., Gjessing, E. T., Henriksen, A., and Wright, R. F.: Acid precipitation in Norway: the regional distribution of contaminants in snow and the chemical concentration processes during snowmelt, IAHS-AISH P., 118, 116–120, https://iahs.info/uploads/dms/4735.116-120-118-Johannessen.pdf (last access: 16 May 2024), 1977.
Kaczmarska, M., Isaksson, E., Karlöf, L., Brandt, O., Winther, J. G., Van De Wal, R. S. W., Van Den Broeke, M., and Johnsen, S. J.: Ice core melt features in relation to Antarctic coastal climate, Antarct. Sci., 18, 271–278, https://doi.org/10.1017/S0954102006000319, 2006.
Kameda, T., Narita, H., Shoji, H., Nishio, F., Fujii, Y., and Watanabe, O.: Melt features in ice cores from Site J, southern Greenland: some implications for summer climate since AD 1550, Ann. Glaciol., 21, 51–58, https://doi.org/10.3189/S0260305500015597, 1995.
Kang, S., Huang, J., and Xu, Y.: Changes in ionic concentrations and δ18O in the snowpack of Zhadang glacier, Nyainqentanglha mountain, southern Tibetan Plateau, Ann. Glaciol., 49, 127–134, https://doi.org/10.3189/172756408787814708, 2008.
Kaspari, S., McKenzie Skiles, S., Delaney, I., Dixon, D., and Painter, T. H.: Accelerated glacier melt on Snow Dome, Mount Olympus, Washington, USA, due to deposition of black carbon and mineral dust from wildfire, J. Geophys. Res.-Atmos., 120, 2793–2807, https://doi.org/10.1002/2014JD022676, 2015.
Kawakami, K., Iizuka, Y., Matoba, S., Aoki, T., and Ando, T.: Inclusions in ice layers formed by melting and refreezing processes in a Greenland ice core, J. Glaciol., 69, 790–802, https://doi.org/10.1017/jog.2022.101, 2022.
Keegan, K. M., Albert, M. R., McConnell, J. R., and Baker, I.: Climate change and forest fires synergistically drive widespread melt events of the Greenland Ice Sheet., P. Natl. Acad. Sci. USA, 111, 7964–7967, https://doi.org/10.1073/pnas.1405397111, 2014.
Keegan, K. M., Albert, M. R., Mcconnell, J. R., and Baker, I.: Climate Effects on Firn Permeability Are Preserved Within a Firn Column, J. Geophys. Res.-Earth, 124, 830–837, https://doi.org/10.1029/2018JF004798, 2019.
Kinnard, C., Koerner, R. M., Zdanowicz, C. M., Fisher, D. A., Zheng, J., Sharp, M. J., Nicholson, L., and Lauriol, B.: Stratigraphic analysis of an ice core from the Prince of Wales Icefield, Ellesmere Island, Arctic Canada, using digital image analysis: High-resolution density, past summer warmth reconstruction, and melt effect on ice core solid conductivity, J. Geophys. Res.-Atmos., 113, D24120, https://doi.org/10.1029/2008JD011083, 2008.
Koenig, L. S., Miège, C., Forster, R. R., and Brucker, L.: Initial in situ measurements of perennial meltwater storage in the Greenland firn aquifer, Geophys. Res. Lett., 41, 81–85, https://doi.org/10.1002/2013GL058083, 2014.
Koerner, R. M.: Some Observations on Superimposition of Ice on the Devon Island Ice Cap, N.W.T. Canada, Geogr. Ann. A, 52, 57–67, https://doi.org/10.1080/04353676.1970.11879808, 1970.
Koerner, R. M.: Devon Island Ice Cap: Core Stratigraphy and Paleoclimate, Science, 196, 15–18, https://doi.org/10.1126/science.196.4285.15, 1977a.
Koerner, R. M.: Distribution of microparticles in a 299-m core through the Devon Island ice cap, Northwest Territories, Canada, IAHS-AISH P., 118, 371–376, https://iahs.info/uploads/dms/4770.371-376-118-Koerner.pdf (last access: 16 May 2024), 1977b.
Koerner, R. M.: Ice Core Evidence for Extensive Melting of the Greenland Ice Sheet in the Last Interglacial, Science, 244, 964–968, https://doi.org/10.1126/science.244.4907.964, 1989.
Koerner, R. M.: Some comments on climatic reconstructions from ice cores drilled in areas of high melt, J. Glaciol., 43, 90–97, https://doi.org/10.3189/S0022143000002847, 1997.
Koerner, R. M. and Fisher, D. A.: A record of Holocene summer climate from a Canadian high-Arctic ice core, Nature, 343, 630–631, https://doi.org/10.1038/343630a0, 1990.
Koerner, R. M., Paterson, W. S. B., and Krouse, H. R.: δ18O Profile in Ice formed between the Equilibrium and Firn Lines, Nature Physical Science, 245, 137–140, https://doi.org/10.1038/physci245137a0, 1973.
Koh, G. and Jordan, R.: Sub-surface melting in a seasonal snow cover, J. Glaciol., 41, 474–482, https://doi.org/10.1017/S002214300003481X, 1995.
Krenke, A. N. and Khodakov, V. G.: O svyazi poverkhnostnogo tayaniya lednikov s temperaturoyi vozdukha (About the relation between surface ablation of the glaciers and the air temperature), Materialy glyaciologicheskikh issledovaniyi, Khronika, ohsuzhdeniya, 12, 153–164, 1966.
Kuhn, M.: The nutrient cycle through snow and ice, a review, Aquat. Sci., 63, 150–167, https://doi.org/10.1007/PL00001348, 2001.
Kuipers Munneke, P., Ligtenberg, S. R. M., Van Den Broeke, M. R., Van Angelen, J. H., and Forster, R. R.: Explaining the presence of perennial liquid water bodies in the firn of the Greenland Ice Sheet, Geophys. Res. Lett., 41, 476–483, https://doi.org/10.1002/2013GL058389, 2014a.
Kuipers Munneke, P., Ligtenberg, S. R. M., Van Den Broeke, M. R., and Vaughan, D. G.: Firn air depletion as a precursor of Antarctic ice-shelf collapse, J. Glaciol., 60, 205–214, https://doi.org/10.3189/2014JoG13J183, 2014b.
Langway, C. C. and Shoji, H.: Past Temperature Record From The Analysis of Melt Features In The Dye 3, Greenland, Ice Core, Ann. Glaciol., 14, 343–344, https://doi.org/10.3189/S0260305500009095, 1990.
Laska, M., Luks, B., and Budzik, T.: Influence of snowpack internal structure on snow metamorphism and melting intensity on Hansbreen, Svalbard, Pol. Polar Res., 37, 193–218, https://doi.org/10.1515/popore-2016-0012, 2016.
Lee, J., Hur, S. Do, Lim, H. S., and Jung, H.: Isotopic characteristics of snow and its meltwater over the Barton Peninsula, Antarctica, Cold. Reg. Sci. Technol., 173, 102997, https://doi.org/10.1016/j.coldregions.2020.102997, 2020.
Lenaerts, J. T. M., Lhermitte, S., Drews, R., Ligtenberg, S. R. M., Berger, S., Helm, V., Smeets, C. J. P. P., Broeke, M. R. V. Den, Van De Berg, W. J., Van Meijgaard, E., Eijkelboom, M., Eisen, O., and Pattyn, F.: Meltwater produced by wind-albedo interaction stored in an East Antarctic ice shelf, Nat. Clim. Change, 7, 58–62, https://doi.org/10.1038/nclimate3180, 2017.
Leroux, N. R. and Pomeroy, J. W.: Modelling capillary hysteresis effects on preferential flow through melting and cold layered snowpacks, Adv. Water Resour., 107, 250–264, https://doi.org/10.1016/j.advwatres.2017.06.024, 2017.
Li, Z., Edwards, R., Mosley-Thompson, E., Wang, F., Dong, Z., You, X., Li, H., Li, C., and Zhu, Y.: Seasonal variability of ionic concentrations in surface snow and elution processes in snow-firn packs at the PGPI site on Ürümqi glacier No. 1, eastern Tien Shan, China, Ann. Glaciol., 43, 250–256, https://doi.org/10.3189/172756406781812069, 2006.
Ligtenberg, S. R. M., Helsen, M. M., and van den Broeke, M. R.: An improved semi-empirical model for the densification of Antarctic firn, The Cryosphere, 5, 809–819, https://doi.org/10.5194/tc-5-809-2011, 2011.
Lliboutry, L.: Temperate ice permeability, stability of water veins and percolation of internal meltwater, J. Glaciol., 42, 201–211, https://doi.org/10.3189/S0022143000004068, 1996.
MacDonell, S., Fernandoy, F., Villar, P., and Hammann, A.: Stratigraphic Analysis of Firn Cores from an Antarctic Ice Shelf Firn Aquifer, Water, 13, 731, https://doi.org/10.3390/w13050731, 2021.
Machguth, H., Macferrin, M., Van As, D., Box, J. E., Charalampidis, C., Colgan, W., Fausto, R. S., Meijer, H. A. J., Mosley-Thompson, E., and Van De Wal, R. S. W.: Greenland meltwater storage in firn limited by near-surface ice formation, Nat. Clim. Change, 6, 390–393, https://doi.org/10.1038/nclimate2899, 2016.
Marsh, P. and Woo, M.-K.: Wetting Front Advance and Freezing of Meltwater Within a Snow Cover 1. Observations in the Canadian Arctic, Water Resour. Res., 20, 1853–1864, https://doi.org/10.1029/WR020i012p01853, 1984.
Martinerie, P., Raynaud, D., Etheridge, D. M., Barnola, J.-M., and Mazaudier, D.: Physical and climatic parameters which influence the air content in polar ice, Earth Planet. Sc. Lett., 112, 1–13, https://doi.org/10.1016/0012-821X(92)90002-D, 1992.
Matsuoka, K. and Naruse, R.: Mass Balance Features Derived from a Firn Core at Hielo Patagónico Norte, South America, Arct. Antarct. Alp. Res., 31, 333–340, https://doi.org/10.1080/15230430.1999.12003318, 1999.
Mattea, E., Machguth, H., Kronenberg, M., van Pelt, W., Bassi, M., and Hoelzle, M.: Firn changes at Colle Gnifetti revealed with a high-resolution process-based physical model approach, The Cryosphere, 15, 3181–3205, https://doi.org/10.5194/tc-15-3181-2021, 2021.
Mattson, L. E., Gardner, J. S., and Young, G. J.: Ablation on Debris Covered Glaciers: an Example from the Rakhiot Glacier, Punjab, Himalaya, IAHS-AISH P., 218, 289–296, https://iahs.info/uploads/dms/9559.289-296-218-Mattson.pdf (last access: 16 May 2024), 1993.
McDowell, I. E., Keegan, K. M., Wever, N., Osterberg, E. C., Hawley, R. L., and Marshall, H.: Firn core evidence of two-way feedback mechanisms between meltwater percolation and firn microstructure from the western percolation zone of the Greenland Ice Sheet, J. Geophys. Res.-Earth, 128, e2022JF006752, https://doi.org/10.1029/2022jf006752, 2023.
McGurk, B. J. and Kattelmann, R. C.: Evidence of liquid water flow through snow from thick-section photography, in: International Snow Science Workshop, Canadian Avalanche Association, 1988 International Snow Science Workshop, Whistler, 12–15 October 1988, 137–139, https://arc.lib.montana.edu/snow-science/item/628 (last access: 16 May 2024), 1988.
McLeod, J. T. and Mote, T. L.: Linking interannual variability in extreme Greenland blocking episodes to the recent increase in summer melting across the Greenland ice sheet, Int. J. Climatol., 36, 1484–1499, https://doi.org/10.1002/joc.4440, 2016.
Meyer, C. R. and Hewitt, I. J.: A continuum model for meltwater flow through compacting snow, The Cryosphere, 11, 2799–2813, https://doi.org/10.5194/tc-11-2799-2017, 2017.
Meyer, T. and Wania, F.: Modeling the elution of organic chemicals from a melting homogeneous snow pack, Water Res., 45, 3627–3637, https://doi.org/10.1016/j.watres.2011.04.011, 2011.
Miller, O., Solomon, D. K., Miège, C., Koenig, L., Forster, R., Schmerr, N., Ligtenberg, S. R. M., Legchenko, A., Voss, C. I., Montgomery, L., and McConnell, J. R.: Hydrology of a Perennial Firn Aquifer in Southeast Greenland: An Overview Driven by Field Data, Water Resour. Res., 56, e2019WR026348, https://doi.org/10.1029/2019WR026348, 2020.
Mitchell, L. E., Buizert, C., Brook, E. J., Breton, D. J., Fegyveresi, J., Baggenstos, D., Orsi, A., Severinghaus, J., Alley, R. B., Albert, M., Rhodes, R. H., McConnell, J. R., Sigl, M., Maselli, O., Gregory, S., and Ahn, J.: Observing and modeling the influence of layering on bubble trapping in polar firn, J. Geophys. Res., 120, 2558–2574, https://doi.org/10.1002/2014JD022766, 2015.
Moore, J. C. and Grinsted, A.: Ion fractionation and percolation in ice cores with seasonal melting, in: Physics of Ice Core Records II: Papers collected after the 2nd International Workshop on Physics of Ice Core Records, edited by: Hondoh, T., Sapporoh, Japan, http://hdl.handle.net/2115/45455 (last access: 16 May 2024), 2009.
Moore, J. C., Grinsted, A., Kekonen, T., and Pohjola, V.: Separation of melting and environmental signals in an ice core with seasonal melt, Geophys. Res. Lett., 32, L10501, https://doi.org/10.1029/2005GL023039, 2005.
Moran, T. and Marshall, S.: The effects of meltwater percolation on the seasonal isotopic signals in an Arctic snowpack, J. Glaciol., 55, 1012–1024, https://doi.org/10.3189/002214309790794896, 2009.
Moser, D. E., Jackson, S., Kjær, H. A., Markle, B. R., Ngoumtsa, E., Pedro, J. B., Segato, D., Spolaor, A., Tetzner, D., Vallelonga, P., and Thomas, E. R.: An Age Scale for the First Shallow (Sub-)Antarctic Ice Core from Young Island, Northwest Ross Sea, Geosciences, 11, 368, https://doi.org/10.3390/geosciences11090368, 2021.
Müller-Tautges, C., Eichler, A., Schwikowski, M., Pezzatti, G. B., Conedera, M., and Hoffmann, T.: Historic records of organic compounds from a high Alpine glacier: influences of biomass burning, anthropogenic emissions, and dust transport, Atmos. Chem. Phys., 16, 1029–1043, https://doi.org/10.5194/acp-16-1029-2016, 2016.
NEEM community members: Eemian interglacial reconstructed from a Greenland folded ice core, Nature, 493, 489–494, https://doi.org/10.1038/nature11789, 2013.
Neff, P. D.: A review of the brittle ice zone in polar ice cores, 55, 72–82, https://doi.org/10.3189/2014AoG68A023, 2014.
Neff, P. D., Steig, E. J., Clark, D. H., McConnell, J. R., Pettit, E. C., and Menounos, B.: Ice-core net snow accumulation and seasonal snow chemistry at a temperate-glacier site: Mount Waddington, southwest British Columbia, Canada, J. Glaciol., 58, 1165–1175, https://doi.org/10.3189/2012JoG12J078, 2012.
Neff, W.: Atmospheric rivers melt Greenland, Nat. Clim. Change, 8, 857–858, https://doi.org/10.1038/s41558-018-0297-4, 2018.
Neftel, A., Oeschger, H., Schwander, J., and Stauffer, B.: Carbon Dioxide Concentration in Bubbles of Natural Cold Ice, J. Phys. Chem., 87, 4116–4120, https://doi.org/10.1021/j100244a025, 1983.
Nghiem, S. V., Hall, D. K., Mote, T. L., Tedesco, M., Albert, M. R., Keegan, K., Shuman, C. A., DiGirolamo, N. E., and Neumann, G.: The extreme melt across the Greenland ice sheet in 2012, Geophys. Res. Lett., 39, L20502, https://doi.org/10.1029/2012GL053611, 2012.
Nicolas, J. P., Vogelmann, A. M., Scott, R. C., Wilson, A. B., Cadeddu, M. P., Bromwich, D. H., Verlinde, J., Lubin, D., Russell, L. M., Jenkinson, C., Powers, H. H., Ryczek, M., Stone, G., and Wille, J. D.: January 2016 extensive summer melt in West Antarctica favoured by strong El Niño, Nat. Commun., 8, 15799, https://doi.org/10.1038/ncomms15799, 2017.
Niwano, M., Box, J. E., Wehrlé, A., Vandecrux, B., Colgan, W. T., and Cappelen, J.: Rainfall on the Greenland Ice Sheet: Present-Day Climatology From a High-Resolution Non-Hydrostatic Polar Regional Climate Model, Geophys. Res. Lett., 48, e2021GL092942, https://doi.org/10.1029/2021GL092942, 2021.
Nye, J. F.: Diffusion of isotopes in the annual layers of ice sheets, J. Glaciol., 44, 467–468, https://doi.org/10.3189/S0022143000001982, 1998.
Okamoto, S., Fujita, K., Narita, H., Uetake, J., Takeuchi, N., Miyake, T., Nakazawa, F., Aizen, V. B., Nikitin, S. A., and Nakawo, M.: Reevaluation of the reconstruction of summer temperatures from melt features in Belukha ice cores, Siberian Altai, J. Geophys. Res.-Atmos., 116, D02110, https://doi.org/10.1029/2010JD013977, 2011.
Olson, M. and Rupper, S.: Impacts of topographic shading on direct solar radiation for valley glaciers in complex topography, The Cryosphere, 13, 29–40, https://doi.org/10.5194/tc-13-29-2019, 2019.
Orsi, A. J., Kawamura, K., Fegyveresi, J. M., Headly, M. A., Alley, R. B., and Severinghaus, J. P.: Differentiating bubble-free layers from melt layers in ice cores using noble gases, J. Glaciol., 61, 585–594, https://doi.org/10.3189/2015jog14j237, 2015.
Osmont, D., Wendl, I. A., Schmidely, L., Sigl, M., Vega, C. P., Isaksson, E., and Schwikowski, M.: An 800-year high-resolution black carbon ice core record from Lomonosovfonna, Svalbard, Atmos. Chem. Phys., 18, 12777–12795, https://doi.org/10.5194/acp-18-12777-2018, 2018.
Osmont, D., Brugger, S., Gilgen, A., Weber, H., Sigl, M., Modini, R. L., Schwörer, C., Tinner, W., Wunderle, S., and Schwikowski, M.: Tracing devastating fires in Portugal to a snow archive in the Swiss Alps: a case study, The Cryosphere, 14, 3731–3745, https://doi.org/10.5194/tc-14-3731-2020, 2020.
Pang, H., He, Y., Hou, S., and Zhang, N.: Changes in ionic and oxygen isotopic composition of the snow-firn pack at Baishui Glacier No. 1, southeastern Tibetan Plateau, Environ. Earth Sci., 67, 2345–2358, https://doi.org/10.1007/s12665-012-1681-4, 2012.
Parlange, J.-Y.: Water movement in soils, Geophys. Surv., 1, 357–387, https://doi.org/10.1007/BF01449119, 1974.
Pavlova, P. A., Jenk, T. M., Schmid, P., Bogdal, C., Steinlin, C., and Schwikowski, M.: Polychlorinated Biphenyls in a Temperate Alpine Glacier: 1. Effect of Percolating Meltwater on their Distribution in Glacier Ice, Environ. Sci. Technol., 49, 14085–14091, https://doi.org/10.1021/acs.est.5b03303, 2015.
Pfeffer, W. T. and Humphrey, N. F.: Determination of timing and location of water movement and ice-layer formation by temperature measurements in sub-freezing snow, J. Glaciol., 42, 292–304, https://doi.org/10.3189/S0022143000004159, 1996.
Pfeffer, W. T. and Humphrey, N. F.: Formation of ice layers by infiltration and refreezing of meltwater, Ann. Glaciol., 26, 83–91, https://doi.org/10.3189/1998aog26-1-83-91, 1998.
Pfeffer, W. T., Meier, M. F., and Illangasekare, T. H.: Retention of Greenland runoff by refreezing: implications for projected future sea level change, J. Geophys. Res., 96, 22117–22124, https://doi.org/10.1029/91jc02502, 1991.
Pinglot, J. F., Vaikmäe, R. A., Kamiyama, K., Igarashi, M., Fritzsche, D., Wilhelms, F., Koerner, R., Henderson, L., Isaksson, E., Winther, J. G., Van De Wal, R. S. W., Fournier, M., Bouisset, P., and Meijer, H. A. J.: Ice cores from Arctic sub-polar glaciers: Chronology and post-depositional processes deduced from radioactivity measurements, J. Glaciol., 49, 149–158, https://doi.org/10.3189/172756503781830944, 2003.
Plach, A., Vinther, B. M., Nisancioglu, K. H., Vudayagiri, S., and Blunier, T.: Greenland climate simulations show high Eemian surface melt which could explain reduced total air content in ice cores, Clim. Past, 17, 317–330, https://doi.org/10.5194/cp-17-317-2021, 2021.
Pohjola, V. A., Moore, J. C., Isaksson, E., Jauhiainen, T., van de Wal, R. S. W., Martma, T., Meijer, H. A. J., and Vaikmäe, R.: Effect of periodic melting on geochemical and isotopic signals in an ice core from Lomonosovfonna, Svalbard, J. Geophys. Res., 107, ACL 1-1–ACL 1-14, https://doi.org/10.1029/2000JD000149, 2002.
Porter, S. E., Mosley-Thompson, E., Thompson, L. G., and Wilson, A. B.: Reconstructing an Interdecadal Pacific Oscillation Index from a Pacific Basin–Wide Collection of Ice Core Records, J. Climate, 34, 3839–3852, https://doi.org/10.1175/JCLI-D-20-0455.1, 2021.
Rempel, A., Waddington, E., Wettlaufer, J., and Worster, M. G.: Possible displacement of the climate signal in ancient ice by premelting and anomalous diffusion, Nature, 471, 568–571, https://doi.org/10.1038/35079043, 2001.
Reznichenko, N., Davies, T., Shulmeister, J., and McSaveney, M.: Effects of debris on ice-surface melting rates: an experimental study, J. Glaciol., 56, 384–394, https://doi.org/10.3189/002214310792447725, 2010.
Rowan, A. V., Nicholson, L. I., Quincey, D. J., Gibson, M. J., Irvine-Fynn, T. D. L., Watson, C. S., Wagnon, P., Rounce, D. R., Thompson, S. S., Porter, P. R., and Glasser, N. F.: Seasonally stable temperature gradients through supraglacial debris in the Everest region of Nepal, Central Himalaya, J. Glaciol., 67, 170–181, https://doi.org/10.1017/jog.2020.100, 2021.
Samimi, S., Marshall, S. J., and MacFerrin, M.: Meltwater Penetration Through Temperate Ice Layers in the Percolation Zone at DYE-2, Greenland Ice Sheet, Geophys. Res. Lett., 47, e2020GL089211, https://doi.org/10.1029/2020GL089211, 2020.
Sánchez, M. A., Kling, T., Ishiyama, T., Van Zadel, M. J., Bisson, P. J., Mezger, M., Jochum, M. N., Cyran, J. D., Smit, W. J., Bakker, H. J., Shultz, M. J., Morita, A., Donadio, D., Nagata, Y., Bonn, M., and Backus, E. H. G.: Experimental and theoretical evidence for bilayer-by-bilayer surface melting of crystalline ice, P. Natl. Acad. Sci. USA, 114, 227–232, https://doi.org/10.1073/pnas.1612893114, 2017.
Schilt, A., Baumgartner, M., Schwander, J., Buiron, D., Capron, E., Chappellaz, J., Loulergue, L., Schüpbach, S., Spahni, R., Fischer, H., and Stocker, T. F.: Atmospheric nitrous oxide during the last 140,000 years, Earth Planet. Sc. Lett., 300, 33–43, https://doi.org/10.1016/j.epsl.2010.09.027, 2010a.
Schilt, A., Baumgartner, M., Blunier, T., Schwander, J., Spahni, R., Fischer, H., and Stocker, T. F.: Glacial-interglacial and millennial-scale variations in the atmospheric nitrous oxide concentration during the last 800,000 years, Quat. Sci. Rev., 29, 182–192, https://doi.org/10.1016/j.quascirev.2009.03.011, 2010b.
Schöndorf, T. and Herrmann, R.: Transport and Chemodynamics of Organic Micropollutants and Ions during Snowmelt, Nord. Hydrol., 18, 259–278, https://doi.org/10.2166/nh.1987.0019, 1987.
Schwander, J. and Stauffer, B.: Age difference between polar ice and the air trapped in its bubbles, Nature, 311, 276–279, https://doi.org/10.1038/311045a0, 1984.
Schwikowski, M., Schläppi, M., Santibañez, P., Rivera, A., and Casassa, G.: Net accumulation rates derived from ice core stable isotope records of Pío XI glacier, Southern Patagonia Icefield, The Cryosphere, 7, 1635–1644, https://doi.org/10.5194/tc-7-1635-2013, 2013.
Scott, R. C., Nicolas, J. P., Bromwich, D. H., Norris, J. R., and Lubin, D.: Meteorological drivers and large-scale climate forcing of West Antarctic surface melt, J. Climate, 32, 665–684, https://doi.org/10.1175/JCLI-D-18-0233.1, 2019.
Shiraiwa, T., Kohshima, S., Uemura, R., Yoshida, N., Matoba, S., Uetake, J., and Godoi, M. A.: High net accumulation rates at Campo de Hielo Patagónico Sur, South America, revealed by analysis of a 45.97 m long ice core, Ann. Glaciol., 35, 84–90, https://doi.org/10.3189/172756402781816942, 2002.
Simmleit, N., Herrmann, R., and Thomas, S. W.: Chemical behaviour of hydrophobic micro-pollutants during the melting of snow, IAHS-AISH P., 155, 335–346, https://iahs.info/uploads/dms/6532.335-346-155-Simmleit.pdf (last access: 16 May 2024) 1986.
Sinclair, K. E. and MacDonell, S.: Seasonal evolution of penitente glaciochemistry at Tapado Glacier, Northern Chile, Hydrol. Process., 30, 176–186, https://doi.org/10.1002/hyp.10531, 2016.
Slater, B. and Michaelides, A.: Surface premelting of water ice, Nat. Rev. Chem., 3, 172–188, https://doi.org/10.1038/s41570-019-0080-8, 2019.
Sommer, C. G., Wever, N., Fierz, C., and Lehning, M.: Investigation of a wind-packing event in Queen Maud Land, Antarctica, The Cryosphere, 12, 2923–2939, https://doi.org/10.5194/tc-12-2923-2018, 2018.
Sommers, A. N., Rajaram, H., Weber, E. P., Macferrin, M. J., Colgan, W., and Stevens, C. M.: Inferring firn permeability from pneumatic testing: A case study on the Greenland ice sheet, Front. Earth Sci., 5, 20, https://doi.org/10.3389/feart.2017.00020, 2017.
Souchez, R. A. and Jouzel, J.: On the Isotopic Composition in δD and δ18O of Water and Ice During Freezing, J. Glaciol., 30, 369–372, https://doi.org/10.3189/S0022143000006249, 1984.
Spolaor, A., Varin, C., Pedeli, X., Christille, J. M., Kirchgeorg, T., Giardi, F., Cappelletti, D., Turetta, C., Cairns, W. R. L., Gambaro, A., Bernagozzi, A., Gallet, J. C., Björkman, M. P., and Barbaro, E.: Source, timing and dynamics of ionic species mobility in the Svalbard annual snowpack, Sci. Total Environ., 751, 141640, https://doi.org/10.1016/j.scitotenv.2020.141640, 2021.
Spolaor, A., Scoto, F., Larose, C., Barbaro, E., Burgay, F., Bjorkman, M. P., Cappelletti, D., Dallo, F., de Blasi, F., Divine, D., Dreossi, G., Gabrieli, J., Isaksson, E., Kohler, J., Martma, T., Schmidt, L. S., Schuler, T. V., Stenni, B., Turetta, C., Luks, B., Casado, M., and Gallet, J.-C.: Climate change is rapidly deteriorating the climatic signal in Svalbard glaciers, The Cryosphere, 18, 307–320, https://doi.org/10.5194/tc-18-307-2024, 2024.
Stauffer, B., Neftel, A., Oeschger, H., and Schwander, J.: CO2 Concentration in Air Extracted from Greenland Ice Samples, in: Geophysical Monograph Series: Greenland Ice Core: Geophysics, Geochemistry, and the Environment, edited by: Langway, C. C., Oeschger, H., and Dansgaard, W., 33, https://doi.org/10.1029/GM033p0085, 1985.
Svensson, A., Nielsen, S. W., Kipfstuhl, S., Johnsen, S. J., Steffensen, J. P., Bigler, M., Ruth, U., and Röthlisberger, R.: Visual stratigraphy of the North Greenland Ice Core Project (NorthGRIP) ice core during the last glacial period, J. Geophys. Res.-Atmos., 110, D02108, https://doi.org/10.1029/2004JD005134, 2005.
Takeuchi, N., Sera, S., Fujita, K., Aizen, V. B., and Kubota, J.: Annual layer counting using pollen grains of the Grigoriev ice core from the Tien Shan Mountains, central Asia, Arct. Antarct. Alp. Res., 51, 299–312, https://doi.org/10.1080/15230430.2019.1638202, 2019.
Taranczewski, T., Freitag, J., Eisen, O., Vinther, B., Wahl, S., and Kipfstuhl, S.: 10,000 years of melt history of the 2015 Renland ice core, EastGreenland, The Cryosphere Discuss. [preprint], https://doi.org/10.5194/tc-2018-280, 2019.
Tarussov, A.: The Arctic from Svalbard to Severnaya Zemblya: Climatic reconstruction from ice cores, in: Climate since AD 1500, edited by: Bradley, R. S. and Jones, P. D., 1st edn., Routledge, 505–516, ISBN 9780203430996, 1995.
Taylor, S., Feng, X., Kirchner, J. W., Osterhuber, R., Klaue, B., and Renshaw, C. E.: Isotopic evolution of a seasonal snowpack and its melt, Water Resour. Res., 37, 759–769, https://doi.org/10.1029/2000WR900341, 2001.
Tedesco, M. and Fettweis, X.: Unprecedented atmospheric conditions (1948–2019) drive the 2019 exceptional melting season over the Greenland ice sheet, The Cryosphere, 14, 1209–1223, https://doi.org/10.5194/tc-14-1209-2020, 2020.
Thackeray, C. W. and Fletcher, C. G.: Snow albedo feedback: Current knowledge, importance, outstanding issues and future directions, Prog. Phys. Geogr, 40, 392–408, https://doi.org/10.1177/0309133315620999, 2016.
Thomas, E. R., Allen, C. S., Etourneau, J., King, A. C. F., Severi, M., Winton, V. H. L., Mueller, J., Crosta, X., and Peck, V. L.: Antarctic sea ice proxies from marine and ice core archives suitable for reconstructing sea ice over the past 2000 years, Geosciences, 9, 506, https://doi.org/10.3390/geosciences9120506, 2019.
Thomas, E. R., Gacitúa, G., Pedro, J. B., Faith King, A. C., Markle, B., Potocki, M., and Moser, D. E.: Physical properties of shallow ice cores from Antarctic and sub-Antarctic islands, The Cryosphere, 15, 1173–1186, https://doi.org/10.5194/tc-15-1173-2021, 2021.
Thompson, L. G., Mosley-Thompson, E., Davis, M., Lin, P. N., Yao, T., Dyurgerov, M., and Dai, J.: “Recent warming”: ice core evidence from tropical ice cores with emphasis on Central Asia, Glob. Planet. Change, 7, 145–156, https://doi.org/10.1016/0921-8181(93)90046-Q, 1993.
Thompson, L. G., Davis, M. E., Mosley-Thompson, E., Porter, S. E., Corrales, G. V., Shuman, C. A., and Tucker, C. J.: The impacts of warming on rapidly retreating high-altitude, low-latitude glaciers and ice core-derived climate records, Glob. Planet. Change, 203, 103538, https://doi.org/10.1016/j.gloplacha.2021.103538, 2021.
Trachsel, J. C., Avak, S. E., Edebeli, J., Schneebeli, M., Bartels-Rausch, T., Bruetsch, S., and Eichler, A.: Microscale Rearrangement of Ammonium Induced by Snow Metamorphism, Front. Earth Sci., 7, 194, https://doi.org/10.3389/feart.2019.00194, 2019.
Tranter, M., Brimblecombe, P., Davies, T. D., Vincent, C. E., Abrahams, P. W., and Blackwood, I.: The composition of snowfall, snowpack and meltwater in the Scottish highlands – evidence for preferential elution, Atmos. Environ., 20, 517–525, https://doi.org/10.1016/0004-6981(86)90092-2, 1986.
Tranter, M., Tsiouris, S., Davies, T. D., and Jones, H. G.: A laboratory investigation of the leaching of solute from snowpack by rainfall, Hydrol. Process., 6, 169–178, https://doi.org/10.1002/hyp.3360060205, 1992.
Trudinger, C. M., Enting, I. G., Etheridge, D. M., Francey, R. J., Levchenko, V. A., Steele, L. P., Raynaud, D., and Arnaud, L.: Modeling air movement and bubble trapping in firn, J. Geophys. Res.-Atmos., 102, 6747–6763, https://doi.org/10.1029/96JD03382, 1997.
Trusel, L. D., Frey, K. E., Das, S. B., Karnauskas, K. B., Kuipers Munneke, P., Van Meijgaard, E., and Van Den Broeke, M. R.: Divergent trajectories of Antarctic surface melt under two twenty-first-century climate scenarios, Nat. Geosci., 8, 927–932, https://doi.org/10.1038/ngeo2563, 2015.
Tschumi, J. and Stauffer, B.: Reconstructing past atmospheric CO2 concentration based on ice-core analyses: Open questions due to in situ production of CO2 in the ice, J. Glaciol., 46, 45–53, https://doi.org/10.3189/172756500781833359, 2000.
Tsiouris, S., Vincent, C. E., Davies, T. D., and Brimbleco, P.: The Elution of Ions Through Field and Laboratory Snowpacks, Ann. Glaciol., 7, 196–201, https://doi.org/10.3189/S0260305500006169, 1985.
Vandecrux, B., MacFerrin, M., Machguth, H., Colgan, W. T., van As, D., Heilig, A., Stevens, C. M., Charalampidis, C., Fausto, R. S., Morris, E. M., Mosley-Thompson, E., Koenig, L., Montgomery, L. N., Miège, C., Simonsen, S. B., Ingeman-Nielsen, T., and Box, J. E.: Firn data compilation reveals widespread decrease of firn air content in western Greenland, The Cryosphere, 13, 845–859, https://doi.org/10.5194/tc-13-845-2019, 2019.
Vandecrux, B., Mottram, R., Langen, P. L., Fausto, R. S., Olesen, M., Stevens, C. M., Verjans, V., Leeson, A., Ligtenberg, S., Kuipers Munneke, P., Marchenko, S., van Pelt, W., Meyer, C. R., Simonsen, S. B., Heilig, A., Samimi, S., Marshall, S., Machguth, H., MacFerrin, M., Niwano, M., Miller, O., Voss, C. I., and Box, J. E.: The firn meltwater Retention Model Intercomparison Project (RetMIP): evaluation of nine firn models at four weather station sites on the Greenland ice sheet, The Cryosphere, 14, 3785–3810, https://doi.org/10.5194/tc-14-3785-2020, 2020.
Van Den Broeke, M.: Strong surface melting preceded collapse of Antarctic Peninsula ice shelf, Geophys. Res. Lett., 32, L12815, https://doi.org/10.1029/2005GL023247, 2005.
Van Der Wel, L. G., Streurman, H. J., Isaksson, E., Helsen, M. M., Van De Wal, R. S. W., Martma, T., Pohjola, V. A., Moore, J. C., and Meijer, H. A. J.: Using high-resolution tritium profiles to quantify the effects of melt on two Spitsbergen ice cores, J. Glaciol., 57, 1087–1097, https://doi.org/10.3189/002214311798843368, 2011.
van Wessem, J. M., Ligtenberg, S. R. M., Reijmer, C. H., van de Berg, W. J., van den Broeke, M. R., Barrand, N. E., Thomas, E. R., Turner, J., Wuite, J., Scambos, T. A., and van Meijgaard, E.: The modelled surface mass balance of the Antarctic Peninsula at 5.5 km horizontal resolution, The Cryosphere, 10, 271–285, https://doi.org/10.5194/tc-10-271-2016, 2016.
Vega, C. P., Pohjola, V. A., Beaudon, E., Claremar, B., van Pelt, W. J. J., Pettersson, R., Isaksson, E., Martma, T., Schwikowski, M., and Bøggild, C. E.: A synthetic ice core approach to estimate ion relocation in an ice field site experiencing periodical melt: a case study on Lomonosovfonna, Svalbard, The Cryosphere, 10, 961–976, https://doi.org/10.5194/tc-10-961-2016, 2016.
Veres, D., Bazin, L., Landais, A., Toyé Mahamadou Kele, H., Lemieux-Dudon, B., Parrenin, F., Martinerie, P., Blayo, E., Blunier, T., Capron, E., Chappellaz, J., Rasmussen, S. O., Severi, M., Svensson, A., Vinther, B., and Wolff, E. W.: The Antarctic ice core chronology (AICC2012): an optimized multi-parameter and multi-site dating approach for the last 120 thousand years, Clim. Past, 9, 1733–1748, https://doi.org/10.5194/cp-9-1733-2013, 2013.
Virkkunen, K., Moore, J. C., Isaksson, E., Pohjola, V., Perämäki, P., Grinsted, A., and Kekonen, T.: Warm summers and ion concentrations in snow: Comparison of present day with Medieval Warm Epoch from snow pits and an ice core from Lomonosovfonna, Svalbard, J. Glaciol., 53, 623–634, https://doi.org/10.3189/002214307784409388, 2007.
Vudayagiri, S., Vinther, B., Freitag, J., Langen, P. L., and Blunier, T.: Total Air Content measurements from the RECAP ice core, EGUsphere [preprint], https://doi.org/10.5194/egusphere-2024-237, 2024.
WAIS Divide Project Members: Onset of deglacial warming in West Antarctica driven by local orbital forcing, Nature, 500, 440–444, https://doi.org/10.1038/nature12376, 2013.
Wakahama, G.: The Metamorphism of Wet Snow, IAHS-AISH P., 79, 370–379, https://iahs.info/uploads/dms/079035.pdf (last access: 16 May 2024), 1968.
Wakahama, G.: The role of meltwater in densification processes of snow and firn percolation of meltwater into a snow cover, IAHS-AISH P., 114, 66–72, 1975.
Wang, S., Shi, X., Cao, W., and Pu, T.: Seasonal variability and evolution of glaciochemistry at an alpine temperate glacier on the southeastern Tibetan Plateau, Water, 10, 114, https://doi.org/10.3390/w10020114, 2018.
Warren, S. G.: Optical properties of ice and snow, Philos. T. Roy. Soc. A, 377, 20180161, https://doi.org/10.1098/rsta.2018.0161, 2019.
Watanabe, K., Hirai, T., and Kawada, K.: Ratios of in the snow cover at Murododaira, Mt. Tateyama, Japan: On the possibility of an indicator of chemical leaching, Bulletin of Glaciological Research, 33, 1–5, https://doi.org/10.5331/bgr.33.1, 2015.
Weiler, K., Fischer, H., Fritzsche, D., Ruth, U., Wilhelms, F., and Miller, H.: Glaciochemical reconnaissance of a new ice core from Severnaya Zemlya, Eurasian Arctic, J. Glaciol., 51, 64–74, https://doi.org/10.3189/172756505781829629, 2005.
Weinhart, A. H., Kipfstuhl, S., Hörhold, M., Eisen, O., and Freitag, J.: Spatial Distribution of Crusts in Antarctic and Greenland Snowpacks and Implications for Snow and Firn Studies, Front. Earth Sci., 9, 630070, https://doi.org/10.3389/feart.2021.630070, 2021.
Weiss, R. F.: Carbon dioxide in water and seawater: the solubility of a non-ideal gas, Mar. Chem., 2, 203–215, https://doi.org/10.1016/0304-4203(74)90015-2, 1974.
Westhoff, J., Sinnl, G., Svensson, A., Freitag, J., Kjær, H. A., Vallelonga, P., Vinther, B., Kipfstuhl, S., Dahl-Jensen, D., and Weikusat, I.: Melt in the Greenland EastGRIP ice core reveals Holocene warm events, Clim. Past, 18, 1011–1034, https://doi.org/10.5194/cp-18-1011-2022, 2022.
Wille, J. D., Favier, V., Dufour, A., Gorodetskaya, I. V., Turner, J., Agosta, C., and Codron, F.: West Antarctic surface melt triggered by atmospheric rivers, Nat. Geosci., 12, 911–916, https://doi.org/10.1038/s41561-019-0460-1, 2019.
Williams, M. W., Erickson, T. A., and Petrzelka, J. L.: Visualizing meltwater flow through snow at the centimetre-to-metre scale using a snow guillotine, Hydrol. Process., 24, 2098–2110, https://doi.org/10.1002/hyp.7630, 2010.
Winski, D., Osterberg, E., Kreutz, K., Wake, C., Ferris, D., Campbell, S., Baum, M., Bailey, A., Birkel, S., Introne, D., and Handley, M.: A 400-Year Ice Core Melt Layer Record of Summertime Warming in the Alaska Range, J. Geophys. Res.-Atmos., 123, 3594–3611, https://doi.org/10.1002/2017JD027539, 2018.
Wong, G. J., Hawley, R. L., Lutz, E. R., and Osterberg, E. C.: Trace-element and physical response to melt percolation in Summit (Greenland) snow, Ann. Glaciol., 54, 52–62, https://doi.org/10.3189/2013AoG63A602, 2013.
Wu, G., Li, P., Zhang, X., and Zhang, C.: Using a geochemical method of dissolved and insoluble fractions to characterize surface snow melting and major element elution, J. Glaciol., 64, 1003–1013, https://doi.org/10.1017/jog.2018.87, 2018.
You, X., Li, Z., Edwards, R., and Wang, L.: The transport of chemical components in homogeneous snowpacks on Urumqi Glacier No. 1, eastern Tianshan Mountains, Central Asia, J. Arid. Land, 7, 612–622, https://doi.org/10.1007/s40333-015-0131-z, 2015.
Yuanqing, H., Tandong, Y., Guodong, C., and Meixue, Y.: Climatic records in a firn core from an Alpine temperate glacier on Mt. Yulong, southeastern part of the Tibetan Plateau, Episodes, 24, 13–18, https://doi.org/10.18814/epiiugs/2001/v24i1/004, 2001.
Zhang, C., Wu, G., Gao, S., Zhao, Z., Zhang, X., Tian, L., Mu, Y., and Joswiak, D.: Distribution of major elements between the dissolved and insoluble fractions in surface snow at Urumqi Glacier No. 1, Eastern Tien Shan, Atmos. Res., 132–133, 299–308, https://doi.org/10.1016/j.atmosres.2013.05.009, 2013.
Zhang, L., Vance, T. R., Fraser, A. D., Jong, L. M., Thompson, S. S., Criscitiello, A. S., and Abram, N. J.: Identifying atmospheric processes favouring the formation of bubble-free layers in the Law Dome ice core, East Antarctica, The Cryosphere, 17, 5155–5173, https://doi.org/10.5194/tc-17-5155-2023, 2023.
Zheng, L., Zhou, C., and Wang, K.: Enhanced winter snowmelt in the Antarctic Peninsula: Automatic snowmelt identification from radar scatterometer, Remote Sens. Environ., 246, 111835, https://doi.org/10.1016/j.rse.2020.111835, 2020.
Zongxing, L., Qi, F., Wei, L., Tingting, W., Xiaoyan, G., Zongjie, L., Yan, G., Yanhui, P., Rui, G., Bing, J., Yaoxaun, S., and Chuntan, H.: The stable isotope evolution in Shiyi glacier system during the ablation period in the north of Tibetan Plateau, China, Quatern. Int., 380–381, 262–271, https://doi.org/10.1016/j.quaint.2015.02.013, 2015.
Zou, X., Bromwich, D. H., Montenegro, A., Wang, S. H., and Bai, L.: Major surface melting over the Ross Ice Shelf part II: Surface energy balance, Q. J. Roy. Meteor. Soc., 147, 2895–2916, https://doi.org/10.1002/qj.4105, 2021.
Zuhr, A. M., Münch, T., Steen-Larsen, H. C., Hörhold, M., and Laepple, T.: Local-scale deposition of surface snow on the Greenland ice sheet, The Cryosphere, 15, 4873–4900, https://doi.org/10.5194/tc-15-4873-2021, 2021.
- Abstract
- Introduction – The importance of studying melting and affected ice cores
- From melting to melt-affected ice cores
- Manifestations of melt in ice-core records
- Conclusions and outlook
- Data availability
- Author contributions
- Competing interests
- Disclaimer
- Acknowledgements
- Financial support
- Review statement
- References
- Supplement