the Creative Commons Attribution 4.0 License.
the Creative Commons Attribution 4.0 License.
 | 22 May 2024
Assessment of the impact of dam reservoirs on river ice cover – an example from the Carpathians (central Europe)
Maksymilian Fukś
This paper presents a method for determining the impact of dam reservoirs on the ice cover of rivers downstream of their locations based on a long measurement period (1950–2020) and synthetic-aperture radar (SAR) data. Two rivers and two sets of dam reservoirs located in the Carpathian Mountains (central Europe) were selected for this study. In order to estimate the influence of reservoirs, a logistic regression model was built to describe the relationship between the course of air temperature and the occurrence of ice cover (i.e., total ice cover and border ice) at water gauge cross sections upstream and downstream of the reservoirs. The influence of reservoirs was then defined as the differences between the number of days with ice cover predicted from air temperature and those observed at the water gauge cross sections. Additionally, the extent of the impact of the reservoirs was estimated based on SAR data (Sentinel-1) by identifying river sections downstream of the reservoirs on which total ice cover did not form despite the persistence of very low air temperatures. The study shows that dam reservoirs play an important role in decreasing the incidence of ice cover on rivers. The occurrence of ice cover as a result of reservoir operations could decrease by over 80 % in the sections immediately downstream of the reservoirs. The impact of the reservoir on river ice cover diminishes as the distance from the reservoir increases. Using SAR data, it was estimated that total ice cover did not form in sections 26–60 km downstream of the reservoirs, despite the presence of favorable thermal conditions. Based on the results of the study presented here, it can be assumed that in areas where many dam reservoirs are located, the ice regime of rivers is significantly transformed, which should be taken into account when studying river ice cover. This study also demonstrates that the logistic regression model and SAR data are useful tools for assessing the impact of dam reservoirs on river ice cover.
Please read the corrigendum first before continuing.
-
Notice on corrigendum
The requested paper has a corresponding corrigendum published. Please read the corrigendum first before downloading the article.
-
Article
(10916 KB)
-
The requested paper has a corresponding corrigendum published. Please read the corrigendum first before downloading the article.
- Article
(10916 KB) - Full-text XML
- Corrigendum
- BibTeX
- EndNote


Over the course of the 20th and 21st centuries, the human impact on the natural environment has increased considerably. The transformation of the environment and its effects, previously occurring on a local scale, have now begun to be observed on a regional and global scale. The rapid increase in the impact of human activity since the 1950s has affected both biotic and abiotic aspects of the environment and has been dubbed the “Great Acceleration” (Lewis and Maslin, 2015). The section of the environment undergoing the most substantial changes is the terrestrial part of the Earth's cryosphere. The terrestrial cryosphere responds to climate change mainly through an increase in air temperature, which is particularly rapid in cold areas (Fox-Kemper et al., 2021). Since the second half of the 20th century, there has been a decline in the extent and mass of ice sheets, mountain glaciers, and snow cover, as well as notable melting of permafrost (Fox-Kemper et al., 2021). Considerable changes have also been observed in the river ice phenomena which, due to their periodic nature and the relatively small volume of river ice, are particularly sensitive to climatic variability and human influence (Magnusson et al., 2000; Newton and Mullan, 2021).
Dam reservoirs are an example of anthropogenic elements of the geographic environment that can significantly affect the ice regime of rivers. Such structures change the conditions of ice processes in rivers, mainly through alterations in the flow volume and change in the thermodynamics of rivers downstream of the reservoir location during the winter (e.g., Starosolszky, 1990; Takács et al., 2013; Maheu et al., 2016; Takács and Kern, 2015; Pawłowski, 2015; Apsîte et al., 2016; Chang et al., 2016). In cold and temperate climate zones, due to the occurrence of thermal stratification in the reservoir and the release of bottom hypolimnion waters, the operations of the reservoir cool the river downstream in summer and warm it in winter, which translates into a reduction in the annual amplitude of water temperature. This effect is most pronounced immediately downstream of the reservoir and decreases with increasing distance (Cai et al., 2018). Higher river water temperatures downstream of the reservoirs during winter have been recorded for both large and relatively small reservoirs (<20 m; Maheu et al., 2016). The increase in water temperature downstream of the reservoir may impede the phase transformation and ice cover formation. Reservoirs also act as barriers to moving ice forms. Because ice and ice floes are intercepted, they contribute to the formation of the total ice cover downstream of the dam to a lesser extent (Starosolszky, 1990). Moreover, reservoirs capture ice and sediment which can also result in their reduced amount downstream of the dam. The reduction in suspended material, in turn, leads to fewer nucleating particles which potentially affects the freezing process (Michel, 1961; Osterkamp and Gilfilian, 1975; Carlson, 1981; Chen et al., 2023). Reservoirs also modify the discharge hydrograph. By increasing or decreasing the volume of flow, they can affect the timing of river ice cover formation and breakup (Houkuna et al., 2022).
As a result of dam reservoir operation, the ice regime can be altered, leading to a reduction in the frequency of ice cover over sections ranging from several kilometers to several hundred kilometers, sometimes causing the complete disappearance of ice phenomena (Maheu et al., 2016; Pawłowski, 2015; Chang et al., 2016). Pawłowski (2015) showed that the construction of the Włoclawek dam reservoir on the Vistula River (Poland, central Europe) resulted in a 26 % reduction in the duration of ice cover and a 47 % reduction in all ice phenomena downstream of its location. Chang et al. (2016) showed that the construction of the Longyangxia and Liujiaxia reservoirs on the Yellow River (northern China) resulted in a reduction in the ice cover duration of the river by 8–33 d and a reduction in the thickness of the ice cover by 16–25 cm. This effect has also been noted in small rivers with small- and medium-sized reservoirs. For example, Maheu et al. (2016) showed that the operation of small dam reservoirs in eastern Canada resulted in change in the thermal regime of rivers and the disappearance of ice phenomena in rivers over a distance of 0.3–2.5 km.
Despite the significant role of dam reservoirs in transforming the ice regimes of rivers, the problem is relatively under-researched. Most studies have focused on comparing ice parameters in the riverbed before and after reservoir construction on large lowland rivers for which long measurement series are available. It has been estimated that there are more than 8000 dam reservoirs in ice regime areas, most of which are located in central and northern Europe, eastern Asia, and central North America (Fukś, 2023). The main difficulty in assessing the impact of dam reservoirs on river ice cover comes in distinguishing whether changes are due to operational or climatic factors. So far, in order to study reservoir impact, ice phenomena have been compared during periods with similar thermal conditions (usually determined by the average air temperature of winter) before and after the construction of reservoirs (e.g., Takács et al., 2013; Pawłowski, 2015; Chang et al., 2016). This approach makes it possible to assess the impact of reservoirs only on the basis of selected single years in which the relevant thermal and hydrological conditions occurred. However, in order to accurately characterize the role of reservoirs in transforming the ice regime of rivers, it is necessary to conduct accurate, quantitative assessment of the impact of reservoirs on river ice cover for long periods. Another issue is the small number of studies based on remote sensing data (including radar) for relatively small mountain rivers, where the course of ice processes is poorly understood (Thellman et al., 2021). The shortage of studies results in poor understanding of the extent of the influence of dam reservoirs on river ice cover (especially small mountain rivers), making it difficult to estimate their role on a regional or global scale.
The main objective of this study is to determine the impact of Carpathian dam reservoirs on the ice cover of rivers downstream of their locations based on long observation series and synthetic-aperture radar (SAR) imaging. Specific objectives include to (1) develop and present a method to assess the impact of dam reservoirs on the duration of ice cover based on measurement data from water gauge cross sections and (2) estimate the extent of the impact of dams based on satellite radar imagery (i.e., SAR) and assess the feasibility of using Sentinel-1 satellite radar data to determine the extent of reservoirs' impacts on the ice cover of this type of river. The hypothesis tested in this study is that dam reservoirs, at a local and regional scale, apply direct impact on downstream river systems and alter river ice occurrence more rapidly than climate warming alone.
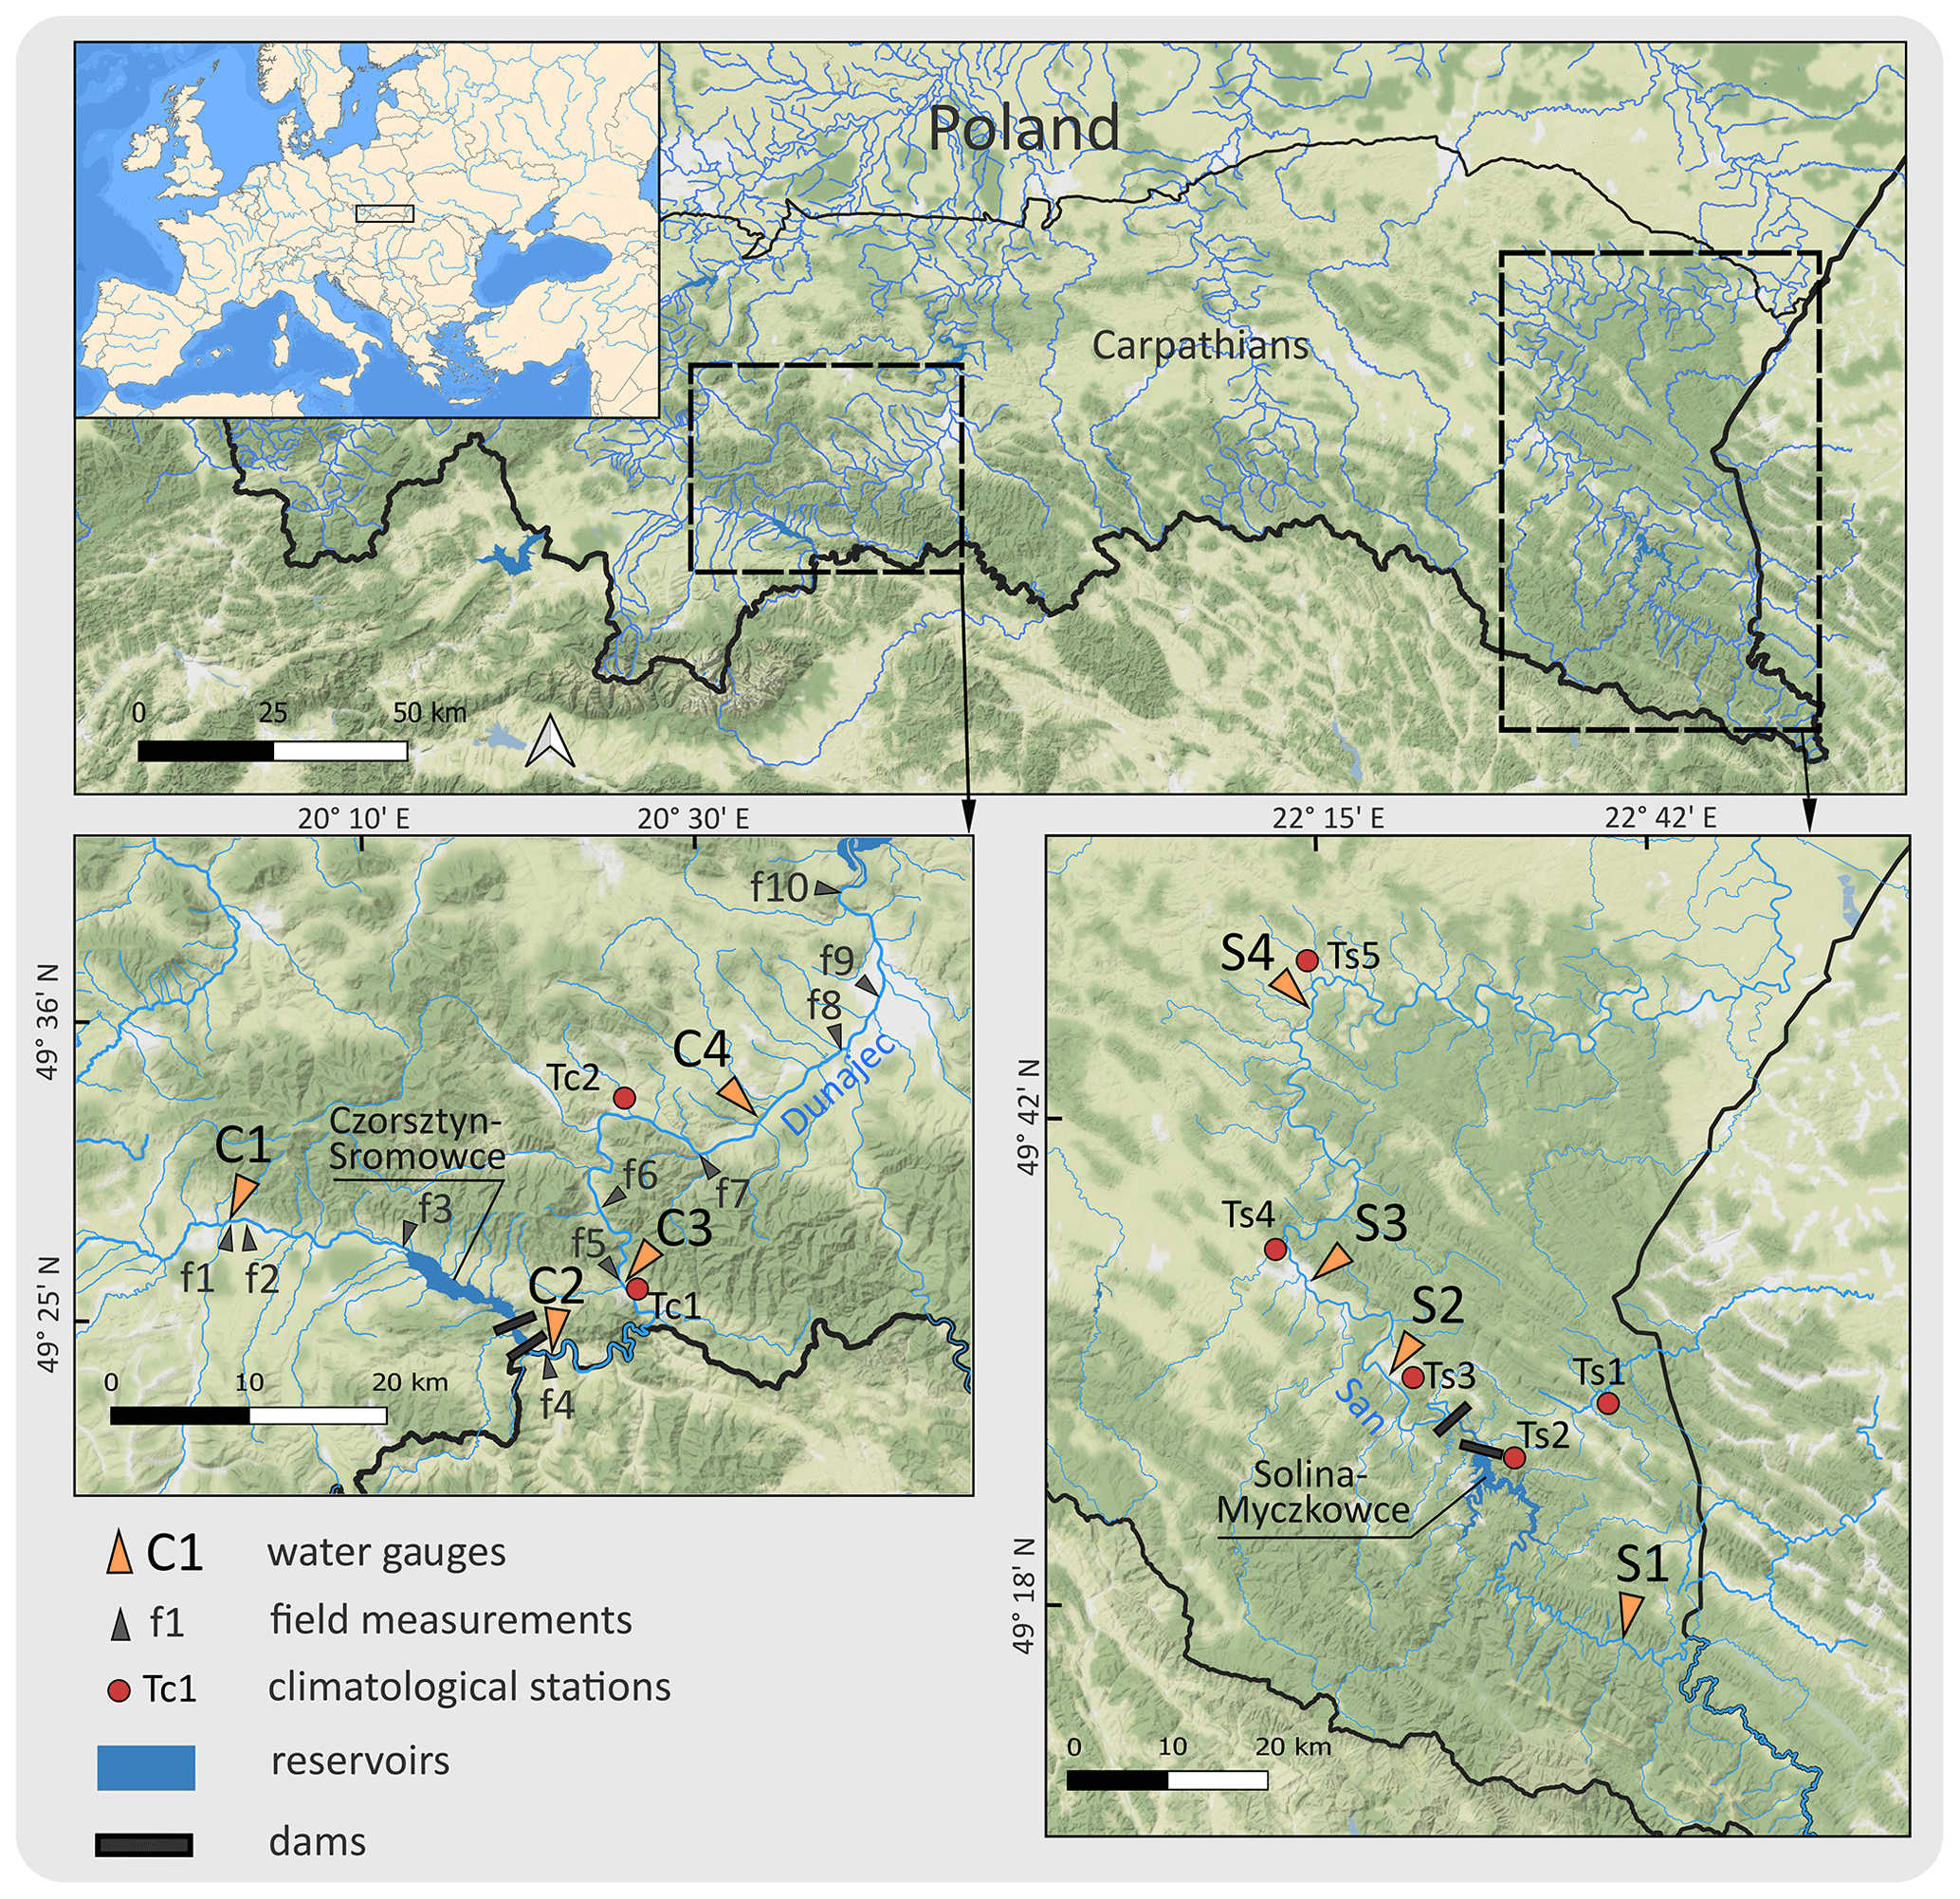
Figure 1Study area and location of measurement stations used in the study. Source: map tiles by Stamen Design, under CC BY 4.0. © OpenStreetMap contributors 2024. Distributed under the Open Data Commons Open Database License (ODbL) v1.0.
2.1 Study area
The study was based on two sets of dam reservoirs located in the Outer Western Carpathians (Solina–Myczkowce) and the Central Western Carpathians (Czorsztyn–Sromowce Wyżne) in central Europe (Fig. 1). These reservoirs are located on two second-order mountain rivers whose sources are in the higher reaches of the Carpathians: the Dunajec and the San rivers. The average annual flow of the Dunajec at its mouth is more than 84 m3 s−1 with a catchment area of 6735 km2, while that of the San averages 134 m3 s−1 with a catchment area of 16 824 km2 (Punzet, 1991). The width of the rivers in the sections downstream of the dams varies from 30 m to more than 100 m. The basic characteristics of both sets of reservoirs are shown in Table 1.
Table 1Characteristics of the studied reservoirs.
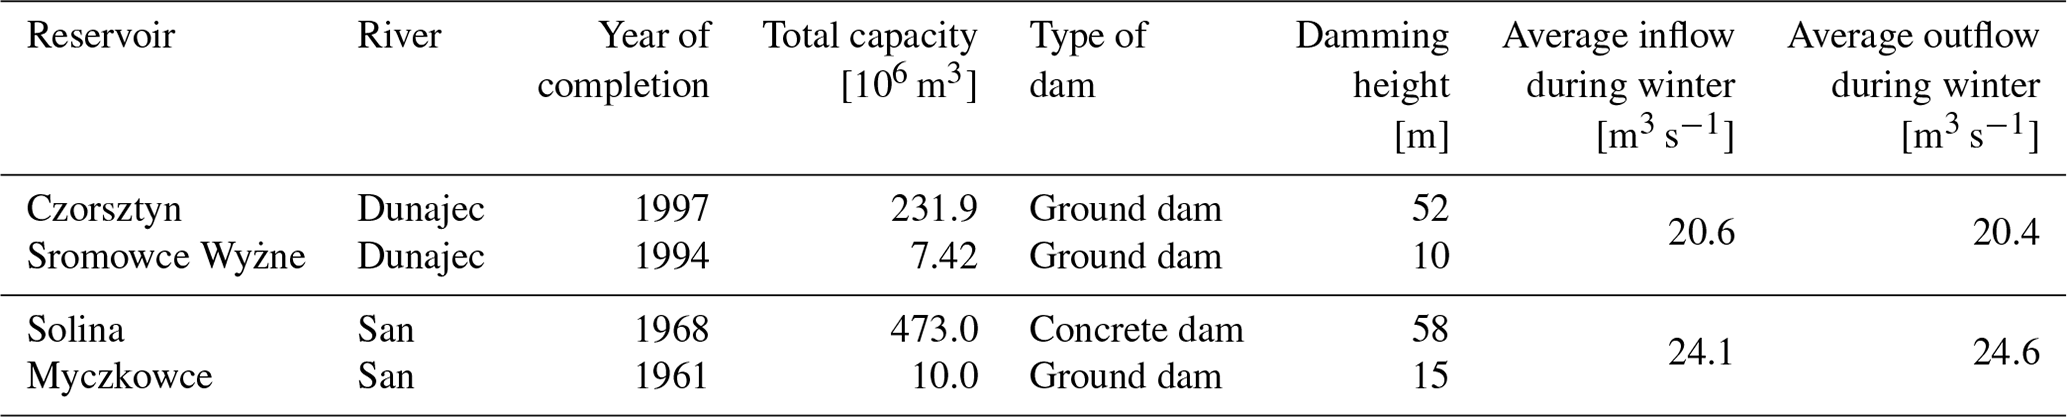
Source of data: Hennig et al. (1991) and Kloss (2003).
The two reservoir complexes studied here consist of a main reservoir and an equalization reservoir. The Czorsztyn and Solina reservoirs are intended mainly for electricity production and also play a role in flood control, while the Sromowce and Myczkowce reservoirs serve as equalizing reservoirs for daily flow fluctuations caused by the operation of hydroelectric power plants. Both reservoirs significantly affect the thermal regime of the rivers downstream of their locations. It has previously been shown that the operation of the hydroelectric power plant at the Solina reservoir significantly transforms the thermal regime of the Myczkowce reservoir, and consequently of the river downstream, warming it in winter by about 2 °C (Lewińska and Lewiński, 1972). In the case of the Czorsztyn–Sromowce reservoir complex, studies have shown that those reservoirs warm the temperature of the Dunajec waters downstream of the complex by 1–2 °C (Wiejaczka et al., 2015; Kędra and Wiejaczka, 2018). In addition, the synchronization between air and water temperatures in the river downstream of the reservoirs was disrupted by the dam operation (Kędra and Wiejaczka, 2016). Both reservoirs transform the discharge of the river downstream of their locations, relative to natural conditions, due to the operation of hydroelectric power plants and equalization reservoirs. During the winter this is evidenced by the rise in river water levels downstream of the reservoirs.
The San River catchment area (Solina–Myczkowce reservoir complex) is characterized by low population density (<20 people km−2). No large cities are located along the river, and the entire upper part of the catchment area is located within Bieszczady National Park and is protected. Therefore, it can be assumed that the ice and thermal regime of this river is not significantly impacted by human activity (except for the operation of the reservoir). In the case of the Dunajec River (Czorsztyn–Sromowce reservoir complex), the population density is higher and reaches up to 200 people km−2. The upper part of the Dunajec River basin is located within Tatra National Park and is protected. Several cities and dozens of villages with tourist infrastructure (e.g., winter tourism, skiing, and thermal pools) are located along the studied river and its tributaries. Therefore, it can be assumed that the temperature of surface waters and the ice regime may be affected to some extent (for example, through the emission of thermal pollutants into rivers), but the scale of impact is difficult to estimate due to the lack of data.
The main reasons for selecting these sites for the study were the good availability of hydrological and meteorological data, as well as the location and characteristics of these reservoirs. In terms of their size, these reservoirs represent typical facilities for ice cover areas. According to the Global Reservoir and Dam Database (GRanD), as well as calculations presented by Fukś (2023), in areas where river ice cover occurs, reservoirs with dam heights ranging between 41 and 60 m account for about 20 % of all reservoirs (Lehner et al., 2011). The large number of similar reservoirs in areas of river ice cover allows the results to be applied to other similar facilities and rivers. In addition, there are not enough studies in the literature on ice phenomena in relatively small mountain rivers due to the lack of observational data, the difficulty of conducting observations with remote sensing data, and the greater practical significance of large rivers (Thellman et al., 2021).
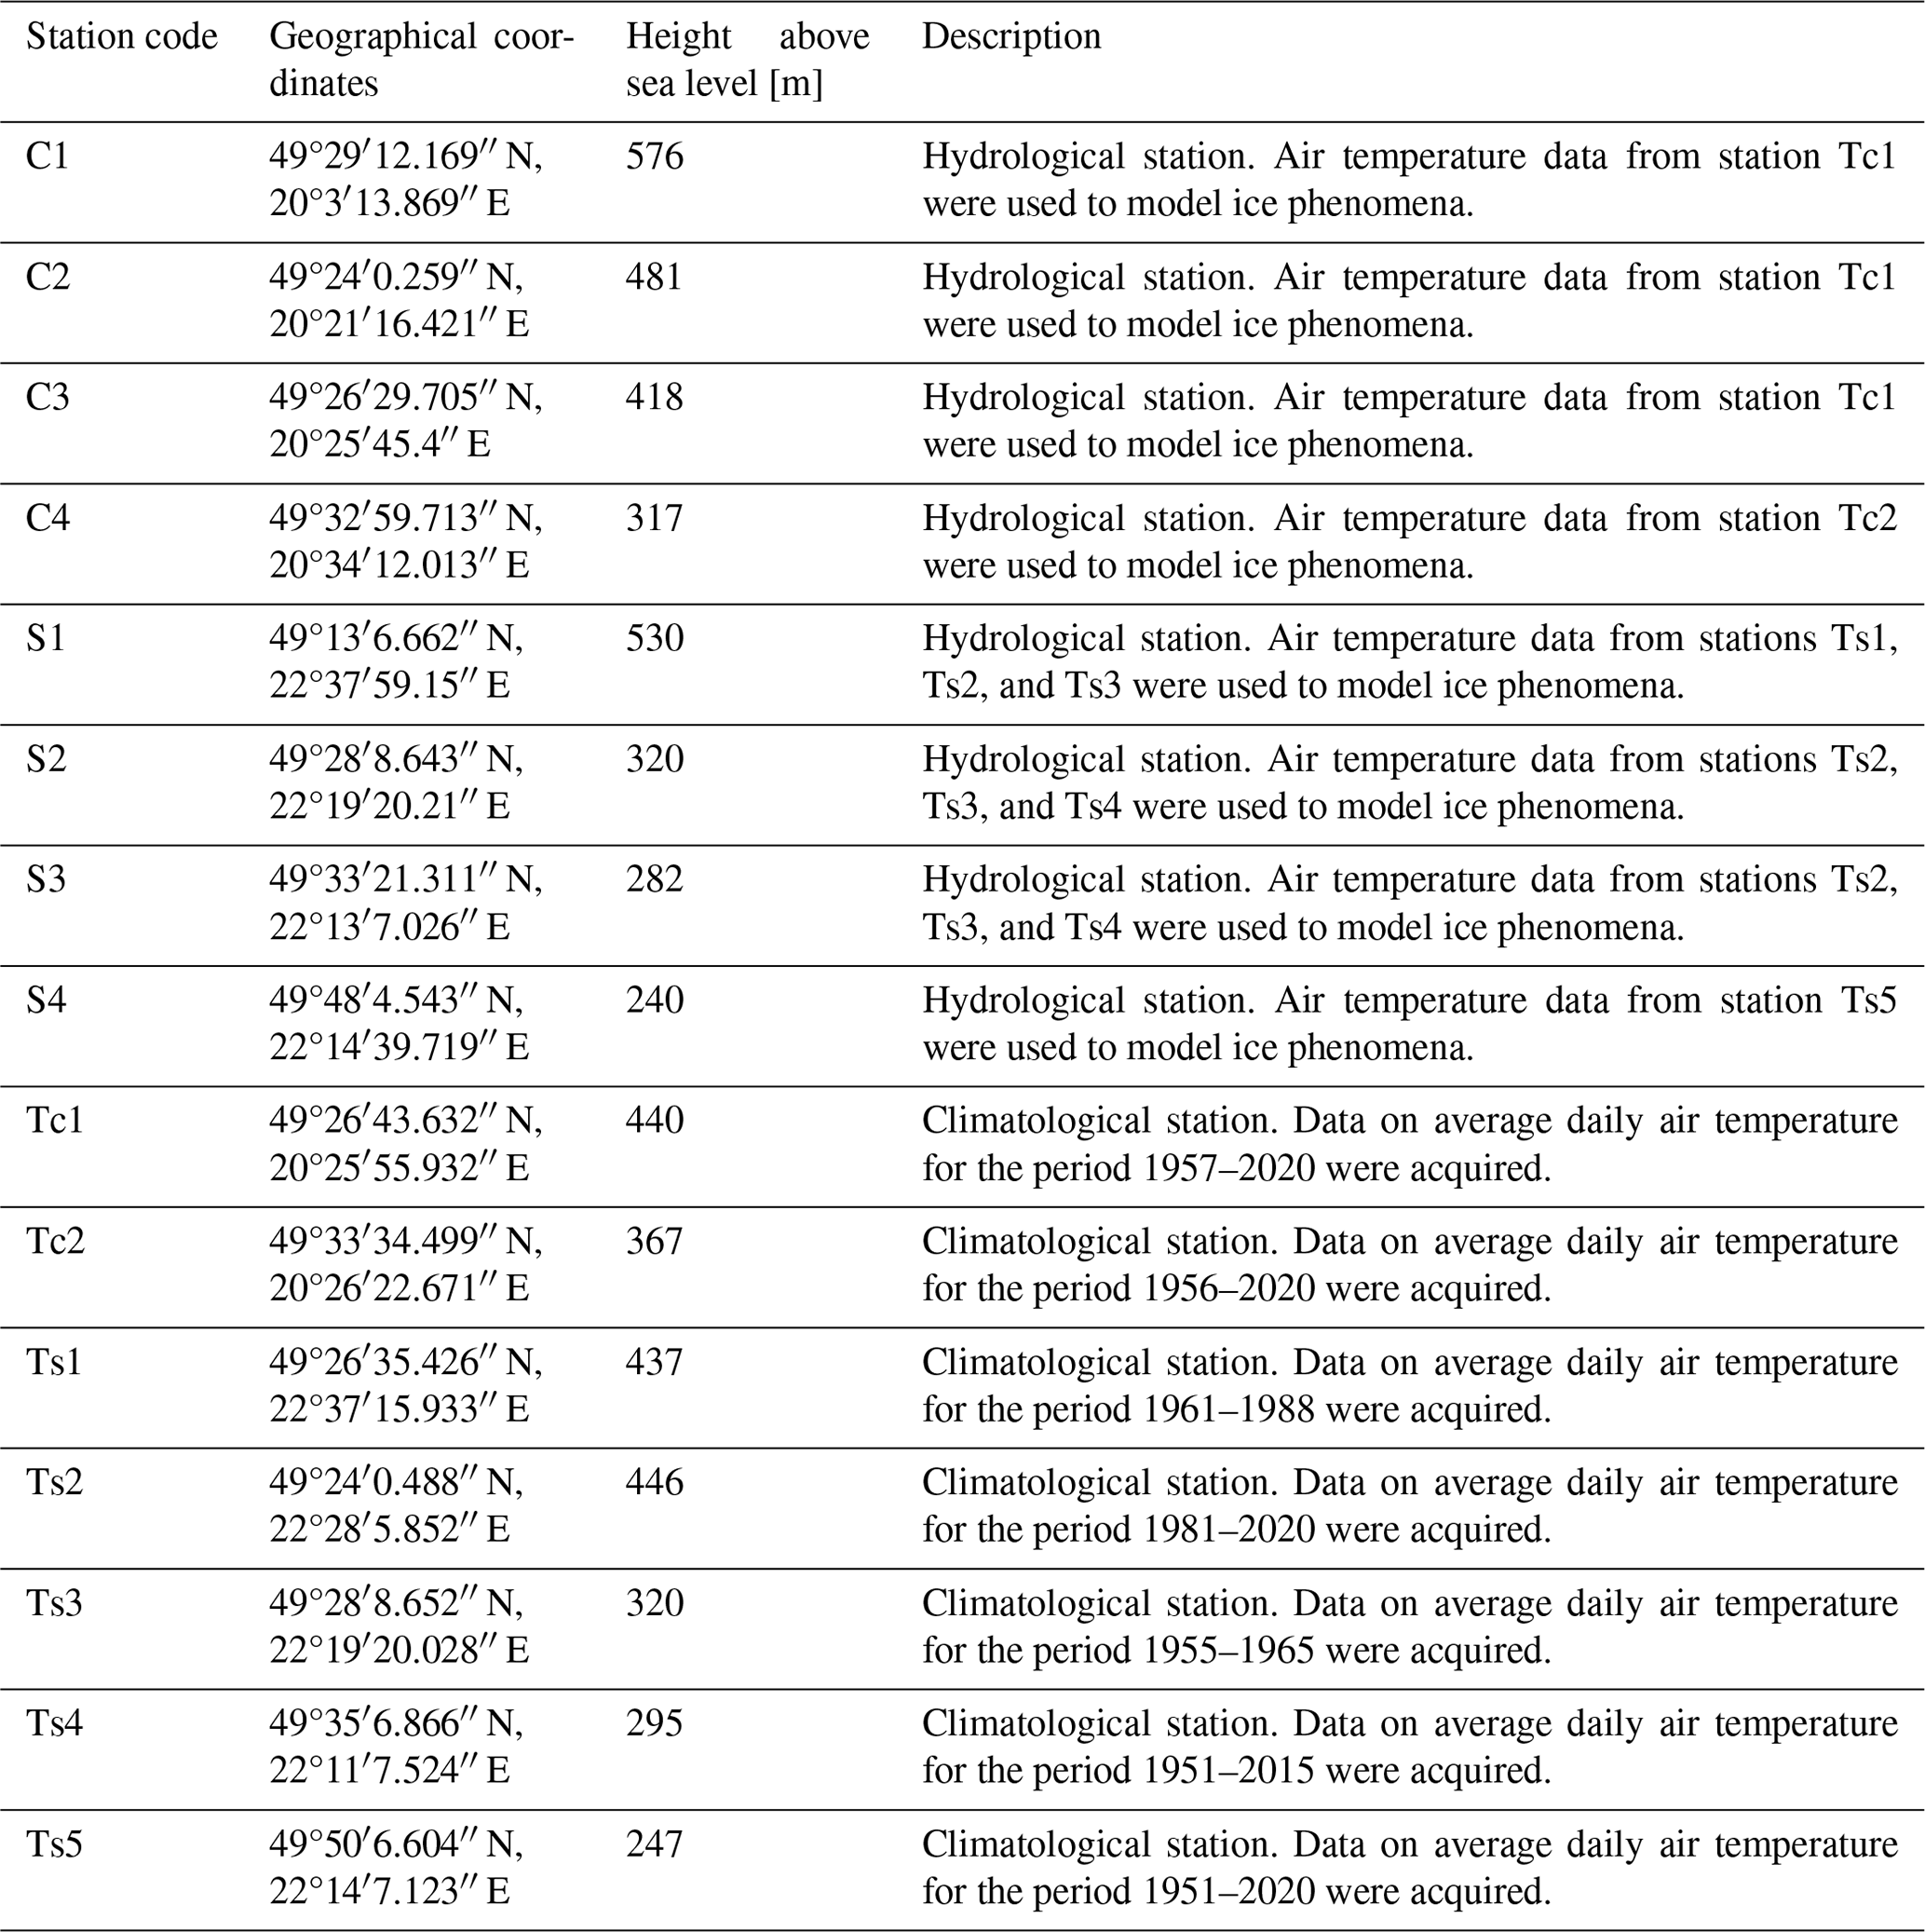
Table 2Characteristics of hydrological and climatological stations.
2.2 Data and methods
In order to estimate the impact of dam reservoirs on river ice cover, data on the daily occurrence of ice cover over the period 1950–2020 were obtained at eight water gauge cross sections (four for each reservoir complex studied) (Fig. 1). The occurrence of ice cover at a water gauge cross section was defined as any occurrence of total ice cover (water surface completely covered by ice) or border ice (partial coverage of the water surface by ice). In both cases, one cross section was located upstream of the reservoir (C1: 14.6 km; S1: 28.5 km), while the others were located downstream of the reservoir location at distances ranging from several to tens of kilometers from the reservoir (C2: 1.8 km; C3: 22 km; C4: 52 km; S2: 11.7 km; S3: 33 km; S4: 80.5 km; Table 2). Data on the occurrence of ice phenomena each day of the winter periods (November to March) during 1950–1980 were obtained from hydrological yearbooks published by the Polish State Hydrological and Meteorological Institute. These yearbooks were issued only in printed form, so for this study they were digitized by manually transcribing data on daily ice cover occurrence. Data on the occurrence of ice cover during 1981–2020 were obtained from the online public database of the Institute of Meteorology and Water Management – National Research Institute (IMGW-PIB; see the “Data availability” section). Data on the course of average daily air temperature at climatological stations were also obtained from the IMGW-PIB public database. For the Solina–Myczkowce reservoir complex, climatological data were obtained from five stations (Ts1, Ts2, Ts3, Ts4, and Ts5), while for the Czorsztyn–Sromowce reservoir complex they were obtained from two (Tc1 and Tc2; Table 2). The acquired data on the occurrence of ice cover were subjected to analysis involving a comparison of the average duration of ice cover before and after the formation of the reservoirs at stations upstream and downstream of reservoir locations, as well as a comparison of the two studied rivers. Data from periods for which there were no observations, or for which observations were incomplete, were excluded from the statistical analysis.
The difference in elevation between hydrological and climatological stations is relatively small. In the case of the Dunajec River catchment, the altitude of the hydrological stations used ranges from 317 to 576 m above sea level, while the climatological stations range from 367 to 440 m above sea level. In the case of the San River basin, the altitude of the hydrological stations used varies and ranges from 240 to 530 m above sea level, while the climatological ones range from 247 to 437 m above sea level. The distances between the climatological and hydrological stations are also relatively small (Fig. 1). The short distances and the lack of significant differences in elevation make it possible to assume that the data from the climatological stations reflect the conditions at the hydrological stations relatively accurately.
The acquired data on average daily air temperatures from climatological stations (Tc1, Tc2, Ts2, Ts4, and Ts5) were analyzed for trends. The non-parametric Mann–Kendall test was used to detect them, while the Theil–Sen estimator was used to determine the magnitude of changes (Mann, 1945; Theil, 1950; Sen, 1968; Kendall, 1975). The trend incidence analysis was carried out for entire periods where data were available, as well as for a uniform period (1982–2015) for all stations. Results at the p<0.05 level were accepted as statistically significant. The analysis was carried out for the average values of each month and for the entire winter period (November to December).
In order to separate the effects of climate change and reservoir operations on the ice cover of the studied rivers, a logistic regression method was used to model the relationship between air temperature and ice cover occurrence. Logistic regression is a method that allows the classification of a dichotomous explanatory variable based on one or more explanatory variables. The method was first proposed by Cox (1958) and is widely used in classification and prediction in natural science research. Previously, it has been used in studies of river ice phenomena (Yang et al., 2020; Wu et al., 2021) and the delineation of flood-prone areas (Lee and Kim, 2021) or of areas susceptible to landslides (Ayalew and Yamagishi, 2005), among other applications, but it has not been used in studies of the effects of dam reservoirs. Logistic regression analysis is based on the concept of odds that represent the ratio of the probability (p) that an event will occur and the probability that the event will not occur and is expressed by Eq. (1):
In order to carry out a binary classification of the dependent variable on the basis of the continuous independent variable, a logit transformation was applied by logarithmizing the odds, as expressed by Eq. (2):
where x1 is the explanatory variable and β0 and β1 are regression coefficients that are estimated using the maximum likelihood method. The probability of ice cover occurrence on a given day (p) is calculated using Eq. (3), and classification is done by applying a threshold value of probability that separates the occurrence of ice cover from its absence:
where x1 is the average air temperature of the 14 d prior to each day. The average air temperature from the 14 d preceding each modeled day was selected based on preliminary tests (not shown). These tests consisted of testing the predictive ability (accuracy and area under the receiver operating characteristic curve (ROC AUC)) of the logistic regression model for the occurrence of ice cover based on the average daily air temperatures from 2 to 20 d prior to each modeled day. The analyses showed that in most cases, taking the average from 14 d resulted in the best predictive ability of the models.
The first stage of analysis required coding of the data from the water gauge stations, with a value of 1 assigned to each day in which ice cover occurred and a value of 0 assigned if it did not occur from November to March over the entire study period. Sometimes the period was shorter than 70 years due to data gaps. Each record was assigned an average air temperature from 14 d before the modeled day determined from measurements from the nearest climatological station. In some cases, data from several nearby stations were used simultaneously due to gaps in measurement data. Based on the acquired database, we used a logistic regression model of the relationship between the course of the average air temperature from 14 d before the modeled day and the occurrence of ice cover in the period before the dam reservoirs were built for each water gauge station. For the water gauges on the Dunajec River (C1–C4), data from 1 November 1957 to 31 March 1990 were used as the set for training the model, while for the San River, data from 1 November 1956 to 31 March 1967 (S1) or 14 January 1951 to 31 March 1967 (S2–S4) were used, depending on the station. The data for building the model were divided into a training set and a test set in the ratio of 70 : 30. Model training and hyperparameter optimizations (C – inverse of regularization strength) were carried out based on the training set. Stratified cross-validation was used to avoid over-fitting the model on the training set, and the quality of the resulting models was determined by the prediction accuracy and the value of the area under the receiver operating characteristic (ROC) curve on the test set (ROC-AUC value). Based on the obtained models, for each adopted winter period, the probability of ice cover occurrence at the tested cross sections was calculated based on the average air temperature, from which it was determined whether ice cover could occur on a given day. Then, the ice cover occurrence data calculated from the model based on the course of the average air temperature were compared with actual observations of ice cover at all stations. In this study, it was assumed that the difference between the number of days with ice cover predicted by the model and the number of days with ice observed at the stations was due to the operation of dam reservoirs. In order to validate these results, the results of modeling and observations from stations upstream and downstream of the reservoir were compared. All calculations were carried out using Python and the scikit-learn library.
The period of January to February 2017 was chosen to determine the spatial extent of the impact of dam reservoirs on river ice cover based on remote sensing data. The analysis of radar (i.e., SAR) data was aimed at determining the sections of the studied rivers downstream of the reservoirs on which ice cover did not form despite the maintenance of favorable air temperatures. Remote sensing data were used because it was not possible to estimate this parameter based on data from water gauge stations, due to the small number of stations and large distances between them. The year 2017 was chosen due to the persistence of very low air temperatures in the study areas during this period. Many stations recorded the lowest average January temperature since 2006 (−7.3 °C) at this point, and occasionally, the air temperature reached as low as −20 °C. It was found that such air temperature resulted in the persistence of ice cover on the studied rivers before the construction of dam reservoirs. Moreover, during this period, ice cover was observed at the water gauge cross sections upstream of the two reservoirs from the beginning of December to the end of February.
The occurrence of ice cover was determined on the basis of radar (i.e., SAR) images acquired by Sentinel-1 satellites. In the first stage, the area of rivers (water surface) downstream of the studied reservoirs was determined by manually creating polygons on the basis of aerial photos and cloudless Sentinel-2 satellite images. River areas in the vicinity of hydraulic structures (bridges), narrow river sections (<30 m in width), and areas close to the banks (about 10 m from the shore) were excluded from the analysis, which made it possible to exclude pixels partially covering areas other than the water surface. Then, for the designated polygons, Sentinel-1 SAR interferometric ground-range-detected (IW GRD) imagery was acquired from 5 different days for both studied rivers (Table 3).
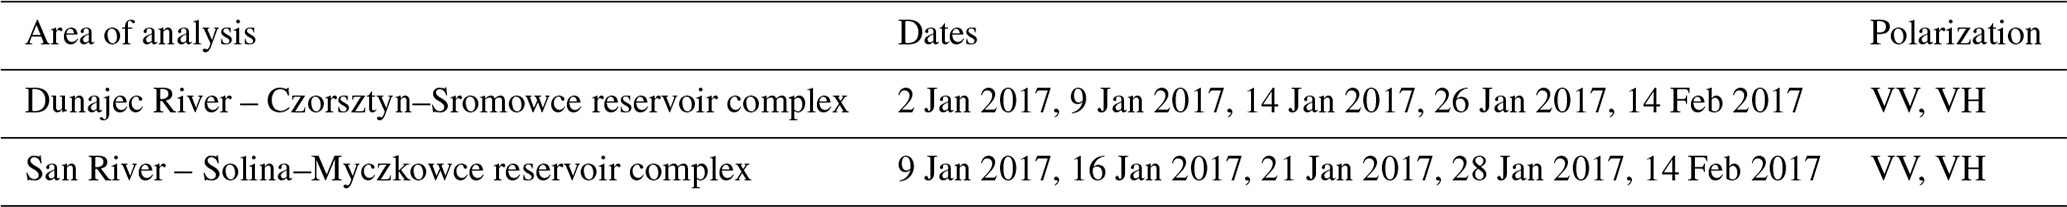
Data from descending orbits in vertical–vertical (VV) and vertical–horizontal (VH) polarization were used. This study used imagery provided by Google Earth Engine, in which orbit metadata were updated, border noise was removed, thermal noise was removed, radiometric calibration values were applied, and terrain correction was performed. After preprocessing, the data had a spatial resolution of 10 m. In order to classify the acquired images (water/ice), thresholds of the backscattering coefficient that separated the occurrence of ice cover from water were determined for both studied rivers. This determination of the presence of ice cover was made possible by the marked contrast between the two classes (ice/water) due to the significant effect of ice cover presence on the backscattering coefficient of the microwave radiation beam (Stonevicius et al., 2022; Palomaki and Sproles, 2022). Consolidated ice tends to have significantly higher backscattering values than water, mainly due to the roughness of ice surface. For this purpose, the value of the backscattering coefficient was used for designated sections of rivers completely covered by ice (14 January for the Dunajec River and 9 January for the San River). These sections were determined on the basis of cloudless images from the Sentinel-2 satellite. The thresholds of the values separating the two classes were calculated separately for the two studied rivers according to Eq. (4):
where σ is the average backscatter from selected sections of ice-covered rivers and s is the average standard deviation of σ (Sobiech and Dierking, 2013). For the Dunajec River, the thresholds were set at −19.24 dB for VH polarization and −10.16 dB for VV polarization, while for the San River they were set at −21.16 for VH polarization and −11.55 for VV polarization. The results were validated by comparing the classification results of Sentinel-1 radar imagery with optical imagery acquired by the Sentinel-2 satellite for the Dunajec area acquired on 14 February 2017.
In order to identify the causes of the transformation of the ice regime of the rivers resulting from the operations of the dam reservoirs, data on daily water level and temperature, as well as flow volume at station C3 for 1984–2020, were obtained (IMGW-PIB; see the “Data availability” statement). The choice of the Dunajec River and station C3 for the in-depth analysis was due to the availability of data for the periods before and after reservoir construction. Based on the collected data, the variability of river parameters was analyzed in the period after the construction of the reservoir complex (1996–2020) as compared with the period before the construction (1984–1995). In addition, in order to identify in detail the impact of the dam reservoir on the variability of water temperature and the occurrence of ice cover in the longitudinal profile of the river, field measurements were carried out on 5 December 2023. This day, in the study area, was preceded by a period of approximately 6 d with negative air temperatures reaching −10 °C. The assessment of the occurrence of ice phenomena was carried out visually. (The types of ice phenomena and the percentage of the channel occupied by ice were determined.) Water temperature measurements were conducted at 10 points (3 upstream of the reservoir and 7 downstream of the reservoir) using an Elmetron CC-315 conductivity meter.
The average air temperature in winter (November to March) during the studied periods at stations in the Dunajec River basin (Czorsztyn–Sromowce reservoir complex) ranged from −0.54 °C (station Tc1) to 0.36 °C (station Tc2). At both stations January was the coldest month in the winter period (−3.51 °C at station Tc1 and −2.47 °C at station Tc2), and the warmest month was November (2.92 °C at station Tc1 and 3.43 °C at station Tc2). At climatological stations in the San River basin (Solina–Myczkowce reservoir complex), average winter air temperatures ranged from −0.04 °C (at station Ts5) to 0.2 °C (at station Ts2; Fig. 2). The warmest month at these stations was November (3.63 °C at station Ts2, 3.71 °C at station Ts4, and 3.46 °C at station Ts5) and the coldest was January (−2.48 °C at station Ts2, −2.79 °C at station Ts4, and −3.04 °C at station Ts5).
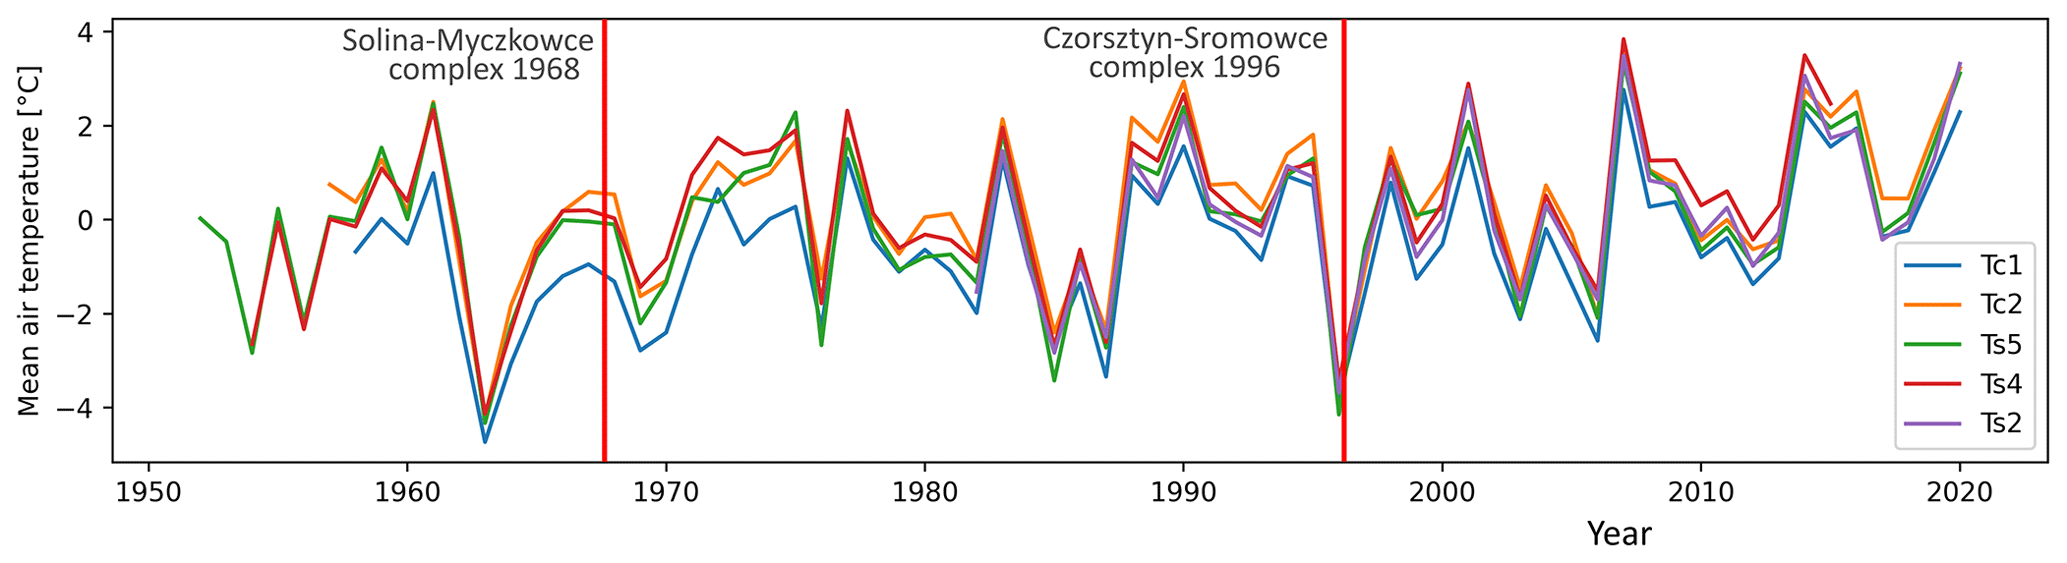
Figure 2Average air temperature in winter (November to March) at stations Tc1 (1958–2020), Tc2 (1957–2020), Ts2 (1982–2020), Ts4 (1954–2015), and Ts5 (1952–2020).
In the period after the construction of the Czorsztyn–Sromowce reservoir complex, the surveyed stations recorded a slight decrease in the average air temperature in winter period compared with the period prior to the dam development. The average air temperature in winter (November to March) during 1985–1995 (10 years before the construction of the Czorsztyn–Sromowce reservoir complex) at stations Tc1 and Tc2 (in the Dunajec River basin) amounted to −0.36 and 0.55 °C, respectively. In the 10-year period after the reservoir construction (1996–2006), the average air temperature was slightly lower at both stations: −1.07 °C at station Tc1 and 0.44 °C at station Tc2. After the construction of the Solina–Myczkowce reservoir complex, the studied stations recorded a slight increase in average air temperature compared with the period prior to the dam development. For the Ts4 and Ts5 stations, the average winter temperature in the 10 years before the construction of the Solina–Myczkowce reservoir complex (1957–1967) amounted to −0.33 and −0.38 °C, respectively. In the 10 years after the construction of the reservoir (1968–1978), the temperature was slightly higher and amounted to 0.53 and 0.05 °C, respectively.
As for the average air temperature in winter, a statistically significant trend was recorded only at station Tc1 (0.3 °C per decade) during 1958–2020. In the entire study area, there was a statistically significant trend in the average temperature in November during 1982–2015, reaching 0.9 °C per decade. No statistically significant trends were recorded in other months (Table 4).
Table 4Trends in average air temperature by month and over the entire winter period.
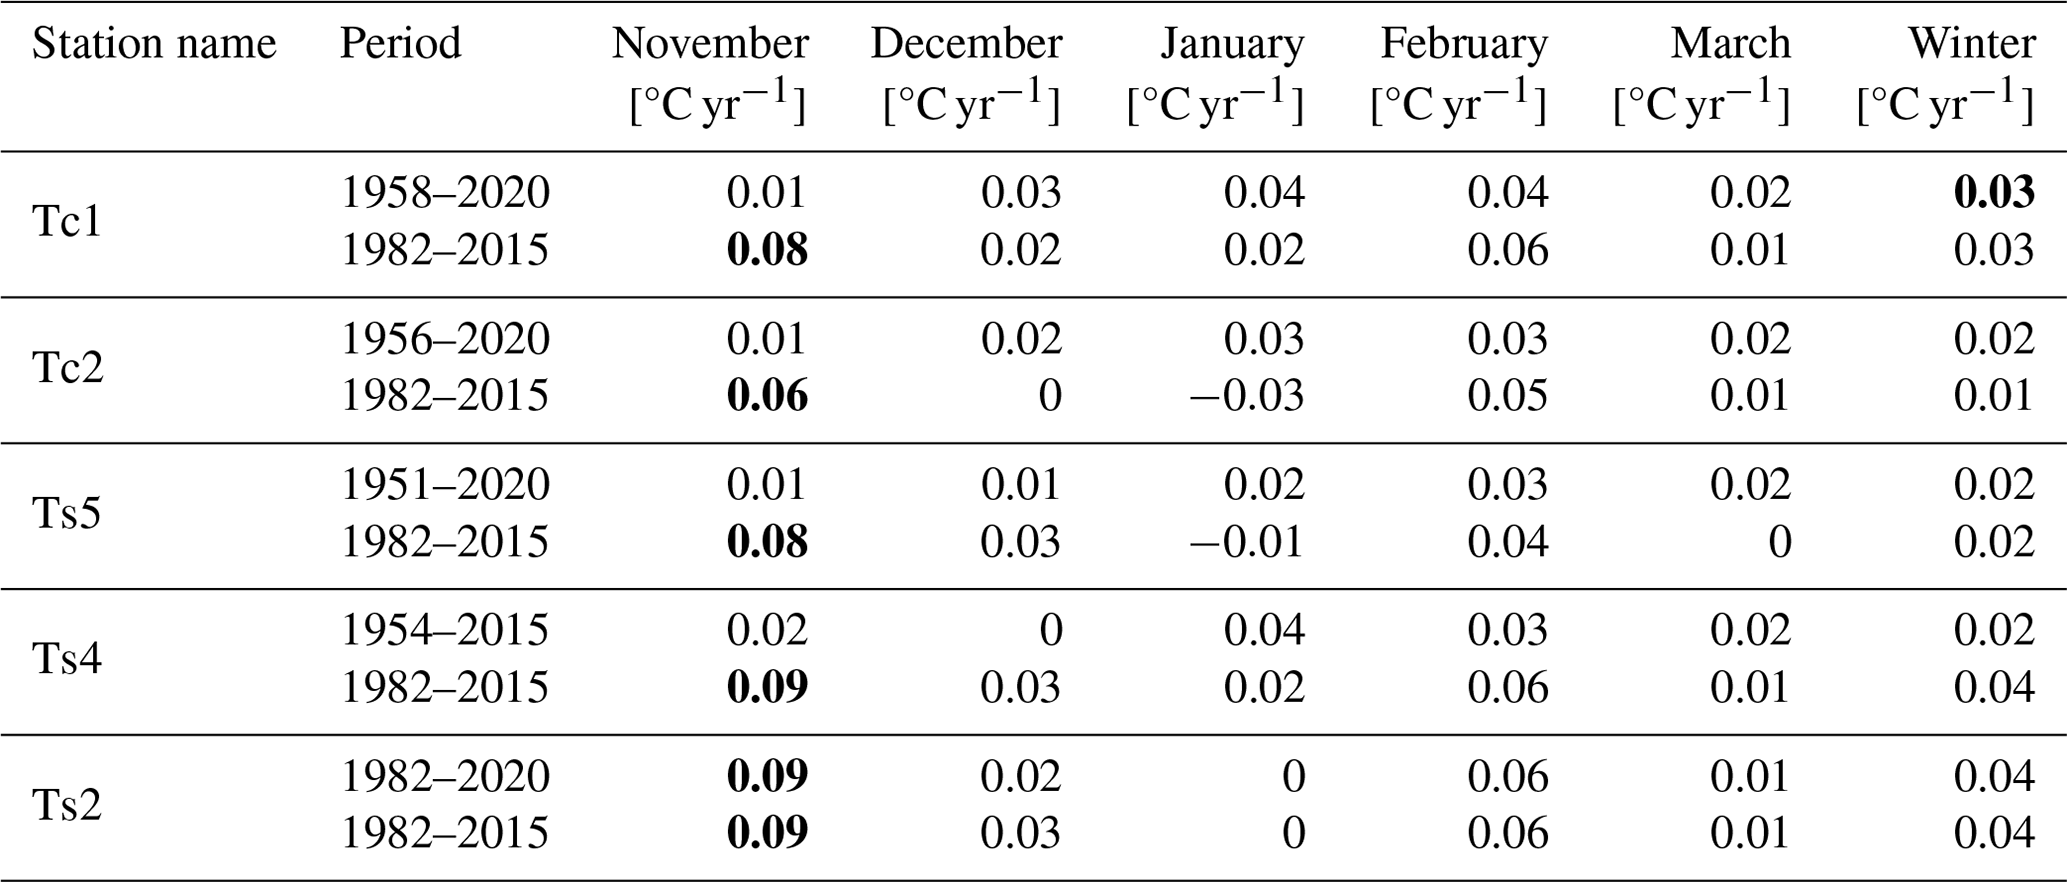
Statistically significant results at p<0.05 are marked in bold.
For both studied rivers, the highest average annual number of days with ice cover during the study period occurred at cross sections located upstream of the dam reservoirs: 65 d at point C1 (Dunajec) and 75 d at point S1 (San; Figs. 3 and 4). At cross sections downstream of the reservoirs, the average annual number of days with ice cover ranged from 45–53 d for the Czorsztyn–Sromowce reservoir complex (C2–C4) and from 32–46 d for the Solina–Myczkowce reservoir complex (S2–S4). In all studied cross sections, a decrease in the frequency of ice cover was observed after the reservoirs were put into operation (Figs. 3 and 4).
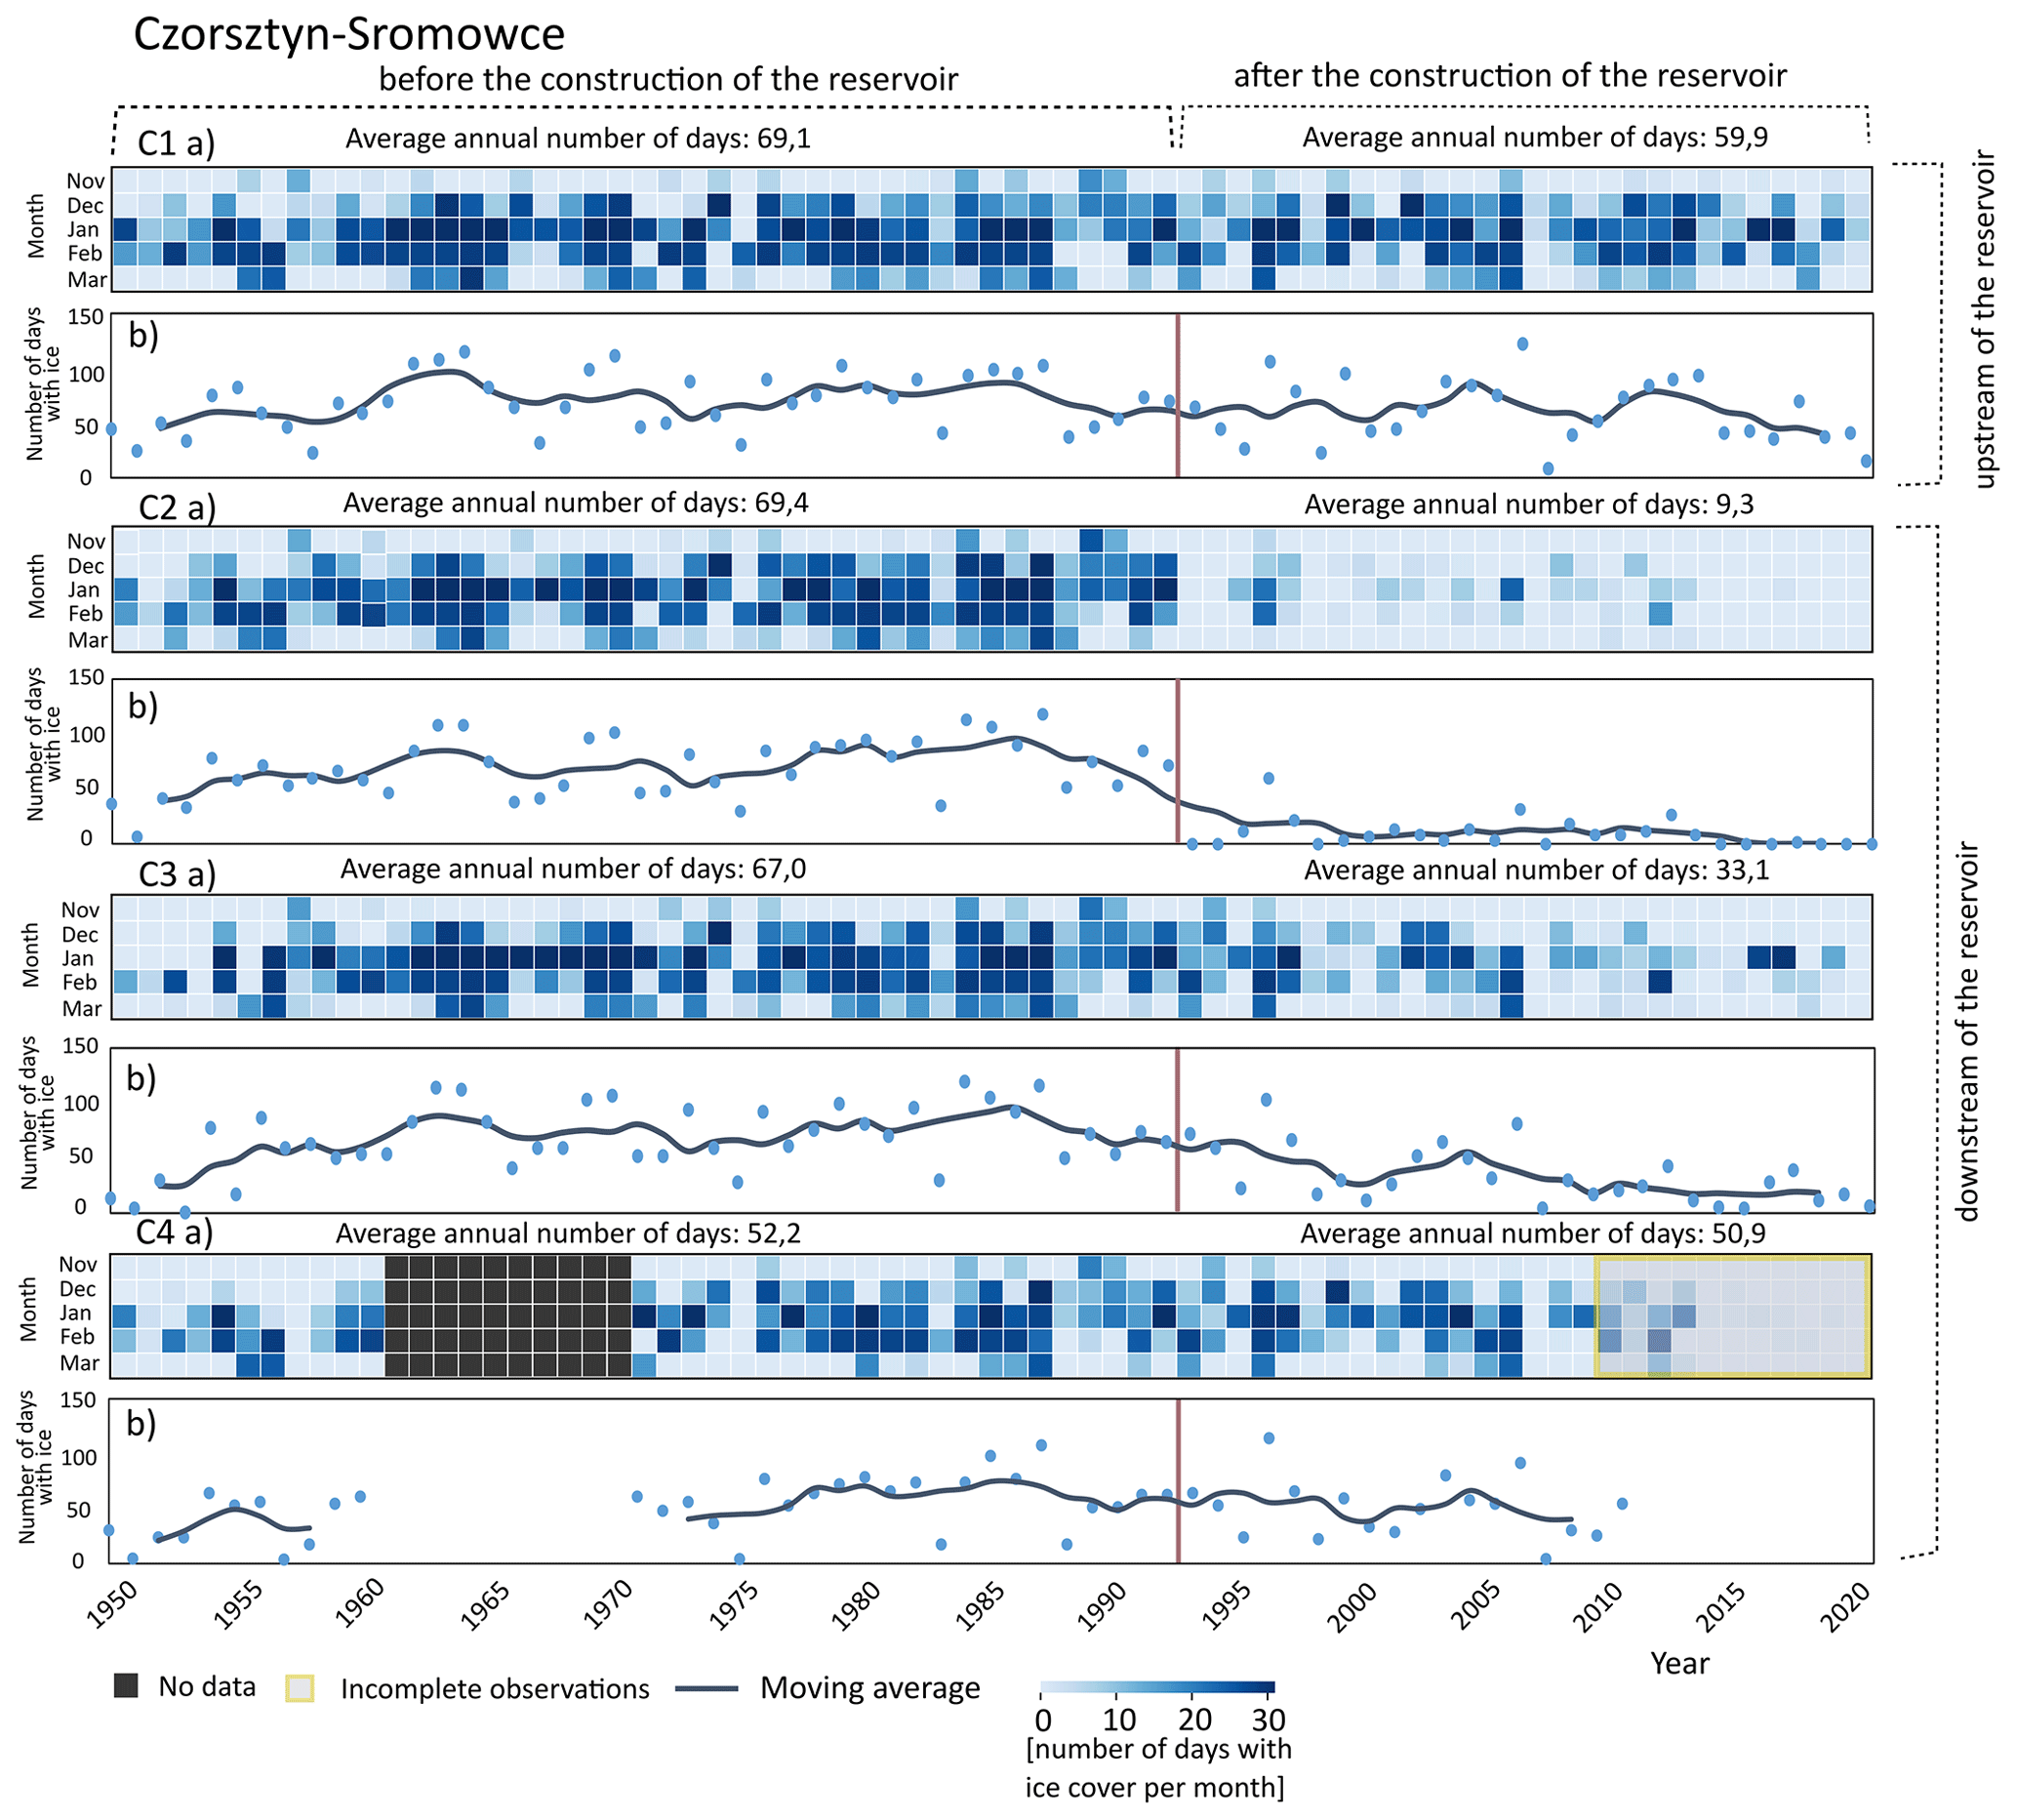
Figure 3Observed number of days with ice cover on the Dunajec River in each month at water gauge stations (a) and annual sum of the number of days with ice cover with a 5-year moving average (b). The year of construction of the reservoir was taken as 1992 (the year before the construction of the Sromowce Wyżne reservoir).
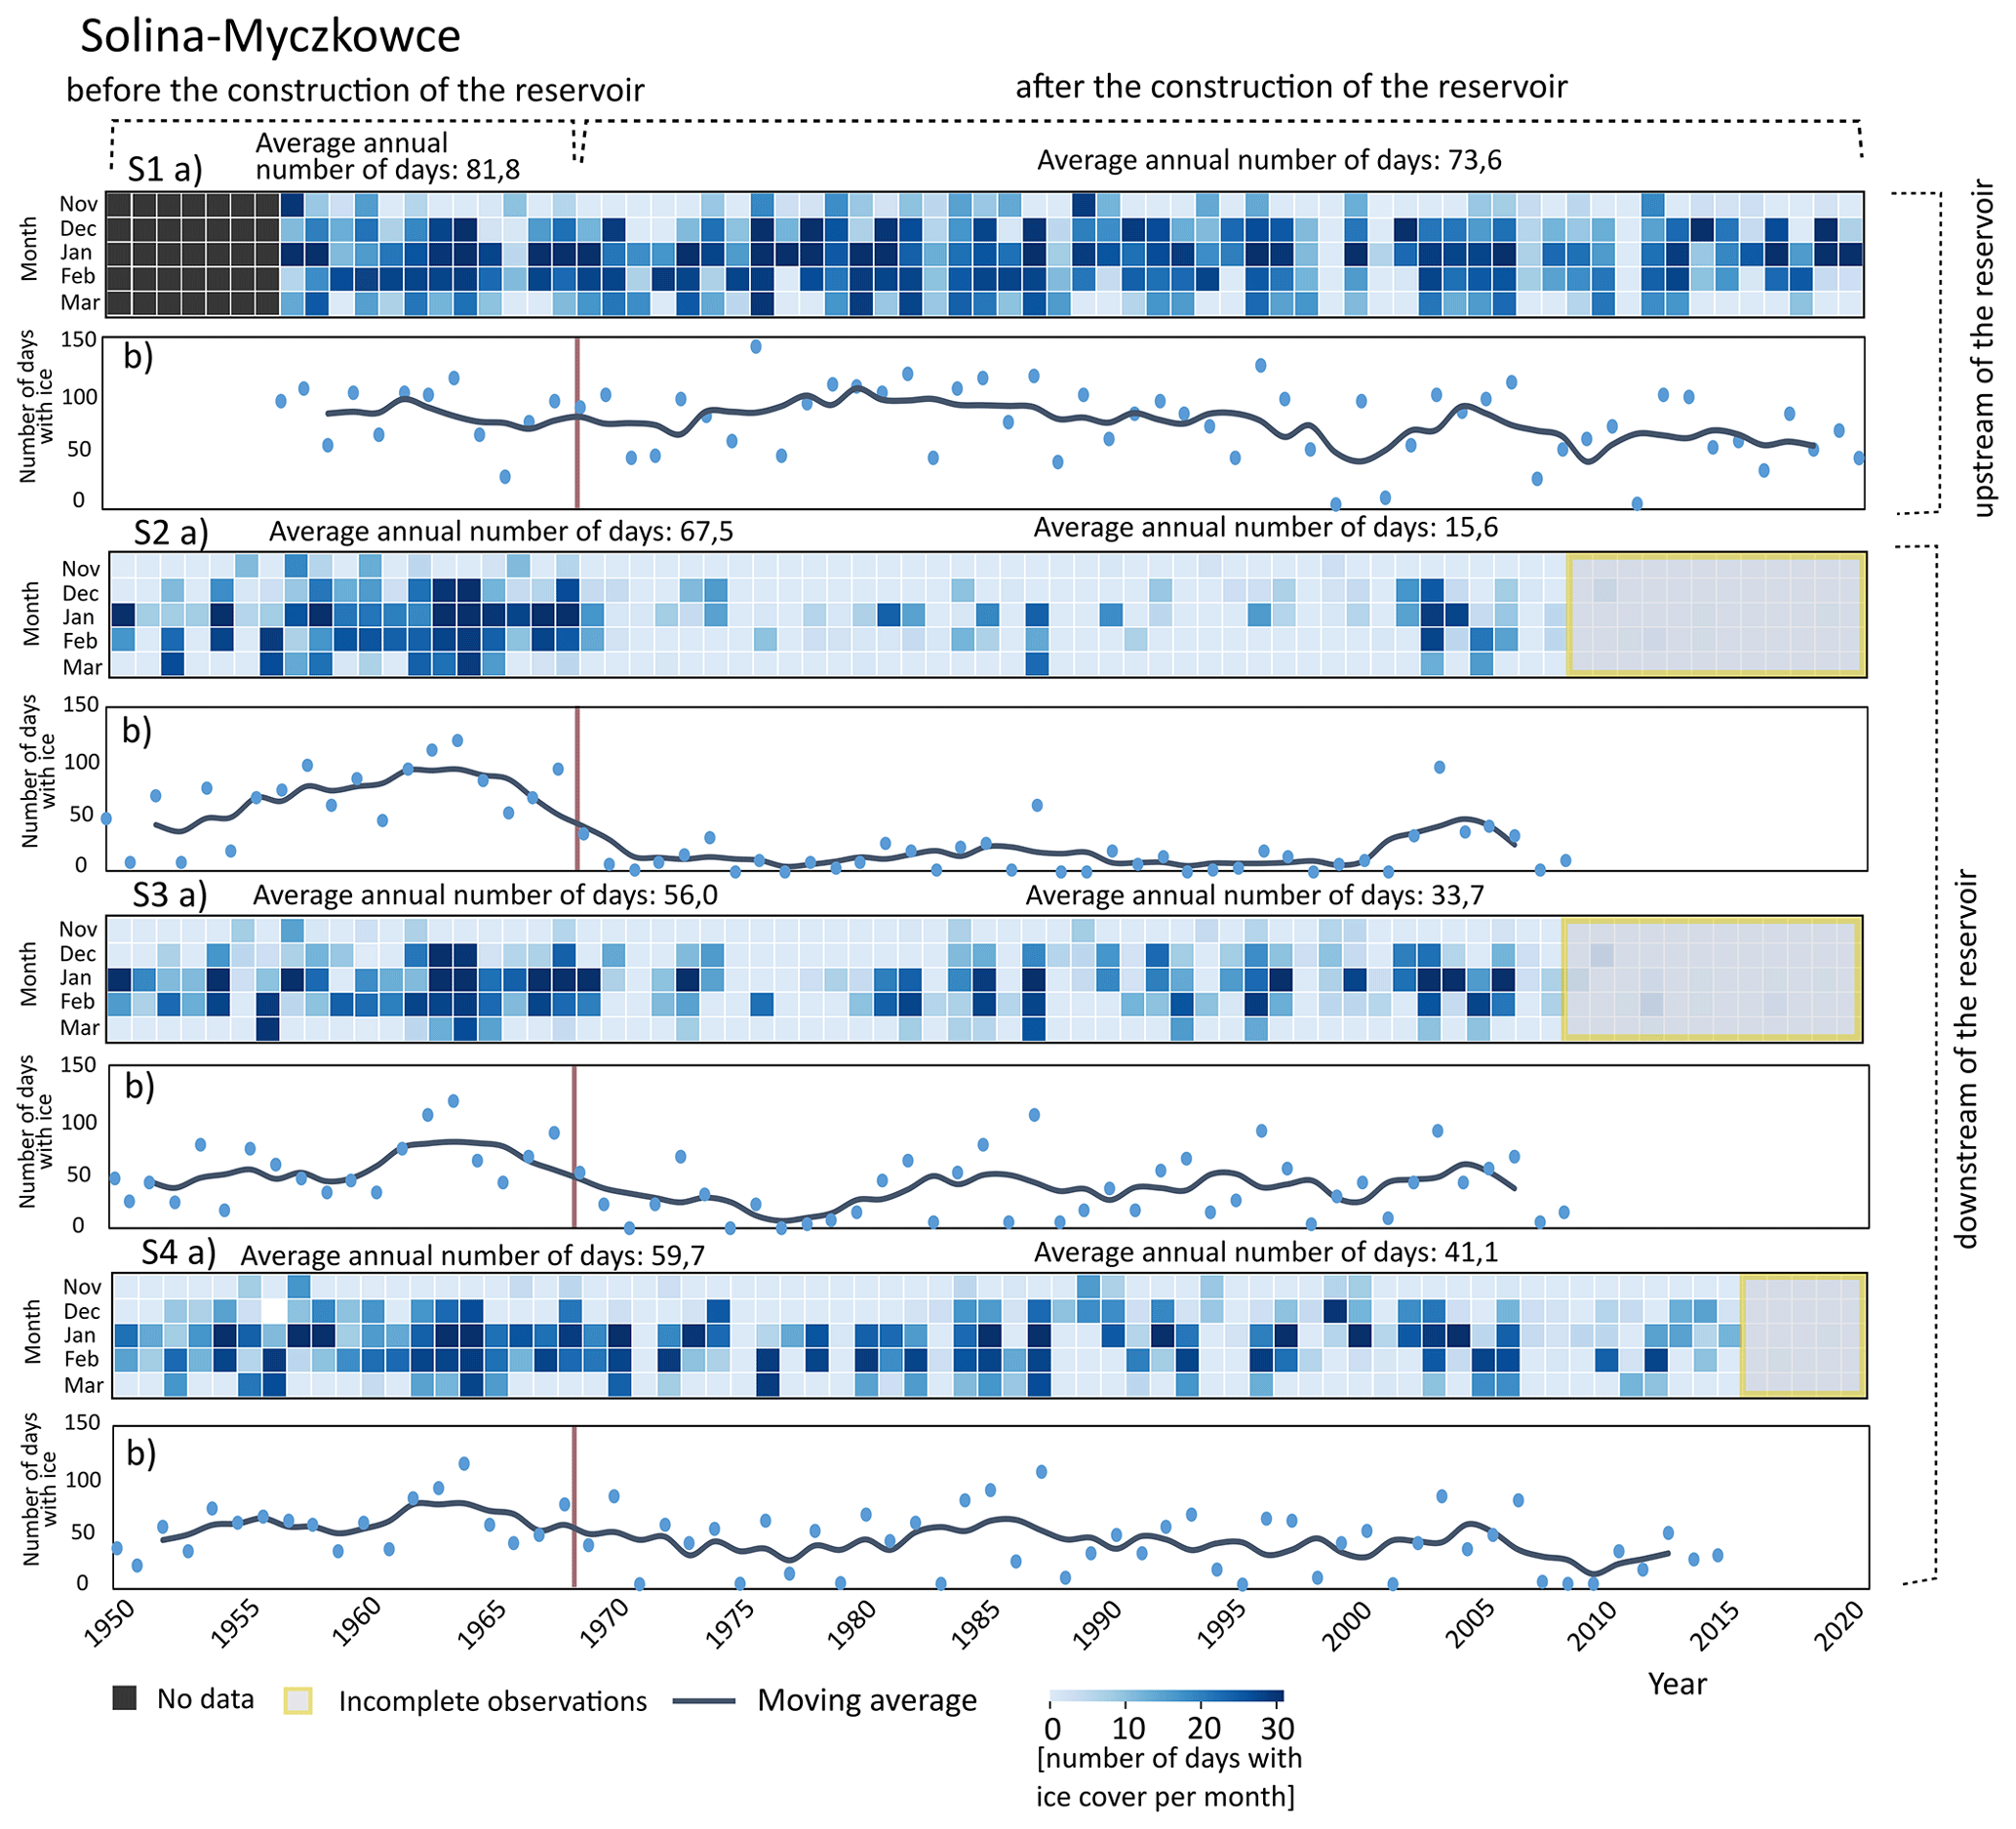
Figure 4Observed number of days with ice cover on the San River in each month at water gauge stations (a) and annual sum of the number of days with ice cover with a 5-year moving average (b). The year 1968 (the year the Solina reservoir was built and filled) was taken as the year of construction of the reservoir.
In the case of the Dunajec River, the decrease in frequency varied along the river's longitudinal profile. At the cross section located upstream of the reservoir (C1), a 13.3 % decrease in the number of days with ice cover was observed in the post-reservoir period (1993–2020) compared with the earlier period (1950–1992). At cross sections located downstream of the reservoir, the greatest decrease in the frequency of ice cover occurred at point C2 (86.2 %) and decreased with increasing distance from the reservoir at cross sections C3 and C4 (50.6 % and 2.7 %, respectively).
For the San River, at the cross section located upstream of the reservoir (S1), a 10 % decrease in the number of days with ice cover was observed in the period after its construction (1969–2020) compared with the earlier period (1950–1968). At cross sections downstream of the reservoir (S2–S4), the decrease in frequency was 77 %, 39.8 %, and 31.2 %, respectively. In the period before the construction of the reservoirs on the two rivers under study, the annual ice pattern followed a similar trend, despite the fact that they are approximately 140 km apart. For example, the Pearson correlation coefficient of the annual number of days during 1950–1968 between stations C2 and S2 was 0.76 and was 0.86 between stations C3 and S3. In the period after the construction of the Solina–Myczkowce reservoir complex (1969–2009), the correlation dropped to 0.04 and 0.47, respectively.
The predictive ability of the logistic regression models was relatively high. The accuracy of correctly classifying days in the test set into two groups (days with ice cover and days without ice cover) based on the average air temperature of the 14 d before the modeled day ranged from 80 % to 87 %. The developed models had very good predictive ability, as evidenced by the high values of the area under the ROC curve ranging from 0.89 to 0.94 (Fig. 5).
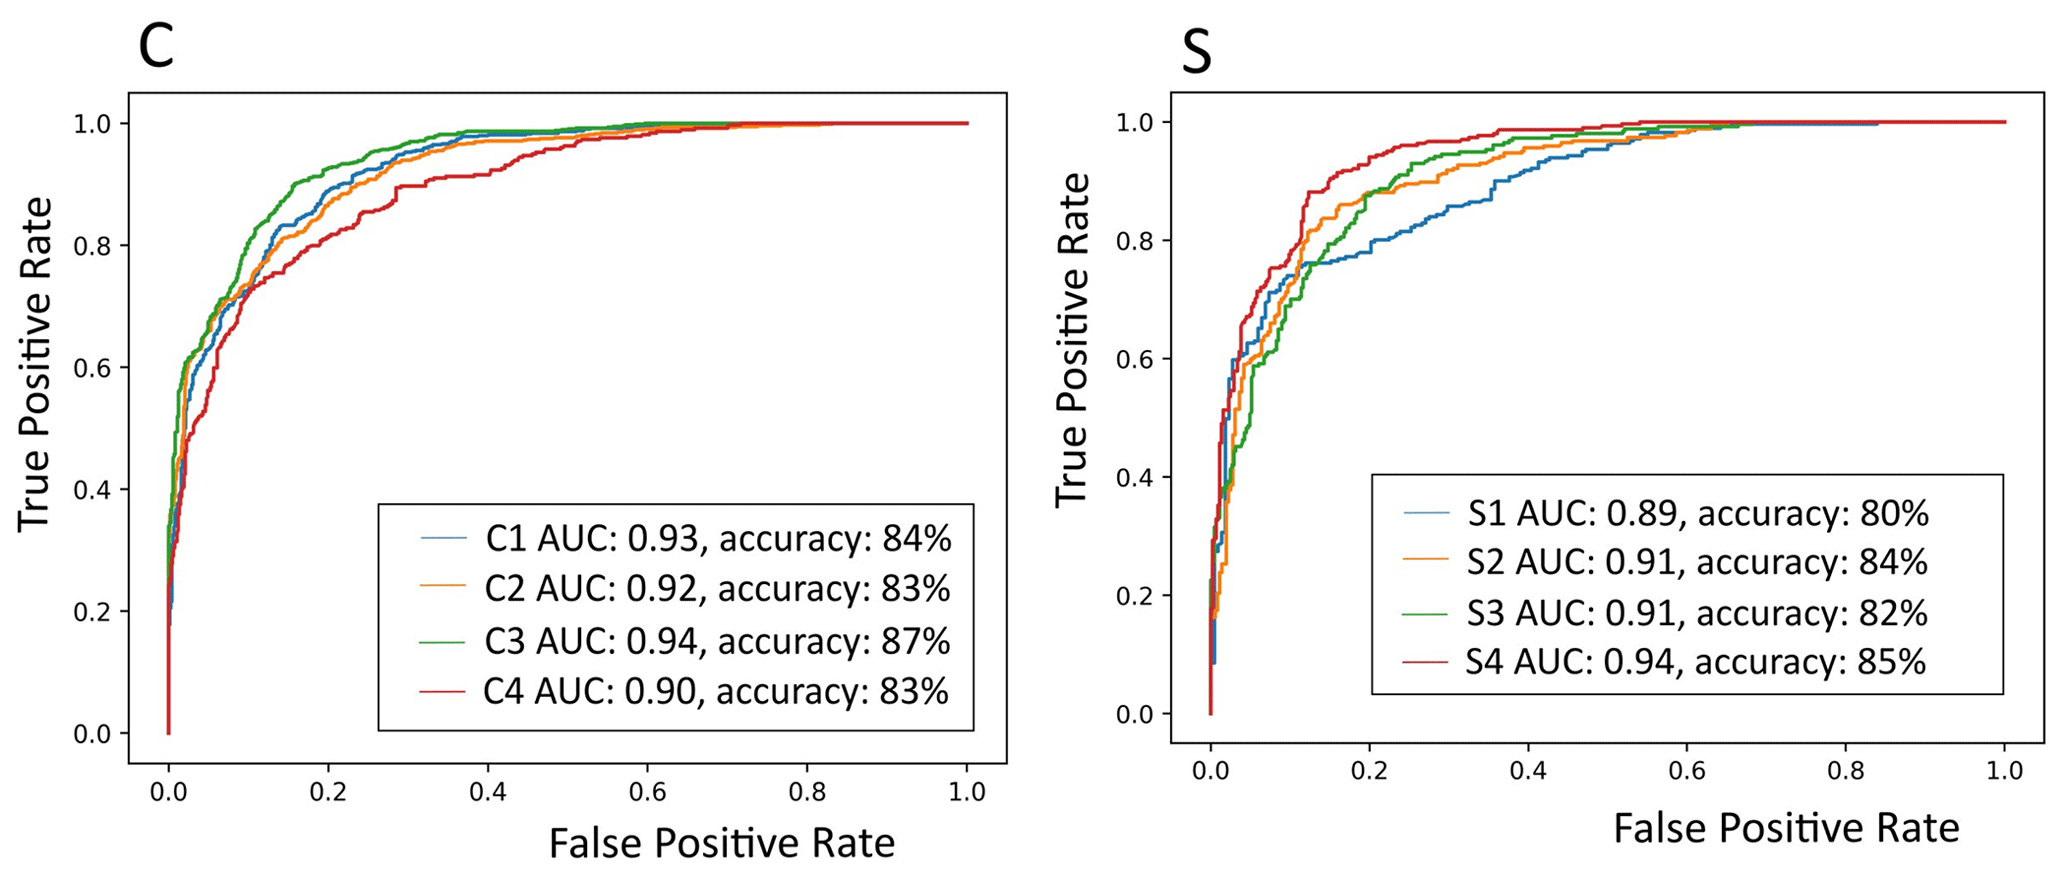
Figure 5Receiver operating characteristic (ROC) curve, area under ROC curve (AUC) values, and prediction accuracy.
In the case of the Dunajec River, there is a noticeable difference in the values observed and predicted by the model downstream and upstream of the Czorsztyn–Sromowce Wyżne reservoir complex (Fig. 6). At the C1 water gauge cross section, the number of days with ice cover observed and predicted from air temperature before and after the reservoir was very similar (Fig. 6). At this location during 1957–1992, the annual average observed number of days with ice cover was 73.1 d, while the number predicted by the model was 72.3 d.

Figure 6Comparison of modeling results based on air temperature with observations of ice cover for the Dunajec River and the Czorsztyn–Sromowce reservoir complex (a) and the density of the distribution of days with ice cover at temperatures before and after the construction of the dam reservoir (b). The year of construction of the reservoir was taken as 1992 (the year before the construction of the Sromowce Wyżne reservoir).
In the post-reservoir period (1993–2020), these values were 59.9 and 59.2 d, respectively. At point C2, located directly downstream of the reservoir, there was a significant discrepancy between the observed and predicted values based on air temperature in the post-reservoir period. During 1957–1992, the average annual totals observed and predicted by the model were very similar: 74.4 and 74.6, respectively. In the period after the construction of the reservoir (1993–2020), the observed average annual number of days with ice cover was 9.3, while the number of days predicted by the model was 61.
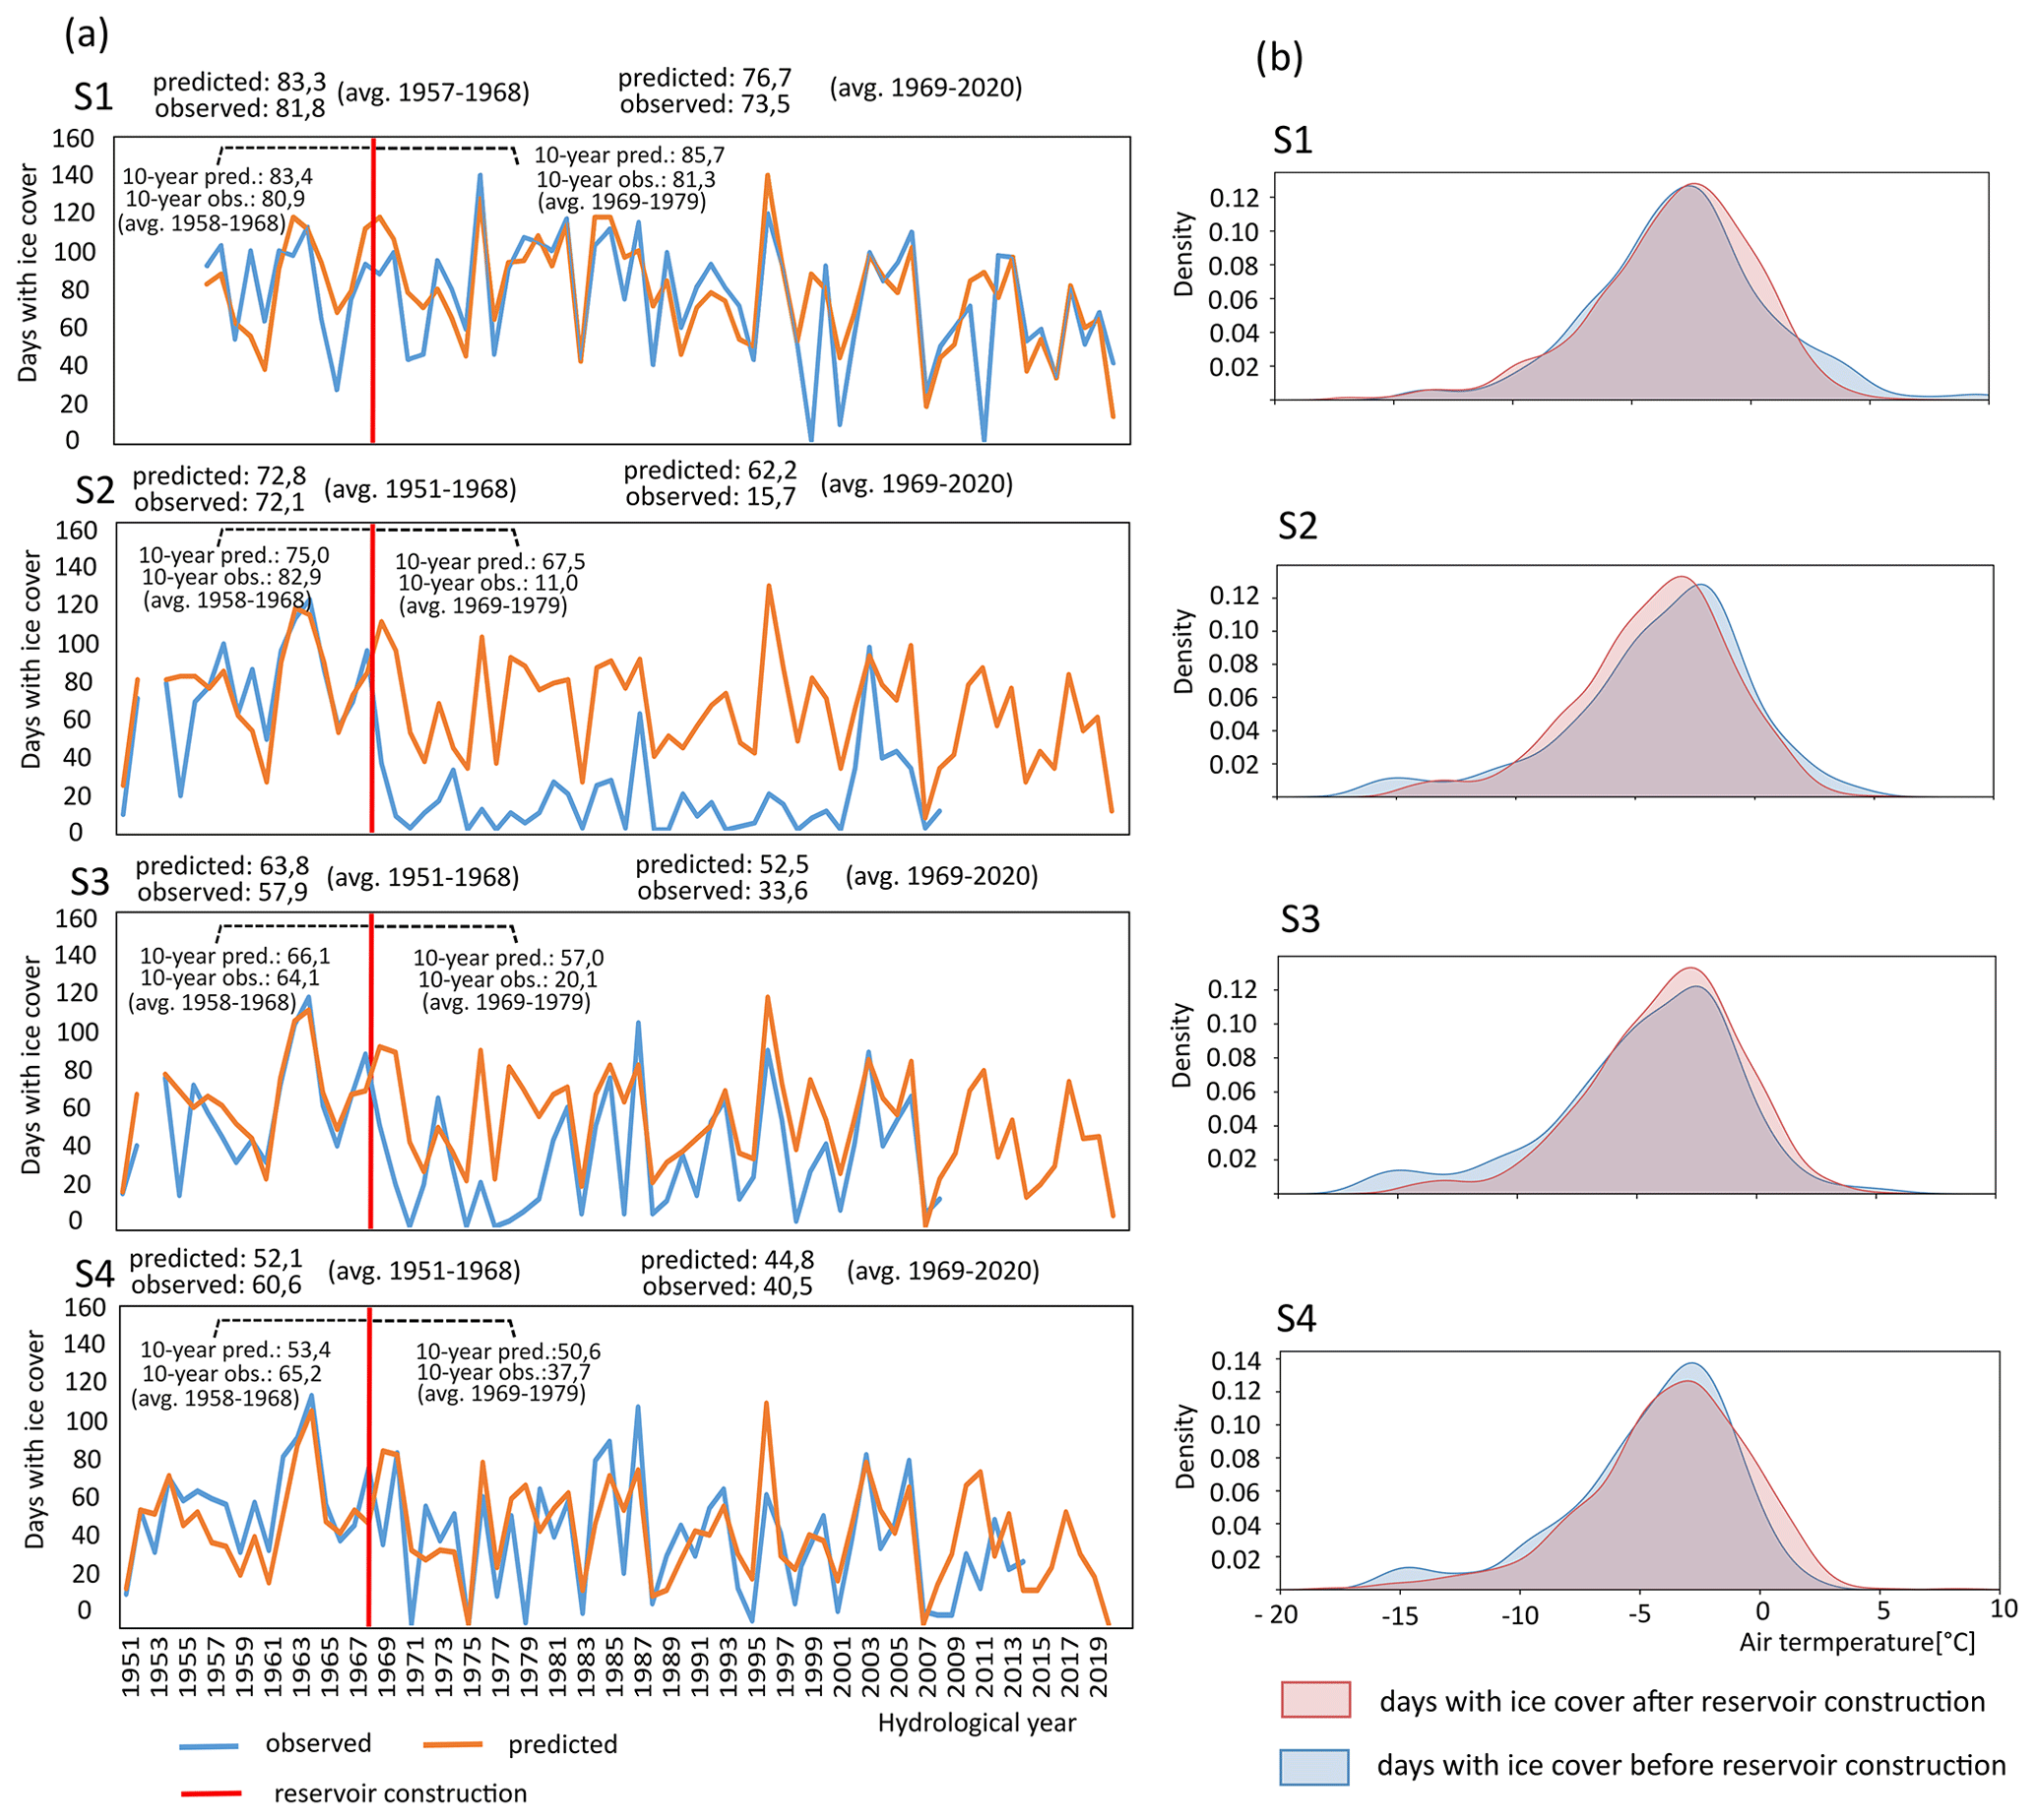
Figure 7Comparison of modeling results based on air temperature with observations of ice cover for the San River and the Solina–Myczkowce reservoir complex (a) and the density of the distribution of days with ice cover at temperatures before and after the construction of the dam reservoir (b). The year 1968 (the year the Solina reservoir was built and filled) was taken as the year of construction of the reservoir.
At point C3, after the construction of the reservoir, the difference between the observed and predicted average number of days with ice cover was less than at point C2, but still notable (half as much). At point C4 in the period after the construction of the reservoir, values were more similar to each other: the observed number of days was 50.1, while the predicted number of days was 47.5. In the cross sections located downstream of the reservoir (C2–C4), there was a significant shift in the distribution of the number of days with ice cover in the average air temperature in the period after the construction of the reservoir compared with the earlier period. This effect was not observed at point C1.
Similar results were obtained regarding the Solina–Myczkowce reservoir system (Fig. 7). In the cross section located upstream of the reservoir (S1), the air-temperature-based prediction and the observed average number of days with ice cover were similar both before (1950–1968) and after (1969–2020) the reservoir was built. For cross section S2, located directly downstream of the reservoir, a significant discrepancy was found in the observed and model-predicted average number of days with ice cover after the reservoir's construction. The average observed number of days with ice cover before the reservoir's construction was 72.1, while the number predicted by the model was 72.8. After the reservoir's construction, the observed average number of days dropped to 15.7, while the predicted number of days was 62.2. A similar trend was observed for cross section C3. The annual average observed number of days with ice cover in the period after the reservoir's formation was 33.6, while that predicted by the model based on temperature was 52.5. At water gauge cross section S4, the model-predicted and observed number of days with ice cover were very similar both before (predicted: 52.1 d; observed: 60.6 d) and after the reservoir was built (predicted: 44.8 d; observed: 40.5 d). In the case of the San River, a slight shift in the distribution of the number of days with ice cover in the mean air temperature was observed only at cross section S2 located directly downstream of the Solina reservoir.
It is worth noting the variation in the accuracy of the prediction of ice cover occurrence by the developed models. Although the prediction accuracy determined from the test set varied in the 80 %–87 % range, the multi-year averages of observed and predicted values at stations upstream of the reservoirs were very close to each other (respectively 59.2 and 59.9 in cross section C1, and 76.7 and 73.5 in cross section S1, in the period after the construction of the reservoirs). The high agreement of these data suggests a higher accuracy than was determined from the test sets. This is most likely due to the dichotomous nature of the errors made by the model. The overall error includes predictions of the occurrence of ice cover when in reality there was none and predictions of the absence of ice cover when in fact there was. Most likely, the existence of both types of errors in similar proportions resulted in high agreement over the long term (>40 years).
The results of analysis of Sentinel-1 (i.e., SAR) data showed that, during the study period (January to February 2017), total ice cover did not form in a section of about 60 km downstream of the Czorsztyn–Sromowce reservoir complex and 26 km downstream of the Solina–Myczkowce reservoir complex (Fig. 8).
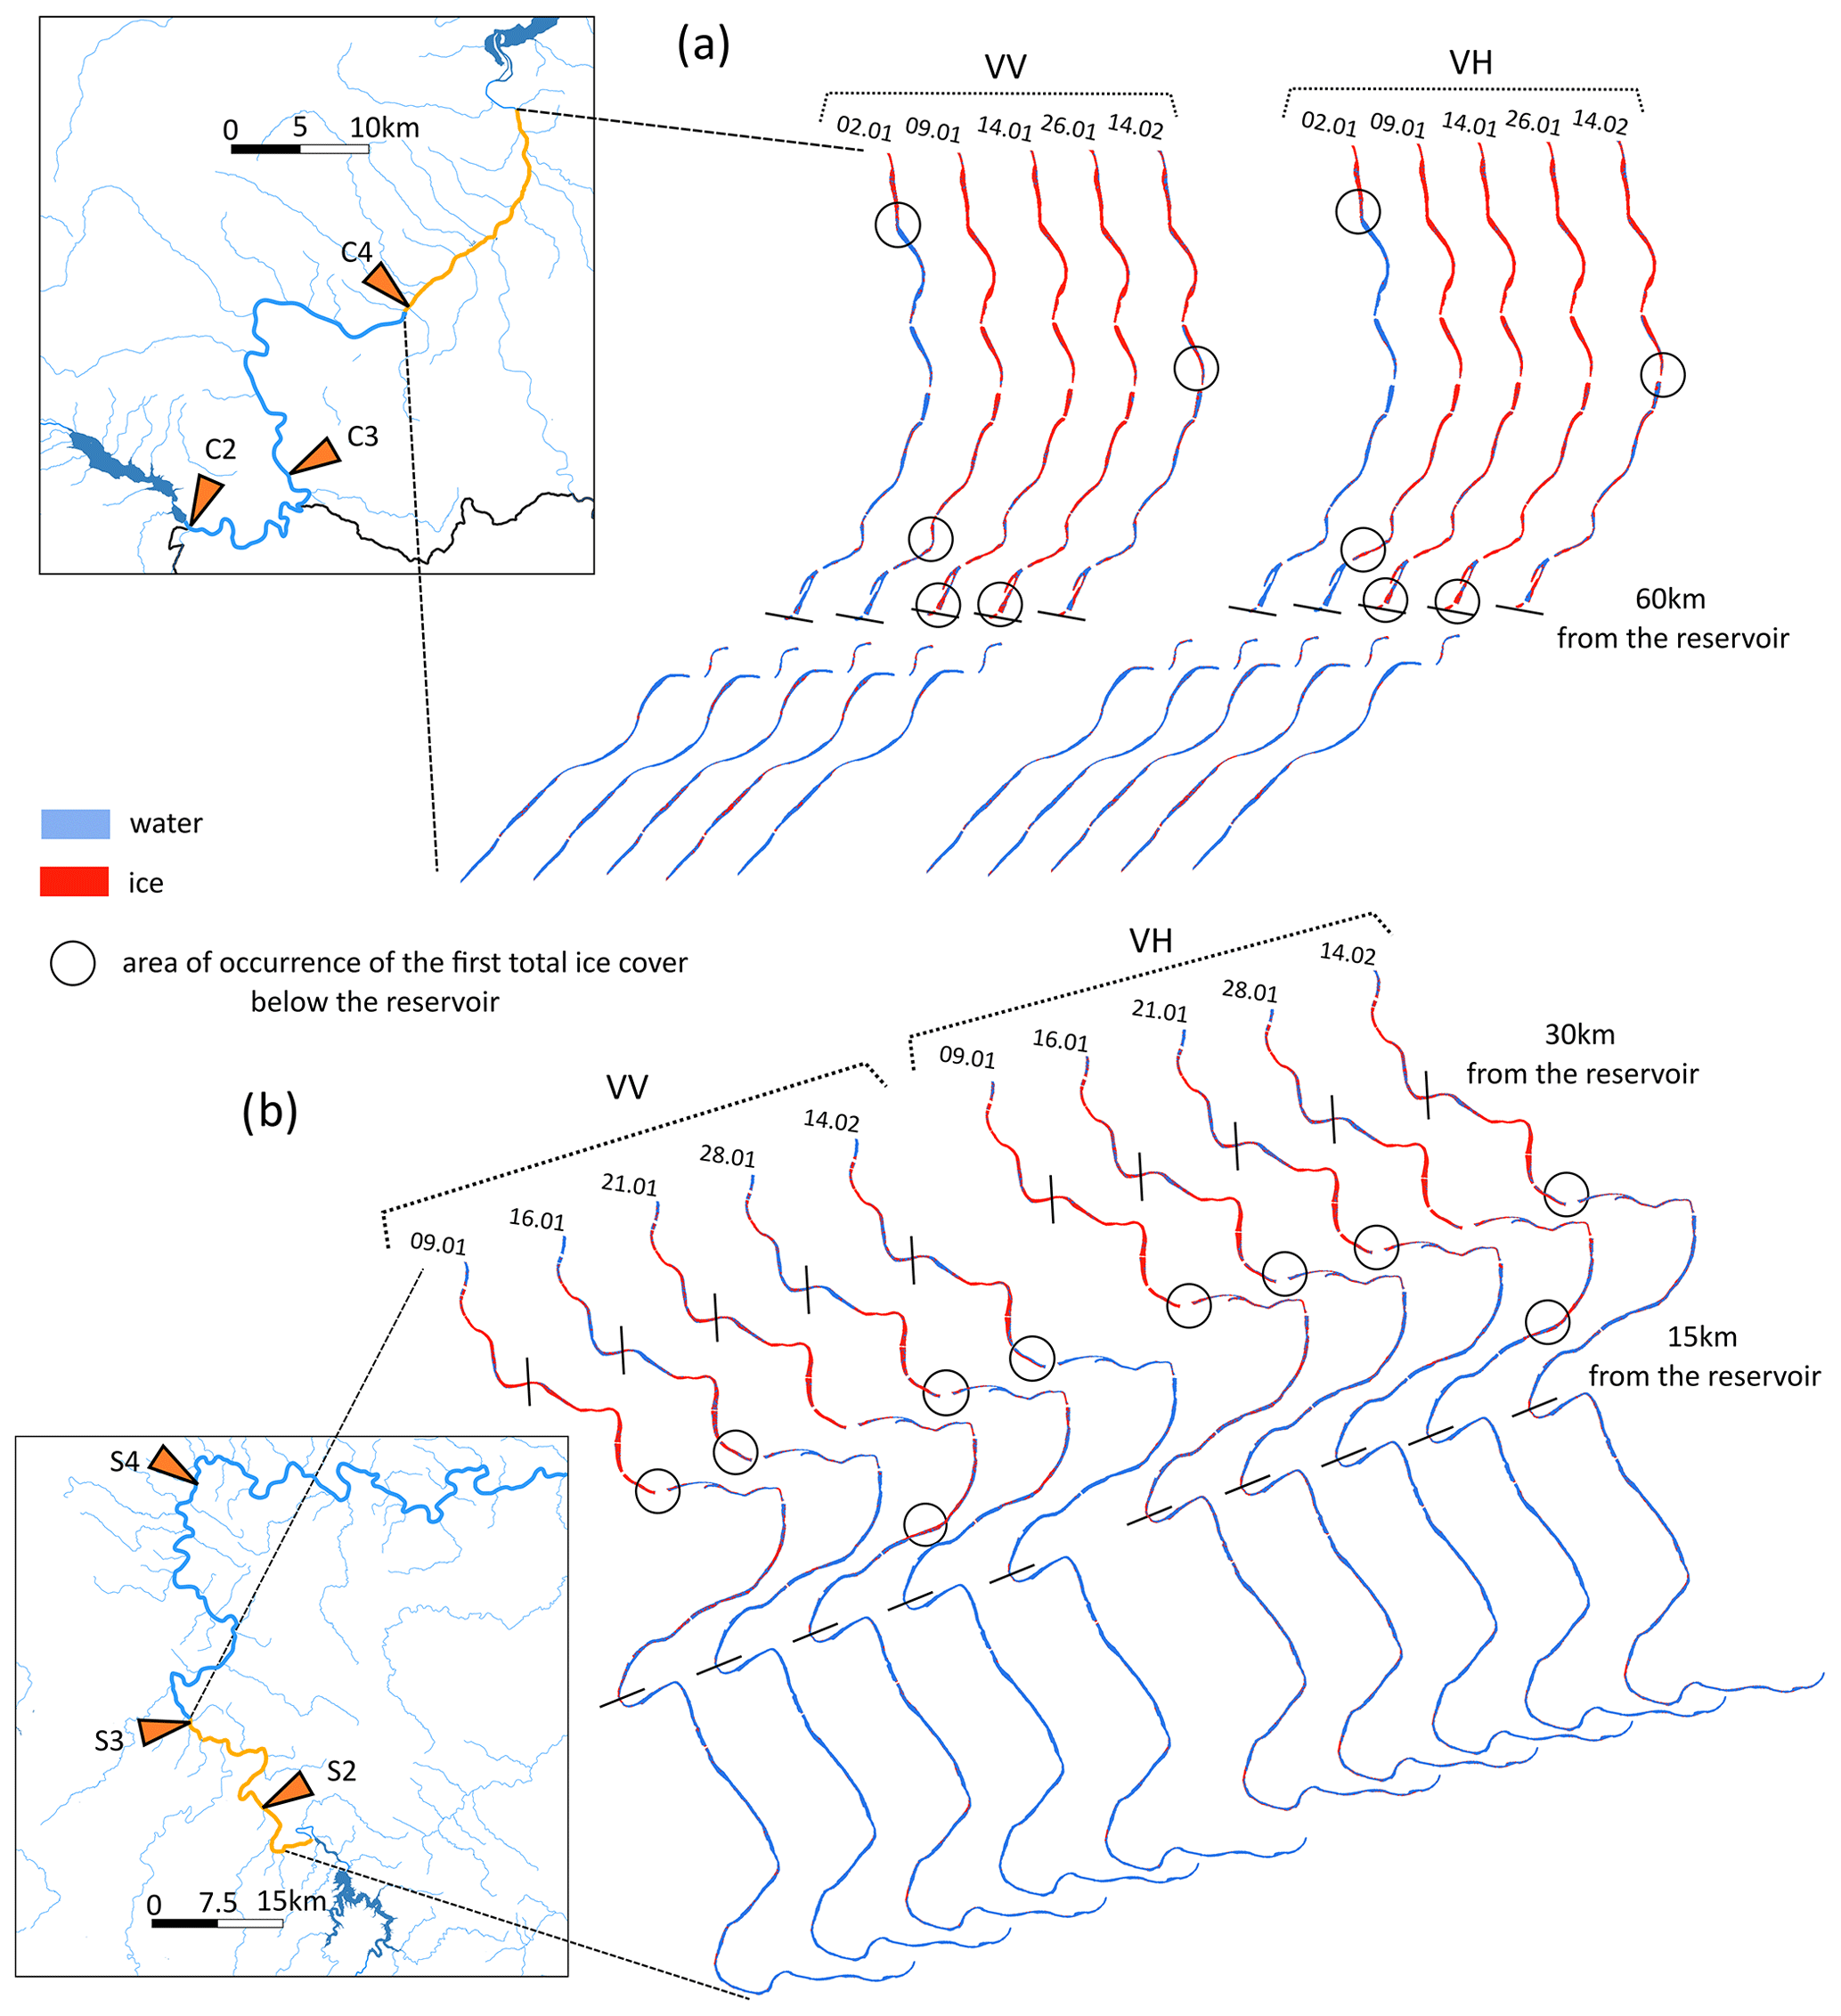
Figure 8The extent of ice cover on the Dunajec (a) and San (b) rivers.
The greatest icing events occurred in the second half of February, which was associated with the persistence of very low air temperatures (close to −10 °C). On both studied rivers, three sections could be distinguished in terms of ice phenomena. Directly downstream of the reservoir, a section was observed where the ice cover did not form completely. In the case of the Czorsztyn–Sromowce reservoir complex it reached about 40–50 km downstream of the reservoir, while in the case of the Solina–Myczkowce reservoir complex, it extended about 10 km downstream of the reservoir. Further away was a section where border ice occasionally formed, but the ice cover did not form completely, and the amount of border ice increased as the distance from the reservoir increased. The third section was characterized by the occurrence of total ice cover on most sections of the studied rivers (>60 km in the case of the Czorsztyn–Sromowce reservoir complex and >26 km downstream of the Solina–Myczkowce reservoir complex).
Visual analysis of the classification results of SAR imagery, backscatter coefficient distribution maps, and optical imagery showed that the determination of the area where ice cover was not present downstream of the reservoir was relatively accurate. River sections without ice cover were characterized by a predominance of pixels classified as water, while sections with ice cover were characterized by a predominance of pixels classified as ice (Fig. 9). The largest classification errors were recorded in narrow and shallow sections of the surveyed rivers without ice cover, where there was an increase in the backscatter coefficient unrelated to the presence of ice cover. This resulted in misclassification of pixels from this area as ice. Misclassification of pixels was also recorded in transition sections between open water and total ice cover where border ice was present, especially in narrow river sections.
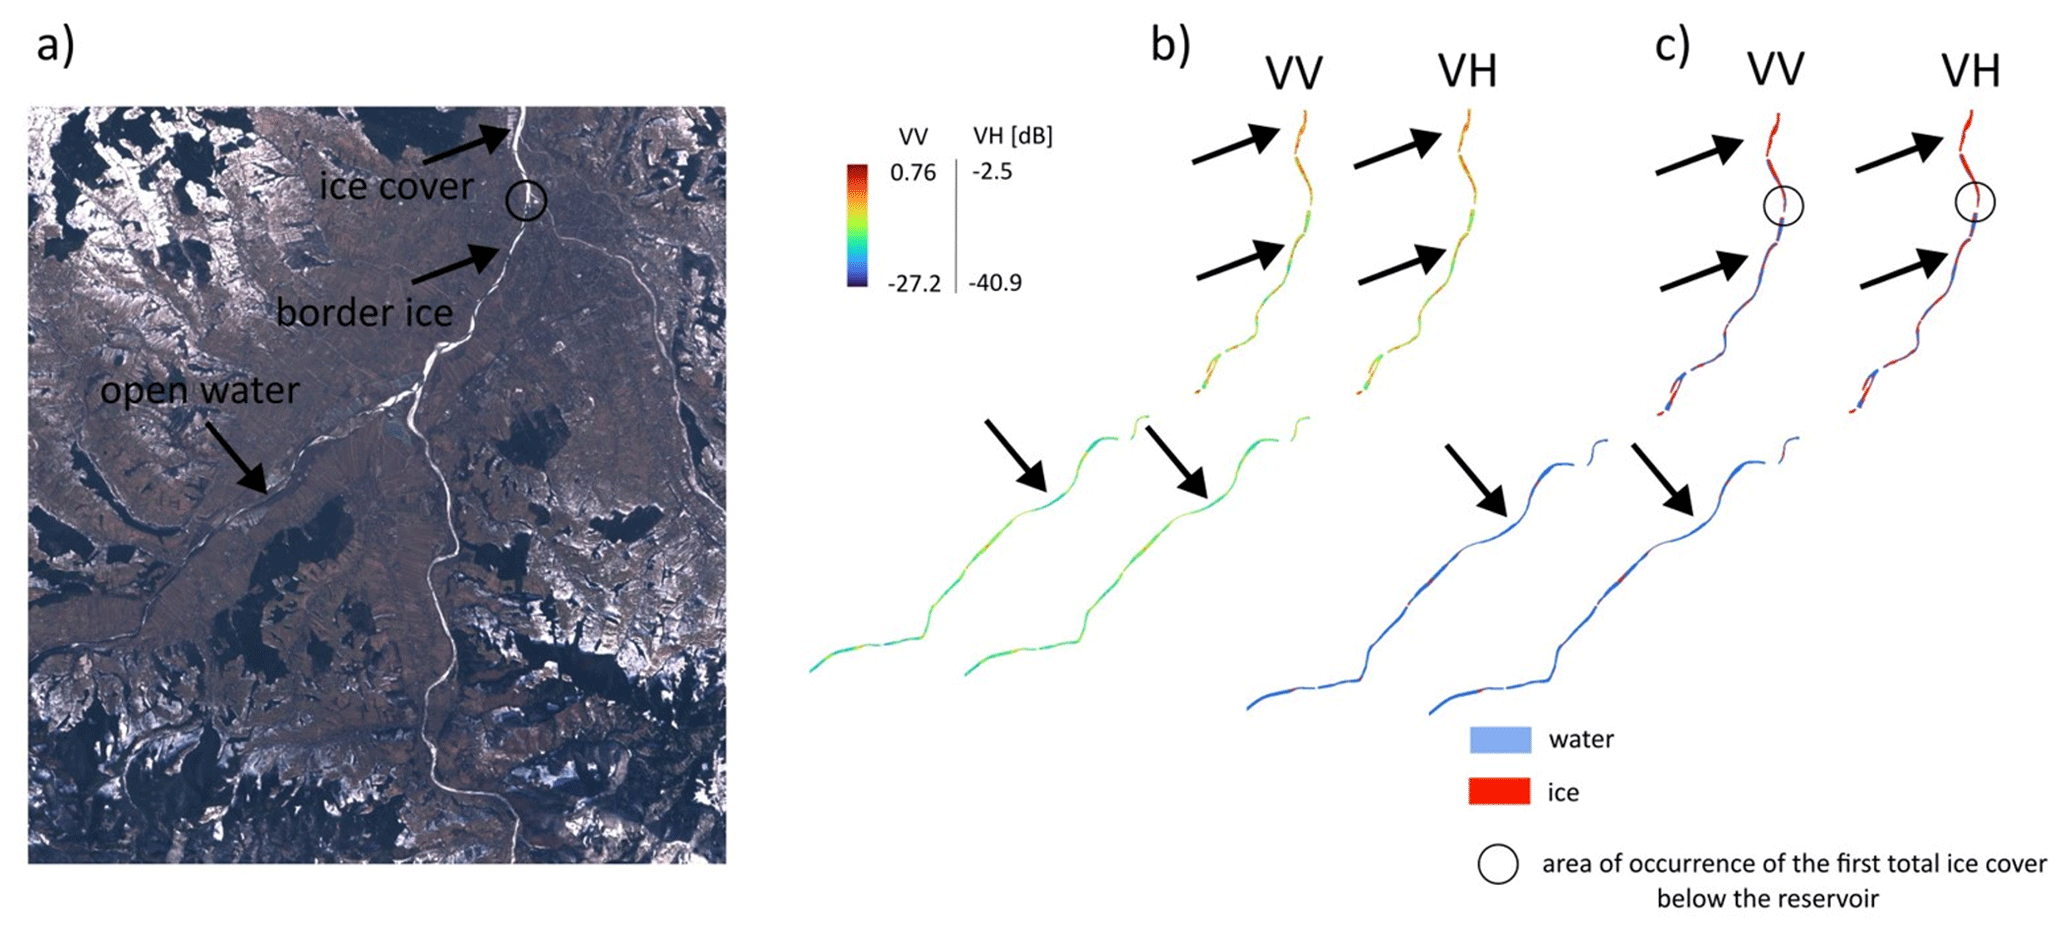
Figure 9Comparison of Sentinel-1 backscatter coefficient (b), classification results (c), and Sentinel-2 data (a) acquired on 14 February 2017 for the Dunajec River. Source: own elaboration based on data obtained from Copernicus Sentinel Data (https://scihub.copernicus.eu/, last access: 15 May 2024). Contains modified Copernicus Sentinel data, processed by ESA, licensed under CC BY-SA 3.0 IGO.
Analysis of changes in water temperature at station C3 showed that after the construction of the Czorsztyn–Sromowce reservoir complex (1996–2020), there was a decrease in water temperature in the summer period and an increase in the winter period compared with the period prior to the dam development (1984–1995; Fig. 10b). In the period after the construction of the reservoirs, the largest increase in average water temperature was recorded in November (an increase of about 3 °C). During the remaining winter months (December to March), an increase in monthly average water temperature was also observed, ranging from 0.2 to 1.6 °C. This effect was confirmed by field measurements (Fig. 10a).
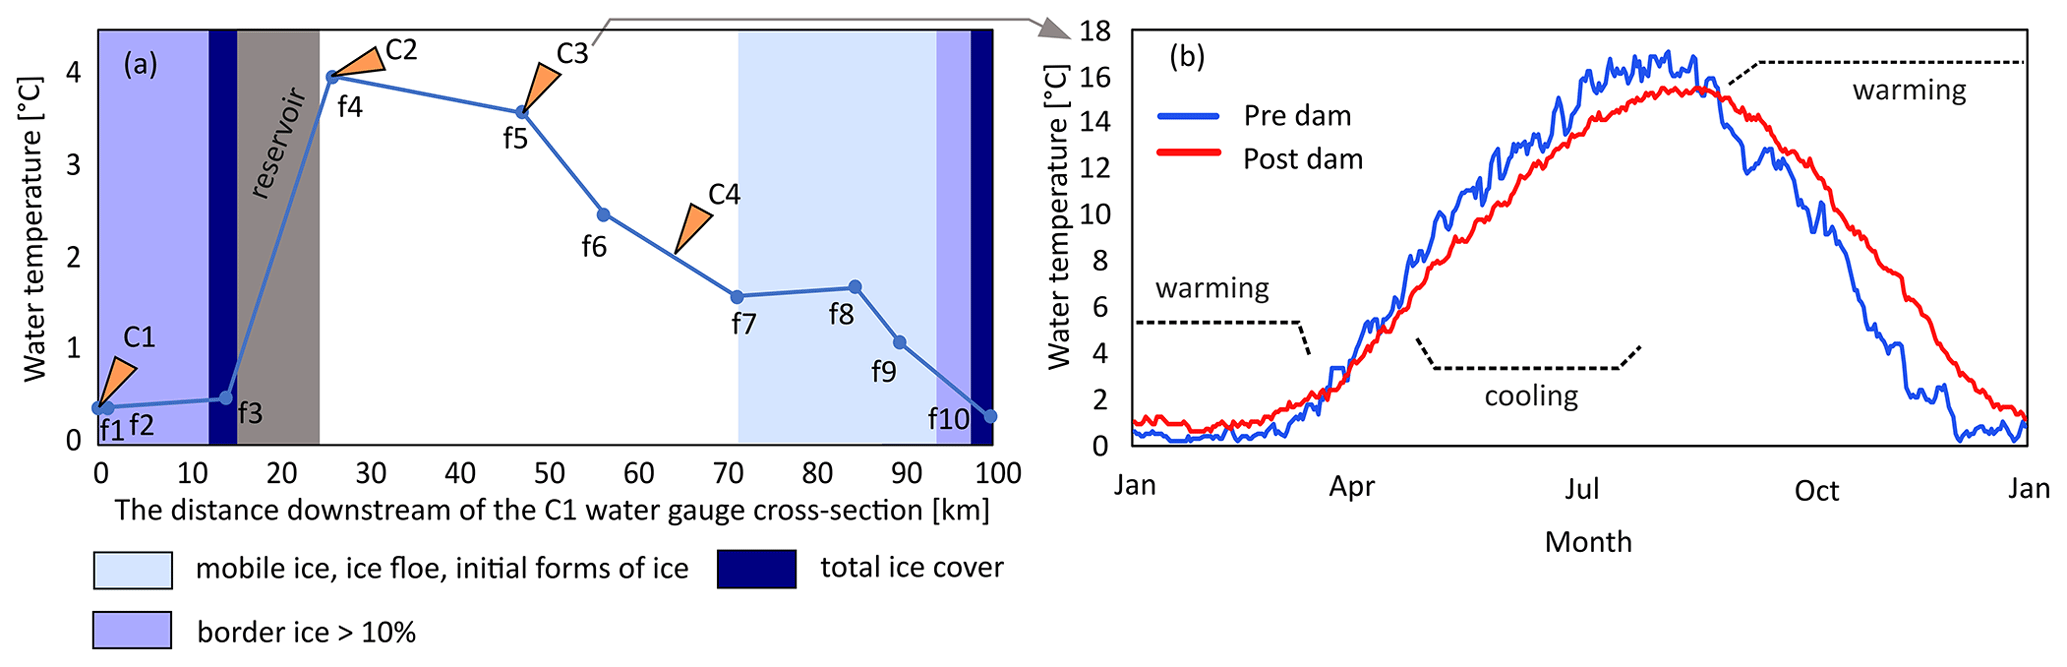
Figure 10Water temperature and the occurrence of ice phenomena in the longitudinal profile of the Dunajec River on 5 December 2023 (a), and the variation in the average water temperature at station C3 on individual days of the year before (1984–1995) and after (1996–2020) the reservoir was built (b).
On 5 December 2023, the average water temperature upstream of the reservoir (measuring points f1–f3) amounted to 0.4 °C. In this section, border ice covered up to 20 % of the water surface. Downstream of the reservoir there was a sharp increase in water temperature (up to 4 °C; Fig. 10a). As the distance from the reservoir increased, water temperature decreased up to 0.3 °C at a distance of about 75 km downstream of the reservoir (measuring point f10). In the section of the river up to about 45 km downstream of the reservoir, no ice phenomena were observed. At distances further than 50 km from the reservoir, initial ice forms, and ice floe as well as local border ice was observed.
Analysis of changes in flow volume at station C3 showed that in winter periods after the construction of the Czorsztyn–Sromowce reservoir complex (1996–2020), there was an increase in water flow volume (an average increase of 3.7 m3 s−1) compared with the period before the dam development (1984–1995; Fig. 11). During the winter period, an increase in flow volume was recorded in November (an increase of 7.3 m3 s−1), February (an increase of 7.5 m3 s−1), and slightly in December (an increase of 0.5 m3 s−1). The increase in flow volume resulted in a 2 cm increase in the average water level in winter (Fig. 11).
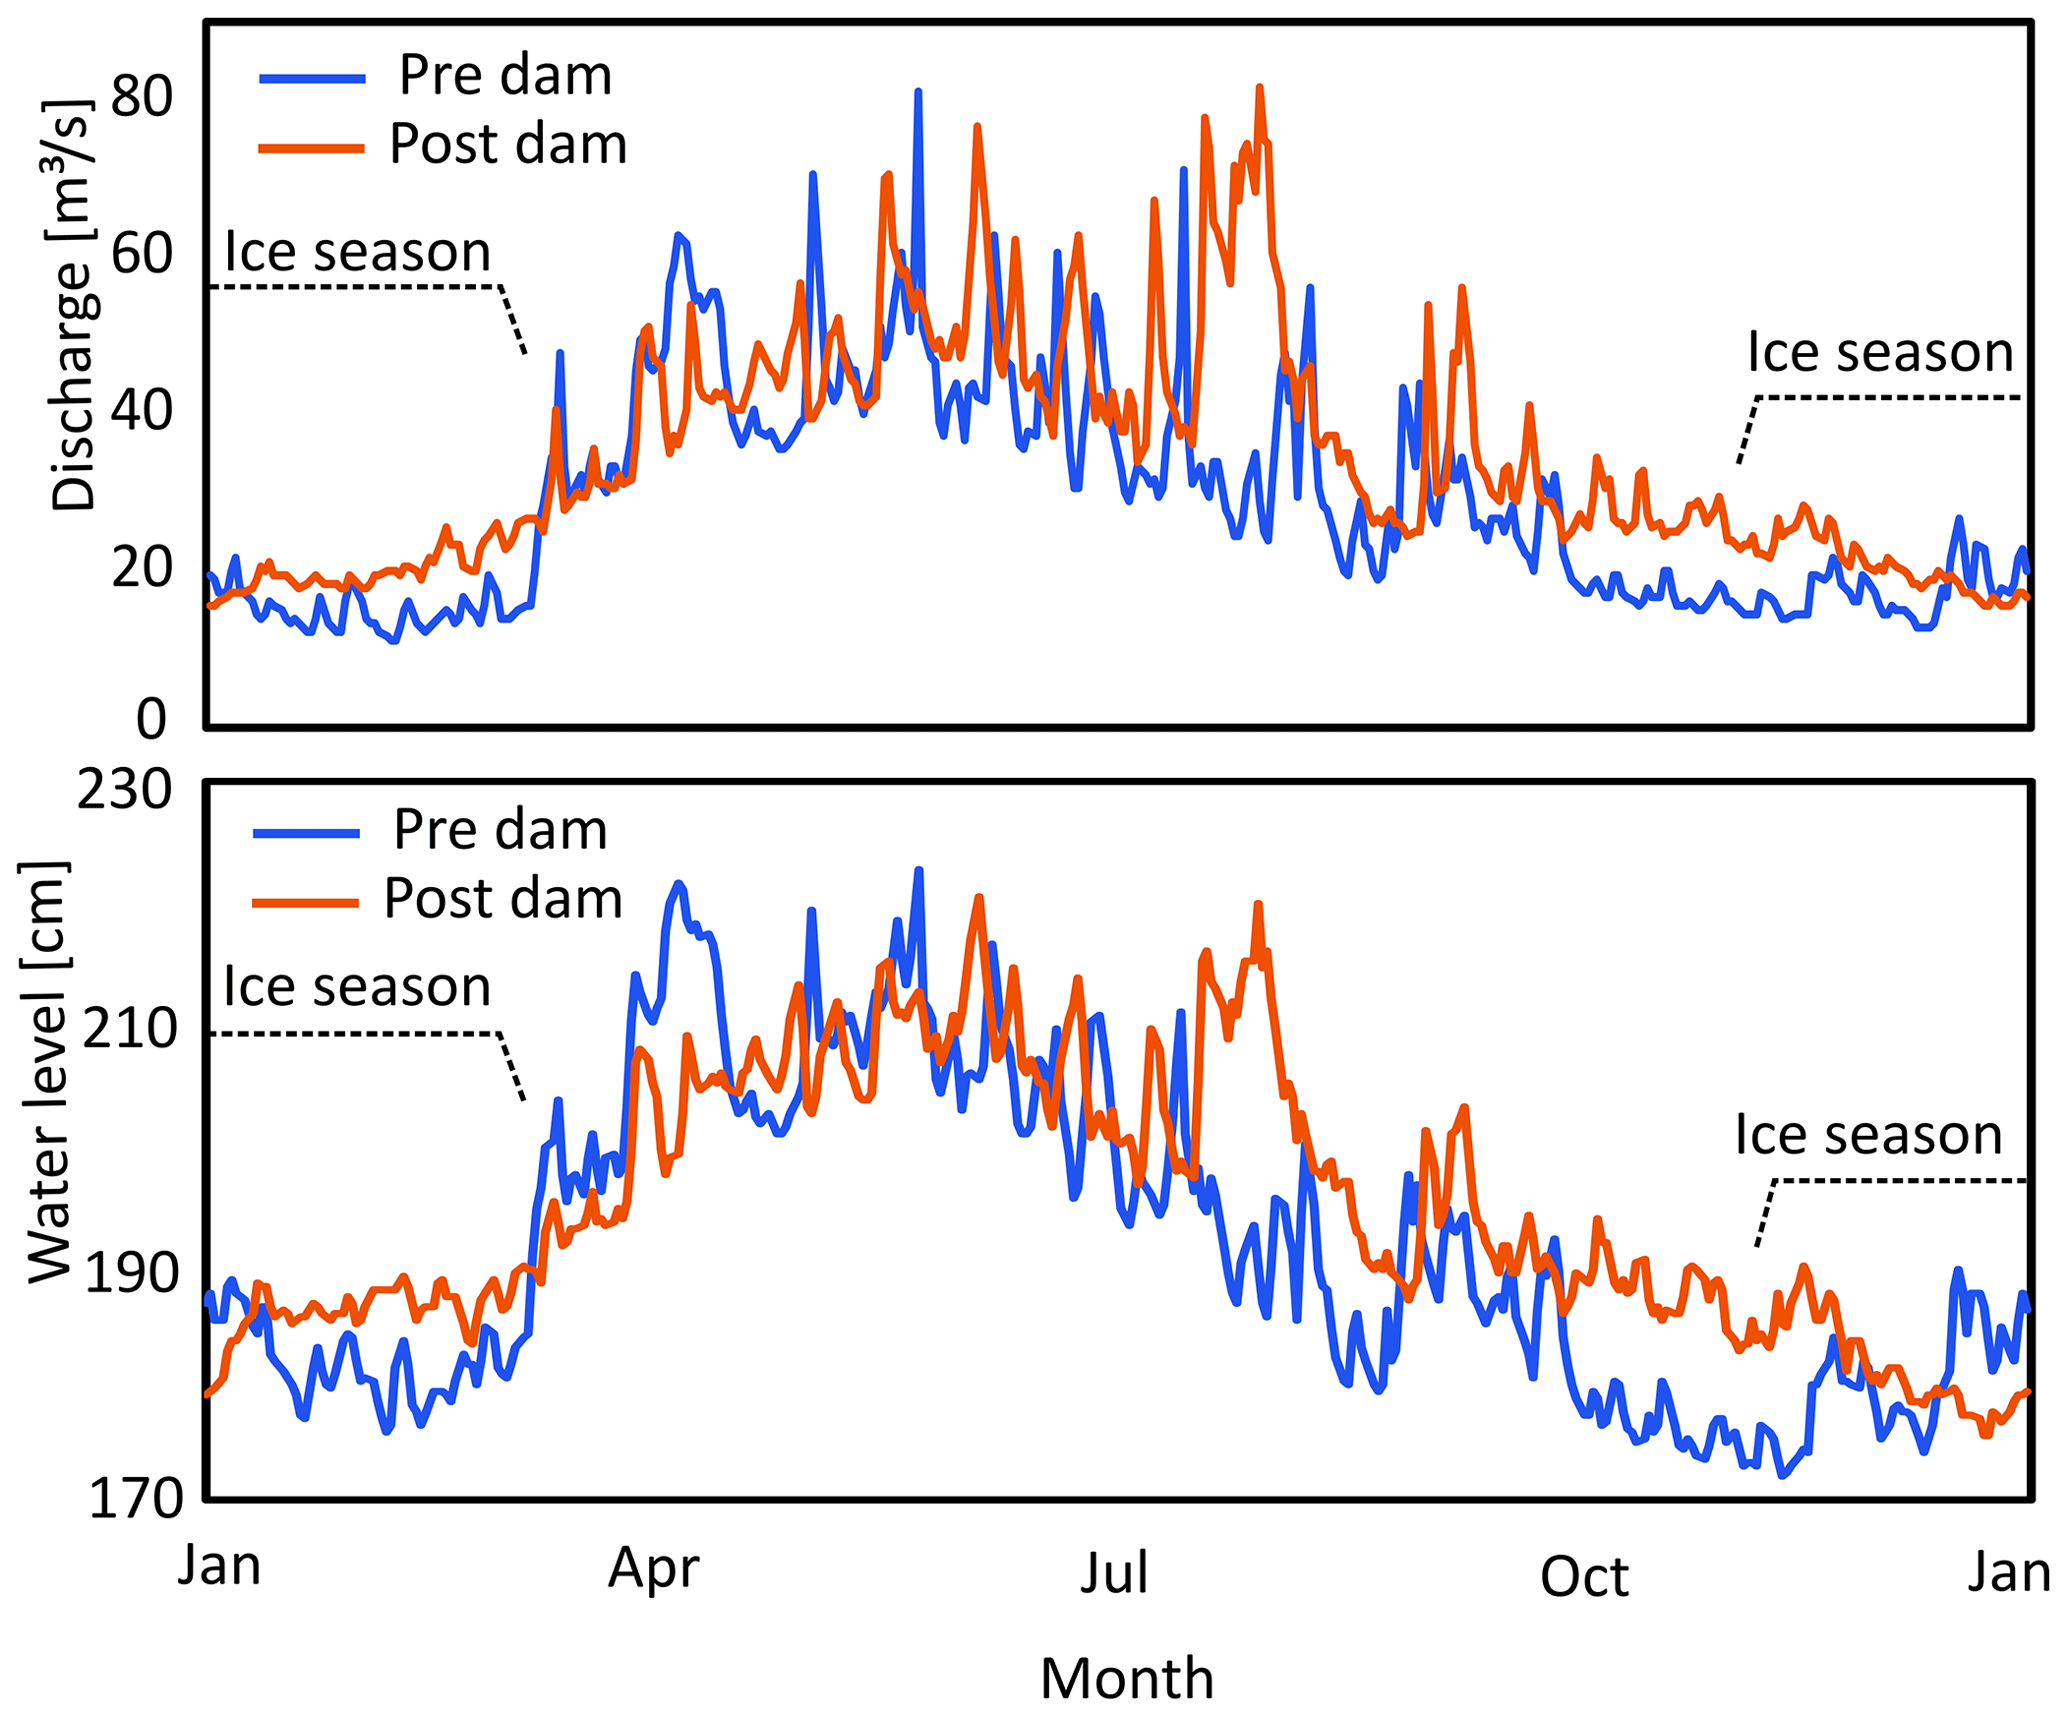
Figure 11Average water level and discharge at station C3 in the periods before (1984–1995) and after (1996–2020) the construction of the reservoir.
This study demonstrates that the analyzed dam development was an important element in transforming (decrease in frequency of ice cover) the ice regime of the downstream rivers. The impact of the reservoirs is evidenced by a substantial decrease in the incidence of ice cover downstream of the reservoirs in the period after their construction, with minor change at cross sections upstream of the reservoirs. The significance of the reservoirs is also indicated by the lack of sharp increases in air temperature in the post-reservoir period in the study areas. In the case of the Dunajec River, a lower average winter air temperature was observed in the 10-year period after the reservoir construction as compared with the 10-year period prior to the construction. At the same time, a decrease in the frequency of ice cover was observed at cross sections C2 and C3 (downstream of the reservoir). The decrease in average temperature and the associated decrease in the frequency of ice cover suggest that the recorded disappearance of ice cover on the studied rivers is not due to climatic conditions. The important impact of reservoir operations on the river ice regime is also evidenced by the analysis of water temperature, ice cover occurrence, and changes in flow volume. Field studies have shown that during periods of low air temperatures (reaching −10 °C), high water temperatures (reaching 4 °C) are possible downstream of the reservoir, due to the release of bottom warm water from the reservoir. On the day of the survey, the increase in temperature resulted in the absence of ice phenomena along the 45 km downstream of the reservoir. In the post-reservoir period (1996–2020) at station C3, this effect (and the potential impact of climatic variability) translated into a 1.18 °C increase in average winter water temperature compared with the earlier period (1984–1996). The important role of dam reservoirs in the transformation of water temperature is also evidenced by other studies: Kędra and Wiejaczka (2016, 2018) and Wiejaczka et al. (2015) have previously shown that the Czorsztyn–Sromowce reservoir system had a significant impact on the water temperature of the Dunajec River, as well as the synchronization of air and water temperature in the river. The analysis of flow volume showed that there was an increase in flow volume in the post-reservoir period (1996–2020) at station C3 compared with the period prior to the dam development (1984–1996). Increased discharge in the river results in delayed formation of stable ice cover due to increased water velocity in the riverbed (Houkuna et al., 2022).
In the study area, the increase in air temperature most likely manifested in a slightly later formation of ice cover and its earlier disappearance. After 2010, at cross sections located upstream of the reservoirs, ice cover occurred sporadically in November and March, which is partially confirmed by trends in air temperature at the climatological stations studied (an increase in average November temperature in the range of 0.6–0.8 °C per decade during 1982–2015). Accordingly, rising air temperatures may exacerbate the effects on river ice cover caused by the operation of dam reservoirs. However, the relatively small variation in the annual number of days with ice cover in cross sections upstream of the reservoirs and the lack of significant trends in average air temperature in all months except November suggest that in the study area the increase in air temperature has not significantly changed the frequency of ice cover. Further research based on more detailed data is needed in order to explore the potential impact of climate change on the ice cover.
On the basis of observational data and modeling results, it was found that the greatest transformations occurred at cross sections located closest to the facilities (C2 and S2), and reservoir influence decreased with increasing distance from the reservoir. This effect may be interpreted as a gradual decrease in the influence of the reservoir and restoration of the natural course of thermal and ice processes in rivers. The use of a classification method based on logistic regression allowed us to estimate that, in the case of the Czorsztyn–Sromowce reservoir complex, at cross section C2 (1.8 km downstream of the dam) during 1996–2020, the operation of the reservoir reduced the duration of ice cover by 84 % on average, while at point C3 (22 km downstream of the dam), reservoir operation reduced ice cover by 46 %. Similarly, in the case of the Solina–Myczkowce reservoir complex, the operation of the reservoir reduced the duration of ice cover by about 75 % at point S2 (11.7 km downstream of the dam) and by 36 % at point S3 (33 km downstream of the dam). These results suggest that in the stretch of rivers about 20–40 km downstream of the reservoirs, the influence of the reservoirs was the main factor determining the observed disappearance of ice cover and the course of ice processes. The important role played by the dam reservoirs is supported by the much smaller magnitude of the decrease in the frequency of ice cover at cross sections upstream of the reservoirs (10 % and 13.3 % after the construction of the reservoirs compared with the earlier period), where the decrease was mainly due to climatic conditions.
A visual comparison of the classification results of radar imagery (Sentinel-1) with optical data (Sentinel-2) showed that it was possible to determine, with relative accuracy, the extent to which there was no ice cover downstream of dam reservoirs on mountain rivers with similar characteristics to those analyzed in this study. Based on the threshold of the backscattering coefficient to two classes (water/ice) on rivers similar to those studied here (width of 20–100 m), it was possible to determine the approximate extent of the river section downstream of the reservoir on which the total ice cover did not form. The range of influence of the studied reservoirs on the occurrence of river ice cover on the basis of SAR data was determined to be 26 km for the Solina–Myczkowce reservoir complex and 60 for the Czorsztyn–Sromowce reservoir complex. An analysis of the river network in the catchments of the studied rivers showed that the smaller extent of the influence of the Solina–Myczkowce reservoir complex was most likely due to the mixing of the waters of the San River with two relatively large tributaries in close proximity to the reservoir, the Hoczewka and Osława (average winter inflow at the mouth: 2.8 and 8.6 m3 s−1, respectively). The mixing of these waters with those of the San River (average winter outflow from the reservoir: 24.6 m3 s−1) may lead to a drop in water temperature and the appearance of ice phenomena. The relatively minor influence of the Solina–Myczkowce reservoir is also evidenced by the lack of a clear change in the distribution of the number of days with ice cover in the average air temperature at cross sections downstream of the reservoir. By comparison, for the Dunajec River, total ice cover appeared during the analyzed period about 60 km downstream of the reservoir in the vicinity of a tributary of the Poprad River, one of the largest tributaries of the river.
Similar results have been previously obtained for other dam reservoirs located in mountainous areas, including in the Carpathian Mountains. Cyberska (1972, 1975) analyzed the influence of a complex of dam reservoirs (dam height of 32.5 m) on the thermals and occurrence of ice phenomena on the Dunajec River (Poland). Cyberska estimated that in the period after the reservoir's construction, the 12–65 km downstream area of the reservoir saw an average 65 % reduction in the duration of ice cover. These values are slightly higher than those obtained in this study, especially for cross sections located far from the reservoir, which may be due to the fact that they were estimated based on the comparison of periods before and after the reservoir's construction without accounting for the possible influence of changing climatic conditions. An estimate based on a similar methodology made by Wiejaczka (2009) showed that, on the Ropa River, at a cross section located 16 km downstream of the dam, after the construction of the dam reservoir (dam height of 34 m), there was a 35 % decrease in the frequency of ice cover (total and border ice). Chang et al. (2016) compared periods with similar thermal conditions (before and after reservoir construction) and analyzed the impact of large (dams 178 and 147 m high) dam reservoirs on ice phenomena on the Yellow River. They found that reservoir operation reduced the duration of ice phenomena at downstream stations by 33, 22, and 8 d, which is less than the value estimated in this study. However, these results are particularly significant given that the gauging stations are located more than 800 km downstream of the reservoirs. An important role in the transformation of the ice regime was also demonstrated in the case of the Williston reservoir in Canada on the Peace River (dam height 186 m). As a result of the operation of this reservoir, ice cover does not form between 100 and 300 km downstream of the dam (Jasek and Pryse-Phillips, 2015). The distance is much more extensive than estimated in this study, which may be due to the different sizes of these rivers and reservoirs. Similar results were obtained for the Krasnoyarsk reservoir (Belolipetsky and Genova, 1998): downstream of the dam (124 m), the ice cover also did not form for 100–300 km, depending on hydrometeorological conditions. Transformations of the river ice regime have been observed for both, large reservoirs (dams higher than 15 m) and small ones. For example, Maheu et al. (2016) analyzed the impact of small dam reservoirs (dams 7–13 m high) on thermals and water ice in eastern Canada. Using two examples, they showed that the operation of these facilities significantly raised water temperatures and reduced ice formation in sections up to 2.5 km downstream.
Similar effects on river ice cover have also been reported for lowland reservoirs, which have different characteristics (e.g., usually less depth) due to terrain. Takács et al. (2013) analyzed the occurrence of ice cover upstream and downstream of small dams (<10 m) in the Raba River basin (western Transdanubia, Hungary). They based their study on selected periods with similar thermal conditions before and after the construction of the reservoirs, showing that, after their construction, the relative frequency of ice cover downstream of reservoir location decreased by up to 10 % and that anthropogenic factors were crucial in transforming the ice regime of rivers. The considerably smaller impact of these reservoirs than the values estimated in this study can be explained by the smaller size of the dam. Pawłowski (2015) showed that the construction of the Włoclawek reservoir on the Vistula River (Poland) resulted in a 47 % reduction in the duration of ice cover downstream of its location and a 26 % reduction in the duration of all ice events, leading to a substantial transformation of the river's ice regime. Here, to demonstrate the impact of reservoirs, periods with similar average air temperatures before and after the reservoirs were selected. These values were smaller than those obtained in this work, which is likely due to the fact that the Włoclawek reservoir has a damming level that is 5-fold lower (11 m). Apsîte et al. (2016) analyzed the impact of the operation of three dam reservoirs (dam heights of 18–40 m) on the phenology of ice phenomena on the Daugava River (Latvia), showing that, at a station 6 km downstream of the reservoir after its construction, there was a reduction in the duration of ice cover by 91 d. This is a greater decrease in the frequency of ice cover than estimated in this study, but it was not determined how much of this effect was due to the construction of the reservoir in relation to climate change.
Despite the relatively high predictive ability of the presented logistic regression models and the high agreement between modeling results and observations at stations upstream of the reservoirs, caution should be exercised when analyzing the impact of dam reservoirs using the presented method because of limitations that arise from both the nature of the data and the river ice processes themselves. First of all, the presented method does not take into account other possible factors affecting river ice phenomena; these mainly may include regulation of rivers affecting the conditions of ice formation, all kinds of thermal pollutants emitted into rivers, discharges of municipal and industrial wastewater that can increase the content of dissolved substances and thus lower the freezing point, and the occurrence of natural changes in the hydrological and morphological characteristics of rivers and their channels. An important problem is also the significant sensitivity of the model to input data on the occurrence of river ice cover; due to its characteristics (large variation in parameters in the longitudinal profile of rivers, non-linear nature of development and disappearance, and significant sensitivity to hydrological and meteorological conditions), this is difficult to describe and classify into a rigid framework which can translate into reliable modeling results.
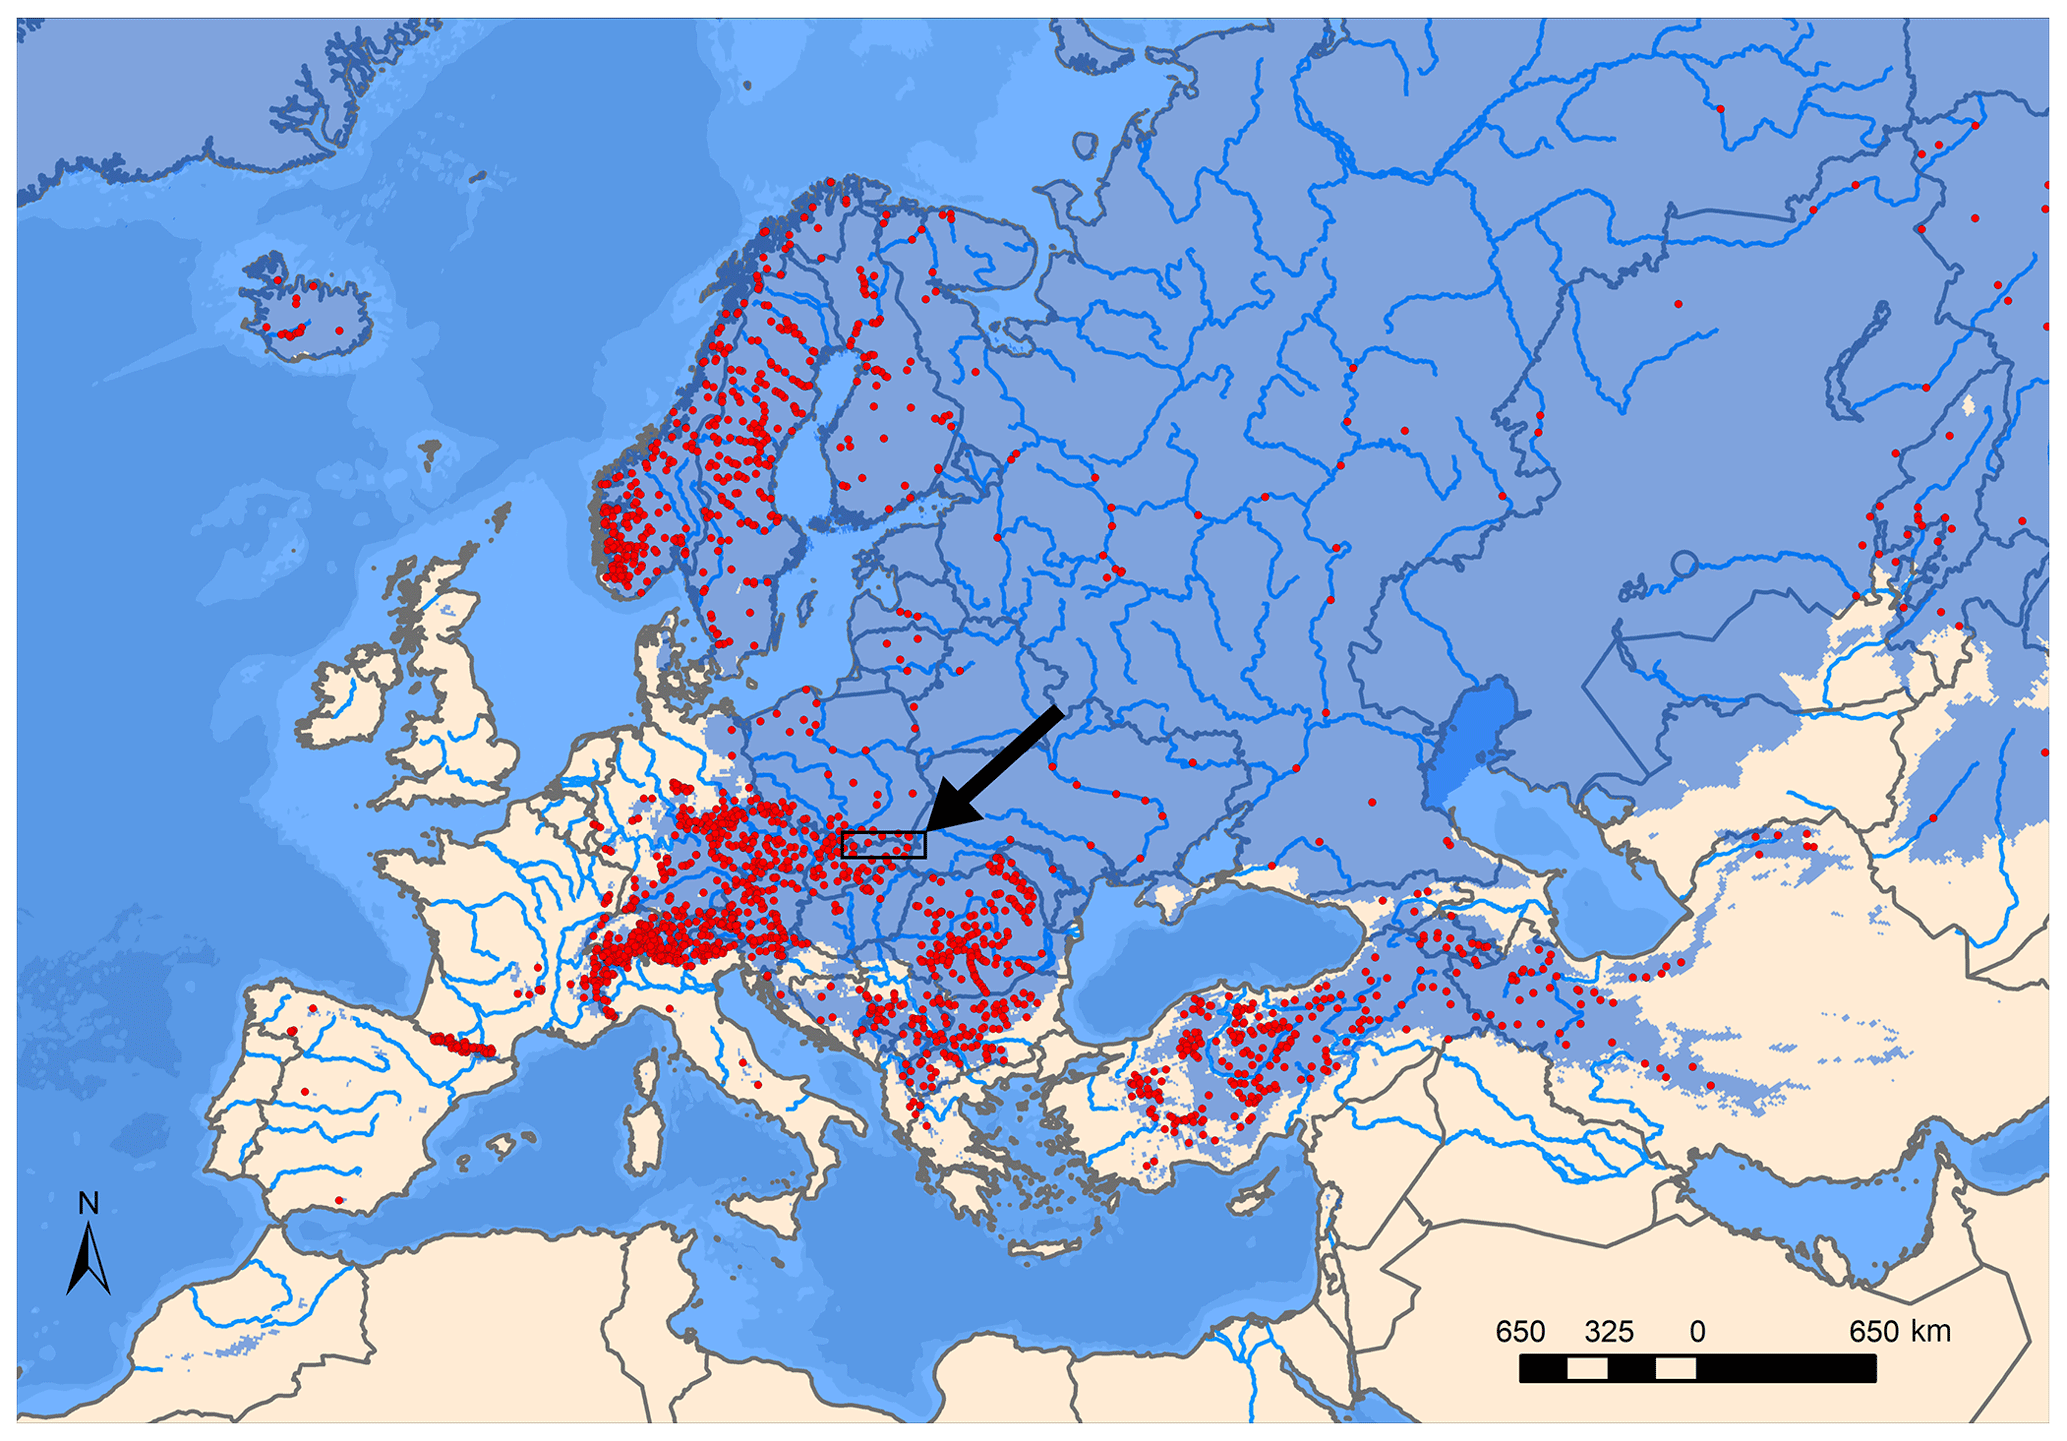
Figure 12Locations of dam reservoirs (red dots) in areas of river ice cover in Europe (highlighted in blue). The area of this research is marked with an arrow. Compiled from Fukś (2023).
The method presented in the paper and the obtained results may be of significance for the study of river ice regimes on a local and regional scale. In the studies cited above, the impact of reservoirs was analyzed by comparing thermally similar periods before and after their construction. Typically, the periods have been selected based on average winter temperatures. However, this approach appears to be an oversimplification due to the averaging of extreme values over entire periods. Furthermore, this method limits the analysis to selected periods only. On the other hand, the method presented in the current study made it possible to demonstrate the impact of reservoirs on river ice cover over the entire period after their construction, regardless of climatic variability. The rationale for developing methods to study the impact of dam reservoir operations on river ice cover is due to the substantial increase in the number of dam reservoirs in ice-covered areas since the beginning of the second half of the 20th century. It has been estimated that there are more than 8000 such facilities, most of which are located in areas where ice cover on average lasts a relatively short time, i.e., from 15 d to 3 months (Fukś, 2023). In Europe, most of the reservoirs in areas where river ice is present are located in the central region and on the Fennoscandian peninsula (Fig. 12). In areas of ice cover, a particularly large number of reservoirs are also located in central North America as well as central and eastern Asia (Fukś, 2023). Moreover, these are areas where a significant reduction in the duration of river ice cover has been observed over the past 40 years (Yang et al., 2020). Based on the studies presented here, it is reasonable to assume that the increase in the number of dam reservoirs is responsible for part of this effect.
Using two reservoirs located in the Carpathian region as an example, this study presents a method for estimating the impact of dam reservoirs on river ice cover based on measurement data from water gauge cross sections and a logistic regression model. An estimation of the extent of the impact of dam reservoirs based on SAR data acquired by Sentinel-1 was also made here, and this method's use for determining the extent of dam impact was evaluated. The conclusions of the study can be summarized as follows:
-
At the local scale (single river), dam reservoirs exert direct impact on downstream river systems that change the occurrence of river ice faster than climate warming alone. The results presented here suggest that, in areas with a large number of reservoirs, these reservoirs may play an important role at the regional scale. This is evidenced by the modeling results and their comparison to the variability of ice cover occurrence in cross sections not influenced by a dam reservoir (C1 and S1). The decrease in the incidence of ice cover due to the operation of dam reservoirs could exceed 80 % in the sections of rivers immediately downstream of dam locations, with this effect decreasing with increasing distance from the reservoir. Based on this study, it can be assumed that the increase in the number of dam reservoirs is an important factor in the currently observed shortening of the duration of river ice cover.
-
The range of river sections downstream of the studied reservoirs on which total ice cover does not form was estimated at 60 and 26 km from the reservoir dam location. Based on the results presented in this study and a review of the literature, it can be concluded that the extent of dams' impact varies greatly. The considerable fluctuation in the range of influence that reservoirs have is most likely due to different local environmental conditions as well as the technical features of the dams' development.
-
Due to the significant impact of the studied reservoirs on the occurrence of river ice cover, it is necessary to take into account the influence of such structures when conducting studies addressing the role of climate change in the temporal and spatial variability of river ice cover. Failure to take into account the impact of reservoirs may result in erroneous attribution of the disappearance of river ice cover to an increase in air temperature and misinterpretation of the results. This is important given the substantial increase in the number of reservoirs in areas with river ice cover occurrence in the context of accelerating trends towards warmer air temperatures (1980s and 1990s).
-
Logistic regression models are a useful tool for studying the impact of dam reservoirs on river ice cover. This is evidenced by the high predictive ability of the created models, the relatively high accuracy determined on the basis of test sets, and the very high agreement of the modeling results with observations at cross sections upstream of the reservoirs. After appropriate adaptation, the logistic regression model and the presented procedure can be used to study the impact of dam reservoirs on other elements of the natural environment.
-
In relatively narrow (20–100 m) mountain rivers, SAR data are a useful tool for determining the sections downstream of dam reservoirs in which ice cover does not form. Despite the many errors inherent in the classification of SAR imagery, it is possible to estimate how far downstream of the reservoirs there is ice cover, which permits study of the extent of their influence. The usefulness of this type of data is evidenced by the validation of results based on optical imaging of the Sentinel-2 satellite.
Data on the daily occurrence of ice cover on the studied rivers and daily air temperature were obtained from the repository of the Polish Institute of Meteorology and Water Management (Institute of Meteorology and Water Management, 2024, https://danepubliczne.imgw.pl/data/dane_pomiarowo_obserwacyjne/) and hydrological yearbooks of surface waters of the Polish Institute of Meteorology and Water Management (1949–1980). Sentinel-1 (European Space Agency) data were obtained from the Earth Engine Data Catalog (2024, https://developers.google.com/earth-engine/datasets/catalog/COPERNICUS_S1_GRD).
The author has declared that there are no competing interests.
Publisher's note: Copernicus Publications remains neutral with regard to jurisdictional claims made in the text, published maps, institutional affiliations, or any other geographical representation in this paper. While Copernicus Publications makes every effort to include appropriate place names, the final responsibility lies with the authors.
This research was funded in whole by the National Science Center, Poland (grant no. 2020/39/O/ST10/00652). For the purpose of Open Access, the author has applied a CC-BY public copyright license to any Author Accepted Manuscript (AAM) version arising from this submission.
This paper was edited by Daniel Farinotti and reviewed by Andrew Newton and two anonymous referees.
Apsîte, E., Elferts, D., and Latkovska, I.: Long-term changes of Daugava River ice phenology under the impact of the cascade of hydro power plants, Proc. Latv. Acad. Sci., 70, 71–77, https://doi.org/10.1515/prolas-2016-0012, 2016.
Ayalew, L. and Yamagishi, H.: The application of GIS-based logistic regression for landslide susceptibility mapping in the Kakuda-Yahiko Mountains, Central Japan, Geomorphology, 65, 15–31, https://doi.org/10.1016/j.geomorph.2004.06.010, 2005.
Belolipetsky, V. M., Genova, S. N.: Investigation of hydrothermal and ice regimes in hydropower station bays, Int. J. Comput. Fluid Dyn., 10, 151–158, https://doi.org/10.1080/10618569808961681, 1998.
Cai, H., Piccolroaz, S., Huang, J., Liu, Z., Liu, F., and Toffolon, M.: Quantifying the impact of the Three Gorges Dam on the thermal dynamics of the Yangtze River, Environ. Res. Lett., 13, 054016, https://doi.org/10.1088/1748-9326/aab9e0, 2018.
Carlson, R. F.: Ice formation on rivers and lakes, North. Eng., 13, 4–9, 1981.
Chang, J., Wang, X., Li, Y., and Wang, Y.: Ice regime variation impacted by reservoir operation in the Ning-Meng reach of the Yellow River, Nat. Hazards, 80, 1015–1030, https://doi.org/10.1007/s11069-015-2010-5, 2016.
Chen, Y., Lian, J., Zhao, X., Guo, Q., and Yang, D.: Advances in Frazil Ice Evolution Mechanisms and Numerical Modelling in Rivers and Channels in Cold Regions, Water, 15, 2582, https://doi.org/10.3390/w15142582, 2023.
Cox, D. R.: The regression analysis of binary sequences, J. Roy. Stat. Soc. B, 20, 215–232, 1958.
Cyberska, B.: Zmiany w temperaturze i zlodzeniu rzek poniżej zbiorników retencyjnych, Gospodarka Wodna, 7, 244–250, 1972 (in Polish).
Cyberska, B.: Wpływ zbiornika retencyjnego na transformację naturalnego reżimu termicznego rzeki, Prace IMGW, 4, 45–108, 1975 (in Polish).
European Space Agency (ESA): Sentinel-1 SAR GRD: C-band Synthetic Aperture Radar Ground Range Detected, Earth Engine Data Catalog [data set], https://developers.google.com/earth-engine/datasets/catalog/COPERNICUS_S1_GRD#description, last access: 15 May 2024.
Fox-Kemper, B., Hewitt, H. T., Xiao, C., Aðalgeirsdóttir, G., Drijfhout, S. S., Edwards, T. L., Golledge, N. R., Hemer, M., Kopp, R. E., Krinner, G., Mix, A., Notz, D., Nowicki, S., Nurhati, I. S., Ruiz, L., Sallée, J.-B., Slangen, A. B. A., and Yu, Y.: Ocean, Cryosphere and Sea Level Change. in: Climate Change 2021: The Physical Science Basis. Contribution of Working Group I to the Sixth Assessment Report of the Intergovernmental Panel on Climate Change, edited by: Masson-Delmotte, V., Zhai, P., Pirani, A., Connors, S.L., Péan, C., Berger, S., Caud, N., Chen, Y., Goldfarb, L., Gomis, M.I., Huang, M., Leitzell, K., Lonnoy, E., Matthews, J.B.R., Maycock, T.K., Waterfield, T., Yelekçi, O., Yu, R., and Zhou B., Cambridge University Press, Cambridge, United Kingdom and New York, NY, USA,1211–1362, https://doi.org/10.1017/9781009157896.011, 2021.
Fukś M.: Changes in river ice cover in the context of climate change and dam impacts – a review, Aquat. Sci., 85, 113, https://doi.org/10.1007/s00027-023-01011-4, 2023.
Hennig, J., Hennig I., and Roszkowski A.: Zbiorniki retencyjne, in: Dorzecze górnej Wisły Część 2, edited by: Dynowska, I. and Maciejewski, M., PWN, 1991 (in Polish).
Huokuna, M., Morris, M., Beltaos, S., and Burrell, B. C.: Ice in reservoirs and regulated rivers, Int. J. River Basin Manag., 20, 1–16, https://doi.org/10.1080/15715124.2020.1719120, 2022.
Institute of Meteorology and Water Management (IMGW-PIB): Hydrological yearbooks of surface waters, Warsaw, Poland, 1949–1980.
Institute of Meteorology and Water Management, Poland: Archival measurement and observation data, Institute of Meteorology and Water Management, Poland [data set], https://danepubliczne.imgw.pl/data/dane_pomiarowo_obserwacyjne/, last access: 15 May 2024.
Jasek, M. and Pryse-Phillips, A.: Influence of the proposed Site C hydroelectric project on the ice regime of the Peace River, Can. J. Civ. Eng., 42, 645–655, https://doi.org/10.1139/cjce-2014-0425, 2015.
Kędra, M. and Wiejaczka, Ł.: Disturbance of water-air temperature synchronization by dam reservoirs, Water Environ. J., 30, 31–39, https://doi.org/10.1111/wej.12156, 2016.
Kędra, M. and Wiejaczka, Ł.: Climatic and dam-induced impacts on river water temperature: Assessment and management implications, Sci. Total Environ., 626, 1474–1483, https://doi.org/10.1016/j.scitotenv.2017.10.044, 2018.
Kendall, M. G.: Rank Correlation Methods, 4th edn., Charles Griffin, London, UK, 1975.
Kloss, A.: Podstawowe parametry głównych obiektów, in: Zespół zbiorników wodnych Czorsztyn-Niedzica i Sromowce Wyżne im, Gabriela Narutowicza monografia, edited by: Łagosz, T., Dziewański, J., Godlewski, B., Hobot, U., Krakowski, M., Łaski, A., Witkowski, Z., and Wolski, W., 2003 (in Polish)
Lee, J. Y. and Kim, J. S.: Detecting areas vulnerable to flooding using hydrological-topographic factors and logistic regression, Appl. Sci., 11, 5652, https://doi.org/10.3390/app11125652, 2021.
Lehner, B., Reidy Liermann, C., Revenga, C., Vörösmarty, C., Fekete, B., Crouzet, P., Döll, P., Endejan, M., Frenken, K., Magome, J., Nilsson, C., Robertson, J. C., Rodel, R., Sindorf, N., and Wisser, D.: Highresolution mapping of the world's reservoirs and dams for sustainable river-fow management, Front. Ecol. Envirol., 9, 494–502, https://doi.org/10.1890/100125, 2011.
Lewińska, J. and Lewiński, A.: Wpływ energetycznego wykorzystania zbiorników wodnych na zmianę reżimu termicznego wody, Gosp. Wodna, 8, 295–296, 1972 (in Polish).
Lewis, S. L. and Maslin, M. A.: Defining the Anthropocene, Nature, 519, 171–180, https://doi.org/10.1038/nature14258, 2015.
Magnusson, J. J., Robertson, D. M., Benson, B. J., Wynne, R. H., Livingstone, D. M., Arai, T., Assel, R.A., Barry, R. G., Card, V., Kuusisto, E., Granin, N. G., Prowse, T. D., Stewart, K. M., and Vuglinski, V.S.: Historical trends in lake and river ice cover in the Northern Hemisphere, Science, 289, 1743–1746, https://doi.org/10.1126/science.289.5485.1743, 2000.
Maheu, A., St-Hilaire, A., Caissie, D., and El-Jab, N.: Understanding the thermal regime of rivers influenced by small and medium size dams in Eastern Canada, River Res. Appl., 32, 2032–2044, https://doi.org/10.1002/rra.3046, 2016.
Mann, H. B.: Nonparametric tests against trend, Econometrica, 13, 245–259, https://doi.org/10.2307/1907187, 1945.
Michel, B.: From the nucleation of ice crystals in clouds to the formation of frazil ice in rivers, Physics of Snow and Ice: proceedings, 1, 129–136, 1967.
Newton, A. M. W. and Mullan, D. J.: Climate change and Northern Hemisphere lake and river ice phenology from 1931–2005, The Cryosphere, 15, 2211–2234, https://doi.org/10.5194/tc-15-2211-2021, 2021.
Osterkamp, T. E. and Gilfilian, R. E.: Nucleation characteristics of stream water and frazil ice nucleation, Water Resour. Res., 11, 926–928, 1975.
Palomaki, R. T. and Sproles, E. A.: Quantifying the Effect of River Ice Surface Roughness on Sentinel-1 SAR Backscatter, Remote Sens.-Basel, 14, 5644, https://doi.org/10.3390/rs14225644, 2022.
Pawłowski, B.: Determinants of change in the duration of ice phenomena on the Vistula River in Toruń, J. Hydrol. Hydromech., 63, 145–153, https://doi.org/10.1515/johh-2015-0017, 2015.
Punzet, J.: Przepływy charakterystyczne in: Dorzecze górnej Wisły Część 1, edited by: Dynowska, I. and Maciejewski, M., PWN, 1991 (in Polish).
Sen, P. K.: Estimates of the regression coefficient based on Kendall's tau, J. Am. Stat. Assoc., 63, 1379–1389, 1968.
Sobiech, J. and Dierking, W.: Observing lake-and river-ice decay with SAR: advantages and limitations of the unsupervised k-means classification approach, Ann. Glaciol., 54, 65–72, 2013.
Starosolszky, Ö.: Effect of river barrages on ice regime, J. Hydraul. Res. 28, 711–718, https://doi.org/10.1080/00221689009499021, 1990.
Stonevicius, E., Uselis, G., and Grendaite, D.: Ice Detection with Sentinel-1 SAR Backscatter Threshold in Long Sections of Temperate Climate Rivers, Remote Sens.-Basel, 14, 1627, https://doi.org/10.3390/rs14071627, 2022.
Takács, K. and Kern, Z.: Multidecadal changes in the river ice regime of the lower course of the River Drava since AD 1875, J. Hydrol., 529, 1890–1900, https://doi.org/10.1016/j.jhydrol.2015.01.040, 2015.
Takács, K., Kern, Z., and Nagy, B.: Impacts of anthropogenic effects on river ice regime: Examples from Eastern Central Europe, Quaternary Int., 293, 275–282, https://doi.org/10.1016/j.quaint.2012.12.010, 2013.
Theil, H. A.: rank-invariant method of linear and polynomial regression analysis I, II, III, Proc. R. Neth. Acad. Arts Sci., 53, 1397–1412, 1950.
Thellman, A., Jankowski, K. J., Hayden, B., Yang, X., Dolan, W., Smits, A. P., and O'Sullivan, A. M.: The ecology of river ice, J. Geophys. Res.-Biogeo., 126, e2021JG006275, https://doi.org/10.1029/2021JG006275, 2021.
Wiejaczka, Ł.: Wpływ zbiornika wodnego “Klimkówka” na zlodzenie Ropy, in: Funkcjonowanie środowiska przyrodniczego w okresie przemian gospodarczych w Polsce, edited by: Bochenek, W. and Kijowska, M., Szymbark, 172–187, 2009 (in Polish).
Wiejaczka, Ł., Kijowska-Strugała, M., Pierwoła, P., and Nowak, M.: Influence of the Czorsztyn-Sromowce Wyżne Reservoir complex on the Dunajec River thermal-regime, Geogr. Pol., 88, 467–482, https://doi.org/10.7163/GPol.0029, 2015.
Wu, Y., Duguay, C. R., and Xu, L.: Assessment of machine learning classifiers for global lake ice cover mapping from MODIS TOA reflectance data, Remote Sens. Environ., 253, 112206, https://doi.org/10.1016/j.rse.2020.112206, 2021.
Yang, X., Pavelsky, T. M., and Allen, G. H.: The past and future of global river ice, Nature, 577, 69–73, https://doi.org/10.1038/s41586-019-1848-1, 2020.
The requested paper has a corresponding corrigendum published. Please read the corrigendum first before downloading the article.
- Article
(10916 KB) - Full-text XML