the Creative Commons Attribution 4.0 License.
the Creative Commons Attribution 4.0 License.
 | 07 May 2024
Thermal infrared shadow-hiding in GOES-R ABI imagery: snow and forest temperature observations from the SnowEx 2020 Grand Mesa field campaign
C. Chris Chickadel
Jessica D. Lundquist
The high temporal resolution of thermal infrared imagery from the Geostationary Operational Environmental Satellites R-series (GOES-R) presents an opportunity to observe mountain snow and forest temperatures over the full diurnal cycle. However, the off-nadir views of these imagers may impact or bias temperature observations, especially when viewing a surface composed of both snow and forests. We used GOES-16 and -17 thermal infrared brightness temperature observations of a flat snow- and forest-covered study site at Grand Mesa, Colorado, USA, to characterize how forest coverage and view angle impact these observations. These two geostationary satellites provided views of the study area from the southeast (134.1° azimuth, 33.5° elevation) and southwest (221.2° azimuth, 35.9° elevation), respectively. As part of the NASA SnowEx field campaign in February 2020, coincident brightness temperature observations from ground-based and airborne IR sensors were collected to compare with those from the geostationary satellites. Observations over the course of 2 cloud-free days spanned the entire study site. The brightness temperature observations from each dataset were compared to find their relative differences and how those differences may have varied over time and/or as a function of varying forest cover across the study area. GOES-16 and -17 brightness temperatures were found to match the diurnal cycle and temperature range within ∼ 1 h and ± 3 K of ground-based observations. GOES-16 and -17 were both biased warmer than nadir-looking airborne IR and ASTER observations. The warm biases were higher at times when the sun–satellite phase angle was near its daily minimum. The phase angle, the angle between the direction of incoming solar illumination and the direction from which the satellite is viewing, reached daily minimums in the morning for GOES-16 and afternoon for GOES-17. In morning observations, warm biases in GOES-16 brightness temperature were greater for pixels that contained more forest coverage. The observations suggest that a “thermal infrared shadow-hiding” effect may be occurring, where the geostationary satellites are preferentially seeing the warmer sunlit sides of trees at different times of day. These biases are important to understand for applications using GOES-R brightness temperatures or derived land surface temperatures (LSTs) over areas with surface roughness features, such as forests, that could exhibit a thermal infrared shadow-hiding effect.
- Article
(12079 KB) - Full-text XML
- BibTeX
- EndNote


Mountain areas that receive seasonal snow are the headwaters of rivers that more than a billion people depend on globally (Immerzeel et al., 2020). Despite their importance, these are notoriously difficult places to gather hydrological or meteorological observations for predicting snow water equivalent (SWE) and the timing and magnitude of streamflow (Raleigh et al., 2013). Longwave radiation measurements, of which the upwards component is controlled by the diurnal cycle of snow surface temperature, have been identified as especially critical for modeling these snowmelt-fed systems (Lapo et al., 2015; Raleigh et al., 2016). Distributed observations of surface temperatures at sub-daily temporal resolutions are needed for hydrologic and land surface models and could aid real-time forecasting (Shamir and Georgakakos, 2014). Thermal infrared imagery from geostationary satellites that constantly view the same portions of Earth's surface, such as the GOES-R Advanced Baseline Imager (ABI), can make land surface temperature (LST) observations at very high temporal resolution (5 min or better), capturing the full diurnal cycle. These observations, however, have spatial resolutions of ≥2 km, and view the land surface from off-nadir angles.
The 2020 NASA SnowEx field campaign was a collaborative effort between government agencies and academic researchers to intercompare and evaluate snow remote sensing methods with extensive ground-based observations. This was conducted in early 2020 at Grand Mesa, a large flat-topped mountain in the western part of the US state of Colorado. As part of this campaign, a multi-sensor experiment was designed to investigate how the off-nadir views of GOES-R satellites affect their surface temperature retrievals over snow and forests by making thermal infrared brightness temperature observations and intercomparisons at a range of spatial and temporal scales (Table 1, Fig. 1). This unique study site, a flat expanse of snow and conifer forest, allowed us to investigate how forests affect observed brightness temperatures, independent of the effects due to complex terrain. Ground-based snow brightness temperature measurements provided a continuous point of comparison for GOES-R, while multiple overpasses from airborne IR imagery, gridded to 5 m spatial resolution, provided finer-resolution distributed brightness temperature details over the course of two mornings. To benchmark the ground point measurements and airborne IR, which itself has a wide range of view angles (Pestana et al., 2019), we compared these with a coincident nadir-looking ASTER thermal infrared image at 90 m spatial resolution. Specifically, we set out to address the following questions regarding GOES-R ABI thermal infrared brightness temperature observations during SnowEx. (1) What were the relative accuracies of each source of remotely sensed brightness temperature? (2) How did fractional forest cover impact the relative accuracy of GOES-R ABI brightness temperature across the study area? (3) How did the relative accuracy of GOES-R ABI brightness temperature change over the course of each day of observations?
Table 1Ground-based and remotely sensed temperature observations from the SnowEx 2020 field campaign used in this study.

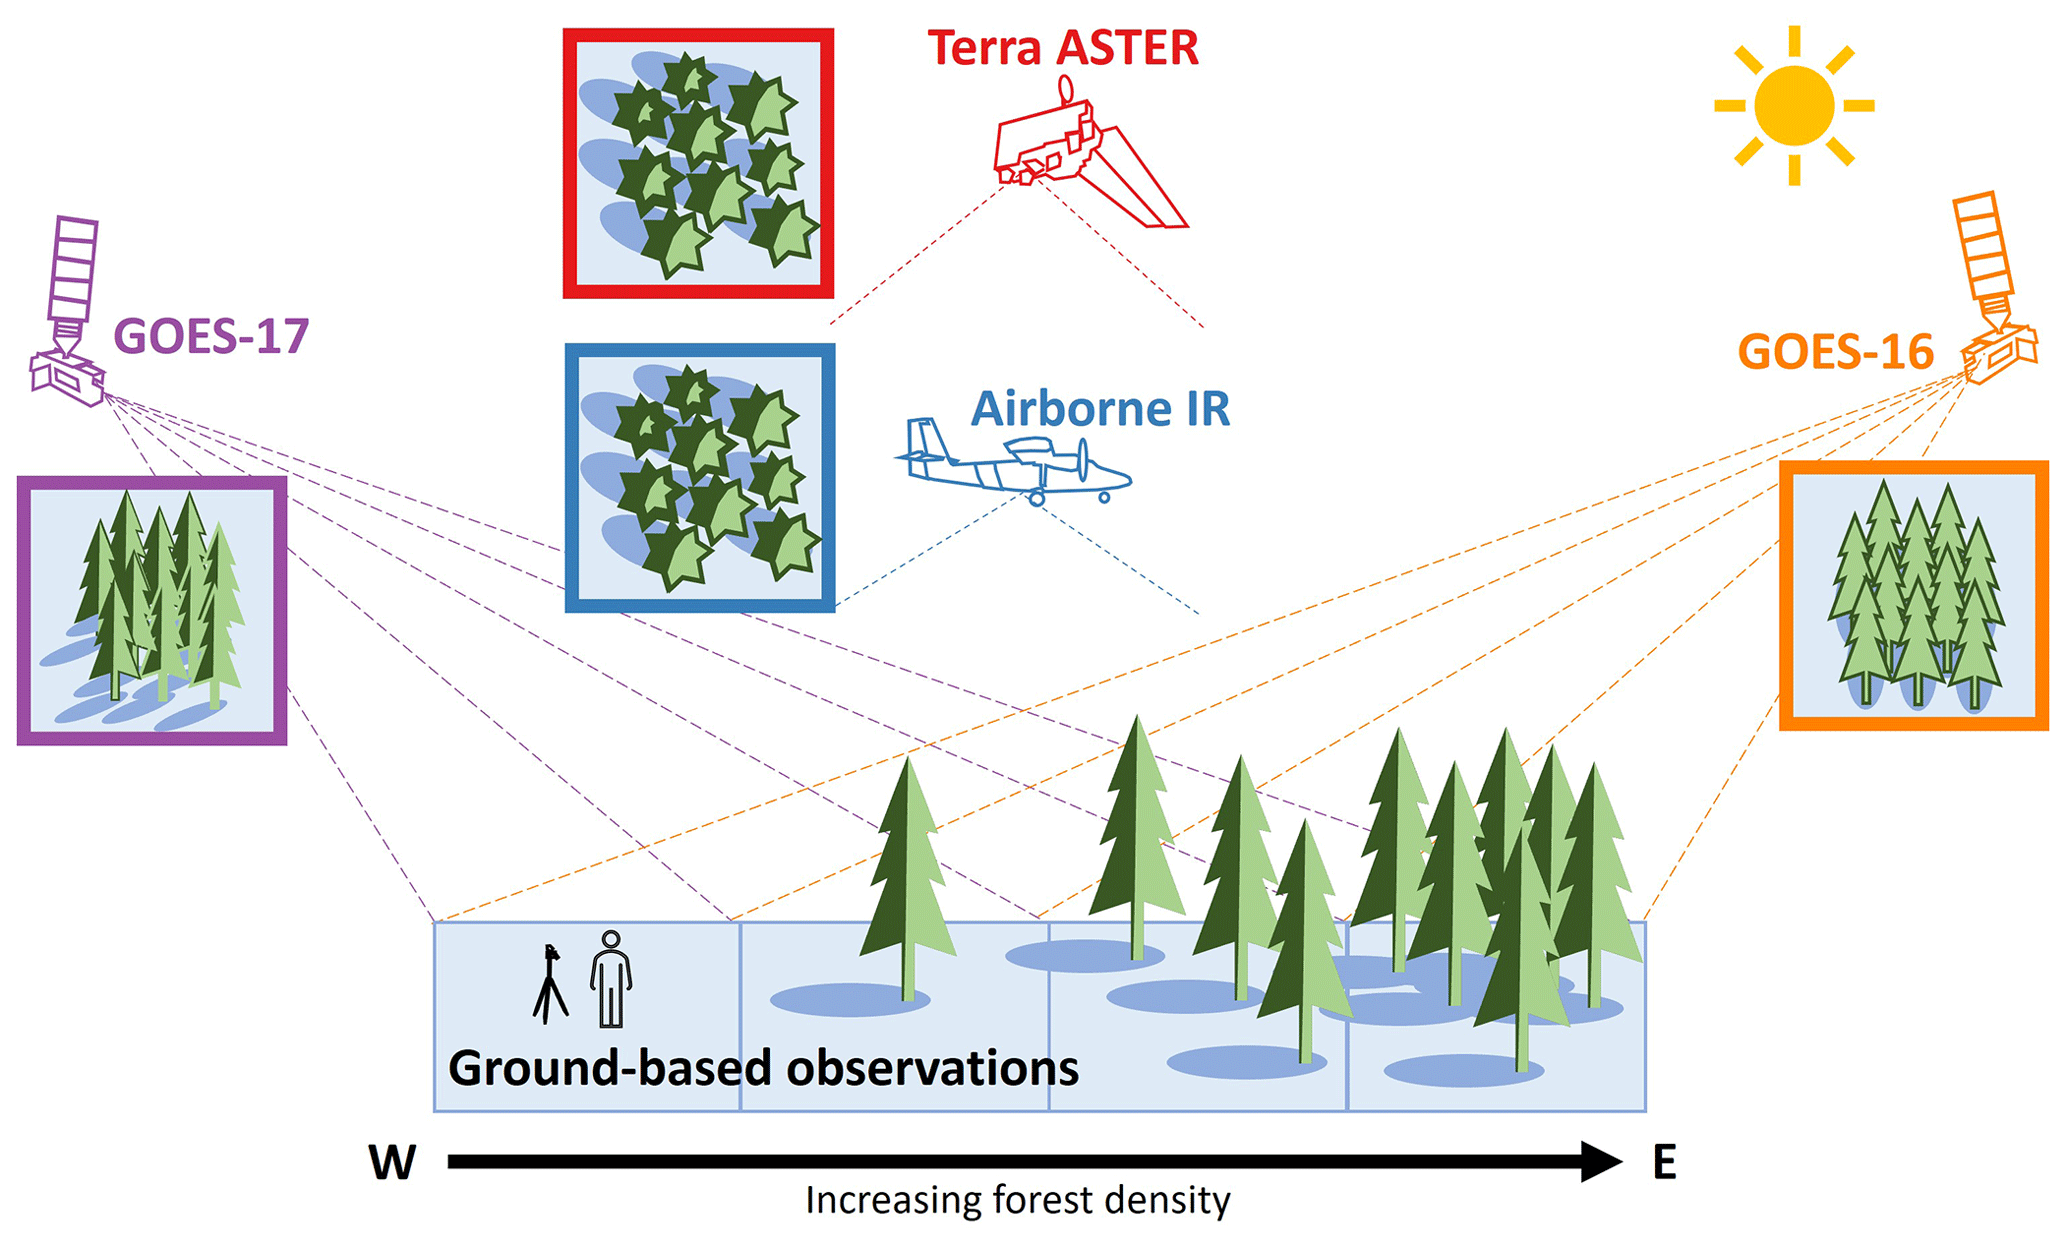
Figure 1Conceptual illustration of how nadir and off-nadir looking remote sensing imagers see parts of a forest canopy and, depending on the direction of solar illumination, the shadows cast by trees.
We hypothesized that among the brightness temperature observations collected, the best agreements would be between the nadir-looking ASTER, nadir-looking airborne IR, and ground-based snow brightness temperatures. We further hypothesized that for GOES-R ABI pixels with greater forest canopy, the observed brightness temperatures would be greater than those from the nadir ASTER and airborne IR imagery. Finally, we hypothesized that these warm biases would be greatest in the early morning observations of GOES-16 (GOES-East) and late afternoon observations of GOES-17 (GOES-West), when they are viewing the solar-illuminated side of trees.
2.1 High temporal resolution thermal infrared imagery
Land surface models are highly sensitive to their temperature and longwave forcing input (Mizukami et al., 2014; Raleigh et al., 2015) in both accumulation and ablation periods (Günther et al., 2019). This is especially important for sparsely instrumented mountain areas, where land surface models can have air temperature errors of ∼3–4 °C (Tomasi et al., 2017). Differences in forcing inputs, or how surface energy fluxes are parameterized in land surface models, can result in hourly surface temperature errors of as much as 15 °C (Essery et al., 2013), and lead to snow disappearance date uncertainties spanning months (Hinkelman et al., 2015). Surface temperature observations at model-relevant time steps, such as hourly temporal resolutions, are especially needed to capture diurnal processes like snow melt–freeze cycles (Niu et al., 2011) and snow grain metamorphism, which in turn drive feedbacks in the surface energy balance through changes in emissivity and albedo (Flanner and Zender, 2006; Warren, 1982, 2019).
Thermal infrared satellite imagery can provide snow surface temperature observations for homogenous snow-covered landscapes (Hall et al., 2008; Wan et al., 2002), estimates of near-surface air temperature (Pepin et al., 2016; Shamir and Georgakakos, 2014), and dew-point temperature (Raleigh et al., 2013), all of which are needed for modeling hydrologic processes. However, satellite observations at < 100 m spatial resolution are made too infrequently (4–16 d repeat) for looking at snow surface energy balance processes at model-relevant time steps. Observations from imagers like VIIRS or MODIS (250 m to 1 km resolution) provide two observations per day each for mid-latitude locations. The observations from the sun-synchronous orbiting MODIS or VIIRS imagers do not necessarily see the coldest and warmest times of day to capture the full diurnal temperature range (DTR), nor do they provide LST more frequently than every few hours. Their twice-daily observations can also be obscured by cloud cover, creating large data gaps relative to the diurnal cycle of snow surface temperatures.
Geostationary satellite imagery may help overcome these drawbacks, providing high-temporal-resolution LST, potentially seeing between intermittent periods of cloud cover, though at coarser spatial resolutions (≥2 km) and off-nadir view angles. In the complex terrain and forest vegetation of mountain watersheds, the individual image pixels from thermal infrared observations will report an LST signature that is a mixture of the subpixel snow and forest surface temperatures (Dozier, 1981; Selkowitz et al., 2014). Snow and vegetation can have significant temperature differences, especially on clear days, where incoming solar radiation warms forest canopies more than the high albedo snow surface, and during the snowmelt period, when daytime snow surface temperatures are capped at 0 °C (Pestana et al., 2019). Sections 4.4 and 5.4 describe how we tested the uncertainty around the assumption that the brightness temperatures of surfaces within a pixel's footprint scale linearly to a mean brightness temperature and the geolocation uncertainty of GOES ABI pixel footprints.
2.2 Off-nadir views and shadow-hiding
Imagery from geostationary satellites comes with the drawback of having off-nadir view angles. These view angles are dependent on the location of the area of interest on Earth's surface and the satellite's orbital position (Schmit et al., 2017). Interpretation of off-nadir thermal infrared images require consideration of the parallax effect over rough surfaces, the angular emissivity of different surface materials, and longer atmospheric path lengths.
In thermal infrared satellite imagery, the parallax effect can lead to different brightness temperatures being observed for the same area of interest at different view angles. Geostationary satellites view the mountains of North America from the south; therefore, south-facing mountain slopes appear lengthened, occupying a larger portion of an image, north-facing mountain slopes are foreshortened, and steeper north-facing mountain slopes may be completely occluded from view. Prior work compared brightness temperatures from off-nadir GOES-16 thermal infrared imagery to coincident nadir-looking ASTER and MODIS thermal infrared imagery over the Sierra Nevada of California (Pestana and Lundquist, 2022). This work showed that GOES-16 imagery preferentially viewed south-facing slopes, which receive more solar illumination in the daytime, heating up more than shaded north-facing slopes. GOES-16 brightness temperatures were therefore biased warm in comparison to those from ASTER and MODIS, which being nadir-pointing could see both the sunlit and shaded sides of mountain slopes.
The parallax effect is also important at smaller spatial scales, such as that of individual trees in a forested landscape (Fig. 1). Tree profiles (rather than canopy tops) come into view when observed from off-nadir angles, causing each tree to take up more space in the image. Off-nadir imagery of landscapes with snow and forests will also have trees obscuring the snow surface behind and beneath them (Balick et al., 2002; Pestana et al., 2019). Much like at the scale of mountain slopes, daytime solar illumination, especially at low sun angles, will warm up one side of trees more than the other shaded side. The observed thermal infrared brightness temperature of mountainous or forested terrain is therefore dependent on both view angle and the angle of solar illumination. The angle between the two is the phase angle (Henderson et al., 2003). The same landscape can therefore appear warmer at small phase angles when solar illuminated surfaces are in view and shaded areas are occluded, or colder at large phase angles when more shaded areas are in view and sunlit areas are occluded (Fig. 1). With visible and NIR imagery, this effect is referred to as “shadow-hiding,” or creating a “hotspot” (really a bright spot), over surface roughness features, such as trees (Hall et al., 1993; Bréon et al., 2002) or wind forms in snow, such as sastrugi (Warren et al., 1998). With nadir-pointing satellite imagers in sun-synchronous orbits (e.g., MODIS or VIIRS), the phase angle changes slowly on an annual cycle, but with a geostationary satellite able to observe at high temporal resolution, the phase angle changes continuously over each diurnal cycle (Pestana et al., 2023).
Due to the off-nadir view angles of the GOES-R ABI observations, the angular emissivity of surfaces observed, i.e., a snow-covered forested landscape, must also be considered. The near blackbody-like emissivity of vegetation, such as the conifers that dominate the study area (Sect. 3.1), does not vary with view angle. The emissivity of snow, however, does vary with view angle and with grain size (Dozier and Warren, 1982). The emissivity of snow is smaller at larger view angles; however, over rough snow surfaces such as the wind-formed sastrugi observed over the westernmost portion of the mesa, there is a wide distribution of view angles normal to the snow surface even for a nadir-looking imager. At the view angles that GOES-16 and -17 observed our study area (Sect. 3.3.1), snow emissivity could range from 0.95 for coarse-grained snow (such as > 1 mm melt forms) to 0.99 for fine-grained snow (such as < 1 mm fragmented dendritic precipitation particles) (Hori et al., 2006; Warren, 2019). At the lowest end of this emissivity range, a snow surface at 260 K would have a brightness temperature about 3 K colder seen by the off-nadir-looking GOES compared to a nadir-looking satellite imager, and it would be about 0.5 K colder at the highest end of this range. Snow pit observations (Vuyovich et al., 2021) coinciding with the GOES observations used in this work reported predominately fine-grained decomposing and fragmented precipitation particles of < 1 mm at the snow surface. We can therefore expect to see in our comparison of brightness temperatures from imagers with different view angles that GOES ABI observations may be biased low by 0.5 K relative to nadir observations due to emissivity alone. GOES-R ABI brightness temperatures may also be biased low in comparison with a nadir-looking view due to their longer atmospheric path lengths, but this effect can be negligible for cloud-free high-altitude winter conditions when absorption of thermal infrared radiation by water vapor is minimal (Pestana and Lundquist, 2022). See Sect. 6.1 for further discussion of atmospheric effects.
3.1 SnowEx 2020 field campaign study site
The 2020 NASA SnowEx field campaign intensive observation period (IOP) took place at Grand Mesa in western Colorado (39.02°, −108.12°) from 26 January to 14 February 2020 (Fig. 2). This period of the field campaign brought together snow remote sensing researchers to test new instruments and methods and to collect extensive ground-based observations for validation. Grand Mesa, a large flat-topped mountain with elevations above 3000 m, is located within the watersheds of the upper Colorado River and its tributary, the Gunnison River. This region was chosen as a location to evaluate remote sensing observations of mountain snow because of its flat terrain, where the additional complications of view angles and complex terrain are minimized. The site is also beneficial for thermal infrared remote sensing because at its high elevation the atmospheric path length, and therefore magnitude of absorption of thermal infrared radiation by water vapor in the atmosphere, is lower than that of sites at lower elevations. The high emissivities of both snow and conifer trees provide us with a scene where brightness temperatures are close to true surface temperatures (Kim et al., 2018; Warren, 2019).
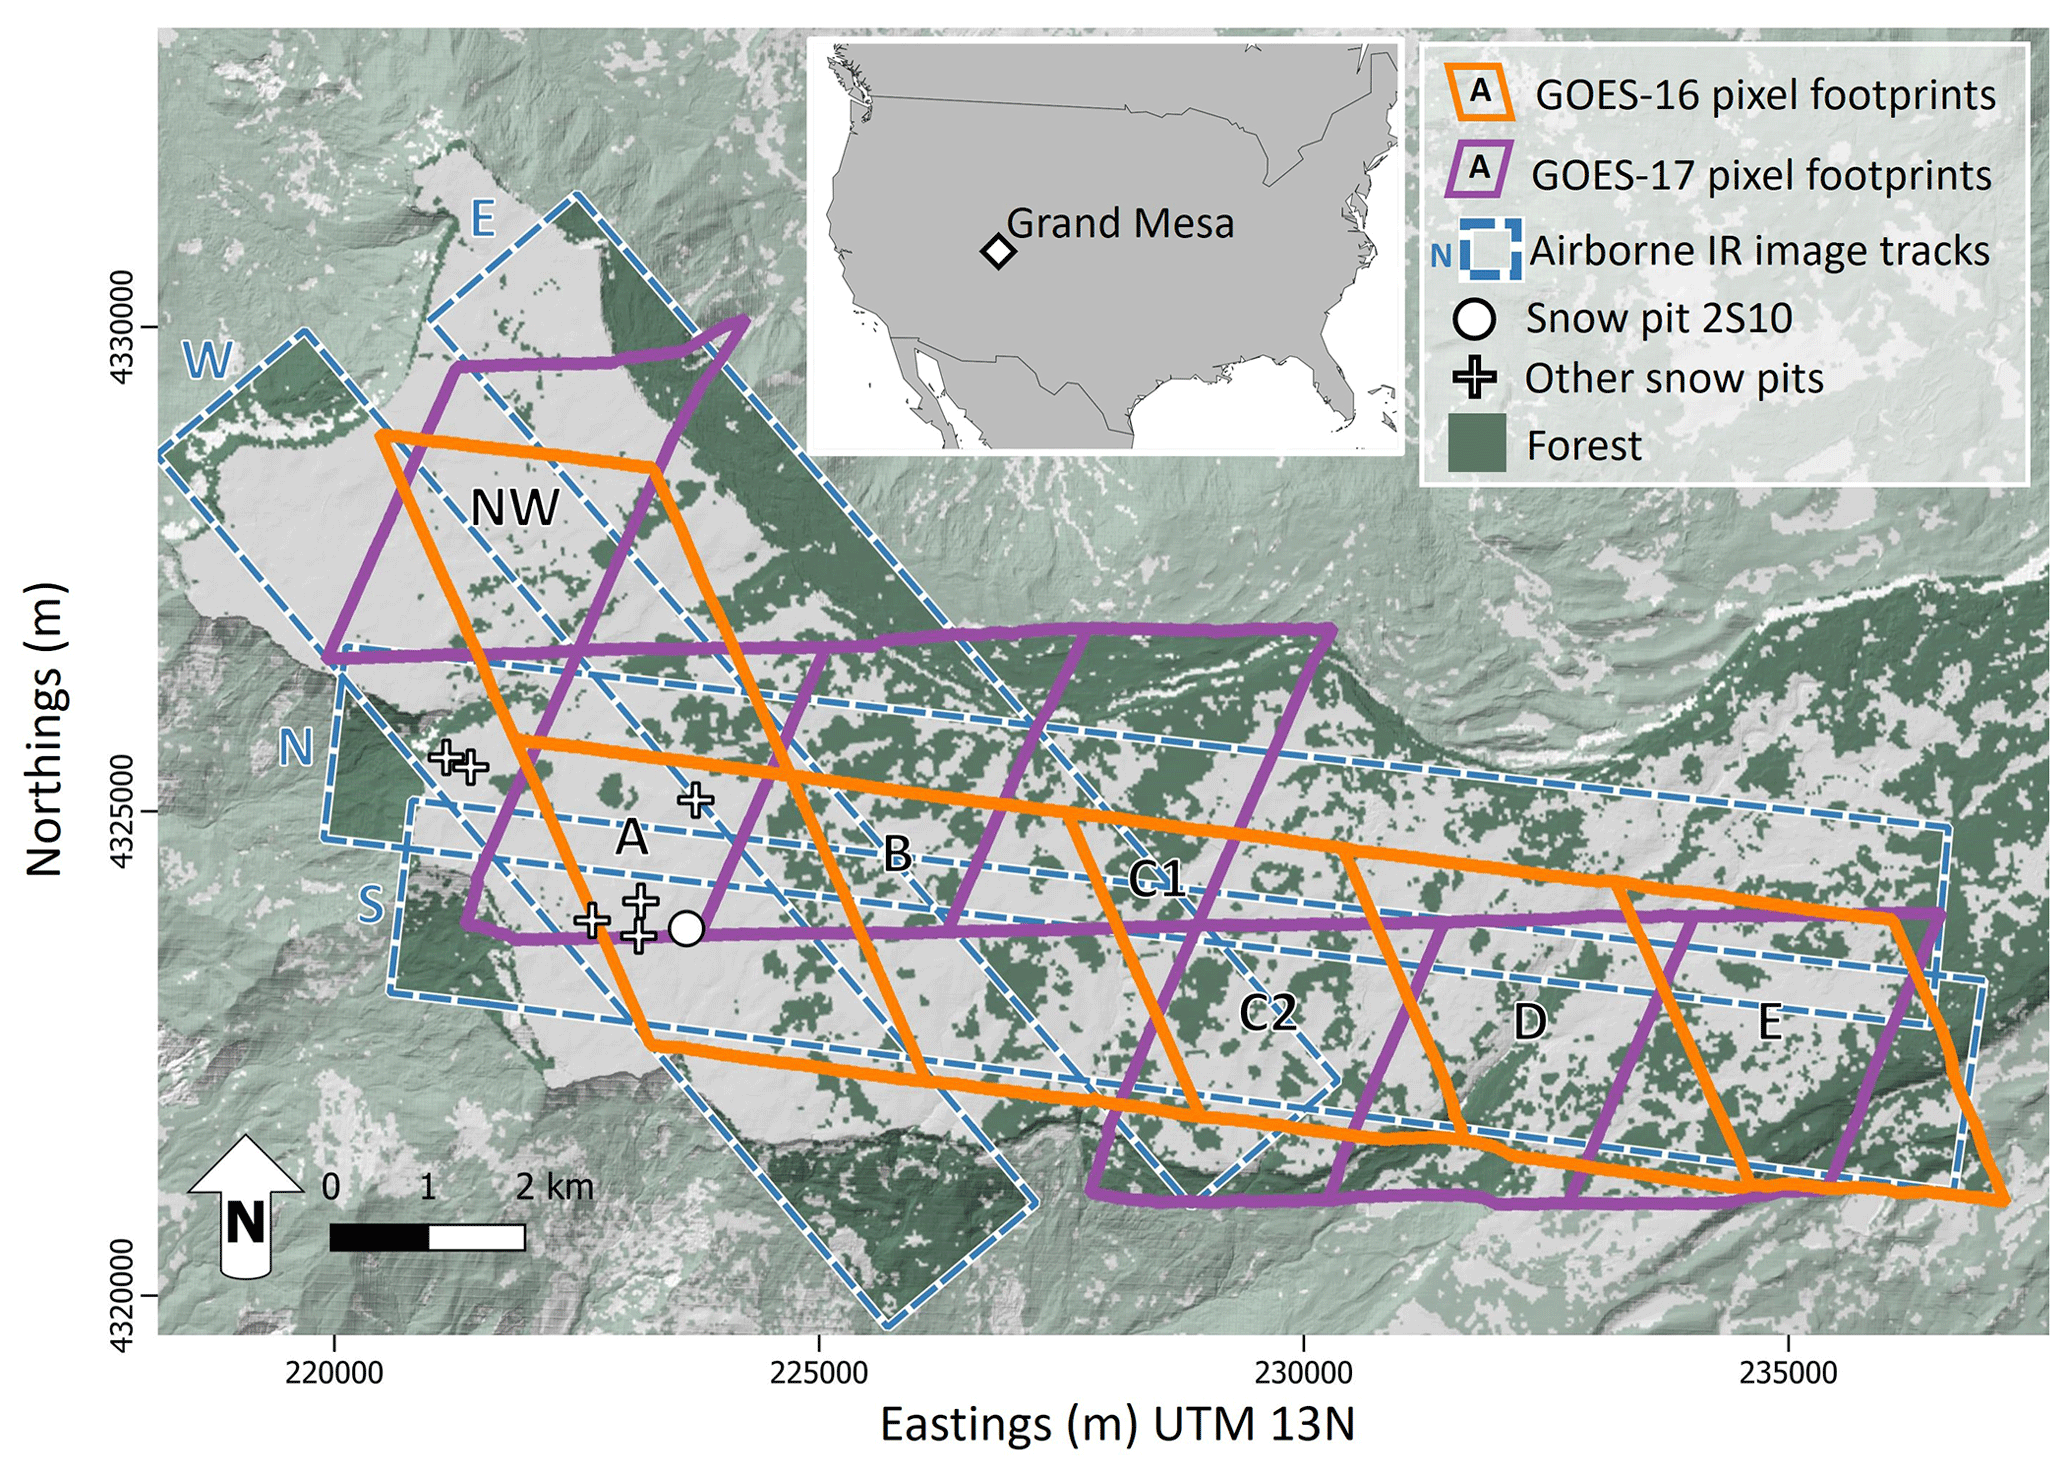
Figure 2Map of the study area at Grand Mesa, Colorado, and inset map showing its location within the contiguous United States. Polygons outline GOES-16 (orange) and GOES-17 (purple) ABI pixel footprints, and airborne IR image mosaic swaths (dashed blue lines). Snow pit 2S10, where automated continuous snow brightness temperatures were observed, is indicated by the white circle, and instantaneous snow surface temperature observations at other snow pits are indicated by white + symbols. Dark green areas indicate forests within the area covered by the thermal infrared remote sensing imagery.
During the IOP field campaign, the ground surface was entirely snow covered, with no bare ground surfaces visible in remotely sensed imagery. The westernmost portion of Grand Mesa is sparsely forested, and forest cover increases across the mesa towards the east. Mixed conifer forests of Engelmann spruce (Picea engelmannii), subalpine fir (Abies lasiocarpa), and lodgepole pine (Pinus contorta var. latifolia) species dominate the vegetation that stood above the snow, with some stands of deciduous Aspen (Populus tremuloides) trees (Currier et al., 2019).
3.2 Ground-based observations
Ground-based observations at Grand Mesa included continuous automated measurements of snow brightness temperature and instantaneous manual snow surface temperatures measurements taken as part of the data collection at individual snow pits. Snow brightness temperatures were measured continuously by an Apogee SI-111 radiometer (8–14 µm) installed at snow pit 2S10 in the western portion of the mesa (39.0195, −108.19214). This radiometer viewed the snow surface at an angle of 45° from nadir and was mounted 2 m above the ground surface, which at this time was 1.27 m above the snow surface. The radiometer had an instantaneous field of view of 44°, giving it an approximately elliptical footprint of 1.45 m × 2.45 m on the top of the snow surface. Snow brightness temperatures measured by this radiometer were recorded at a 5 min temporal resolution (Pestana and Lundquist, 2021). More than 150 snow pits were dug by the field teams over the course of the IOP (Vuyovich et al., 2021), and among the measurements recorded at each snow pit were snow grain size and types, snow surface temperature, and the time of the surface temperature measurement. Snow surface temperatures were measured by a stem thermometer inserted into the topmost 1 cm of snow and shaded from direct sunlight. These snow pit data were accessed from the SnowEx database through the snowexsql Python library (Johnson et al., 2023). The USGS National Elevation Dataset 1 arcsec (∼ 30 m) DEM (United States Geological Survey, 2021) and Tree Canopy Cover (TCC) product from the National Land Cover Database (NLCD) 2016 (Coulston et al., 2012) were used to compute zonal statistics of elevation and fractional vegetated area (fveg), respectively, across the study site.
3.3 Remote sensing observations
3.3.1 GOES-R ABI
Images from the Advanced Baseline Imager (ABI) onboard GOES-16 and GOES-17 were retrieved for the duration of the study period in February 2020. The 5 min temporal resolution Level 1b top-of-atmosphere Radiance CONUS product (L1b-RadC) for thermal infrared bands 13 (10.3 µm) and 14 (11.2 µm), and the 1 h temporal resolution Level 2 Land Surface Temperature CONUS product (L2-LSTC), were downloaded as NetCDF files via the goespy library (Mello and Pestana, 2022). Both satellites viewed the Grand Mesa study site from similar view angles, though with GOES-16 in the southeastern sky (azimuth 134.1°, or 45.9° from due south) and GOES-17 in the southwestern sky (azimuth 221.2°, or 41.2° from due south), with elevation angles of 33.5° and 35.9°, respectively.
The specific ABI pixel footprints that overlapped the study area on top of Grand Mesa were identified by first orthorectifying (Pestana et al., 2022; Pestana and Lundquist, 2022) 2 km L1b-RadC imagery clipped to the region surrounding Grand Mesa from each of GOES-16 and GOES-17. Vector polygons outlining the ABI pixel footprints were created from these sample images, and the resulting polygons were then used to compute land surface elevation summary statistics from the 30 m resolution DEM (United States Geological Survey, 2021). We sampled ABI pixels with footprints on top of Grand Mesa that covered an area with a mean elevation greater than or equal to 3000 m and standard deviation of elevation less than or equal to 60 m. For GOES-16, this resulted in six pixels selected, and for GOES-17 it resulted in seven pixels selected (Fig. 2). The pairs of overlapping GOES-16 and -17 pixels were labeled “NW” for the pixels covering the northwestern most portion of Grand Mesa, and “A”–“E” for the pixels running roughly west to east across the study area. Two GOES-17 pixels are labeled “C1” and “C2” to indicate that they both primarily overlapped with GOES-16 pixel “C.” Time series of the thermal infrared radiance, brightness temperatures (both from L1b-RadC), and LST (from L2-LSTC) were compiled for each of these pixels from imagery covering 8 to 15 February 2020.
These pixel footprints were used to delineate areas of different fractional vegetation cover for comparison across the mesa. The NLCD TCC map was converted to a binary forest map with a vegetation threshold at 20 % TCC. This threshold was chosen to visually match the forest above the snow surface in the ASTER visible image from the morning of 8 February (Fig. 5a). For each GOES ABI pixel footprint, the fractional vegetation area (fveg) was calculated as the fraction of the pixel footprint classified as forest in the binary forest map.
This work uses brightness temperatures computed from high temporal resolution GOES-R ABI top-of-atmosphere radiance (L1b-RadC), rather than the LST product (L2-LSTC). Though the LST product corrects for atmospheric absorption and surface emissivity, they are only generated hourly, rather than the much higher 5 min temporal resolution available from the radiance product. The hourly LST observations were also not available for most of the daytime periods. The ABI Cloud Mask algorithm is generally used to determine when and where the land surface is not obscured by clouds to determine if LST should be computed. However, identifying cloud cover over snow is notoriously difficult due to their similar appearance in remote sensed imagery across the visible through infrared spectrum (Rittger et al., 2019; Stillinger et al., 2019). Only four daytime LST observations on 8 February were available, and on 11 February there were three daytime and nine nighttime LST observations. Additionally, the ground-based radiometer and airborne thermal infrared imagery (discussed in the next section) provided brightness temperature observations and were not corrected for atmospheric absorption or surface emissivity to derive an LST product from each. Therefore, we focus primarily on radiance and brightness temperature in our analysis.
3.3.2 Airborne IR imagery
Airborne IR imagery was collected on 4 d with the UW Applied Physics Laboratory's Compact Airborne System for Imaging the Environment (CASIE), consisting of thermal infrared cameras and an infrared radiometer, mounted on the Twin Otter research aircraft from the Naval Postgraduate School (NPS) Center for Interdisciplinary Remotely Piloted Aircraft Studies (CIRPAS). CASIE was installed on the aircraft to be primarily nadir-looking, and had three DRS UC640-17 thermal infrared cameras (8–14 µm) pointing with bore-sight incidence angles of 19°, 0° (nadir-looking), and 21° from port to starboard on the aircraft. These three cameras have overlapping fields of view of 25° (left camera) and 40° (center and right cameras) perpendicular to the aircraft flight direction, with a total field of view of about 72.5° (Lundquist et al., 2018). The aircraft flew at about 1 km above the top of Grand Mesa, giving the three cameras a total swath width of about 2.5 km perpendicular to the direction of flight and a raw ground resolution of 1 m. A nadir-looking Heitronics KT15.85D infrared radiometer with spectral range 9.6–11.5 µm and narrow 1.9° field of view provides a precise brightness temperature measurement for a spot on the ground surface at the center of the center camera's field of view. This higher-precision radiometer data were used to calibrate the thermal infrared cameras (Pestana et al., 2019) prior to mosaicking images together using the aircraft INS-GPS navigation data from their original ∼ 1.1 m spatial resolution to 5 m.
Imagery from two flights on 8 February (from about 08:00–10:00 and 11:00–13:00 LT) and one flight on 11 February (from about 10:00–13:00) were used as these days had the least cloud cover over the study site. Flight lines over the study site were along two sets of parallel tracks that would overlap with ground observations at snow pits (Fig. 2). One set of parallel tracks ran east–west, and the other tracks ran roughly northwest–southeast to capture the northwestern portion of the mesa. The airborne IR imagery collection was in part planned to coincide with the collection of satellite imagery by ASTER on 8 February.
3.3.3 Terra ASTER
The NASA Terra satellite made an overpass of the Grand Mesa study site and imaged it with ASTER at 11:07 LT (UTC−7) on 8 February 2020. ASTER provides a reliable source of surface brightness temperature information at 90 m spatial resolution (Abrams, 2000), fine enough to capture the surface temperature variabilities across the Grand Mesa study area and resolve forest stands from open snow. For this single observation of the Grand Mesa study site, the ASTER Level 1 Precision Terrain Corrected Registered At-Sensor Radiance (AST L1T) product (Meyer et al., 2015) for band 14 (11.3 µm) was used. The top-of-atmosphere radiance was converted to brightness temperatures (Thome, 1999) for comparison with the other ground-based and remote sensing observations.
4.1 Evaluating airborne IR image mosaics against ASTER
To first assess the accuracy of the airborne IR imagery, two airborne IR mosaics from 8 February at 11:07 and 11:19, running east–west across the mesa, were compared against the coincident ASTER image captured at 11:07. The airborne IR mosaics were first resampled to the same spatial resolution of ASTER by taking the mean of the original 5 m spatial resolution images within each 90 m ASTER pixel. The differences between ASTER and each of the two resampled airborne IR mosaics were then computed, producing two difference maps, and the mean and standard deviation of differences were computed for each. Means and standard deviations of differences were also computed for the portions of the difference maps within each of the GOES-16 ABI pixel footprints. The difference maps were inspected qualitatively for patterns in the imagery across the study site to better characterize properties of the airborne IR imagery.
4.2 Comparison of airborne IR, ASTER, and ground observations
To determine how representative the ground-based point brightness temperature measurements were of their surrounding areas, airborne IR imagery and the single ASTER satellite image were compared with ground-based data at the times when each passed over the study site. From each airborne IR mosaic, a 1 km×1 km square was extracted from around the automated snow brightness temperature measurement site at snow pit 2S10 (Fig. 3). Only airborne images that covered at least 30 % of this 1 km2 area were used. The mean, median, and standard deviation of brightness temperatures from this area in each airborne IR image were computed. This provided us with a time series of snow brightness temperatures at each time that the aircraft flew over the ground site. The same 1 km2 region around the snow brightness temperature measurement site was sampled from the single ASTER image from the morning of 8 February to compute the brightness temperature mean, median, and standard deviation as seen by ASTER. The correlation between the time series of airborne IR snow brightness temperature observations and ground-based snow brightness temperatures were computed for each day, while the difference between the ground-based snow brightness temperature measurements and ASTER observations were computed at the time of its overpass.
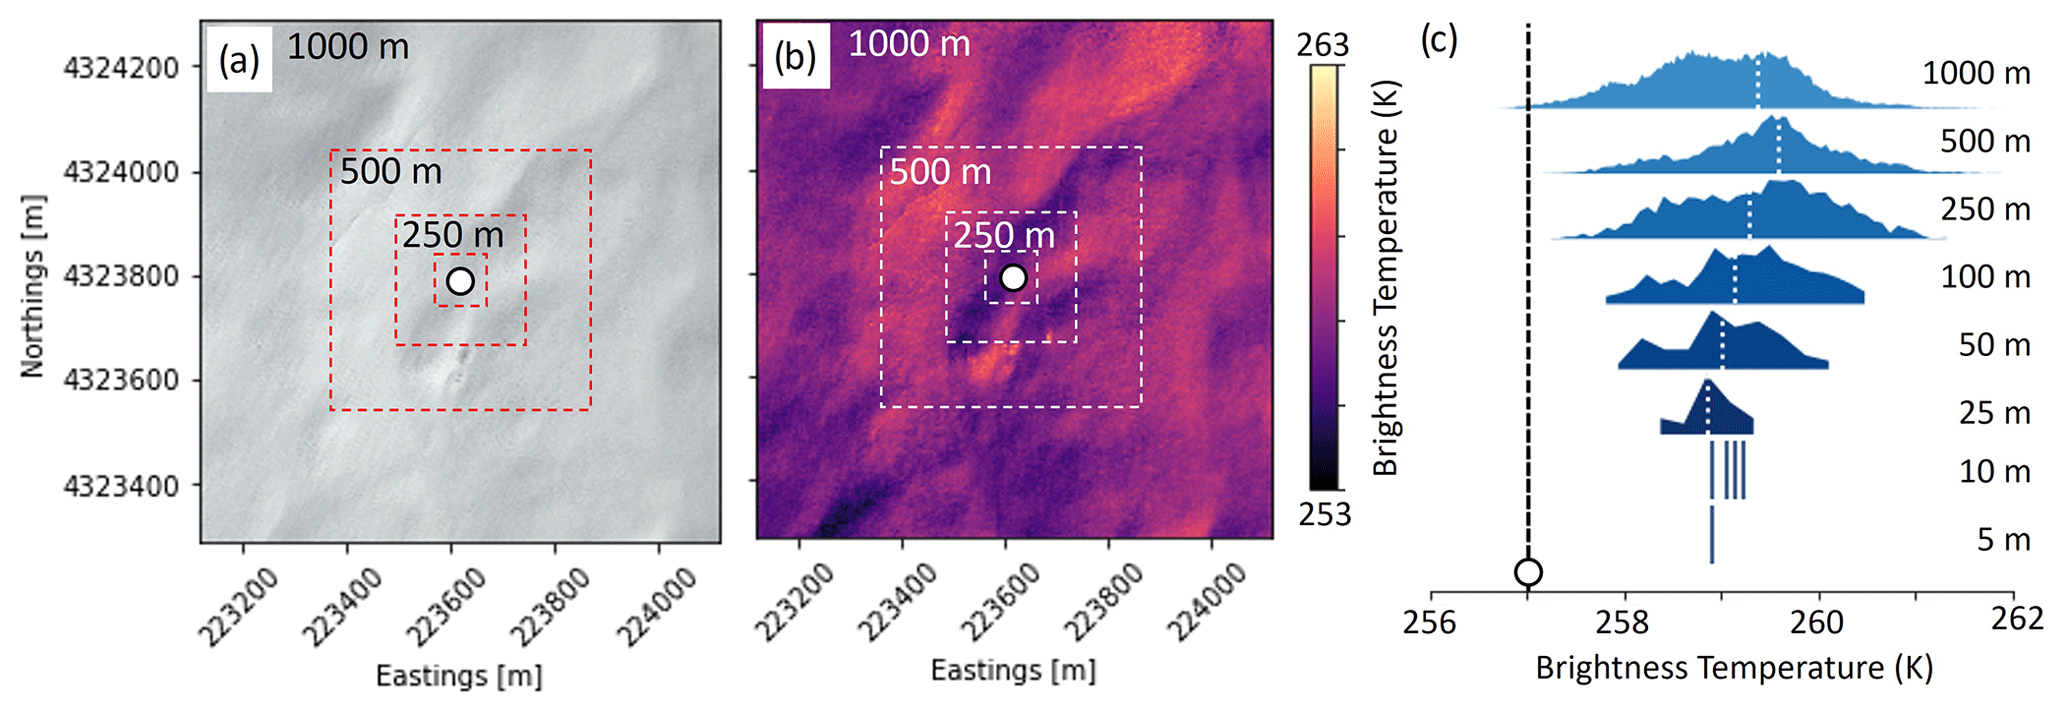
Figure 3Airborne (a) visible and (b) IR image of the area around the snow brightness temperature observation site at snow pit 2S10. Boxes indicate regions from which the mean airborne IR brightness temperature information was taken for comparison with the ground-based observations (only the boxes with sides of 1000, 500, 250, and 100 m are shown). Map coordinates are in UTM zone 13N. (c) Histograms of the airborne IR brightness temperatures from this example image plotted alongside the ground-based snow brightness temperature at this time (vertical dashed line).
To compare the snow surface temperature observations taken at each snow pit against coincident airborne IR imagery, all of the snow pits sampled from 8 February and 11 February that were along the aircraft's flight path within ± 30 min of the flight overpass were compared to the images from that flight. The mean and standard deviation of airborne IR-observed brightness temperatures within a 100 m2 square centered on the snow pit were then compared with these ground-based observations to determine how the differences between the two varied over time and across the study area. One snow pit overflown by the aircraft was about 50 m south of a forest stand, while all other snow pits were 250 m or more away from the nearest forest stand.
The sensitivity of the comparisons between airborne IR imagery, ASTER, and point ground-based temperature observations was tested by reducing the size of the square area from which temperatures were sampled from the airborne IR images (Fig. 3), from a square with sides ranging from 1000 to 100 m (a single ASTER pixel is 90 m), and then for the airborne imagery ranging from 1000 to 5 m (the size of a single airborne IR pixel) (Table 2). All airborne IR images were included in this analysis, rather than excluding images that covered less than 30 % of the area, as was done in the prior analysis of airborne IR and ground data. The mean, median, and standard deviation of brightness temperatures were computed for the sampled region in each image. The mean difference and root-mean-squared difference between all the airborne IR brightness temperature observations of these areas and the coincident ground-based temperature measurements were computed. The smallest area sampled was a single 5 m airborne IR pixel that should contain the ∼ 2.5 m footprint of the ground-based radiometer that was measuring snow brightness temperatures. However, the geolocation accuracy of the airborne IR mosaic imagery is only about ± 10 m (Pestana et al., 2019). Therefore, the single pixel sampled may not actually overlap completely with the ground-based radiometer footprint but instead be directly adjacent to it.
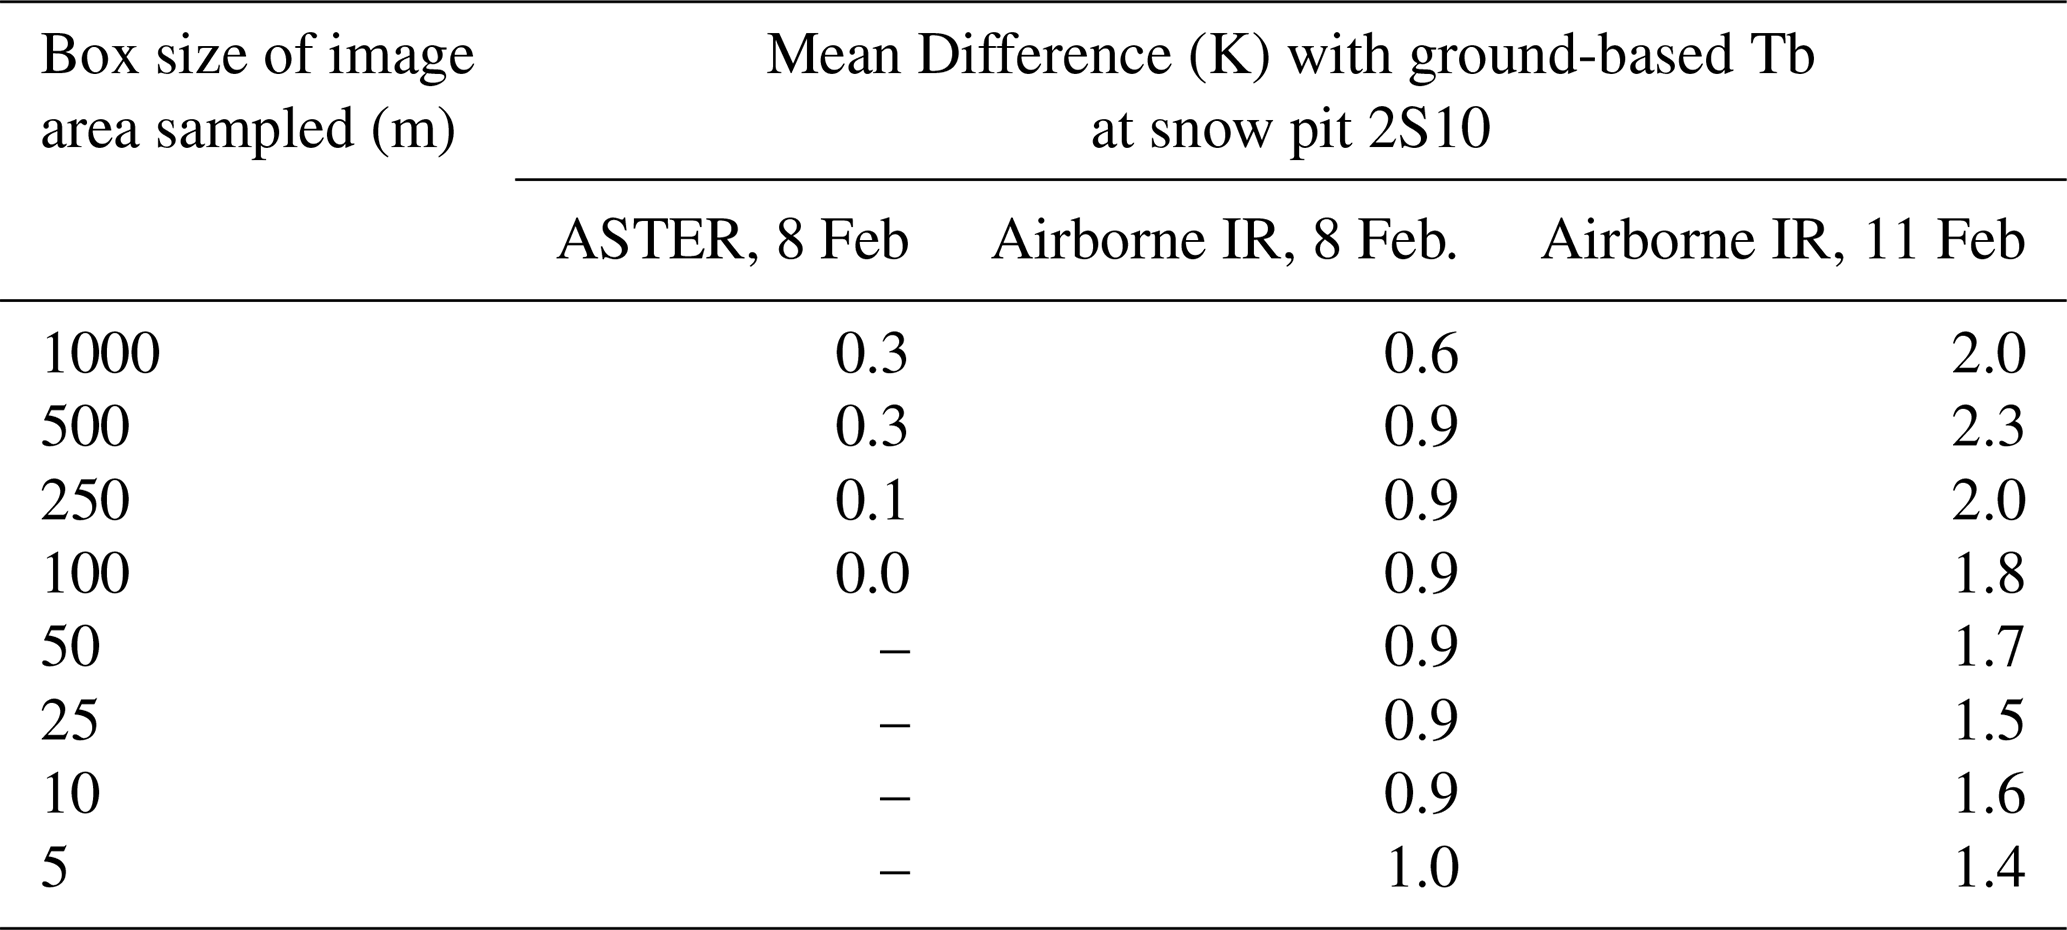
Table 2Mean difference between ground-based snow brightness temperatures and remotely sensed brightness temperatures (K) from both ASTER and airborne IR imagery, sampled from square areas with sides 5 to 1000 m.
4.3 Comparison of high temporal resolution GOES-R ABI with continuous ground observations
GOES-16 and -17 brightness temperature observations were compared against the ground-based snow brightness temperature observations at snow pit 2S10. A time series of brightness temperatures for bands 13 and 14 at 5 min temporal resolution was created for 8 to 12 February 2020 for the GOES-16 and -17 ABI pixels, which contained snow pit 2S10 (both labeled pixel A). Two cloud-free periods, 8 February (07:00–18:00) and 11 February (00:00–18:00), were manually identified by inspecting the GOES imagery and brightness temperatures for cold cloud tops obscuring the study site. The ground-based snow brightness temperature observations at snow pit 2S10 over these same time periods were resampled to match the 5 min temporal resolution of GOES ABI brightness temperatures. All time series were then smoothed with a 30 min running mean to remove the highest frequency variability (median < ± 0.02, σ < 0.6 K) from the data and fill data gaps. The daily maximum and minimum temperatures and diurnal temperature range (DTR) were then found for both the ground-based snow brightness temperature observations and the GOES ABI brightness temperatures. The mean and root-mean-squared difference between GOES ABI brightness temperatures and the ground-based snow brightness temperatures were also computed. For 8 February, because there was cloud-cover at night obscuring the study area until 07:00, we only compared the timing of maximum daytime temperature between GOES and the ground-based observations.
4.4 Comparison of GOES-R ABI, airborne IR, and ASTER imagery
The differences between GOES-16 and -17 ABI brightness temperatures for 8 February (07:00–18:00) and 11 February (21:00 10 February–18:00 11 February) were computed for each pair of corresponding pixels (NW, A, B, C/C1, C/C2, D, and E) across the mesa. This comparison was performed with both ABI bands 14 and 13. The mean difference, standard deviation of differences, and range of differences for each pixel were plotted against the corresponding pixel's fveg value to inspect for any apparent correlation between these differences and the forest fraction within each pixel footprint. The comparison of GOES-16 to -17 is complicated because they view the scene from different perspectives. For example, the pair of pixels “A” from GOES-16 and -17 overlap each other, but they do not have the same footprint on the ground, have slightly different values of fveg, and may include different amounts of the edges of the mesa.
From each airborne IR mosaic, if the airborne imagery covered at least 30 % of each of the GOES-16 and -17 ABI pixel footprints on top of the mesa, the region was sampled from the mosaic (Fig. 4). The mean, median, and standard deviation of temperatures within each footprint were computed for comparison against the ABI band 14 brightness temperature and LST of that pixel for a 10 min window around the aircraft overpass time. The use of the GOES ABI pixel footprints to sample the finer-spatial-resolution airborne images assumes a direct linear scaling of the finer-spatial-resolution brightness temperatures to a mean brightness temperature at the coarser GOES ABI spatial resolution (Pestana and Lundquist, 2022). The sensitivity of the results to this assumption and to the geolocation accuracy of a pixel footprint were tested by comparing GOES ABI brightness temperatures with airborne brightness temperatures sampled from an area larger than a single pixel footprint. An example of the 500 m buffer around a GOES ABI pixel footprint is illustrated in Fig. 4b. Similarly, the GOES-16 and -17 ABI pixel footprints and expanded footprints were used to extract the mean, median, and standard deviation of top-of-atmosphere radiance from the single ASTER image. These were then converted to brightness temperature for comparison against ABI band 14 brightness temperatures.
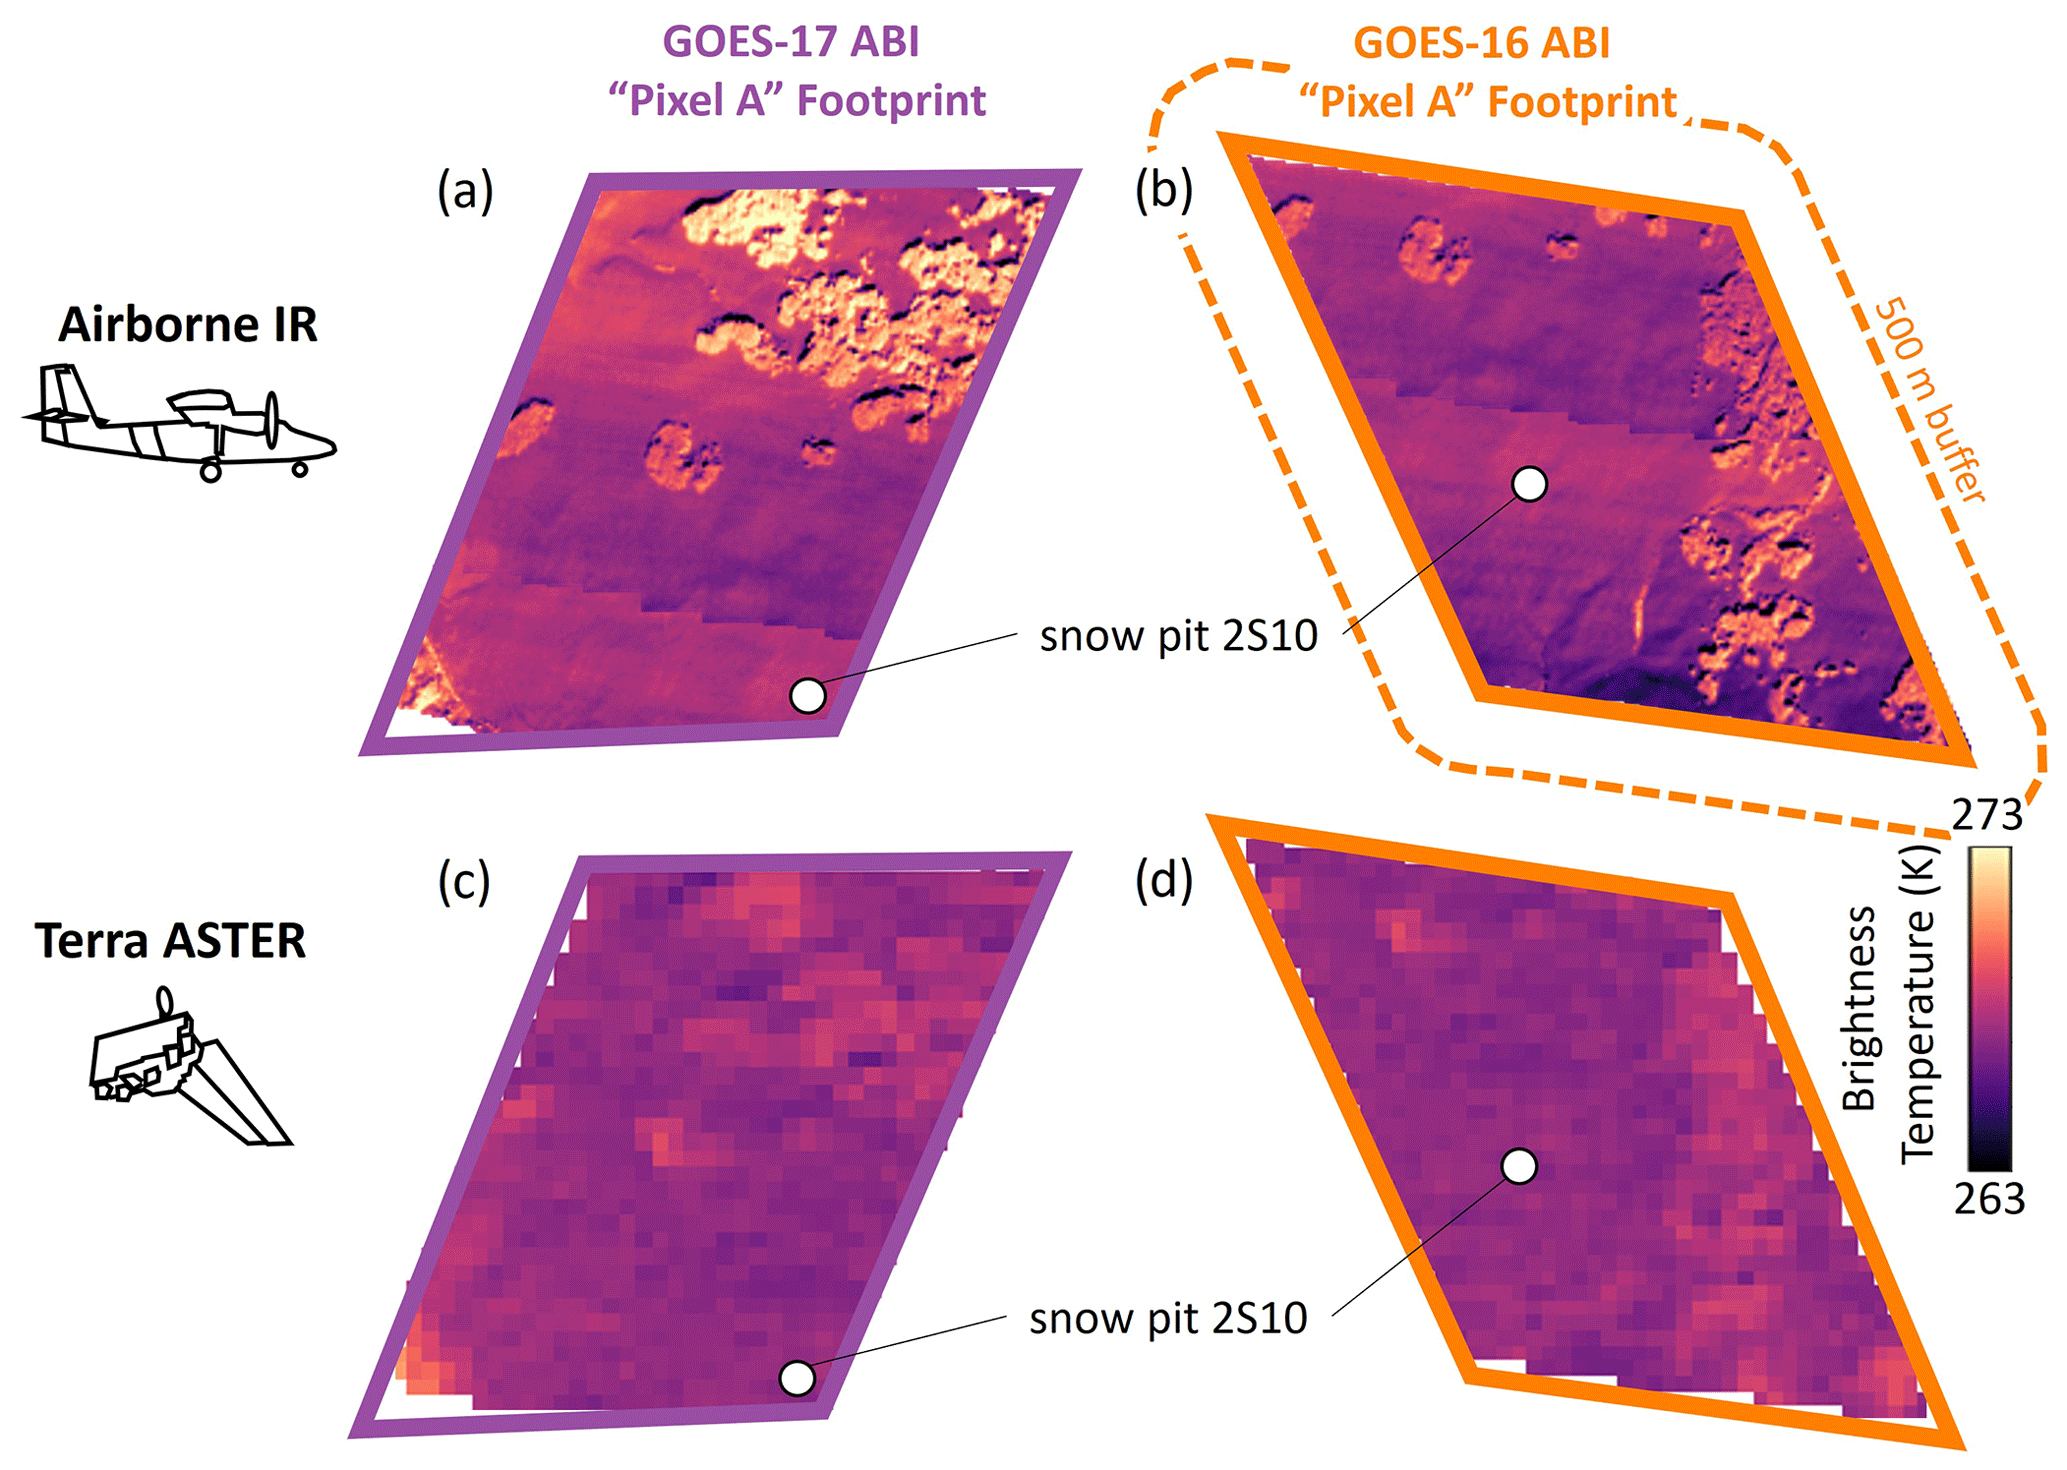
Figure 4Example of sampling (a, b) 5 m spatial resolution airborne IR image mosaics and (c, d) 90 m spatial resolution ASTER image using the GOES-R ABI pixel footprints or (dashed line in b) pixel footprints with an additional 500 m buffer.
5.1 Evaluating airborne IR image mosaics against ASTER
The airborne IR imagery was found to have a warm bias compared with ASTER brightness temperatures. The mean differences between the two resampled airborne IR image mosaics and the ASTER image from the morning of 8 February were 0.4 and 0.8 K and had standard deviations of 1.5 and 1.4 K, respectively. Using the GOES-16 ABI pixel footprints labeled A–E, we found that the mean differences between the airborne IR and ASTER did not vary with vegetation cover.
There were, however, systematic patterns in the difference between airborne IR and ASTER-observed brightness temperatures. The brightness temperature difference maps for each of the two coincident airborne IR image mosaics exhibit a gradient across their field of view, perpendicular to the aircraft's flight direction (Fig. 5). Along the southern edge of each image mosaic, the airborne IR brightness temperatures are about 0.5 K colder than ASTER brightness temperatures, and along the northern edge they are about 0.5 K warmer. Though other airborne IR images did not have coincident ASTER observations for comparison, there was an apparent brightness temperature gradient present in most of the images from east–west flight tracks but not in any from north–south flight tracks.

Figure 5Comparison of airborne and ASTER (a) visible and (b) IR observations on the morning of 8 February 2020. Two overlapping airborne swaths of visible (a) and IR (b) imagery are outlined in dashed (northern flight line at 11:07 UTC−7, east-to-west flight direction) and solid (southern flight line at 11:19 UTC−7, west-to-east flight direction) white lines. (c) The difference between airborne IR image mosaics and the ASTER image (at 11:07 UTC−7).
The apparent brightness temperature gradients could be due to the temperature of the thermal infrared cameras themselves, view angle effects as described in Sect. 2.2, or a combination of the two. Since the airborne IR image mosaics are created from individual images from three cameras, these differences may stem from the three cameras having different temperatures. Following the east–west flight lines, solar heating (sunlit on the southern side, shaded on the northern side) on the aircraft could contribute camera temperature differences (Pestana et al., 2019). Likewise, prevailing wind direction could preferentially cool one side of the camera set versus the other. Though centered at nadir, the three airborne IR cameras together have view angles from 31.5° on the left to 41.0° on the right. At larger off-nadir view angles near the image edges more of the sides of trees will be visible. Along the east–west flight lines, the northward-looking cameras are seeing the south-facing and sunlit side of trees and fewer tree shadows, which is an overall slightly warmer scene than a nadir view would provide. At the same time, southward-looking cameras are seeing the north-facing side of trees and more snow surface shaded by the trees, an overall slightly colder scene than a nadir view would provide. A similar effect could be taking place with undulations in the snow surface where at different view angles the cameras see either the warmer south-facing sunlit side or cooler shaded north-facing side of waves or dunes in the snow surface (Fig. 3b).
Whatever the source of the apparent brightness temperature gradient in some of the airborne IR imagery, we considered its impact on the results negligible. The gradient only had a magnitude of 1 K across the image swaths, which is less than the cameras' accuracy of ± 2 K (Table 1). The difference between airborne IR and ASTER brightness temperatures in the nadir-looking center of the swaths is 0 K. The east–west flight lines passed directly over most of the ground observations locations, observing them from very close to nadir where airborne IR and ASTER brightness temperatures agree (Fig. 1). In comparisons between GOES ABI and airborne IR infrared brightness temperatures, the airborne IR images are aggregated to a mean brightness temperature within a GOES ABI pixel footprint across the image swaths (Fig. 4). This aggregation may compensate for the erroneous gradients since it averages together the positively and negatively biased edges of the swaths. Also of note, the easternmost portion of the airborne IR mosaic from 11:19 shows a large cold feature, which, by inspecting the visible airborne imagery, we identified as a small cloud (Fig. 5c), not visible in the airborne or ASTER image from 12 min prior. This portion of the mosaic was excluded from later analysis.
5.2 Comparison of airborne IR, ASTER, and ground observations
Snow brightness temperatures observed by the airborne IR and ASTER imagers were biased warm in comparison with the ground-based snow brightness temperature observations at snow pit 2S10. Aircraft flights on 2 cloud-free days during the study period provided us with 15 overpasses over the ground sites on the western mesa. Two flights were made on 8 February (Fig. 6a and b). On the first flight, three overpasses occurred about an hour after sunrise (07:13 UTC−7) between 08:00 and 09:30. The second flight of that day made six overpasses between 10:30 and 13:00. The second flight was coincident with the ASTER image taken at about 11:08. On 11 February, a single flight made another six overpasses of the ground site between 09:30 and 13:00 (Fig. 6c and d).
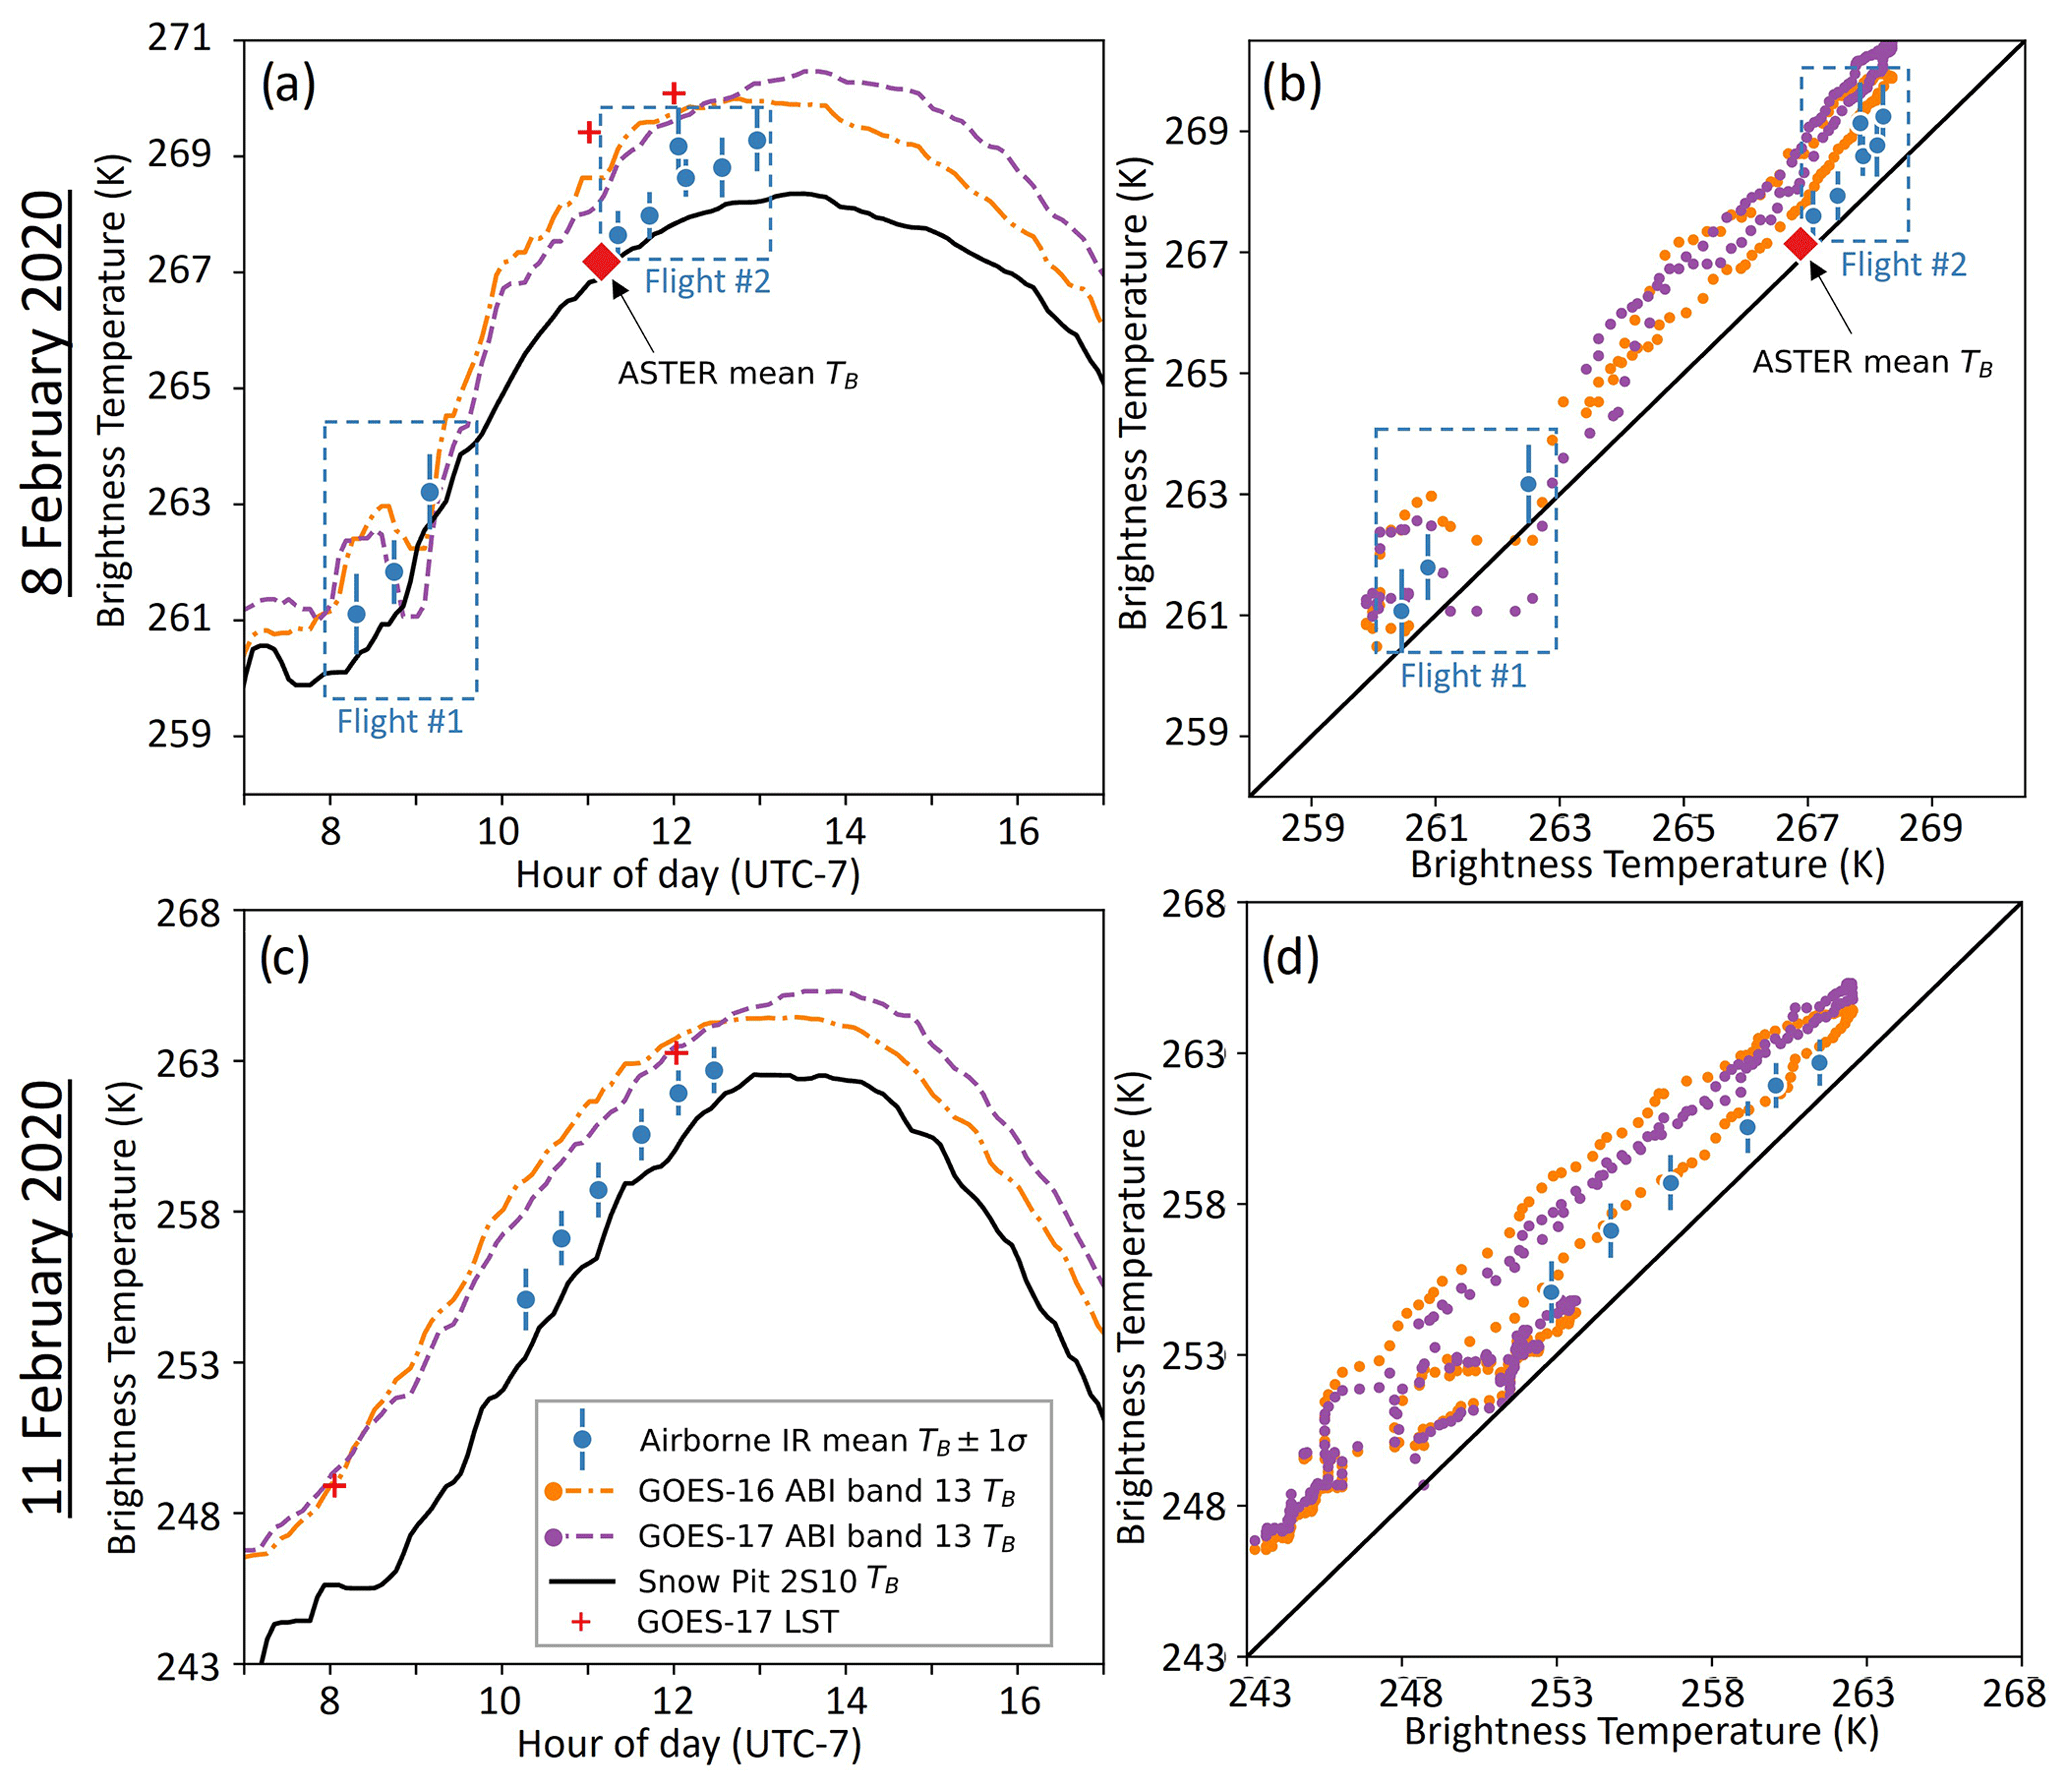
Figure 6Time series for (a) 8 February and (c) 11 February of the ground-based snow brightness temperatures from the Apogee radiometer at snow pit 2S10 (black line), along with GOES-16 (dashed orange) and GOES-17 (dashed purple) band 13 brightness temperatures, GOES-17 LST (red +), airborne IR (blue circles), and ASTER (red diamonds) mean brightness temperatures for the 1 km2 area around the ground site. Plots of ground-based snow brightness temperature against remote sensing brightness temperatures on (b) 8 February and (d) 11 February.
On 8 February, snow brightness temperatures as seen by the airborne IR and ASTER imagery appeared more uniform than on 11 February around snow pit 2S10, and therefore less sensitive to the size of the area sampled from the imagery to compare with ground-based observations (Table 2). ASTER on 8 February matched most closely to the ground-based brightness temperatures with its single pixel value, though this difference only increased by ∼ 0.3 K as the size of the sampled region increased. Snow brightness temperatures as seen in the airborne IR imagery were more uniform across the study area on 8 February (with standard deviations across the 1 km2 area of 0.2 to 0.6 K) than on 11 February (with standard deviations of 0.7 to 1.0 K) which had colder air temperatures and higher wind speeds.
Only four snow pits on 8 February (1N1, 1S2, 6N16, 2S7) and two snow pits on 11 February (1N3, 2S6) were captured in the airborne IR imagery within ± 30 min of their snow surface temperature measurements. On 8 February, two of the snow pit surface temperature measurements (1S2, 2S7) were within ± 1 K of the brightness temperatures in the airborne IR images, while two (1N1, 6N16) were ∼ 2 K warmer, and both snow pit temperature observations were 3–4 K warmer on 11 February. Measuring the temperature of the topmost centimeter of snow is not trivial, as the stem thermometers used can heat up if exposed to sunlight and are in contact with both snow grains and the air space between snow grains. Near the top of the snowpack, the air temperature can be close to that of the above-surface air (Colbeck, 1989), potentially biasing these snow surface temperature readings more towards that of warmer ambient air temperatures.
5.3 Comparison of high temporal resolution GOES-R ABI with continuous ground observations
Both GOES-16 and -17 reported surface brightness temperatures warmer than the ground-based snow brightness temperature observations (Fig. 6), though this difference varied over the course of each day (Fig. 7). Compared to the ground-based observations, the band 14 brightness temperatures had smaller mean and root-mean-squared differences than the band 13 brightness temperatures did. ABI brightness temperatures and ground-based temperature observations show a hysteresis patterns, with GOES ABI brightness temperatures more closely matching the ground-based observations in the nighttime (11 February) and early morning (8 February) than during the day. This pattern is more apparent on 11 February, with GOES brightness temperatures warming up in the morning and cooling down in the evening faster than the ground-based snow brightness temperatures.

Figure 7Difference between GOES-16 ABI band 13 brightness temperature, and brightness temperature observations from GOES-17 ABI band 13, airborne IR imagery, ASTER imagery, and ground-based brightness temperature observations. Plots for (a, b) 8 February 2020 and (c, d) 11 February 2020 for pixels (a, c) A (fveg∼15 %) and (b, d) E (fveg∼45 %). The times that GOES-16 and GOES-17 have their daily minimum phase angle are marked with vertical dashed orange and purple lines, respectively.
GOES-16 and -17 bands 13 and 14 all observed daily Tmin and Tmax within 1 h or less of those measured on the ground, and the DTR matched within ± 3 K on both days. On 8 February, GOES-16 and -17 bands 13 and 14 all observed Tmax within 30 min of ground-based Tmax. Both GOES-16 and -17 observed a DTR ∼ 3 K larger in this time period than the DTR measured on the ground. On 11 February, GOES-16 bands 13 and 14 observed the time of Tmax 30 min later than the ground-based Tmax, and Tmin within 15 min. GOES-17 saw Tmax almost 1 h later than ground-based Tmax, and a Tmin within 20 min of ground-based Tmin. On this day, the DTR observed by GOES ABI was ∼ 3 K smaller than the DTR from the ground-based snow brightness temperature observations.
5.4 Comparison of GOES-R ABI, airborne IR, and ASTER imagery
The band 13 and 14 brightness temperatures from both GOES-16 and -17 were mostly warmer than those from airborne IR and ASTER imagery, and this warm bias was larger for GOES-16, especially for ABI pixels that contained larger forest fractions. The mean differences between GOES-16 compared to GOES-17 and airborne IR observations across all pixels during the first flight on 8 February decreased over time from positive to negative biases (Fig. 7a and b). During the second flight on 8 February, the mean differences between GOES-16 and airborne IR generally decreased from about 2 to 0 K, while the mean differences between GOES-17 and airborne IR increased over time from −1 to 1 K. On 11 February, the mean differences between GOES-17 and airborne IR were relatively constant throughout the morning of observations, while GOES-16 mean differences decreased similarly to what was seen on 8 February, from 5 to 2 K (Fig. 7c and d). The brightness temperature differences also showed some variation due to the airborne image swaths sampling only part of the ABI pixel footprints on alternating flight tracks (as seen in Fig. 7b and d). The mean differences between GOES-16 and the morning airborne IR observations were found to be larger for ABI pixel footprints with higher fveg, while the differences with GOES-17 did not correlate with fveg (Fig. 8). Similarly, the mean differences between GOES-16, but not GOES-17, and the morning ASTER observation were larger for ABI pixel footprints with larger fveg. These results were also robust to uncertainty in the geolocation accuracy of GOES ABI pixel footprints, which is discussed in Sect. 6.1.
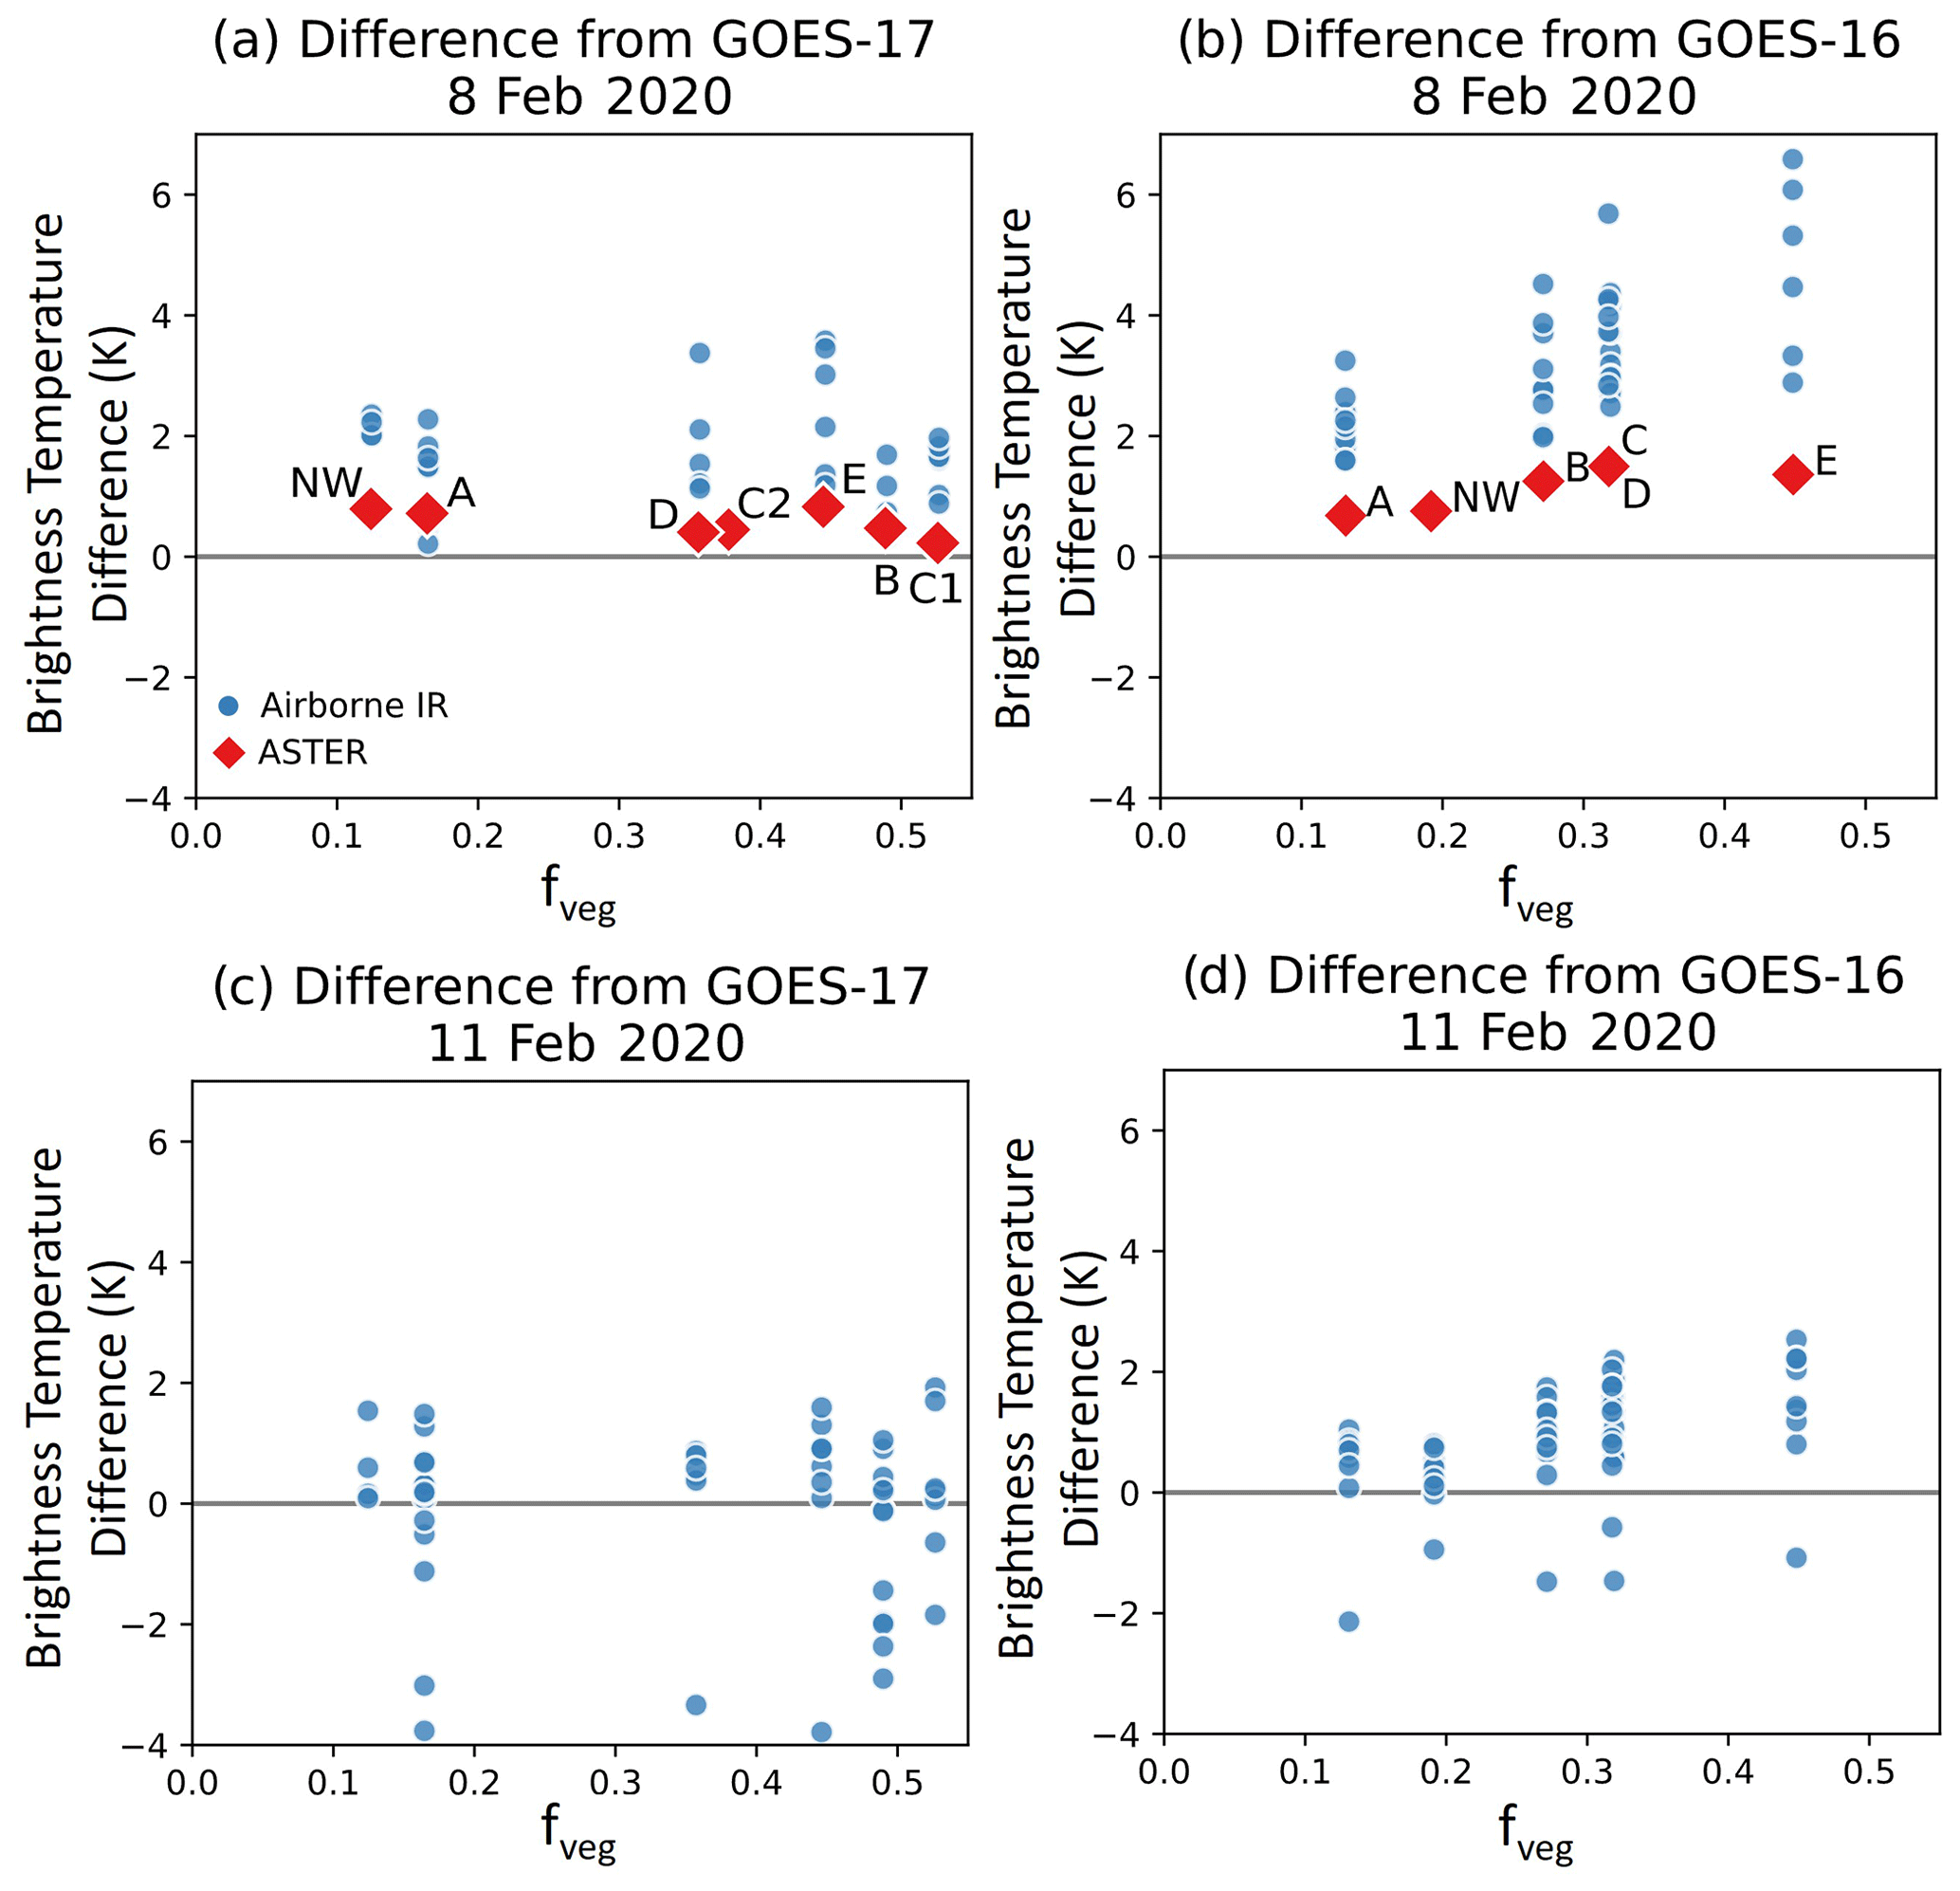
Figure 8Mean differences between GOES-16 and -17 ABI brightness temperatures, airborne IR (blue dots), and ASTER (red diamonds) plotted against the fractional vegetated area (fveg) value of each ABI pixel footprint.
The difference between GOES-16 and -17 brightness temperatures showed a prominent pattern over the course of each day, with GOES-16 reporting warmer brightness temperatures by as much as 3 K in the morning, peaking at about 10:00, and GOES-17 reporting warmer brightness temperatures by nearly 3 K in the afternoons, peaking at about 15:00. The maximum and minimum differences between GOES-16 and -17 were larger for the more forested pixel E than the mostly open snow pixel A. However, there was no correlation found between the magnitude of these differences and the fveg value of each pixel.
6.1 Intercomparison of remote sensing data
The mean differences between brightness temperatures observed by all remote sensing sources and ground-based observations ranged from about 0 to 5 K, with remote sensing sources (airborne IR, ASTER, GOES ABI) typically reporting warmer brightness temperatures than those measured on the ground. The airborne IR and ASTER images best matched the ground-based snow brightness temperature observations because they could resolve separate snow and forest temperatures, whereas the coarser ≥2 km spatial resolution GOES-R ABI pixels reported a mixture of forest and snow temperatures (Table 3). This was apparent even for the mostly forest-free westernmost portion of Grand Mesa (pixels A) with fveg≈15 %. Additionally, there were some thin high-altitude clouds on the morning of 8 February, visible in the GOES-R ABI near-infrared “cirrus band” (band 4, 1.37 µm). The time series of band 13 and 14 brightness temperatures during this time show rapid changes and possibly colder temperatures than would be reported if those thin clouds had not been present.
Table 3Summary of mean differences (K) between the various brightness temperature (Tb) data sources (aggregated across all ABI pixel footprints where applicable) for 2 d of coincident observations during the SnowEx 2020 field campaign. Cells are colored by sign and magnitude of the difference, with positive differences in red and negative differences in blue.
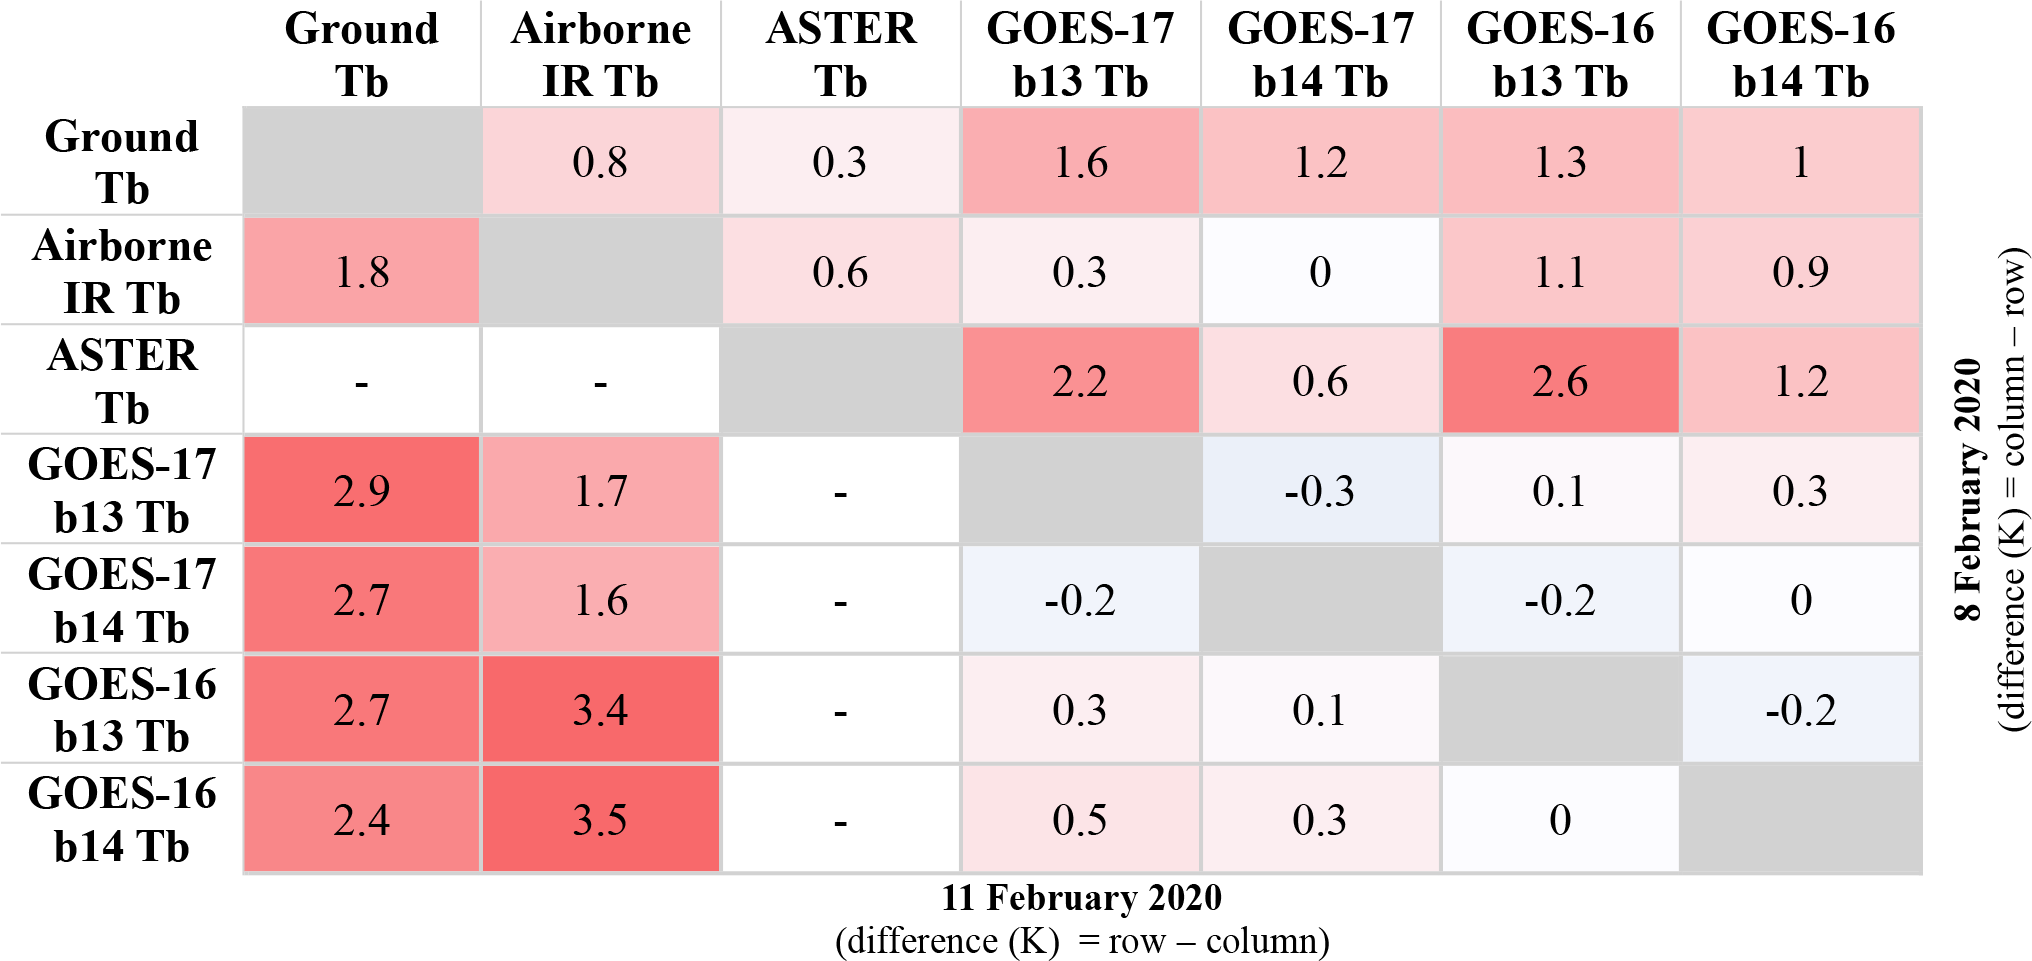
Over the course of each morning, the airborne IR imagery tracked the morning warmup of the snow surface closely, with a constant warm bias relative to the ground-based observations (Fig. 6). GOES-16 and -17 ABI also tracked the ground-based snow brightness temperature observations over the course of the day, though their biases relative to those observations changed over time (Fig. 7). Snow brightness temperatures were more uniform across the western mesa on 8 February than on 11 February, as seen in airborne imagery (Table 2). This was also reflected in ABI brightness temperatures more closely matching the ground-based observations on 8 February. Both GOES-16 and -17 captured the timing of daily Tmin and Tmax on these 2 d within ∼ 1 h and the diurnal temperature range within ± 3 K. This uncertainty in the DTR is similar to the range seen in the mean differences over each day and across the mesa between GOES-R ABI and the ground-based observations (1–3 K), ABI and ASTER (2–3 K), and ABI and the airborne IR imagery (0–5 K).
Our use of a ground-based infrared radiometer and thermal infrared imagers all within the 8–14 µm window allowed us to directly compare their observed brightness temperatures (Pestana and Lundquist, 2022). However, the radiometer and imagers viewed the study site through different atmospheric path lengths. These different path lengths would subject the observations to different amounts of atmospheric absorption and emission of infrared radiation by water vapor. This impact is somewhat alleviated at our high-elevation continental study site, where the atmospheric path to a satellite imager is shorter and atmospheric water vapor concentrations are less than those at more coastal or lower elevations. To quantify these effects, the impact of atmospheric path length for the airborne and satellite thermal infrared imagers was simulated with MODTRAN (Berk et al., 2014) for a mid-latitude winter atmosphere. These simulations showed that GOES-R ABI brightness temperature observations could be as much as 4 K colder than true brightness temperatures due to atmospheric absorption. The GOES-R ABI LST product, which is designed to account for these atmospheric effects, reported surface temperatures very close to GOES-R ABI brightness temperatures (Fig. 6). Absorption by water vapor along the atmospheric path between the snow surface and the radiometer mounted < 2 m above the snow surface is negligible; however, for the airborne IR observations with a path length of ∼ 1 km, the MODTRAN simulation showed that brightness temperatures could be as much as 2 K colder than true brightness temperatures. Due to their different atmospheric path lengths alone, we would expect satellite observations of top-of-atmosphere brightness temperature to be biased colder than airborne observations from ∼ 1 km. Our results, however, show that GOES-R ABI brightness temperatures were biased warmer than airborne observations, suggesting that the magnitude of the atmospheric effect is surpassed by view-angle-related effects.
The mean differences between ground-based snow brightness temperature observations and ABI band 14 brightness temperatures were smaller than those for band 13 by about 0.2–0.4 K. This, however, does not necessarily mean that band 14 was providing a more accurate snow brightness temperature reading. Band 14 covers wavelengths where we can expect some absorption of infrared radiance by atmospheric water vapor, whereas band 13 sits within the “clean IR” window with minimal to no infrared absorption by water vapor (Schmit et al., 2018). With no atmospheric water vapor absorption, the difference between band 13 and 14 brightness temperatures would be negligible. Any atmospheric water vapor present can result in band 14 brightness temperatures being colder than band 13, as was the case seen here. Though we chose generally cloud-free time periods of observations, any trace amounts of water vapor could be causing band 14 to appear colder, which coincidentally more closely matched higher-resolution snow brightness temperatures on Grand Mesa.
The results of this intercomparison were robust even if the geolocation accuracy of a GOES ABI pixel footprint was an order of magnitude larger (± 500 m) than their reported accuracy (± 50 m; Tan et al., 2019). To test the sensitivity of our results to geolocation accuracy, the analysis was repeated but with airborne and ASTER imagery clipped to the area of expanded GOES ABI pixel footprints. These expanded footprints included a 500 m buffer around the original footprint perimeter (Fig. 4b), making them 1 km wider and taller than the original pixel footprints, representing large location uncertainty and overlap between adjacent pixel fields of view. This also tested the assumption that the radiance detected by GOES ABI for a given pixel originated only from the land surface contained within the pixel footprint (i.e., that true brightness temperatures, represented by 5 m airborne or 90 m ASTER, should linearly scale to an average brightness temperature detected by GOES ABI). The analysis using these expanded footprints did not significantly change the results of this work. The warm biases seen in GOES ABI brightness temperatures were larger, likely due to the expanded pixel footprints including warmer lower-elevation areas off the edge of Grand Mesa (Fig. 2).
6.2 Sun–satellite phase angle and thermal infrared shadow-hiding
Even with the flat terrain of Grand Mesa controlling for effects of viewing mountain terrain from off-nadir angles (Pestana and Lundquist, 2022), we observed a morning warm bias between GOES-16 and the coincident nadir-looking ASTER, airborne IR imagery, and GOES-17 (Fig. 7). The GOES-16 brightness temperatures were potentially exhibiting a hotspot effect when the angle between the sun and the view angle of GOES-16 (phase angle) reached a daily minimum. The hotspot effect seen in remote sensing imagery of forests is understood to be explained by shadow-hiding in imagery of reflected sunlight in the visible and NIR wavelengths (Deering et al., 1999; Hapke et al., 1996).
When the airborne IR and ASTER images were taken (07:00–13:00), the sun was rising in the southeastern sky in the same direction from which GOES-16 was viewing Grand Mesa. At about 10:00 on 11 February, when we see the largest warm biases between GOES-16 and all other datasets, the sun had reached 26.9° elevation at an azimuth of 139.1° (26.1 and 139.6 on the 8 February). The angle between GOES-16's view and the sun's position (phase angle) was at its minimum of ∼ 8° on 11 February at 09:59 (∼ 9° at the same time on 8 February). At this time, the sun was illuminating and warming the southeastern-facing sides of trees that GOES-16 is viewing, which in the airborne IR imagery were as much as 5 K warmer than the shaded side of trees (Fig. 9). In addition to viewing the sunlit side of trees, snow in tree shadows was considerably colder than snow in the sunlight (by ∼ 10 K) and would also be hidden from the view of GOES-16.
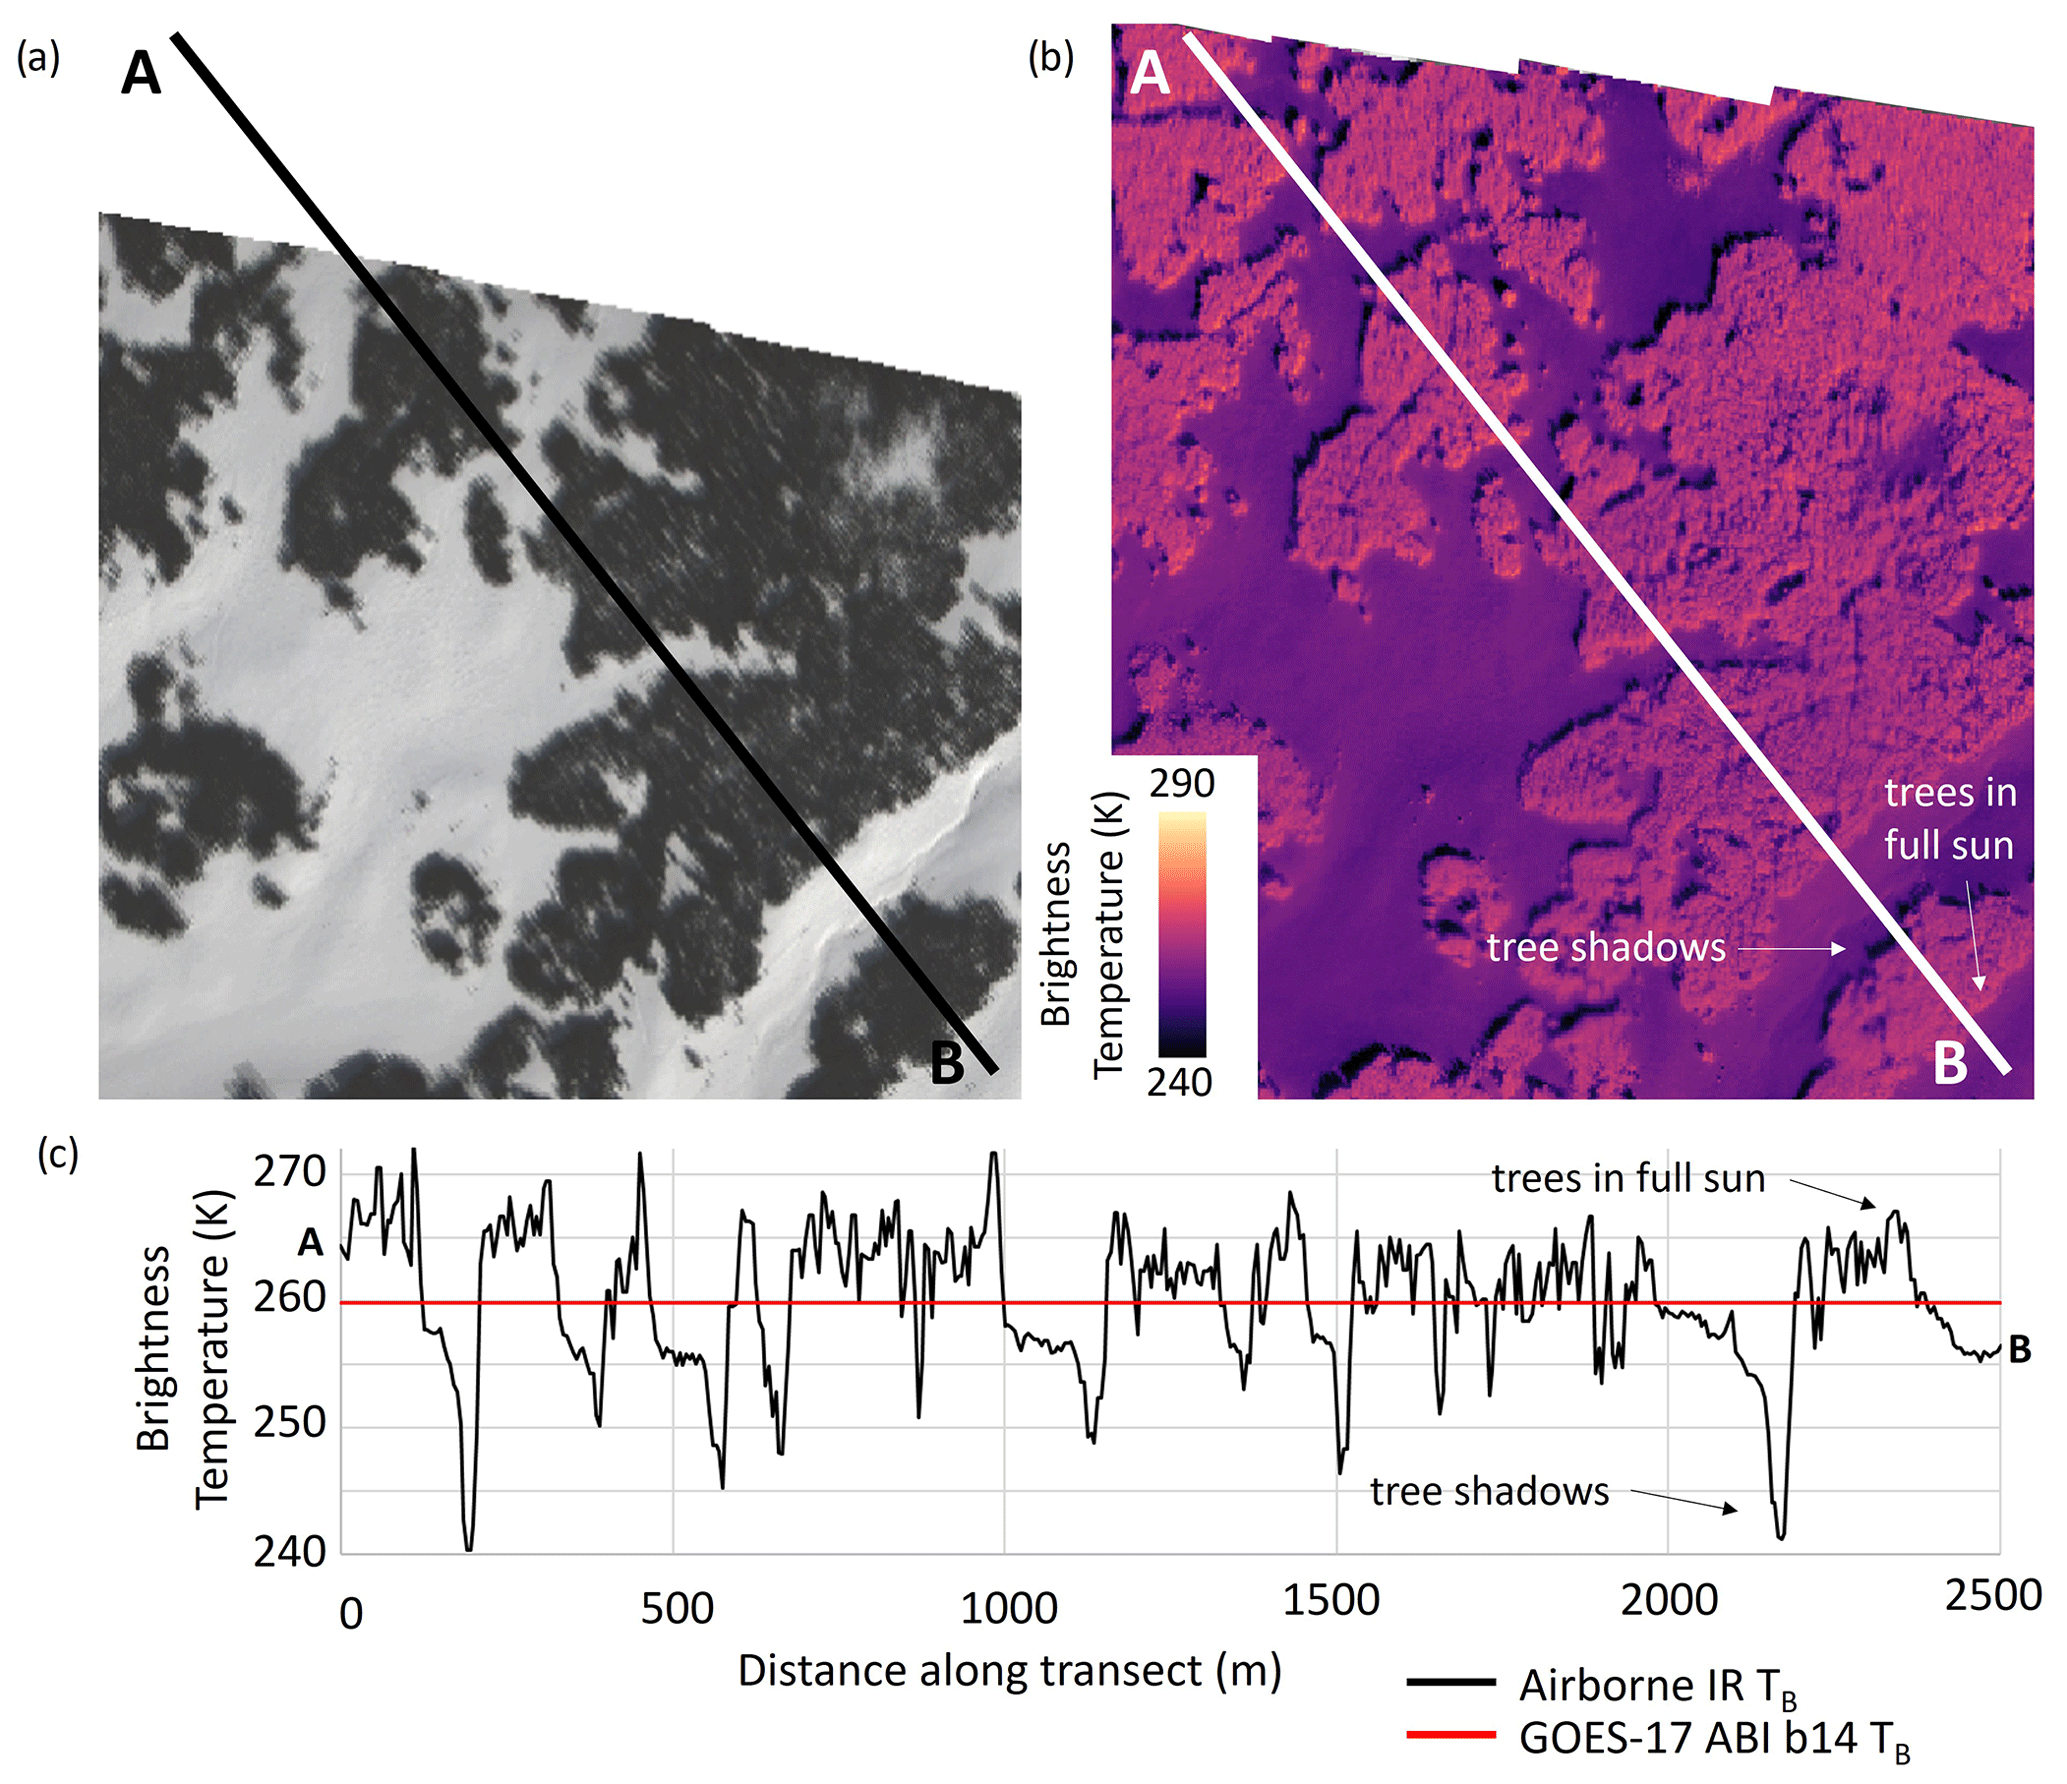
Figure 9Approximately nadir airborne (a) visible and (b) IR images over Grand Mesa, Colorado, from 11 February 2020 10:25:51 UTC−7, and (c) a temperature profile across a forest stand, showing the presence of very cold tree shadows and warm southeast forest edges in full sun. The temperature profile is parallel with the view direction of GOES-16 and nearly perpendicular to the view direction of GOES-17.
The airborne IR and ASTER images viewed the study area from nadir, and the difference between these two image sources did not vary with fveg. GOES-17 surface brightness temperatures had smaller mean differences compared to airborne and ASTER than GOES-16, and these differences did not correlate with fveg. GOES-17, viewing Grand Mesa from the southwest, would similarly be viewing the southwest-facing sides of trees, though during the morning these would be partially in sun and partially in shade. In the afternoon we see that GOES-17 is warmer than GOES-16, peaking at about 15:00. The minimum phase angle between the sun and GOES 17 is ∼ 8° at 14:37 on 11 February (∼ 9° on 8 February).
Though we see that the warm bias in GOES-16 imagery correlates with fveg, the presence of these same warm biases and their patterns over time (e.g., warm biases peaking at the time of minimum phase angle) in the mostly open snow pixels (Fig. 7a and c) suggests that other sources of surface roughness may also be contributing to this effect, such as greater than meter-scale dunes or sub-meter-scale ripples and sastrugi (Kochanski et al., 2019; Warren et al., 1998).
6.3 Applications for downscaling GOES-R ABI thermal infrared imagery
Downscaling methods for coarse-spatial-resolution thermal infrared imagery rely on finer spatial resolution maps of land cover properties and statistical relationships to model and therefore correct for the expected biases in the coarse imagery. Prior methods have used vegetation (Inamdar and French, 2009; Kustas et al., 2003) and terrain maps (Walters, 2013), and biases in GOES-16 ABI imagery have been related to their off-nadir views of complex terrain (Pestana and Lundquist, 2022). Our results demonstrate that for high-temporal-resolution GOES-R ABI thermal infrared imagery, not only does the fractional forest coverage of each ABI pixel have some control on surface temperature biases, but so does the solar illumination angle and the phase angle between the satellite and sun. Thus, any downscaling of GOES-R data must explicitly consider time of day and time of year. These solar and satellite view angle controls on surface temperature observation biases were observed over both the forested and open-snow regions of Grand Mesa, suggesting that surface roughness features as large as trees but perhaps as small as sastrugi contributed to the hotspot effect seen. This information will be needed to determine if, when, and what magnitude a hotspot or thermal infrared shadow-hiding effect will have on the surface temperature bias of the coarser-resolution GOES-R ABI.
During the NASA SnowEx field campaign in February 2020, we conducted an intercomparison of thermal infrared remote sensors for retrieving surface brightness temperatures of snow and forests. The flat study site at Grand Mesa in western Colorado, USA, allowed us to investigate the impact that forest cover has on thermal infrared remote sensing from GOES-16 and GOES-17 at off-nadir view angles and high temporal resolution. Snow brightness temperatures observed by the airborne IR and ASTER imagers were biased warm in comparison with the ground-based snow brightness temperature observations, and the airborne IR imagery itself was found to have a warm bias compared with ASTER, all with mean differences within < 1 K of each other. GOES-16 and GOES-17 observed daily maximum and minimum brightness temperatures within ∼ 1 h of those measured in situ, and the diurnal temperature range matched within ± 3 K. GOES-16 and GOES-17 reported warmer surface brightness temperatures than the ground-based, airborne IR, and ASTER observations. This warm bias was larger for GOES-16 in the mornings when the aircraft and ASTER passed over the study site. The maximum warm biases in GOES-16 and GOES-17 occurred when the sun-satellite phase angle was at its daily minimum, suggesting that a thermal infrared shadow-hiding effect may cause these off-nadir imagers to sense warmer temperatures than nadir-looking imagers. Therefore, land surface roughness features such as trees and the diurnal changes in phase angle should be considered when interpreting GOES-R ABI observations of land surface or brightness temperatures.
The thermal infrared imagery and ground-based snow temperature observations collected as part of SnowEx 2020 provide a unique dataset for characterizing the high temporal resolution observations from geostationary satellites. It could be used further for testing methods for spatially downscaling coarse GOES-R ABI imagery of snow and forests to finer spatial resolutions with statistical models, sensor fusion methods (Quan et al., 2018; Weng and Fu, 2014), or using spectral mixture models to separate snow and forest temperatures (Lundquist et al., 2018). This work demonstrates that future applications of GOES-R ABI imagery for land surface temperature observations of landscapes like mountain snow and forests must account for the continuously changing phase angle and resulting thermal infrared shadow-hiding at small phase angles. Though this work focuses on a single site in a short time period, other geostationary satellites comparable to GOES-R ABI, such as Fengyun-4 and Himawari-8, provide similar views of High Mountain Asia and other mountains in the Eastern Hemisphere where these observations are needed. We expect the processes described here to be important for interpreting geostationary thermal infrared observations all around the globe.
The code used in the analysis of these datasets, including Python scripts and Jupyter Notebooks to generate plots and figures, are available at https://doi.org/10.5281/zenodo.8209719 (Pestana, 2023).
The continuous snow brightness temperature observations (Pestana and Lundquist, 2021) and instantaneous snow surface temperatures (Vuyovich et al., 2021; Johnson et al., 2023) are available through the National Snow and Ice Data Center (NSIDC). The airborne IR imagery can be made available upon request to the corresponding author. The ASTER imagery is accessible through the USGS LPDAAC (https://doi.org/10.5067/ASTER/AST_L1T.003, NASA LP DAAC, 2015), and the NOAA Geostationary Operational Environmental Satellites (GOES) 16 and 17 imagery is available from https://registry.opendata.aws/noaa-goes/ with goespy (last access: 22 November 2022), https://doi.org/10.5281/zenodo.6455060 (Mello and Pestana, 2022), or https://doi.org/10.7289/V5BV7DSR (GOES-R Calibration Working Group and GOES-R Series Program, 2017).
All authors contributed to conceptualization, methodology design, data collection and curation, and manuscript editing. SJP performed the analyses, created visualizations, and prepared the manuscript draft with contributions from JDL and CCC.
The contact author has declared that none of the authors has any competing interests.
Publisher's note: Copernicus Publications remains neutral with regard to jurisdictional claims made in the text, published maps, institutional affiliations, or any other geographical representation in this paper. While Copernicus Publications makes every effort to include appropriate place names, the final responsibility lies with the authors.
We would like to thank the SnowEx 2020 organizing team, participants, snowmobile guides, National Snow and Ice Data Center staff, and the Naval Postgraduate School pilots for facilitating the data collection, as well as the SWESARR team for accommodating our work and providing IMU/GPS navigation data. We would also like to thank fellow project team members from SnowEx Hackweek 2021 for their work developing workflows and tools to analyze the SnowEx snow temperature observations: Aji John, Jeremy Johnston, Friedrich Knuth, Jewell Lund, Giulia Mazzotti, Zachary Miller, Wenge Ni-Meister, and Dillon Ragar. Thank you to the University of Washington Mountain Hydrology group for feedback and input throughout this project and to our three anonymous reviewers, whose feedback and suggestions were very helpful in improving this paper.
This research has been supported by the National Aeronautics and Space Administration (grant nos. 80NSSC20K1610 and 80NSSC20K0374).
This paper was edited by Marie Dumont and reviewed by three anonymous referees.
Abrams, M.: The Advanced Spaceborne Thermal Emission and Reflection Radiometer (ASTER): Data products for the high spatial resolution imager on NASA's Terra platform, Int. J. Remote Sens., 21, 847–859, https://doi.org/10.1080/014311600210326, 2000.
Balick, L. K., Jerrell, R. B., Smith, J. A., and Goltz, S. M.: Directional satellite thermal IR measurements and modeling of a forest in winter and their relationship to air temperature, in: Remote Sensing for Agriculture, Ecosystems, and Hydrology III, Proc. SPIE 4542, Remote Sensing for Agriculture, Ecosystems, and Hydrology III, https://doi.org/10.1117/12.454212, 162–169, https://doi.org/10.1117/12.454212, 2002.
Berk, A., Conforti, P., Kennett, R., Perkins, T., Hawes, F., and van den Bosch, J.: MODTRAN6: a major upgrade of the MODTRAN radiative transfer code, in: Algorithms and Technologies for Multispectral, Hyperspectral, and Ultraspectral Imagery XX, edited by: Velez-Reyes, M. and Kruse, F. A., Proc. SPIE, 9088, 1–4, 90880H-90880H-7, 2014.
Bréon, F.-M., Maignan, F., Leroy, M., and Grant, I.: Analysis of hot spot directional signatures measured from space, J. Geophys. Res.-Atmos., 107, AAC 1-1–AAC 1-15, https://doi.org/10.1029/2001JD001094, 2002.
Colbeck, S. C.: Air Movement in Snow Due to Windpumping, J. Glaciol., 35, 209–213, https://doi.org/10.3189/S0022143000004524, 1989.
Coulston, J. W., Moisen, G. G., Wilson, B. T., Finco, M. V., Cohen, W. B., and Brewer, C. K.: Modeling Percent Tree Canopy Cover: A Pilot Study, Photogramm. Eng. Rem. S., 78, 715–727, 2012.
Currier, W. R., Pflug, J., Mazzotti, G., Jonas, T., Deems, J. S., Bormann, K. J., Painter, T. H., Hiemstra, C. A., Gelvin, A., Uhlmann, Z., Spaete, L., Glenn, N. F., and Lundquist, J. D.: Comparing Aerial Lidar Observations With Terrestrial Lidar and Snow-Probe Transects From NASA's 2017 SnowEx Campaign, Water Resour. Res., 55, 6285–6294, https://doi.org/10.1029/2018WR024533, 2019.
Deering, D. W., Eck, T. F., and Banerjee, B.: Characterization of the Reflectance Anisotropy of Three Boreal Forest Canopies in Spring–Summer, Remote Sens. Environ., 67, 205–229, https://doi.org/10.1016/S0034-4257(98)00087-X, 1999.
Dozier, J.: A method for satellite identification of surface temperature fields of subpixel resolution, Remote Sens. Environ., 11, 221–229, https://doi.org/10.1016/0034-4257(81)90021-3, 1981.
Dozier, J. and Warren, S. G.: Effect of viewing angle on the infrared brightness temperature of snow, Water Resour. Res., 18, 1424–1434, https://doi.org/10.1029/WR018i005p01424, 1982.
Essery, R., Morin, S., Lejeune, Y., and Ménard, C. B.: A comparison of 1701 snow models using observations from an alpine site, Adv. Water Resour., 55, 131–148, https://doi.org/10.1016/j.advwatres.2012.07.013, 2013.
Flanner, M. G. and Zender, C. S.: Linking snowpack microphysics and albedo evolution, J. Geophys. Res.-Atmos., 111, 1–12, https://doi.org/10.1029/2005JD006834, 2006.
GOES-R Calibration Working Group and GOES-R Series Program: NOAA GOES-R Series Advanced Baseline Imager (ABI) Level 1b Radiances, NOAA National Centers for Environmental Information [data set], https://doi.org/10.7289/V5BV7DSR, 2017.
Günther, D., Marke, T., Essery, R., and Strasser, U.: Uncertainties in Snowpack Simulations – Assessing the Impact of Model Structure, Parameter Choice, and Forcing Data Error on Point-Scale Energy Balance Snow Model Performance, Water Resour. Res., 55, 2779–2800, https://doi.org/10.1029/2018WR023403, 2019.
Hall, D., Box, J., Casey, K., Hook, S., Shuman, C., and Steffen, K.: Comparison of satellite-derived and in-situ observations of ice and snow surface temperatures over Greenland, Remote Sens. Environ., 112, 3739–3749, https://doi.org/10.1016/j.rse.2008.05.007, 2008.
Hall, D. K., Foster, J. L., Irons, J. R., and Dabney, P. W.: Airborne bidirectional radiances of snow-covered surfaces in Montana, U. S. A., Ann. Glaciol., 17, 35–40, https://doi.org/10.3189/S0260305500012581, 1993.
Hapke, B., DiMucci, D., Nelson, R., and Smythe, W.: The cause of the hot spot in vegetation canopies and soils: Shadow-hiding versus coherent backscatter, Remote Sens. Environ., 58, 63–68, https://doi.org/10.1016/0034-4257(95)00257-X, 1996.
Henderson, B. G., Balick, L. K., Rodger, A. P., and Pope, P. A.: Concurrent measurements of directional reflectance and temperature of a wintertime coniferous forest from space, Optical Science and Technology, SPIE's 48th Annual Meeting, San Diego, California, USA, 21, 21–33, https://doi.org/10.1117/12.506296, 2003.
Hinkelman, L. M., Lapo, K. E., Cristea, N. C., and Lundquist, J. D.: Using CERES SYN Surface Irradiance Data as Forcing for Snowmelt Simulation in Complex Terrain, J. Hydrometeorol., 16, 2133–2152, https://doi.org/10.1175/JHM-D-14-0179.1, 2015.
Hori, M., Aoki, T., Tanikawa, T., Motoyoshi, H., Hachikubo, A., Sugiura, K., Yasunari, T. J., Eide, H., Storvold, R., Nakajima, Y., and Takahashi, F.: In-situ measured spectral directional emissivity of snow and ice in the 8–14 µm atmospheric window, Remote Sens. Environ., 100, 486–502, https://doi.org/10.1016/j.rse.2005.11.001, 2006.
Immerzeel, W. W., Lutz, A. F., Andrade, M., Bahl, A., Biemans, H., Bolch, T., Hyde, S., Brumby, S., Davies, B. J., Elmore, A. C., Emmer, A., Feng, M., Fernández, A., Haritashya, U., Kargel, J. S., Koppes, M., Kraaijenbrink, P. D. A., Kulkarni, A. V., Mayewski, P. A., Nepal, S., Pacheco, P., Painter, T. H., Pellicciotti, F., Rajaram, H., Rupper, S., Sinisalo, A., Shrestha, A. B., Viviroli, D., Wada, Y., Xiao, C., Yao, T., and Baillie, J. E. M.: Importance and vulnerability of the world's water towers, Nature, 577, 364–369, https://doi.org/10.1038/s41586-019-1822-y, 2020.
Inamdar, A. K. and French, A.: Disaggregation of GOES land surface temperatures using surface emissivity, Geophys. Res. Lett., 36, https://doi.org/10.1029/2008GL036544, 2009.
Johnson, M., Sandusky, M., and Marshall, H.: SnowEx/snowexsql: SnowEx Hackweek 2022 release, Zenodo, 2023.
Kim, Y., Still, C. J., Roberts, D. A., and Goulden, M. L.: Thermal infrared imaging of conifer leaf temperatures: Comparison to thermocouple measurements and assessment of environmental influences, Agr. Forest Meteorol., 248, 361–371, https://doi.org/10.1016/j.agrformet.2017.10.010, 2018.
Kochanski, K., Anderson, R. S., and Tucker, G. E.: The evolution of snow bedforms in the Colorado Front Range and the processes that shape them, The Cryosphere, 13, 1267–1281, https://doi.org/10.5194/tc-13-1267-2019, 2019.
Kustas, W. P., Norman, J. M., Anderson, M. C., and French, A. N.: Estimating subpixel surface temperatures and energy fluxes from the vegetation index–radiometric temperature relationship, Remote Sens. Environ., 85, 429–440, https://doi.org/10.1016/S0034-4257(03)00036-1, 2003.
Lapo, K. E., Hinkelman, L. M., Raleigh, M. S., and Lundquist, J. D.: Impact of errors in the downwelling irradiances on simulations of snow water equivalent, snow surface temperature, and the snow energy balance, Water Resour. Res., 51, 1649–1670, https://doi.org/10.1002/2014WR016259, 2015.
Lundquist, J. D., Chickadel, C., Cristea, N., Currier, W. R., Henn, B., Keenan, E., and Dozier, J.: Separating snow and forest temperatures with thermal infrared remote sensing, Remote Sens. Environ., 209, 764–779, https://doi.org/10.1016/j.rse.2018.03.001, 2018.
Mello, P. A. and Pestana, S.: spestana/goes-py: v0.2.2, https://doi.org/10.5281/zenodo.6455060, 2022.
Meyer, D., Siemonsma, D., Brooks, B., and Johnson, L.: Advanced Spaceborne Thermal Emission and Reflection Radiometer Level 1 Precision Terrain Corrected Registered At-Sensor Radiance (AST_L1T) Product, algorithm theoretical basis document, U. S. Geological Survey, Reston, VA, https://doi.org/10.3133/ofr20151171, 2015.
Mizukami, N., Clark, M. P., Slater, A. G., Brekke, L. D., Elsner, M. M., Arnold, J. R., and Gangopadhyay, S.: Hydrologic Implications of Different Large-Scale Meteorological Model Forcing Datasets in Mountainous Regions, J. Hydrometeorol., 15, 474–488, https://doi.org/10.1175/JHM-D-13-036.1, 2014.
NASA LP DAAC: ASTER Level 1 Precision Terrain Corrected Registered At-Sensor Radiance V003, NASA EOSDIS Land Processes Distributed Active Archive Center [data set], https://doi.org/10.5067/ASTER/AST_L1T.003, 2015.
Niu, G.-Y., Yang, Z.-L., Mitchell, K. E., Chen, F., Ek, M. B., Barlage, M., Kumar, A., Manning, K., Niyogi, D., Rosero, E., Tewari, M., and Xia, Y.: The community Noah land surface model with multiparameterization options (Noah-MP): 1. Model description and evaluation with local-scale measurements, J. Geophys. Res., 116, D12109, https://doi.org/10.1029/2010JD015139, 2011.
Pepin, N. C., Maeda, E. E., and Williams, R.: Use of remotely sensed land surface temperature as a proxy for air temperatures at high elevations: Findings from a 5000 m elevational transect across Kilimanjaro, J. Geophys. Res.-Atmos., 121, 9998, https://doi.org/10.1002/2016JD025497, 2016.
Pestana, S.: spestana/snowex2020: Initial release, Zenodo [code], https://doi.org/10.5281/zenodo.8209719, 2023.
Pestana, S. J. and Lundquist, J. D.: SnowEx20 Raw Near Surface Snow Temperature Profile Time Series, Version 1, Boulder, Colorado USA, NASA National Snow and Ice Data Center Distributed Active Archive Center [data set], https://doi.org/10.5067/9HYQMFZP4ALB, 2021.
Pestana, S. and Lundquist, J. D.: Evaluating GOES-16 ABI surface brightness temperature observation biases over the central Sierra Nevada of California, Remote Sens. Environ., 281, 113221, https://doi.org/10.1016/j.rse.2022.113221, 2022.
Pestana, S., Chickadel, C. C., Harpold, A., Kostadinov, T. S., Pai, H., Tyler, S., Webster, C., and Lundquist, J. D.: Bias Correction of Airborne Thermal Infrared Observations Over Forests Using Melting Snow, Water Resour. Res., 55, 11331–11343, https://doi.org/10.1029/2019WR025699, 2019.
Pestana, S., Bhushan, S., and Carter, J.: spestana/goes-ortho: Initial release, Zenodo [code], 2022.
Pestana, S., Bair, E. H., Dozier, J., and Lundquist, J. D.: Observations of Diurnal Midwave Infrared Anisotropy over Snow and Forests with GOES-R ABI, IGARSS 2023 – 2023 IEEE International Geoscience and Remote Sensing Symposium, Pasadena, CA, USA, 5–8, https://doi.org/10.1109/IGARSS52108.2023.10282266, 2023.
Quan, J., Zhan, W., Ma, T., Du, Y., Guo, Z., and Qin, B.: An integrated model for generating hourly Landsat-like land surface temperatures over heterogeneous landscapes, Remote Sens. Environ., 206, 403–423, https://doi.org/10.1016/j.rse.2017.12.003, 2018.
Raleigh, M. S., Landry, C. C., Hayashi, M., Quinton, W. L., and Lundquist, J. D.: Approximating snow surface temperature from standard temperature and humidity data: New possibilities for snow model and remote sensing evaluation: Snow Surface Temperature Approximation, Water Resour. Res., 49, 8053–8069, https://doi.org/10.1002/2013WR013958, 2013.
Raleigh, M. S., Lundquist, J. D., and Clark, M. P.: Exploring the impact of forcing error characteristics on physically based snow simulations within a global sensitivity analysis framework, Hydrol. Earth Syst. Sci., 19, 3153–3179, https://doi.org/10.5194/hess-19-3153-2015, 2015.
Raleigh, M. S., Livneh, B., Lapo, K., and Lundquist, J. D.: How Does Availability of Meteorological Forcing Data Impact Physically Based Snowpack Simulations?*, J. Hydrometeorol., 17, 99–120, https://doi.org/10.1175/JHM-D-14-0235.1, 2016.
Rittger, K., Raleigh, M. S., Dozier, J., Hill, A. F., Lutz, J. A., and Painter, T. H.: Canopy adjustment and improved cloud detection for remotely sensed snow cover mapping, Water Resour. Res., 55, e2019WR024914, https://doi.org/10.1029/2019WR024914, 2020.
Schmit, T. J., Griffith, P., Gunshor, M. M., Daniels, J. M., Goodman, S. J., and Lebair, W. J.: A Closer Look at the ABI on the GOES-R Series, B. Am. Meteorol. Soc., 98, 681–698, https://doi.org/10.1175/BAMS-D-15-00230.1, 2017.
Schmit, T. J., Lindstrom, S. S., Gerth, J. J., and Gunshor, M. M.: Applications of the 16 spectral bands on the Advanced Baseline Imager (ABI), J. Oper. Meteorol., 6, 33–46, https://doi.org/10.15191/nwajom.2018.0604, 2018.
Selkowitz, D., Forster, R., and Caldwell, M.: Prevalence of Pure Versus Mixed Snow Cover Pixels across Spatial Resolutions in Alpine Environments, Remote Sens.-Basel, 6, 12478–12508, https://doi.org/10.3390/rs61212478, 2014.
Shamir, E. and Georgakakos, K. P.: MODIS Land Surface Temperature as an index of surface air temperature for operational snowpack estimation, Remote Sens. Environ., 152, 83–98, https://doi.org/10.1016/j.rse.2014.06.001, 2014.
Stillinger, T., Roberts, D. A., Collar, N. M., and Dozier, J.: Cloud Masking for Landsat 8 and MODIS Terra Over Snow-Covered Terrain: Error Analysis and Spectral Similarity Between Snow and Cloud, Water Resour. Res., 55, 6169–6184, https://doi.org/10.1029/2019WR024932, 2019.
Tan, B., Dellomo, J. J., Wolfe, R. E., and Reth, A. D.: GOES-16 and GOES-17 ABI INR assessment, in: Earth Observing Systems XXIV, Earth Observing Systems XXIV, San Diego, United States, 49, https://doi.org/10.1117/12.2529336, 2019.
Thome, K. J.: Validation plan for MODIS level 1 at-sensor radiance, Remote Sensing Group of the Optical Sciences Center, University of Arizona, Tucson, AZ, USA, 23–28, 1999.
Tomasi, E., Giovannini, L., Zardi, D., and de Franceschi, M.: Optimization of Noah and Noah_MP WRF Land Surface Schemes in Snow-Melting Conditions over Complex Terrain, Mon. Weather Rev., 145, 4727–4745, https://doi.org/10.1175/MWR-D-16-0408.1, 2017.
United States Geological Survey: United States Geological Survey 3D Elevation Program 1 arc-second Digital Elevation Model, OpenTopography [data set], https://doi.org/10.5069/G98K778D, 2021.
Vuyovich, C. M., Marshall, H., Elder, K., Hiemstra, C., Brucker, L., and McCormick, M.: SnowEx20 Grand Mesa Intensive Observation Period Snow Pit Measurements, Version 1, https://doi.org/10.5067/DUD2VZEVBJ7S, 2021.
Walters, R. D.: Transfer of Snow Information across the Macro-to-Hillslope-Scale Gap Using a Physiographic Downscaling Approach: Implications for Hydrologic Modeling in Semiarid, Seasonally Snow-Dominated Watersheds, Boise State University Theses and Dissertations, 590, https://scholarworks.boisestate.edu/td/590 (last access: 29 May 2022), 2013.
Wan, Z., Zhang, Y., Zhang, Q., and Li, Z.: Validation of the land-surface temperature products retrieved from Terra Moderate Resolution Imaging Spectroradiometer data, Remote Sens. Environ., 83, 163–180, https://doi.org/10.1016/S0034-4257(02)00093-7, 2002.
Warren, S. G.: Optical properties of snow, Rev. Geophys., 20, 67, https://doi.org/10.1029/RG020i001p00067, 1982.
Warren, S. G.: Optical properties of ice and snow, Philos. T. Roy. Soc. A, 377, 20180161, https://doi.org/10.1098/rsta.2018.0161, 2019.
Warren, S. G., Brandt, R. E., and O'Rawe Hinton, P.: Effect of surface roughness on bidirectional reflectance of Antarctic snow, J. Geophys. Res.-Planets, 103, 25789–25807, https://doi.org/10.1029/98JE01898, 1998.
Weng, Q. and Fu, P.: Modeling diurnal land temperature cycles over Los Angeles using downscaled GOES imagery, ISPRS J. Photogramm., 97, 78–88, https://doi.org/10.1016/j.isprsjprs.2014.08.009, 2014.