the Creative Commons Attribution 4.0 License.
the Creative Commons Attribution 4.0 License.
 | 12 Mar 2024
Brief communication: Significant biases in ERA5 output for the McMurdo Dry Valleys region, Antarctica
Slawek M. Tulaczyk
The ERA5 climate reanalysis dataset plays an important role in applications such as monitoring and modeling climate system changes in polar regions, so the calibration of the reanalysis to ground observations is of great relevance. Here, we compare the 2 m air temperature time series of the ERA5 reanalysis and the near-surface bias-corrected reanalysis to the near-ground air temperature measured at 17 automatic weather stations (AWSs) in the McMurdo Dry Valleys, Antarctica. We find that the reanalysis data have biases that change with the season of the year and do not clearly correlate with elevation. Our results show that future work should rely on secondary observations to calibrate when using the ERA5 reanalysis in polar regions.
- Article
(2708 KB) - Full-text XML
-
Supplement
(20671 KB) - BibTeX
- EndNote


The ERA5 dataset represents the fifth iteration of European Centre for Medium-Range Weather Forecasts (ECMWF) global climate hindcasting based on the Integrated Forecasting System (IFS) Cy41r2, derived by a combination of data assimilation and short-term simulations applying an operational numerical weather prediction (NWP) model (Hersbach et al., 2020). With its global coverage, high temporal resolution and relatively high spatial resolution of 31 km, this dataset may prove particularly useful for research in polar regions such as Antarctica, where long-term climate observations are geographically sparse and often temporally discontinuous (Lazzara et al., 2012). A previous study found an encouraging agreement between ERA5 output and automatic weather station (AWS) data from 13 stations located in the southern section of the Antarctic Peninsula (Tetzner et al., 2019). However, at least one other study has pointed out differences between ERA5 and selected weather stations across all of Antarctica (Zhu et al., 2021).
Here, we report the results of a regional comparison between monthly 2 m air temperatures in the McMurdo Dry Valleys region, Antarctica, reported in the ERA5 dataset and corresponding observations from 17 AWS locations. We focus our analysis on this region because of the relatively high spatial and temporal coverage of AWS observations and due to the high multidisciplinary research interest in this region, which contains the main USA and New Zealand research stations and is proximal to Italian and South Korean research stations.
Despite the encouraging results found by Tetzner et al. (2019) for the southern Antarctic Peninsula, we find significant biases in the near-surface air temperatures measured at the AWS and the temperatures reported in the reanalysis datasets.
Table 1List of available AWSs in the McMurdo Dry Valleys region.
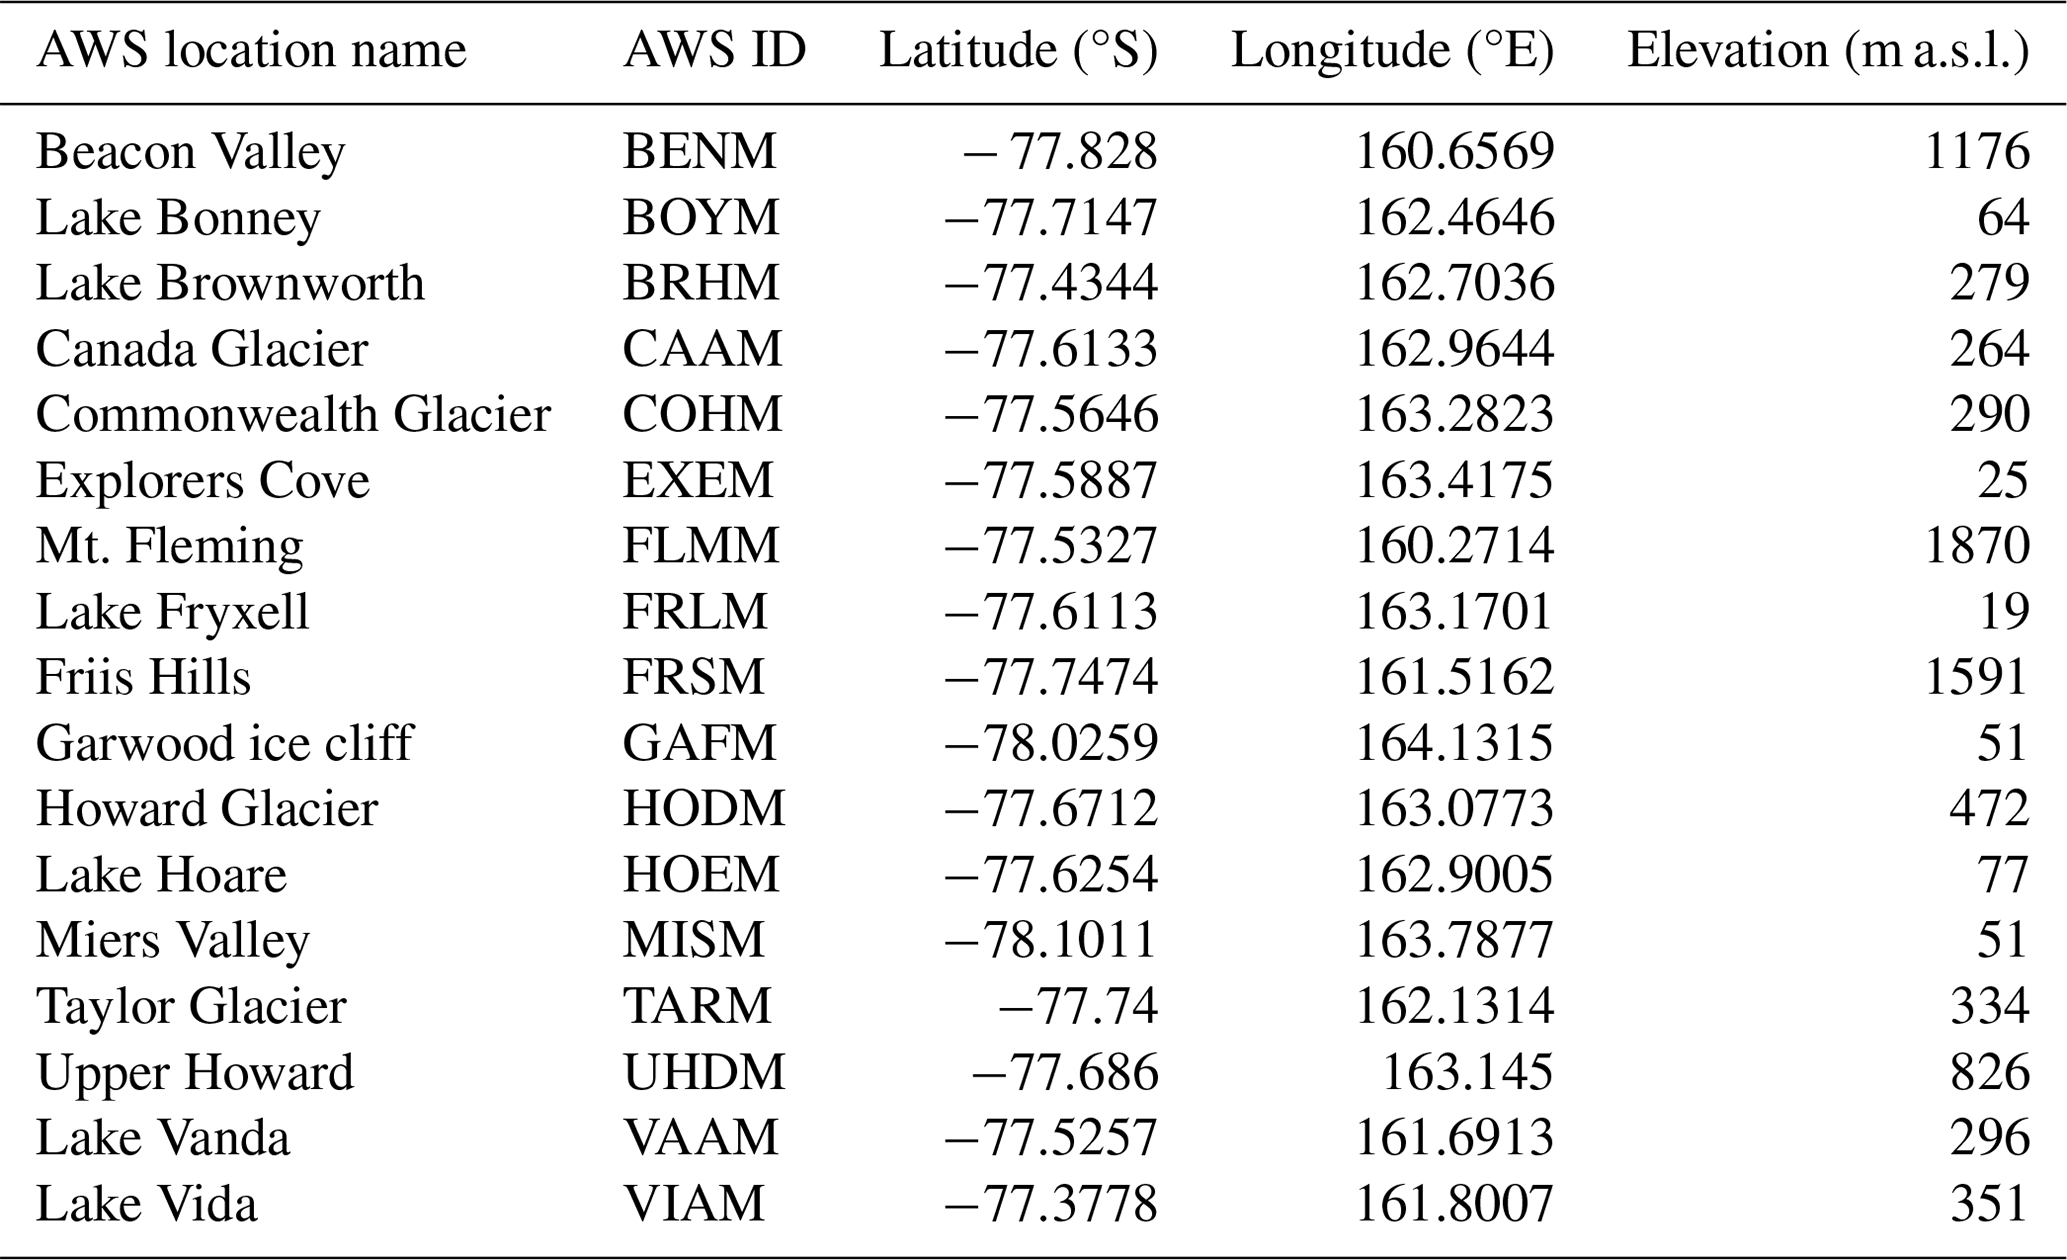
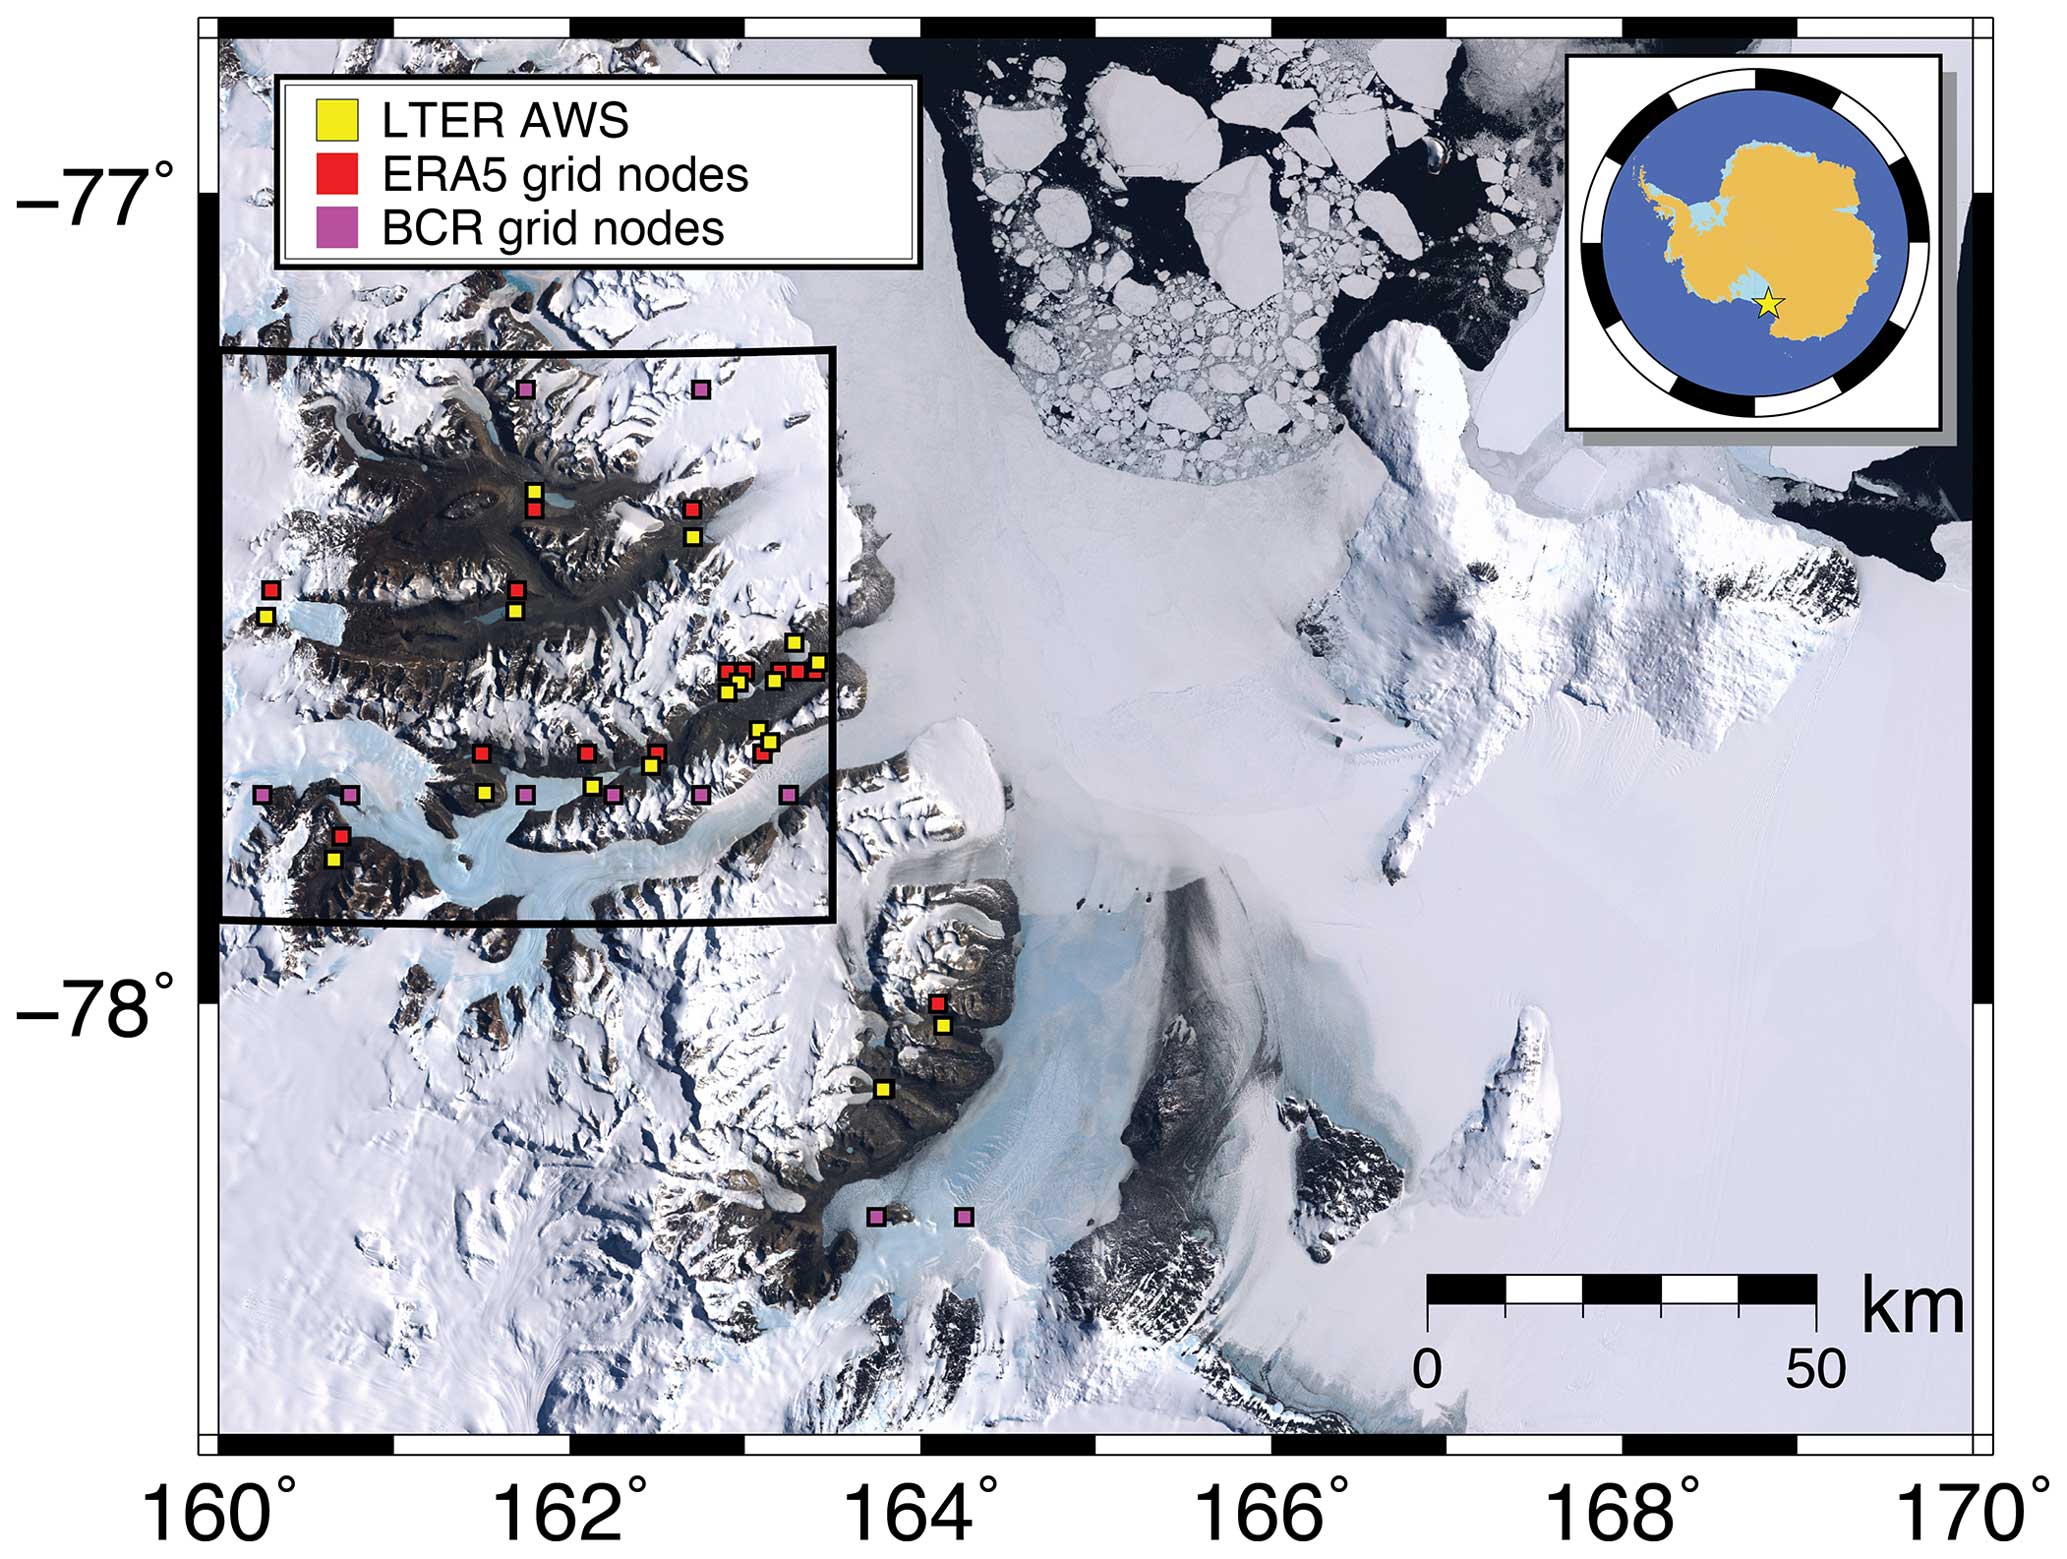
Figure 1Map of the McMurdo Dry Valleys region. The locations of the AWSs managed by LTER are shown with yellow squares, and their corresponding closest ERA5 and BCR grid nodes are shown with red squares and magenta squares, respectively. The black box represents the area where regional averages for all AWSs and all ERA5 and BCR grid cells were calculated. The distance to the sea and the topography of the region can be appreciated in the background satellite image.
We analyze the daily surface temperature (2 m temperature) recorded at 17 AWSs (Fig. 1) managed by the McMurdo Dry Valleys Long-Term Ecological Research (LTER) project since 1992, although some of the stations have been reporting data only since 1986 (Doran et al., 2002). Table 1 summarizes the AWSs used in this study. We compare the AWS data to the monthly ECMWF ERA5 climate reanalysis surface temperature data (Muñoz Sabater, 2019), and we also test against the near-surface bias-corrected reanalysis dataset (BCR) (Cucchi et al., 2022). The latter is obtained from applying the WATer and global CHange (WATCH) Forcing Data methodology (Weedon et al., 2010) to the ERA5 dataset, which includes interpolating to a 0.5°×0.5° grid and correcting for differences in elevation between the Climate Research Unit grid (New et al., 1999, 2000) and the ERA5 grid, along with other monthly based bias corrections (Weedon et al., 2011, 2014; Cucchi et al., 2022). For each AWS, where daily 2 m air temperature data were available, we ran a 30 d moving average filter with no overlap to obtain monthly time series. The ERA5 and BCR grid nodes used to compare to each individual AWS were selected by minimizing the distance between each AWS and all the nodes in the reanalysis grid (Fig. 1). Finally, we interpolated both time series to a regular monthly sequence, and the time series for the ERA5 node data were truncated to match the periods where data were available at their corresponding AWS. The elevations of the AWSs and the nearest ERA5/BCR grid cells are often different, which can induce differences in the measured and calculated values of the 2 m air temperature. Therefore, we correct for the difference in altitude by applying a dry adiabatic lapse rate of 9.8 °C km−1 to the ERA5/BCR data, as done elsewhere (Bromwich et al., 2013). We report the mean temperature for the span of each time series and the standard error of the mean for each sample for the differences between the ERA5 and BCR datasets and the AWS with and without the altitude correction.
Furthermore, we compare the two datasets by analyzing the correlograms of the altitude-corrected temperatures and performing a linear regression. We report the squared correlation coefficients (R2) as a metric of the goodness of fit and the p values from the F statistic to assess the level of statistical significance.
Besides inspecting biases by making comparisons for all individual stations and their corresponding reanalysis grid cells, we also compare the overall mean temperature across all stations with the mean temperature across all grid cells within the main region of the McMurdo Dry Valleys (black box in Fig. 1). We selected this region because it has the highest station density, and including the stations outside of this box would imply using a much larger subgrid for the reanalysis that would not be truly representative of the area covered by the stations. This comparison is important given that the ERA5 and particularly the BCR grid cells might be too large to capture local phenomena such as topographic effects or seasonal temperature inversions at the AWSs. Therefore, comparing average temperatures using the footprint of the whole region is different to calculating the average bias across all stations, and it creates intuition on whether the individual elevation differences average out or not. We created median stacks of the temperature time series for all AWSs and for all the grid cells of the reanalysis that fall within the area. We interpolated all the data of the weather stations to a monthly time series, we patched with NaN (not a number) values the periods of time when data were not available (some stations have longer records than others) and we obtained a mean stack of the time series. Figure S1 in the Supplement shows the individual time series for all AWSs and all the ERA5 and BCR grid cells and their corresponding mean stack. We also tested using median stacks to analyze the effect of outliers in the data, but we did not find major differences between the mean and median stacks. Finally, we used the difference between the median altitude of all weather stations and the median altitude of the selected grid cells of each reanalysis product to apply the dry adiabatic lapse rate correction to the temperatures.
Table 2List of comparison results between the temperatures recorded at the AWSs and the closest ERA5 and BCR nodes. For each of the reanalysis datasets, we show the reported 2 m air temperature and the altitude-corrected (ac) value and their comparison to the average temperature at the AWSs.
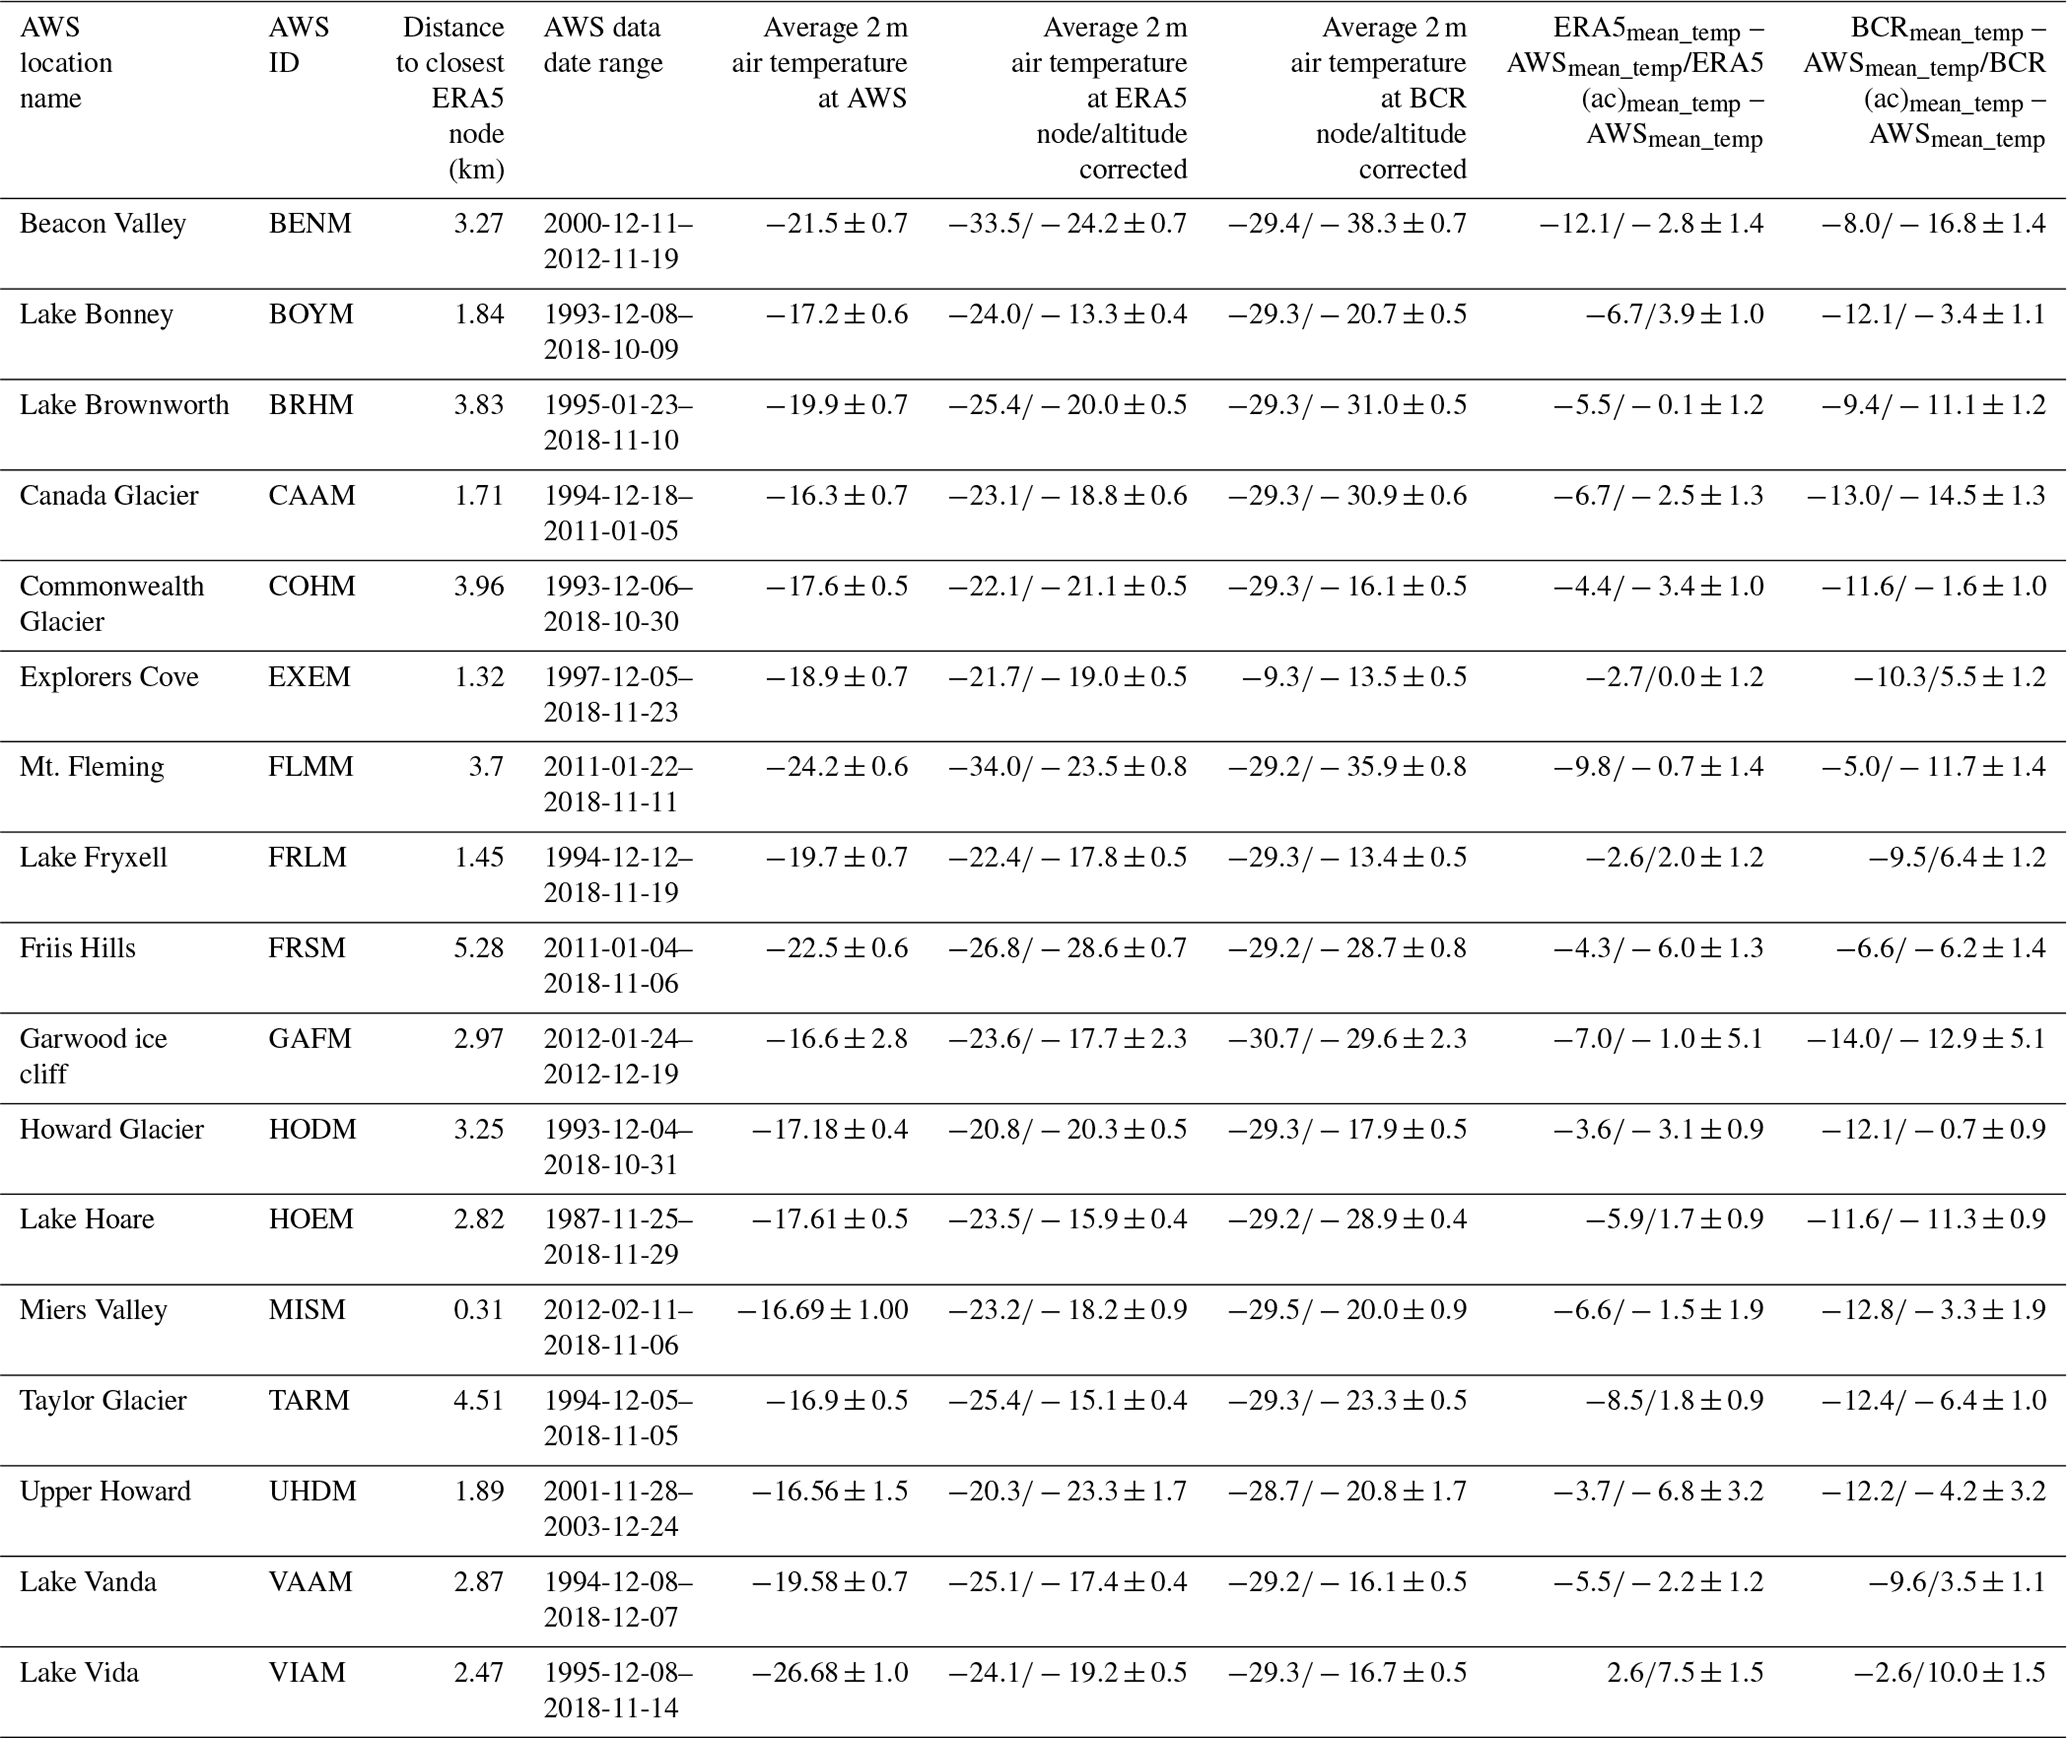
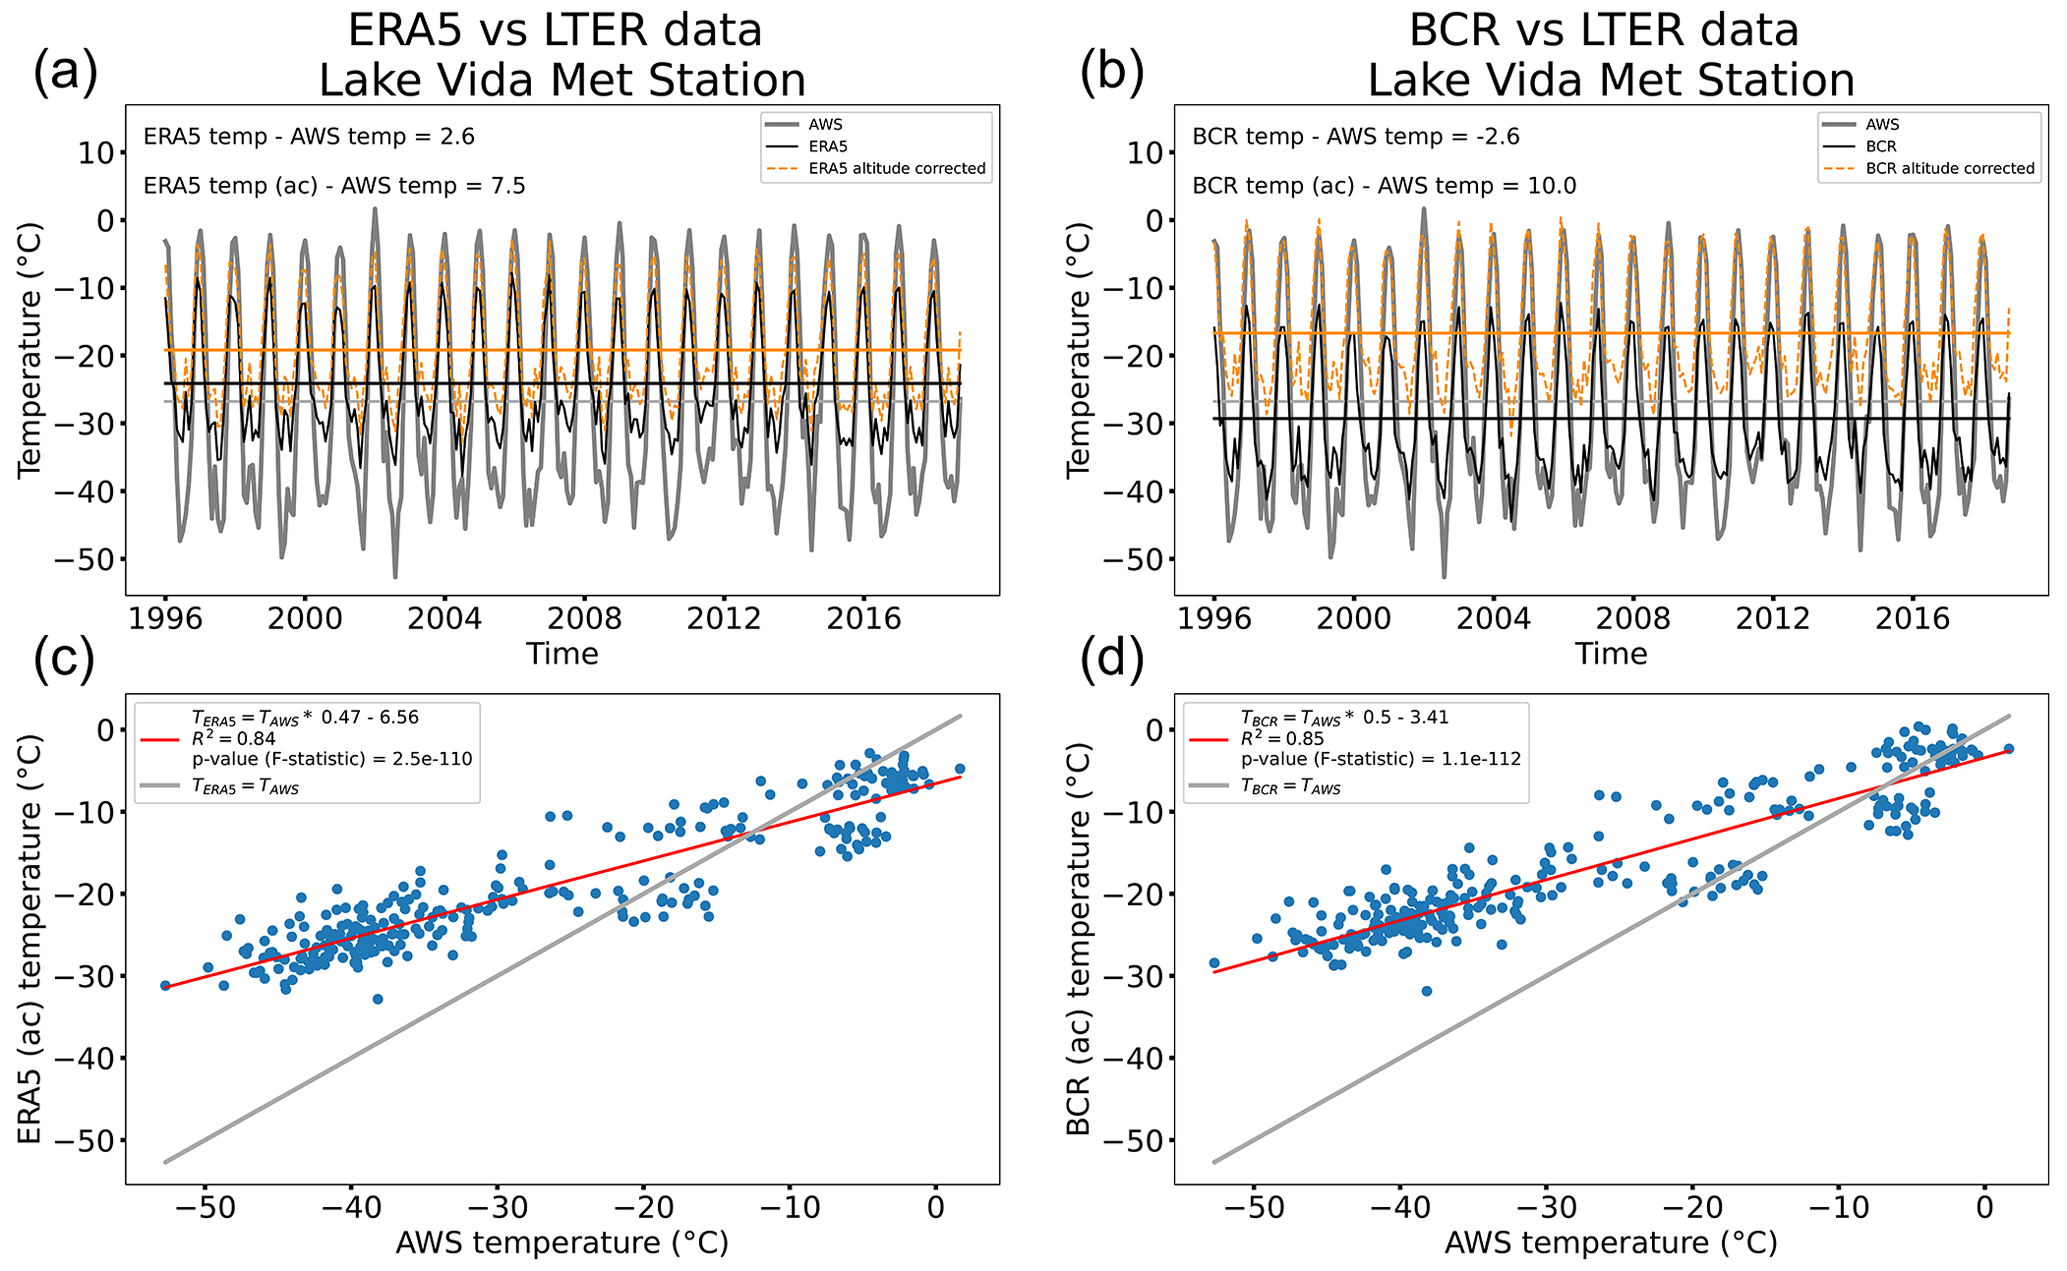
Figure 2Comparison of the monthly averaged 2 m air temperatures recorded at the Lake Vida (VIAM) station and the values from the closest grid node of the ERA5 and BCR datasets. Time series of the AWS data (gray curve) compared to the reanalysis data (black curve) and the altitude-corrected (ac) reanalysis data (dashed orange curve) for the ERA5 (a) and BCR (b) datasets. The correlograms showing the best-fit line (red line) to the relationship between the AWS temperatures and the ERA5 and BCR temperatures are shown in (c) and (d), respectively. Note the seasonal variation in the relationship, particularly the large bias during the winter months.
Overall, the two reanalysis products show both cold and warm biases compared to the AWS temperatures. Table 2 shows the results of the comparison at each station, and the elevation map of the AWSs and the spatial distributions of the altitude-corrected biases are shown in Figs. S2, S3 and S4. We find that the biases in the ERA5 dataset are of a smaller magnitude than the biases observed for the BCR dataset. The altitude correction applied to the grid temperatures does not eliminate but reduces the average bias across all stations. However, this is not the case for all stations: for ERA5, the altitude correction increases the bias at three stations (FRSM, UHDM and VIAM), and for BCR the correction increases the bias at five stations (BENM, BRHM, CAAM, FLMM and VIAM).
Contrary to the altitude-dependent biases found by Tetzner et al. (2019), our results do not show a clear correlation between bias and elevation (see Figs. S2, S3 and S4). Nevertheless, our results do suggest that the ERA5 dataset has predominantly neutral to warm biases in the valleys, despite elevations, and neutral to cold biases in the mountain ranges.
Figure 2 illustrates the comparison of the monthly temperature time series for 1 of 17 locations used in this study (Lake Vida) and the temperatures from the ERA5 and BCR datasets over the time span of more than 2 decades. In this case, the monthly temperature mismatch between the AWS and the ERA5 and BCR altitude-corrected temperatures is particularly large during the winter months, when observations indicate actual temperatures were about 10 °C lower than ERA5 or BCR temperatures (Fig. 2c, d). All the correlograms shown in Figs. S5–S21 suggest that there is a strong seasonality in the relationship between the datasets. During the austral winter and summer seasons the temperatures are generally closely clustered together, systematically being more correlated during the winter and more dispersed during the summer. The spring and fall seasons show a hysteresis that is repeated over all the comparisons. As the environment warms up during the spring months, the ERA5 and BCR temperatures are above the best-fit line and drop below it during the fall. These seasonal biases may ultimately be helpful in revealing what climate processes must be better represented in the ERA5 reanalysis to eliminate the observed temperature biases.
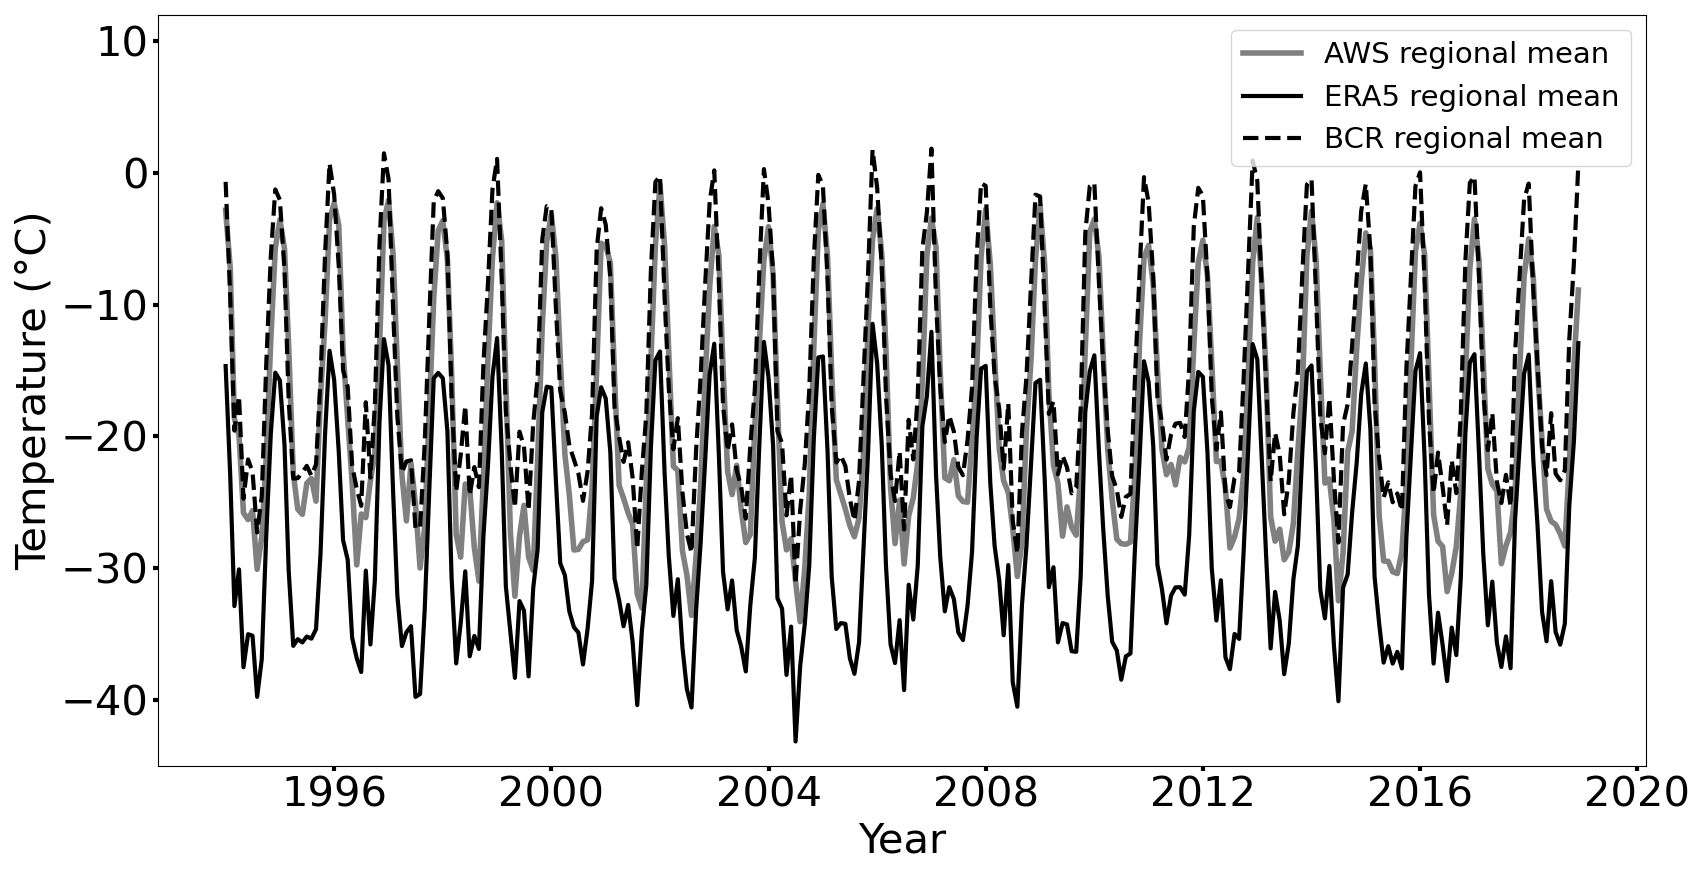
Figure 3Regional mean stacks comparison for a subarea of the McMurdo Dry Valleys (black box in Fig. 1). The average time series of temperatures across all stations is shown with a thick gray line, the average temperature from the ERA5 grid cells that are within the region is shown with a solid black line and the average temperature from the BCR subgrid is shown with a dashed black line.
The comparison between the average stack of the AWSs with the ERA5 and BCR temperatures for the selected subregion (black box in Fig. 1) is shown in Fig. 3. Interestingly, our regional average analysis suggests that the altitude-corrected ERA5 temperatures (black line in Fig. 3) have a cold bias of °C compared to the AWS temperatures, but the altitude-corrected BCR temperatures (dashed black line in Fig. 3) are much closer to the AWS temperatures. Nevertheless, the BCR temperatures do show a warm bias of 3.3±1.0 °C.
Our results differ significantly from the findings reported by Tetzner et al. (2019) for the Ellsworth Land region in the southern Antarctic Peninsula. For that region there is a slight cold bias of the ERA5 surface temperatures close to the coast ( °C) and a slight warm bias in the mountain range escarpment (0.14±0.72 °C), which has encouraging implications for using the reanalysis data where there is no AWS coverage (which represents most of Antarctica). In contrast, we find no obvious topographic dependence on the temperature differences between AWS and ERA5 data. Averaged over the whole region, the altitude-corrected temperatures of the ERA5 dataset have a slight cold bias of °C, whereas the BCR data have a cold bias of a larger magnitude ( °C). However, there are large variations from one site to another and from one season to another. Some of the large cold biases for the altitude-corrected ERA5 and BCR data are observed during the summer months, with average differences of up to and °C, respectively. This may be a particularly significant problem given the fact that warm summer temperatures determine the annual melt rate of snow, glaciers and permafrost in Antarctica. Modeling of snow or ice melting driven by ERA5 temperatures (e.g., Costi et al., 2018) with a strong cold bias, as observed in our study region, will result in a significant underestimate of summer melt production. Conversely, many stations show a warm bias during the winter months, which could potentially be related to temperature inversions that create air parcels with negative buoyancy and drive katabatic winds down the glacial streams and valleys (Phillpot and Zillman, 1970).
The differences in the regional averaged temperature time series for the AWS and the ERA5 and BCR reanalyses do show different biases than the ones reported above, which are based on the average difference between each AWS and its corresponding grid cell. For the average stacks, the ERA5 temperatures are significantly colder than the mean AWS temperatures, and the BCR temperatures are slightly warmer, and they have an overshoot during the summer and the winter alike. This finding is interesting and suggests that BCR reanalysis might be a better reference for the Dry Valleys region when studying a large area, but ERA5 reanalysis might be a better model for more local targets.
In general, our findings agree with the findings of Zhu et al. (2021) in that they also find a cold bias for West Antarctica. However, our results highlight the degree to which such biases can be found at a regional and local scale and by using different datasets. As in situ instrumentation increases in the future in the McMurdo Dry Valleys, future research on the topic could illustrate in more detail the sources of the biases between the reanalysis products and weather stations reported here. Particular attention should be given to the effect on topography and seasonal temperature inversions at smaller scales. Although the ERA5 reanalysis and its bias-corrected version are outstanding sources of global climate variables, the discrepancy between our results and those obtained by Tetzner et al. (2019) suggests that secondary observations should be used to test the reliability of the ERA5 and BCR datasets in polar regions, particularly when performing studies at scales shorter than 0.5°.
We have compared the surface temperature (2 m temperature) recorded at 17 AWSs in the McMurdo Dry Valleys, Antarctica, with temperatures from the ERA5 reanalysis dataset. We found that the temperatures reported by the global climate reanalysis and its bias-corrected version can have significant warm and cold biases relative to the weather stations. The cold temperature bias appears to be the largest during the warm summer months, when the loss of snow and ice to melting is the largest. Warm biases are more common during the winter months, when atmospheric temperature inversions are common. When using the average temperature across many stations in a region and comparing it to the average temperature of all the grid cells in that region, the bias-corrected reanalysis shows a slight warm bias, whereas the ERA5 temperatures show a significant cold bias. We advise using secondary observations to assess the accuracy of parameters included in ERA5 reanalysis and its bias-corrected version for polar regions when performing studies at different scales.
The AWS data were provided by the NSF-supported McMurdo Dry Valleys Long-Term Ecological Research program (NSF OPP-2224760) and can be accessed at https://doi.org/10.5281/zenodo.10783775 (McMurdo Dry Valleys Long Term Ecological Research, 2024). The “ERA5-Land hourly data from 1950 to present” (https://doi.org/10.24381/cds.e2161bac; Muñoz Sabater, 2019) and the “Near surface meteorological variables from 1979 to 2019 derived from bias-corrected reanalysis” (https://doi.org/10.24381/cds.20d54e34; Cucchi et al., 2022) data were downloaded from the Copernicus Climate Change Service (C3S) Climate Data Store.
The supplement related to this article is available online at: https://doi.org/10.5194/tc-18-1207-2024-supplement.
SMT conceived the study. RGG performed the analysis. RGG and SMT prepared the article with equal contributions.
The contact author has declared that none of the authors has any competing interests.
Publisher’s note: Copernicus Publications remains neutral with regard to jurisdictional claims made in the text, published maps, institutional affiliations, or any other geographical representation in this paper. While Copernicus Publications makes every effort to include appropriate place names, the final responsibility lies with the authors.
This research has been supported by the National Science Foundation (grant no. 1644187).
This paper was edited by Bin Cheng and reviewed by two anonymous referees.
Bromwich, D. H., Otieno, F. O., Hines, K. M., Manning, K. W., and Shilo, E.: Comprehensive evaluation of polar weather research and forecasting model performance in the Antarctic, J. Geophys. Res.-Atmos., 118, 274–292, 2013.
Costi, J., Arigony-Neto, J., Braun, M., Mavlyudov, B., Barrand, N. E., Da Silva, A. B., Marques, W. C., and Simoes, J. C.: Estimating surface melt and runoff on the Antarctic Peninsula using ERA-Interim reanalysis data, Antarct. Sci., 30, 379–393, 2018.
Cucchi, M., Weedon, G. P., Amici, A., Bellouin, N., Lange, S., Müller, Schmied, H., Hersbach, H., Cagnazzo, C., and Buontempo, C.: Near surface meteorological variables from 1979 to 2019 derived from bias-corrected reanalysis, version 2.1, Copernicus Climate Change Service (C3S) Climate Data Store (CDS) [data set], https://doi.org/10.24381/cds.20d54e34, 2022.
Doran, P. T., McKay, C. P., Clow, G. D., Dana, G. L., Fountain, A. G., Nylen, T., and Lyons, W. B.: Valley floor climate observations from the McMurdo Dry Valleys, Antarctica, 1986–2000, J. Geophys. Res.-Atmos., 107, ACL-13, https://doi.org/10.1029/2001JD002045, 2002.
Hersbach, H., Bell, B., Berrisford, P., Hirahara, S., Horányi, A., Muñoz-Sabater, J., Nicolas, J., Peubey, C., Radu, R., Schepers, D., and Simmons, A.: The ERA5 global reanalysis, Q. J. Roy. Meteor. Soc., 146, 1999–2049, https://doi.org/10.1002/qj.3803, 2020.
Lazzara, M. A., Weidner, G. A., Keller, L. M., Thom, J. E., and Cassano, J. J.: Antarctic automatic weather station program: 30 years of polar observation, B. Am. Meteor. Soc., 93, 1519–1537, https://doi.org/10.1175/BAMS-D-11-00015.1, 2012.
McMurdo Dry Valleys Long Term Ecological Research: McMurdo-Dry-Valleys-LTER-Meteorological-Stations-Daily-Air-Temperature (v1.0.0), Zenodo [data set], https://doi.org/10.5281/zenodo.10783775, 2024.
Muñoz Sabater, J.: ERA5-Land hourly data from 1981 to present, Copernicus Climate Change Service (C3S) Climate Data Store (CDS) [data set], https://doi.org/10.24381/cds.e2161bac, 2019.
New, M., Hulme, M., and Jones, P.: Representing Twentieth-Century Space–Time Climate Variability. Part I: Development of a 1961–90 Mean Monthly Terrestrial Climatology, J. Climate, 12, 829–856, https://doi.org/10.1175/1520-0442(1999)012<0829:RTCSTC>2.0.CO;2, 1999.
New, M., Hulme, M., and Jones, P.: Representing Twentieth-Century Space–Time Climate Variability. Part II: Development of 1901–96 Monthly Grids of Terrestrial Surface Climate, J. Climate, 13, 22172238, https://doi.org/10.1175/1520-0442(2000)013<2217:RTCSTC>2.0.CO;2, 2000.
Phillpot, H. R. and Zillman, J. W.: The surface temperature inversion over the Antarctic continent, J. Geophys. Res., 75, 4161–4169, 1970.
Tetzner, D., Thomas, E., and Allen, C.: A Validation of ERA5 Reanalysis Data in the Southern Antarctic Peninsula–Ellsworth Land Region, and Its Implications for Ice Core Studies, Geosci. J., 9, 289, https://doi.org/10.3390/geosciences9070289, 2019.
Weedon, G.P., Gomes, S., Viterbo, P., Österle, H., Adam, J.C., Bellouin, N., Boucher, O., and Best, M.: The watch forcing data 1958–2001: a meteorological forcing data set for land surface-and hydrological-models, WATCH technical report, 4625, https://publications.pik-potsdam.de/pubman/item/item_16400, 2010.
Weedon, G. P., Gomes, S., Viterbo, P., Shuttleworth, W. J., Blyth, E., Österle, H., Adam, J. C., Bellouin, N., Boucher, O., and Best, M.: Creation of the WATCH forcing data and its use to assess global and regional reference crop evaporation over land during the twentieth century, J. Hydrometeorol., 12, 823–848, 2011.
Weedon, G. P., Balsamo, G., Bellouin, N., Gomes, S., Best, M. J., and Viterbo, P.: The WFDEI meteorological forcing data set: WATCH Forcing Data methodology applied to ERA-Interim reanalysis data, Water Resour. Res., 50, 7505–7514, 2014.
Zhu, J., Xie, A., Qin, X., Wang, Y., Xu, B., and Wang, Y.: An assessment of ERA5 reanalysis for Antarctic near-surface air temperature, Atmosphere, 12, 217, https://doi.org/10.3390/atmos12020217, 2021.