the Creative Commons Attribution 4.0 License.
the Creative Commons Attribution 4.0 License.
 | 21 Feb 2023
Climatology and surface impacts of atmospheric rivers on West Antarctica
Michelle L. Maclennan
Jan T. M. Lenaerts
Christine A. Shields
Andrew O. Hoffman
Nander Wever
Megan Thompson-Munson
Andrew C. Winters
Erin C. Pettit
Theodore A. Scambos
Jonathan D. Wille
Atmospheric rivers (ARs) transport large amounts of moisture from the mid- to high-latitudes and they are a primary driver of the most extreme snowfall events, along with surface melting, in Antarctica. In this study, we characterize the climatology and surface impacts of ARs on West Antarctica, focusing on the Amundsen Sea Embayment and Marie Byrd Land. First, we develop a climatology of ARs in this region, using an Antarctic-specific AR detection tool combined with the Modern-Era Retrospective analysis for Research and Applications, version 2 (MERRA-2) and the European Centre for Medium-Range Weather Forecasts (ECMWF) Reanalysis v5 (ERA5) atmospheric reanalyses. We find that while ARs are infrequent (occurring 3 % of the time), they cause intense precipitation in short periods of time and account for 11 % of the annual surface accumulation. They are driven by the coupling of a blocking high over the Antarctic Peninsula with a low-pressure system known as the Amundsen Sea Low. Next, we use observations from automatic weather stations on Thwaites Eastern Ice Shelf with the firn model SNOWPACK and interferometric reflectometry (IR) to examine a case study of three ARs that made landfall in rapid succession from 2 to 8 February 2020, known as an AR family event. While accumulation dominates the surface impacts of the event on Thwaites Eastern Ice Shelf (> 100 kg m−2 or millimeters water equivalent), we find small amounts of surface melt as well (< 5 kg m−2). The results presented here enable us to quantify the past impacts of ARs on West Antarctica's surface mass balance (SMB) and characterize their interannual variability and trends, enabling a better assessment of future AR-driven changes in the SMB.
- Article
(7713 KB) - Full-text XML
- BibTeX
- EndNote


The Antarctic Ice Sheet (AIS) represents a vast, dynamic system, whose mass is gained over time through snow accumulation and lost through ablation. The balance of these processes, known as the mass balance, is calculated as the difference between mass changes at the surface of the ice sheet, known as the surface mass balance (SMB), and discharge of ice across the grounding line. In the last 4 decades, the AIS has experienced increased mass loss, from 40 ± 9 Gt yr−1 (gigatons per year) between 1979 and 1990 to 252 ± 26 Gt yr−1 between 2009 and 2017, most of which is attributed to increasing discharge across the grounding line of the West Antarctic Ice Sheet (WAIS; Rignot et al., 2019). From 1979 to 2017, the WAIS contributed 6.9 ± 0.6 mm of global mean sea level rise (Rignot et al., 2019).
Although it covers only 17 % of the AIS, the WAIS accounts for 34 % of ice discharge (Rignot et al., 2019). Within the WAIS, the Amundsen Sea sector has experienced more than a doubling (130 % increase) of ice discharge from 1979 to 2017 (Rignot et al., 2019). In this region, the enhanced flow of relatively warm circumpolar deep water beneath ice shelves on coastal West Antarctica has increased basal melt of the ice shelves and led to widespread grounding line retreat (Jacobs and Hellmer, 1996; Thoma et al., 2008; Jacobs et al., 2011; Dutrieux et al., 2014; Rignot et al., 2014; Alley et al., 2021; Milillo et al., 2022; Wild et al., 2022). In particular, Thwaites Glacier (TG), which borders the Amundsen Sea, is at considerable risk for continued grounding line retreat in the future because it is grounded on inward sloping bedrock, which may lead to a rapid positive feedback for increasing ice flow and retreat, termed “marine ice sheet instability” (Weertman, 1974; Schoof, 2012). This process may be underway already, but a rapid acceleration in the twenty-second century could result in several tens of centimeters of sea level rise (Joughin et al., 2014; DeConto and Pollard, 2016; Seroussi et al., 2017; Shepherd et al., 2018; DeConto et al., 2021).
While discharge from the WAIS has increased since 1979, the SMB has experienced no significant trend in the last 4 decades, despite its large interannual variability (Medley et al., 2014; Rignot et al., 2019). The SMB represents the balance between mass gained at the surface through precipitation,and mass lost by sublimation or evaporation and surface meltwater runoff (Lenaerts et al., 2019). Snowfall acts as the primary contributor to the SMB. At present, rainfall is an insignificant component of the SMB as rainfall over the WAIS is very low, and most refreezes in the firn (Vignon et al., 2021). However, rainfall can lower the surface albedo and thereby increase future melting (Wille et al., 2019). While SMB of the WAIS has been relatively constant long-term, interannual variability in SMB is high: in the Amundsen Sea sector, SMB variability has the same order of magnitude as the annual mass loss (Medley et al., 2014; Lenaerts et al., 2018; Donat-Magnin et al., 2020). The SMB in this region is driven by extreme snowfall events which contribute more than 50 % of the total annual snowfall and help to drive the high interannual variability (Maclennan and Lenaerts, 2021). The combination of high interannual variability and seasonal variability in snowfall drives large variations in the annual SMB of the WAIS. To constrain past and future changes in the mass balance of the WAIS, it is essential to diagnose the character and impacts of these extreme events on the SMB.
Among the primary drivers of these extreme snowfall events are atmospheric rivers (ARs), which only make landfall about 3 d per year in Antarctic coastal regions but contribute 10 %–20 % of the total annual snowfall to the AIS each year (Wille et al., 2021; Gorodetskaya et al., 2014). ARs are long, narrow bands of warm and moist air that propagate poleward from the extra-tropics and are often associated with extratropical cyclones (Zhu and Newell, 1998). When a cold front catches up with a warm front in the extratropical cyclone, it sweeps up water vapor in the cyclone's warm sector, forming a narrow band of moist air and precipitation at the leading edge of the cold front (Bao et al., 2006; Dacre et al., 2015). The ARs are associated with a low-level jet and moisture fluxes on the order of the flow of the Amazon River (Zhu and Newell, 1998). When ARs encounter land and are lifted further orographically, these bands of warm and moist air produce intense precipitation, which can lead to flooding in coastal regions of the midlatitudes, including California, Western Europe, and the Andes in South America (Zhu and Newell, 1998; Ralph et al., 2006; Viale and Nuñez, 2011; Lavers and Villarini, 2013; Ramos et al., 2015; Waliser and Guan, 2017; Lamjiri et al., 2017; Whan et al., 2020). ARs account for over 90 % of poleward water vapor transport in the mid- and high-latitudes (Nash et al., 2018). The primary driver for AR transport towards the Antarctic continent is atmospheric blocking by high-pressure ridges which enhance the transport of heat and moisture from low to high latitudes (Terpstra et al., 2021; Pohl et al., 2021).
While ARs make landfall up to 14 % of the time in the mid-latitudes (∼ 50 d per year), they are comparatively rare over the AIS, making landfall only 1 % of the time (or ∼ 3 d per year; Rutz et al., 2019a; Wille et al., 2021). Although they occur infrequently, Antarctic ARs can have multiple, contrasting impacts on the SMB. Intense precipitation is caused by ARs when they make landfall over the AIS, because they carry so much moisture. ARs are associated with strong, localized accumulation events in East Antarctica that can account for up to 80 % of the annual SMB (Gorodetskaya et al., 2014). Furthermore, they explain 63 % of satellite altimetry-identified increases in surface height in West Antarctica during 2019–2020 (Adusumilli et al., 2021). The ability of ARs to transport heat poleward is important for the AIS as well, as ARs raise surface temperatures on the ice sheet through warm air advection and enhanced cloud radiative forcing (downwelling long-wave radiation; Wille et al., 2019). This causes surface melting in coastal Antarctica, particularly on the Antarctic Peninsula, which can lead to runoff and/or deplete the ability of the firn to store future meltwater (Wille et al., 2019). Unlike on the Greenland Ice Sheet (Neff et al., 2014; Mattingly et al., 2018), ARs act to increase the Antarctic SMB, as they cause significantly more snowfall than surface melting (Wille et al., 2019, 2021).
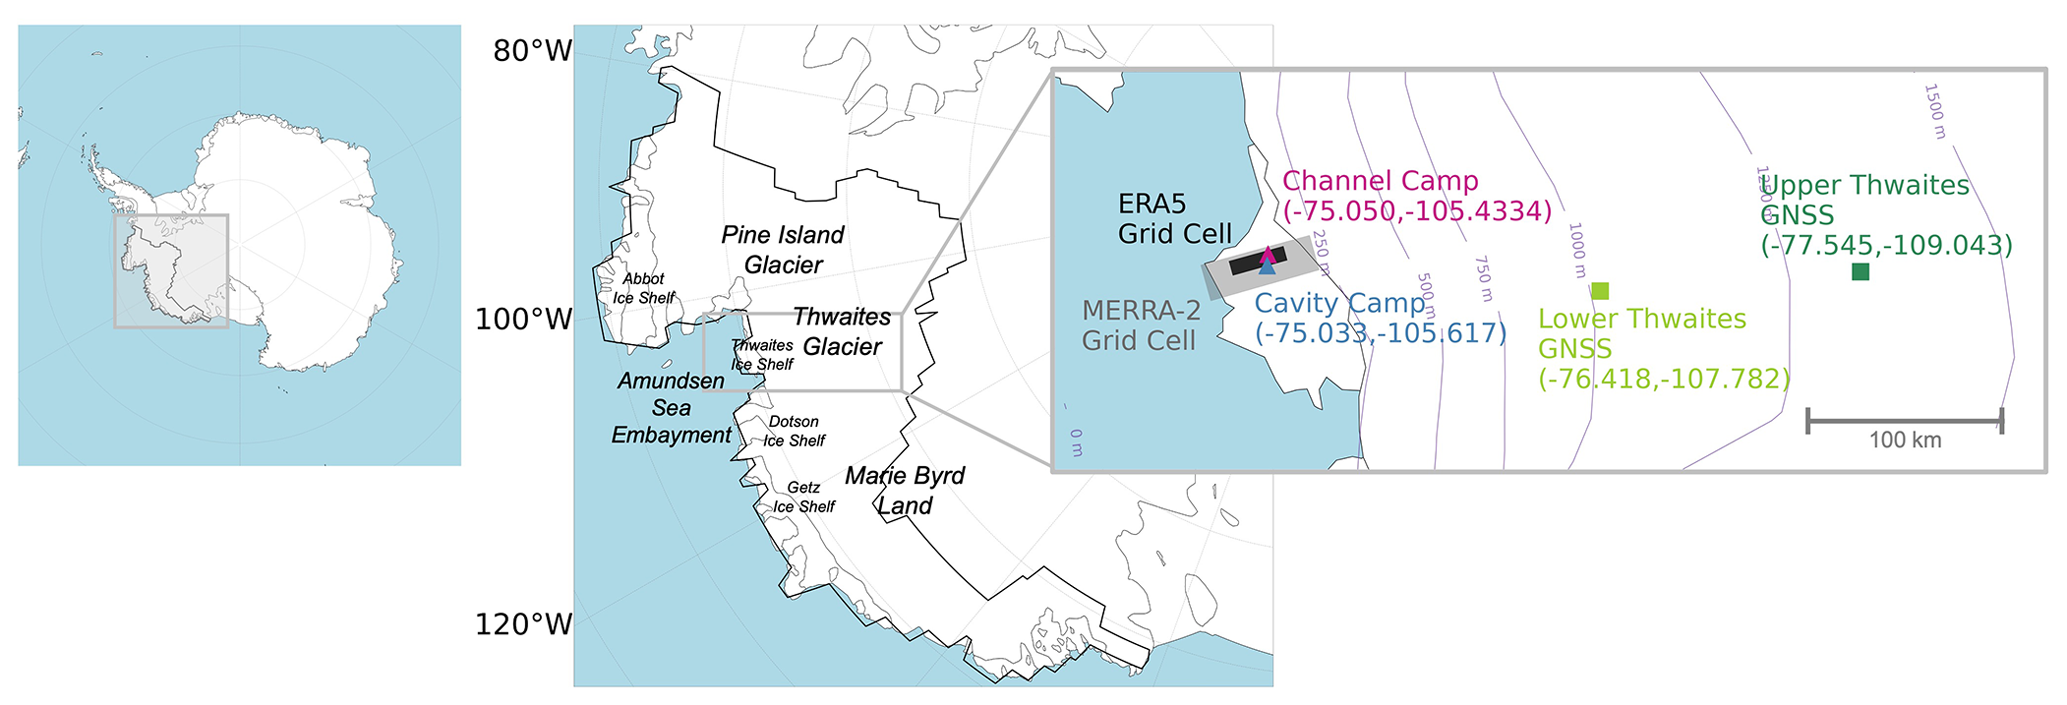
Figure 1Map showing the region of interest in this study – the Amundsen Sea Embayment and Marie Byrd Land in West Antarctica (outlined in black). Locations of the AMIGOS at Cavity Camp (blue) and Channel Camp (pink) are shown on Thwaites Eastern Ice Shelf, along with the MERRA-2 (gray) and ERA5 (black) grid cells nearest to the AMIGOS. Also shown are the GNSS receiver sites at Lower Thwaites (light green) and Upper Thwaites (dark green), located on the grounded Thwaites Glacier. In this figure, and any following maps, elevation contours are from MERRA-2 (http://doi.org/10.5067/ME5QX6Q5IGGU) and drainage basins are from Zwally et al. (2012).
Despite the importance of ARs for SMB of the WAIS, the spatial variability of extreme precipitation associated with ARs over Antarctica is poorly understood. Previous research using a regional climate model showed that coastal regions of the WAIS broadly experience 1–3 d of AR conditions per year which account for around 40 % of extreme precipitation events from 1980 to 2020 (Wille et al., 2021). However, the low spatiotemporal resolution of atmospheric reanalysis products does not highlight the effects of topography or capture precipitation patterns during individual AR events (Gehring et al., 2022). In this study, we provide both a large-scale, climatological perspective of West Antarctic ARs and a focused case study of a particular AR event. First, we use atmospheric reanalyses to quantify the landfalls and accumulation impacts of ARs from 1980 to 2020 over Marie Byrd Land and the Amundsen Sea sector. Then, we use in situ observations and a firn model to examine the specific impacts of a series of three successive ARs that made landfall on TG in February 2020, as well as the ability of reanalyses to reproduce those observations. Our analysis provides key indications of small-scale spatial variability in AR-driven accumulation and surface melting on TG within the broader context of the climatology of ARs in the region. Finally, we discuss how ARs contribute to the present mass balance of the WAIS, which improves our understanding of how their impacts may change in future climate scenarios.
2.1 Observations from automatic weather stations
Through the Thwaites-Amundsen Regional Survey and Network (TARSAN) project integrating atmosphere–ice–ocean processes of the International Thwaites Glacier Collaboration (ITGC), automatic weather stations known as the Automated Meteorology–Ice–Geophysics Observation System (AMIGOS; Scambos et al., 2013) were installed on Thwaites Eastern Ice Shelf at Cavity Camp (75.033∘ S, 105.617∘ W) and Channel Camp (75.050∘ S, 105.4334∘ W) during a field campaign in austral summer 2019/20 (Fig. 1). Cavity Camp is located on a flat part of Thwaites Eastern Ice Shelf, whereas Channel Camp sits within the surface expression of a basal melt channel (Alley et al., 2016). The AMIGOS at Cavity Camp and Channel Camp provide unique in situ observations of the weather occurring over Thwaites Eastern Ice Shelf by logging hourly temperature, surface pressure, wind speeds and direction, humidity, and snow height, as well as other observations such as GPS position and firn temperature. We utilize these novel observations to characterize the in situ atmospheric conditions – air temperature, surface pressure, wind speed, and wind direction – for the case study of an AR that made landfall over TG on 2 February 2020. The AMIGOS temperature sensors were located about 6 m above the surface during the period of interest in this study, so we refer to AMIGOS air temperatures as “near surface”. The choice not to correct observed temperatures to 2 m above the surface is justified because the atmospheric surface layer is usually neutrally stable and well-mixed during AR events. We use a firn-temperature record from thermistors placed 1 m below the surface at the AMIGOS stations to identify changes in firn temperature associated with percolation of surface meltwater during the case study AR event. Sustained hurricane-force winds of 55–70 m s−1 over Thwaites Eastern Ice Shelf in late September 2021 severely damaged the AMIGOS and have limited the available weather data to a period of just over 1.5 years after installment.
2.2 Reanalysis products: MERRA-2 and ERA5
To characterize the large-scale atmospheric circulation and weather conditions associated with Antarctic AR events, we use the global atmospheric reanalyses Modern-Era Retrospective analysis for Research and Applications, version 2 (MERRA-2; Gelaro et al., 2017) and the European Centre for Medium-Range Weather Forecasts (ECMWF) Reanalysis v5 (ERA5; Hersbach et al., 2020). Reanalyses assimilate observations (not including the AMIGOS data) with atmospheric modeling to produce regularly gridded, temporally continuous weather and climate data. Due to the spatiotemporally limited observations available for the Southern Ocean and Antarctica, reanalysis products are essential for examining spatial patterns in atmospheric pressure, temperature, moisture, and snowfall over the WAIS, and they are commonly used to examine the synoptic forcing of ARs over Antarctica (Gorodetskaya et al., 2014; Pohl et al., 2021). MERRA-2 features a latitude–longitude grid spacing of 0.5∘ × 0.625∘ (Gelaro et al., 2017), which is approximately 56 km × 18 km at the location of TG. ERA5 is the newest global atmospheric reanalysis product from the European Centre for Medium-range Weather Forecasts (ECMWF) and features a latitude–longitude grid spacing of 0.25∘ latitude (28 km) by 0.25∘ longitude (7 km) resolution (Hersbach et al., 2020). We primarily use MERRA-2 to analyze the large-scale synoptic conditions and impacts of AR events in West Antarctica, as MERRA-2 explicitly represents ice sheet hydrological and energy budgets and compares best to ice core records of snow accumulation in Antarctica among multiple reanalyses (Gelaro et al., 2017; Medley and Thomas, 2019).
We use the MERRA-2 reanalysis to generate composite maps of the surface pressure and surface pressure anomaly (relative to 1980–2020 climatology) during the times of AR landfalls over coastal West Antarctica, including the Amundsen Sea Embayment and Marie Byrd Land. Over Thwaites Eastern Ice Shelf, we compare MERRA-2 2 m temperatures before and during AR events to examine the impacts of ARs on surface temperatures by season.
We also use MERRA-2 to examine spatial patterns in surface pressure, 500 hPa geopotential height, and the 500 hPa geopotential height anomaly (relative to 1980–2020 climatology) over West Antarctica and the Southern Ocean during the case study AR event in February 2020. We compare time series of both MERRA-2 and ERA5 to the atmospheric conditions observed by the AMIGOS (near-surface temperature, surface pressure, wind speed, and wind direction) on Thwaites Eastern Ice Shelf during the case study event. While AMIGOS observations reflect local conditions at the Cavity and Channel Camp sites, MERRA-2 and ERA5 data represent grid-cell averages, meaning local values for temperature, surface pressure, wind speed, and wind direction can deviate from those grid-cell averages. In the near-surface temperature comparison, MERRA-2 and ERA5 use 2 m temperatures while the observed temperatures are from approximately 6 m above the surface. We include ERA5 in this analysis because there are differences between MERRA-2 and ERA5 in 2 m temperature and snow accumulation during the event, allowing for a comparison between the reanalyses.
2.3 Atmospheric river detection catalogue and attributing precipitation
We use a polar-specific AR detection algorithm produced by Wille et al. (2021) to identify the occurrence and landfall of ARs over the WAIS. The algorithm uses the MERRA-2 atmospheric reanalysis (Gelaro et al., 2017) from 37.5 to 80∘ S to detect moisture filaments when integrated water vapor (IWV) or meridional integrated vapor transport (vIVT) exceed the 98th percentile of their monthly climatologies. Moisture filaments are classified as ARs if they extend at least 20∘ in the meridional direction. Because it tracks IWV and vIVT relative to the monthly climatology, this algorithm is uniquely positioned to detect polar ARs. Wille et al. (2021) found that IWV is better suited for identifying ARs that cause surface melting, as high IWV over the AIS is associated with cloud development and high downwelling longwave radiation to the surface. Comparatively, the vIVT-based definition of ARs is better suited for studying snowfall, since the meridional transport of water vapor is linked to atmospheric dynamics that lead to precipitation.
In this study, we primarily focus on AR-driven precipitation, and thus we use the vIVT catalogues with AR detection at 3 h intervals based on MERRA-2 reanalysis. From the catalogues, we generate maps of AR frequency over the AIS. We then identify individual AR events making landfall over the Amundsen Sea Embayment and Marie Byrd Land by counting the number of consecutive time indices of AR landfall within the region. If the time steps indicate a 12 h break or more, we count them as two separate AR events. We do this to account for AR families, which are multiple ARs that make landfall in succession in short periods of time (Fish et al., 2022). Based on the AR events we identified, we quantify their trends, duration, and seasonality from 1980 to 2020. To attribute precipitation to ARs, we integrate MERRA-2 3 h precipitation within the footprint of the AR landfall, based on the vIVT AR catalogue of Wille et al. (2021). We also attribute precipitation that falls up to 24 h after landfall, but within the footprint of the AR, to the AR event.
2.4 SNOWPACK firn modeling
We use observed snow height and temperature from the AMIGOS to force the firn model SNOWPACK (Lehning et al., 2002a, b) to reconstruct accumulation and surface melt during the AR case study event in February 2020. SNOWPACK is a physics-based, multi-layer firn model (Lehning et al., 2002a, b) which has been extensively applied in polar regions (Groot Zwaaftink et al., 2013; Steger et al., 2017; van Wessem et al., 2021; Keenan et al., 2021). The model calculates snow compaction using an overburden formulation and solves the full surface energy balance to provide the upper boundary condition for solving the temperature equation and calculating melt. When snow accumulates, fresh accumulation density is calculated as a function of meteorological conditions, particularly wind and the presence of drifting snow (Keenan et al., 2021; Wever et al., 2022). We configure the SNOWPACK model similar to the “Redeposit”-setup discussed in Wever et al. (2022) while additionally deriving snowfall from the observed snow height: if observed snow height exceeds the simulated snow height, the difference is interpreted as snowfall, when relative humidity, air temperature, and snow surface temperature meet snowfall conditions (Lehning et al., 1999; Wever et al., 2015). This is then combined with fresh accumulation density, parameterized following Schmucki et al. (2014), to convert to accumulated mass.
We use the MeteoIO library (Bavay and Egger, 2014) to preprocess the meteorological forcing data. Since the measured snow depth from the acoustic sensors exhibited oscillations, seemingly synchronized with the diurnal cycle in temperature and consequently, the speed of sound (e.g., Ryan et al., 2008), we applied a weighted moving average smoothing filter with a centered window of 48 h. Both the Cavity Camp and Channel Camp AMIGOS are represented by the same closest MERRA-2 grid point (Fig. 1). However, we run SNOWPACK individually for each of the AMIGOS. Using the model settings as described in Keenan et al. (2021), we run SNOWPACK for the period from 1980 to the installation date of the respective AMIGOS, using forcing data provided by MERRA-2. We then mark the layer in the SNOWPACK-simulated firn, whose depth corresponds to the measured position of the base plate of the AMIGOS upon installation in the field. In the remainder of the simulation, we track the position of this marked layer, and the AMIGOS snow depth is referenced to this specific layer. We can then use the aforementioned snow-height-driven accumulation approach, while eliminating the settling of the AMIGOS station in the firn column. From the installation date of the AMIGOS forward model, we use the available parameters from the AMIGOS to force the simulation (i.e., snow depth, near-surface air temperature, relative humidity, and wind speed) while taking downwelling shortwave and longwave radiation from the reanalysis. From the installation date of the AMIGOS onwards, we performed two sets of simulations, one forced by MERRA-2 and the other by ERA5.
2.5 Surface height changes via interferometric reflectometry
We supplement the record of surface height change estimates observed by the AMIGOS on Thwaites Eastern Ice Shelf with surface height change measurements from the grounded TG observed with the global navigation satellite system (GNSS) using interferometric reflectometry (IR; Larson et al., 2009, 2015; Roesler and Larson, 2018). Two GNSS receivers have been maintained on TG over the last 10 years. These sites are located 124 km (GNSS Lower Thwaites; 1011 m elevation) and 215 km (GNSS upper Thwaites; 1315 m elevation) from the present grounding zone (Fig. 1; Wilson et al., 2009a, b) and have been used to understand the flow acceleration of the glacier and the influence of lake fill-drain cycles on interior glacier flow speed. These sites can also be used to understand the variability of snowfall over TG using GNSS–interferometric reflectometry (GNSS–IR). The addition of GNSS–IR snow-accumulation records enables us to compare spatial differences in snowfall on Thwaites Eastern Ice Shelf and TG during the AR case study event. We use the GNSS–IR method to determine the height of phase center of the GNSS receiver antenna above the surface using the signal-to-noise ratio of multi-path interference with the direct signal. As snow is deposited at Lower and upper Thwaites receiver sites, the height of the receivers above the surface is reduced. Forward models of reflector height change due to snow loading. Densification combined with inverse methods capable of sampling posterior distributions of model parameters using likelihood estimates that assimilate reflector height data can be used to solve for the joint accumulation and densification history. From these independent records of accumulation and deposition, we can verify the influence of atmospheric river landfall on observed SMB. We show GNSS-derived accumulation with the SNOWPACK-reconstructed accumulation to examine the inland propagation of the case study AR event from Lower TG (AMIGOS and Lower Thwaites GNSS) to Upper TG (Upper Thwaites GNSS). These observations provide additional spatial information on accumulation patterns due to the AR event.
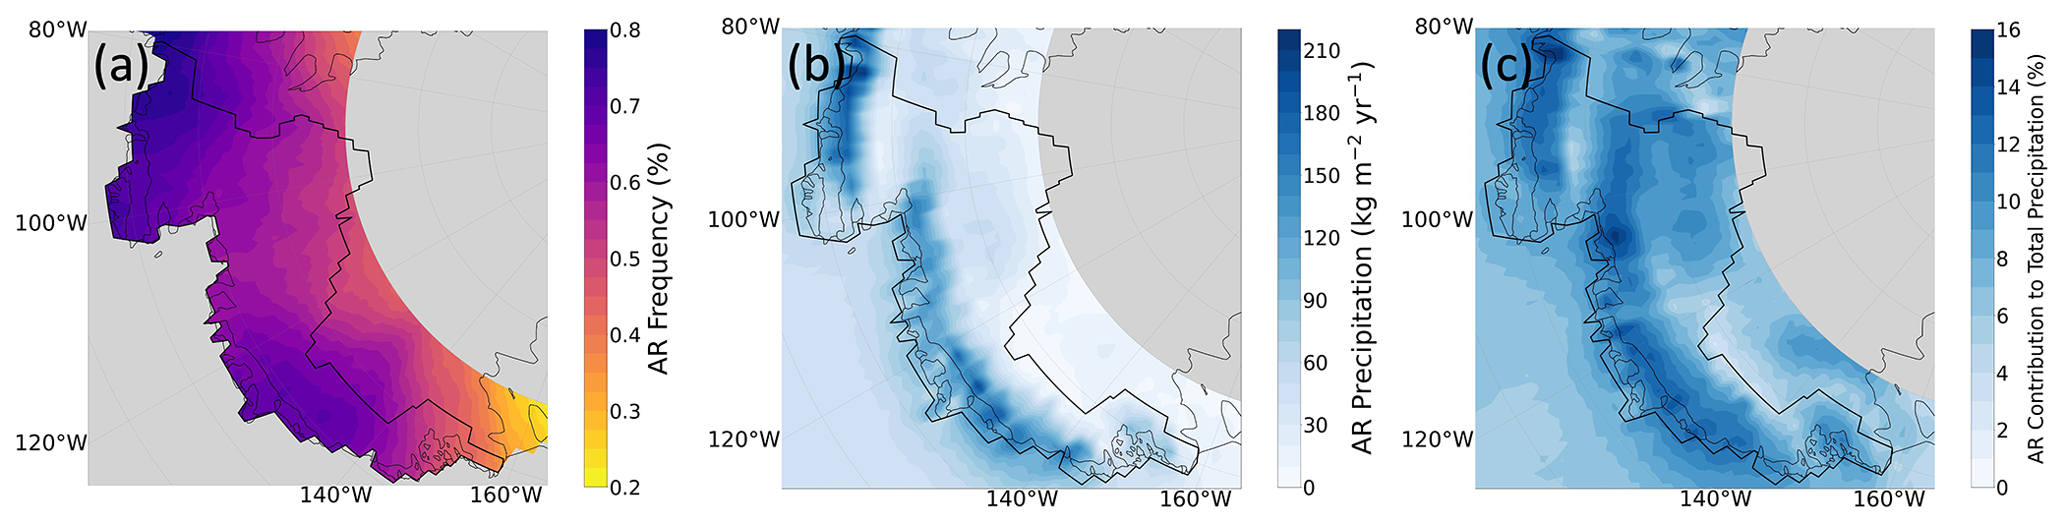
Figure 2(a) Temporal frequencies of AR landfall (number of AR times divided by the total time, as a percentage), (b) precipitation attributed to ARs, and (c) AR precipitation as the percentage of the total annual precipitation in West Antarctica (MERRA-2, 1980 to 2020). The Amundsen Sea Embayment and Marie Byrd Land (region of interest) are outlined in black in all three figures. Gray shading over the interior of the ice sheet marks the 80∘ S boundary of the Wille et al. (2021) AR detection algorithm.
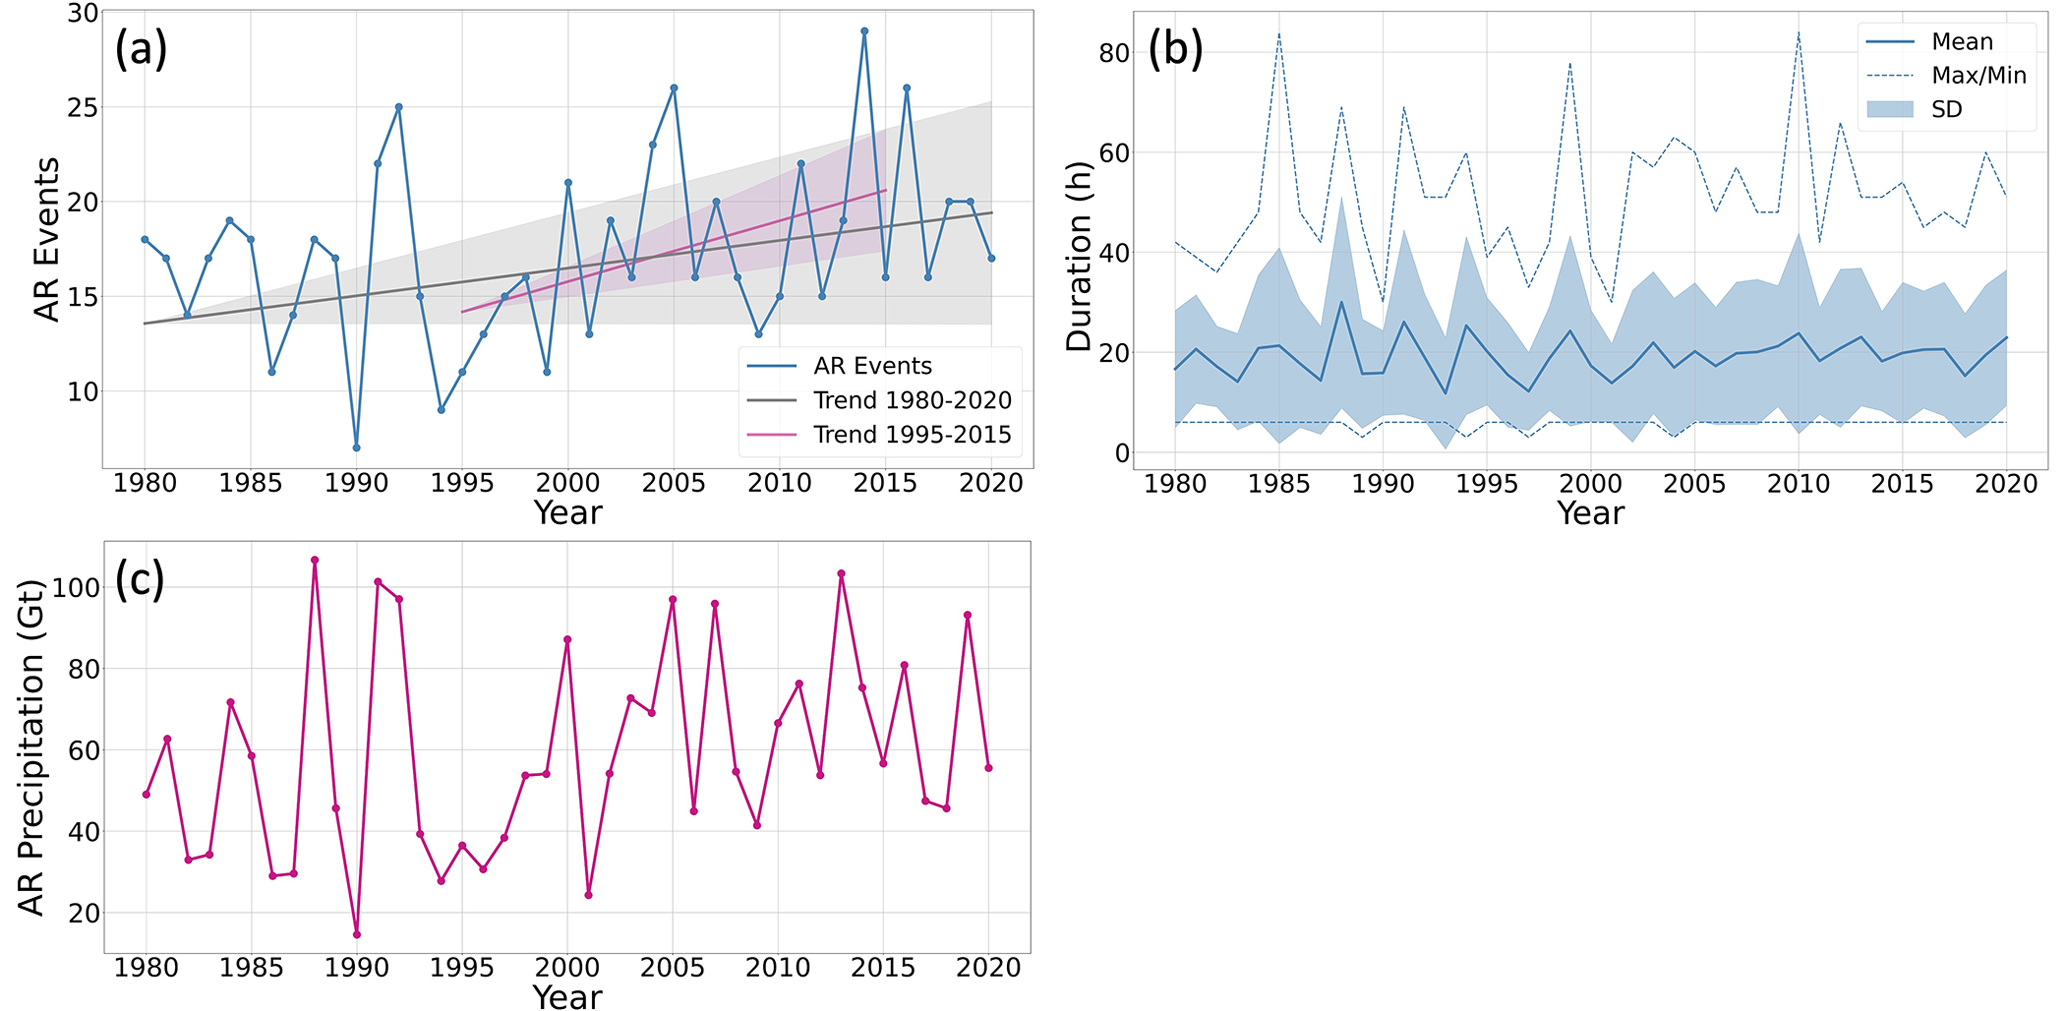
Figure 3(a) The number of AR events making landfall over the Amundsen Sea Embayment and Marie Byrd Land each year (blue), with the 1980–2020 trend and standard error (gray) and the 1995–2015 trend error (pink). (b) The mean duration of AR events each year (thick blue line), along with the maximum and minimum duration of events (dotted lines) and the standard deviation from the mean (blue shading). (c) The total precipitation attributed to ARs annually from 1980 to 2020.
3.1 Climatology of West Antarctic atmospheric rivers
To determine the frequency of ARs over the Amundsen Sea Embayment and Marie Byrd Land region, we divide the number of AR times by the total time for each year from 1980 to 2020 then take the mean. Our analyses show that ARs exhibit a total frequency of 3.2 % over the whole region from 1980 to 2020 (i.e., on average there is an AR making landfall somewhere in the region 3.2 % of the time). Within the region, localized AR frequencies range from 0.2 % to 0.8 % of the time, with the highest frequencies over the Abbot Ice Shelf and the Getz Ice Shelf (Fig. 2a). Integrated over the entire region, ARs contribute 59 ± (1 standard deviation) 24 Gt precipitation annually (out of 550 ± 63 Gt total annual precipitation, Figs. 2b and c and 3c), and explain 28.7 % of the interannual variability in precipitation (linear trends removed). The correlation between AR precipitation and the total annual precipitation is moderately positive, with the Pearson correlation coefficient r = 0.52 (p < 0.01, Fig. A1).
On average, there are 17 ± 5 AR events over the Amundsen Sea Embayment and Marie Byrd Land each year (Fig. 3a). From 1980 to 2020, there is a positive trend in AR events of +0.12 ± 0.06 events per year squared (p = 0.055), similar to the results from Wille et al. (2021), which also showed an increasing trend in AR frequency from 1980 to 2018 over the WAIS region. From 1995 to 2015, there is a marked trend of +0.32 ± 0.16 events per year squared (p = 0.059), indicating multi-decadal variability in the number of AR events embedded within the longer-term positive trend (this 20-year period is selected based on its high trend, low p value, and low standard error of 0.16 events per year squared). The mean duration of AR events in this region is 16.2 ± 13.9 h (Fig. 3b), which indicates that there is large variability in the duration of AR events. Throughout the study period, there were many short events that passed the AR detection threshold for only 3 h, while the longest detected durations after AR landfall occurred in 1985 and 2010, lasting 84 h. There is no statistically significant correlation between the number of AR events per year and their maximum, or mean, duration. Furthermore, there is no statistically significant seasonality to the number of AR events nor their duration over the Amundsen Sea Embayment and Marie Byrd Land.
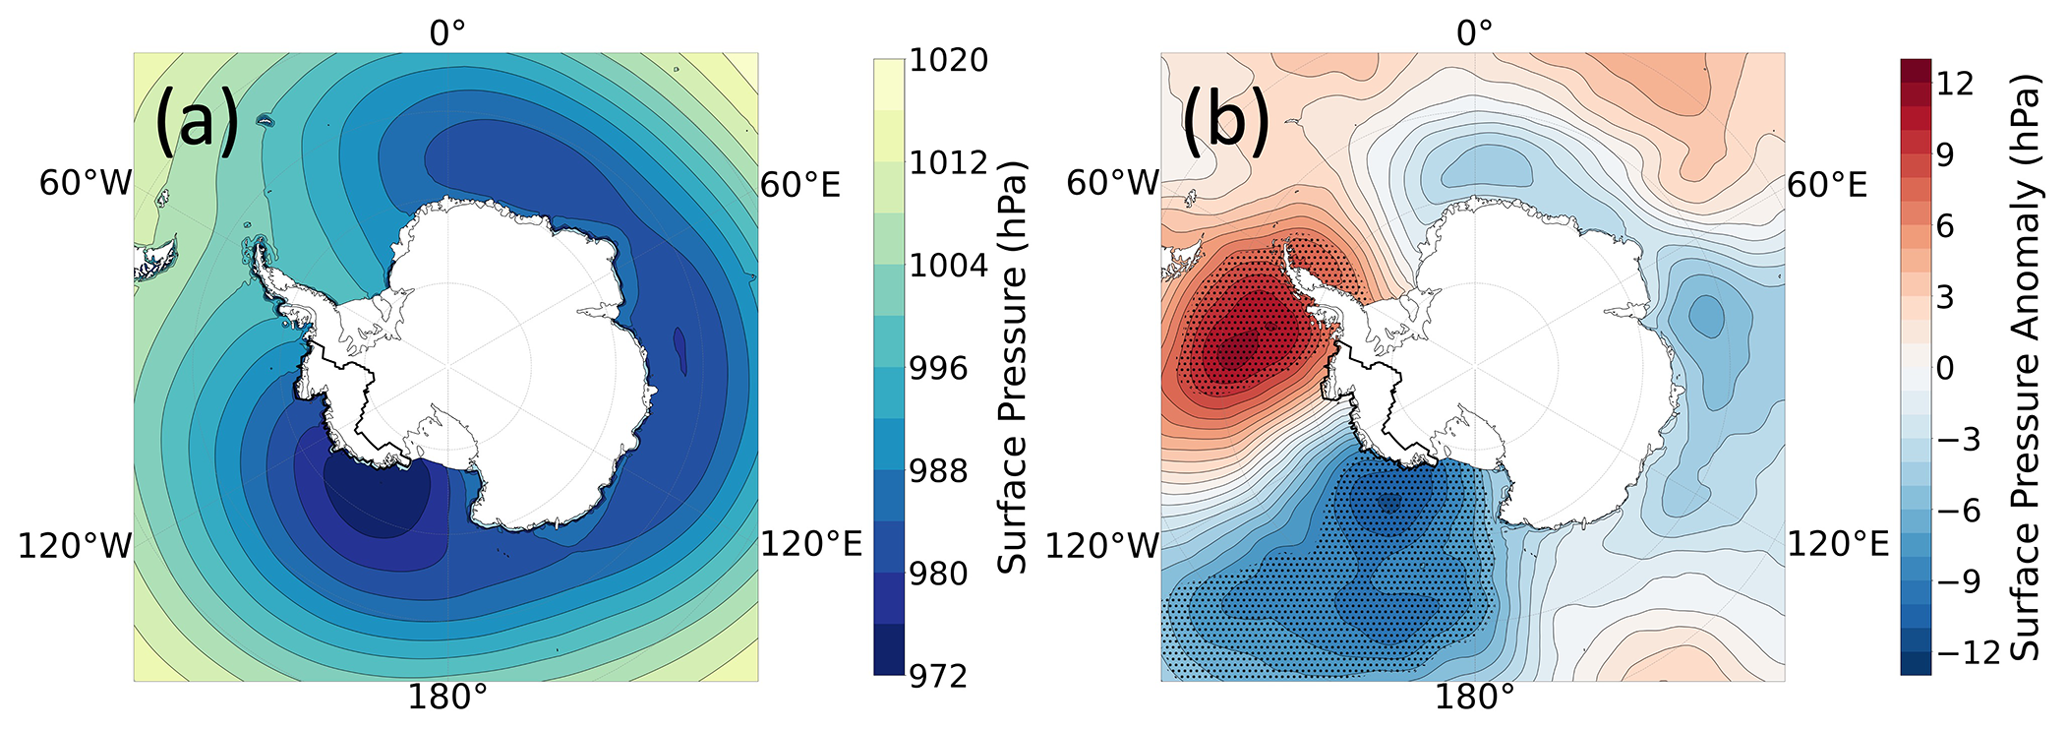
Figure 4MERRA-2 composite maps of (a) surface pressure and (b) surface pressure anomaly during AR landfall in the region of interest (the Amundsen Sea Embayment and Marie Byrd Land) which is outlined in black. Stippling on the surface pressure anomaly indicates regions of statistically significant anomaly, where the anomaly exceeds one half of the standard deviation from the mean surface pressure.
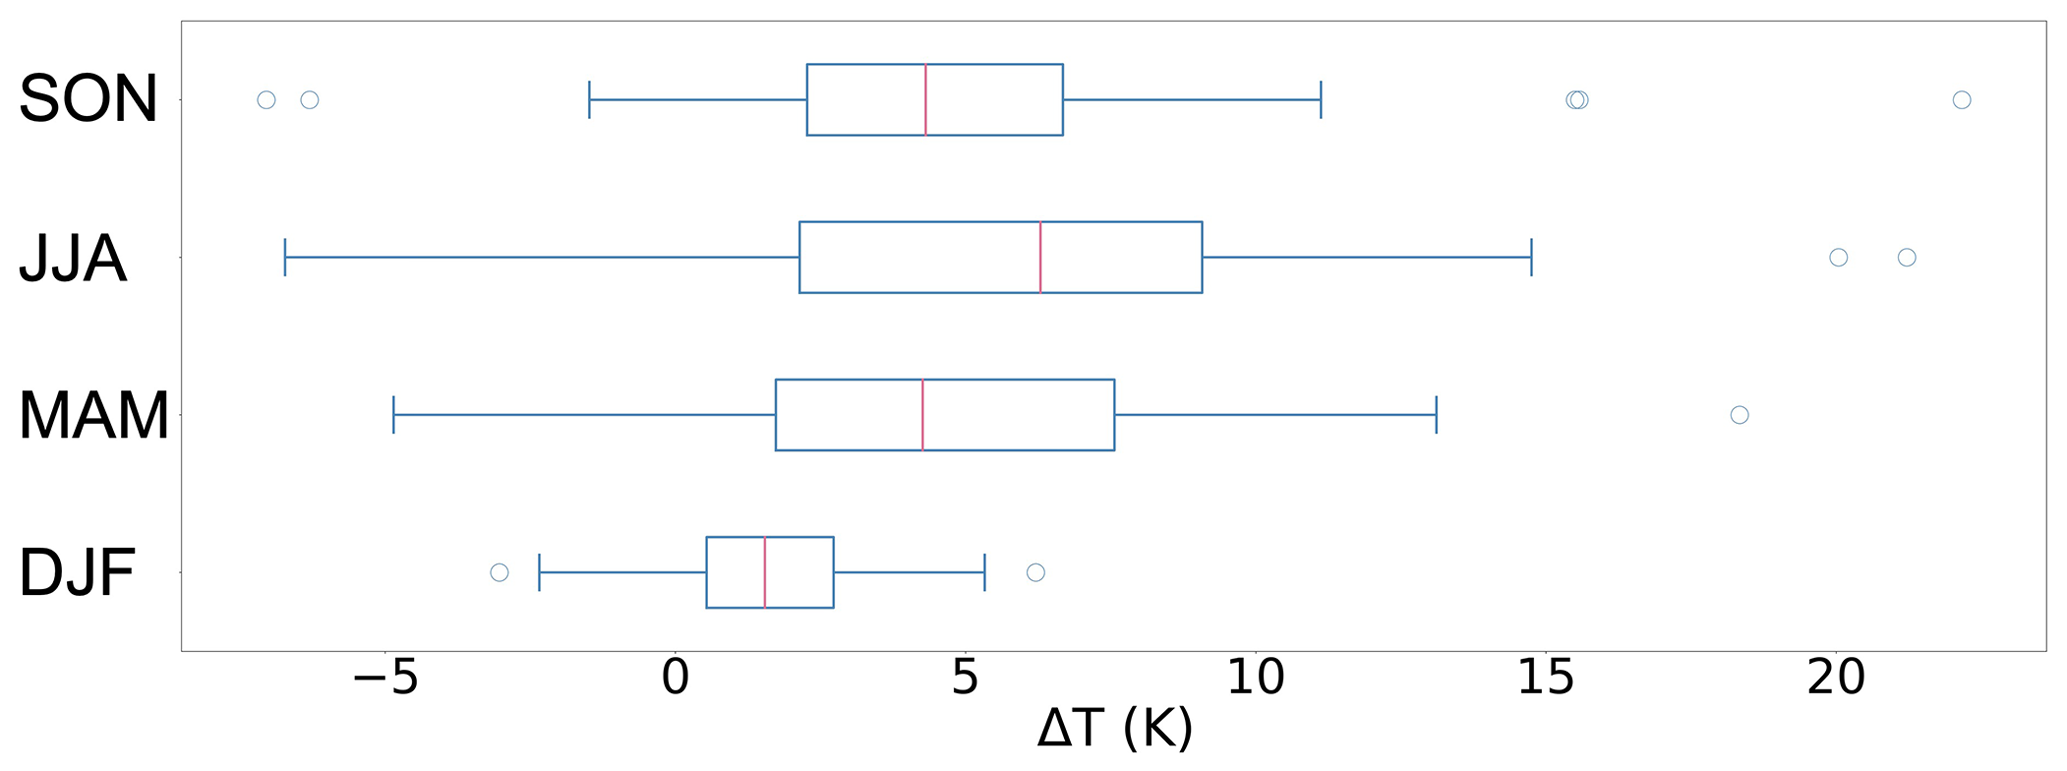
Figure 5MERRA-2 2 m temperature difference by season between the average temperature 24 h before AR landfall and the average temperature 24 h from AR landfall (post- minus pre-event) from MERRA-2 reanalysis over Thwaites Eastern Ice Shelf. Starting from the bottom, austral summer (December–January–February or DJF), fall (March–April–May or MAM), winter (June–July–August or JJA), and spring (September–October–November or SON). From left to right on each box plot: minimum, first quartile, median, third quartile, maximum. Outliers are represented as circles on the plot.
From the average surface pressure maps during AR events, we can identify that ARs in this region are driven by large-scale synoptic patterns involving the coupling of a blocking high and a low-pressure system (Fig. 4). In the surface pressure composite of all AR events on TG, we find that AR events are associated with a climatological low-pressure system, commonly referred to as the Amundsen Sea Low, located west of TG (Raphael et al., 2016). There is also a high pressure ridge extending southward from South America towards the Antarctic Peninsula. In the surface pressure anomaly composite, we see statistically significant high-pressure anomalies over the Antarctic Peninsula, signaling the presence of a blocking high during AR landfall on TG. We also observe statistically significant low-pressure anomalies in the region of the Amundsen Sea Low, west of TG. The blocking high serves to inhibit the zonal flow of low-pressure systems and directs circulation towards the Amundsen Sea Embayment and Marie Byrd Land. Furthermore, the surface pressure anomaly composite shows a zonal wave tree-like structure of alternating high- and low-pressure anomalies surrounding the AIS (Raphael, 2004).
To further examine the impacts of AR landfalls on TG surface conditions, we calculate the change in surface temperatures on Thwaites Eastern Ice Shelf during AR events (Fig. 5). To do this, we take the difference between the mean MERRA-2 2 m temperature 24 h before landfall and the mean 2 m temperature 24 h after landfall. Atmospheric river events are associated with a temperature increase of 1.4 K (first quartile) to 7.1 K (third quartile), with a median of 3.8 K over Thwaites Eastern Ice Shelf over all seasons. In austral summer (December–January–February), the median temperature increase is the smallest at 1.5 K. In fall (March–April–May), winter (June–July–August), and spring (September–October–November), the median temperature increases associated with AR landfall are 4.3, 6.3, and 4.3 K, respectively. The increase in surface temperatures is associated with temperature advection and increased downwelling longwave radiation during AR landfall (Wille et al., 2019). Here, we see the largest increases in temperature associated with the landfall of winter AR events. There are many more summer events where 2 m temperatures exceed the melting point of 273.15 K (six events in 1980–2020) than in fall (two events), winter (one event), and spring (0 events). While winter AR events are associated with the largest median and maximum temperature increases during AR landfall, they are also associated with the largest standard deviation in temperature changes (± 5.0 K), and some winter events exhibit a decrease in temperature from the mean 24 h before landfall to the mean 24 h after landfall.
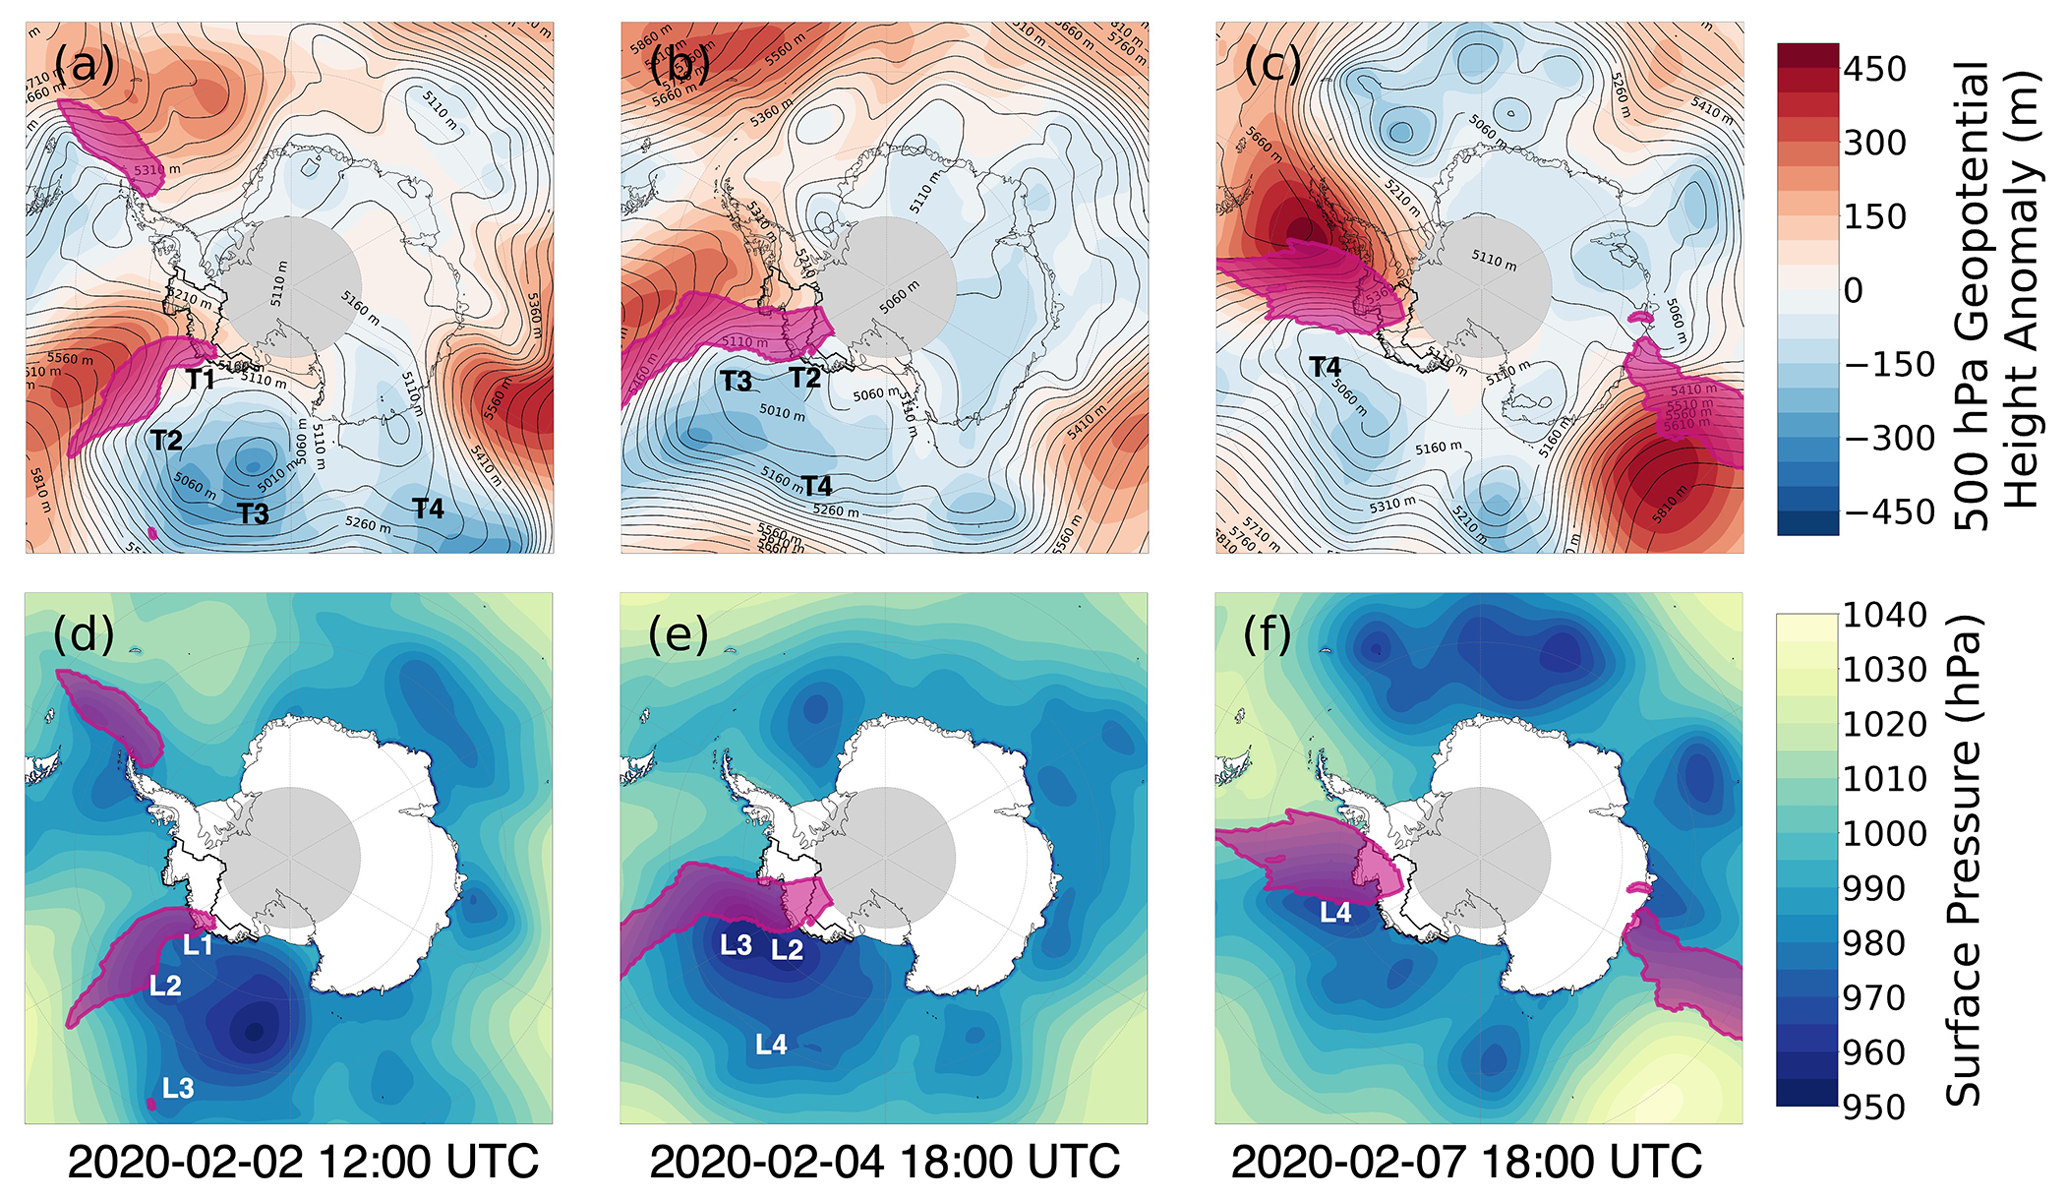
Figure 6Three ARs make landfall on TG in short succession on (a, d) 2 February, (b, e) 4 February, and (c, f) 7 February 2020. (a–c) MERRA-2 500 hPa geopotential heights (contours) and height anomaly (colors) during each AR landfall. (d–f) MERRA-2 surface pressure (colors) during each AR landfall. In each panel, the AR detection catalogue by Wille et al. (2021) indicates the spatial footprint of the ARs in pink. The location of shortwave troughs (geopotential height) and associated nodes in the low-pressure system (surface pressure) are indicated in each panel. Trough 1 (T1) drives Low 1 (L1), T2–L2, T3–L3, and T4–L4.
3.2 Case study: atmospheric river surface impacts on Thwaites Glacier
The geometry and orientation of TG render it highly susceptible to synoptic flow-induced snow storms caused by ocean air masses that are driven from the Southern Ocean into the Amundsen Sea sector. When air masses rise up the slope of TG, the water vapor in marine air masses condenses, leading to orographic intensification of precipitation. With two AMIGOS installed on Thwaites Eastern Ice Shelf in January 2020, we are now able to examine unique in situ atmospheric conditions during AR landfalls on Thwaites Eastern Ice Shelf. Case studies such as the February 2020 family of ARs can bring insight into the hydroclimate dynamics responsible for the West Antarctic AR climatologies and quantify examples of SMB impacts.
In February 2020, a family AR event occurred over TG over a period of 5 d, involving the landfall of three distinct ARs in rapid succession. The event began on 2 February, when the first AR made landfall on the western flank of the glacier for 6 h (Fig. 6a and d). A second AR made landfall shortly after, from 3 to 5 February, propagating from west to east across TG (Fig. 6b and e). A third AR made landfall from 7 to 8 February, on the eastern flank of TG (Fig. 6c and f). This AR family event was associated with a persistent high-pressure ridge extending from South America to the Antarctic Peninsula, coupled with a broad low-pressure system northwest of TG. This blocking high acted to keep the low pressure in place, preventing its zonal migration.
During this time, several distinct sea-level pressure minima (nodes) developed within the broader surface low-pressure system, which were associated with the passage of short-wave troughs in the middle troposphere (Fig. 6a–c). Short-wave troughs promote enhanced divergence in the middle troposphere and the subsequent development of localized sea-level pressure minima. These nodes facilitated the formation of ARs along the eastern edge of the broader surface low by enhancing the meridional transport of marine air masses southward. In particular, the first AR is driven by two nodes embedded within the broader surface low-pressure system, L1 and L2, which were associated with short-wave troughs T1 and T2. Subsequently, L1 and T1 dissipate, with the second AR driven by L2 and L3. The development of L3 can be tied to a separate short-wave trough (T3) that propagated around the broader upper-level trough prior to the second AR. The third AR is driven exclusively by L4, which is associated with another short-wave trough (T4) that can be tracked from off the coast of East Antarctica on 2 February to TG on 7 February. Coincident with this family of ARs, a persistent ridge of high pressure, known as a blocking high, forms downstream of the broader surface low-pressure system. The coupling of the high- and low-pressure systems channels each AR into the Amundsen Sea Embayment and onto TG, leading all three ARs to make landfall at the same location. The release of latent heat due to condensation and deposition within each AR amplifies the mid-tropospheric geopotential height anomalies, reinforcing the blocking high in a positive feedback cycle. This evolution permits multiple AR events to occur in rapid succession, as seen in this case study of the February 2020 AR family event.
On Thwaites Eastern Ice Shelf, we observe distinct signals in the AMIGOS surface pressure, as well as near-surface air temperature, wind direction, and wind speed during the AR family event (Fig. 7). From the onset of the first AR, near-surface temperatures increase to the melting point and remain consistently at or above the melting point in observations and ERA5 (MERRA-2 remains below the melting point) for the entire duration of the AR family event. The observed surface pressure repeatedly drops during the AR events, indicating the onset of new low-pressure system nodes associated with and reinforcing each AR. The wind direction experiences rapid changes before the first AR event, and after the third, and shifts to the north during the events. This reflects the synoptic pattern of northerly flow onto TG between the low-pressure system and blocking high. The wind speed accelerates during the first and second events, then drops and rises once more during the third AR landfall.
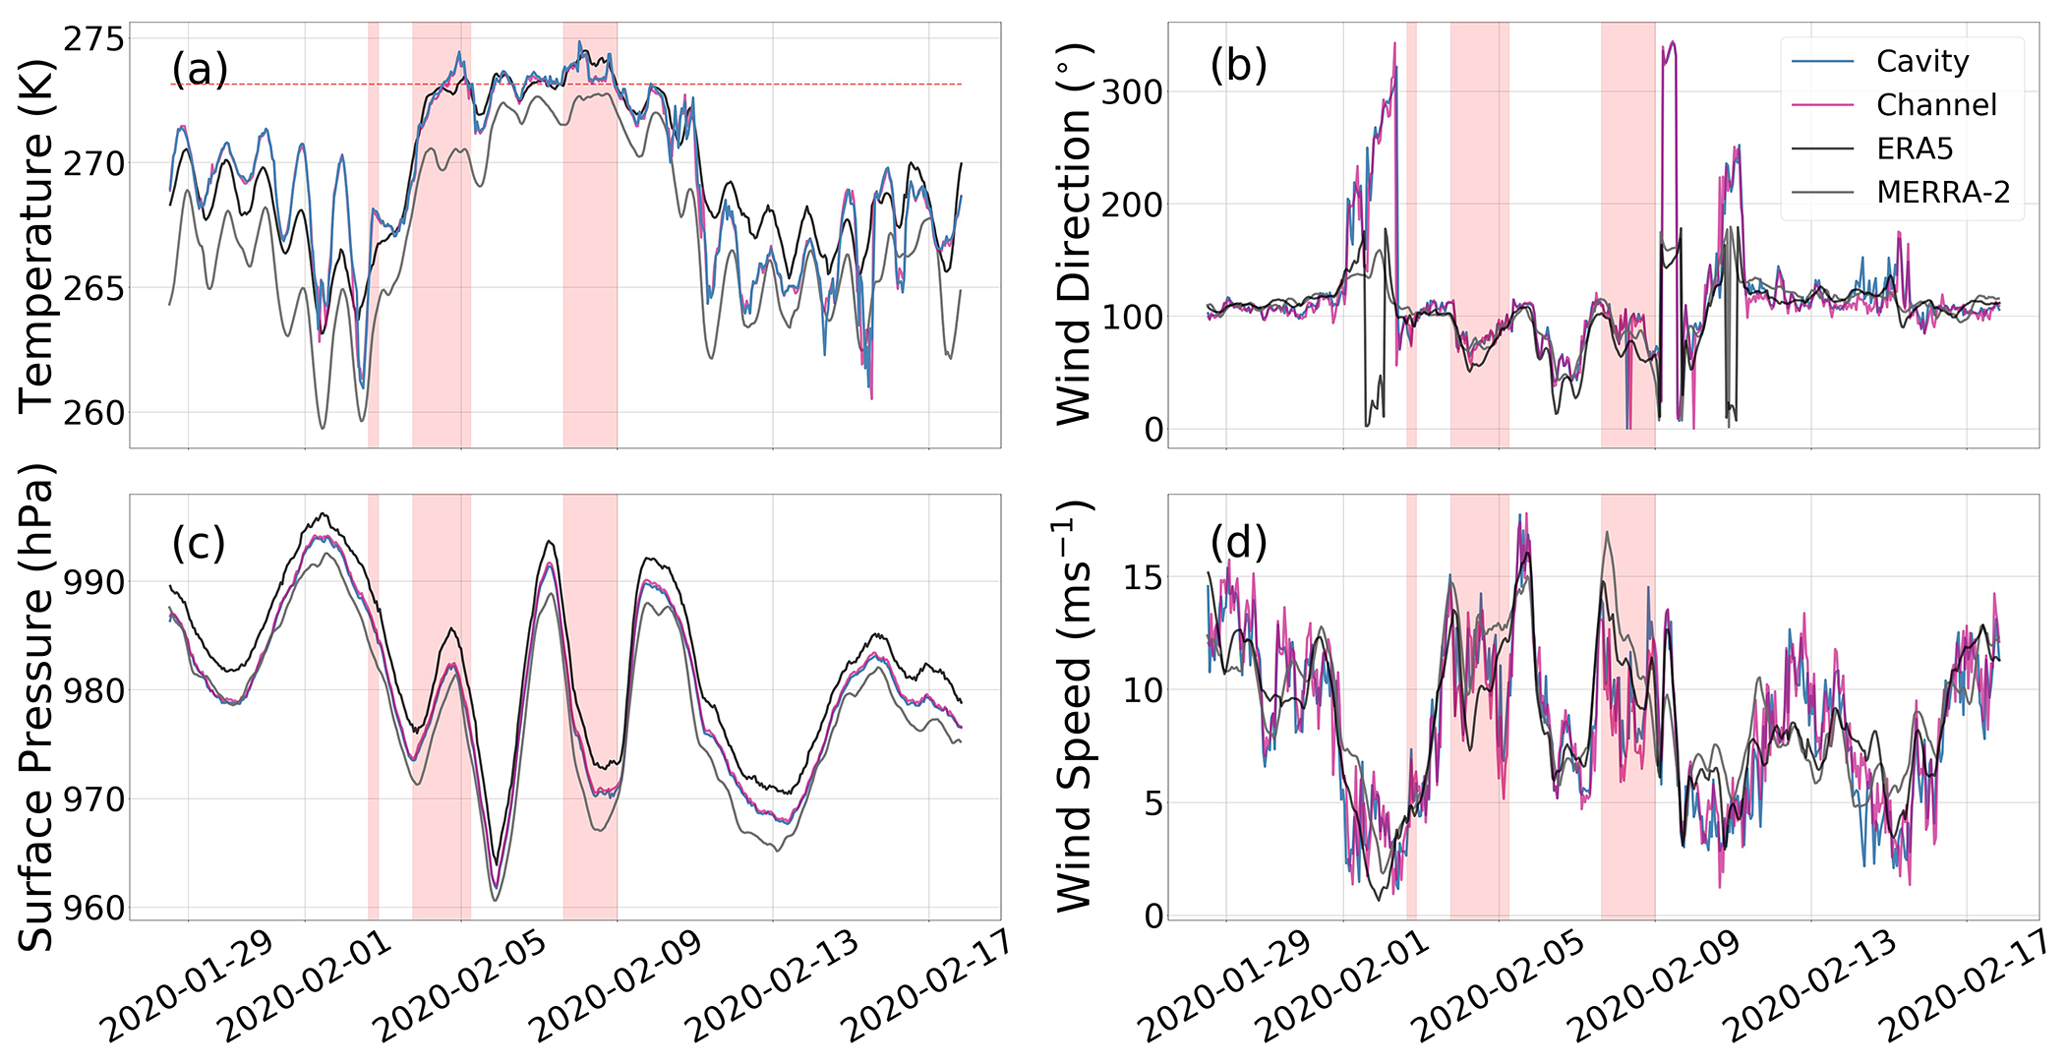
Figure 7Observations of (a) 2 m temperature, (b) wind direction, (c) surface pressure, and (d) wind speed during the AR family event from AMIGOS at Cavity Camp (blue) and Channel Camp (pink) sites, and MERRA-2 (gray) and ERA5 (black) reanalyses. Pink shading indicates the timing of the AR events, based on the Wille et al. (2019) AR detection algorithm.
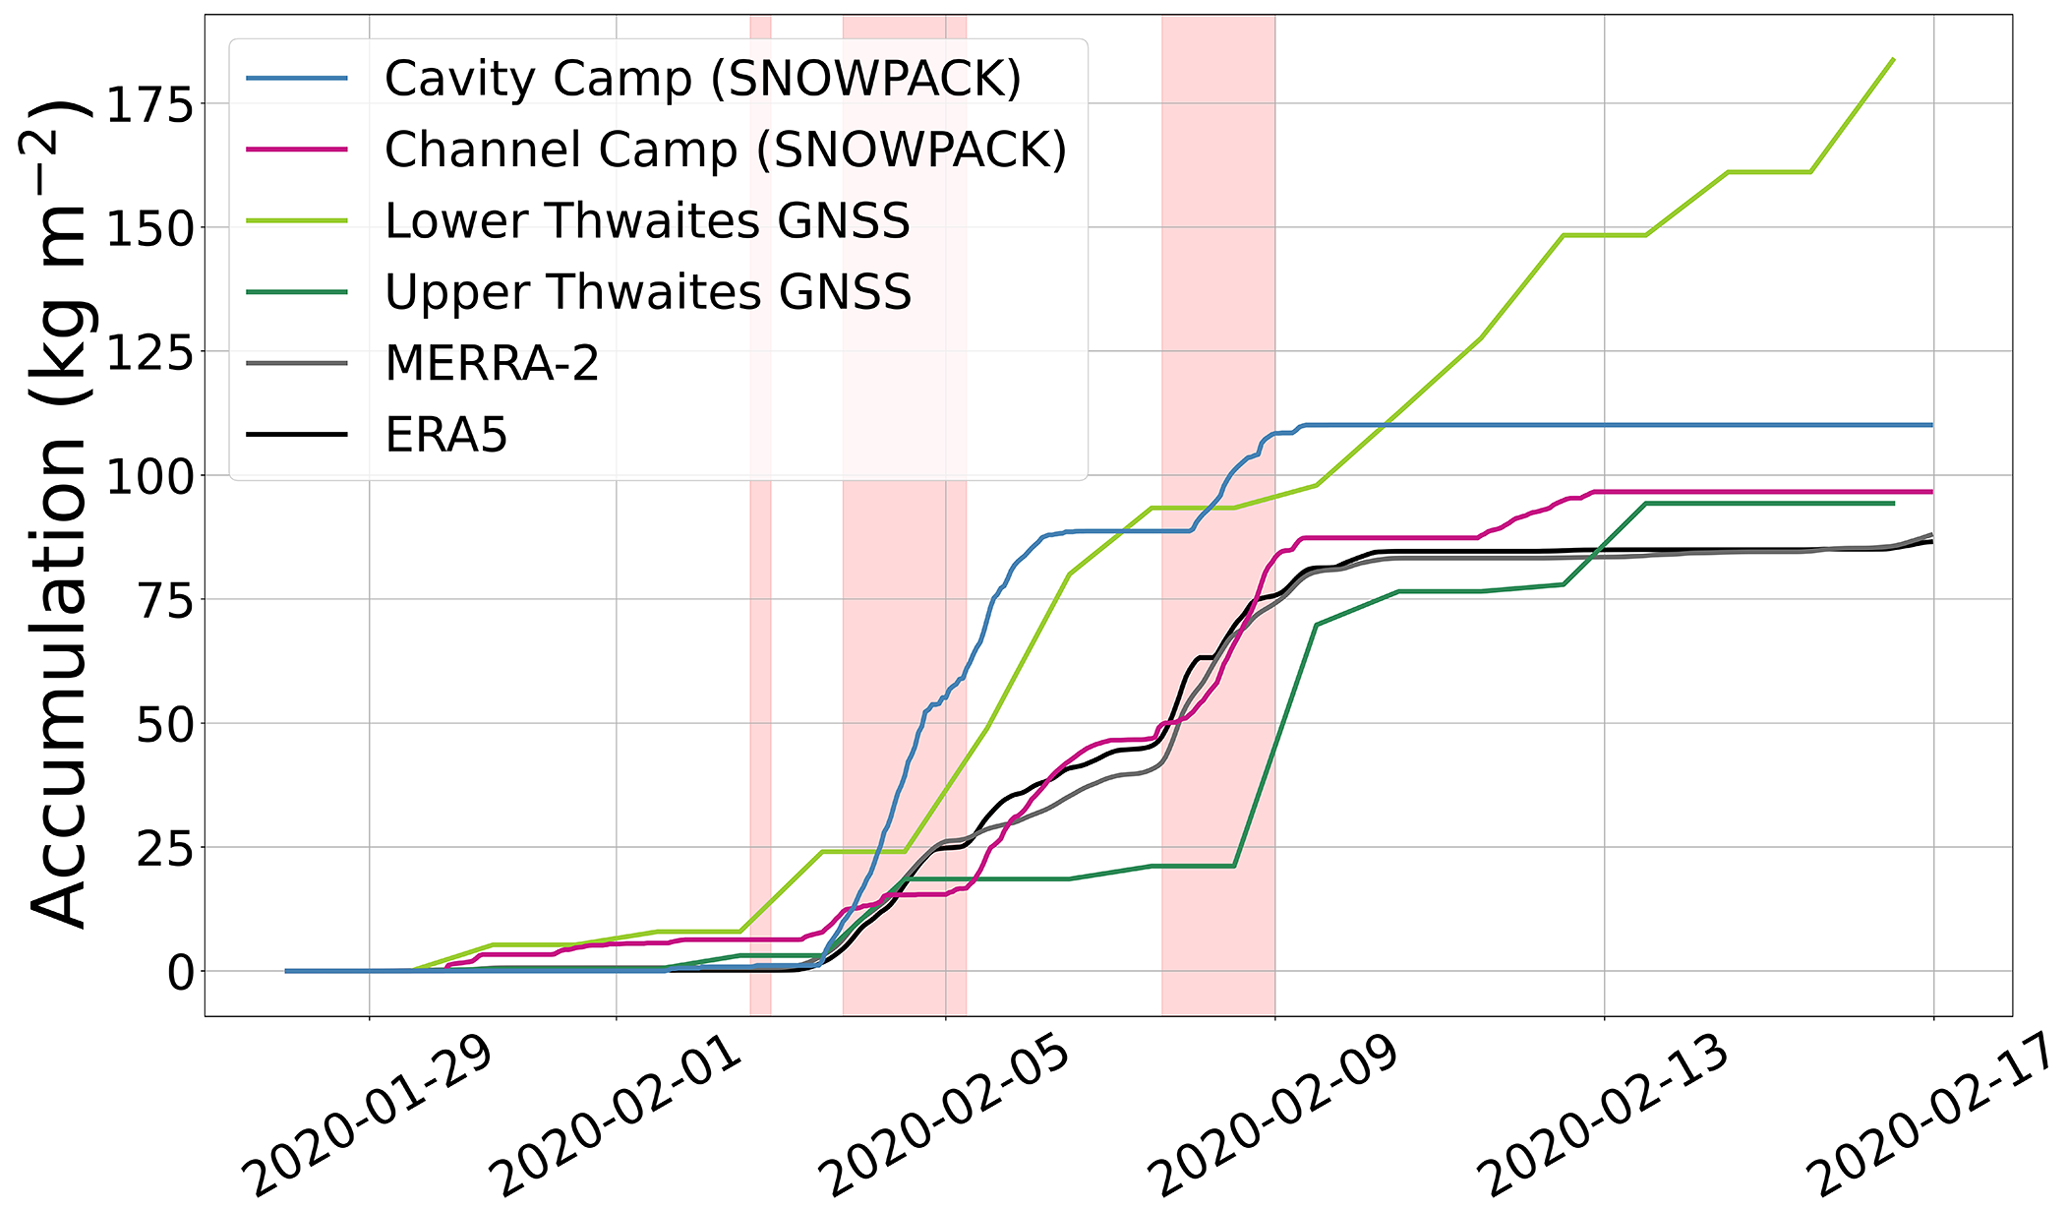
Figure 8Reconstructed accumulation at Cavity Camp (blue) and Channel Camp (pink) sites on Thwaites Eastern Ice Shelf during the AR family event. AMIGOS observations of snow height and atmospheric conditions are used to force SNOWPACK with radiation provided by MERRA-2. Light purple and dark purple lines show GNSS–IR-derived accumulation at Lower Thwaites and Upper Thwaites, respectively. We also show accumulation only from MERRA-2 (gray) and ERA5 (black). Pink shading indicates the timing of the AR events.
Next, we examine the impacts of the February 2020 AR family event on the SMB of Thwaites Eastern Ice Shelf (Fig. 8). From our SNOWPACK firn modeling analysis, which converted observed snow heights into accumulation associated with the AR family event, we find a total accumulation of 110 kg m−2 (or millimeters water equivalent) at Cavity Camp and 97 kg m−2 at Channel Camp. A rapid increase in accumulation occurs at the onset of the first AR, and continues through the third AR. During this event, Cavity Camp exhibits earlier and higher total accumulation than Channel Camp, possibly due to local topographical differences between the two sites on Thwaites Eastern Ice Shelf. The SNOWPACK-reconstructed accumulation at each site is very similar when using MERRA-2 or ERA5 radiative forcing.
When we compare the SNOWPACK-reconstructed accumulation with the accumulation in MERRA-2 and ERA5 reanalyses, we find that both reanalyses slightly underestimate the total accumulation during this time by 10 %–20 %. MERRA-2 accumulation is 88 kg m−2, ERA5 accumulation is 87 kg m−2. The total precipitation in 2020 is 1005 kg m−2 in MERRA-2 and 983 kg m−2 in ERA5, so this AR family event represents 9 % of the total annual precipitation in both reanalysis products. While the snow height observations at Cavity Camp and Channel Camp and represent point locations, the accumulation in the reanalyses represents a grid-cell average. Therefore, the reanalyses may partly underestimate local accumulation on Thwaites Eastern Ice Shelf, particularly during extreme events, due to the lower spatial resolution.
Based on the SNOWPACK analysis, we also find small amounts of surface melting associated with the AR family event (not shown). Alongside higher near-surface temperatures in ERA5 compared to MERRA-2 during the event, we find slightly higher amounts and longer duration of surface melt when we use ERA5 radiative forcing. When using MERRA-2 radiative forcing, we find 2 kg m−2 of surface melt at Cavity Camp and 1 kg m−2 of total melt at Channel Camp. When using ERA5 radiative forcing, we find 5 kg m−2 at Cavity Camp and 3 kg m−2 of total melt at Channel Camp. We find that the melt occurs for 34 h spread across 6 d at Cavity Camp with MERRA-2 radiative forcing and for 59 h spread across 11 d with ERA5 radiative forcing. At Channel Camp, the melt occurs for 26 h over 3 d with MERRA-2 forcing and for 46 h over 7 d with ERA5 forcing. Furthermore, thermistors placed 1.5 m above the battery box at the AMIGOS stations indicate a sub-surface increase in temperatures from −6 ∘C to the melting point coinciding with the second and third ARs in the AR family event. The rise in firn temperatures indicates surface meltwater percolation through the firn (Fig. A2). Overall, surface melt is nearly 2 orders of magnitude lower than the snowfall, indicating that the primary impact of this AR family event is to contribute snowfall to TG.
Throughout the AR family event, accumulation is consistently higher at the Lower Thwaites GNSS site than at the Upper Thwaites GNSS site (Fig. 8). Lower Thwaites experiences 184 kg m−2 total accumulation, and Upper Thwaites experiences 94 kg m−2 total accumulation. The difference in accumulation between the two sites may indicate that Lower Thwaites experiences more orographic precipitation than Upper Thwaites (the sites are 129 km apart and 304 m in vertical distance), and local topographical variation may contribute to the difference as well.
Atmospheric rivers transport large amounts of moisture from the mid-latitudes to high latitudes, leading to high snowfall events and elevated surface temperatures when they make landfall over the AIS. By combining the large-scale climatology of AR events on the Amundsen Sea Embayment and Marie Byrd Land with the case study of the surface impacts of an AR family event on TG, we aim to provide key insights on the nature and impacts of AR events in West Antarctica. In this study, we examine both the large-scale climatology of the West Antarctic ARs using the vIVT AR catalogue developed by Wille et al. (2021) and reanalysis products, and the local effects of a case study AR family event in February 2020 on Thwaites Eastern Ice Shelf using AMIGOS weather observations, the SNOWPACK firn model, GNSS–IR snow accumulation records, and temperature sensors in the firn. By combining large-scale reanalysis products with in situ data, we provide a detailed analysis of current AR impacts on the SMB of West Antarctica, enabling a discussion on how these effects may change in a future climate as well.
Using the Wille et al. (2021) AR detection algorithm based on vIVT, we are able to diagnose the local climatology of ARs making landfall over the Amundsen Sea Embayment and Marie Byrd Land. This algorithm is uniquely adapted to focus on polar regions, where cold and dry air allow for less atmospheric moisture than in the mid-latitudes, where most AR detection algorithms are currently focused (Rutz et al., 2019a). However, the Wille et al. (2021) algorithm relies on only one variable (vIVT) and one reanalysis (MERRA-2) to calculate the spatial footprints of ARs. Moreover, we currently do not have a method to validate the algorithm as most global AR detection algorithms do not capture ARs so far south, and even this algorithm is limited to latitudes above 80∘ S. Future developments in Antarctic-specific AR detection algorithms should bring in observations and more than one atmospheric variable to classify the presence of an AR.
We find that AR events making landfall in the Amundsen Sea Embayment and Marie Byrd Land are driven by the coupling of a blocking high over the Antarctic Peninsula with a low-pressure system known as the Amundsen Sea Low. This pressure anomaly pattern is similar to the Pacific South-American patterns identified by Scott et al. (2019) as drivers of marine air intrusions and West Antarctic surface melting; they are also consistent with geopotential height anomalies identified by Adusumilli et al. (2021) during the WAIS AR events in 2019. While ARs are infrequent, they cause intense precipitation in short periods of time, accounting for 11 % of the annual surface accumulation in this region, consistent with Wille et al. (2021). There are 17 ± 5 AR events occurring over the Amundsen Sea Embayment and Marie Byrd Land each year with a mean duration of 16 h. The total snowfall on TG and the top 10 % highest snowfall days (1980–2015) exhibit strong seasonality, with 2 to 3 times as much snowfall occurring in the fall, winter, and spring seasons when compared to the austral summer (Maclennan and Lenaerts, 2021). AR events, however, which explain up to 10 % of extreme snowfall events on the Amundsen Sea Embayment and Marie Byrd Land (Wille et al., 2021), exhibit no statistically significant seasonality in the number of AR events. This indicates that there are relatively more AR events making landfall over the AIS in the austral summer when compared to the top 10 % of snowfall events, or the total snowfall, than in the fall, winter, and spring seasons. This difference may be explained to some extent by the greater baroclinicity of the atmosphere over the Southern Ocean and AIS in the shoulder seasons, which may enhance the poleward transport of extra-tropical cyclones and the resulting occurrence of winter storm events not associated to ARs (Van Den Broeke, 1998). ARs are rare, and since 90 % of extreme snowfall days are not associated with ARs detected by the Wille et al. (2021) vIVT algorithm, it is crucial to consider the role of non-AR storm events in contributing to the SMB of TG as well.
Global reanalyses, including MERRA-2 and ERA5, are employed at modest horizontal resolutions, and parameterize precipitation rates, likely leading to an underestimation of extreme local precipitation on the AIS. Furthermore, to attribute precipitation to ARs, we quantify precipitation directly beneath the spatiotemporal footprint of the AR as detected by the Wille et al. (2021) algorithm, up to 24 h after landfall, which likely underestimates the true footprint of the AR. Therefore, in situ observations can provide more accurate information on the local amounts of snowfall associated with AR landfall over the AIS. While short in time (lasting only 1.5 years from the date of installation), the AMIGOS weather observations are key to diagnosing the surface impacts of the AR case study event in our study.
We present a case study of an AR family which was marked by a series of three distinct ARs making landfall over TG in rapid succession from 2 to 8 February. During this AR family event, the AMIGOS indicate a large increase in snow height (0.3 m) on Thwaites Eastern Ice Shelf. We use the SNOWPACK model to quantify the amount of mass added to the surface during the AR family event by reconstructing accumulation based on AMIGOS-observed surface height changes. This approach represents the essential role of firn modeling in converting observed surface height change to mass change on Antarctica. We find that accumulation dominates the SMB impacts of the event, with 110 and 97 kg m−2 of snowfall at Cavity Camp and Channel Camp, respectively. Combining SNOWPACK-reconstructed accumulation on Thwaites Eastern Ice Shelf with GNSS–IR snow accumulation records on TG adds a spatial component to the observed snowfall. During the case study event, we see the highest accumulation at Lower Thwaites GNSS, followed by Cavity Camp and Channel Camp on Thwaites Eastern Ice Shelf and then Upper Thwaites GNSS. This is consistent with Maclennan and Lenaerts (2021), who found that based on reanalyses MERRA-2 and ERA5, orographic precipitation on TG is highest in the region of steepest surface slopes, at the lower part of the glacier. We find that using in situ observations is necessary to capture the full surface impacts of AR events, particularly to quantify accumulation, which is underestimated by reanalyses during the case study event. However, among all of the in situ observations (AMIGOS and GNSS–IR) and even with satellite altimetry (Adusumilli et al., 2021), the problem of converting surface height change to mass change remains, amplifying the need for firn modeling to observe glaciological changes on TG.
From MERRA-2 reanalysis, we find that ARs over TG are associated with a 1.4 to 7.1 K temperature increase when they make landfall over Thwaites Eastern Ice Shelf. The largest temperature increases during AR landfall are in the winter months (June–July–August). There are steep temperature inversions present over the AIS in winter, so a disruption in the near-surface atmospheric stability by AR events may be the driving factor for the large temperature increase (Phillpot and Zillman, 1970). The occurrence of summer ARs, however, is critically important for the SMB and firn health of the AIS. As surface-based temperature inversions are least developed in austral summer, and air temperature is higher than in other seasons, the baseline surface temperatures before AR events are nearest the melting point in summer. When AR events make landfall and further raise surface temperatures through latent heat release and downwelling longwave radiation, they can cause surface melting on the AIS by raising temperatures to or above the melting point (Wille et al., 2019). While ARs currently act as a net positive to the SMB of the AIS, future increases in surface temperatures may lead to larger-scale surface melting events, firn air depletion, and runoff.
From AMIGOS atmospheric observations on Thwaites Eastern Ice Shelf during the case study AR family event in February 2020, we observe a rapid increase in near-surface temperatures during the first two ARs, and temperatures remain at the melting point for the following 5 d. When comparing the observations to reanalyses, we find that MERRA-2 underestimates near-surface temperatures during the event, while ERA5 shows more realistic temperatures. This highlights the need for in situ observations – using only MERRA-2 reanalysis, we may not have seen the indication that the AR family caused surface melting on Thwaites Eastern Ice Shelf. When examining the long-term impacts of ARs on the surface and firn of the AIS, we cannot only rely on reanalysis, especially MERRA-2, to capture the full range of surface temperatures during AR events. To quantify surface melting during the AR family event using AMIGOS observations, we once again use SNOWPACK firn modeling. By forcing SNOWPACK with observed near-surface temperatures, we find 2 to 5 kg m−2 of melt at Cavity Camp and 1 to 3 kg m−2 of melt at Channel Camp (when using MERRA-2 and ERA5 radiative forcing). Furthermore, AMIGOS temperature sensors 1 m below the surface indicate a sudden temperature rise due to meltwater percolation in the firn.
The greatest limitations to the in situ weather observations are spatial and temporal coverage. The AMIGOS captured hourly atmospheric data on Thwaites Eastern Ice Shelf for only 1.5 years, after which data collection stopped due to high winds on Thwaites Eastern Ice Shelf. These data provide a ground truth for surface conditions and impacts of weather events, including but not limited to ARs. The GNSS–IR records of accumulation span the last 2 decades, providing an accumulation record that we can compare to the AMIGOS observations and reanalysis. Still, with limited temperature observations on Thwaites Eastern Ice Shelf, and no measurements of atmospheric radiative fluxes, we have extremely limited information on the state of the firn on the ice shelf and TG. Therefore, firn modeling is critical in quantifying both accumulation and melt during AR events, because it can inform us about snow density and compaction rate, surface melt, snow redistribution, and sublimation – processes that all affect observed surface height change but are not easy to separate.
AR-driven surface melting will likely not lead to the destabilization of Thwaites Eastern Ice Shelf, particularly when compared to the pace and extent of current ocean-induced basal melting of the ice shelf. As seen during the case study event, snowfall dominates AR surface impacts by 2 orders of magnitude when compared to melt, and in general, surface temperatures rarely reach the melting point on Thwaites Eastern Ice Shelf. However, ARs represent an important contributor to the mass balance of TG. The snow accumulation and range near-surface temperatures associated with these extreme events have the largest impacts on the SMB and may affect feedbacks with ice dynamics on TG. If these extremes are amplified in the future climate, such as an increase in the frequency and/or intensity of ARs, we may observe more frequent surface melting in West Antarctica. This could seriously impact ice shelf stability, the ability of the firn layer to absorb meltwater, and ultimately the mass balance of the WAIS. In turn, changes in ice dynamics and surface height on TG may impact the location and intensity of AR-attributed orographic precipitation (Christian et al., 2022). Finally, surface melt is not only relevant for ice shelf stability and glacier mass balance – it matters for firn temperatures and air content, and glaciological observations of mass change of TG. Melt changes the thermal structure of the firn, and thus there are hidden impacts of surface melt that are not visible at the surface. This highlights the need to examine the representation of ARs in climate models and how their intensity, frequency, and SMB impacts may change in the future.
While AR events occur slightly more frequently over the Antarctic Peninsula and Dronning Maud Land than over the Amundsen Sea Embayment and Marie Byrd Land (Wille et al., 2021), the vulnerability of the latter region to ocean-induced ice mass loss and ice sheet instability amplifies the importance of quantifying accumulation and the interannual variability of AR events, as well as the modes of atmospheric variability driving their long-term trends (Shields et al., 2022), as a compensation mechanism for the mass loss. The long-term positive trend in the number of AR events and the shorter-term variability identified in this study underlines the importance of understanding how modes of atmospheric variability, especially the PSA2, and anthropogenic forcing are impacting AR activity in this region (Dalaiden et al., 2022). The longer the duration of the AR event, the more intense its impacts, as demonstrated in the case study of the extreme AR family event in February 2020. The baseline atmospheric temperature and the extent to which the AR raises surface temperatures play a key role in AR-driven surface melting in West Antarctica (Wille et al., 2019). While West Antarctica currently experiences minimal surface melting, most of which is absorbed by the firn, future-climate scenarios could exhibit more widespread surface melting in West Antarctica. Future warming in Antarctica many create a situation similar to the present-day Greenland Ice Sheet, where melting occurs at lower elevations and snowfall occurs at higher elevations during AR events, with a potential increase in AR-driven rainfall as well (Mattingly et al., 2018, 2020). Combined with the dynamic mass loss of West Antarctica, changes in AR–SMB impacts may affect the stability and mass balance of the WAIS. The observations of the case study AR event underline the importance of AR representation in modeled future climate scenarios, and analysis of how the frequency, duration, and intensity of AR events, and the occurrence of AR family events, may change in the future.
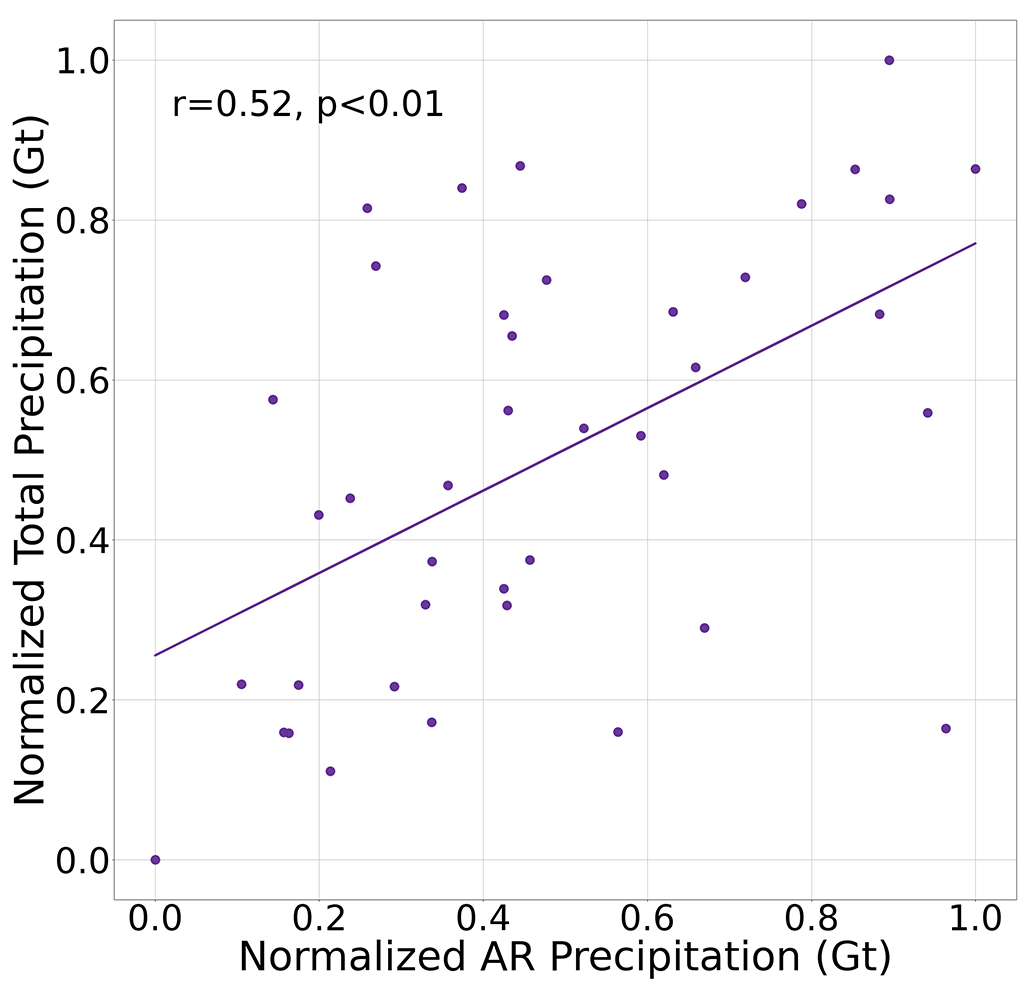
Figure A1Correlation between normalized annual AR precipitation and the normalized annual total precipitation over the Amundsen Sea Embayment and Marie Byrd Land. The Pearson correlation coefficient r = 0.52 (p < 0.01).
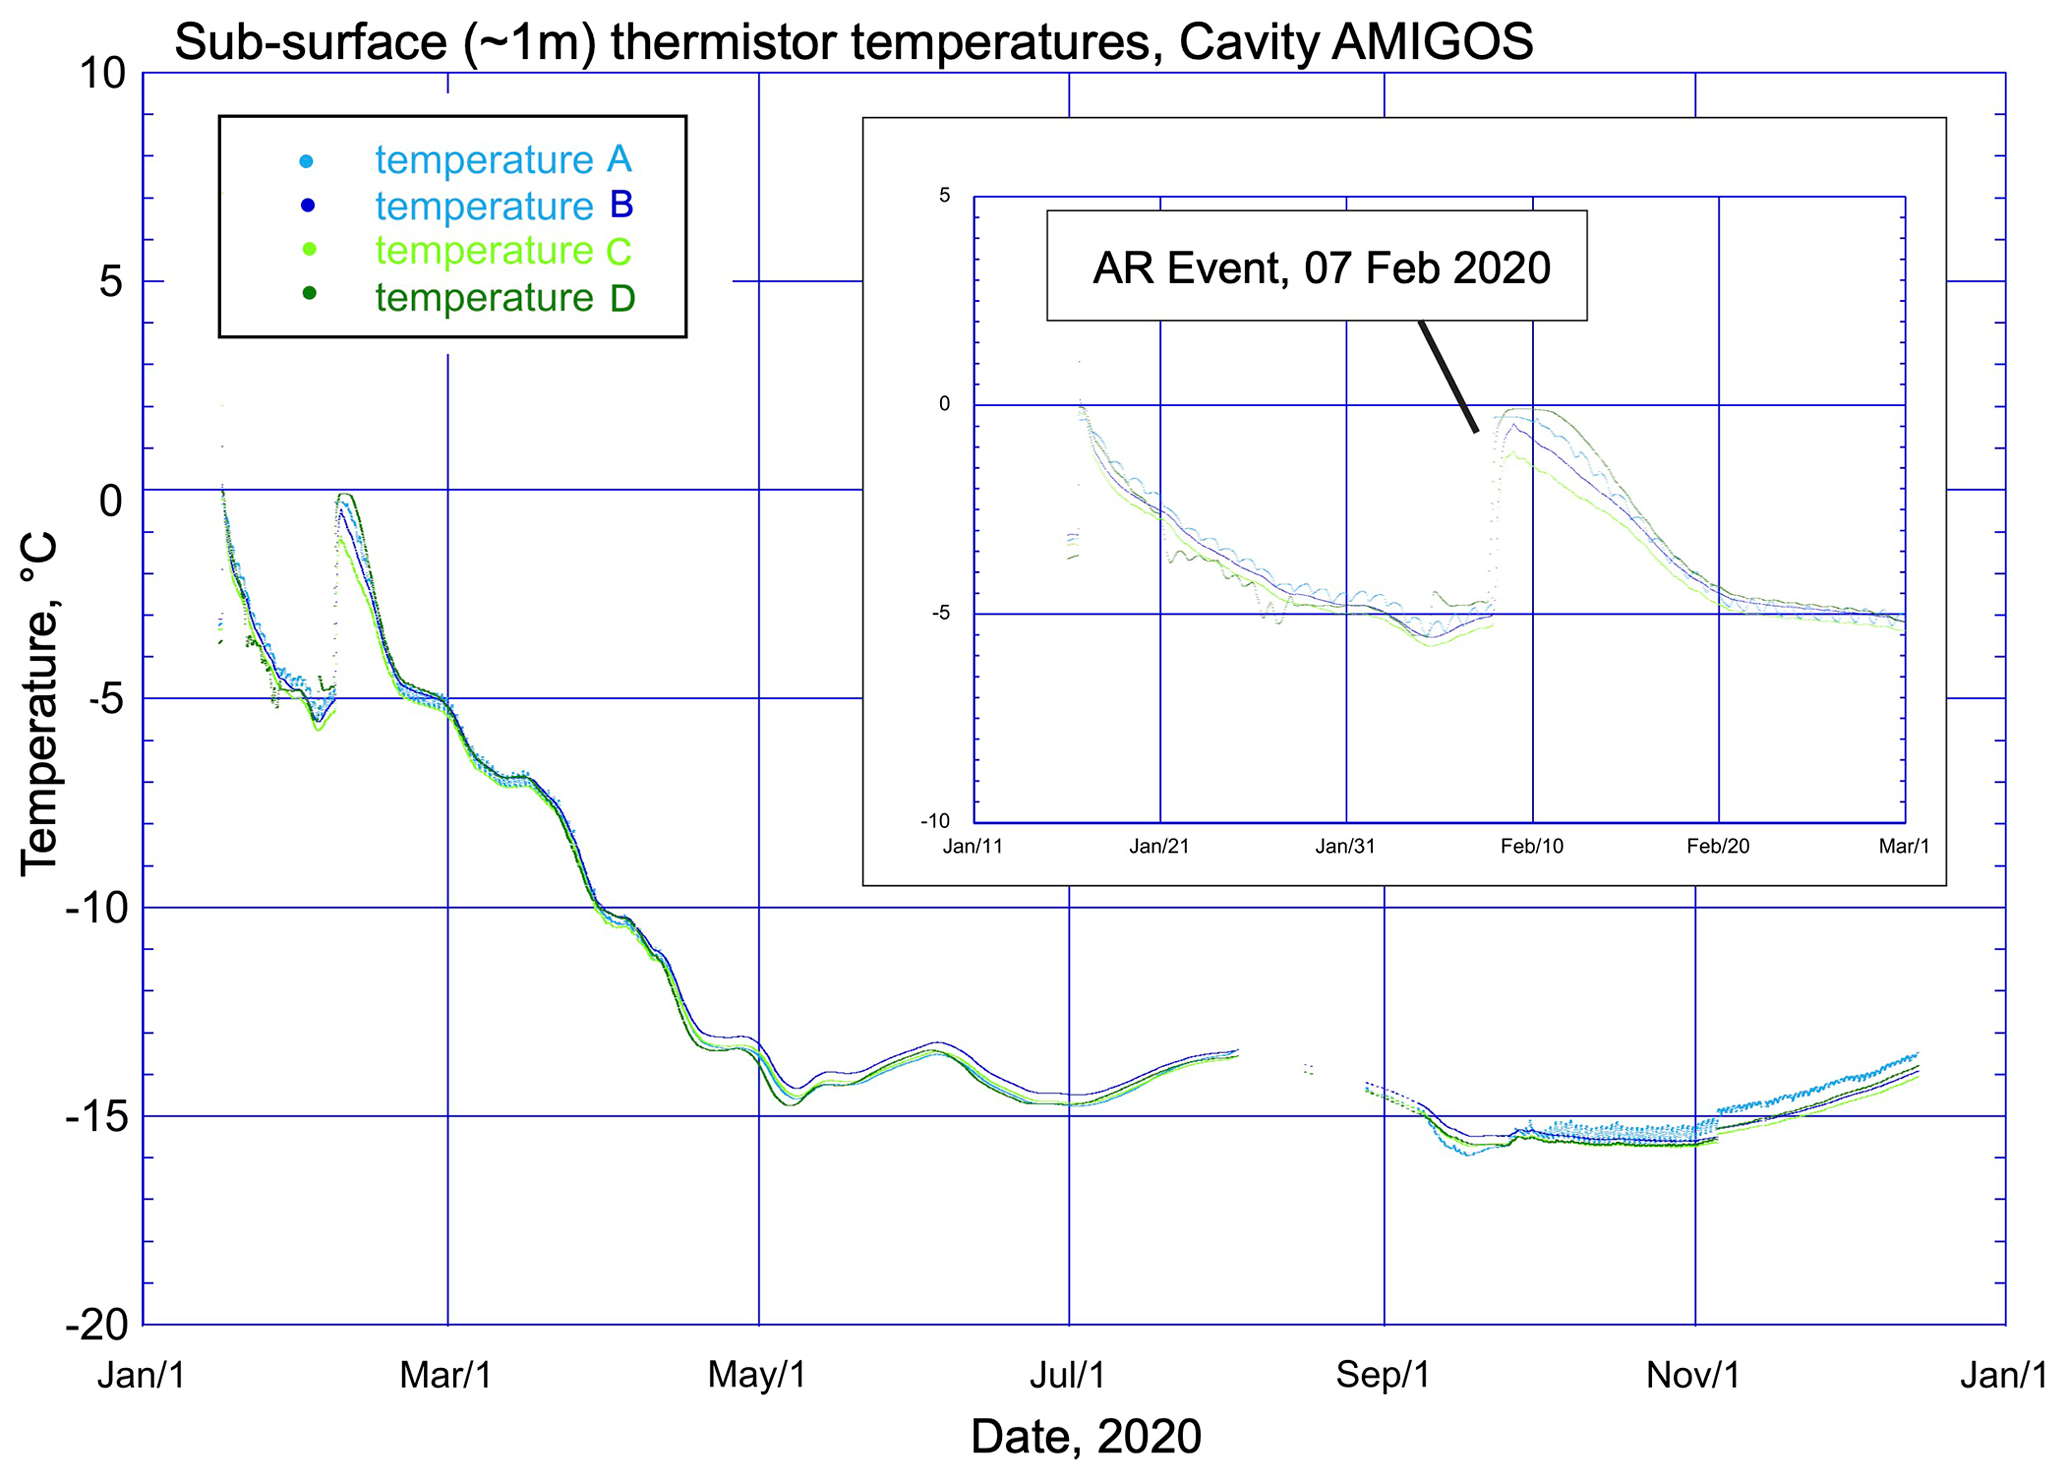
Figure A2Firn temperature time series during the February 2020 AR event from 4 thermistors (A–D), all placed 1 m below the surface at Cavity Camp.
The AMIGOS weather and snow height data are available from USAP-DC via DOI https://doi.org/10.15784/601552 (Scambos, 2022a) and https://doi.org/10.15784/601549 (Scambos, 2022b). MERRA-2 data are available through the Goddard Earth Sciences Data and Information Services Center at https://doi.org/10.5067/L0T5GEG1NYFA (GMAO, 2015). ERA5 data are available through the Copernicus Climate Data Store at https://doi.org/10.24381/cds.adbb2d47 (Hersbach et al., 2018). The Wille vIVT catalogue is available through the ARTMIP database, https://doi.org/10.5065/D62R3QFS (Rutz et al., 2019b; Shields et al., 2018). MeteoIO and SNOWPACK are software published under the GNU LGPLv3 license by the WSL Institute for Snow and Avalanche Research SLF, Davos, Switzerland at https://gitlabext.wsl.ch/snow-models/snowpack (WSL, 2022). The repository used to develop the versions of MeteoIO and SNOWPACK used in this study can be accessed via https://doi.org/10.5281/zenodo.7536784 (Wever et al., 2023), with the exact version corresponding to commit 149c586 (https://doi.org/10.5281/zenodo.7331794; Wever, 2022). The SNOWPACK model simulations are accessible via https://doi.org/10.5281/zenodo.7320237 (Wever, 2022). The GNSS–IR snow accumulation time series is available through the University of Washington's ResearchWorks Archive http://hdl.handle.net/1773/48595 (Hoffman and Christianson, 2022). Code used to derive GNSS–IR accumulation history is available at https://github.com/hoffmaao/thwaites-gnss-ir (Hoffman and Christianson, 2022).
MLM led the data analysis and writing. JTML assisted in data analysis and writing. CAS and JDW provided access to the atmospheric river detection catalogue and assisted in data analysis. ACW provided analysis of the synoptic meteorology during the case study event. AOH provided the GNSS–IR time series of snow accumulation on Thwaites Glacier. NW and MTM performed SNOWPACK modeling of the firn, driven by AMIGOS observations. TAS provided the AMIGOS data and led the associated fieldwork with ECP.
The contact author has declared that none of the authors has any competing interests.
Publisher's note: Copernicus Publications remains neutral with regard to jurisdictional claims in published maps and institutional affiliations.
This work is from the TARSAN project, a component of the International Thwaites Glacier Collaboration (ITGC) with support from the National Science Foundation (NSF: grant 1929991) and the Natural Environment Research Council (NERC: grant NE/S006419/1). Logistics were provided by the NSF-US Antarctic Program and NERC-British Antarctic Survey. ITGC Contribution No. ITGC-073.
We would like to recognize Tim White and Bruce Wallin for building and programming the AMIGOS-III units. We acknowledge the Colorado Space Grant at the University of Colorado for the undergraduate team that first integrated the new sensors to the AMIGOS-III system. Ronald Ross and Ted Scambos developed the earliest version of the AMIGOS concept. Finally, we thank the TARSAN field team for the installation of the AMIGOS on Thwaites Eastern Ice Shelf, including Christian Wild, Karen Alley, Gabriela Collao-Barrios, Atsuhiro Muto, Martin Truffer, Cecelia Mortenson, Blair Fyffe, and Dale Pomraning. We also acknowledge Antarctic Support Contractors/Leidos and Ken Borek Air.
We thank Sanne Veldhuijsen and two anonymous reviewers for providing constructive comments that helped to improve this paper considerably. We would also like to thank Devon Dunmire for her feedback on the SNOWPACK modeling section of this paper..
This research has been supported by the National Aeronautics and Space Administration (grant nos. 80NSSC21K1610 and 80NSSC20K1727), the National Science Foundation (grant nos. 1929991, 1947282, and 1738934), the Natural Environment Research Council (grant no. NE/S006419/1), the US Department of Energy (grant no. DE35 SC0022070), and the Agence Nationale de la Recherche (grant no. ANR-20-CE01-0013).
This paper was edited by Ruth Mottram and reviewed by Sanne Veldhuijsen and two anonymous referees.
Adusumilli, S., Fish, M., Fricker, H. A., and Medley, B.: Atmospheric River Precipitation Contributed to Rapid Increases in Surface Height of the West Antarctic Ice Sheet in 2019, Geophys. Res. Lett., 48, e2020GL091076, https://doi.org/10.1029/2020GL091076, 2021. a, b, c
Alley, K. E., Scambos, T. A., Siegfried, M. R., and Fricker, H. A.: Impacts of warm water on Antarctic ice shelf stability through basal channel formation, Nat. Geosci., 9, 290–293, https://doi.org/10.1038/ngeo2675, 2016. a
Alley, K. E., Wild, C. T., Luckman, A., Scambos, T. A., Truffer, M., Pettit, E. C., Muto, A., Wallin, B., Klinger, M., Sutterley, T., Child, S. F., Hulen, C., Lenaerts, J. T. M., Maclennan, M., Keenan, E., and Dunmire, D.: Two decades of dynamic change and progressive destabilization on the Thwaites Eastern Ice Shelf, The Cryosphere, 15, 5187–5203, https://doi.org/10.5194/tc-15-5187-2021, 2021. a
Bao, J. W., Michelson, S. A., Neiman, P. J., Ralph, F. M., and Wilczak, J. M.: Interpretation of Enhanced Integrated Water Vapor Bands Associated with Extratropical Cyclones: Their Formation and Connection to Tropical Moisture, Mon. Weather Rev., 134, 1063–1080, https://doi.org/10.1175/MWR3123.1, 2006. a
Bavay, M. and Egger, T.: MeteoIO 2.4.2: a preprocessing library for meteorological data, Geosci. Model Dev., 7, 3135–3151, https://doi.org/10.5194/gmd-7-3135-2014, 2014. a
Christian, J. E., Robel, A. A., and Catania, G.: A probabilistic framework for quantifying the role of anthropogenic climate change in marine-terminating glacier retreats, The Cryosphere, 16, 2725–2743, https://doi.org/10.5194/tc-16-2725-2022, 2022. a
Dacre, H. F., Clark, P. A., Martinez-Alvarado, O., Stringer, M. A., and Lavers, D. A.: How Do Atmospheric Rivers Form?, B. Am. Meteorol. Soc., 96, 1243–1255, https://doi.org/10.1175/BAMS-D-14-00031.1, 2015. a
Dalaiden, Q., Schurer, A. P., Kirchmeier-Young, M. C., Goosse, H., and Hegerl, G. C.: West Antarctic Surface Climate Changes Since the Mid-20th Century Driven by Anthropogenic Forcing, Geophys. Res. Lett., 49, e2022GL099543, https://doi.org/10.1029/2022GL099543, 2022. a
DeConto, R. M. and Pollard, D.: Contribution of Antarctica to past and future sea-level rise, Nature, 531, 591–597, https://doi.org/10.1038/nature17145, 2016. a
DeConto, R. M., Pollard, D., Alley, R. B., Velicogna, I., Gasson, E., Gomez, N., Sadai, S., Condron, A., Gilford, D. M., Ashe, E. L., Kopp, R. E., Li, D., and Dutton, A.: The Paris Climate Agreement and future sea-level rise from Antarctica, Nature, 593, 83–89, https://doi.org/10.1038/s41586-021-03427-0, 2021. a
Donat-Magnin, M., Jourdain, N. C., Gallée, H., Amory, C., Kittel, C., Fettweis, X., Wille, J. D., Favier, V., Drira, A., and Agosta, C.: Interannual variability of summer surface mass balance and surface melting in the Amundsen sector, West Antarctica, The Cryosphere, 14, 229–249, https://doi.org/10.5194/tc-14-229-2020, 2020. a
Dutrieux, P., De Rydt, J., Jenkins, A., Holland, P. R., Ha, H. K., Lee, S. H., Steig, E. J., Ding, Q., Abrahamsen, E. P., and Schröder, M.: Strong sensitivity of pine Island ice-shelf melting to climatic variability, Science, 343, 174–178, https://doi.org/10.1126/science.1244341, 2014. a
Fish, M. A., Done, J. M., Swain, D. L., Wilson, A. M., Michaelis, A. C., Gibson, P. B., and Ralph, F. M.: Large-Scale Environments of Successive Atmospheric River Events Leading to Compound Precipitation Extremes in California, J. Climate, 35, 1515–1536, https://doi.org/10.1175/JCLI-D-21-0168.1, 2022. a
Gehring, J., Vignon, É., Billault-Roux, A. C., Ferrone, A., Protat, A., Alexander, S. P., and Berne, A.: Orographic Flow Influence on Precipitation During an Atmospheric River Event at Davis, Antarctica, J. Geophys. Res.-Atmos., 127, e2021JD035210, https://doi.org/10.1029/2021JD035210, 2022. a
Gelaro, R., McCarty, W., Suárez, M. J., Todling, R., Molod, A., Takacs, L., Randles, C. A., Darmenov, A., Bosilovich, M. G., Reichle, R., Wargan, K., Coy, L., Cullather, R., Draper, C., Akella, S., Buchard, V., Conaty, A., da Silva, A. M., Gu, W., Kim, G. K., Koster, R., Lucchesi, R., Merkova, D., Nielsen, J. E., Partyka, G., Pawson, S., Putman, W., Rienecker, M., Schubert, S. D., Sienkiewicz, M., and Zhao, B.: The modern-era retrospective analysis for research and applications, version 2 (MERRA-2), J. Climate, 30, 5419–5454, https://doi.org/10.1175/JCLI-D-16-0758.1, 2017. a, b, c, d
GMAO – Global Modeling and Assimilation Office: MERRA-2 tavg1_2d_Ifo_Nx: 2d, 1-hourly, Time-Averaged, Single-Level, Assimilation, Land Surface Forcings V5.12.4, Greenbelt, MD, USA, Goddard Earth Sciences Data and Information Services Center (GES DISC) [data set], https://doi.org/10.5067/L0T5GEG1NYFA, 2015. a
Gorodetskaya, I. V., Tsukernik, M., Claes, K., Ralph, M. F., Neff, W. D., and Van Lipzig, N. P. M.: The role of atmospheric rivers in anomalous snow accumulation in East Antarctica, Geophys. Res. Lett., 41, 6199–6206, https://doi.org/10.1002/2014GL060881, 2014. a, b, c
Groot Zwaaftink, C. D., Cagnati, A., Crepaz, A., Fierz, C., Macelloni, G., Valt, M., and Lehning, M.: Event-driven deposition of snow on the Antarctic Plateau: analyzing field measurements with SNOWPACK, The Cryosphere, 7, 333–347, https://doi.org/10.5194/tc-7-333-2013, 2013. a
Hersbach, H., Bell, B., Berrisford, P., Biavati, G., Horányi, A., Muñoz Sabater, J., Nicolas, J., Peubey, C., Radu, R., Rozum, I., Schepers, D., Simmons, A., Soci, C., Dee, D., and Thépaut, J.-N.: ERA5 hourly data on single levels from 1959 to present, Copernicus Climate Change Service (C3S) Climate Data Store (CDS) [data set], https://doi.org/10.24381/cds.adbb2d47, 2018. a
Hersbach, H., Bell, B., Berrisford, P., Hirahara, S., Horányi, A., Muñoz-Sabater, J., Nicolas, J., Peubey, C., Radu, R., Schepers, D., Simmons, A., Soci, C., Abdalla, S., Abellan, X., Balsamo, G., Bechtold, P., Biavati, G., Bidlot, J., Bonavita, M., Chiara, G., Dahlgren, P., Dee, D., Diamantakis, M., Dragani, R., Flemming, J., Forbes, R., Fuentes, M., Geer, A., Haimberger, L., Healy, S., Hogan, R. J., Hólm, E., Janisková, M., Keeley, S., Laloyaux, P., Lopez, P., Lupu, C., Radnoti, G., Rosnay, P., Rozum, I., Vamborg, F., Villaume, S., and Thépaut, J.: The ERA5 global reanalysis, Q. J. Roy. Meteorol. Soc., 146, 1999–2049, https://doi.org/10.1002/qj.3803, 2020. a, b
Hoffman, A. and Christianson, K.: gnss-ir derived accumulation history at the GNSS sites LTHW, UTHW, and KHLR maintained by unavco and the polenet team, University of Washington ResearchWorks Archive [data set], http://hdl.handle.net/1773/48595, last access: 17 May 2022. a
Hoffman, A. O.: thwaites-gnss-ir, GitHub [code], https://github.com/hoffmaao/thwaites-gnss-ir, last access: 7 November 2022 a
Jacobs, S. S. and Hellmer, H. H.: Freshening Could Come From Other Melting Ice in the, Observatory, 23, 957–960, 1996. a
Jacobs, S. S., Jenkins, A., Giulivi, C. F., and Dutrieux, P.: Stronger ocean circulation and increased melting under Pine Island Glacier ice shelf, Nat. Geosci., 4, 519–523, https://doi.org/10.1038/ngeo1188, 2011. a
Joughin, I., Smith, B. E., and Medley, B.: Marine Ice Sheet Collapse Potentially Under Way for the Thwaites Glacier Basin, West Antarctica, Science, 344, 735–738, https://doi.org/10.1126/science.1249055, 2014. a
Keenan, E., Wever, N., Dattler, M., Lenaerts, J. T. M., Medley, B., Kuipers Munneke, P., and Reijmer, C.: Physics-based SNOWPACK model improves representation of near-surface Antarctic snow and firn density, The Cryosphere, 15, 1065–1085, https://doi.org/10.5194/tc-15-1065-2021, 2021. a, b, c
Lamjiri, M. A., Dettinger, M. D., Ralph, F. M., and Guan, B.: Hourly storm characteristics along the U. S. West Coast: Role of atmospheric rivers in extreme precipitation, Geophys. Res. Lett., 44, 7020–7028, https://doi.org/10.1002/2017GL074193, 2017. a
Larson, K. M., Gutmann, E. D., Zavorotny, V. U., Braun, J. J., Williams, M. W., and Nievinski, F. G.: Can we measure snow depth with GPS receivers?, Geophys. Res. Lett., 36, 17502, https://doi.org/10.1029/2009GL039430, 2009. a
Larson, K. M., Wahr, J., and Kuipers Munneke, P.: Constraints on snow accumulation and firn density in Greenland using GPS receivers, J. Glaciol., 61, 101–114, https://doi.org/10.3189/2015JOG14J130, 2015. a
Lavers, D. A. and Villarini, G.: The nexus between atmospheric rivers and extreme precipitation across Europe, Geophys. Res. Lett., 40, 3259–3264, https://doi.org/10.1002/GRL.50636, 2013. a
Lehning, M., Bartelt, P., Brown, B., Russi, T., Stöckli, U., and Zimmerli, M.: snowpack model calculations for avalanche warning based upon a new network of weather and snow stations, Cold Reg. Sci. Technol., 30, 145–157, https://doi.org/10.1016/S0165-232X(99)00022-1, 1999. a
Lehning, M., Bartelt, P., Brown, B., and Fierz, C.: A physical SNOWPACK model for the Swiss avalanche warning: Part III: meteorological forcing, thin layer formation and evaluation, Cold Reg. Sci. Technol., 35, 169–184, https://doi.org/10.1016/S0165-232X(02)00072-1, 2002. a, b
Lehning, M., Bartelt, P., Brown, B., Fierz, C., and Satyawali, P.: A physical SNOWPACK model for the Swiss avalanche warning: Part II. Snow microstructure, Cold Reg. Sci. Technol., 35, 147–167, https://doi.org/10.1016/S0165-232X(02)00073-3, 2002b. a, b
Lenaerts, J. T. M., Ligtenberg, S. R., Medley, B., Van De Berg, W. J., Konrad, H., Nicolas, J. P., Van Wessem, J. M., Trusel, L. D., Mulvaney, R., Tuckwell, R. J., Hogg, A. E., and Thomas, E. R.: Climate and surface mass balance of coastal West Antarctica resolved by regional climate modelling, Ann. Glaciol., 59, 29–41, https://doi.org/10.1017/aog.2017.42, 2018. a
Lenaerts, J. T. M., Medley, B., Broeke, M. R., and Wouters, B.: Observing and Modeling Ice Sheet Surface Mass Balance, Rev. Geophys., 57, 376–420, https://doi.org/10.1029/2018RG000622, 2019. a
Maclennan, M. L. and Lenaerts, J. T. M.: Large-Scale Atmospheric Drivers of Snowfall Over Thwaites Glacier, Antarctica, Geophys. Res. Lett., 48, e2021GL093644, https://doi.org/10.1029/2021GL093644, 2021. a, b, c
Mattingly, K. S., Mote, T. L., and Fettweis, X.: Atmospheric River Impacts on Greenland Ice Sheet Surface Mass Balance, J. Geophys. Res.-Atmos., 123, 8538–8560, https://doi.org/10.1029/2018JD028714, 2018. a, b
Mattingly, K. S., Mote, T. L., Fettweis, X., As, D. V., Tricht, K. V., Lhermitte, S., Pettersen, C., and Fausto, R. S.: Strong Summer Atmospheric Rivers Trigger Greenland Ice Sheet Melt through Spatially Varying Surface Energy Balance and Cloud Regimes, J. Climate, 33, 6809–6832, https://doi.org/10.1175/JCLI-D-19-0835.1, 2020. a
Medley, B. and Thomas, E. R.: Increased snowfall over the Antarctic Ice Sheet mitigated twentieth-century sea-level rise, Nat. Clim. Change, 9, 34–39, https://doi.org/10.1038/s41558-018-0356-x, 2019. a
Medley, B., Joughin, I., Smith, B. E., Das, S. B., Steig, E. J., Conway, H., Gogineni, S., Lewis, C., Criscitiello, A. S., McConnell, J. R., van den Broeke, M. R., Lenaerts, J. T. M., Bromwich, D. H., Nicolas, J. P., and Leuschen, C.: Constraining the recent mass balance of Pine Island and Thwaites glaciers, West Antarctica, with airborne observations of snow accumulation, The Cryosphere, 8, 1375–1392, https://doi.org/10.5194/tc-8-1375-2014, 2014. a, b
Milillo, P., Rignot, E., Rizzoli, P., Scheuchl, B., Mouginot, J., Bueso-Bello, J. L., Prats-Iraola, P., and Dini, L.: Rapid glacier retreat rates observed in West Antarctica, Nat. Geosci., 15, 48–53, https://doi.org/10.1038/s41561-021-00877-z, 2022. a
Nash, D., Waliser, D., Guan, B., Ye, H., and Ralph, F. M.: The Role of Atmospheric Rivers in Extratropical and Polar Hydroclimate, J. Geophys. Res.-Atmos., 123, 6804–6821, https://doi.org/10.1029/2017JD028130, 2018. a
Neff, W., Compo, G. P., Ralph, F. M., and Shupe, M. D.: Continental heat anomalies and the extreme melting of the Greenland ice surface in 2012 and 1889, J. Geophys. Res.-Atmos., 119, 6520–6536, https://doi.org/10.1002/2014JD021470, 2014. a
Phillpot, H. R. and Zillman, J. W.: The surface temperature inversion over the Antarctic Continent, J. Geophys. Res., 75, 4161–4169, https://doi.org/10.1029/JC075I021P04161, 1970. a
Pohl, B., Favier, V., Wille, J., Udy, D. G., Vance, T. R., Pergaud, J., Dutrievoz, N., Blanchet, J., Kittel, C., Amory, C., Krinner, G., and Codron, F.: Relationship Between Weather Regimes and Atmospheric Rivers in East Antarctica, J. Geophys. Res.-Atmos., 126, e2021JD035294, https://doi.org/10.1029/2021JD035294, 2021. a, b
Ralph, F. M., Neiman, P. J., Wick, G. A., Gutman, S. I., Dettinger, M. D., Cayan, D. R., and White, A. B.: Flooding on California's Russian River: Role of atmospheric rivers, Geophys. Res. Lett., 33, L13801, https://doi.org/10.1029/2006GL026689, 2006. a
Ramos, A. M., Trigo, R. M., Liberato, M. L., and Tomé, R.: Daily Precipitation Extreme Events in the Iberian Peninsula and Its Association with Atmospheric Rivers, J. Hydrometeorol., 16, 579–597, https://doi.org/10.1175/JHM-D-14-0103.1, 2015. a
Raphael, M. N.: A zonal wave 3 index for the Southern Hemisphere, Geophys. Res. Lett., 31, L23212, https://doi.org/10.1029/2004GL020365, 2004. a
Raphael, M. N., Marshall, G. J., Turner, J., Fogt, R. L., Schneider, D., Dixon, D. A., Hosking, J. S., Jones, J. M., and Hobbs, W. R.: The Amundsen Sea Low: Variability, Change, and Impact on Antarctic Climate, B. Am. Meteorol. Soc., 97, 111–121, https://doi.org/10.1175/BAMS-D-14-00018.1, 2016. a
Rignot, E., Mouginot, J., Morlighem, M., Seroussi, H., and Scheuchl, B.: Widespread, rapid grounding line retreat of Pine Island, Thwaites, Smith, and Kohler glaciers, West Antarctica, from 1992 to 2011, Geophys. Res. Lett., 41, 3502–3509, https://doi.org/10.1002/2014GL060140, 2014. a
Rignot, E., Mouginot, J., Scheuchl, B., van den Broeke, M., van Wessem, M. J., and Morlighem, M.: Four decades of Antarctic Ice Sheet mass balance from 1979-2017, P. Natl. Acad. Sci. USA, 116, 1095–1103, https://doi.org/10.1073/pnas.1812883116, 2019. a, b, c, d, e
Roesler, C. and Larson, K. M.: Software tools for GNSS interferometric reflectometry (GNSS-IR), GPS Solut., 22, 1–10, https://doi.org/10.1007/S10291-018-0744-8, 2018. a
Rutz, J. J., Shields, C. A., Lora, J. M., Payne, A. E., Guan, B., Ullrich, P., O'Brien, T., Leung, L. R., Ralph, F. M., Wehner, M., Brands, S., Collow, A., Goldenson, N., Gorodetskaya, I., Griffith, H., Kashinath, K., Kawzenuk, B., Krishnan, H., Kurlin, V., Lavers, D., Magnusdottir, G., Mahoney, K., McClenny, E., Muszynski, G., Nguyen, P. D., Prabhat, M., Qian, Y., Ramos, A. M., Sarangi, C., Sellars, S., Shulgina, T., Tome, R., Waliser, D., Walton, D., Wick, G., Wilson, A. M., and Viale, M.: The Atmospheric River Tracking Method Intercomparison Project (ARTMIP): Quantifying Uncertainties in Atmospheric River Climatology, J. Geophys. Res.-Atmos., 124, 13777–13802, https://doi.org/10.1029/2019JD030936, 2019a. a, b
Rutz, J. J., Shields, C. A., Lora, J. M., Payne, A. E., Guan, B., Ullrich, P. A., O'Brien , T. A., Leung, L. R., Ralph, F. M., Wehner, M. F., Brands, S., Marquardt Collow, A. B., Goldenson, N., Gorodetskaya, I. V., Griffith, H., Hagos, S. M., Kashinath, K., Kawzenuk, B., Krishnan, H., Kurlin, V., Lavers, D., Magnusdottir, G., Mahoney, K., McClenny, E., Muszynski, G., Nguyen, M. D., Prabhat, Qian, Y., Ramos, A. M., Sarangi, C., Sellars, S., Shulgina, T., Tom, R., Waliser, D., Walton, D., Wick, G., Wilson, A. M., and Viale, M.: ARTMIP Tier-1 Catalogues, UCAR [data set], https://doi.org/10.5065/D62R3QFS, 2019. a
Ryan, W. A., Doesken, N. J., and Fassnacht, S. R.: Evaluation of Ultrasonic Snow Depth Sensors for U. S. Snow Measurements, J. Atmos. Ocean. Tech., 25, 667–684, https://doi.org/10.1175/2007JTECHA947.1, 2008. a
Scambos, T.: AMIGOS-III Cavity and Channel Snow Height and Thermistor Snow Temperature Data, US Antarctic Program (USAP) Data Center [data set], https://doi.org/10.15784/601552, 2022a. a
Scambos, T.: Vaisala WXT520 weather station data at the Cavity and Channel AMIGOS-III sites, US Antarctic Program (USAP) Data Center [data set], https://doi.org/10.15784/601549, 2022b. a
Scambos, T. A., Ross, R., Haran, T., Bauer, R., Ainley, D. G., Seo, K. W., De Keyser, M., Behar, A., and MacAYEAL, D. R.: A camera and multisensor automated station design for polar physical and biological systems monitoring: AMIGOS, J. Glaciol., 59, 303–314, https://doi.org/10.3189/2013JOG12J170, 2013. a
Schmucki, E., Marty, C., Fierz, C., and Lehning, M.: Evaluation of modelled snow depth and snow water equivalent at three contrasting sites in Switzerland using SNOWPACK simulations driven by different meteorological data input, Cold Reg. Sci. Technol., 99, 27–37, https://doi.org/10.1016/J.COLDREGIONS.2013.12.004, 2014. a
Schoof, C.: Marine ice sheet stability, J. Fluid Mech., 698, 62–72, https://doi.org/10.1017/JFM.2012.43, 2012. a
Scott, R. C., Nicolas, J. P., Bromwich, D. H., Norris, J. R., and Lubin, D.: Meteorological Drivers and Large-Scale Climate Forcing of West Antarctic Surface Melt, J. Climate, 32, 665–684, https://doi.org/10.1175/JCLI-D-18-0233.1, 2019. a
Seroussi, H., Nakayama, Y., Larour, E., Menemenlis, D., Morlighem, M., Rignot, E., and Khazendar, A.: Continued retreat of Thwaites Glacier, West Antarctica, controlled by bed topography and ocean circulation, Geophys. Res. Lett., 44, 6191–6199, https://doi.org/10.1002/2017GL072910, 2017. a
Shepherd, A., Fricker, H. A., and Farrell, S. L.: Trends and connections across the Antarctic cryosphere, Nature, 558, 223–232, https://doi.org/10.1038/s41586-018-0171-6, 2018. a
Shields, C. A., Rutz, J. J., Leung, L. -Y., Ralph, F. M., Wehner, M., Kawzenuk, B., Lora, J. M., McClenny, E., Osborne, T., Payne, A. E., Ullrich, P., Gershunov, A., Goldenson, N., Guan, B., Qian, Y., Ramos, A. M., Sarangi, C., Sellars, S., Gorodetskaya, I., Kashinath, K., Kurlin, V., Mahoney, K., Muszynski, G., Pierce, R., Subramanian, A. C., Tome, R., Waliser, D., Walton, D., Wick, G., Wilson, A., Lavers, D., Prabhat, Collow, A., Krishnan, H., Mangusdottir, G., and Nguyen, P.: Atmospheric River Tracking Method Intercomparison Project (ARTMIP): project goals and experimental design, Geosci. Model Dev., 11, 2455–2474, https://doi.org/10.5194/gmd-11-2455-2018, 2018. a
Shields, C. A., Wille, J. D., Collow, A. B. M., Maclennan, M., and Gorodetskaya, I. V.: Evaluating Uncertainty and Modes of Variability for Antarctic Atmospheric Rivers, Geophys. Res. Lett., 49, e2022GL099577, https://doi.org/10.1029/2022GL099577, 2022. a
Steger, C. R., Reijmer, C. H., van den Broeke, M. R., Wever, N., Forster, R. R., Koenig, L. S., Munneke, P. K., Lehning, M., Lhermitte, S., Ligtenberg, S. R., Miège, C., and Noël, B. P.: Firn meltwater retention on the greenland ice sheet: A model comparison, Frontiers in Earth Science, 5, 3, https://doi.org/10.3389/FEART.2017.00003, 2017. a
Terpstra, A., Gorodetskaya, I. V., and Sodemann, H.: Linking Sub-Tropical Evaporation and Extreme Precipitation Over East Antarctica: An Atmospheric River Case Study, J. Geophys. Res.-Atmos., 126, e2020JD033617, https://doi.org/10.1029/2020JD033617, 2021. a
Thoma, M., Jenkins, A., Holland, D., and Jacobs, S.: Modelling Circumpolar Deep Water intrusions on the Amundsen Sea continental shelf, Antarctica, Geophys. Res. Lett., 35, 2–7, https://doi.org/10.1029/2008GL034939, 2008. a
Van Den Broeke, M. R.: The semi-annual oscillation and Antarctic climate. Part 1: influence on near surface temperatures (1957–79), Antarct. Sci., 10, 175–183, https://doi.org/10.1017/S0954102098000248, 1998. a
van Wessem, J. M., Steger, C. R., Wever, N., and van den Broeke, M. R.: An exploratory modelling study of perennial firn aquifers in the Antarctic Peninsula for the period 1979–2016, The Cryosphere, 15, 695–714, https://doi.org/10.5194/tc-15-695-2021, 2021. a
Viale, M. and Nuñez, M. N.: Climatology of Winter Orographic Precipitation over the Subtropical Central Andes and Associated Synoptic and Regional Characteristics, J. Hydrometeorol., 12, 481–507, https://doi.org/10.1175/2010JHM1284.1, 2011. a
Vignon, É., Roussel, M. L., Gorodetskaya, I. V., Genthon, C., and Berne, A.: Present and Future of Rainfall in Antarctica, Geophys. Res. Lett., 48, e2020GL092281, https://doi.org/10.1029/2020GL092281, 2021. a
Waliser, D. and Guan, B.: Extreme winds and precipitation during landfall of atmospheric rivers, Nat. Geosci., 10, 179–183, https://doi.org/10.1038/ngeo2894, 2017. a
Weertman, J.: Stability of the Junction of an Ice Sheet and an Ice Shelf, J. Glaciol., 13, 3–11, https://doi.org/10.3189/S0022143000023327, 1974. a
Wever, N.: SNOWPACK simulations for Thwaites Cavity and Channel AMIGOS sites in West Antarctica, Zenodo [data set], https://doi.org/10.5281/zenodo.7320237, 2022. a
Wever, N., Keenan, E., and snowpack-model: snowpack-model/snowpack: 149c586 (149c586), Zenodo [code], https://doi.org/10.5281/zenodo.7331794, 2022. a
Wever, N., Keenan, E., and snowpack-model: snowpack-model/snowpack: 7afca63 (7afca63), Zenodo [code], https://doi.org/10.5281/zenodo.7536784, 2023. a
Wever, N., Schmid, L., Heilig, A., Eisen, O., Fierz, C., and Lehning, M.: Verification of the multi-layer SNOWPACK model with different water transport schemes, The Cryosphere, 9, 2271–2293, https://doi.org/10.5194/tc-9-2271-2015, 2015. a
Wever, N., Keenan, E., Amory, C., Lehning, M., Sigmund, A., Huwald, H., and Lenaerts, J.: Observations and simulations of new snow density in the drifting snow-dominated environment of Antarctica, J. Glaciol., https://doi.org/10.1017/jog.2022.102, in press, 2022. a, b
Whan, K., Sillmann, J., Schaller, N., and Haarsma, R.: Future changes in atmospheric rivers and extreme precipitation in Norway, Clim. Dynam., 54, 2071–2084, https://doi.org/10.1007/s00382-019-05099-z, 2020. a
Wild, C. T., Alley, K. E., Muto, A., Truffer, M., Scambos, T. A., and Pettit, E. C.: Weakening of the pinning point buttressing Thwaites Glacier, West Antarctica, The Cryosphere, 16, 397–417, https://doi.org/10.5194/tc-16-397-2022, 2022. a
Wille, J. D., Favier, V., Dufour, A., Gorodetskaya, I. V., Turner, J., Agosta, C., and Codron, F.: West Antarctic surface melt triggered by atmospheric rivers, Nat. Geosci., 12, 911–916, https://doi.org/10.1038/s41561-019-0460-1, 2019. a, b, c, d, e, f, g, h
Wille, J. D., Favier, V., Gorodetskaya, I. V., Agosta, C., Kittel, C., Beeman, J. C., Jourdain, N. C., Lenaerts, J. T. M., and Codron, F.: Antarctic atmospheric river climatology and precipitation impacts, J. Geophys. Res.-Atmos., 126, e2020JD033788, https://doi.org/10.1029/2020JD033788, 2021. a, b, c, d, e, f, g, h, i, j, k, l, m, n, o, p, q, r
Wilson, T., Bevis, M., Smalley, R. J., Dalziel, I., Kendrick, E., Konfal, S., Saddler, D., and Willis, M.: Antarctica-POLENET GPS Network – LTHW-Lower Thwaites Glacier P. S., The GAGE Facility operated by UNAVCO, Inc., GPS/GNSS Observations Dataset, https://doi.org/10.7283/T5NK3C7D, 2009a. a
Wilson, T., Bevis, M., Smalley, R. J., Dalziel, I., Kendrick, E., Konfal, S., Saddler, D., and Willis, M.: Antarctica-POLENET GPS Network – UTHW-Up Thwaites Glacier P. S., The GAGE Facility operated by UNAVCO, Inc., GPS/GNSS Observations Dataset, https://doi.org/10.7283/T50P0XBC, 2009b. a
WSL: MeteoIO and SNOWPACK, License: GNU LHPLv3, Institute for Snow and Avalanche Research SLF, Davos, Switzerland, WSL [code], https://gitlabext.wsl.ch/snow-models/snowpack, last access: 17 November 2022. a
Zhu, Y. and Newell, R. E.: A Proposed Algorithm for Moisture Fluxes from Atmospheric Rivers, Mon. Weather Rev., 126, 725–735, https://doi.org/10.1175/1520-0493(1998)126%3C0725:APAFMF%3E2.0.CO;2, 1998. a, b, c
Zwally, H. J., Giovinetto, M. B., Beckley, M. A., and Saba, J. L.: Antarctic and Greenland Drainage Systems, GSFC Cryospheric Sciences Laboratory, http://icesat4.gsfc.nasa.gov/cryo_data/ant_grn_drainage_systems.php (last access: 30 March 2019), 2012. a