the Creative Commons Attribution 4.0 License.
the Creative Commons Attribution 4.0 License.
 | 14 Feb 2023
Brief communication: Combining borehole temperature, borehole piezometer and cross-borehole electrical resistivity tomography measurements to investigate seasonal changes in ice-rich mountain permafrost
Chasper Buchli
Samuel Weber
Jacopo Boaga
Mirko Pavoni
Alexander Bast
A novel combination of borehole temperature, borehole piezometer and cross-borehole electrical resistivity tomography (ERT) data is used to investigate changing ice and/or water contents in the creeping ice-rich Schafberg rock glacier in the Eastern Swiss Alps. Instrumentation techniques and first results are presented. The rock glacier ice is close to its melting point, and the landform has locally heterogeneous stratigraphies, ice and/or water contents and temperature regimes. The measurement techniques presented continuously monitor temporal and spatial phase changes to a depth of 12 m and should provide the basis for a better understanding of accelerating rock glacier kinematics and future water availability.
- Article
(5757 KB) - Full-text XML
- BibTeX
- EndNote


A widespread acceleration of ice-rich rock glaciers is being recorded in the Alps (Permos, 2019), increasing the likelihood of mass movements such as debris flows from their frontal lobes in steep terrain connected to streams (Kummert and Delaloye, 2018). The acceleration has been attributed to ice warming induced by global warming and to rising water contents within the ice-rich permafrost (Cicoira et al., 2019). Ice and water contents of rock glaciers have been modelled to investigate future water availability (Pruessner et al., 2022), and the water-related dynamics of rock glaciers have been investigated based on aerial photography, in situ GNSS and meteorological data (Wirz et al., 2016) as well as snow cover timing (Kenner et al., 2019). Rock glacier outflow has been quantified (Krainer and Mostler, 2002) and dynamic liquid water storage capacities estimated (Wagner et al., 2021). However, there is little direct information on the internal hydrology of rock glaciers (Zenklusen Mutter and Phillips, 2012), changes in ice and/or water contents or talik formation. A substantial unfrozen water content can persist well below 0 ∘C, depending on soil properties, salinity and pore-water pressure (Arenson et al., 2022), as was shown by Musil et al. (2006) using cross-hole georadar measurements in the Muragl rock glacier. Many Alpine rock glaciers are close to their melting point (PERMOS, 2019), and borehole temperature data do not allow us to distinguish between ice and water close to 0 ∘C, so relative changes in ice and/or water content have to be monitored using geophysical methods detecting changes in resistivity (Mollaret et al., 2019). Electrical resistivity methods have been established in mountain permafrost terrain in the past few decades and deliver increasingly detailed information, including quantitative estimation of water storage, ice contents, water flow and temperature (Hauck, 2013). Continuous surface electrical resistivity data (ERT) provide valuable 2D information on resistivity changes in ice-rich permafrost substrates. However, 2D ERT soundings can only provide limited information with increasing depth. Cross-borehole measurements such as georadar (Musil et al., 2006) or cross-borehole ERT overcome this limitation by using at least two vertical boreholes for electrode locations (Binley, 2015). To date, cross-borehole ERT has primarily focused on groundwater research, especially on the remediation of contaminated groundwater (Binley and Slater, 2020) or to determine substrate characteristics but has never been applied in mountain permafrost environments.
Time domain reflectometry (TDR) measurements in the active layer of mountain permafrost (Rist and Phillips, 2005) revealed how water contents vary on a daily and seasonal basis in frozen talus slopes. Laboratory experiments (Harris and Davies, 1998) gave the first indications of the relation between pore-water pressure and temperature during phase change in permafrost. Although pore-water pressure is routinely monitored in other environments, piezometer data have not been collected in ice-rich mountain permafrost. Here we present first data snapshots from a novel combination of borehole temperature, borehole piezometer and cross-borehole ERT measurements designed to investigate the changes occurring in an ice-rich rock glacier, in particular modifications of the ice-to-water ratio near 0 ∘C, with continuous measurements. Previously collected borehole temperature data, surface ERT, seismics and electromagnetic frequency domain data indicated the occurrence of heterogeneously distributed ground ice and possible talik formation (Boaga et al., 2020) at the Schafberg rock glacier study site we focus on here.
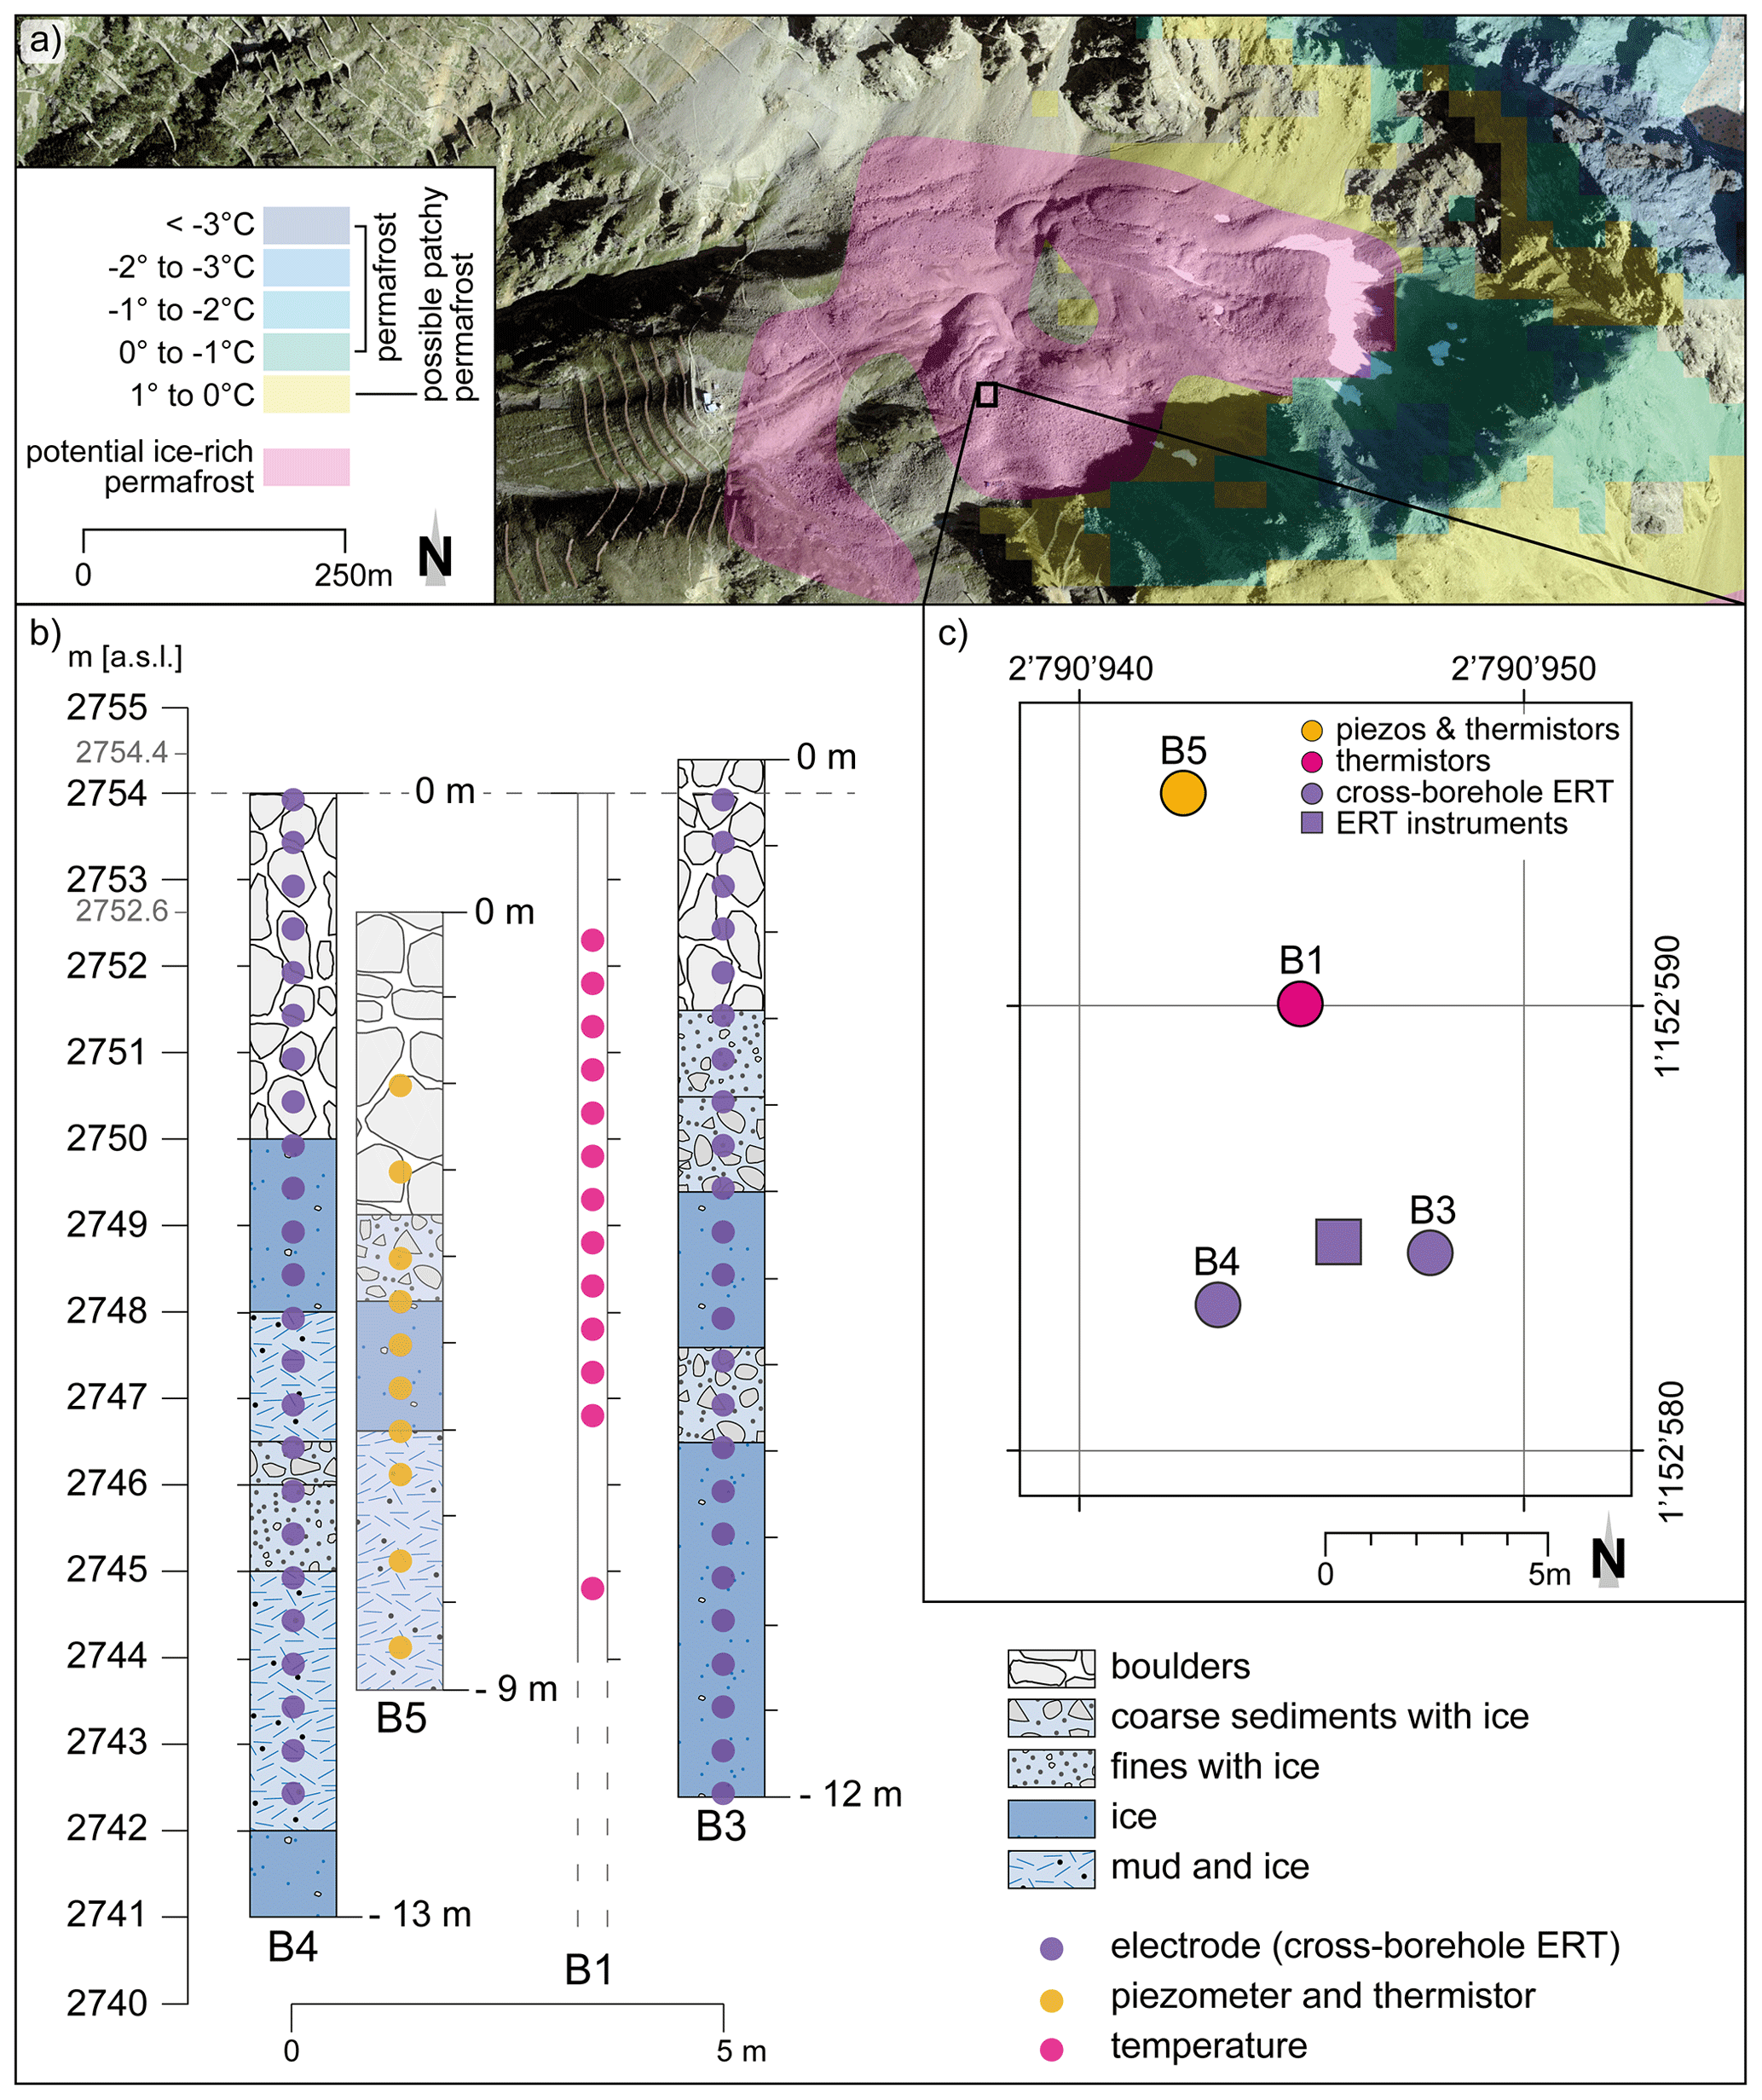
Figure 1(a) Modelled permafrost distribution at the Schafberg study site (permafrost and ground ice distribution map of Switzerland, Kenner et al., 2019). Aerial photograph: © swisstopo. (b) Borehole stratigraphy in B3, B4 and B5 (drilled in 2020) and positions of the ERT electrodes (purple dots), as well as borehole piezometers and temperature sensors (yellow dots (B5) and pink dots (B1)). No stratigraphy is shown for B1 (drilled in 1990). (c) Positions of the boreholes and instruments relative to each other and their position on the Schafberg rock glacier (black rectangle in a). “Fines” refers to “fine sediment”.
2.1 Borehole drilling
The monitoring site (46∘29′50.391′′ N, 9∘55′34.779′′ E) is on the ice-rich Schafberg rock glacier, at 2750 m a.s.l. above Pontresina (Engadin, Eastern Swiss Alps, Fig. 1a), where an existing PERMOS (Permafrost Monitoring Switzerland) borehole (Schafberg B1, drilled to 67 m depth in 1990; lowest temperature sensor currently at 15.9 m) is equipped with temperature sensors (Vonder Mühll and Holub, 1992). Additionally, three vertical boreholes (B3, 12 m deep; B4, 13 m; and B5, 9 m) were drilled destructively in August 2020, and stratigraphy was recorded based on drill performance and observation of material ejected by air flushing (Fig. 1b). A 4 m long PVC pipe was temporarily installed during drilling to prevent active layer collapse (Fig. 2a). The sensors were lowered into the boreholes immediately after drill extraction, the stabilizing PVC pipe removed and the boreholes filled with a sand–gravel mixture (total volume 0.3 m3, consisting of 50 % sand (≤2 mm diameter) and of 50 % gravel (2–4 mm diameter)) to establish contact between the sensors and borehole walls (see Sect. 2.2 and 2.3) and to minimize air circulation. At the ground surface, the boreholes and instrument boxes (Fig. 2d) are protected by concrete chambers with iron lids.
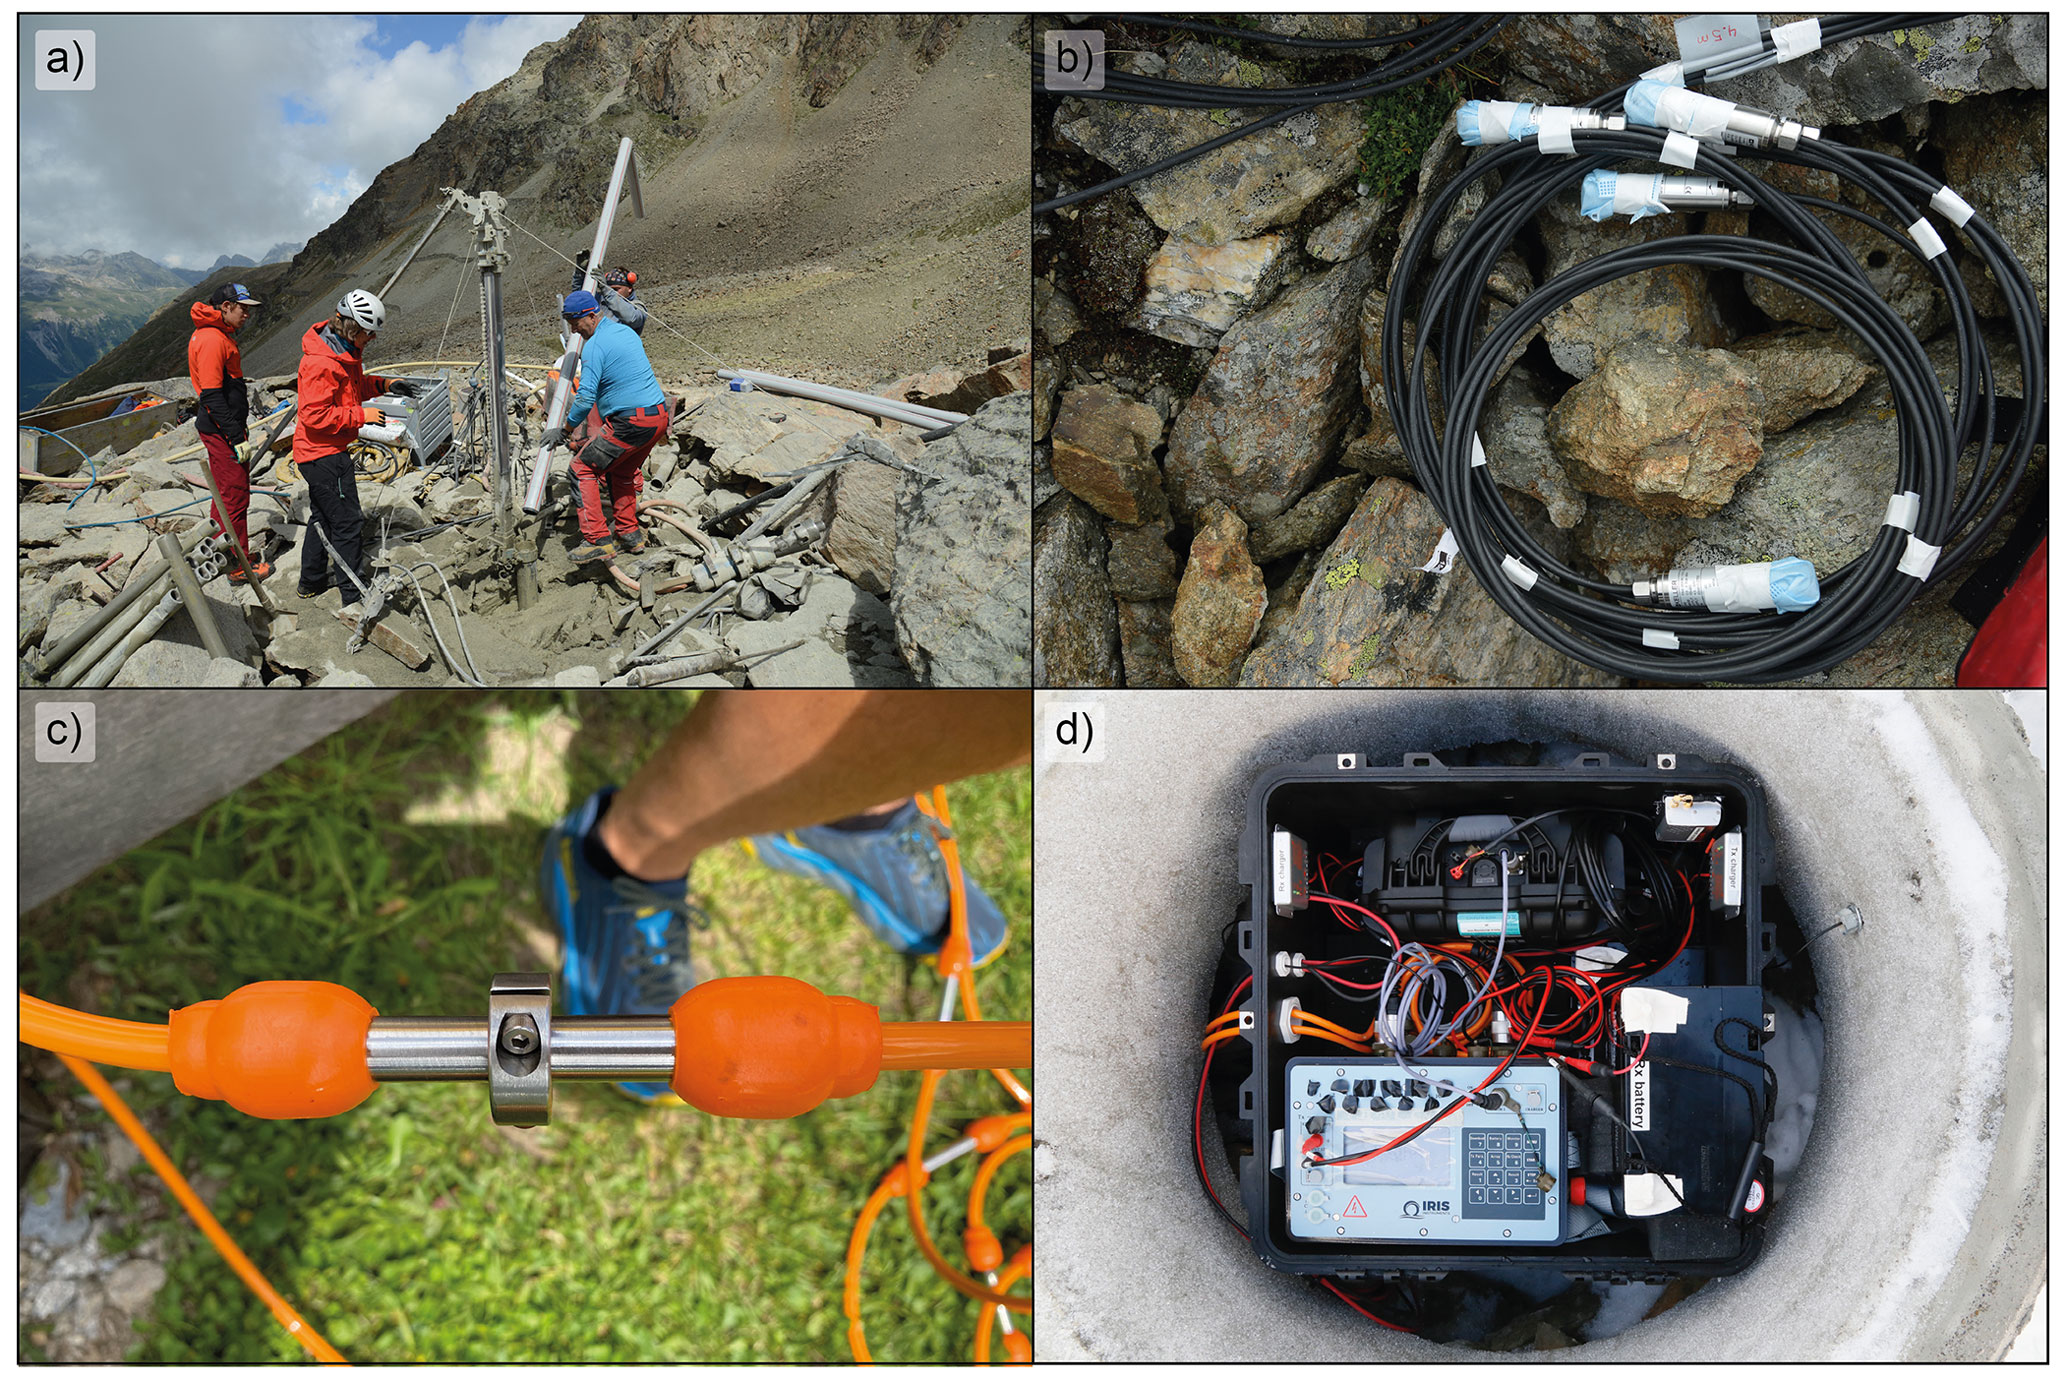
Figure 2(a) Drill and protective PVC pipe used to drill boreholes B3, B4 and B5 on Schafberg rock glacier in August 2020. (b) Piezometers and temperature sensors ready to be installed in B5. (c) Stainless steel ring mounted on cross-borehole ERT electrode to improve ground contact. (d) Cross-borehole ERT logging system for B3 and B4 in a concrete chamber (ERT instruments in Fig. 1c).
2.2 Borehole temperatures and piezometer sensors
Borehole B1 is equipped with 16 YSI thermistors (44 006) to a depth of 15.9 m (depths to 9.2 m shown in Fig. 1b), with an accuracy of ±0.1 ∘C and with a Campbell CR1000 data logger. Energy is supplied by two 12 V batteries. Data are recorded every 2 h and read out using a Toughbook during site visits. The borehole is part of the PERMOS network and the data are available online (https://www.permos.ch, last access: 5 February 2023, https://doi.org/10.13093/permos-2022-01).
Borehole B5 is located 10 m northwest of B3 (Fig. 1c) and was equipped with 10 Keller PAA-36XiW piezometers. The piezometer data provide temporal evolution of the effective pressure measured at the sensor's membrane (measured relative to a vacuum; pressure range 60–230 kPa, accuracy ±11.5 kPa), combined with 10 PT 1000 temperature sensors (accuracy ±0.1 ∘C) between 2.0 and 8.5 m depth (Fig. 1b and c). For protection, the sensors were smeared with Vaseline and wrapped in a thin textile (Fig. 2b). They are connected to two Keller ARC-1 Box 4G data loggers containing a barometer and the data are measured hourly and transmitted daily via a mobile phone network to a cloud-based data platform.
2.3 Cross-borehole electrical resistivity tomography (ERT)
Boreholes B3 and B4 are 5 m apart (Fig. 1c) and are both equipped with an ERT multi-core cable (24 electrodes per borehole with 50 cm vertical spacing, at 0–11.5 m depth; see Fig. 1b). In addition, stainless steel rings were mounted at the cables' take-outs to improve electrode contact with the substrate (Fig. 2c). We use a Syscal system (https://www.iris-instruments.com, last access: 5 February 2023) to automatically collect and transmit the data consisting of the Syscal Pro Switch 48 resistivity meter and the Syscal monitoring unit (SMU), which are protected by a concrete chamber (Fig. 2d) at the ground surface between the two boreholes. The SMU starts, logs and transmits the data daily. The system requires two 12 V lead crystal batteries (100 Ah for current transmission and 55 Ah for current reception), which are fed by two solar panels (155 and 55 W, respectively) mounted on a pylon. Data are collected daily at 14:00 (CEST) and are transmitted via a modem and an omnidirectional antenna mounted in the wall of the concrete chamber. For the configuration of the quadrupoles, we use a dipole–dipole skip-two array, collecting 1494 direct and reciprocal data points per day.
2.4 Data processing and analysis
Data shown here were processed and analysed for 1 d in summer (20 August 2021; close to the expected timing of the maximum thickness of the active layer, generally around the end of August) and for 1 d 6 months later, in midwinter (20 February 2022).
To invert the measured apparent resistivities to specific resistivities of the near-subsurface, the Python-based open-source software ResIPy was used (Blanchy et al., 2020). The inverse modelling is based on Occam's principle. It is performed to minimize an objective function, which quantifies the misfit between the observed dataset and the predictions made by the model (Binley and Slater, 2020). The two presented datasets were inverted independently. The reciprocal data acquisition allows us to estimate the data quality, filtering the ERT data and, hence, to eliminate implausible values and outliers. The direct and reciprocal deviations were checked (Blanchy et al., 2020), and only data with less than 5 % discrepancy were considered for further inversion (remaining data points: nAug21=214; nFeb22=118). Data error analyses were performed following Blanchy et al. (2020). The field data's error check was used to weight the later error model parameters in the inversion process. Since the current flow does not interact with the surface or other boundaries, all electrodes except the top two were treated as buried in the modelling process and an unstructured triangular mesh was created, extending the real mesh laterally and downwards. The computed models converged after six (20 August 2021; RMSE 1.06) and five iterations (20 February 2022; RMSE 1.04). The iteration process was terminated when it reached a maximum of 10 iterations or the data–model misfit based on the least-square fit equaled the number of measurements (Binley and Slater, 2020). Both independent models clearly show the resistivity variation between the summer and winter datasets. However, to better highlight the variations, differences were additionally modelled using ResIPy's time-lapse inversion scheme (Blanchy et al., 2020). Model results were plotted with the open-source visualization application ParaView (https://www.paraview.org, last access: 5 February 2023; Ayachit et al., 2015).
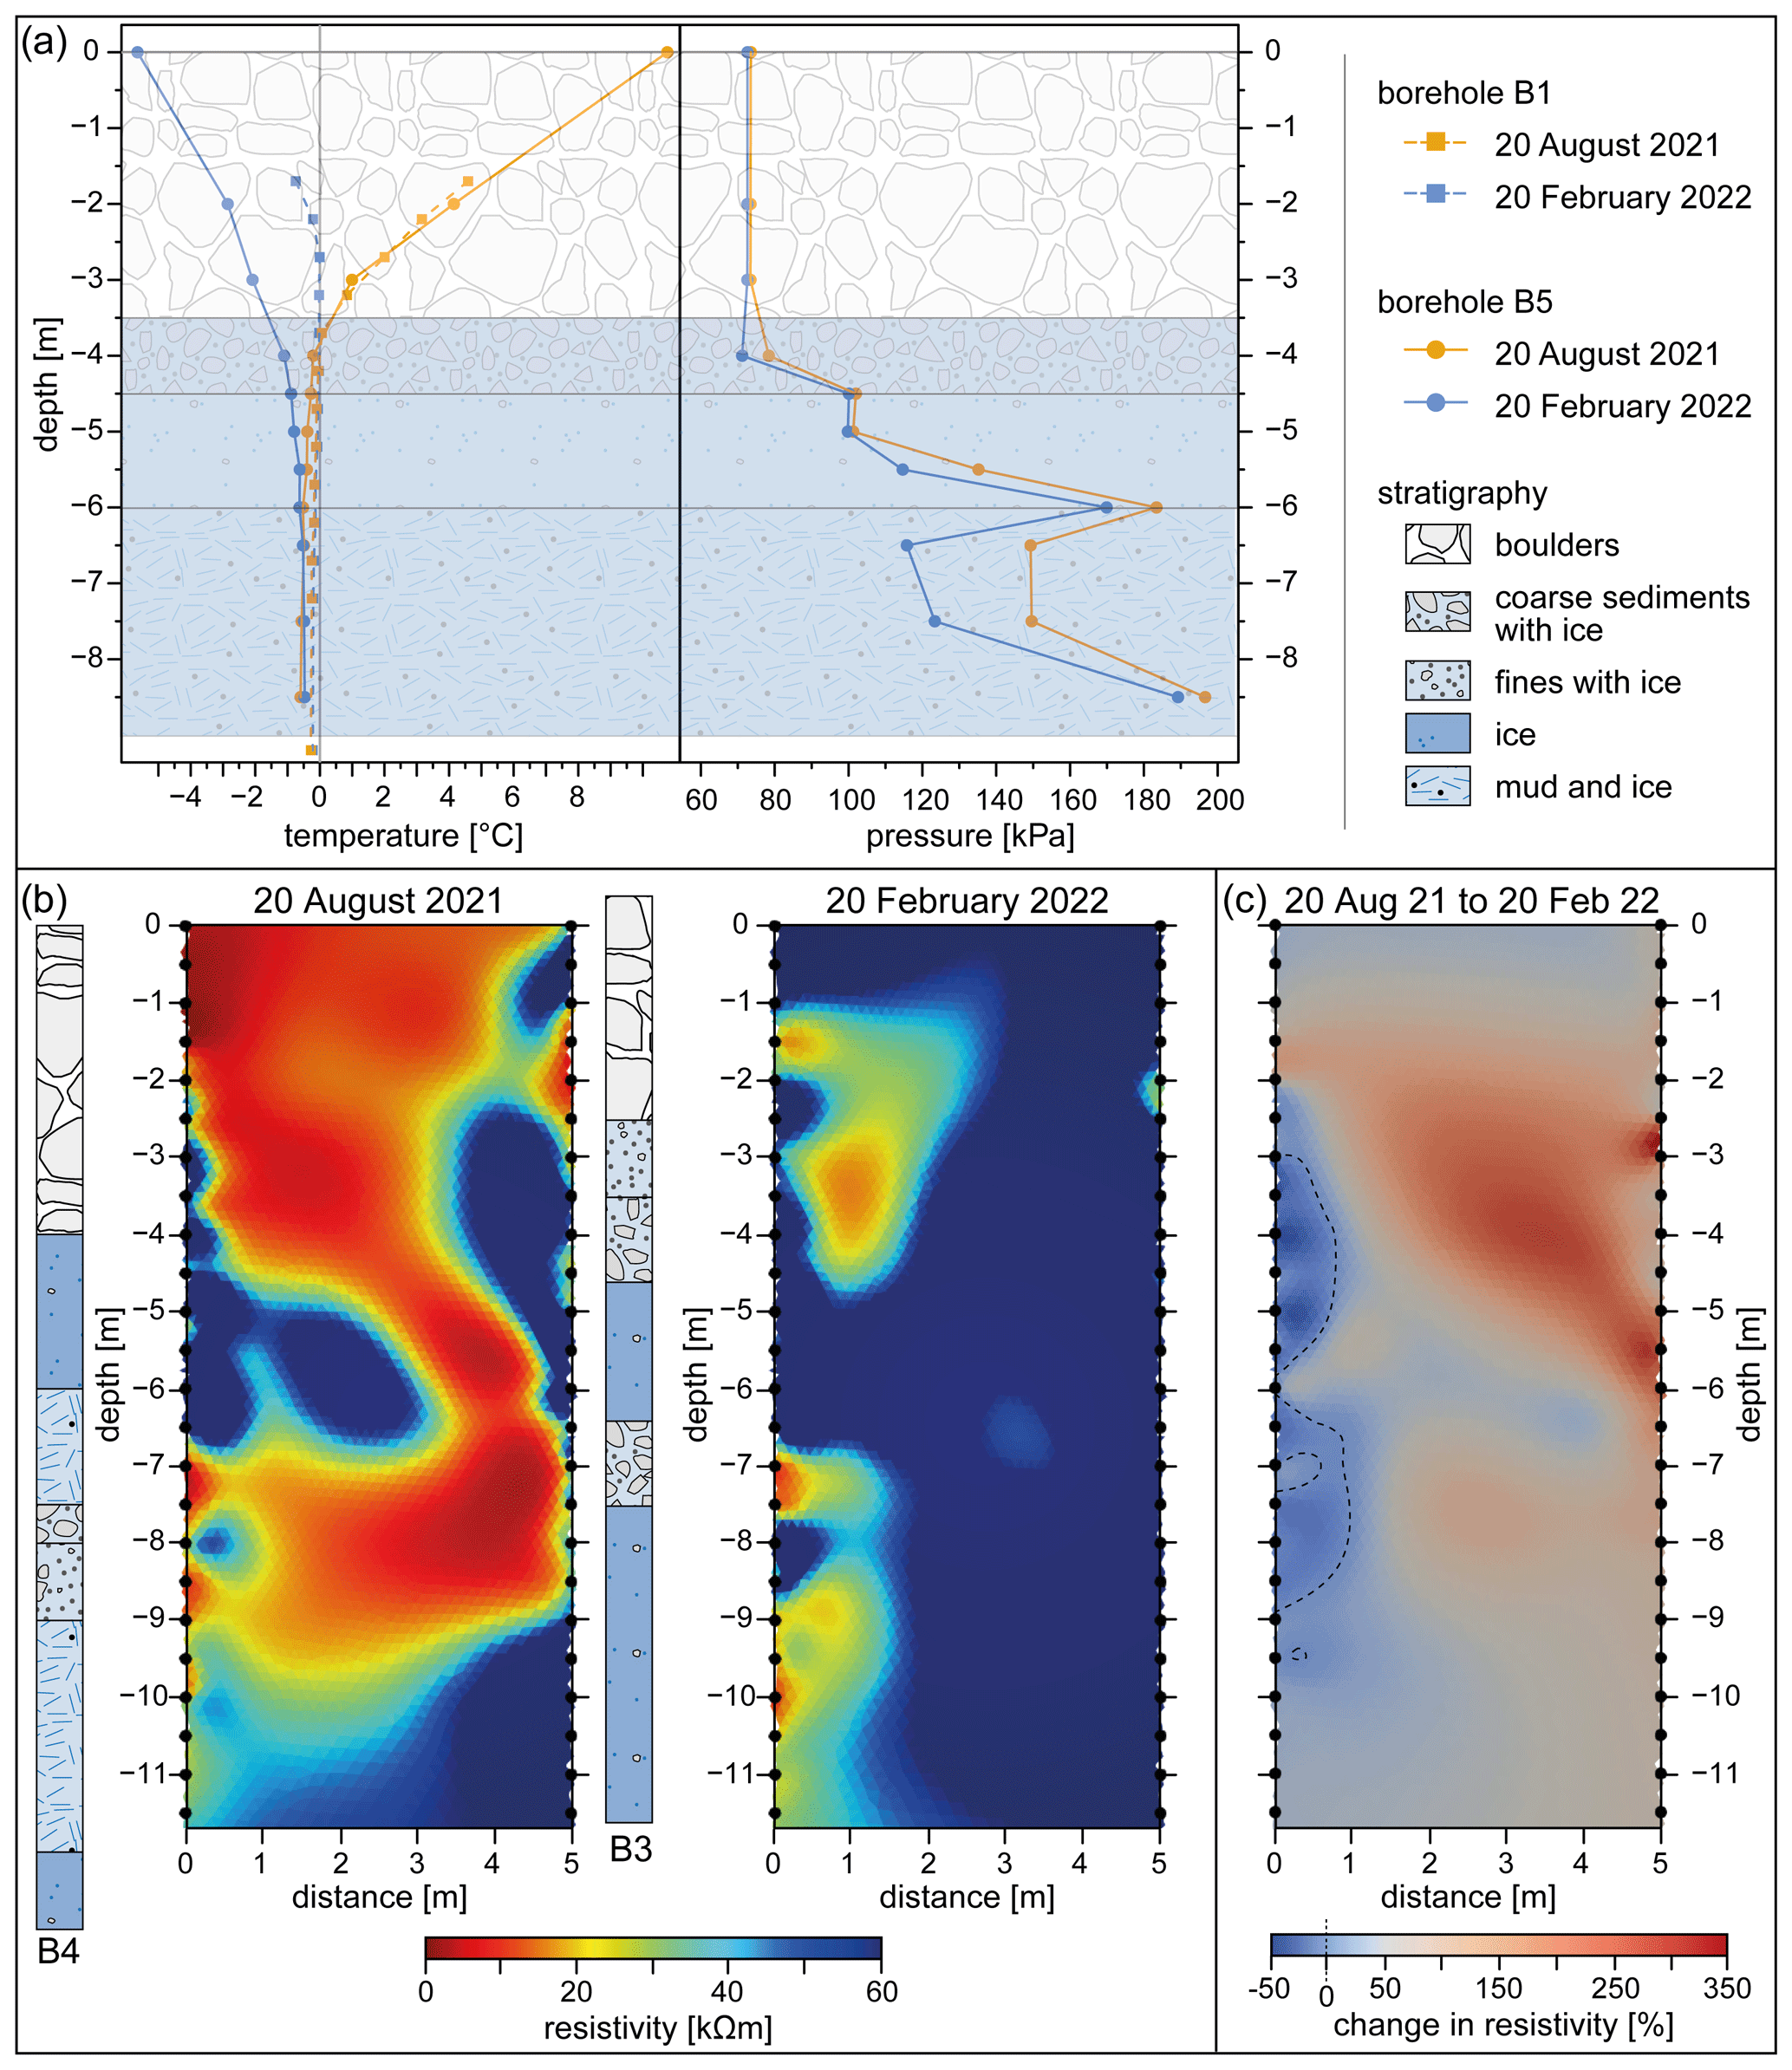
Figure 3(a) Left: Borehole temperatures in B1 (squares) and B5 (dots) on 20 August 2021 (yellow) and 20 February 2022 (blue), between 0 and 9 m depth. Right: Piezometer pressure data measured in B5 on 20 August 2021 (yellow) and 20 February 2022 (blue). The stratigraphy of B5 is shown in the background. The source for the temperature data of borehole B1 is the Swiss Permafrost Monitoring Network (PERMOS). (b) Cross-borehole resistivities on 20 August 2021 (left; 6 iterations, RMSE 1.06) and on 20 February 2022 (centre; 5 iterations, RMSE 1.04). The stratigraphies of B4 and B3 are shown beside the 20 August 2021 resistivity profiles to underline the consistency between stratigraphies and resistivities (for legend see Fig. 3a). (c) Percentage change of resistivities between 20 August 2021 and 20 February 2022. The black-dashed line indicates the 0 % contour line.
The stratigraphies recorded indicate a layer of large boulders dominating the topmost 3–4 m of the three 2020 boreholes B3–B5. Below these, the substrate in B3 is made up of icy sediments and dirty ice (Fig. 1b). Some icy sediments were also found in B4 and B5, but wet sludge containing ice particles dominated. Ice and water distribution are thus heterogeneous over distances of 5–10 m.
The borehole temperatures, piezometer data and cross-borehole ERT data shown for 20 August 2021 and 20 February 2022 highlight thermal and phase contrasts between summer and winter conditions (Fig. 3). Vertical temperature distributions in B1 (drilled in 1990) and SB5 are in good agreement and show that permafrost temperatures are close to 0 ∘C in both seasons (Fig. 1a). The maximum active layer thickness is generally 3.5–4 m in both boreholes and temperatures in the thawed part of the active layer are nearly identical in August (Fig. 3a). February temperatures are higher in B1 than B5, suggesting a higher moisture content in B1.
In the blocky active layer, the piezometer data mainly correspond to air pressure. Below the active layer the presence of ice makes the quality of the data uncertain. Nevertheless, the pressure data at 6–10 m depth seem most plausible, as the substrate consists of wet sludge (with a high unfrozen water content) containing ice crystals. Pressures were lower in winter than in summer in this layer (Fig. 3a), due to higher water contents in summer (infiltration of snow meltwater and precipitation).
On 20 August 2021, the ERT image is consistent with the stratigraphies recorded in B3 and B4 in August 2020 and with the temperature data (Fig. 3b). Resistivities below 15 k Ω m are mainly found in the thawed active layer. The blocky, uppermost layer can best explain the anomaly of higher resistivities (0–1.5 m depth, right). Resistivities are highest where ice was recorded in the stratigraphy, reaching values above 60 k Ω m and indicating a lower water content. The relatively low resistivities between 7–9 m depth are remarkable. They reveal the stratigraphic contrast between the very ice-rich layers and the sludgy layers containing ice crystals, with high water contents. In winter, resistivities increase by up to 350 % due to the general relation between resistivity and temperature (Fig. 3b and c). The most remarkable resistivity changes occur in the active layer and the underlying sediments with ice (B3). In contrast, the resistivity changes are smallest near B4 due to the higher water content in the sludge-ice layers.
The multi-method approach presented is a novel combination of techniques in an ice-rich rock glacier and has delivered first promising results. The temperature data measured in boreholes B1 and B5 are almost identical in summer but contrast strongly in winter in the active layer, highlighting local differences in moisture content. Below 4.5 m depth, ground temperatures are close to 0 ∘C all year round, making it difficult to distinguish variations in ice and/or water content thermally. The continuous cross-borehole ERT data thus provide useful supplementary information: they show vertical and lateral changes in resistivity, allowing us to discern phase changes in the active layer and variations in ice and/or water content in the underlying permafrost. The quality of the contact between the electrodes and the sand–gravel borehole infill is unknown, but summer resistivities confirm summer borehole stratigraphies. This is encouraging, as the latter were determined from observations during destructive drilling and not based on borehole cores. Little seasonal change in resistivity is registered in the wet sludge layers containing ice crystals, which is likely due to latent heat effects. These layers confirm that mountain permafrost can contain substantial unfrozen water contents. The highest seasonal electrical resistivity changes are observed in ice-rich sediments.
The piezometer data must be interpreted with care: if ground temperature drops below 0 ∘C, ice formation might strongly affect the pressure measured in the sensor's housing and thereby not fully represent the dominant pressure condition at a given depth. Similar challenges were encountered by Harris and Davies (1998) in laboratory experiments. Further laboratory experiments will be necessary to determine the behaviour of these types of piezometer sensors, depending on ground ice and water contents. Nevertheless, the piezometers do indicate the presence of air, water or ice, and they register seasonal pressure variations in wet layers. All the data presented here highlight the heterogeneous and seasonally variable nature of the substrate, as was revealed by the contrasting borehole stratigraphies. Frequency domain electromagnetometer data from 2019 (Boaga et al., 2020) additionally confirm this.
The main technical challenges confronted were as follows: (1) borehole walls collapsing between the extraction of the drill head and insertion of the sensors (requiring the use of a stabilizing PVC tube) and (2) establishing efficient electrical contact between the sensors and the borehole walls. The filling material differed from the original substrate, and it is not known whether it subsequently settled and whether all spaces around the sensors were efficiently filled. Processes such as subsidence, creep and changing ice and/or water contents could be a challenge for long-term sensor health in these tubeless boreholes. Nevertheless, future analysis will reveal daily but also medium- to long-term interannual and inter-seasonal changes in rock glacier water content, which will be correlated with meteorological variables. This information contributes towards (i) closing the gap regarding the direct quantification of rock glacier water content and (ii) a better understanding of climate change impacts. The unique combination of methods presented here will provide valuable insight into local rock glacier substrate characteristics and relative ice-to-water ratios, thus contributing to understanding factors driving accelerating rock glacier kinematics and future water availability from these landforms.
For inverting the ERT models, we used the Python-based open-source software ResIPy (Blanchy et al., 2020), which is available at GitLab (https://gitlab.com/hkex/resipy, last access: 5 February 2023). For ERT visualization we used the open-source visualization application ParaView (Ayachit et al., 2015, https://www.paraview.org, last access: 5 February 2023). We plotted borehole temperature and piezometer data with R (R Core Team, 2022; https://www.R-project.org; last access: 5 February 2023) within the RStudio environment (Posit team, 2022, http://posit.co, 5 February 2023).
In this case study, we did not perform data analysis on extensive or big data sets. In our contribution, we highlighted the method of using a combined approach for change detection in ice-rich mountain permafrost as a first step. The data used in this paper (borehole temperature and piezometer data as well as cross-borehole ERT data) can be provided by Marcia Phillips (phillips@slf.ch) or Alexander Bast (alexander.bast@slf.ch) on request. The monitoring dataset will be open-source and published within a more extensive data analysis in 2023. Ground temperature data of borehole B1 were provided by PERMOS, supported by MeteoSwiss (in the framework of GCOS Switzerland)/BAFU/SCNAT (https://www.permos.ch, last access: 5 February 2023, https://doi.org/10.13093/permos-2022-01, PERMOS, 2022).
MaP initiated the study, designed the measurement concept, and drilled and instrumented the boreholes. CB carried out the electronics work and programmed the cross-borehole ERT with AB. AB, SW, MaP, JB and MiP analysed the borehole data. All authors contributed to the paper.
The contact author has declared that none of the authors has any competing interests.
Publisher’s note: Copernicus Publications remains neutral with regard to jurisdictional claims in published maps and institutional affiliations.
Nora Bühler, Samuel Halter, Thomas Schlatter and Lars Widmer are thanked for their excellent practical assistance. We thank the Foffa Conrad AG drilling team and Helibernina AG for their outstanding work as well as the Amt für Wald und Naturgefahren Graubünden and the Gemeinde Pontresina for their ongoing, much appreciated support. We are very grateful to Roger Hübscher, Daniel Fries and Silvan Achtnich at Keller Druckmesstechnik AG for their valuable support with the piezometers and to Hans-Martin Schuler from IGM GmbH for useful advice regarding the ERT equipment. The editor, Adam Booth, and two anonymous reviewers are warmly thanked for their constructive comments and useful suggestions.
This paper was edited by Adam Booth and reviewed by two anonymous referees.
Arenson, L. U., Harrington, J. S., Koenig, C. E. M., and Wainstein, P. A.: Mountain Permafrost Hydrology-A Practical Review Following Studies from the Andes, Geosciences, 12, 48, https://doi.org/10.3390/geosciences12020048, 2022.
Ayachit, U., Geveci, B., and Avila, L. S.: The ParaView Guide: Updated for ParaView Version 4.3. Kitware, New York, 261 p., ISBN 9781930934306, 2015,
Binley, A.: 11.08 – Tools and Techniques: Electrical Methods, in: Treatise on Geophysics (Second Edition), edited by: Schubert, G., Elsevier, Oxford, 233–259, https://doi.org/10.1016/B978-0-444-53802-4.00192-5, 2015.
Binley, A. and Slater, L.: Resistivity and Induced Polarization, in: Resistivity and Induced Polarization: Theory and Applications to the Near-Surface Earth, edited by: Binley, A. and Slater, L., Cambridge University Press, Cambridge, https://doi.org/10.1017/9781108685955, 2020.
Blanchy, G., Saneiyan, S., Boyd, J., McLachlan, P., and Binley, A.: ResIPy, an intuitive open source software for complex geoelectrical inversion/modeling, Comput. Geosci., 137, 104423, https://doi.org/10.1016/j.cageo.2020.104423, 2020.
Boaga, J., Phillips, M., Noetzli, J., Haberkorn, A., Kenner, R., and Bast, A.: A Comparison of Frequency Domain Electro-Magnetometry, Electrical Resistivity Tomography and Borehole Temperatures to Assess the Presence of Ice in a Rock Glacier, Front. Earth Sci., 8, 586430, https://doi.org/10.3389/feart.2020.586430, 2020.
Cicoira, A., Beutel, J., Faillettaz, J., and Vieli, A.: Water controls the seasonal rhythm of rock glacier flow, Earth Planet. Sc. Lett., 528, 115844, https://doi.org/10.1016/j.epsl.2019.115844, 2019.
Harris, C. and Davies, M. C. R.: Pressures recorded during laboratory freezing and thawing of a natural silt-rich soil, Proceedings 7th International Conference on Permafrost, Yellowknife, Canada, Collection Nordicana 55, 433–439, 1276, 1998.
Hauck, C.: New Concepts in Geophysical Surveying and Data Interpretation for Permafrost Terrain, Permafrost Periglac., 24, 131–137, https://doi.org/10.1002/ppp.1774, 2013.
Kenner, R., Pruessner, L., Beutel, J., Limpach, P., and Phillips, M.: How rock glacier hydrology, deformation velocities and ground temperatures interact: Examples from the Swiss Alps, Permafrost Periglac., 31, 3–14, https://doi.org/10.1002/ppp.2023, 2019.
Krainer, K. and Mostler, W.: Hydrology of Active Rock Glaciers: Examples from the Austrian Alps, Arct. Antarct. Alp. Res., 34, 142–149, https://doi.org/10.2307/1552465, 2002.
Kummert, M. and Delaloye, R.: Mapping and quantifying sediment transfer between the front of rapidly moving rock glaciers and torrential gullies, Geomorphology, 309, 60–76, https://doi.org/10.1016/j.geomorph.2018.02.021, 2018.
Mollaret, C., Hilbich, C., Pellet, C., Flores-Orozco, A., Delaloye, R., and Hauck, C.: Mountain permafrost degradation documented through a network of permanent electrical resistivity tomography sites, The Cryosphere, 13, 2557–2578, https://doi.org/10.5194/tc-13-2557-2019, 2019.
Musil, M., Maurer, H., Hollinger, K., and Green, A. G.: Internal structure of an alpine rock glacier based on crosshole georadar traveltimes and amplitudes, Geophys. Prospect., 54, 273–285, https://doi.org/10.1111/j.1365-2478.2006.00534.x, 2006.
PERMOS: Permafrost in Switzerland 2014/2015 to 2017/2018, 104 pp., https://doi.org/10.13093/permos-rep-2019-16-19, 2019.
PERMOS: PERMOS Database, Swiss Permafrost Monitoring Network, Fribourg and Davos, Switzerland [data set], https://doi.org/10.13093/permos-2022-01, 2022.
Posit team: RStudio: Integrated Development Environment for R, Posit Software, PBC, Boston, MA [code], http://www.posit.co/ (last access: 5 February 2023), 2022.
Pruessner, L., Huss, M., and Farinotti, D.: Temperature evolution and runoff contribution of three rock glaciers in Switzerland under future climate forcing, Permafrost Periglac. Process., 33, 310–322, https://doi.org/10.1002/ppp.2149, 2022.
R Core Team: R: A Language and Environment for Statistical Computing, R Foundation for Statistical Computing [code], Vienna, Austria, https://www.R-project.org (last access: 5 February 2023), 2022.
Rist, A. and Phillips, M.: First results of investigations on hydrothermal processes within the active layer above alpine permafrost in steep terrain, Norsk Geogr. Tidsskr., 59, 177–183, 2005.
Vonder Mühll, D. and Holub, P.: Borehole logging in Alpine permafrost, Upper Engadin, Swiss Alps, Permafrost Periglac. Process., 3, 125–132, 1992.
Wagner, T., Kainz, S., Helfricht, K., Fischer, A., Avian, M., Krainer, K., and Winkler, G.: Assessment of liquid and solid water storage in rock glaciers versus glacier ice in the Austrian Alps, Sci. Total Environ., 800, 149593, https://doi.org/10.1016/j.scitotenv.2021.149593, 2021.
Wirz, V., Gruber, S., Purves, R. S., Beutel, J., Gärtner-Roer, I., Gubler, S., and Vieli, A.: Short-term velocity variations at three rock glaciers and their relationship with meteorological conditions, Earth Surf. Dynam., 4, 103–123, https://doi.org/10.5194/esurf-4-103-2016, 2016.
Zenklusen Mutter, E. and Phillips, M.: Thermal evidence of recent talik formation in Ritigraben rock glacier: Swiss Alps, in: Resources and risks of permafrost areas in a changing world, edited by: Hinkel, K. M., Proceedings, Vol. 1: international contributions, The Northern Publisher, 479–483, 2012.