the Creative Commons Attribution 4.0 License.
the Creative Commons Attribution 4.0 License.
 | 08 Feb 2023
Wind conditions for snow cornice formation in a wind tunnel
Hongxiang Yu
Benjamin Walter
Jie Zhang
Ning Huang
Snow cornices growing on the leeward side of mountain ridges are common in alpine and polar regions during snow seasons. These structures may crack and fall, leading to an increase in avalanche danger. Although cornice formation has been observed in wind tunnel tests and the field, knowledge gaps still exist regarding the formation mechanism. This is particularly true with respect to wind conditions which favor cornice formation. To characterize the wind effects as the main factor for cornice growth, we carried out ring wind tunnel (RWT) experiments in a cold laboratory under various wind conditions. We quantitatively investigated the growth rate of the cornice in the horizontal and vertical direction as well as the airborne particle concentration. The results show that cornices only appear under a moderate wind speed range (1–2 times the threshold wind speed). The cornice growth rates in length and thickness are mainly determined by the combined effects of mass accumulation and erosion. The lower-limit wind speed for cornice growth is approximately equal to the threshold wind speed for snow transport. The upper limit of wind speed is when the erosion rate is higher than the deposition rate. The length growth rate of the cornices reaches a maximum for wind speeds approximately 40 % higher than the threshold wind speed. Moreover, a conceptual model for interpreting the cornice accretion mechanism is proposed based on the mass conservation and the results of the RWT experiments. The estimated suitable wind condition for cornice growth and formation are in good agreement with field observations in Gruvefjellet, Svalbard. Based on the physics of drifting snow, our results provide new insights into snow cornice formation and improve understanding of cornice processes that can influence avalanche activity. The experimental results and the conceptual model can be used in future snow cornice simulation and prediction work for cornice-induced avalanches.
- Article
(3324 KB) - Full-text XML
- Companion paper
- BibTeX
- EndNote


Snow cornices are leeward-growing masses of snow overhanging and extending horizontally beyond the edge, usually appearing on the ridgeline of steep mountains (Seligman et al., 1936). Some cornices deform, detach, and eventually fall off, which induces cornice fall avalanches or slope erosion and leads to a redistribution of the snow cover below (Wahl et al., 2009). For example, cornice fall avalanches accounted for 45.2 % of all 423 snow avalanches observed in the Longyearbyen area, central Svalbard, from 2006 to 2009. They triggered slab avalanches and loose snow avalanches as secondary avalanches on the slope below (Eckerstorfer and Christiansen, 2011). Cornice fall avalanches cause potential threats to local infrastructure and human lives.
Although understanding the initial evolution of cornices is a foundation for predicting and treating cornice fall avalanches, only a few studies have paid attention to the initial accretion process, especially to the horizontal extension forming the main part of the snow mass overhanging the edge of a mountain crest. Previous research has observed that cornices grow under moderate wind speeds. However, gaps remain regarding a general rule on suitable wind conditions for cornice growth. Montagne et al. (1968) measured a wind speed range between 7 and 15 m s−1 (at 0.35 m height) for cornice formation using a hand anemometer. Naito and Kobayashi (1986) identified wind speeds between 4 to 8 m s−1 as suitable for cornice formation at 1 m above the snow surface in the field and at the center (0.5 m height) in the wind tunnel. McClung and Schaerer (2006) estimated that the threshold wind speed for cornice growth and formation is about 5 to 10 m s−1 (at 10 m height), which is the threshold wind speed for loose snow transport and scouring happens when the wind speed exceeds 25 m s−1. Vogel et al. (2012) determined that cornice accretion occurs during periods with an average wind speed of 12 m s−1, and scour when the wind speed exceeds 30 m s−1 (at 2.8 m height). Hancock et al. (2020) used wind speed of 5 m s−1 (at 10 m height) as a conservative lower threshold for cornice accretion. However, to our best knowledge, these discrepancies and the conditions under which certain wind speed ranges apply have not been investigated. Furthermore, how the wind erosion threshold and thus cornice formation depend on the snow micro-structure properties like the snow grain size and dendricity has not been fully understood.
Indirect evidence was presented by van Herwijnen and Fierz (2014) that snow cornices only grow under moderate to strong winds, during or soon after snowfall. The cornice width from observation is in remarkable agreement with the wind drift index calculated by the snow cover model SNOWPACK (Lehning and Fierz, 2008), which indicates that snow mass transport plays an important role in cornice formation. However, cornices often grow through relatively discrete events in the field (Vogel et al., 2012; van Herwijnen and Fierz, 2014; Naito and Kobayashi, 1986; Hancock et al., 2020). Daily observations therefore only incompletely characterize cornice growth conditions. Due to the compromise of these field observations, continuous observations on individual cornice accretion and failure events are hard to achieve (Hancock et al., 2020). Specifically, measuring the horizontal growth of snow cornice (Vogel et al., 2012) and recording dynamic details of snow mass transport simultaneously is hard to achieve. There are only two laboratory experiments on cornice formation (Naruse et al., 1985; Naito and Kobayashi, 1986). Naito and Kobayashi (1986) carried out experiments both in the wind tunnel and in the field, observing the process of snow cornice growth. They described snow cornice formation as a process in which drifting snow particles adhere to one after another at the leeward edge. The thin snow slab formed in this way and elongating leeward then hangs down under its own weight. Their results show that suitable conditions for cornice growth include air temperatures of −20 to 0 ∘C, wind speeds of 4 to 8 m s−1, and irregular dendritic-shaped snowflakes with larger contact surface. However, quantitative descriptions of this process have not been reported, and further quantitative analysis of experiments has not been carried out. Moreover, the locations such as cornice-like deposition at the ridge are well predicted in numerical simulations using Alpine3D (Lehning et al., 2006) and ARPS (Mott et al., 2010), but the cornice shape cannot be represented.
Therefore, wind tunnel experiments under controlled environmental conditions and quantitative descriptions of the individual cornice formation process as a pathway to improve the understanding of cornice dynamics in the field, particularly on the wind effects on cornice formation, are essential. In this work, wind tunnel experiments of snow cornice evolution on the edge of a small-scaled mountain ridge model carried out in a cold laboratory at the WSL Institute for Snow and Avalanche Research (SLF) are presented. A quantitative analysis of the effect of wind conditions on snow cornice formation is presented. Section 2 presents the experimental setup in the cold laboratory and the post-processing method for the cornice images. General features of the snow cornice observed in the experiment under variable wind conditions are shown in Sect. 3. Finally, a conceptual model for the growth rates of snow cornices based on mass conservation is proposed in Sect. 4. Its application for field observations is discussed. Section 5 summarizes the conclusions and outlook.
2.1 Experimental setup
The experiments were carried out in a cold laboratory of the SLF in Davos, Switzerland, where the room temperature can be controlled from −25 to 0 ∘C. An obround, closed-circuit wind tunnel built by Sommer et al. (2017, 2018) was used to perform the investigations. During the experiments, the room temperature of the cold laboratory was set to be −5 ∘C. At this temperature, the cohesion of snow particles is significantly enhanced compared with colder temperatures (Tobias et al., 2022).
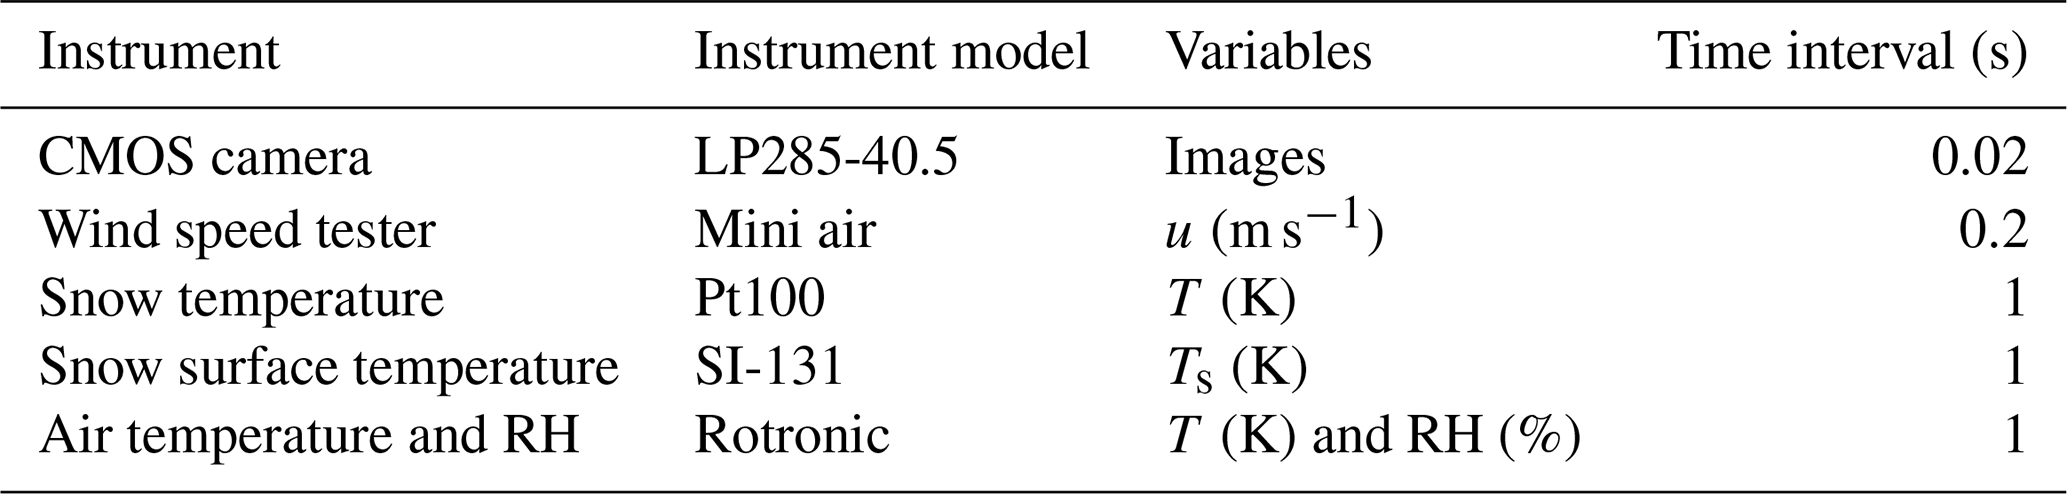
The schematic diagram of the experimental setup is shown in Fig. 1. The ring wind tunnel (RWT) contains two straight sections (length: 1 m, marked as S1 and S2) and two half-circle sections (outer diameter: 0.6 m, marked as H1 and H2). Its cross-section area is 0.2 m (width) × 0.5 m (height). An electric motor with rotor blades installed inside the middle of H1 creates the wind flow with a wind speed range of 0–8 m s−1. A sieve is installed at S1, where the tunnel has an upward open window to supply snow particles. Sensors monitoring the air conditions are installed at the inlet of S2. The details of the sensors are listed in Table 1. The ridge model in S2 with the fixed size and place is built with compacted snow each time before the experiment. The size of the ridge model was set as 0.125 m in height and with a 0.1 m flat section. The slope angle relative to the horizontal direction is 36∘. To record the growth of the cornice using shadowgraphy imaging, we placed a CMOS Camera with a spatial resolution of 2048 × 2048 pixels to zoom on the edge of the ridge. We placed an LED lamp on the opposite side for illumination.
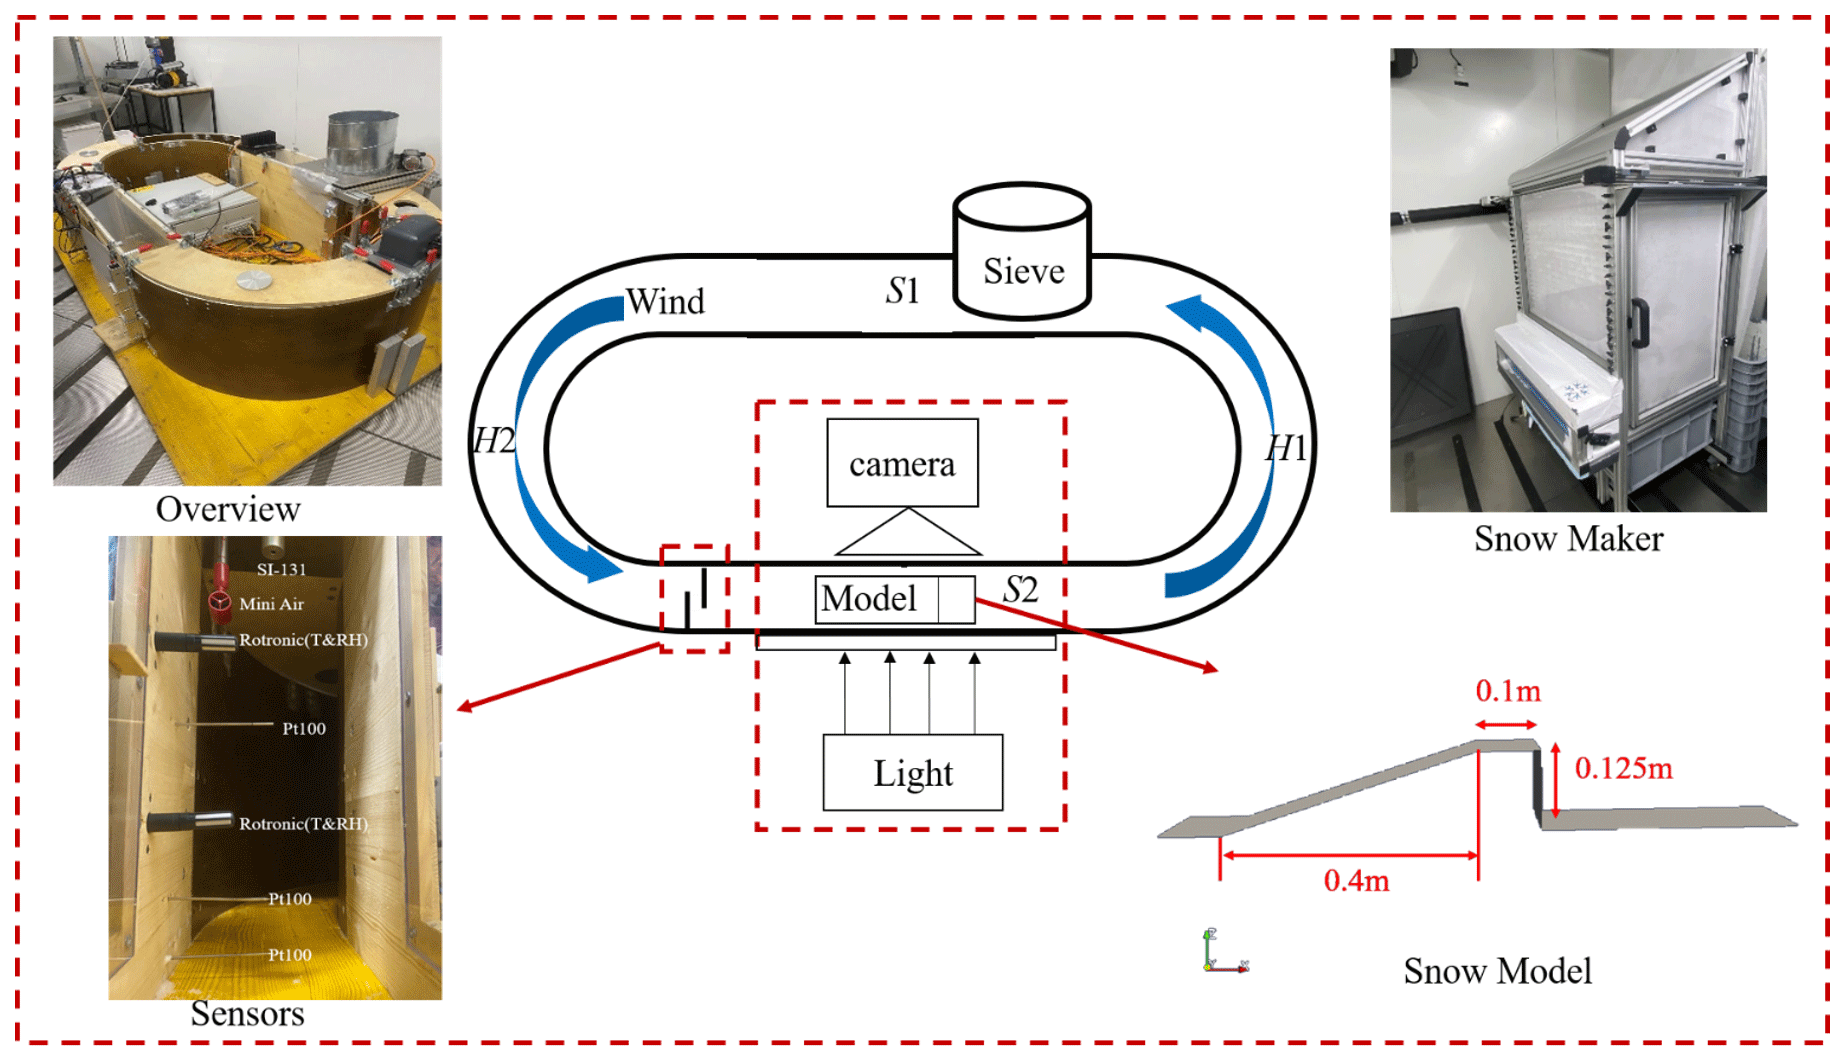
Figure 1Schematic diagram of the closed-circuit tunnel experimental system in the cold lab. The insets are the pictures of the RWT, snow maker, sensors and the snow model setup inside the RWT.
Fresh snow particles made with a snow maker developed at SLF (Schleef et al., 2014) were used for feeding the flow through the sieve. When using the snow maker, the room temperature was set to −20 ∘C, and the water inside the snow maker reservoir was set to 30 ∘C. The obtained fresh snow is a mixture of dendritic crystals and hollow columns. The average diameter was about 300–500 µm, estimated by a grid plate and an amplifying lens. The specific surface area (SSA) was about 40–60 mm−1 for the snow that was stored for a few days up to a week (Schleef et al., 2014). A constant seeding rate is applied for all experimental tests, and the wind tunnel is cleaned up before each test. Impact threshold wind speed in the experiment is determined (1) by increasing the wind speed from 0 until saltating particles can be observed and (2) by decreasing the wind speed slowly until snow saltation is not visible anymore. The average wind speed at these two times is considered the impact threshold wind speed (Walter et al., 2014). The average impact threshold wind speed was 3.2 m s−1 at the height of the mini air wind sensor. Thus, seven target wind speed conditions (from 3.0 to 6.0 m s−1 by steps of 0.5 m s−1) were set for the experiments. Once the propeller starts to rotate, the wind speed increases until it reaches the target value. The propeller's angular velocity is adjusted throughout the experiment to keep the wind speed constant.
2.2 Image processing
The CMOS camera recorded 50 images with a frequency of 10 Hz in the burst mode, and the pause between two bursts was 5 s. Thus, 50 continuous frames in 5 s as one set was obtained, which could be used to estimate the cornice growth rate and transport mass flux instantaneously or on average. The first image, in which only the ridge model was visible without snow particles moving across, was set as a background image, as shown in Fig. 2a. For a set of 50 frames, the images were subtracted from the background image (only with the ridge model) and transformed to binary format (where the grayscale value of pixels is 1 with snow and 0 without snow), as shown in Fig. 2c–e. The cornice length L and cornice thickness H are calculated based on the binary images (Fig. 2c–d). To avoid a wrong interpretation (as erosion or deposition) of the shape effect of bending, we used the thickness of accumulation mass on the flat area as the indicator of vertical accumulation and erosion of the cornice in the following analysis.
The instantaneous cornice growth or erosion rate in thickness and in length are then calculated as the difference between two adjacent frames divided by the time difference between two images Δt:
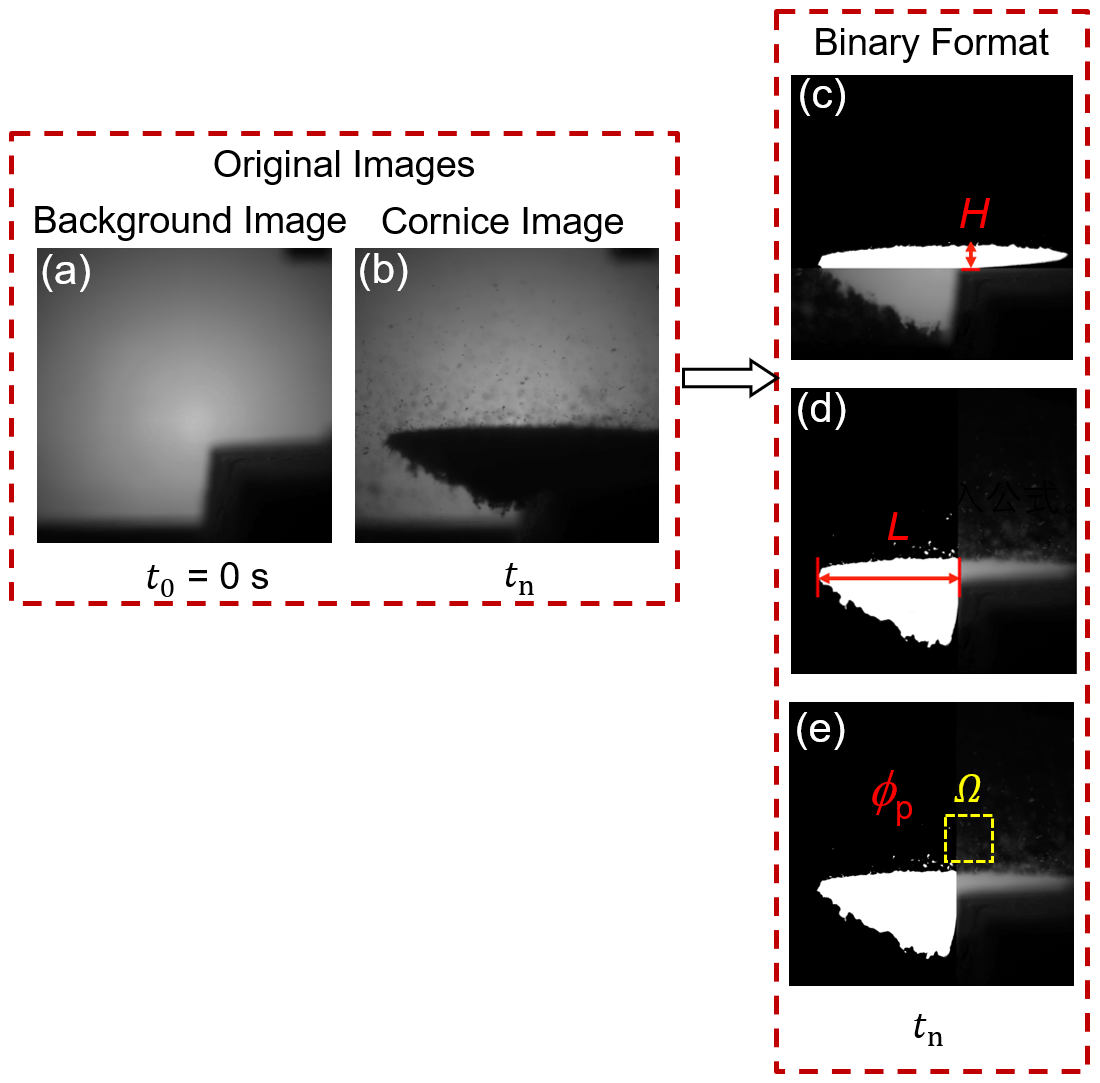
Figure 2Post-processing images using the grayscale method. Raw images of background (a) and cornice (b). The binary format of images with information of thickness accumulation H (c), length growth L (d), and airborne snow particle mass concentration ϕp captured in window Ω (e).
The averaged deposition rates in length and in thickness are calculated as the sum of the growth rate and the absolute value of erosion rate:
A window Ω with an area of 1 cm × 1 cm slightly above the snow cornice is chosen to calculate the mean mass concentration of particles in the air as shown in Fig. 2e. Ignoring the overlapping particles, we calculate the total volume of snow particles in Ω as the orthographic projection area of snow particles multiplied by its average diameter. Thus, the mass concentration ϕp can be estimated as
where ρi is the ice density, dp is the averaged diameter, gj is the binary value of the jth pixel in window Ω, cm2 is the area of a pixel, S0=1 cm2 is the area of the window Ω, p=3.5 cm is the depth of field where particles can be detected in this width range (Crivelli et al., 2016). The transport mass flux qp can be estimated using
The transport mass flux profile can be described by an exponential law (Nishimura and Nemoto, 2005; Sugiura et al., 1998):
where A and R0 are empirical coefficients that change with wind speed. The transport rate Q can be obtained by integrating the mass flux profiles over height:
To quantify the exchange of snow between the mass flux and the cornice, we defined the relative mass flux collection efficiency as
where is the growth rate of the cornice projected area Ac and ρc=147 kg m−3 is the average snow density of the cornice as measured during the experiments. This value is close to the fresh snow and lower than that in the field of ∼ 300 kg m−3 (Naruse et al., 1985), which might be related to the long-term compaction of the snowpack in the field.
3.1 General observations on snow cornice formation
By post-processing the high-speed camera images from the experiments, the profiles of the snow cornice are obtained as shown in Fig. 3a. The time series of the cornice length L, thickness H, and the mass concentration of airborne snow ϕp are then estimated as shown in Fig. 3b. Here, we use the case of wind speed u=4 m s−1 as an example to present the cornice growth process. As is shown in Fig. 3b, the cornice size information associated with wind speed and particle mass concentration are presented. The wind speed increased from 0 to 4 m s−1 in about 210 s and was then kept stable during the cornice formation process. The particle mass concentration started to increase at t=176 s (marked as a black dashed line: u=ut) and reached a stable value at t=250 s. The cornice started to grow when the wind speed exceeded the threshold. The growth rate was not stable at first because the initial growth of cornice is in intermittent drifting snow when the aerodynamic entrainment is still dominant in the initial stage of drifting snow (Li et al., 2018). The linear length growth stage is when the wind speed and mass concentration values become stable.
During cornice accretion, there are two stages for the growth of the cornice. In the first stage, a few particles stop at the edge and compose a 0.011 m small and thin slab that forms leeward of the ridge model's edge. The shape profile of this slab is shown from t1 to t3 in Fig. 3a. In the second stage (from t=320 s in Fig. 3b), the cornice thickness grows simultaneously with the length. With more layers overlapping on the surface, the cornice starts bending down slightly.
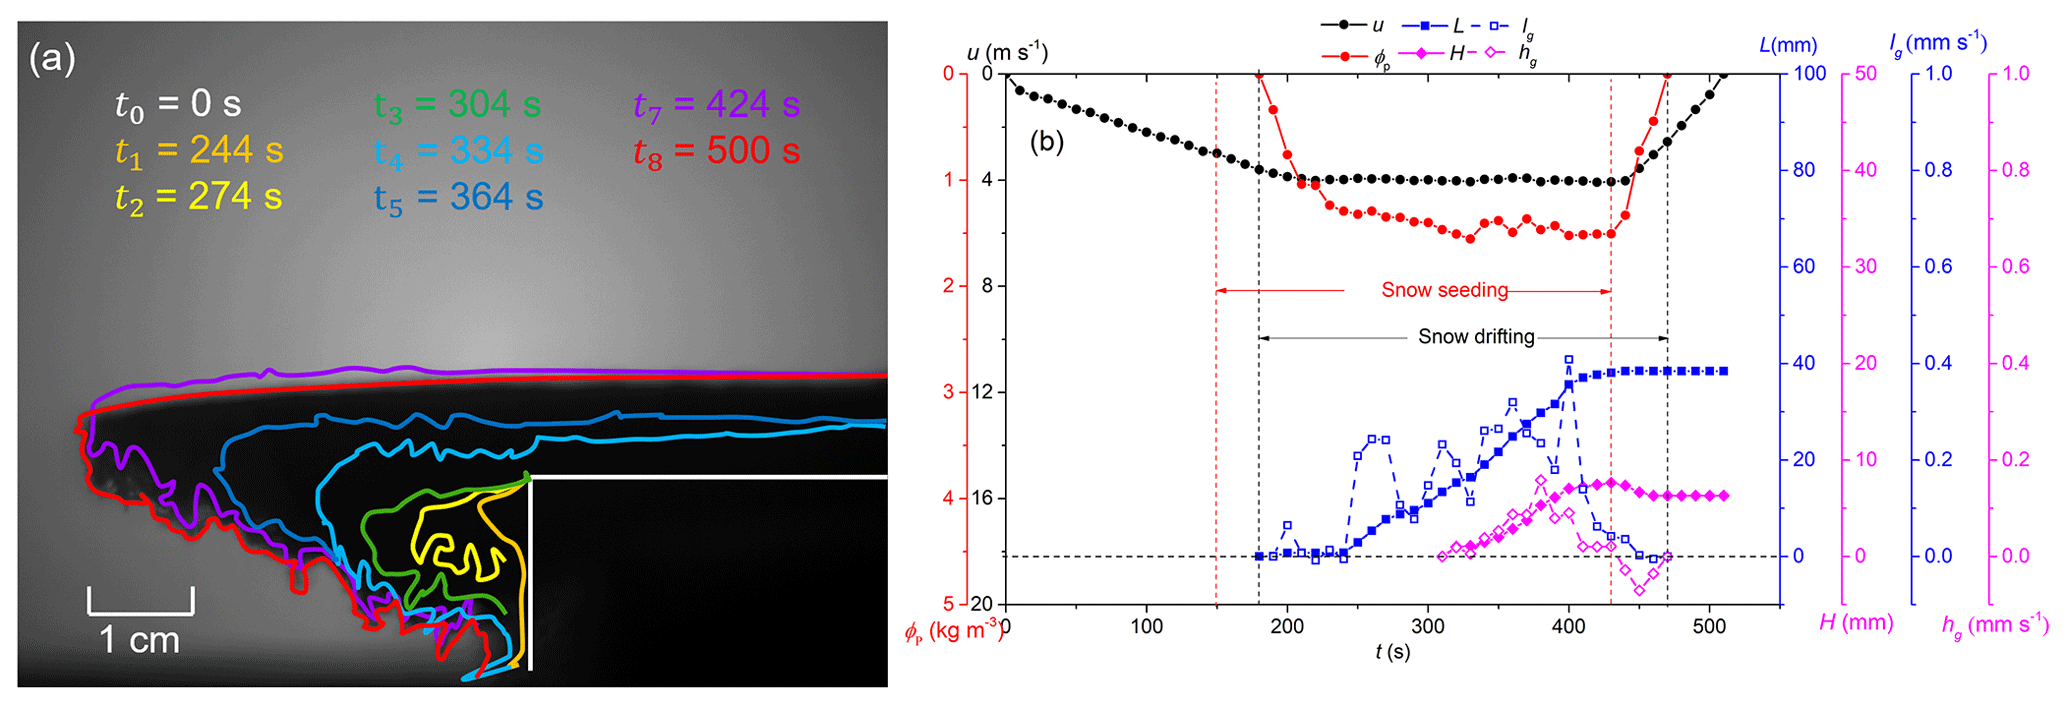
Figure 3(a) Cornice profiles in the growth process. (b) Variation in cornice length (blue squares), thickness (pink diamonds), length growth rate (hollow blue squares), cornice thickness growth rate (hollow pink diamonds), wind speed (black circles), and particle mass concentration in the air (red circles).
When the cornice length reaches the boundary of the image, we stopped seeding and erosion then reduces the thickness of the snow cornice. The downward bending continues (outlines from t7 to t8 in Fig. 3a and t=430–440 s in Fig. 3b). During this period, aerodynamic entrainment dominates the erosion process. As is shown in Fig. 3b, the mass flux markedly decreases as the aerodynamic entrainment is inhibited by the surface morphology formed during the redistribution of the snow deposition in the RWT.
3.2 Mass flux and collection efficiency
Since the magnitude of drifting snow is critical for the vertical and horizontal cornice growth rates, the mass transport rates were calculated for the different experiments and analyzed in terms of mass exchange between the cornice and the saltation layer. The mass flux variation with height over snow cornices can be estimated by multiple windows Ω that are continuously distributed in height, as is shown in Fig. 4. The mass flux exponentially decreases with the increasing height in each wind condition, and its value increases with the wind speed, which is consistent with previous results (Takeuchi, 1980; Lehning et al., 2002; Kosugi et al., 2008; Lü et al., 2012; Crivelli et al., 2016; Melo et al., 2022).

Figure 4Mass flux variation with height under different wind conditions (3.5–6 m s−1). The dashed lines are exponentially fitted.

By fitting Eq. (7) using the estimated mass flux from the shadow images, we obtain A and R0 for different wind speeds, as summarized in Table 2. Their fitted functions are and . As is shown in Fig. 4, the transport mass flux profile can be described by an exponential law (Nishimura and Nemoto, 2005; Sugiura et al., 1998).

Figure 5Collection efficiency E (in blue) and snow transport rate Q (in red) under different non-dimensional wind speeds . X represents the distance from the snow particle feeding point to the mass collection pits where the cornice grows. Lines are for ring wind tunnel experiments, and hollow scatters are for N&K86. N&K86 represents the experiment results of Naito and Kobayashi (1986).
A non-dimensional wind speed is defined here to compare it with the experimental results of Naito and Kobayashi (1986) (N&K86 hereafter). In this definition, ut is the threshold wind speed which can be regarded as the lower-limit wind speed value for cornice growth. As is shown in Fig. 5, the mass collection efficiency in both N&K86 and our experiment decreases with the increasing wind speed and the corresponding drift rate. Our measured values for the collection efficiency are in the same order of magnitude as in N&K86. Due to the limited data and unpublished details in the study of N&K86, we could not make a deeper comparison.
The collection efficiency cannot directly reflect the cornice growth characteristics because it represents the proportion of snow particles passing through the edge and stopping at it. This value only reflects the effective contribution of the drifting snow to the snow cornice formation under different wind conditions. Thus, to characterize the growth rate of the cornice, it is necessary to analyze the absolute number of accumulated particles as a function of time and wind speed which is introduced in Sect. 3.3.
3.3 The suitable wind speed range for cornice formation
Cornice formation was tested with wind speeds from 3.0 to 6.0 m s−1 using 0.5 m s−1 increments. For each wind condition, the averaged cornice growth rates in length and thickness are and (with seeding) and erosion rates: and (without seeding) are obtained by taking the average of the growth/erosion rates during the linear increase/decrease in the length/height, as is shown in the Fig. 3. Thus, the averaged deposition rates in length and thickness can be calculated using Eqs. (3)–(4).
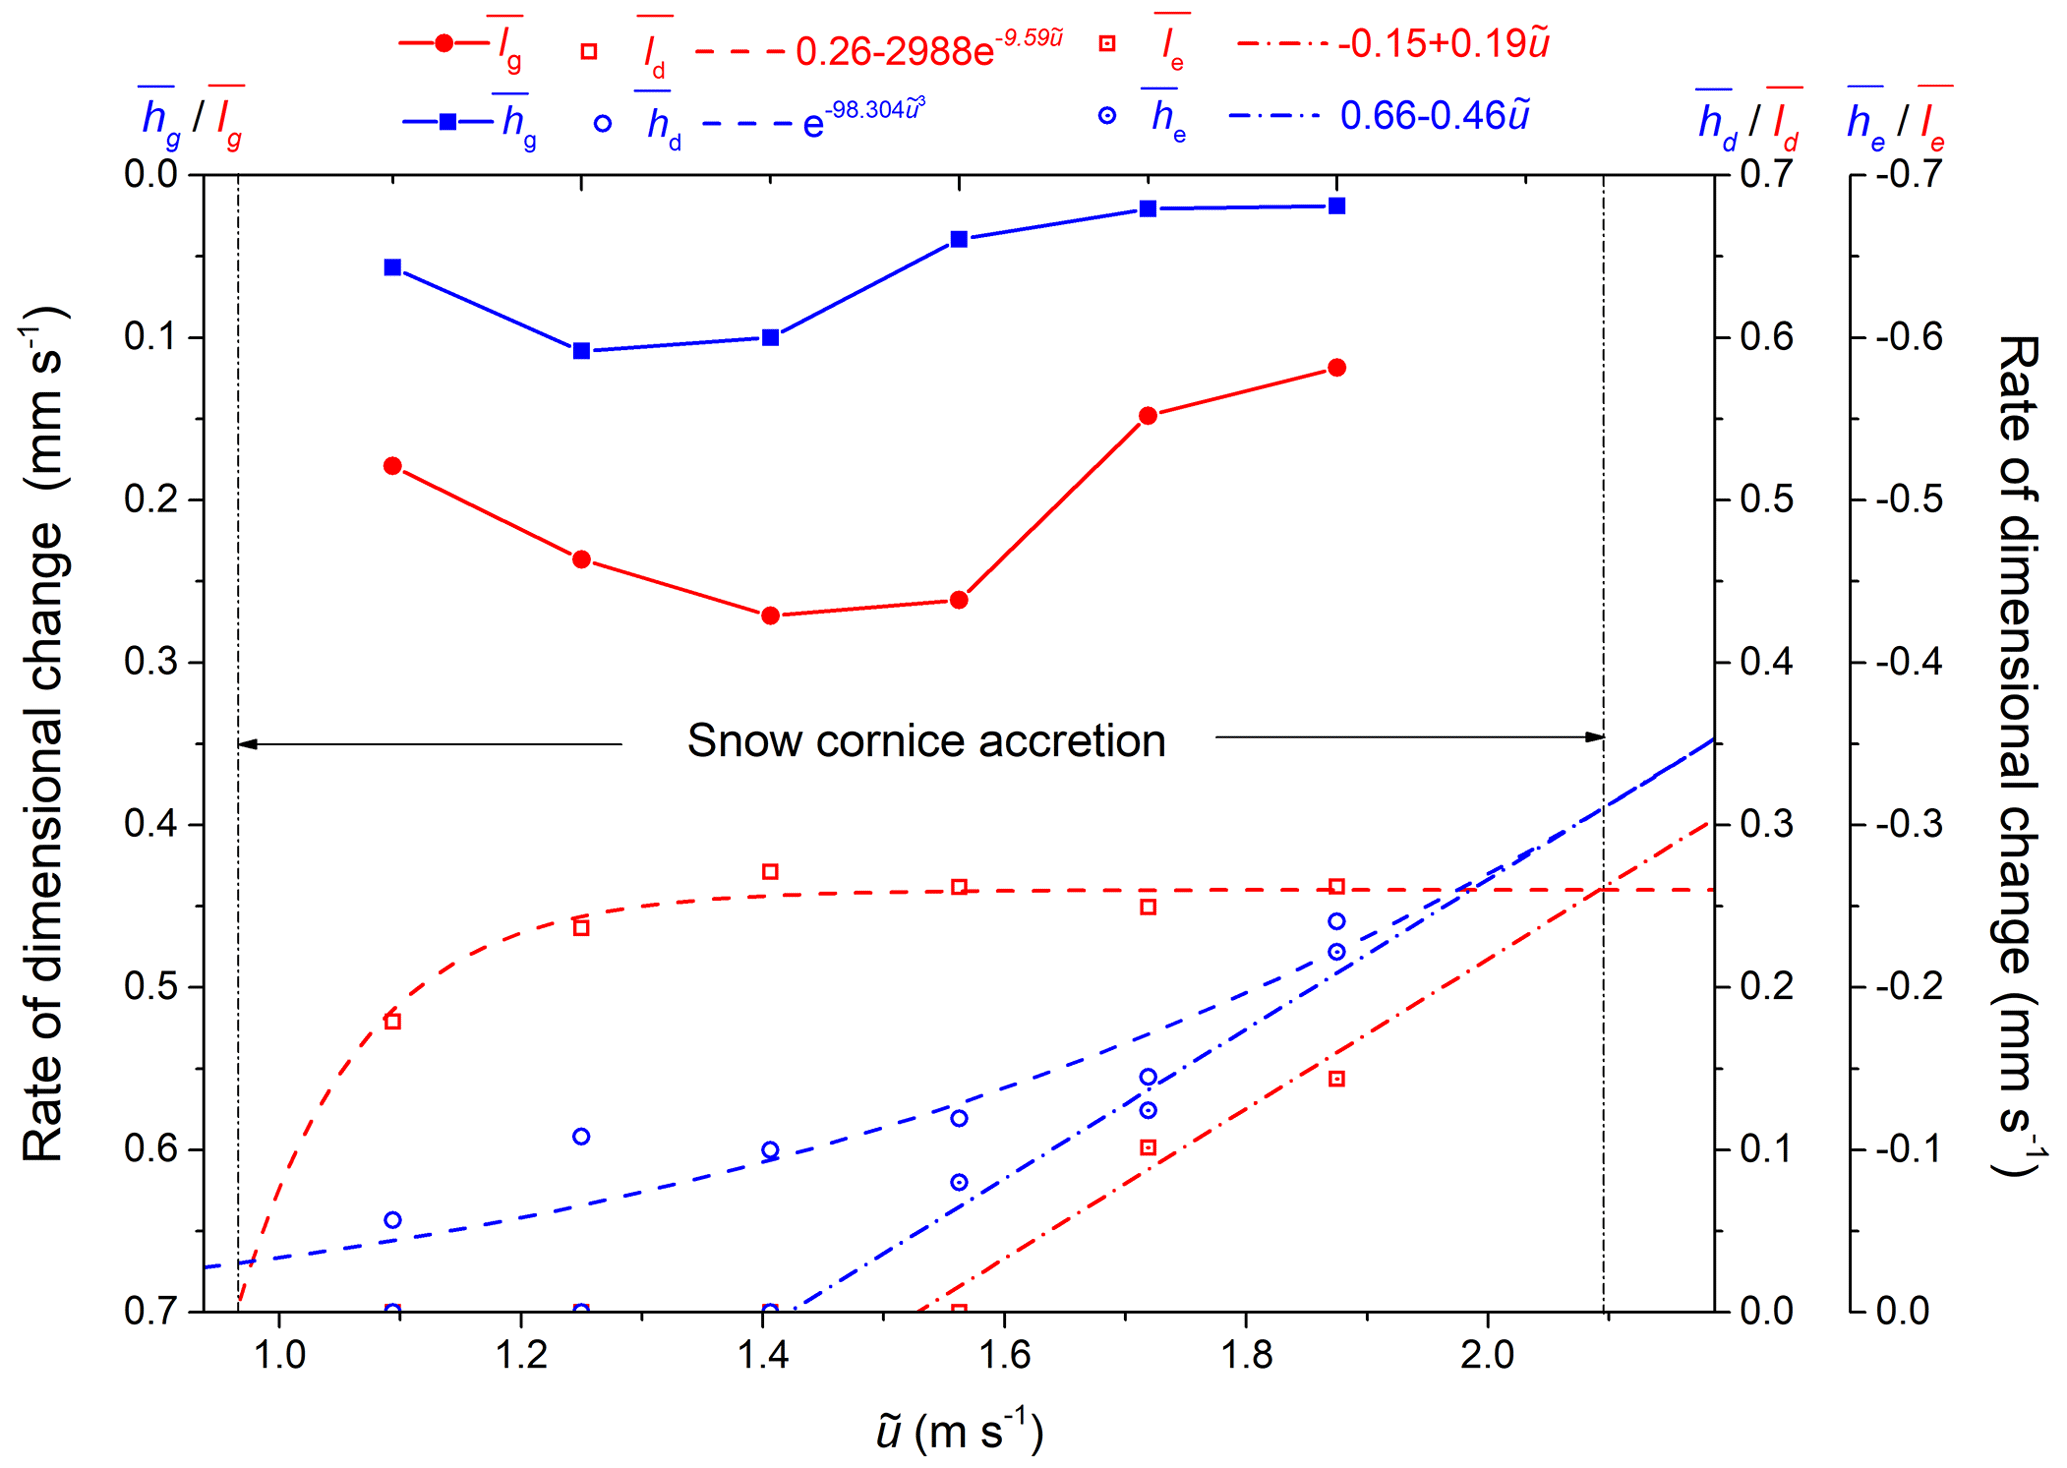
Figure 6Averaged growth rates, erosion rates, and deposition rates in length and thickness under different wind conditions. The fitted functions are plotted as dashed lines.
As is shown in Fig. 6, there is no cornice formation for wind speeds lower than the threshold wind speed because of a missing saltation layer and snow transport. The extension line of the deposition rate in length tends to 0 around the threshold wind speed for snow transport. Thus, we can conclude that the lower-limit wind speed for cornice accretion is close to the threshold wind speed for snow transportation, which is consistent with the field study (McClung and Schaerer, 2006; Hancock et al., 2020).
The averaged cornice length growth rate (equal to ) reaches its maximum when the wind speed is approximately 40 % higher than the threshold wind speed. The averaged erosion rates in length and thickness approximately linearly increase with the wind speed. In the cornice growing process, the averaged length growth rate () is higher than the averaged thickness growth rate () at all wind speed conditions. The erosion in length takes place later than in thickness, and the averaged thickness erosion rate is always approximately 30 % higher than the length erosion rate ().
The averaged deposition rate in length increases rapidly at first and stabilizes with wind speed, while the averaged erosion rate in length linearly increases with the wind speed. The values of and arrive equivalently in wind conditions of about 6.5 m s−1, at which point the mass of the accumulation and the erosion is balanced. Thus, the upper-limit wind speed of snow cornice formation in our case is 6.5 m s−1, which is 2 times the threshold wind speed.
Overall, the cornice growth process has two stages: in the first stage, a thin slab grows and overhangs at the edge. In the second stage, cornice thickness and length both increase simultaneously. The collection efficiency, reflecting the effective contribution of the drifting snow to the snow cornice formation, cannot directly reflect the cornice growth characteristics. Instead, the deposition rates, the erosion rates, and the growth rates both in length and thickness were analyzed separately for all wind conditions. From the results we can conclude that in all wind conditions, the cornice starts to grow when the wind speed exceeds the threshold value and starts to scour when the erosion rate is higher than the deposition rate. The cornice only grows at a moderate wind speed range (1–2 ut). The length erosion rate of the cornice is typically 30 % lower relative to the thickness erosion rate. The presented framework for characterizing cornice accretion may provide a basis for future field and laboratory studies under different conditions.
From the experimental results, we can conclude that cornice growth is a process of mass accumulation overgrowing the ridge under the action of wind force, accompanied by bending and erosion. The growth process of a snow cornice has two stages, which can be described with a schematic shown in Fig. 7. The first stage can be assumed to be a formation of a 1–2 particle diameters thick snow slab composed of particles sticking horizontally to the edge (see Fig. 3a and b). The first process is mainly determined by the spatial variation in the mass transport rate along the flow direction. The second stage can be assumed to be a repeated process of length growth and then thickness growth. The length growth is regarded as a horizontal creeping of the newly formed snow layer, driven by the drifting snow. The thickness growth is regarded as a comprehensive result of particle deposition and erosion at the edge. Thus, the second growth process is mainly dependent on the wind speed, the non-dimensional, spatial variation in mass concentration, and the particle interaction force.
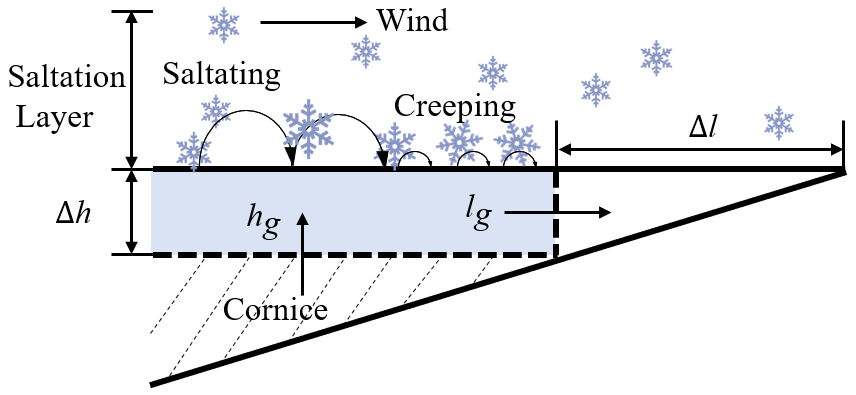
4.1 A conceptual model for cornice formation
In this section, we analyze the snow cornice as the shaded area shown in Fig. 7. Based on the law of mass conservation, the cornice thickness growth rate hg can be calculated as the difference between the deposition rate in thickness hd and the thickness erosion rate he, in which the deposition rate in thickness is calculated by the deposition rate of mass on the surface per unit of time. Thus, the thickness growth rate hg can be written as
where Kd is the deposition coefficient.
The cornice length growth is regarded as the forward creeping of the surface layer, which is driven by the drifting snow saltation. The cornice length growth rate lg can be estimated as the difference between the deposition rate in length ld and the length erosion rate le. In which ld is regarded as the horizontal moving distance Δl of a newly formed snow layer (blue area in Fig. 7) with 1–2 particle diameters in thickness Δh per unit time. The deposition rate in length ld is related to the mass transport rate Q and the non-dimensional horizontal collection coefficient fl:
As we already measured the cornice thickness growth rate hg, thickness erosion rate he, the cornice length growth rate lg, length erosion rate le, the air mass concentration ϕp, the mass transport rate Q, the deposition coefficient, and the horizontal collection rate can be estimated as and , which exponentially decrease with the wind speed, as shown in Fig. 8. Although deposition and collection coefficients are largest at the lowest wind speeds, the total mass flux is still too small to result in a significant length/height growth. At around 40 % above the threshold, Qfl are at a maximum, resulting in the strongest length growth rates lg. The net height and length growth rate from Eq. (10) and Eq. (11) together with the deposition collection rates from Fig. 8 can be used to simulate cornice accretion for a wide range of atmospheric conditions.
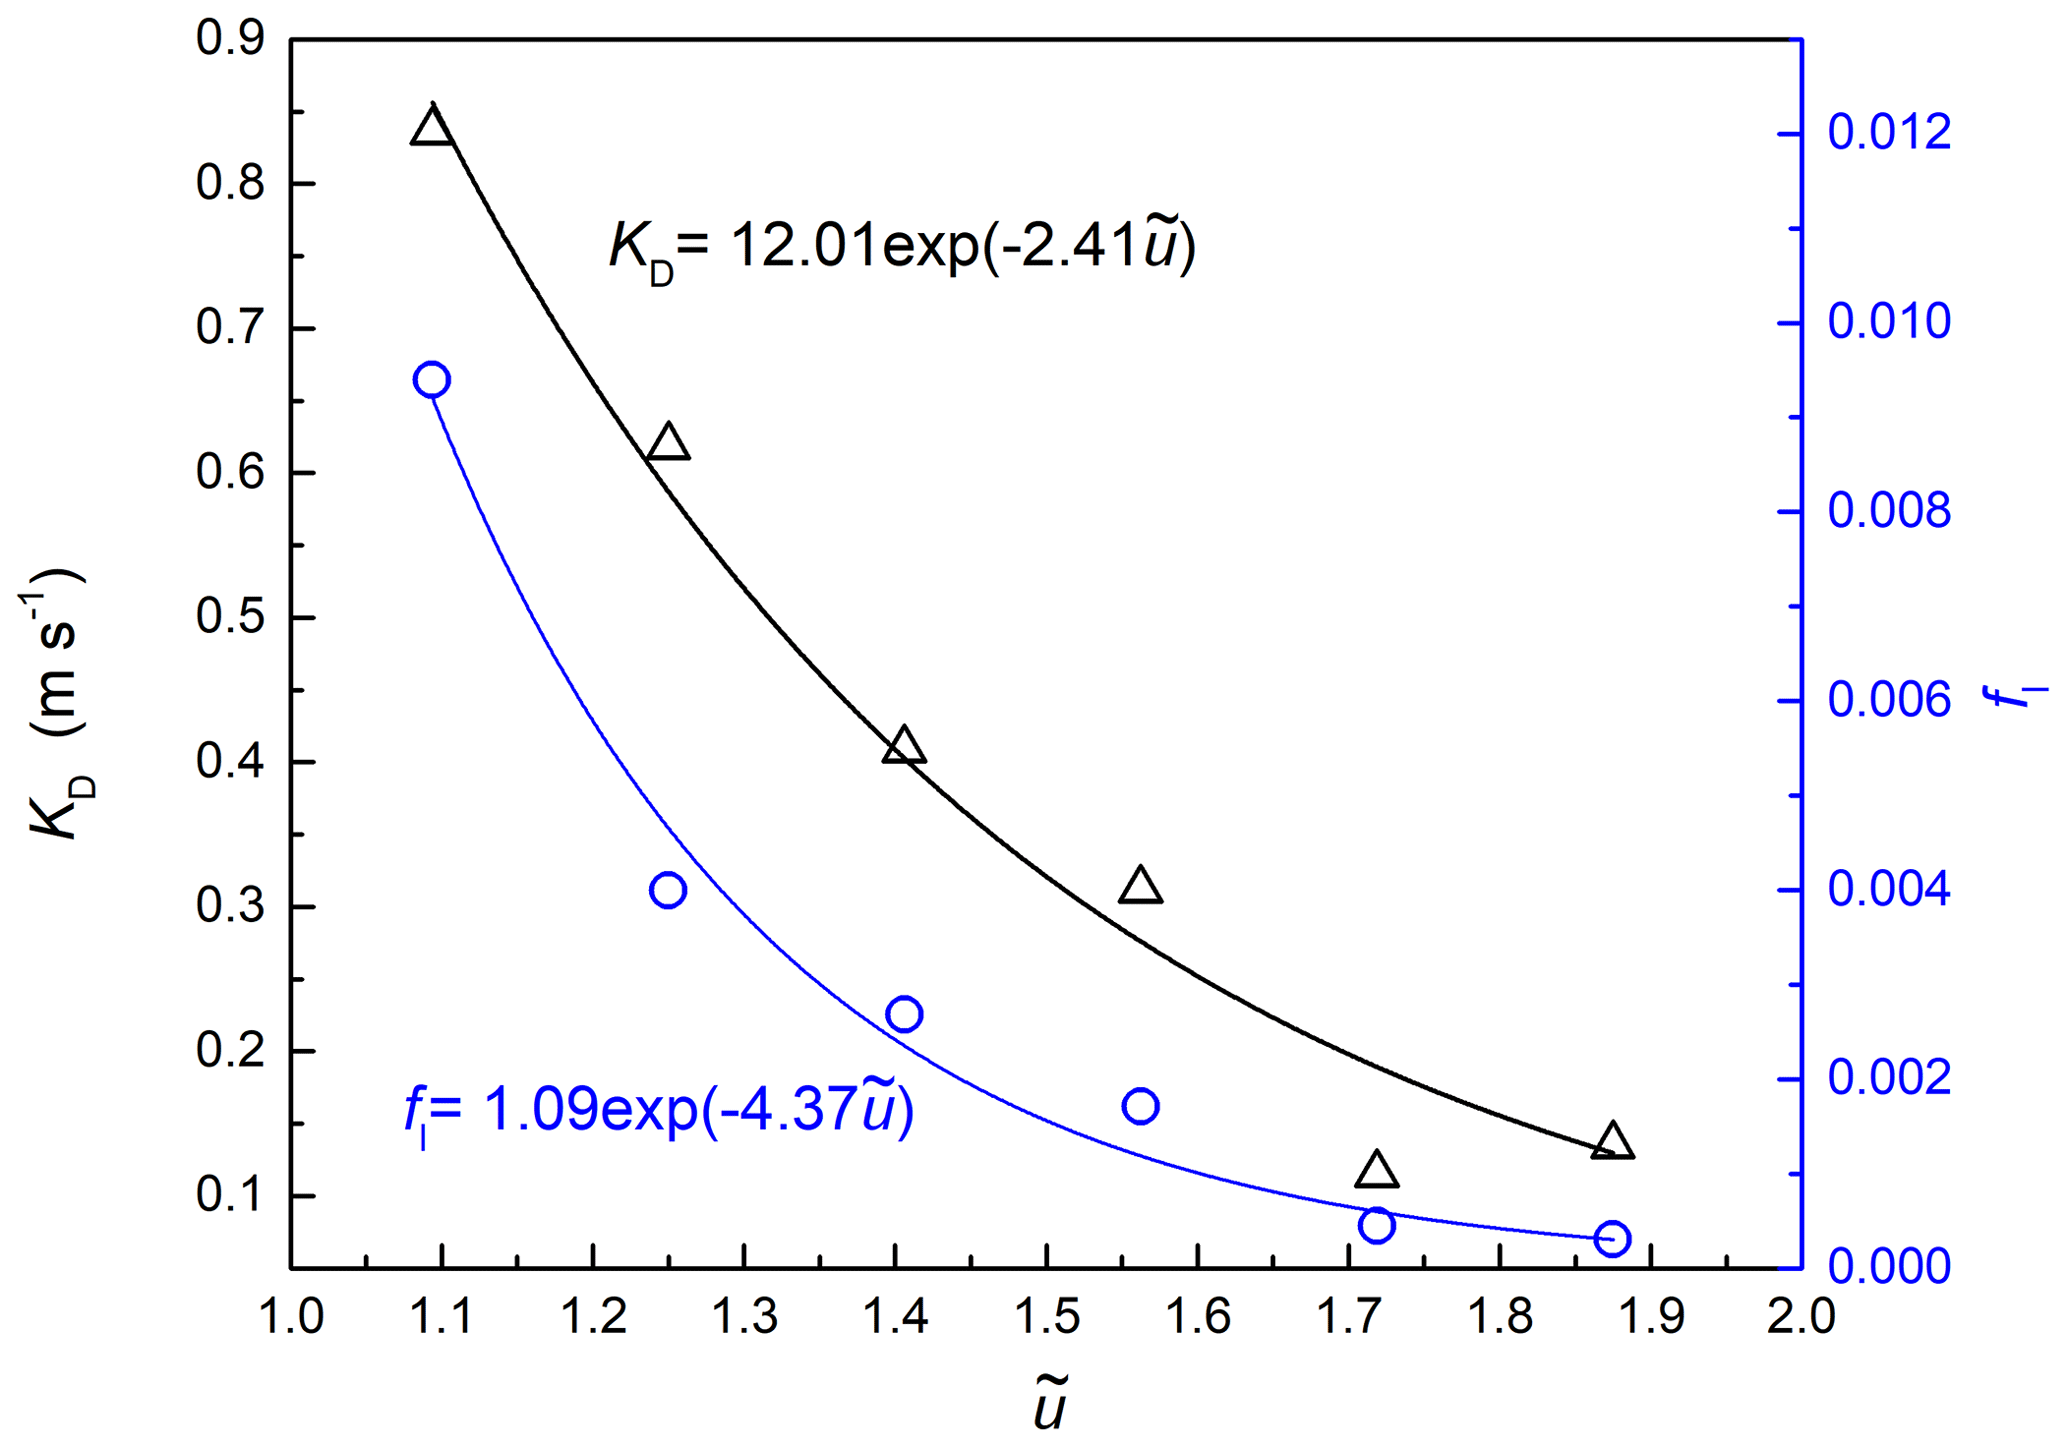
Figure 8Deposition coefficient and the horizontal collection rate in all wind conditions. The solid lines are the fit curves.
4.2 Field predictions
To validate our conceptual model introduced in Sect. 4.1, we compare the results with two cases of field observations.
4.2.1 Case I: comparison of suitable wind condition with Vogel et al. (2012)
Vogel et al. (2012, abbreviated VF2012) showed cornice evolution along the ridgeline of the Gruvefjellet plateau mountain above Nybyen in the period 2008–2010. They found that the cornice accretion happened during the entire snow season, when the averaged hourly maximum wind speeds exceeded 12 m s−1, with a minimum of at least 10 m s−1. It should be noted here that by analyzing the time series of wind speed data from Gruvefjellet meteo station (Web Publisher v4.2.0.28, 2022), the corresponding average wind speed is found to be 7.37 ± 0.97 m s−1 when the maximum wind speed is in the range of 10.5 to 11.5 m s−1. Thus, the friction velocity is 0.29 m s−1 assuming a roughness length z0 = 10−4 m. This value is comparable to the threshold wind speed in previous research (Sugiura et al., 1998; JDoorschot et al., 2004; Clifton et al., 2006), considering the harder snow surface in Gruvefjellet (Eckerstorfer et al., 2013).
Considering that the cornice accretion always appears in snowstorms, we assume that the snow transport rate Q in the field can be expressed as the same value as it has in the saturated saltation (Vionnet et al., 2014):
where is the friction velocity which is calculated with the field wind speed uf at height zf=2.8 m. κ=0.4 is the Von Kármán constant, g=9.8 m s−2 is the gravitational acceleration, and z0 is the aerodynamic roughness length. u*t is the threshold friction velocity which is calculated based on the local threshold wind speed ut.
Then we can estimate the potential maximum erosion rate as the aerodynamic entrainment rate by
where is the mass of a snow particle, in which the average particle diameter dp in the field is assumed to be 300 µm (Nishimura et al., 2014). grains N−1 s−1 is an empirical parameter (Clifton and Lehning, 2008).
Considering that the ratio of erosion rate in thickness and length is about 0.7, we can rewrite the length growth rate lg in Eq. (11) as
Thus, we could infer that the length growth rate lg is only dependent on variables of the field wind speed uf, the threshold wind speed ut, and the roughness length z0. To test the sensitivity of the input parameters, we choose different z0 and ut to estimate the length growth rate in the wind speed range of VF2012, shown in Fig. 9. The automatic weather station in Gruvefjellet is located at ∼ 300 m from the cornice on the plateau. The wind station is on a flat field, and the roughness length z0 can be assumed to be the measurement values on the flat snow surface. The roughness lengths z0 vary in snow covers (Clifton et al., 2006), typically over 2 orders of magnitude: from 10−5–10−3 m for fresh snow in the field (Brock et al., 2006; König-Langlo, 1985). As is shown in Fig. 9, the roughness length and the threshold wind speed only have effects on the magnitude of the maximum value of growth rates, while the suitable non-dimensional wind speed range remains the same. The predicted wind range for snow cornice formation is about 1–2.3 times the threshold wind speed, namely 10–22.6 m s−1, which agrees with the field observations. And the maximum cornice growth is for winds about 30 % higher than the threshold wind speed. There are no available length growth rate data in VF2012, so we use the following case to validate the length growth rate. Because it is at the same site, we use m and ut=10 m s−1 in the following modeling.
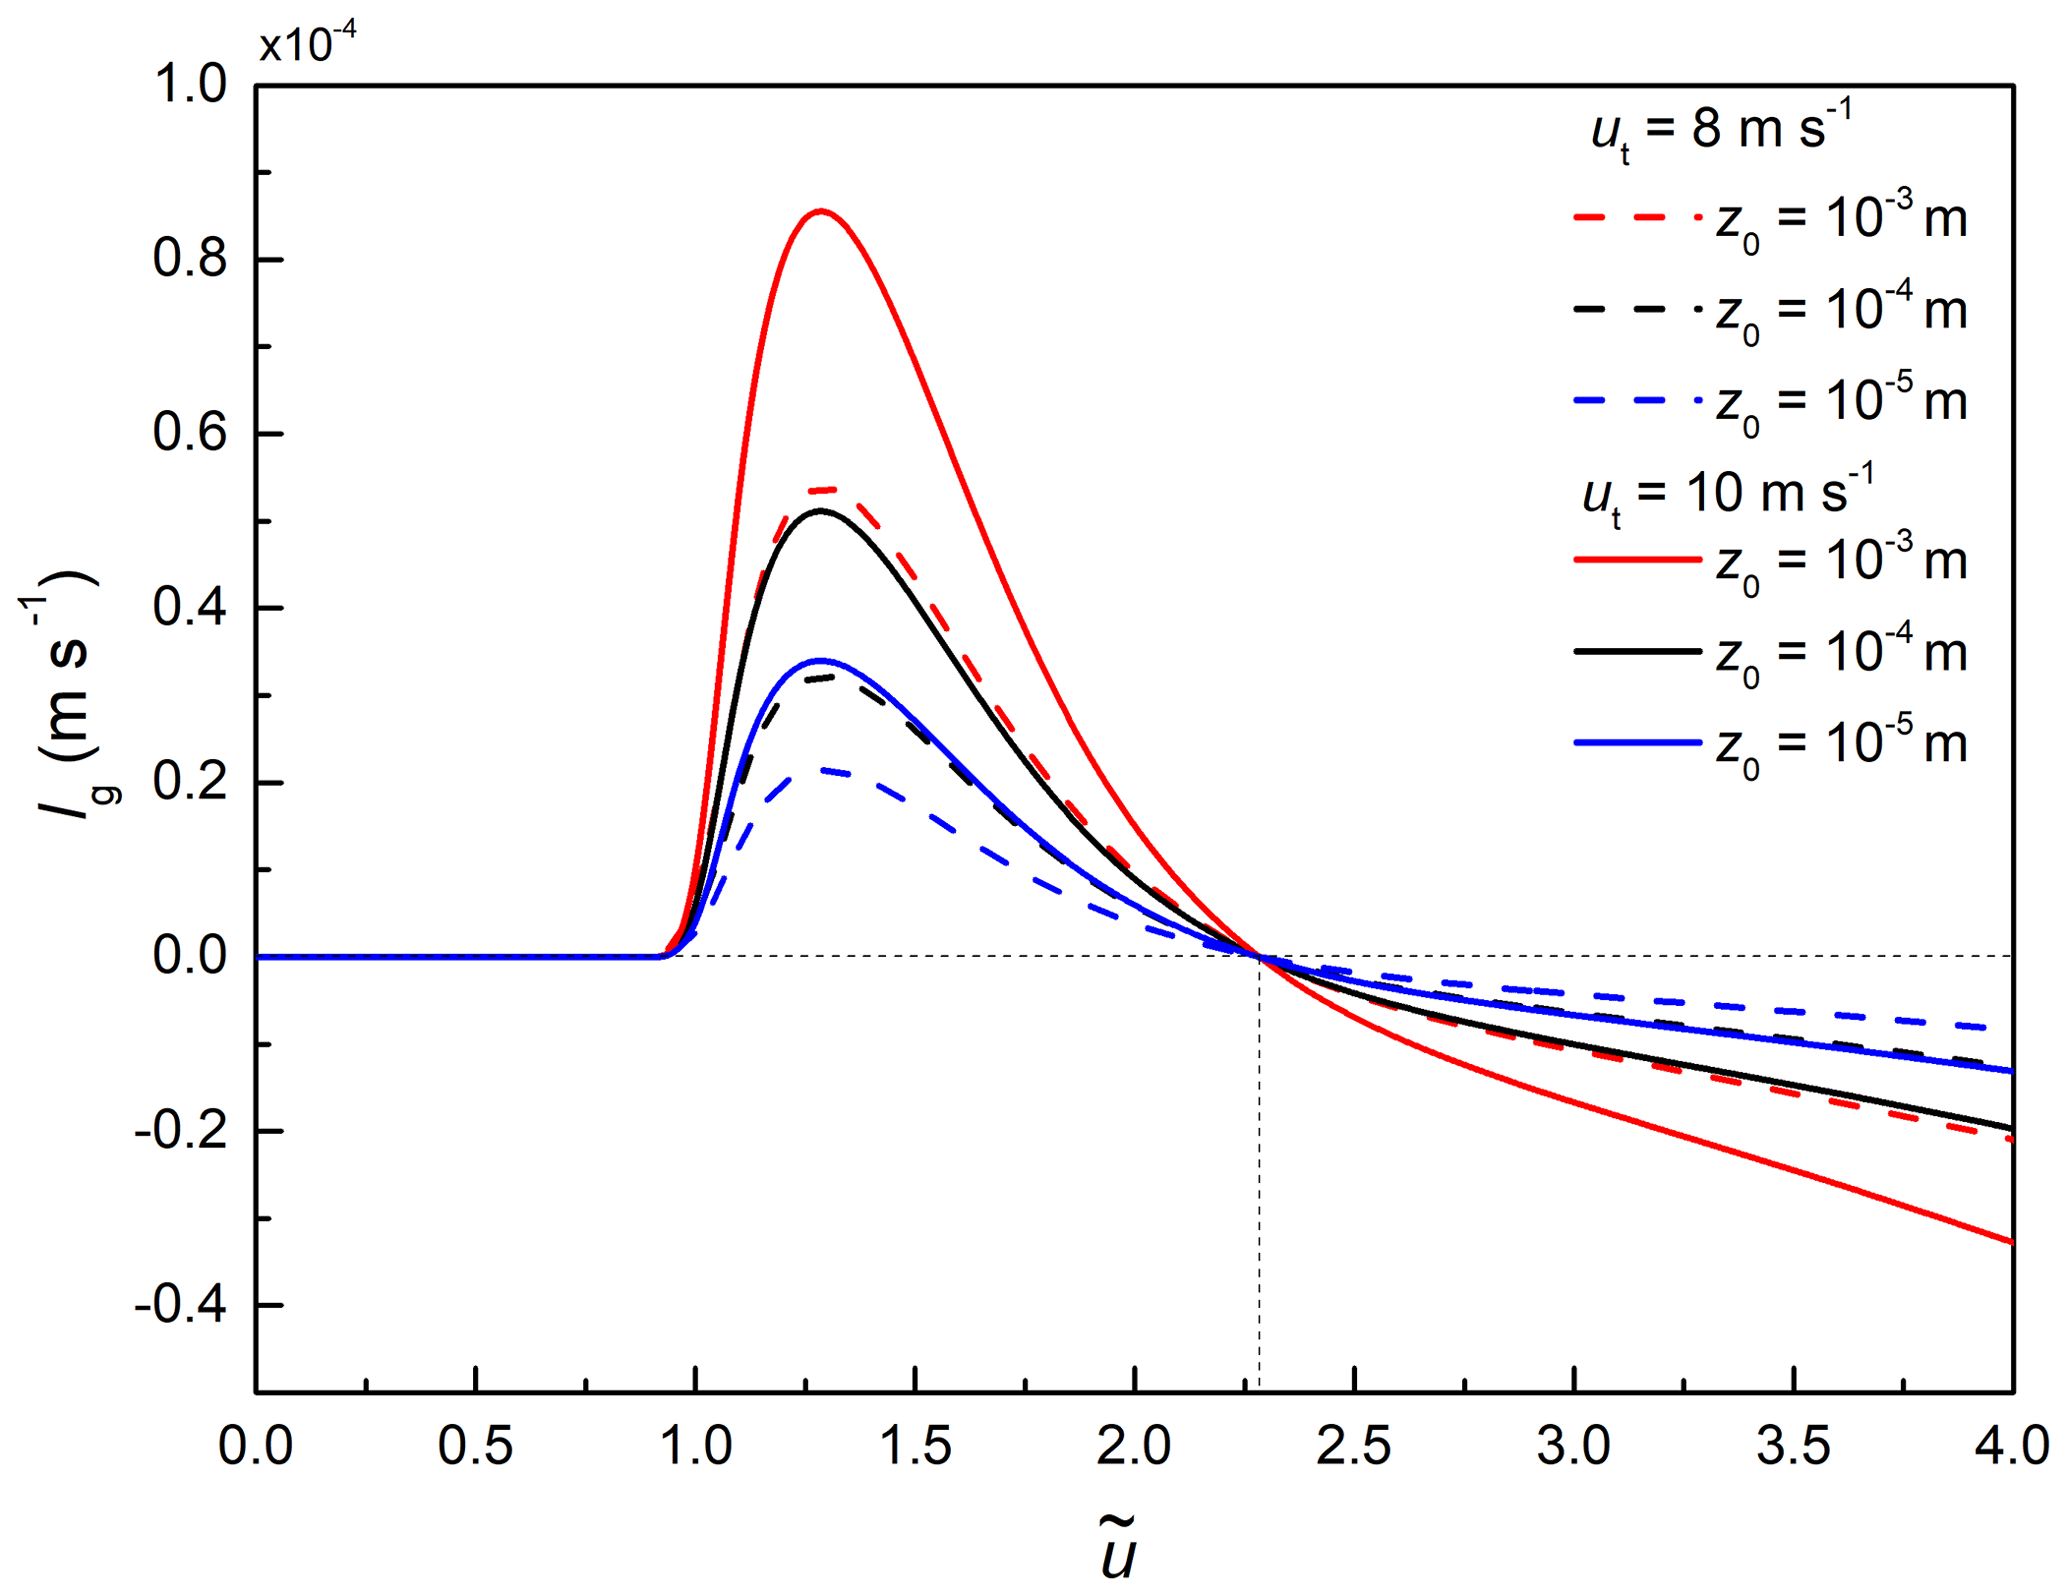

Figure 10(a) Time series of wind speed u on 1 d. (b) Average length growth rates in different sample frequencies.
4.2.2 Case II: comparison of the length growth rate with Hancock et al. (2020)
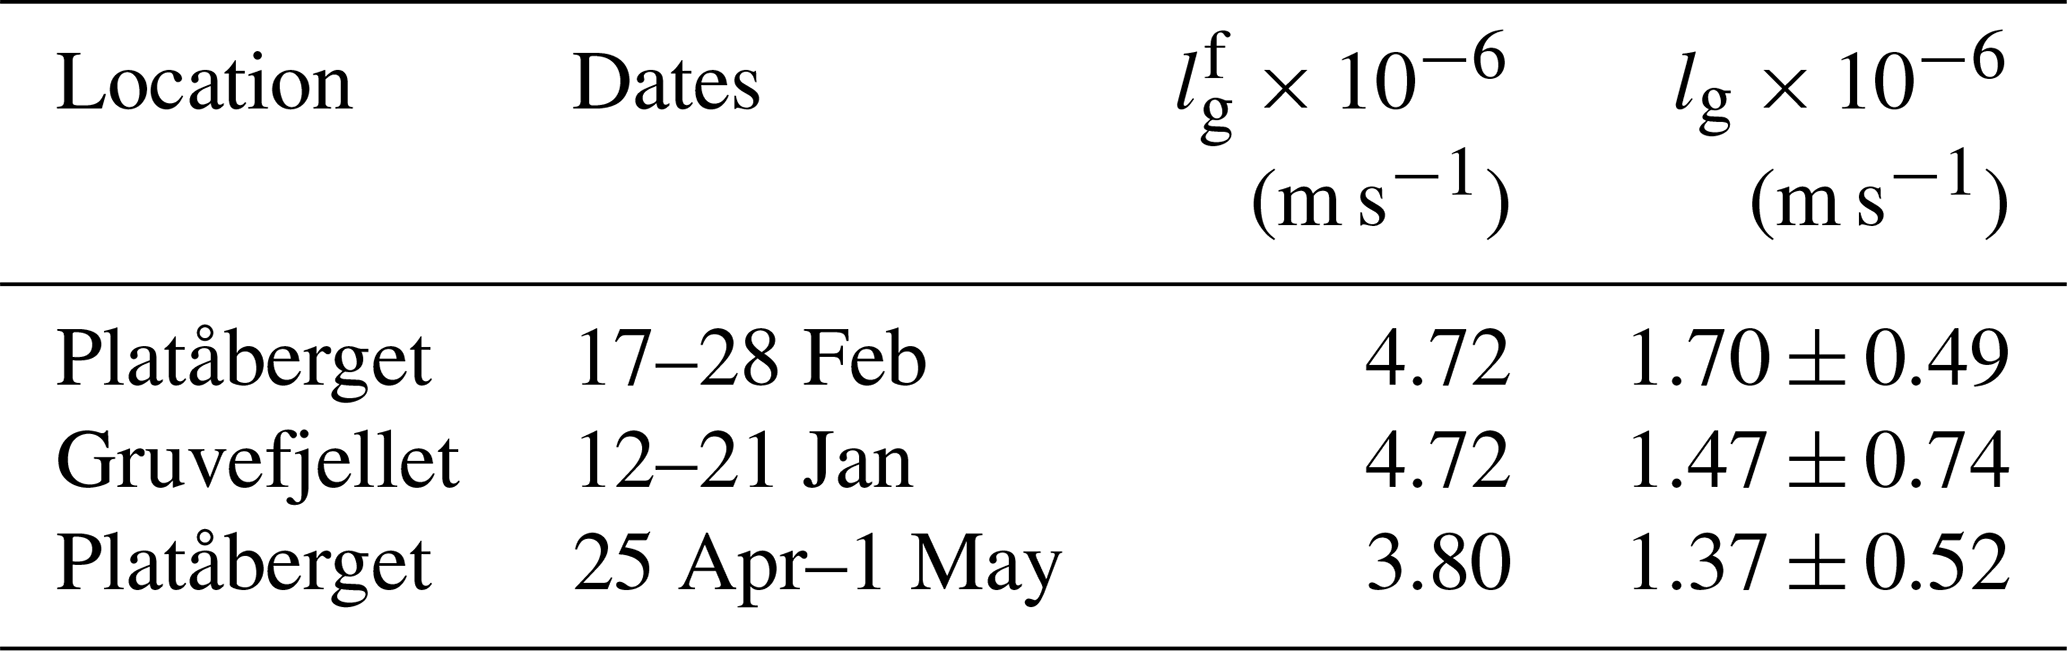
Hancock et al. (2020, abbreviated HF2020) used a Riegl® Laser Measurement Systems VZ-6000 ultra-long-range terrestrial laser scanner to repeatedly scan the Gruvefjellet and Platåberget cornice systems throughout the 2016–2017 and 2017–2018 winter seasons. Three cornice accretion events were recorded with a mean length growth rate over 10 mm h−1, which is about 3.9–4.7 × 10⁻⁶ m s−1. However, in our experiment, the average length growth rate range is 1.2–2.7 × 10⁻⁴ m s−1. The main reason for the discrepancies between the laboratory and the field results is due to the temporally and spatially constrained estimates of the threshold wind speeds for cornice accretion and cornice horizontal length growth rate (Vogel et al., 2012; Hancock et al., 2020). In the field, snow cornices have multiple growth periods in snowstorms that last a few hours, while in the RWT experiment, we mainly focused on a continuous growth process of a snow cornice. The fluctuating and intermittent wind in the field differs from the steady and stationary wind in the RWT, and this also causes the effective time for a cornice formation being much less than the sampling time (several hours to days). The sampling frequency is not sufficient to catch the complete accretion period, for the wind in the field is gusty and intermittent. Also, in the field, the cornice may partially collapse from time to time which is not recognized during the storm without any laser scanning. Thus, it is difficult to estimate the cornice length growth rate based on the daily averaged wind speed from HF2020. Here, we use the Weibull probability density function to reproduce a high-resolution time series of wind speed (Fig. 10a), which can be expressed as
in which k is the shape factor which is normally between 1.5 to 3, depending on the wind variability. Smaller k represents more gusty wind. For example, k=2 represents for the moderately gusty wind (Seguro and Lambert, 2000). Here, we assumed it to be 1.7. λ is the scale factor which is calculated based on the daily averaged wind speed and the gamma function of the inverse of the shape factor k:
Figure 10a shows an example of wind speed time series produced by using Eq. (15) with a mean wind speed of 5.4 m s−1 and time interval of 10 min. From the time series, we can estimate the length growth rate as follows:
where T is the sampling time of the scanner images. The transport rate Q(u), horizontal collection rate fl(u), and the mass erosion rate Me(u) are the functions of wind speed u in time series. To test the sensitivity of the time interval dt, we use values of 5 min, 10 min, 15 min, 30 min, 1 h, and 2 h. The estimated growth rates are shown in Fig. 10b. The length growth rate trends to a stable value when the time interval is shorter than 10 min. Thus, in the following analysis, we used 10 min as the time interval of wind data sampling.
Table 3 shows the averaged length growth rates in three cornice accretion events in HF2020. The averaged length growth rates lg calculated from the model are comparable with that values from TLS (terrestrial laser scanner) data in the field (Hancock et al., 2020), which indicates that our model has the potential ability to predict the cornice accretion in the field.
What needs to be mentioned is that to enhance the model accuracy, the values of Kd and fl inferred in this prediction model still need re-estimation and corrections for the natural larger-scale snow cornice. These two parameters may be influenced by the local topographical features. For future accurate field predictions on the cornice on a larger scale, more field measurement data are needed, such as the snowpack thickness at the root of a cornice, the mass concentration, the threshold friction velocity, roughness length, and cornice density to calculate the proper values for Kd and fl in the field.
We carried out RWT experiments and studied suitable wind conditions for cornice formation and growth. The results show that the snow cornices only grow at moderate wind speeds with a sufficient snow mass flux over the ridge of the model. The cornice growth process has two stages. The vertical growth rate of the cornice is typically lower relative to the horizontal growth. The mass collection efficiency decreases with the increasing wind speed and the corresponding drift rate, which cannot be considered the indicator for cornice growth. Instead, the growth rates of cornice in length and thickness are determined by the combined effects of mass accumulation and erosion. The lower limit of wind speed is the threshold wind speed for snow transport, and the upper-limit value of wind speed is when the deposition rate and the erosion rate become balanced. The most favorable wind condition for cornice growth is approximately 40 % higher than the threshold wind speed for snow transport, at which the net deposition rate in length is at a maximum. Based on the experimental results, a conceptual model is proposed for interpreting the mechanism of cornice growth. From this model, we can further explain that the magnitudes of the cornice thickness and length growth rates are determined by the competing effects of an increasing drift rate Q and decreasing collection rates Kd and fl with increasing wind speed above the threshold. Besides, based on the field observation data, such as roughness length, the threshold wind speed, and the local surface snow conditions, this model can be applied to field conditions to predict the cornice length growth rates and the suitable wind speed range. From the estimations at the study site of Gruvefjellet, we can conclude that the wind speed range of cornice growth is 1–2.3 times the threshold wind speed, which is in line with the previous observations in the field. It is found that the most favorable wind condition for cornice growth is approximately 30 % higher than the local threshold wind speed for this site. The discrepancies in the knowledge of the suitable wind speed range in the previous wind tunnel experiment and the field observations are mainly due to the differences in the local roughness lengths and the threshold wind speeds. In a future study, improvements in our model, such as predicting the snow cornice growth rates more accurately, still need higher-frequency observation data on cornice growth and erosion and the measurements of other relevant parameters.
Overall, this study is a step forward in understanding the mechanism of cornice formation with detailed measurements and controlled environmental conditions. We also present progress in the methodology of observing snow cornice formation. In the future, this may lead to improvements in cornice fall avalanche predictions.
| Symbol | Definitions and units |
| A0 | Area of one pixel [m2] |
| dp | Particle diameter [m] |
| dt | Time interval [s] |
| E | Collection efficiency [%] |
| fl | Horizontal collection coefficient [m s−1] |
| g | Gravitational acceleration [9.81 m s−2] |
| H | Cornice thickness [m] |
| hd | Deposition rate in thickness [m s−1] |
| Averaged deposition rate in thickness [m s−1] | |
| he | Erosion rate in thickness [m s−1] |
| Averaged erosion rate in thickness [m s−1] | |
| hg | Growth rate in thickness [m s−1] |
| Averaged growth rate in thickness [m s−1] | |
| Δh | Thickness of newly formed snow layer [m] |
| Kd | Deposition coefficient [m s−1] |
| k | Shape factor |
| κ | Von Kármán constant [0.4] |
| L | Cornice length [m] |
| ld | Deposition rate in length [m s−1] |
| Averaged deposition rate in length [m s−1] | |
| le | Erosion rate in length [m s−1] |
| Averaged erosion rate in length [m s−1] | |
| lg | Growth rate in length [m s−1] |
| Averaged growth rate in length [m s−1] | |
| Growth rate in length the field [m s−1] | |
| Δl | Moving distance of a newly formed snow layer [m] |
| Me | Erosion rate of mass [kg m−2 s−1] |
| mp | One particle mass [kg] |
| p | Depth of field [m] |
| Q | Transport rate [kg m−1 s−1] |
| qp | Particle mass flux [kg m−2 s−1] |
| S0 | Area of window Ω [m2] |
| Sc | Cornice area [m2 s−1] |
| t | Time [s] |
| T | Sampling time of the scanner images [min] |
| u | Wind speed [m s−1] |
| Non-dimensional wind speed | |
| Daily averaged wind speed [m s−1] | |
| uf | Field wind speed [m s−1] |
| up | Particle velocity [m s−1] |
| ut | Threshold wind speed [m s−1] |
| u* | Friction velocity [m s−1] |
| u*t | Threshold friction velocity [m s−1] |
| z | Height above snow surface [m] |
| z0 | Roughness length [m] |
| zf | Height of wind speed sensor in field [m] |
| ρa | Air density [kg m−3] |
| ρc | Cornice density [kg m−3] |
| ρi | Ice density [kg m−3] |
| ηae | Aerodynamic entrainment coefficient [grains N−1 s−1] |
| ϕp | Mass concentration of particles in the air [kg m−3] |
| λ | Scale factor |
The data presented in the figures and the post-processing code are available at https://doi.org/10.16904/envidat.372 (Lehning et al., 2023).
HY, GL, and BW designed the experiments. HY and GL conducted the experiments, performed the data analysis, and prepared the first draft. ML, JZ, and BW reviewed and edited the paper. NH and ML organized this study, contributed to its conceptualization and discussion, and finalized the paper.
The contact author has declared that none of the authors has any competing interests.
Publisher's note: Copernicus Publications remains neutral with regard to jurisdictional claims in published maps and institutional affiliations.
The authors would like to thank Matthias Jaggi for his snow maker expertise. The authors appreciate the valuable suggestions of Mahdi Jafari, Daniela Brito Melo, and Armin Sigmund for improving improve the paper. The authors thank the editor Melody Sandells, Holt Hancock, and the three anonymous referees for their constructive comments. This work was supported by the National Natural Science Foundation of China (grant nos. 42006187 and 41931179), the Second Tibetan Plateau Scientific Expedition and Research Program (grant no. 2019QZKK020109-2), the Fundamental Research Funds for the Central Universities (grant no. lzujbky-2021-it29), and Swiss National Science Foundation (grant 200020_179130).
This work was supported by the National Natural Science Foundation of China (grant nos. 42006187 and 41931179), the Second Tibetan Plateau Scientific Expedition and Research Program (grant no. 2019QZKK020109-2), the Fundamental Research Funds for the Central Universities (grant no. lzujbky-2021-it29), and the Swiss National Science Foundation (grant 200020_179130).
This paper was edited by Melody Sandells and reviewed by Holt Hancock and three anonymous referees.
Brock, B. W., Willis, I. C., and Sharp, M. J.: Measurement and parameterization of aerodynamic roughness length variations at Haut Glacier d’Arolla, Switzerland, J. Glaciol., 52, 281–297, 2006. a
Clifton, A. and Lehning, M.: Improvement and validation of a snow saltation model using wind tunnel measurements, Earth Surf. Proc. Land., 33, 2156–2173, 2008. a
Clifton, A., Rüedi, J.-D., and Lehning, M.: Snow saltation threshold measurements in a drifting-snow wind tunnel, J. Glaciol., 52, 585–596, 2006. a, b
Crivelli, P., Paterna, E., Horender, S., and Lehning, M.: Quantifying particle numbers and mass flux in drifting snow, Bound.-Lay. Meteorol., 161, 519–542, https://doi.org/10.1007/s10546-016-0170-9, 2016. a, b
Eckerstorfer, M. and Christiansen, H. H.: Topographical and meteorological control on snow avalanching in the Longyearbyen area, central Svalbard 2006–2009, Geomorphology, 134, 186–196, https://doi.org/10.1016/j.geomorph.2011.07.001, 2011. a
Eckerstorfer, M., Christiansen, H. H., Rubensdotter, L., and Vogel, S.: The geomorphological effect of cornice fall avalanches in the Longyeardalen valley, Svalbard, The Cryosphere, 7, 1361–1374, https://doi.org/10.5194/tc-7-1361-2013, 2013. a
Hancock, H., Eckerstorfer, M., Prokop, A., and Hendrikx, J.: Quantifying seasonal cornice dynamics using a terrestrial laser scanner in Svalbard, Norway, Nat. Hazards Earth Syst. Sci., 20, 603–623, https://doi.org/10.5194/nhess-20-603-2020, 2020. a, b, c, d, e, f
JDoorschot, J. J., Lehning, M., and Vrouwe, A.: Field measurements of snow-drift threshold and mass fluxes, and related model simulations, Bound.-Lay. Meteorol., 113, 347–368, 2004. a
König-Langlo, G.: Roughness length of an Antarctic ice shelf, Polarforschung, 55, 27–32, 1985. a
Kosugi, K., Sato, T., Nemoto, M., Mochizuki, S., and Sato, A.: Vertical profiles of mass flux for different particle diameters in drifting snow over hard snow surfaces, Proc. ISSW, 38, 143–152, 2008. a
Lehning, M. and Fierz, C.: Assessment of snow transport in avalanche terrain, Cold Reg. Sci. Technol., 51, 240–252, https://doi.org/10.1016/j.coldregions.2007.05.012, 2008. a
Lehning, M., Naaim, F., Naaim, M., Brabec, B., Doorschot, J., Durand, Y., Guyomarc’h, G., Michaux, J.-L., and Zimmerli, M.: Snow drift: acoustic sensors for avalanche warning and research, Nat. Hazards Earth Syst. Sci., 2, 121–128, https://doi.org/10.5194/nhess-2-121-2002, 2002. a
Lehning, M., Völksch, I., Gustafsson, D., Nguyen, T. A., Stähli, M., and Zappa, M.: ALPINE3D: a detailed model of mountain surface processes and its application to snow hydrology, Hydrol. Process., 20, 2111–2128, 2006. a
Lehning, M., Yu, H., Li, G., Walter, B., Zhang, J., and Huang, N.: Data and Code on Cornice Formation in a Wind Tunnel, EnviDat [data set], https://doi.org/10.16904/envidat.372, 2023. a
Li, G., Wang, Z., and Huang, N.: A snow distribution model based on snowfall and snow drifting simulations in mountain area, J. Geophys. Res.-Atmos., 123, 7193–7203, https://doi.org/10.1029/2018JD028434, 2018. a
Lü, X., Huang, N., and Tong, D.: Wind tunnel experiments on natural snow drift, Sci. China Technol. Sci., 55, 927–938, https://doi.org/10.1007/s11431-011-4731-3, 2012. a
McClung, D. and Schaerer, P. A.: The avalanche handbook, The Mountaineers Books, ISBN 0-89886-809-2, 2006. a, b
Melo, D. B., Sharma, V., Comola, F., Sigmund, A., and Lehning, M.: Modeling snow saltation: the effect of grain size and interparticle cohesion, J. Geophys. Res.-Atmos., 127, e2021JD035260, https://doi.org/10.1029/2021JD035260, 2022. a
Montagne, J., McPartland, J. T., Super, A. B., and Townes, H. W.: The Nature and control of snow cornices on the Bridger Range, Southwestern Montana, Alta Avalanche Study Center, Miscellaneous Report No. 14, 1968. a
Mott, R., Schirmer, M., Bavay, M., Grünewald, T., and Lehning, M.: Understanding snow-transport processes shaping the mountain snow-cover, The Cryosphere, 4, 545–559, https://doi.org/10.5194/tc-4-545-2010, 2010. a
Naito, A. and Kobayashi, D.: Experimental study on the occurrence of cornice, Low Temperature Science, Physics, 44, 91–101, 1986. a, b, c, d, e, f
Naruse, R., Nishimura, H., and Maeno, N.: Structural Characteristics of Snow Drifts and Cornices, Ann. Glaciol., 6, 287–288, 1985. a, b
Nishimura, K. and Nemoto, M.: Blowing snow at Mizuho station, Antarctica, Philos. T. Roy. Soc. A, 363, 1647–1662, https://doi.org/10.1098/rsta.2005.1599, 2005. a, b
Nishimura, K., Yokoyama, C., Ito, Y., Nemoto, M., Naaim-Bouvet, F., Bellot, H., and Fujita, K.: Snow particle speeds in drifting snow, J. Geophys. Res.-Atmos., 119, 9901–9913, 2014. a
Schleef, S., Jaggi, M., Löwe, H., and Schneebeli, M.: An improved machine to produce nature-identical snow in the laboratory, J. Glaciol., 60, 94–102, https://doi.org/10.3189/2014JoG13J118, 2014. a, b
Seguro, J. and Lambert, T.: Modern estimation of the parameters of the Weibull wind speed distribution for wind energy analysis, J. Wind Eng. Ind. Aerod., 85, 75–84, 2000. a
Seligman, G., Seligman, G. A., and Douglas, C.: Snow structure and ski fields: being an account of snow and ice forms met with in nature, and a study on avalanches and snowcraft, Macmillan and Company, limited, 1936. a
Sommer, C. G., Lehning, M., and Fierz, C.: Wind tunnel experiments: saltation is necessary for wind-packing, J. Glaciol., 63, 950–958, https://doi.org/10.1017/jog.2017.53, 2017. a
Sommer, C. G., Lehning, M., and Fierz, C.: Wind tunnel experiments: influence of erosion and deposition on wind-packing of new snow, Front. Earth Sci., 6, 4, https://doi.org/10.3389/feart.2018.00004, 2018. a
Sugiura, K., Nishimura, K., Maeno, N., and Kimura, T.: Measurements of snow mass flux and transport rate at different particle diameters in drifting snow, Cold Reg. Sci. Technol., 27, 83–89, https://doi.org/10.1016/S0165-232X(98)00002-0, 1998. a, b, c
Takeuchi, M.: Vertical profile and horizontal increase of drift-snow transport, J. Glaciol., 26, 481–492, https://doi.org/10.3189/S0022143000010996, 1980. a
Tobias, E., Erik, T., David, K., Johan, C., and Anders, R.: Angle of repose of snow: An experimental study on cohesive properties, Cold Reg. Sci. Technol., 194, 103678, https://doi.org/10.1016/j.coldregions.2021.103470, 2022. a
van Herwijnen, A. and Fierz, C.: Monitoring snow cornice development using time-lapse photography, in: Proceedings of the International Snow Science Workshop, 865–869, 2014. a, b
Vionnet, V., Martin, E., Masson, V., Guyomarc'h, G., Naaim-Bouvet, F., Prokop, A., Durand, Y., and Lac, C.: Simulation of wind-induced snow transport and sublimation in alpine terrain using a fully coupled snowpack/atmosphere model, The Cryosphere, 8, 395–415, https://doi.org/10.5194/tc-8-395-2014, 2014. a
Vionnet, V., Martin, E., Masson, V., Guyomarc'h, G., Naaim-Bouvet, F., Prokop, A., Durand, Y., and Lac, C.: Simulation of wind-induced snow transport and sublimation in alpine terrain using a fully coupled snowpack/atmosphere model, The Cryosphere, 8, 395–415, https://doi.org/10.5194/tc-8-395-2014, 2014. a, b, c, d
Wahl, L., Planchon, O., and David, P.-M.: Characteristics and seasonal evolution of firns and snow cornices in the High Vosges mountains (eastern France), Erdkunde, 63, 51–67, https://doi.org/10.3112/erdkunde.2009.01.04, 2009. a
Walter, B., Horender, S., Voegeli, C., and Lehning, M.: Experimental assessment of Owen's second hypothesis on surface shear stress induced by a fluid during sediment saltation, Geophys. Res. Lett., 41, 6298–6305, 2014. a
Web Publisher v4.2.0.28, R. P. D.: The Weather on Gruvefjellet, http://158.39.149.183/Gruvefjellet/index.html, last access: 1 December 2022. a