the Creative Commons Attribution 4.0 License.
the Creative Commons Attribution 4.0 License.
 | 22 Dec 2023
Rapid warming and degradation of mountain permafrost in Norway and Iceland
Bernd Etzelmüller
Ketil Isaksen
Justyna Czekirda
Sebastian Westermann
Christin Hilbich
Christian Hauck
With the EU-funded PACE (Permafrost and Climate in Europe) project at the turn of this century, several deep boreholes (100 m+) were drilled in European mountain sites, including in mainland Norway, Svalbard and Sweden. During other projects from 2004 and the International Polar Year (IPY) period in 2006–2007, several additional boreholes were drilled in different sites in both Norway and Iceland, measuring temperatures along both altitudinal and latitudinal gradients. At most sites, multi-temporal geophysical soundings are available using electrical resistivity tomography (ERT). Here, we study the development of permafrost and ground temperatures in mainland Norway and Iceland based on these data sets. We document that permafrost in Norway and Iceland is warming at a high rate, including the development of taliks in both Norway and Iceland in response to global climate change during the last 20 years. At most sites, ground surface temperature (GST) is apparently increasing more strongly than surface air temperature (SAT). Changing snow conditions appear to be the most important factor for the higher GST rates. Modelling exercises also indicate that the talik development can be explained by both higher air temperatures and increasing snow depth.
- Article
(11112 KB) - Full-text XML
- BibTeX
- EndNote


Permafrost is defined thermally as ground (i.e. lithosphere) at or below 0 ∘C over at least 2 consecutive years (Van Everdingen, 1998). Since the 18th century, permafrost has been known to be an important geomorphological factor governing certain landform development and producing geotechnical problems for construction (e.g. French, 2017). Relatively recently, permafrost has been recognised as a major storage of carbon that can become mobilised and released as greenhouse gases upon thawing (Hugelius et al., 2014; Miner et al., 2022). Furthermore, permafrost is a major component for the stability of steep rock walls or debris slopes in mountain environments (Gruber and Haeberli, 2007; Krautblatter et al., 2013; Penna et al., 2023). Permafrost and the ground thermal regime also seem to be important factors modulating geomorphological process rates (Berthling and Etzelmuller, 2011) and ultimately landscape development (Andersen et al., 2015; Egholm et al., 2015; Hales and Roering, 2007, 2009; Etzelmüller et al., 2020b).
Western Scandinavia and Iceland are situated at the transition zone between regions dominated by mountain permafrost and Arctic conditions towards Svalbard and eastern Greenland. At present, Norway has an extensive network of boreholes where we measure subsurface temperatures along both altitudinal and latitudinal gradients (Etzelmüller et al., 2020a; Farbrot et al., 2011; Christiansen et al., 2010; Sollid et al., 2003). In addition, at most sites, multi-temporal geophysical surveys are available using electrical resistivity tomography (ERT). In Iceland, four boreholes have existed since 2004, of which three were originally drilled in permafrost. Finally, daily gridded data sets of meteorological parameters such as air temperature and precipitation (Lussana et al., 2018a, b) and associated modelled snow cover (Saloranta, 2016; Czekirda et al., 2019) are available back to 1957 for Norway and 1959 for Iceland, allowing the evaluation of the relation between climate and ground thermal regime along regional gradients.
This study outlines changes in the thermal state of permafrost in Norway and Iceland based on borehole monitoring between 2004 and 2022. The study demonstrates how the changing climate has rapidly warmed and degraded mountain permafrost and discusses the possible drivers for these changes.
The field sites are located in five observatories in the mountain areas of southern and northern Norway and around four boreholes in central and eastern Iceland (Fig. 1a, b). In Norway, all field sites are situated in typical mountain settings, with bedrock covered by relatively coarse-grained regolith or glacial deposits. In Iceland, volcanic sand-rich deposits dominate the surface cover. All sites in Norway and Iceland are barren or only sparsely vegetated by lichen and mosses, except the Iškoras site, which is covered by denser and higher vegetation. The geology varies between the sites, while the glaciation history is comparable. All sites were ice covered during the last glaciations; however, they were most probably under cold basal-ice conditions, and thus, they experienced limited erosion, at least during the last ice sheet period (e.g. Kleman and Hättestrand, 1999). All sites are situated relatively close to the regional lower limits of mountain permafrost, besides in Jotunheimen, where two boreholes are drilled well into continuous permafrost, which probably prevailed during the Holocene (Lilleøren et al., 2012).
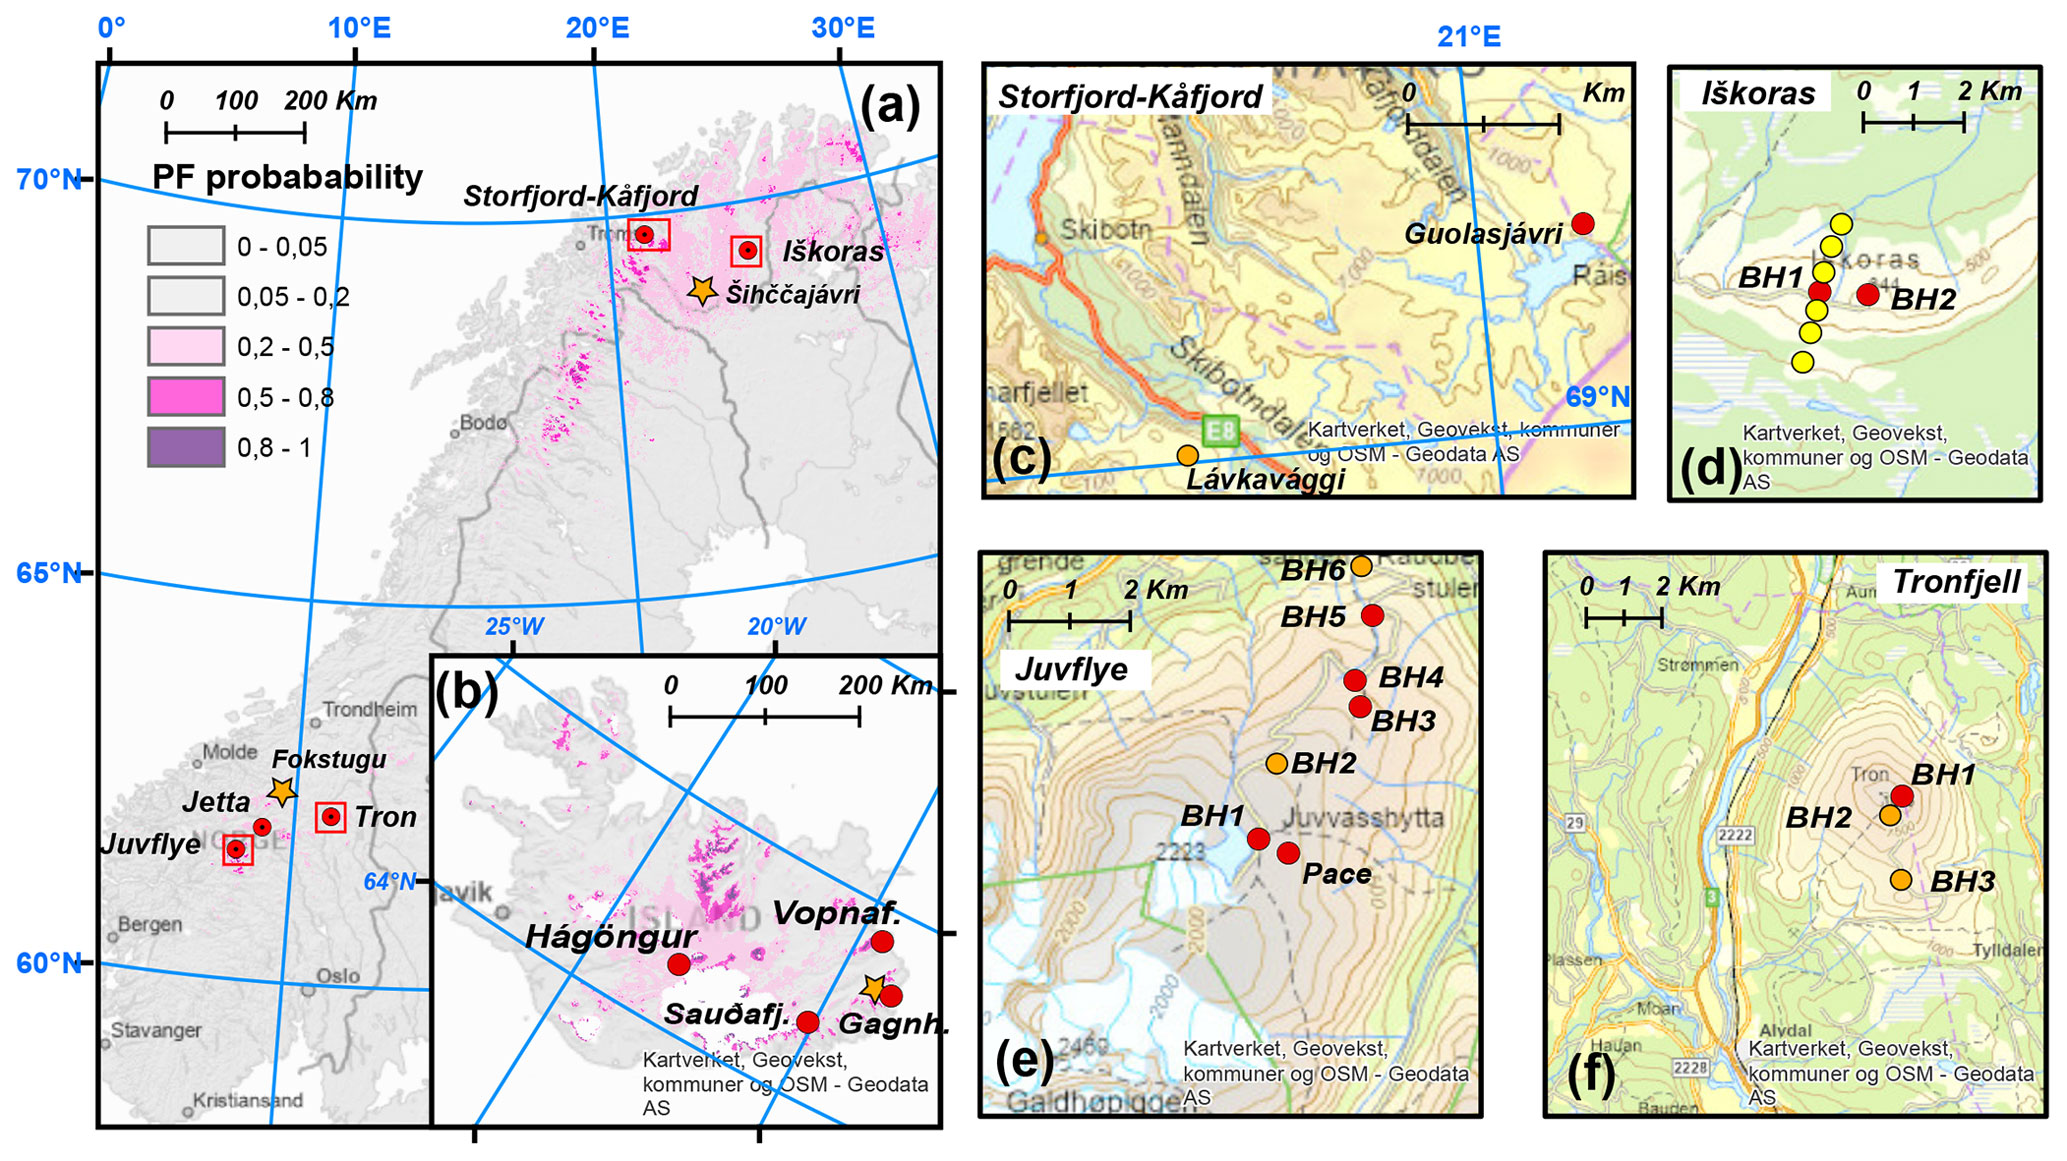
Figure 1Map of Norway (a) and Iceland (b), showing permafrost probability based on Obu et al. (2019). The permafrost observatories are indicated with circles, and the close-up maps are indicated with a rectangle. The orange stars indicate weather stations presented in Fig. 2; the station in Iceland is Egilstaðir. (c) The Storfjord-Kåfjord permafrost observatory (Troms county, northern Norway). (d) The Iškoras permafrost observatory (Finnmark county, northern Norway). (e) The Juvflye permafrost observatory (Innlandet county, southern Norway). (f) The Tronfjell permafrost observatory (Innlandet county, southern Norway). Red dots denote sites where we measured ground temperature (GT), surface air temperature (SAT) and ground surface temperature (GST); yellow dots indicate only SAT and GST measurements at the site, while orange dots indicate boreholes not used in this study. All background maps are from the Norwegian Mapping Authority.
2.1 The Juvflye permafrost observatory (Innlandet, southern Norway) (61.7∘ N, 8.4∘ E)
The Juvflye area is a high-mountain plateau at ca. 1800 m a.s.l. which is surrounded by Norway's highest peaks in Jotunheimen, with elevation close to 2500 m a.s.l. The bedrock is dominated by metamorphosed gabbro, while the surface cover is dominated by blockfields and block-rich till of some metres of thickness. In this area, there are seven boreholes, of which five are included in this study (Fig. 1e). They range from an elevation of 1500 to 1900 m a.s.l., of which the former is close to the lower altitudinal limit of permafrost in the area (Hauck et al., 2004; Isaksen et al., 2002, 2011; Hipp et al., 2012). The uppermost boreholes are drilled in a blockfield-covered mountain plateau. The area is dominated by sporadic and discontinuous permafrost; only high-elevation areas above ca. 1700 m a.s.l. have continuous permafrost (Gisnås et al., 2016). The area has been subject to long-term permafrost research (Farbrot et al., 2011; Hipp et al., 2012; Isaksen et al., 2002; King, 1986; Ødegård et al., 1992) and has one of the deep (129 m) PACE (Permafrost and Climate in Europe) boreholes (Isaksen et al., 2001; Etzelmüller et al., 2020a) established in 1999 and located next to the highest weather station in Norway at Juvvasshøe (Juv-P, Table 1). Long-term monitoring of air and ground surface temperatures takes place in addition to the borehole monitoring. The area also hosts investigations on ice patches overlying permafrost (Ødegård et al., 2017).
2.2 The Tronfjell (62.2∘ N, 10.7∘ E) and Jetta (61.9∘ N, 9.3∘ E) permafrost observatory (southern Norway)
Tronfjell and Jetta are two mountain peaks, both at ca. 1600 m a.s.l. and located ca. 50 km apart. The Tronfjell mountain consists of a massif gabbro block protruding from the surrounding landscape. The mountain is surrounded by deep valleys at all sides and is therefore particularly prone to winter air temperature inversions. On Tronfjell, three boreholes exists (Fig. 1f), of which we use the borehole at 1620 m a.s.l., located on the top plateau of the mountain massif (Farbrot et al., 2011), in this study (Tr1, Table 1). The Jetta mountain consists of schist, having two boreholes. Also here, we use the top borehole at 1580 m a.s.l. (Jet1, Table 1). The highest elevations in both areas lie in discontinuous to sporadic permafrost close to the lower regional limit of permafrost.
2.3 The Storfjord-Kåfjord permafrost observatory (Troms, northern Norway)
The Storfjord-Kåfjord area in Troms comprises two different sites, Guolasjávri (69.4∘ N, 21.2∘ E) and Lávkavággi (69.3∘ N, 20.4∘ E), which are two neighbouring valleys separated by a mountain range reaching up to ca. 1600 m a.s.l. (Fig. 1c). The borehole at Guolasjávri is located at ca. 780 m a.s.l. on a mountain plateau (Gu1, Table 1) close to the border of Finland, which is surrounded by peaks up to 1400 m a.s.l. The borehole at Lávkavággiis is located at 770 m a.s.l. on a mountain pass between two valleys (Lav1, Table 1). At both sites, the boreholes are located close to the lower limit of mountain permafrost, where snow thickness determines whether a site develops permafrost or not (Christiansen et al., 2010; Farbrot et al., 2013). Elevations above 1000 m a.s.l. in these areas may have more continuous permafrost (e.g. Gisnås et al., 2016).
2.4 The Iškoras permafrost observatory (Finnmark, northern Norway) (69.3∘ N, 25.3∘ E)
The Iškoras area consists of a quartzite massif protruding from the peneplain of Finnmarksvidda, with a maximum elevation of 600 m a.s.l. There are two boreholes on the top of the Iškoras mountain, both at 600 m a.s.l. (Fig. 1d). One borehole (Iski1) is drilled directly into bedrock, while borehole 2 (Isk2) has a ca. 3 m thick till cover over bedrock (Christiansen et al., 2010; Farbrot et al., 2013). In addition, we measured air and ground surface temperatures along a transect in a north–south direction over the ridge, between 200 and 600 m a.s.l. The plateau of the Finnmarksvidda undulates between 300 and 400 m a.s.l. The site is frequently affected by winter air temperature inversions, especially below the tree line. Lakes and larger mire areas normally cover depressions on the Finnmarksvidda plateau. The area lies below the mountain permafrost belt; however, many of these mires contain palsas and large peat plateaus and were recently evaluated by Borge et al. (2017) and Martin et al. (2019).
Table 1Borehole metadata and temperature trends during the measurement period. SAT refers to surface air temperature, GST refers to ground surface temperature, GT refers to ground temperature, dec refers to decade, and BH refers to borehole. The mean GST is calculated based on a nearby GST logger. Linear trends are calculated as normal linear regressions between time and temperature, and long-term decadal changes are based on the slope of the regression (a). Mean values at or above 0 ∘C are highlighted.
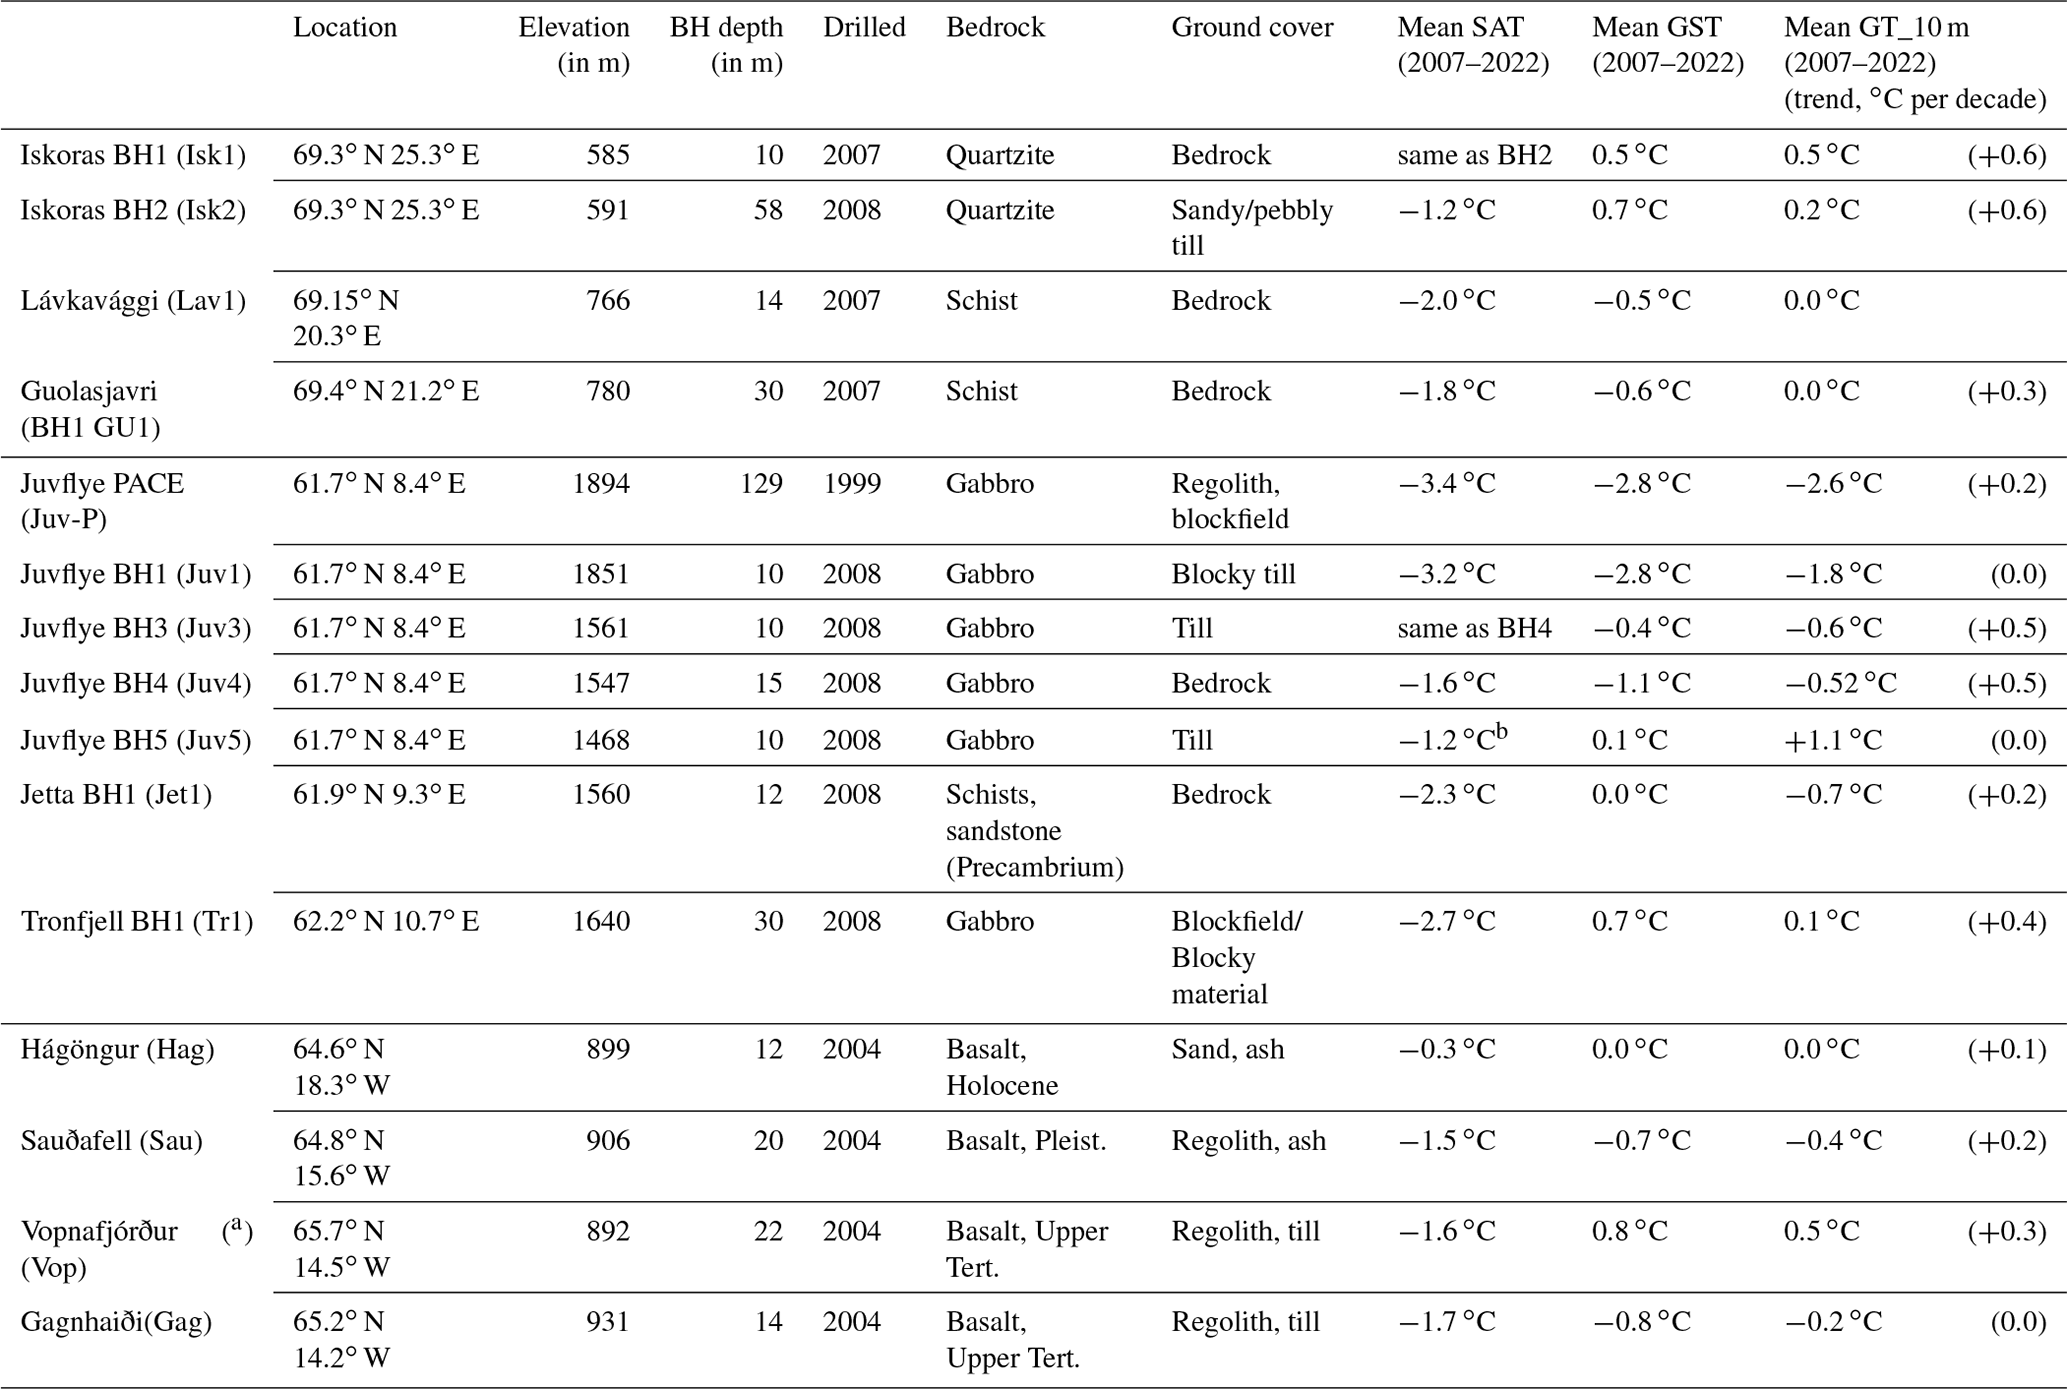
a GT from 20 m depth. b The SAT station is located ca. 100 m downslope of BH5, with an elevation of 1438 m a.s.l.
2.5 The Iceland permafrost observatory (central and eastern Iceland)
Four boreholes were installed in 2004 in central (Hágöngur – 64.6∘ N, 18.3∘ W) and eastern Iceland (Sauðafell – 64.8∘ N, 15.6∘ W; Vopnafjörður – 65.7∘ N, 14.5∘ W; Gagnhaiði – 65.2∘ N, 14.2∘ W) (Fig. 1b). The boreholes (8–20 m depth) are drilled in bedrock overlain by a sediment cover of ca. 1 m. The surface cover consists of till (Gagnhaiði) or vitrisols (all other sites). This soil cover is poorly vegetated, where dry conditions prevail (Arnalds, 2015). Moreover, redistribution of snow by wind is commonly observed in the poorly vegetated areas. All boreholes in Iceland lie at the lower limit of discontinuous permafrost. More details about the monitoring sites can be found in Farbrot et al. (2007).
3.1 Climate data
Long-term climate data are available from the Norwegian Meteorological Institute (MET Norway) as in situ observations either from nearby weather stations or from high-resolution gridded (1 km grid spacing) daily series, available as the seNorge dataset (Lussana et al., 2018a, b; Saloranta, 2016). For all borehole sites in Norway, we used the daily seNorge air temperature, snow depth (SD), precipitation and snow water equivalent (SWE). The elevation of the seNorge cell is not exactly the same as the borehole elevation, and strong winter air temperature inversions may additionally bias the seNorge data (Lussana et al., 2018b). For some borehole sites, we therefore performed a statistical downscaling by determining monthly regression estimates between the seNorge time series and air temperature measurements at the sites since the installation of the boreholes. We then used these regressions to estimate daily air temperatures back to 1957.
Similar gridded data sets of air temperature exist for Iceland, provided by the Icelandic Meteorological Office (IMO); these are for a 1 km2 resolution and are based on lapse rate adjustment and interpolation between the weather stations (Crochet and Jóhannesson, 2011). Snow depth was modelled using a degree-day SWE model (Saloranta, 2012) and a HARMONIE gridded-precipitation data set (Bengtsson et al., 2017) using the same procedure as for the Norwegian seNorge data (Czekirda et al., 2019).
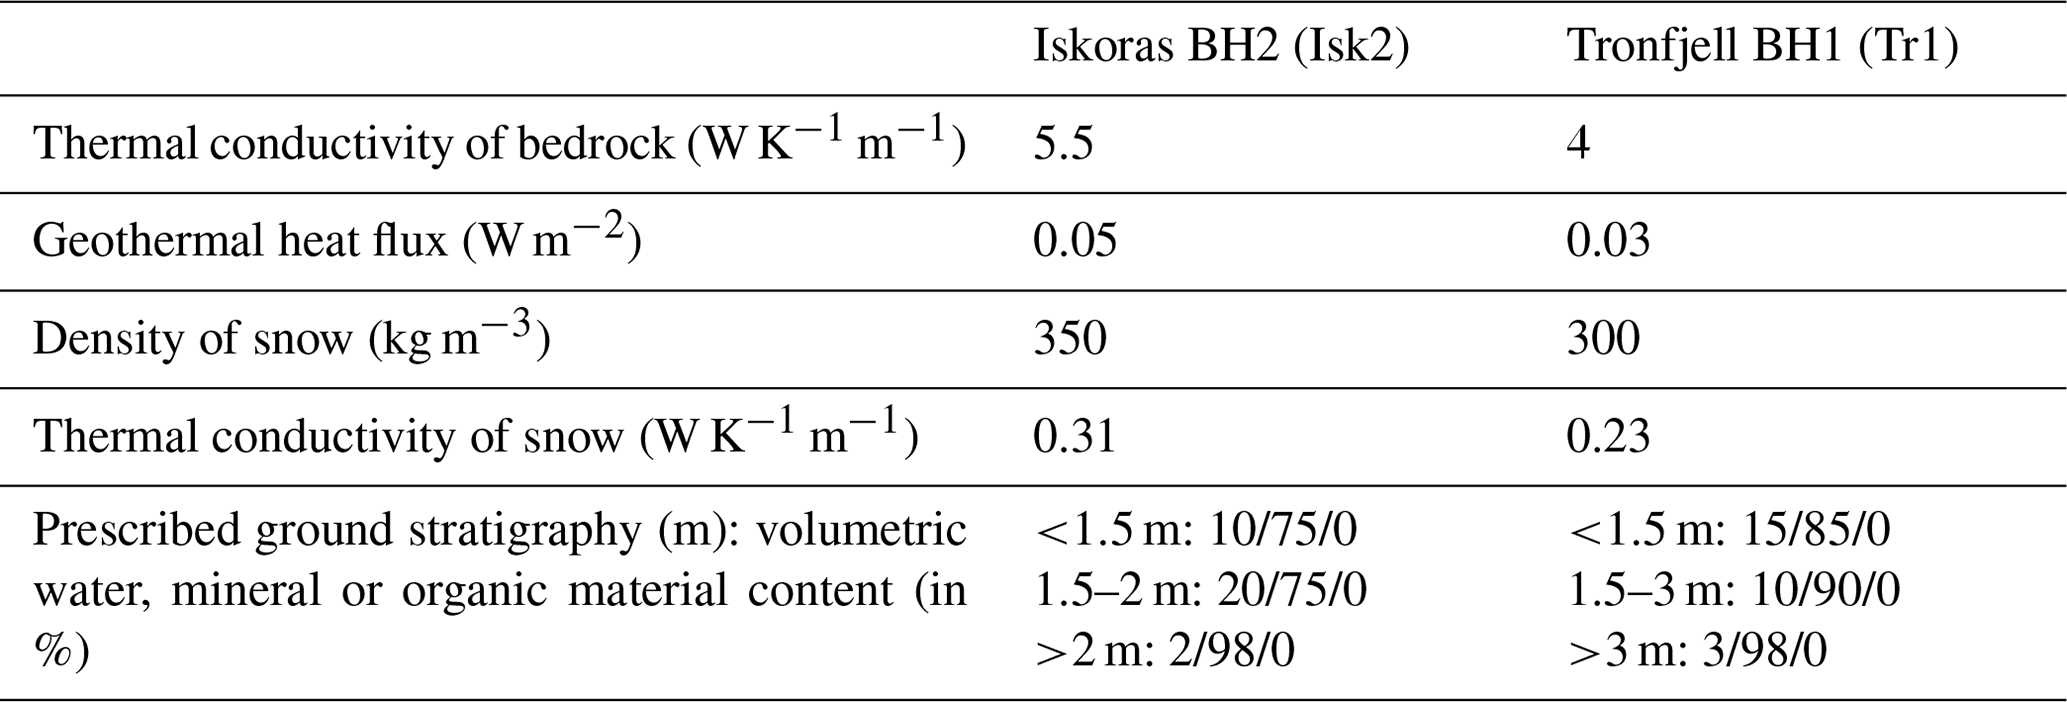
Table 2Model parameters and prescribed stratigraphy for the Iskoras and Tronfjell sites. For more details on value selection and implementation, see Westermann et al. (2013).
3.2 Air and ground surface temperature measurements
At each borehole location, surface air temperature (SAT) and ground surface temperature (GST) are measured using miniature temperature loggers (MTLs) with an accuracy and resolution that are usually better than ±0.2 ∘C. At the Iškoras site, seven stations measuring SAT and GST were established along a profile line from north to south (Fig. 1d), addressing winter temperature inversion conditions. Shorter data gaps in SAT were filled by neighbouring stations using simple regression (R2>0.75).
3.3 Ground temperatures
The boreholes at all sites were established during the period 2007 to 2009 (Table 1), except for Juvflye-PACE, which was established in 1999. They are equipped with thermistors coupled to a logging device, with measurement accuracies between ±0.01 and ±0.2 ∘C (Table 1). The boreholes at Iškoras and Tronfjell are equipped with PT1000 thermistor strings, measuring temperature with accuracies better than ±0.01 ∘C. The data are logged using Campbell logging devices. The borehole in Guolasjávri is 30 m deep, but the logger chain is only 15 m (GEOprecision system with Dallas thermistors, ±0.1 ∘C). A similar system is used at Lávkavággi, Jetta and the Juvflye observatory. In Iceland, logger systems were changed during the monitoring period. Until 2022, three boreholes were equipped with GEOprecision logging systems.
3.4 Electrical resistivity tomography (ERT)
ERT yields the two- or three-dimensional electrical resistivity distribution of the subsurface by injecting an electric current between two electrodes coupled to the ground surface and measuring the resulting electrical potential differences at two further electrodes along a profile line. By using different combinations of this 4-electrode measurement (so-called quadrupoles) with various spacings between the electrodes, a two-dimensional resistivity section can be obtained. The investigation depth depends mainly on the distances between the electrodes employed along the profile and the profile length, with larger distances giving greater penetration depth. The obtained apparent resistivity measurements have to be inverted using suitable inversion algorithms yielding the specific electrical resistivity distribution along the 2D profiles. Relatively high electrical resistivity (>10 kΩm) values can be associated with frozen conditions, including ground ice occurrences or dry blocky layers, whereas relatively low electrical resistivity values (<10 kΩm) point to (high) liquid water contents and unfrozen conditions (Hauck, 2002). ERT data acquisition was conducted with ABEM terrameters (SAS1000 or LS) using Wenner protocols. All ERT profiles were inverted using common inversion parameters within the software Res2Dinv (Loke and Barker, 1995). The length of the profiles varied between 80 and 160 m, and a 2 m spacing protocol was used. The repeated ERT measurements were performed in the immediate vicinity of the borehole locations on Iškoras, Guolasjávri, Juvflye and Tronfjell, with the first measurements taking place in 2009. Measurements were normally carried out at the end of August or early September.
3.5 Heat flow modelling
For selected sites, the ground thermal regime was modelled with the simple heat conduction model CryoGRID2 (Westermann et al., 2013) to reproduce the observed ground temperature evolution and to test the influence of different forcing factors. The subsurface temperature distribution was simulated by numerically solving the transient 1D heat equation (Williams and Smith, 1989). As boundary conditions, we prescribe time series of measured GST for calibration of the subsurface conditions and the geothermal heat flux at depth (Table 2). For the runs, the snow cover was included using the seNorge snow depth data set (Lussana et al., 2018a, b; Saloranta, 2016), and air temperature from seNorge was applied at the upper boundary. The thermal properties of the ground are described in terms of density (ρ); thermal conductivity (k); and fraction of minerals, water or ice, organic material, and air. The heat conduction equation was discretised along the borehole depth using finite differences and was subsequently solved by applying the method of lines. For details of CryoGRID2, see Westermann et al. (2013) and Czekirda et al. (2019), who applied CryoGRID2 spatially for southern Norway and Iceland, respectively.
4.1 Regional climate trends
In northern Europe and particularly in Norway, SAT had a positive trend of between +0.2 and +0.6 ∘C per decade between 1991 and 2020 (Fig. 2a). Since ca. 1990, we observe mainly higher SAT (between +0.5 and +1.5 ∘C) than average during the current normal period (1991–2020) for all permafrost observatories included in this study (Fig. 2b). Northern Norway has the largest positive deviation from the normal period, while Iceland has the lowest, with deviations normally below +1 ∘C. There is a trend in terms of increased snow cover, especially in eastern Norway (Tronfjell) and northern Norway (Iškoras and Guolasjávri) (Fig. 2c). In central and western Norway (Jotunheimen), the SWE increase was less pronounced or absent (Fig. 2c).
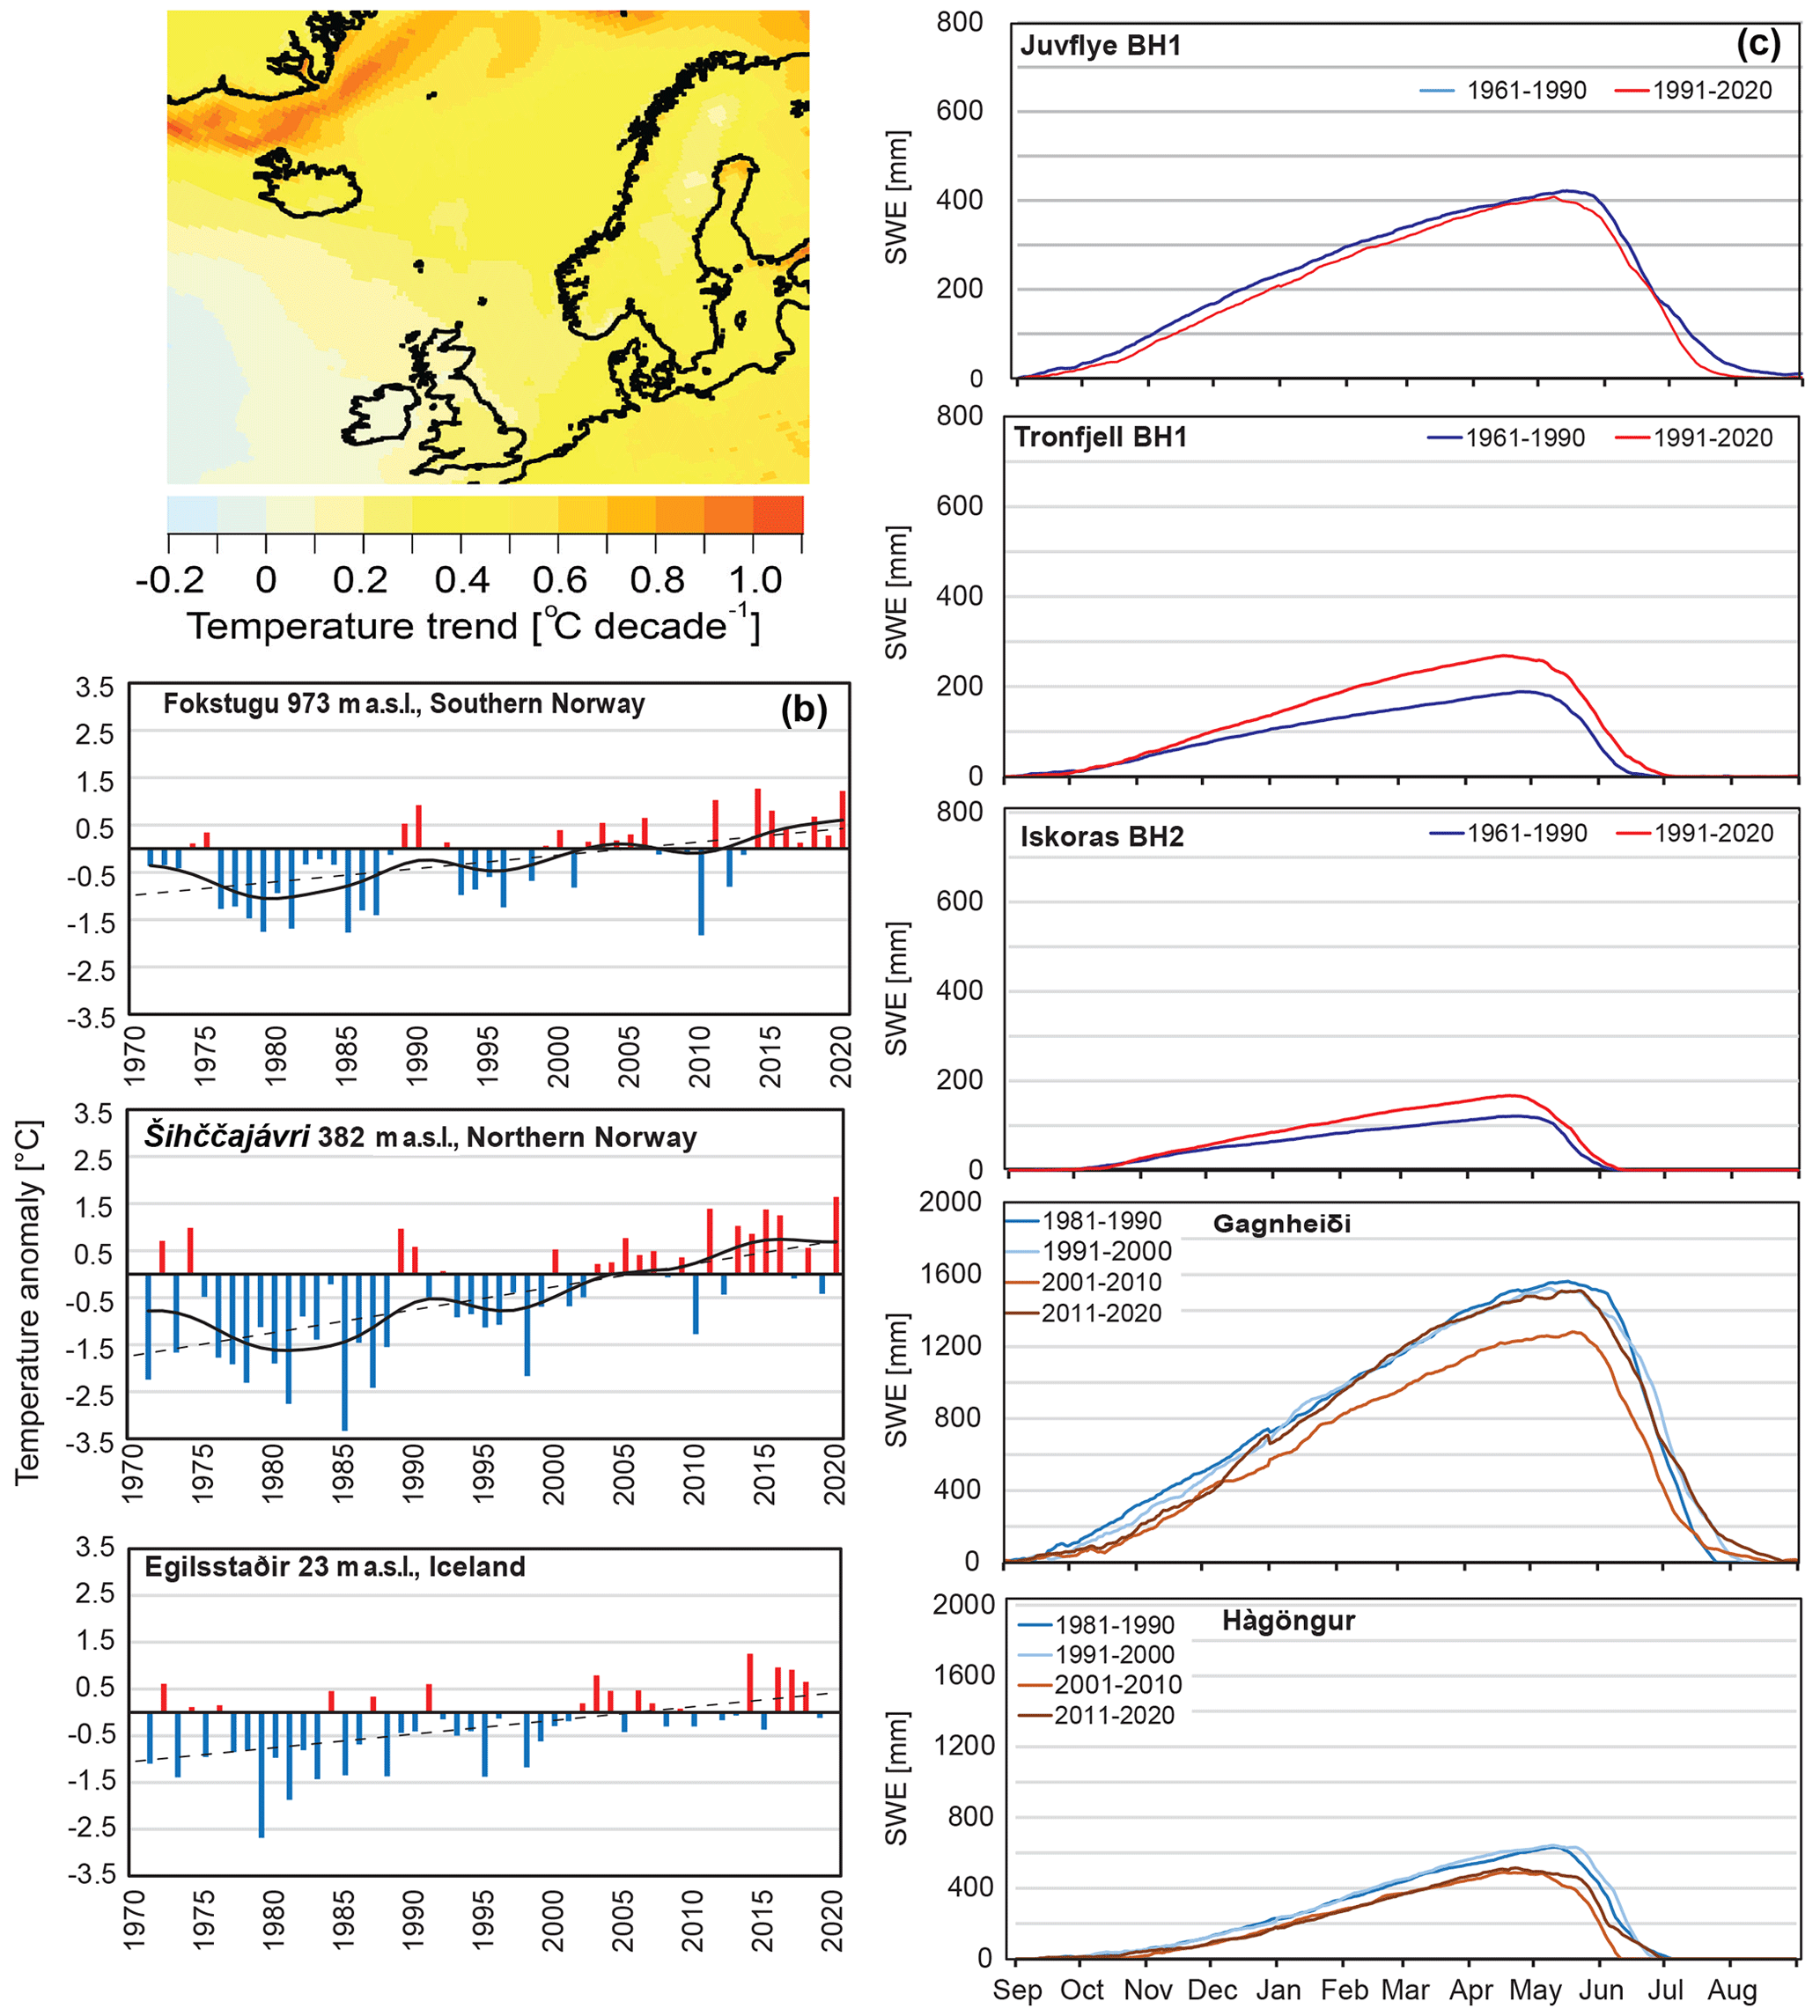
Figure 2(a) Decadal air temperature trend during the 30-year normal period 1991–2020 based on ERA5 reanalysis data (Hersbach et al., 2020). (b) Time series of MAAT from 1971 to 2020 obtained from official weather stations located near the borehole observatories. Annual values are shown as temperature anomalies with respect to the 1991–2020 average. The solid black line shows decadal variations based on a Gaussian filter, while the dotted black line shows the long-term trend. (c) Decadal mean of snow water equivalent (SWE) for selected Icelandic and Norwegian sites. SWE in Iceland was computed using a degree-day SWE model and the HARMONIE precipitation data set (Bengtsson et al., 2017). For Icelandic sites, the data are calculated for the closest 1 km2 grid cell and a precipitation fraction of 1. The decadal mean of SWE for selected Norwegian sites was obtained from seNorge (Saloranta, 2012). For Norwegian sites, the data are calculated from nearby grid points with representative heights (±50 m elevation).
In Iceland, snow depth is normally higher than at the Norwegian sites, with slightly increasing trends especially after 2010 in eastern Iceland (Gunnarsson et al., 2019). In central Iceland (Hágöngur), snow cover (SWE) seems to decrease slightly after 2010 according to our estimations (Fig. 2c).
4.2 Air (SAT), ground surface temperature (GST) and surface offset (SO)
The surface offset (SO) is defined as the temperature difference between GST and SAT (e.g. Smith and Riseborough, 2002) and is normally related to snow cover (winter) and vegetation (summer). The average winter offset (GST minus SAT) is positive at all sites, indicating a higher GST than SAT due to the insulating snow cover (Fig. A1 in the Appendix). However, the magnitude of the winter offset is different, with the sites at Iškoras, Tronfjell, Jetta and Vopnafjörður in Iceland having average offsets close to +3 ∘C or above (Fig. A1). Summer offsets also indicate, in general, higher GST than SAT, except for the Iškoras site. This may be related to vegetation cover, which cools the ground surface during summer due to shading, and/or a more persistent snow cover during spring, when SAT becomes positive.
At the Norwegian sites, the increase in GST is apparently higher than SAT, while at the Icelandic borehole sites, the opposite seems to prevail (Table 1, Fig. A2). We observe also a general increase in SO during the measurement period, with trends varying between <+0.5 and +1.6 ∘C per decade. While the average annual SAT has normally been below 0 ∘C during the measurement period, GST values more often reach >0 ∘C over time. This is especially the case for the sites Jetta, Tronfjell and Iškoras in Norway and Hágöngur in Iceland, facilitating thawing and degradation of permafrost at these sites (see Fig. A2).
4.3 Ground temperature (GT)
In general, ground temperature (GT) at 10 m depth increased during the measurement period (Fig. 3, Table 1), although 3 cold years in 2010–2013 led to a temporary cooling of ground temperatures in southern Norway (Fig. 3b). Since then, GT increased at an accelerated pace, and the GT trend at ca. 10 m depth varied between 0 and +0.5 ∘C per decade (Table 1). In northern Norway, a warming trend prevailed during the entire measurement period, with values between +0.4 and +0.5 ∘C per decade at 10 m depth for all sites. In Iceland, GT trends were also mainly positive but below +0.3 ∘C per decade (Table 1). In general, the warmest years have been recorded since 2018 at all sites, with the exception of 2021 and 2022 (Figs. 3 and 4). The fastest increase of GT after the cool period in 2010–2013 was observed in Tronfjell, southern Norway, possibly because of the loss of ground ice, facilitating rapid warming. Also, the Jetta BH1 site showed a somewhat steeper temperature increase. This borehole is drilled in bedrock and therefore has little ice content.
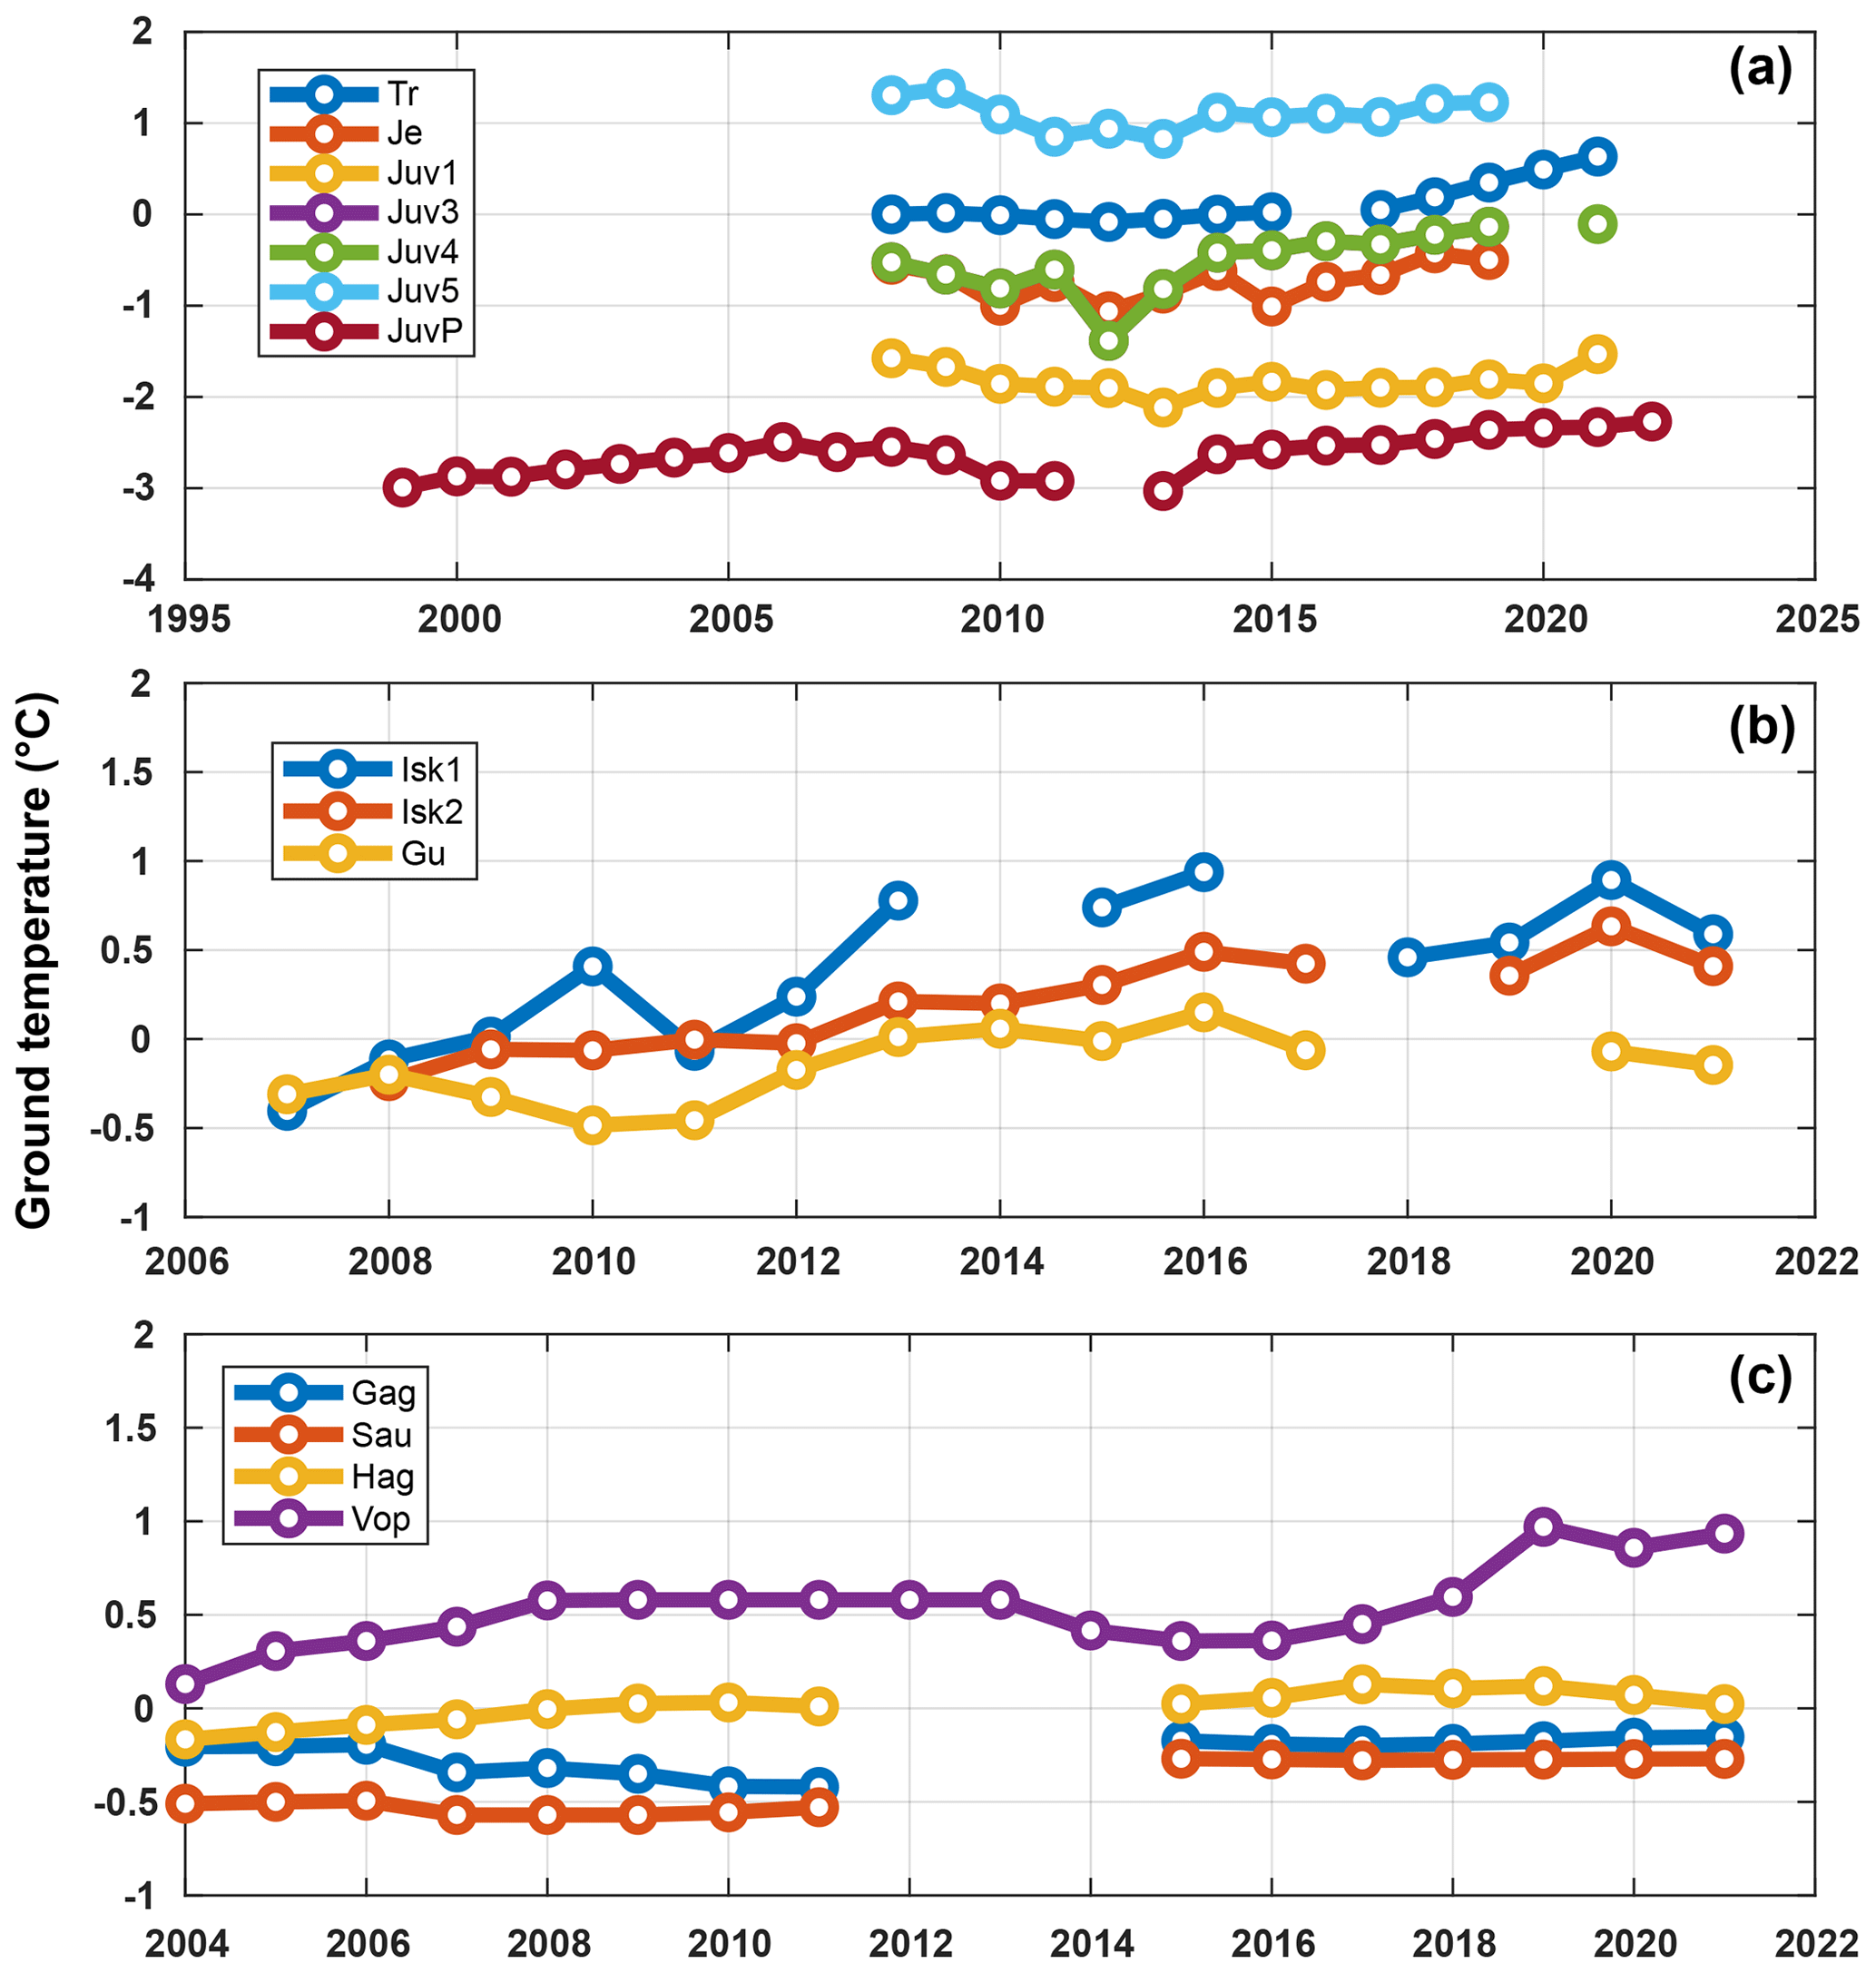
Figure 3Ground temperature (GT) development in time at 10 m depth at selected sites calculated over a hydrological year in (a) southern Norway, (b) northern Norway and (c) Iceland. At Vopnafjörður in Iceland, GT = 20 m.
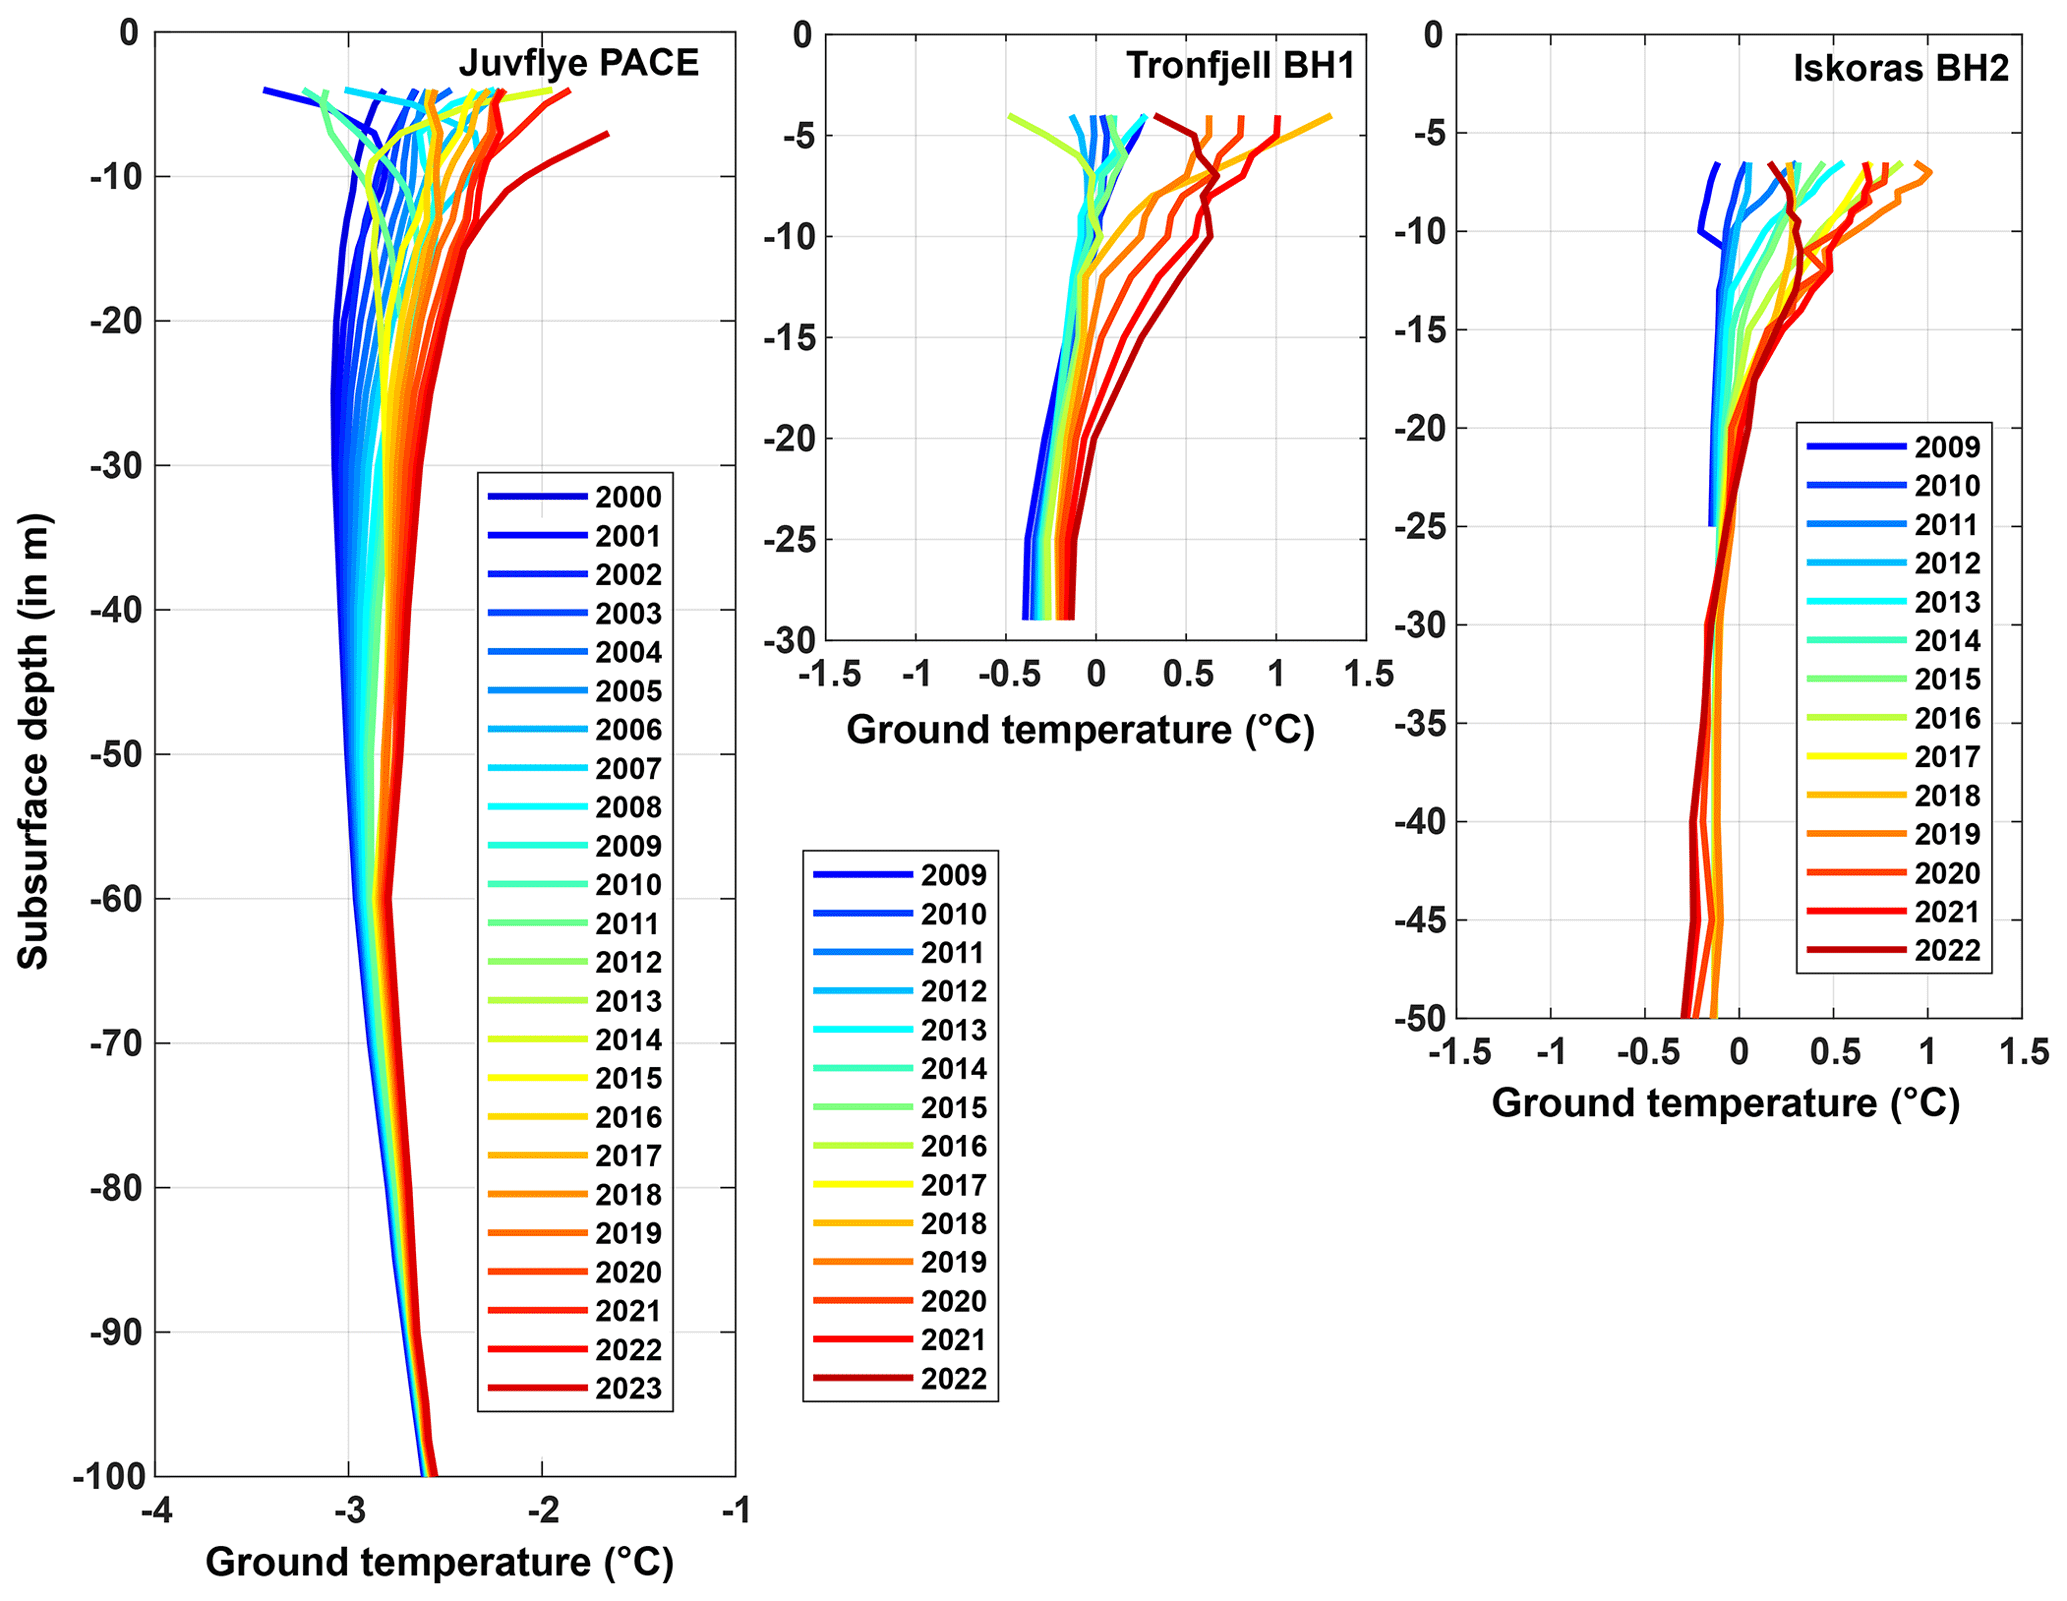
Figure 4Annual average GT with depth for Juvflye, Tronfjell and Iškoras over the measurement period. The last years were the warmest over the entire observation period and at all depths.
4.4 Active-layer thickness (ALT)
The ALT development in southern Norway shows a cyclic development because of the cool period between 2010 and 2013 (Fig. 5). However, already 1 year after the cool years, the ALT at all sites reached the same depth range as in the years before the cool period. The reduction of the active layer in the 2012–2013 season is observed at all sites in southern Norway, with the most pronounced change at Tronfjell and the least pronounced in the Juvflye area. Juvflye BH1 is drilled in a silt-rich cryoturbated till above bedrock, and the sediment cover is more ice rich, damping the ALT changes. In northern Norway, ALT has continuously increased throughout the monitoring period, while in Iceland, the main increase was registered after 2015 (Fig. B2).
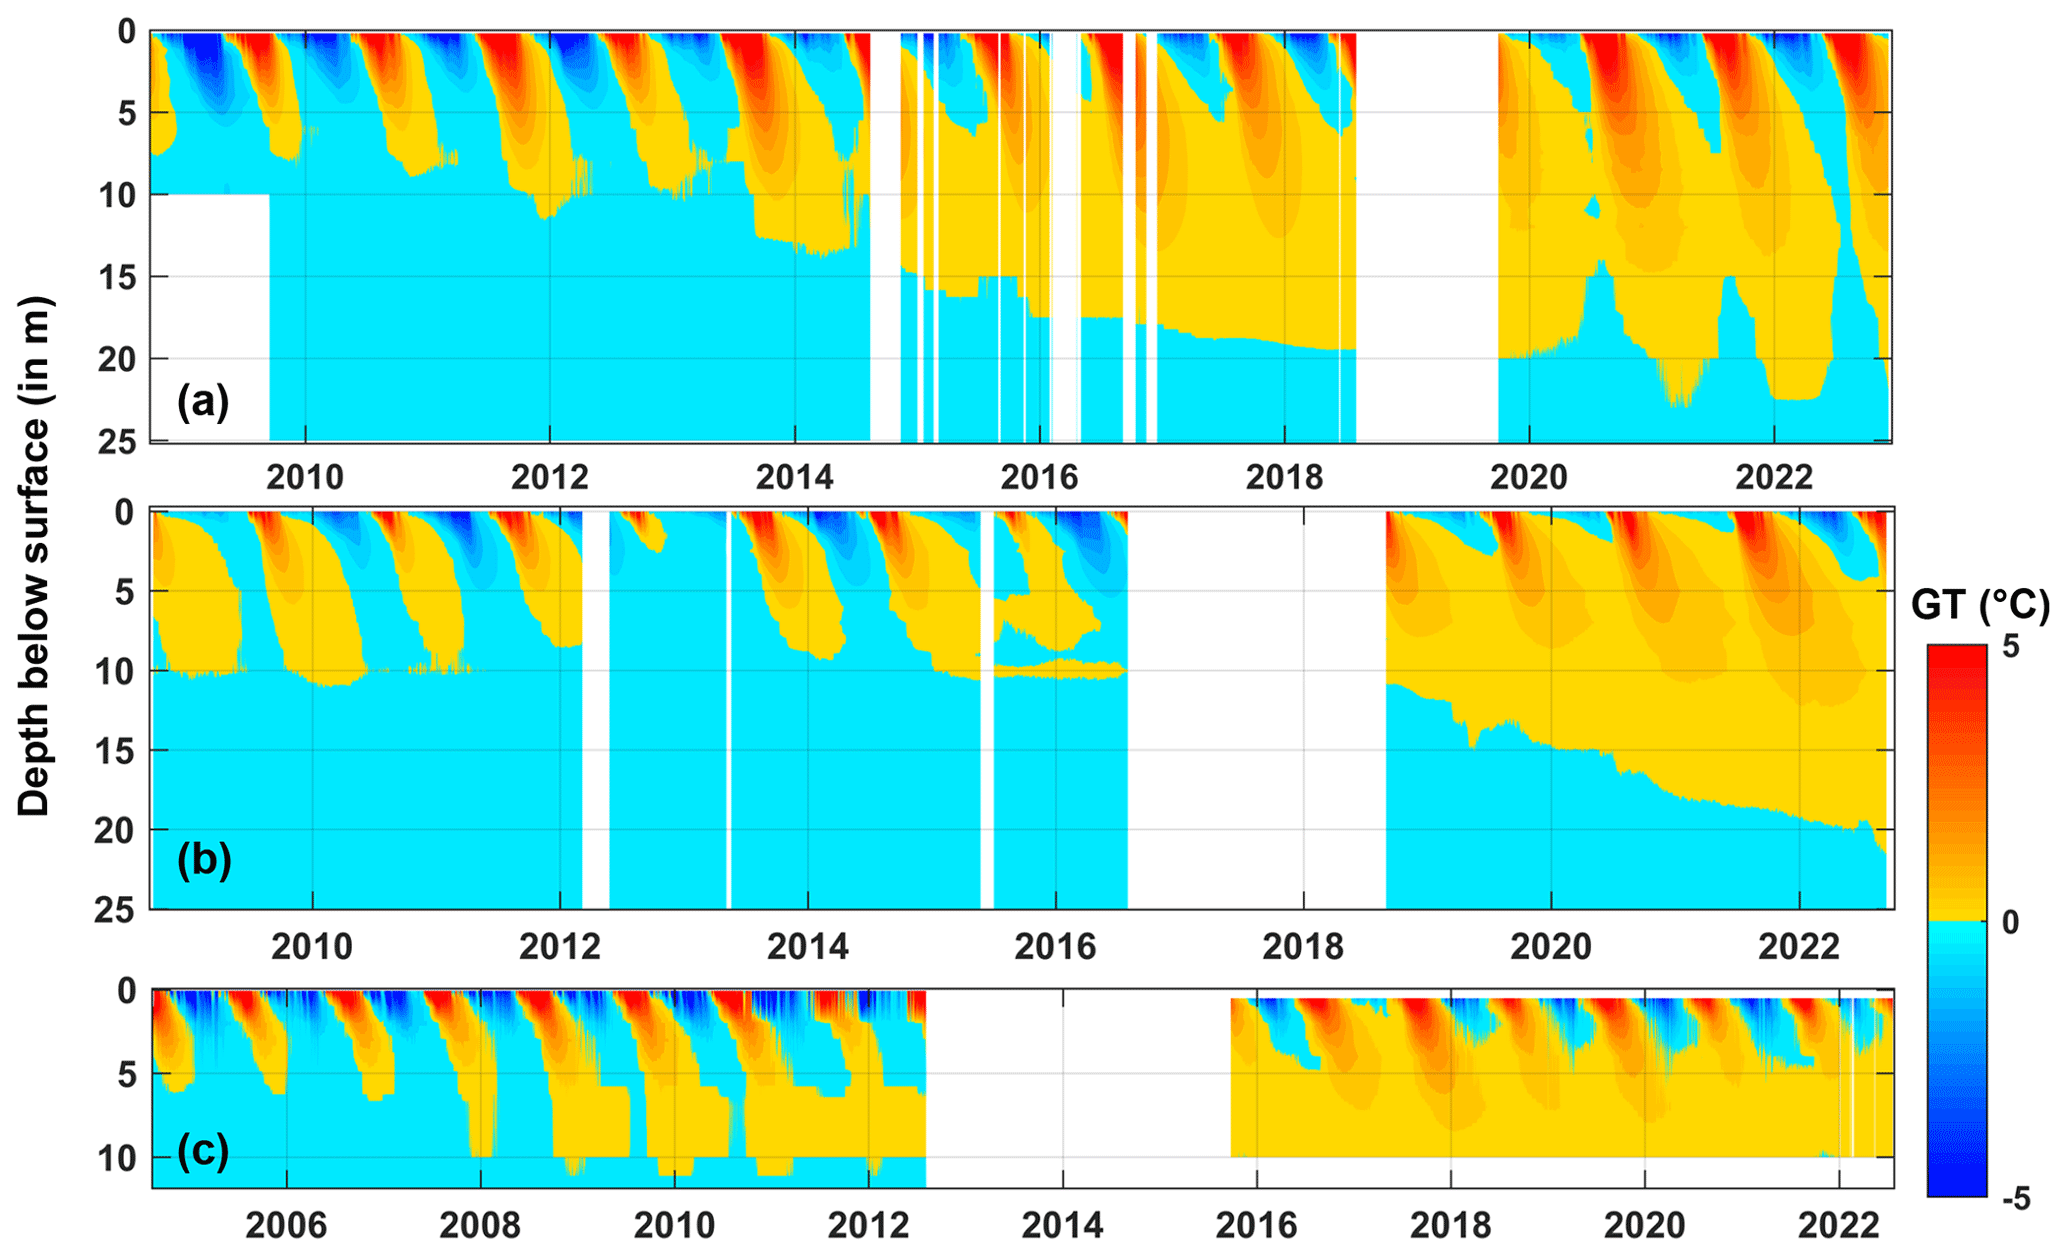
Figure 5Time–depth–temperature plot for selected sites at the permafrost observatories. (a) Iškoras BH2. Here, a talik developed after 2014; however, the borehole partly re-froze after 2022. (b) Tronfjell BH1. A talik developed rapidly after the data gap between 2016 and 2018. (c) Hágöngur. Here, a talik was already established in 2012.
At three of our sites in Norway and Iceland, a clear talik development was observed (Fig. 5). At Iškoras BH2, a talik started to develop during the winter of 2014–2015, following a series of 3 years with high SAT. This talik evolved rapidly, and permafrost thawed down to 22 m in 2022; however, the winters in 2021 and 2022 were cool and reversed some of the talik development (Fig. 5a). At Iškoras BH1, which is drilled in pure bedrock, permafrost was not observed within the borehole (10 m), even though the borehole froze back completely at the start of the monitoring period. Also here, a strong warming is observed during the entire monitoring period, with no re-freezing of the borehole since 2014 (Fig. B2b). At Guolasjávri, we can see a similar development, with thaw deeper than 15 m after 2015 and manual measurements with a thermistor string indicating positive ground temperatures at 22 m depth in 2019. Until 2020, seasonal freezing down to 15 m was observed, but since then, temperatures above 0 ∘C have been registered at 15 m depth (Fig. B2b).
In southern Norway, Tronfjell developed a talik sometime after 2017 (data gap), and at present, it experiences thaw down to 20 m (Fig. 5b). After a very cool winter in 2012–2013 and a subsequent cool summer in 2013, the ALT at this site was drastically reduced by ca. 8 m compared to the years before. After this event, ALT quickly rebounded to similar values as before, followed by an increase in ALT. In the last years, there are signs that the ground does not fully freeze back anymore.
In Iceland, ALT increased after 2012. A talik had already developed in Hágöngur after 2010, and the borehole is free of permafrost in 2022 (Fig. 5c). However, at greater depth, permafrost may still prevail. At Gagnhaiði, a shallow zone between 4 and 5 m seems not to have re-frozen during winter since 2016 (Fig. B2c); however, this measurement must be taken with caution as the measurements can also be related to uncertainties with regard to the thermistor precision (Fig. B2c).
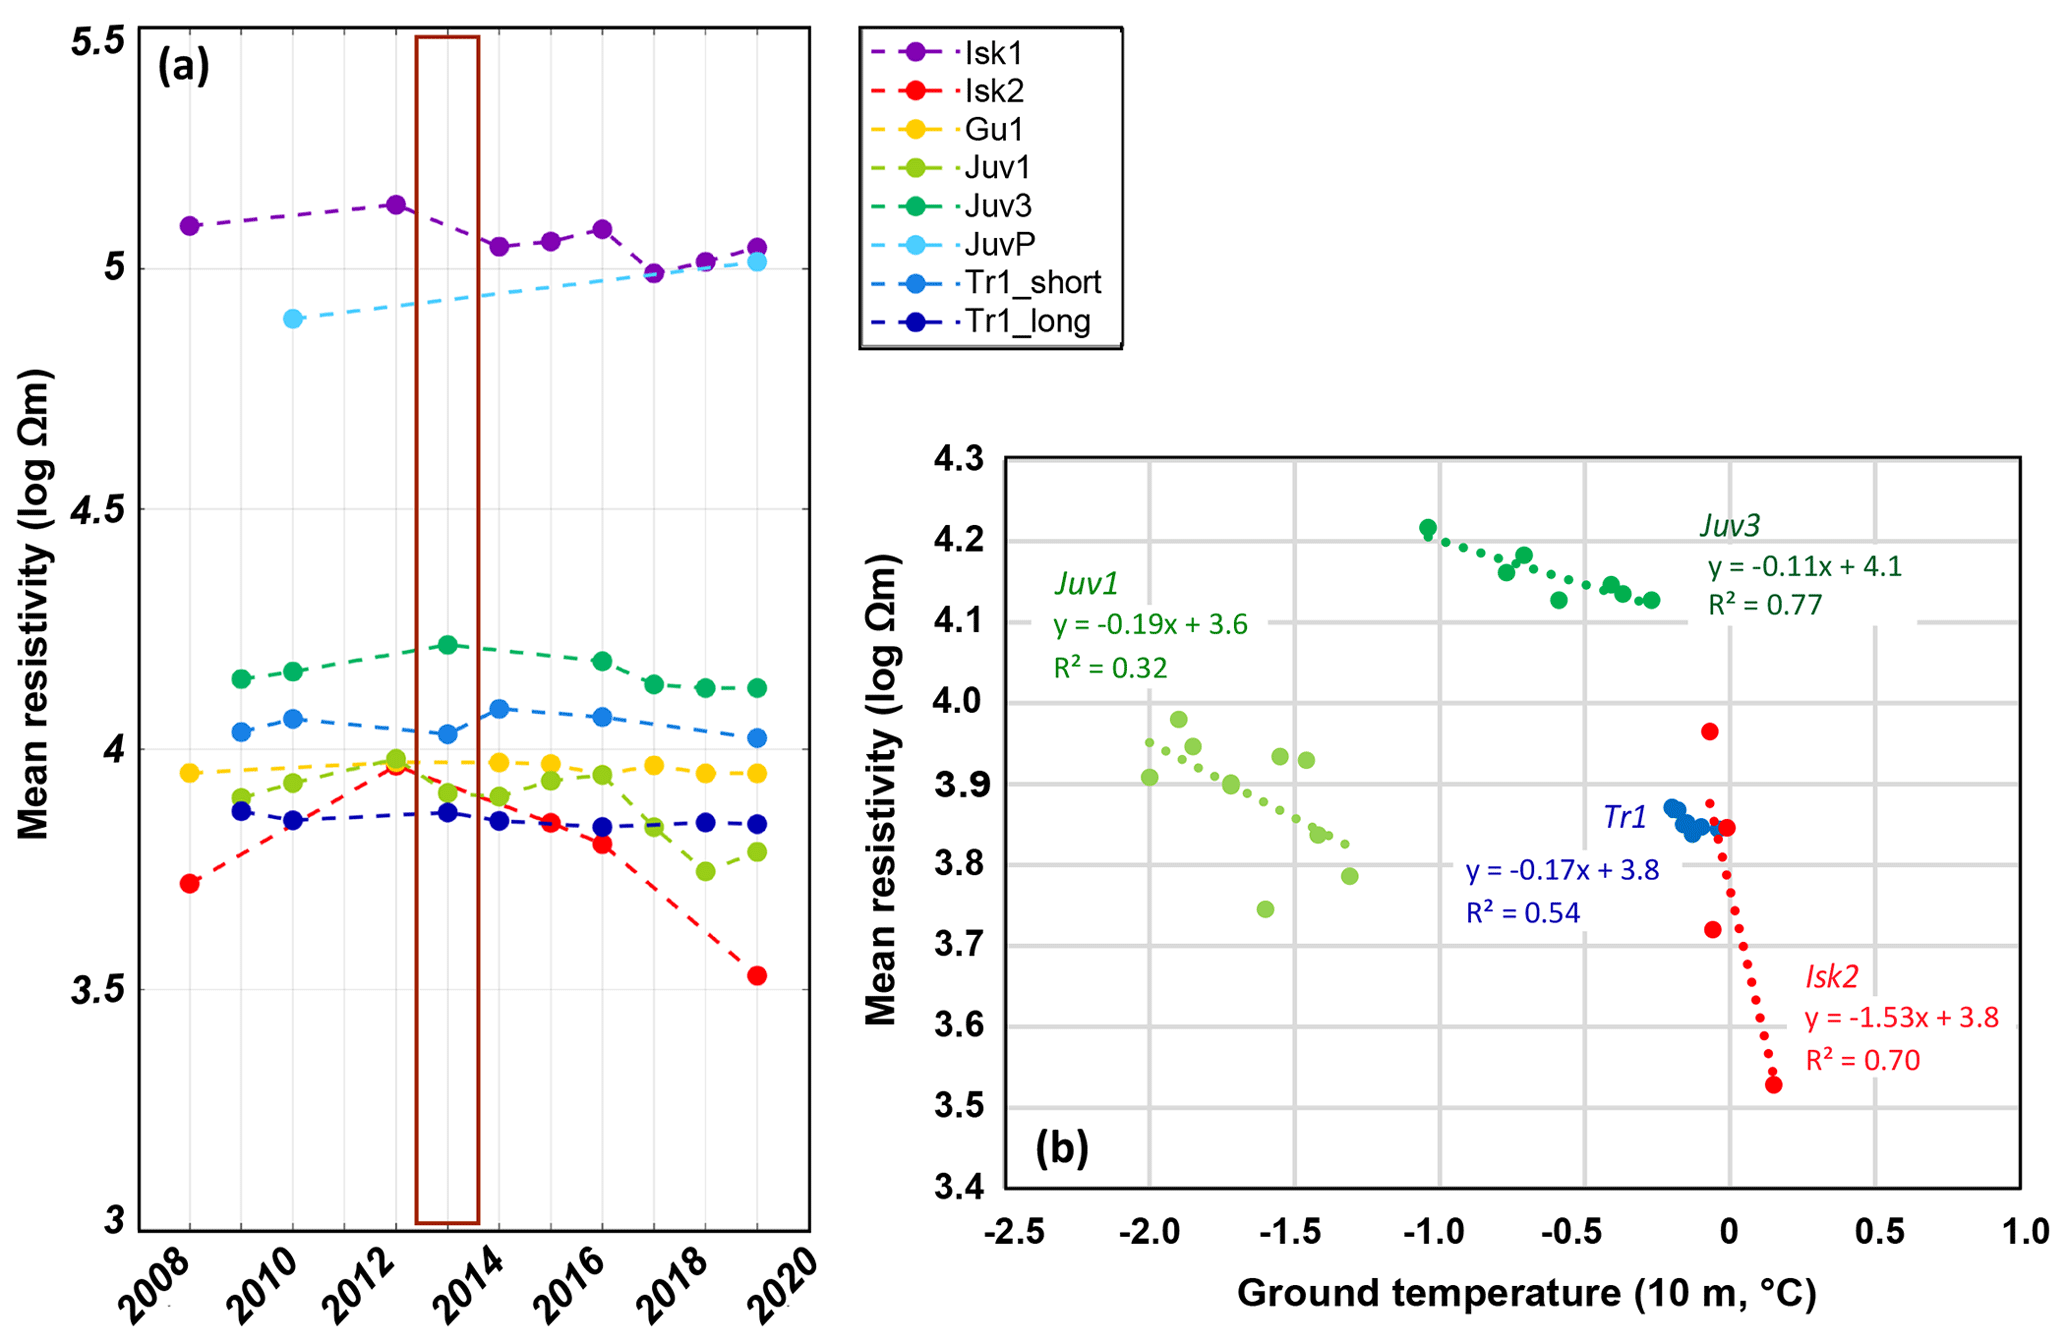
Figure 6(a) Development of specific resistivity at borehole locations at the sites where multi-temporal ERT surveys were measured. The values are calculated as a spatial mean over an area (the so-called zone of interest, ZOI), mostly 10–20 m wide and a couple of metres deep. This ZOI is considered to be a representative permafrost zone below the active layer, at least during the first part of the measurement period. The box indicates the cold period around 2013. (b) Average specific resistivity as in (a), plotted against the average ground temperature at the date of the ERT survey within the same depth range. All sites show a consistent overall decrease in resistivity with increasing ground temperatures, with the most pronounced resistivity change around the melting point.
4.5 Electrical resistivity changes
The time series of electrical resistivity changes obtained from the repeated ERT surveys show an explainable pattern for the different profiles (Fig. 6a) and can be related to GT variations (Fig. 6b). For this, the inverted specific resistivity values were averaged within a so-called zone of interest (ZOI; see Etzelmüller et al., 2020a; Hilbich et al., 2022), which was manually defined around the borehole location and below the active-layer depth for each site or profile. In Fig. 6b, the mean resistivity value is then plotted against the mean borehole temperature over the same depth range at the date of the ERT measurement. In southern Norway, resistivity values increase slightly during the cool period before 2013 and decrease afterwards. In northern Norway, a stable (Guolasjávri) or decreasing trend (Iškoras) was observed. When relating average resistivity with average borehole temperatures, a negative relationship dominates (Fig. 6b), as expected from theory (e.g. Oldenborger and LeBlanc, 2018), varying between −1.5 logΩm ∘C−1 at Iškoras to −0.1 logΩm ∘C−1 at JuvBH3.
4.6 Heat flow modelling (CryoGRID2)
The numerical modelling successfully reconstructed the development of taliks at or close to the timing of the observations, indicating that most of the thermal patterns in the ground can be explained by conductive heat flow modelling alone (Fig. 7a). At Iškoras, the onset of the talik formation could be reproduced well, along with the approximate thaw depth. ALT during the cooler part of the model period before 1990 was around 5 m, increasing to 10 m after 2000. At Tronfjell (Fig. 7b), the fit between simulated and observed temperatures was worse; however, the latest talik development was reproduced, along with the observed thaw depth. The model implicated large ALT and almost implicated talik formation early in the 2000s, while the observed shallow ALT of below 2 m in 2013 was reproduced. According to the model, ALT was close to 2–3 m until 2000, where a strong increase in ALT was simulated. This seems to be related to variations in snow depth, which have had an increasing trend since 2000. This is in accordance with observations of snow depth development in the mountains of Norway (e.g. Dyrrdal et al., 2012).
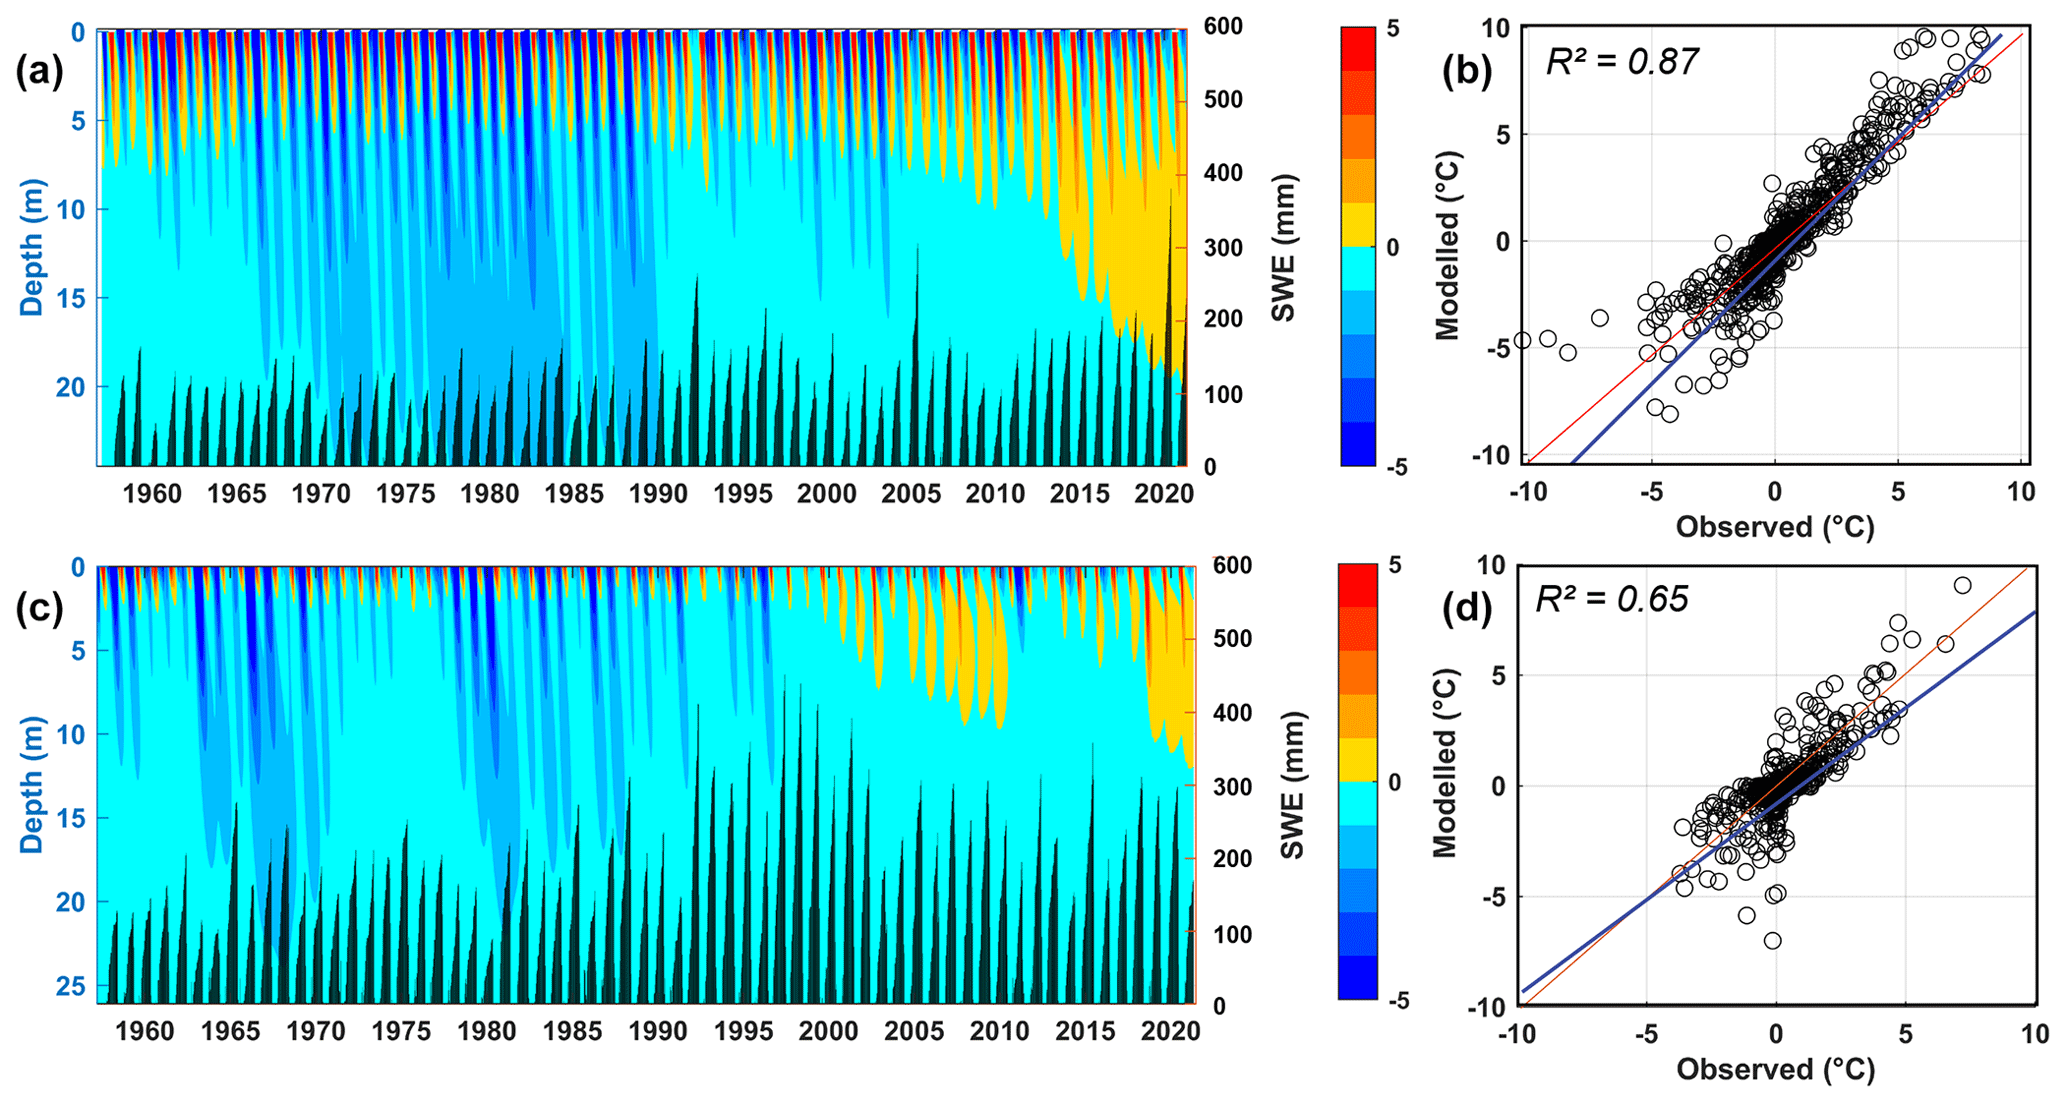
Figure 7Results from ground heat flow modelling at two boreholes, (a) Iškoras BH1 and (c) Tronfjell BH1, with observed talik development for the period 1957 to 2020. (a, c) Modelled time–depth–temperature plot, with the black bars indicating modelled snow water equivalent (SWE) (mm) at the sites based on Lussana et al. (2018a, b) and Saloranta (2016). (b, d) Validating scatter plots for all GTs between 0 and 10 m depth for the period 2009 and 2020, with associated R2 values for the fit between modelled and observed ground temperatures. The red line is the 1:1 line, while the blue line shows the linear regression between observed and modelled values. Both sites show talik development and demonstrate that the last decade was the warmest since 1957. SWE has increased by 50 and 82 mm per decade for Iškoras and Tronfjell, respectively, during this period.
5.1 Permafrost dynamics
The observed GT developments presented in this study are all in line with recent publications of permafrost dynamics in a changing climate. Permafrost warming and degradation seem to be more rapid in the north than in the south and in the maritime west, which is consistent with previous research (Etzelmüller et al., 2020a; Biskaborn et al., 2019; Romanovsky et al., 2010; Christiansen et al., 2010; Smith et al., 2022). Warm permafrost sites normally show slower thermal response than colder sites due to latent heat processes (Romanovsky et al., 2010; Smith et al., 2022); however, at our sites, water and ice contents are low, facilitating fast thermal response. Finally, the highest permafrost temperatures were recorded between 2019 and 2021 at all sites and are in line with a previous study by Etzelmüller et al. (2020a).
Trends in GT are consistent with trends in SAT. The 2011–2020 decade was the warmest on the SAT record in Norway and Iceland, and most of the years from 2014 through to 2022 rank among the warmest years on record (updated time series from MET Norway and IMO). Talik development was observed during the last part of the monitoring period in all permafrost observatories. Such drastic ground temperature development is normally due to an increase in GST, either due to higher SAT or a change in snow cover and composition.
Temporal variability in snow cover is an additional driver of changes in ground surface and permafrost temperature owing to its insulating effect, which restricts winter heat loss from the ground and modulates the influence of air temperature changes on the ground thermal regime (Smith et al., 2022). There is a clear tendency towards increasing snow depth during the monitoring period, along with a shortening of snow cover duration with both later snow onset and earlier snow disappearance (Etzelmüller et al., 2020a). The later snow onset seems not to be accompanied by more freezing of the ground but rather by an increase in thawing degree days (TDDs) during autumn (Fig. C1b). It was also speculated that more frequent and intense rain-on-snow (ROS) events (Pall et al., 2019; Westermann et al., 2011; Rizzi et al., 2018) and winter warm spells form ice layers near the snow surface, thus reducing snow surface erosion due to wind and leading to a thicker winter snow cover. There are no clear observations of this phenomenon; however, there are various studies documenting more rain-on-snow events in Norwegian mountains, potentially influencing snow composition, thickness and thermal conductivity (Rizzi et al., 2018; Dyrrdal et al., 2012; Vikhamar-Schuler et al., 2016). Our numerical modelling indicates that the variations in SAT and snow depth from seNorge (Lussana et al., 2018b) alone could predict the onset of the talik reasonably well. Furthermore, thermal preconditioning is discussed, e.g. heat waves reducing the ice content in the ground and thus conditioning the ground to develop taliks more easily. This could be the case at Tronfjell where a smaller talik was modelled just after 2000 (Fig. 7), reducing potential ice and/or water content. This increases the potential for faster talik formation after a cool period because of lower ice content. The process was also discussed in Isaksen et al. (2011), who observed the first signs of talik formation in a permafrost monitoring site in Dovrefjell between 2006–2009 and the formation of talik in a model for the same 3 years (2006–2009) at Juv-BH5, which today has no permafrost in the upper 10 m.
5.2 The influence of ground characteristics
With the exception of the boreholes at Juvflye (BH1) and Trond (BH1), all boreholes are drilled in coarse sediment cover or in bedrock with only a thin sediment cover of less than 2–3 m (Farbrot et al., 2007, 2011, 2013) and relatively small ice content. Permafrost in Scandinavia is mostly restricted to mountain environments, besides in the Finnmarksvidda area, where permafrost is widely encountered in palsa mires and peat plateaus (Borge et al., 2017; Martin et al., 2021; Kjellman et al., 2018). In the mountains, thin sediment thickness above bedrock dominates with few exceptions. This makes mountain areas fast to respond in comparison to the more ice-rich arctic areas, especially if ALT exceeds the general sediment thickness. Thus, the response of near-surface ground temperatures (ca. <20 m) to changing climate forcing is fast to immediate. At the Iškoras site, we observe a partial reversal of the degradation development (Fig. 5a). This indicates very low water content in the bedrock and the very high thermal conductivity of the underlying quartzite, with values of >5 W m−1 K−1 measured in bedrock cores from the site (Farbrot et al., 2013).
This is also confirmed by the ERT trend between resistivity and average ground temperature, which varied between −1.5 logΩm ∘C−1 at Iškoras to −0.1 logΩm ∘C−1 at JuvBH3. The large trend at Iškoras reflects the (strong) decrease of resistivity upon thawing close to the melting point, where the liquid water content strongly increases and where the mobility of the ions in the pore fluid increases as well. The large variation in the gradients in the negative temperature range can be related to bedrock type and moisture and/or ice contents. The smaller gradient at JuvBH3 is related to a small moisture and/or ice content, and the larger gradient at JuvBH1 corresponds to an increased ice content (e.g. Hauck, 2002).
5.3 The influence of air temperature inversions
Winter air temperature inversions and changes in inversion patterns will highly influence the thermal regime at local sites. Normally, the frequency and magnitude of winter inversions increase with continentality (Fig. D1a). In extreme cases, valley bottom temperatures can become much lower than higher up in the mountains, even in terms of an annual average, as observed e.g. in continental mountain sites in Yukon and Alaska (Lewkowicz et al., 2011; Lewkowicz and Bonnaventure, 2011). This climate pattern might lead to the preservation of palsas and peat plateaus in the valley bottom, while the nearby mountain peaks at higher elevations may experience degrading permafrost. This inversion pattern is also visible in eastern Norway (Tronfjell), although it is less extreme, while all other areas may have occasional inversions during winter but with overall negative monthly lapse rates (Fig. D1b). The frequency and magnitude of inversions are likely to be influenced by global climate change, and permafrost in different altitudinal zones may thus react differently to the same large-scale changes. The permafrost observatories in Norway are all located close to the mountain tops, while the valleys and even the lower parts of the slopes are generally permafrost free. It is therefore likely that the ground temperature trends presented in this study are largely representative for the mountain permafrost domain in Norway and Iceland. However, permafrost in lowland areas, especially in palsa mires in Finnmark, may potentially experience different trends in SAT due to changes in inversion patterns. Furthermore, we emphasise that transferring SAT trends measured in valley settings to higher elevations may lead to strong biases when assessing the impact of climate change on mountain permafrost.
Based on direct temperature measurements in permafrost boreholes in Norway and Iceland between 2004 (1999 at Juvflye-PACE) and 2022 and repeated electrical resistivity tomography and long-term permafrost modelling, the following conclusions can be drawn.
-
Permafrost in Norway and Iceland has been warming at rates between 0 and 0.6 ∘C per decade (Isk2) at 10 m depth since the start of the measurements. Warming rates were, in general, higher in northern Norway than in southern Norway and Iceland.
-
In all regions studied, the development of taliks or complete permafrost degradation is observed, such as in Tronfjell (southern Norway) and Iškoras (northern Norway). The talik development could be modelled by heat conduction alone and by increasing SAT and snow depth as the main forcing variables since 2010.
-
At most sites, ground surface temperature (GST) is increasing more strongly than surface air temperature (SAT). Changing snow conditions, especially those related to increasing snow depth and a shortening of snow cover duration, appear to be the most important factor for the higher GST rates. A thicker winter snow cover may be related to more frequent and intense rain-on-snow events and winter warm spells, which may reduce snow surface erosion due to wind. Further studies are needed to confirm this hypothesis.
-
Multi-temporal ERT measurements showed decreasing electrical resistivities during the study period at most sites in Norway, associated with clear negative trends between mean electrical resistivity and ground temperature. Both observations indicate a reduction in or total loss of ice at most study sites.
The observation record clearly demonstrates the impact of climate change on the thermal state of permafrost in Norway and Iceland. Several of the Norwegian sites will continue to be part of the national operational permafrost monitoring programme (Isaksen et al., 2022) and will become available in near-real time on https://cryo.met.no/en/permafrost (last access: 12 December 2023).
Surface offset (SO) is the difference of SAT and GST and is highly influenced by snow and vegetation cover. Figures A1 and A2 are both related to SO and show the relative influence of, in particular, snow cover (vegetation cover is low at all sites) in space (at borehole sites) and time.
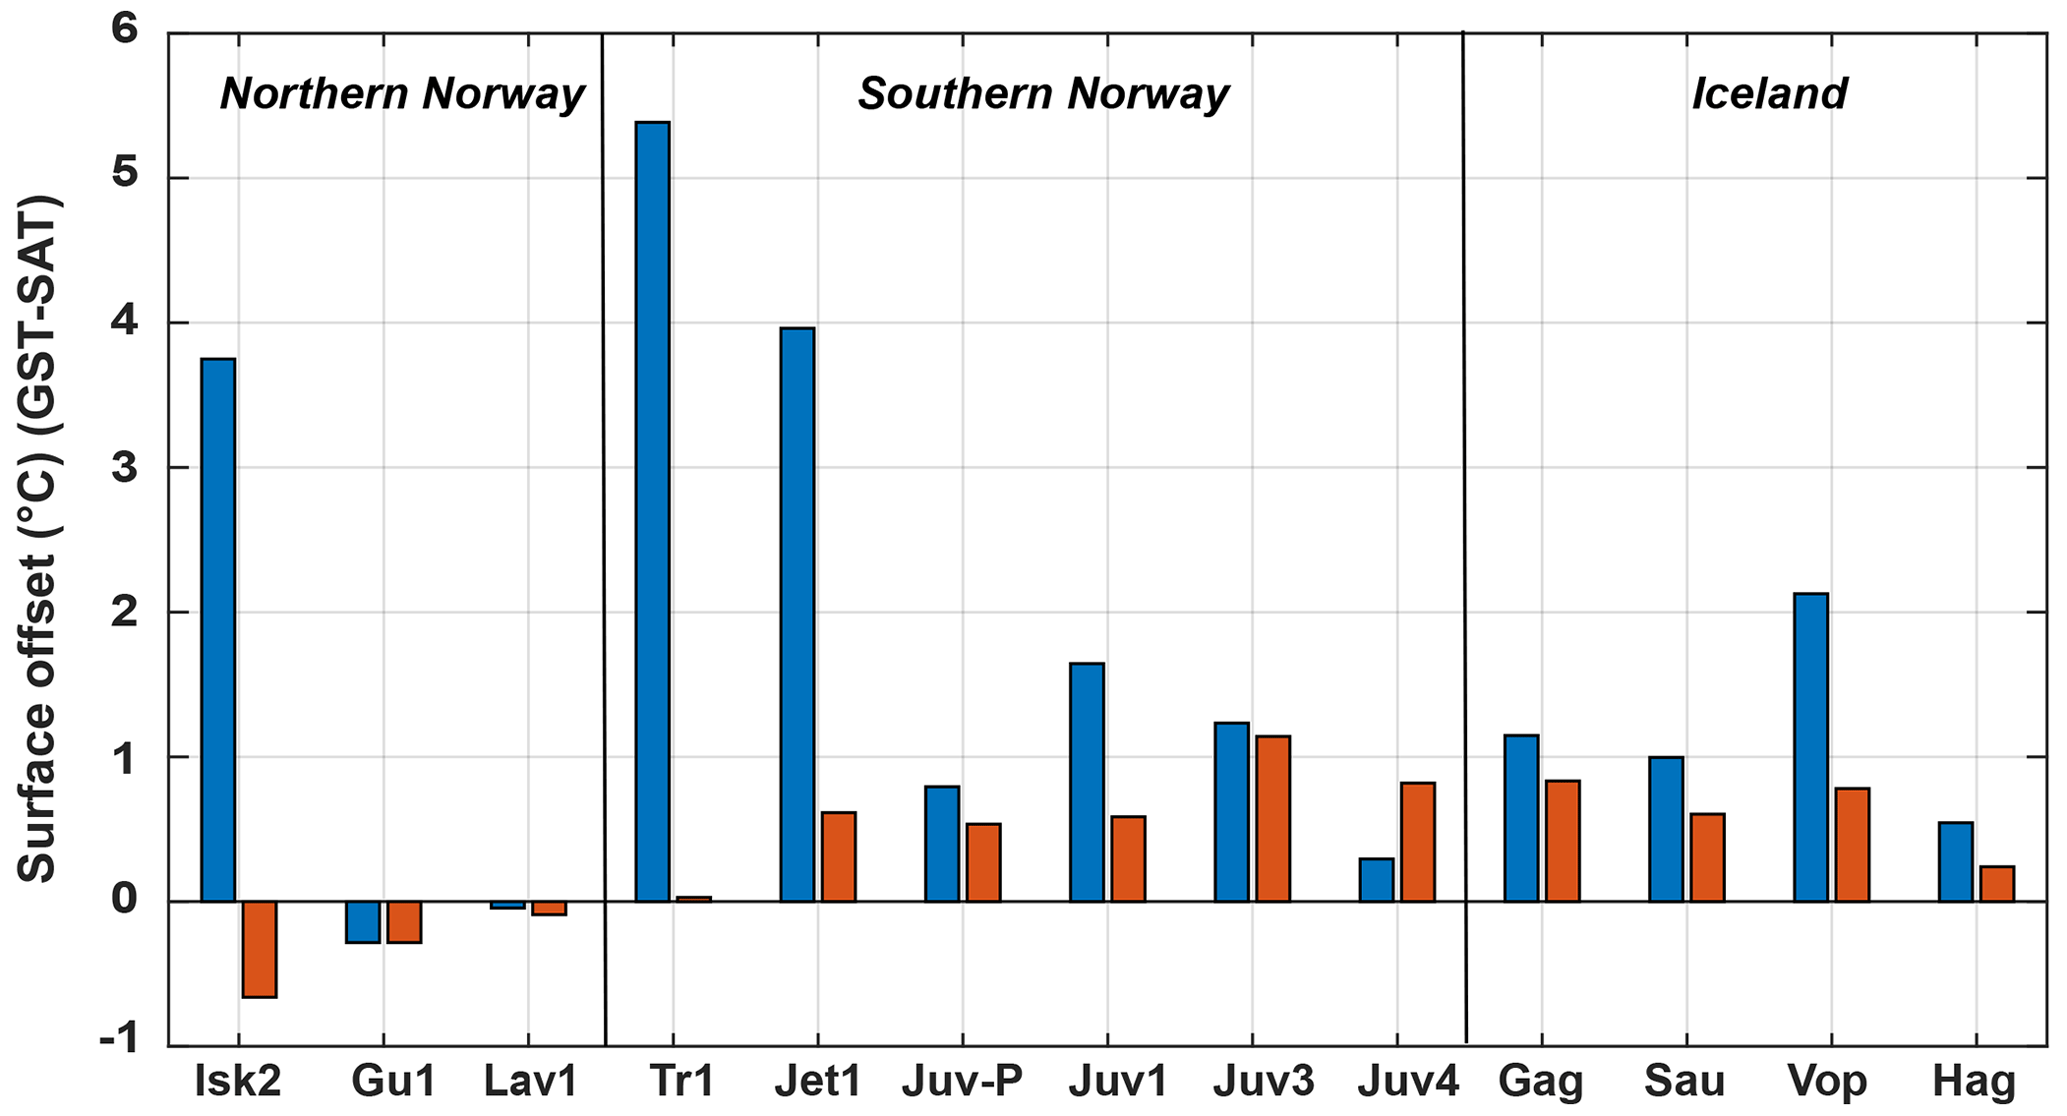
Figure A1Average surface offset (GST – SAT) for selected boreholes in Norway and Iceland. Winter (blue) and summer (red). Most sites show positive winter and summer offsets, indicating warmer conditions at the ground surface than in the air.
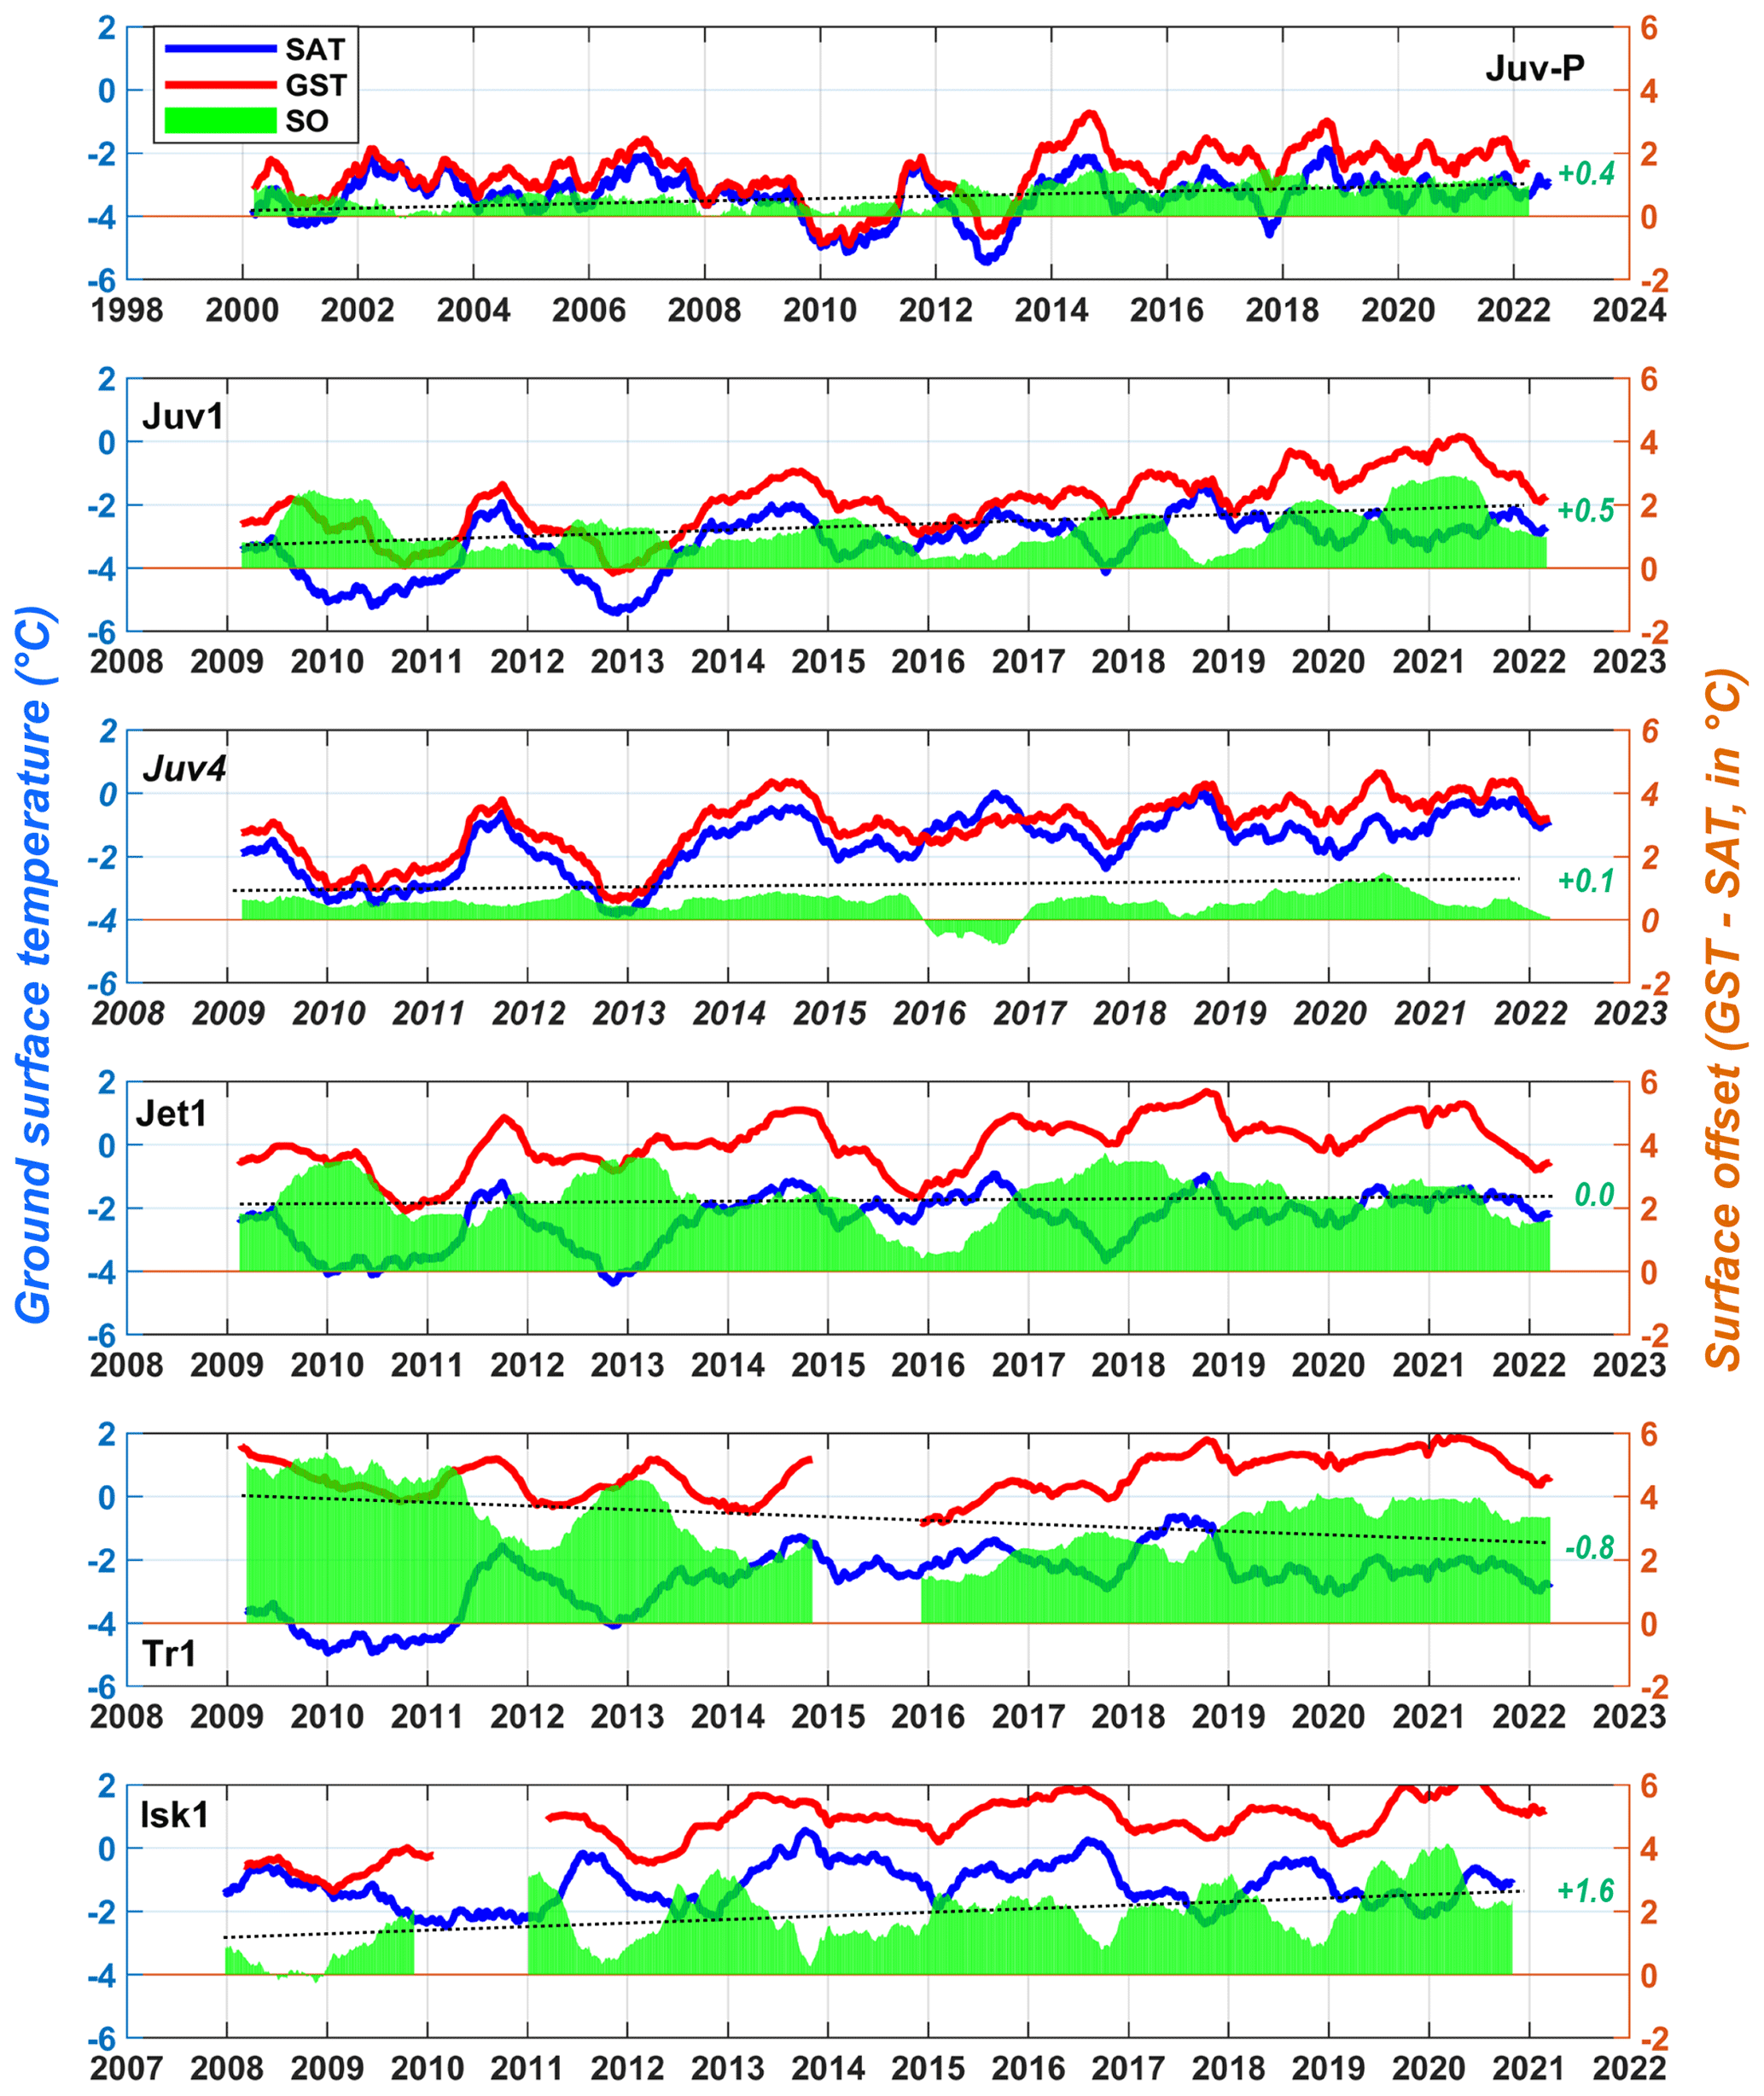
Figure A2Average daily SAT, GST and SO development at selected boreholes in Norway and Iceland. The curves show a 365 d moving average based on a Gaussian filter. The trend lines denote the SO trend, while the green numbers denotes the trend of SO (∘C per decade). The trend varies between 0 ∘C per decade for Jetta BH1 (Jet1) and +1.6 ∘C per decade for IškorasBH2 (Isk1). Tronfjell (TR1) has a negative trend with −0.8 ∘C per decade, probably related to the transition from mainly negative GST at the start of the period towards positive GST. Linear trends are calculated as normal linear regressions between time and temperature, and long-term decadal changes are based on the slope of the regression (a).
The following graphs show the development of ground temperatures and ALT for all borehole sites. For Fig. B1, the ALT is defined as the largest depth for the 0 ∘C contour during the hydrological year. The deviations in percentages are related to the average ALT during the measurement period.
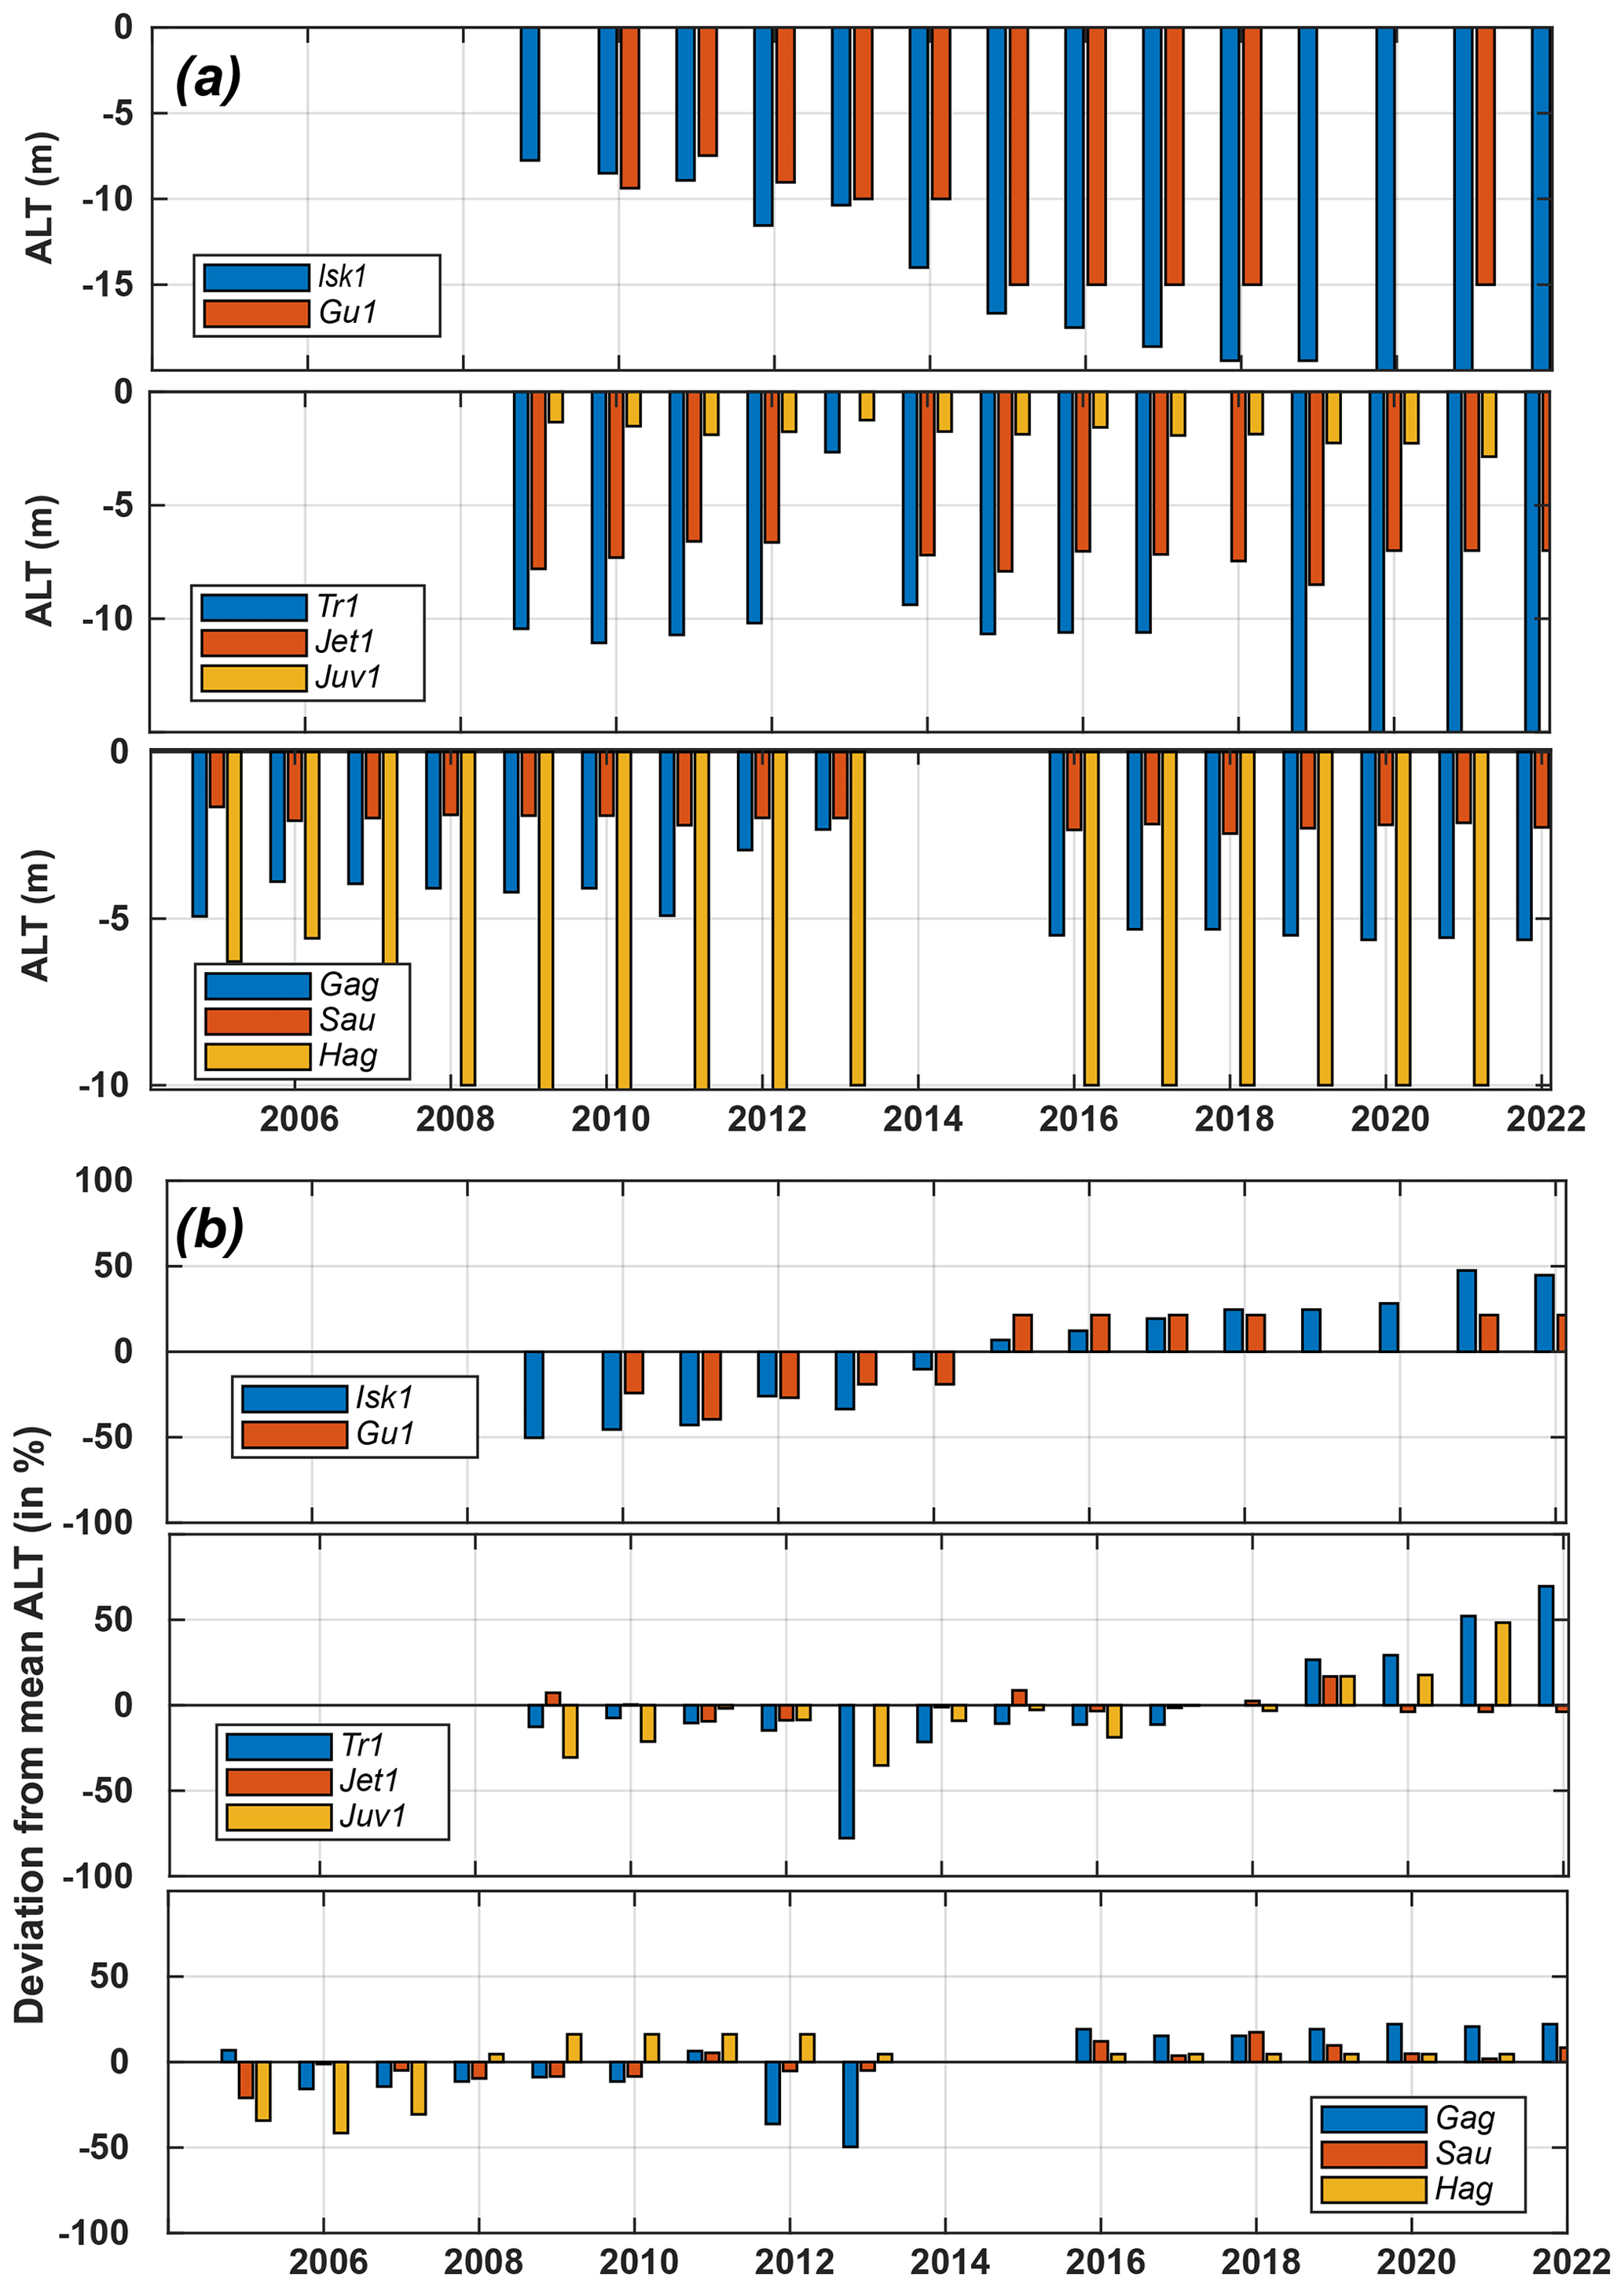
Figure B1(a) Active-layer thickness development at selected boreholes at the permafrost observatories. ALT at exactly −15 or −10 m denotes thaw in the entire borehole length and, normally, talik development (Fig. 5). (b) Normalised active-layer thickness change in relation to overall average during the measurement period in percent. In northern Norway, a steady increasing trend is observed, while in southern Norway, changes were less pronounced and also negative during a couple of years around 2013.
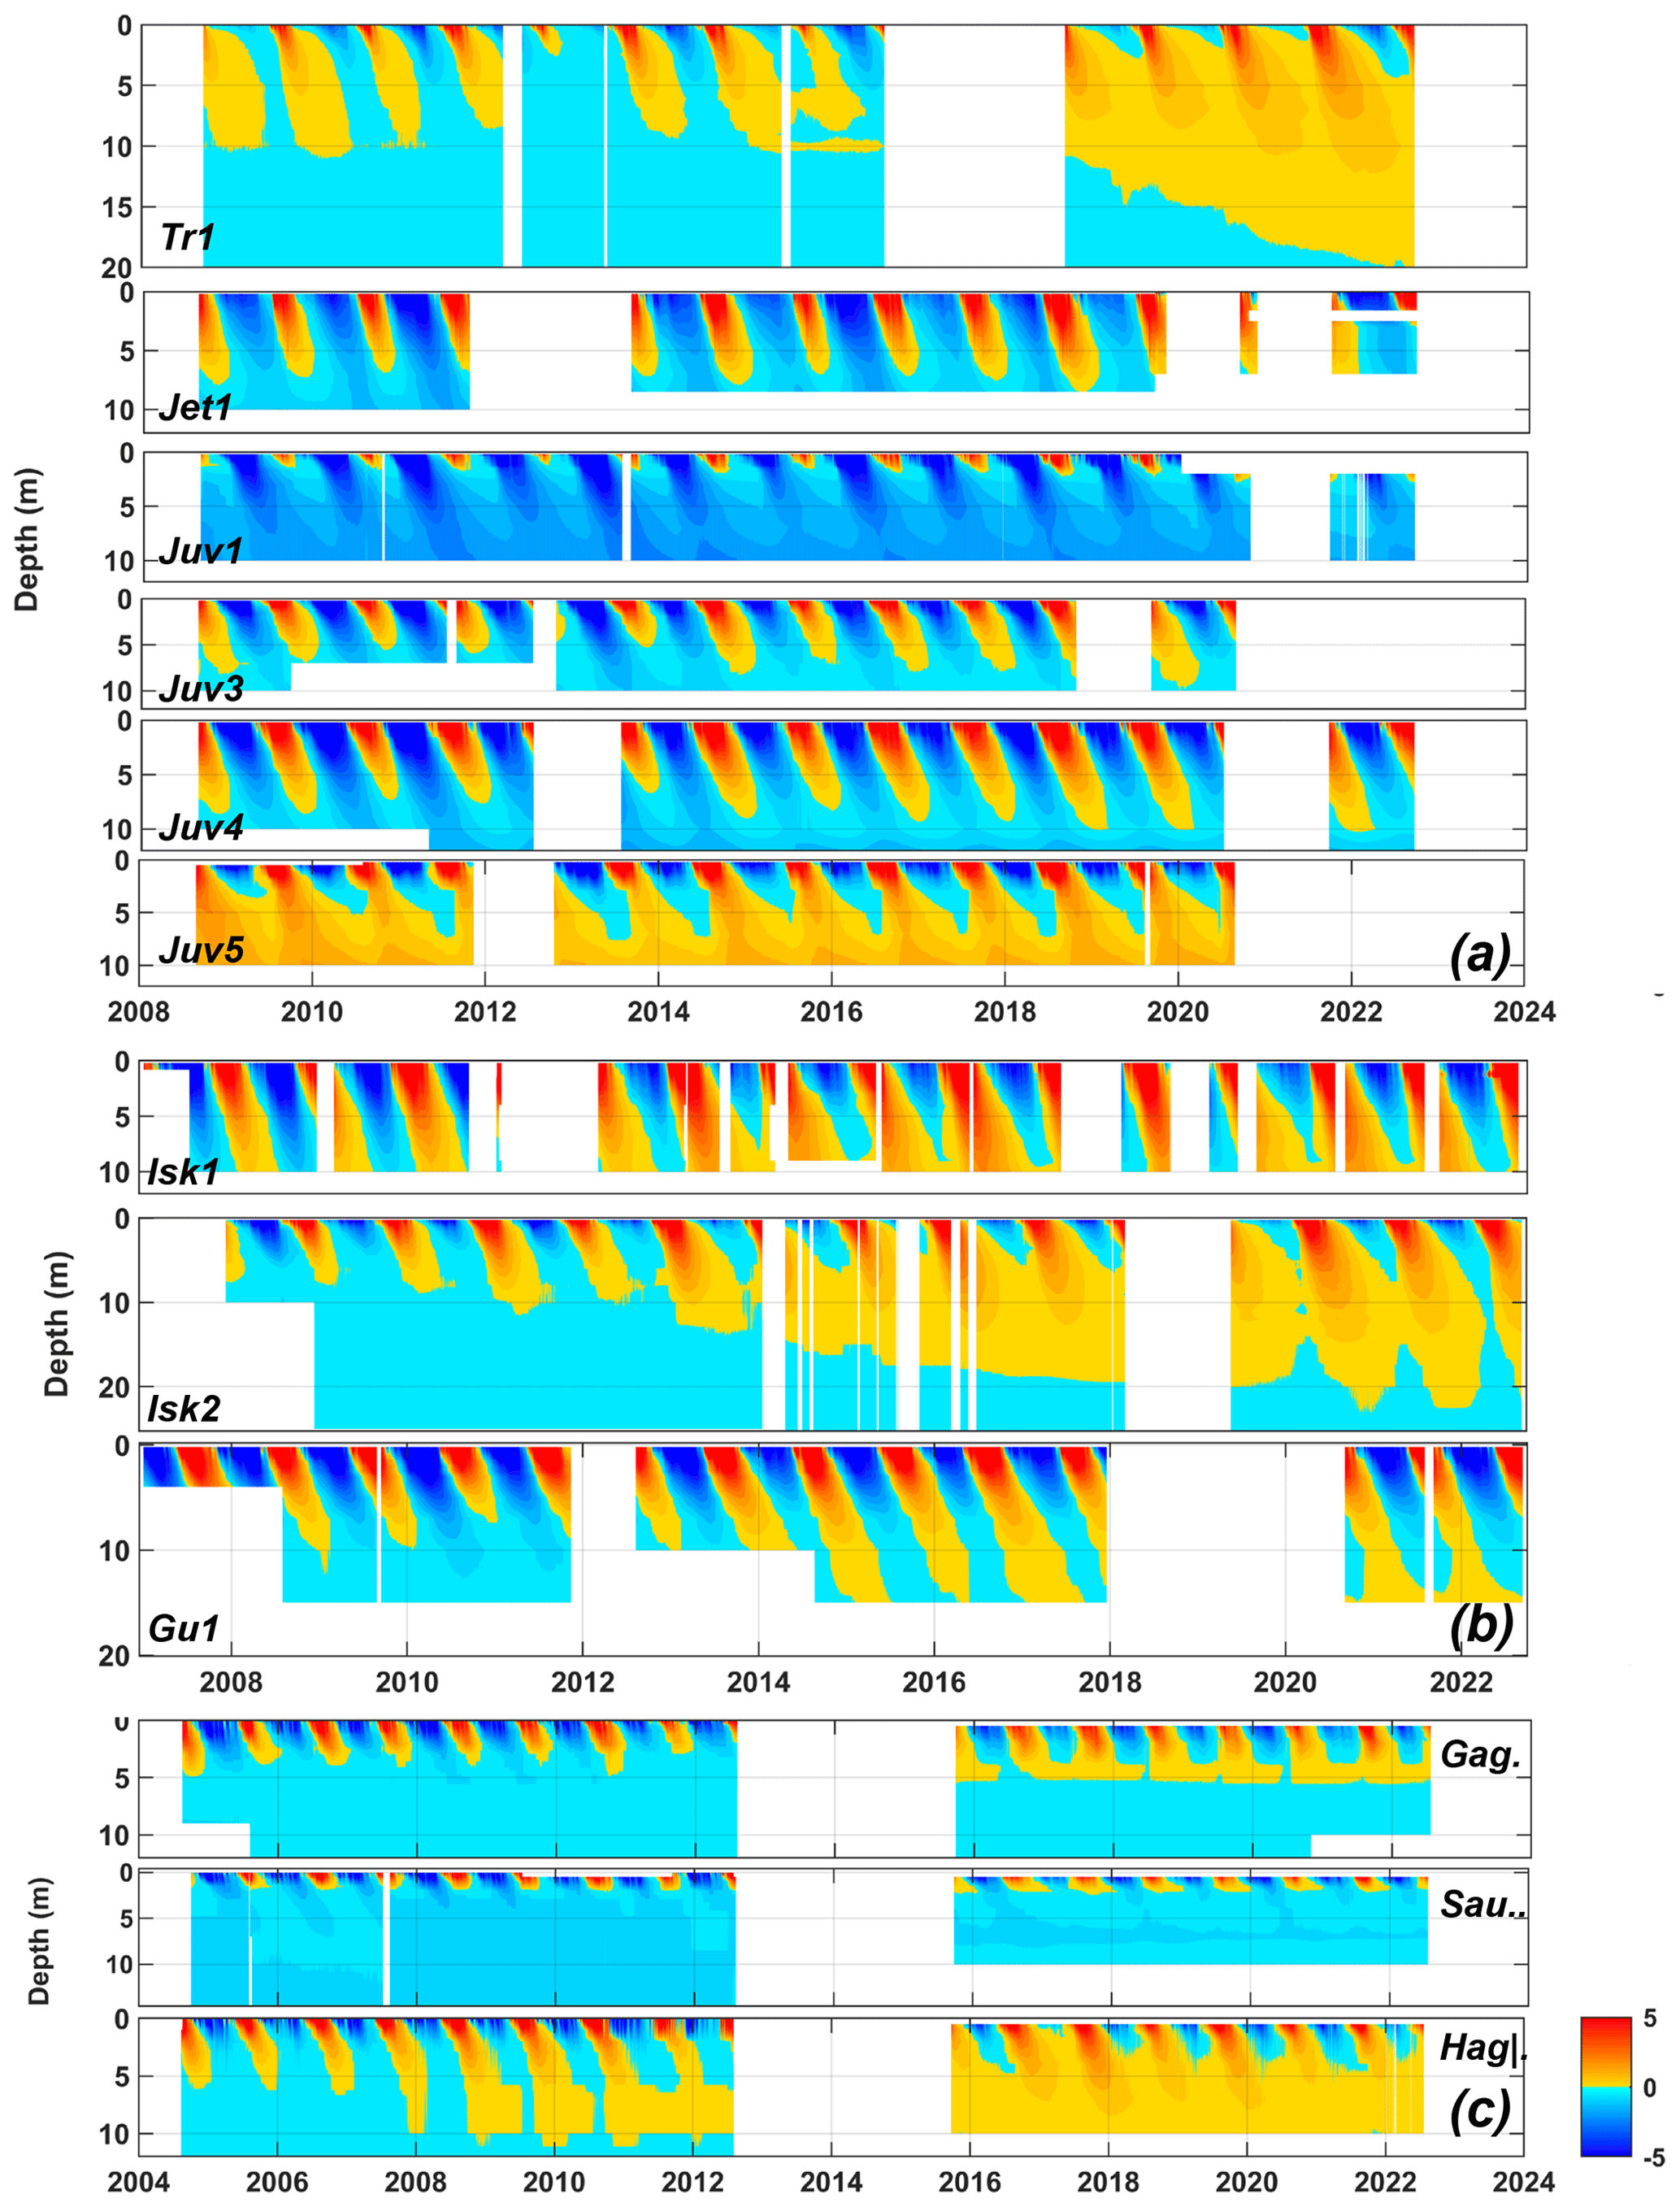
Figure B2Time–depth temperature plots for all measurement sites. (a) Sites in southern Norway, (b) northern Norway and (c) Iceland.
Seasonal variations in GST display changes in the energy forcing conditions on top of the ground surface and below snow and vegetation cover. There are, in general, limited positive trends for summer thawing degree days, while winter freezing degree days are highly dependent on snow cover and increased for most sites at varying paces (e.g. Juvflye-PACE). Thawing degree days during the shoulder seasons seem to be increasing slightly for spring, with a strong increase during autumn.
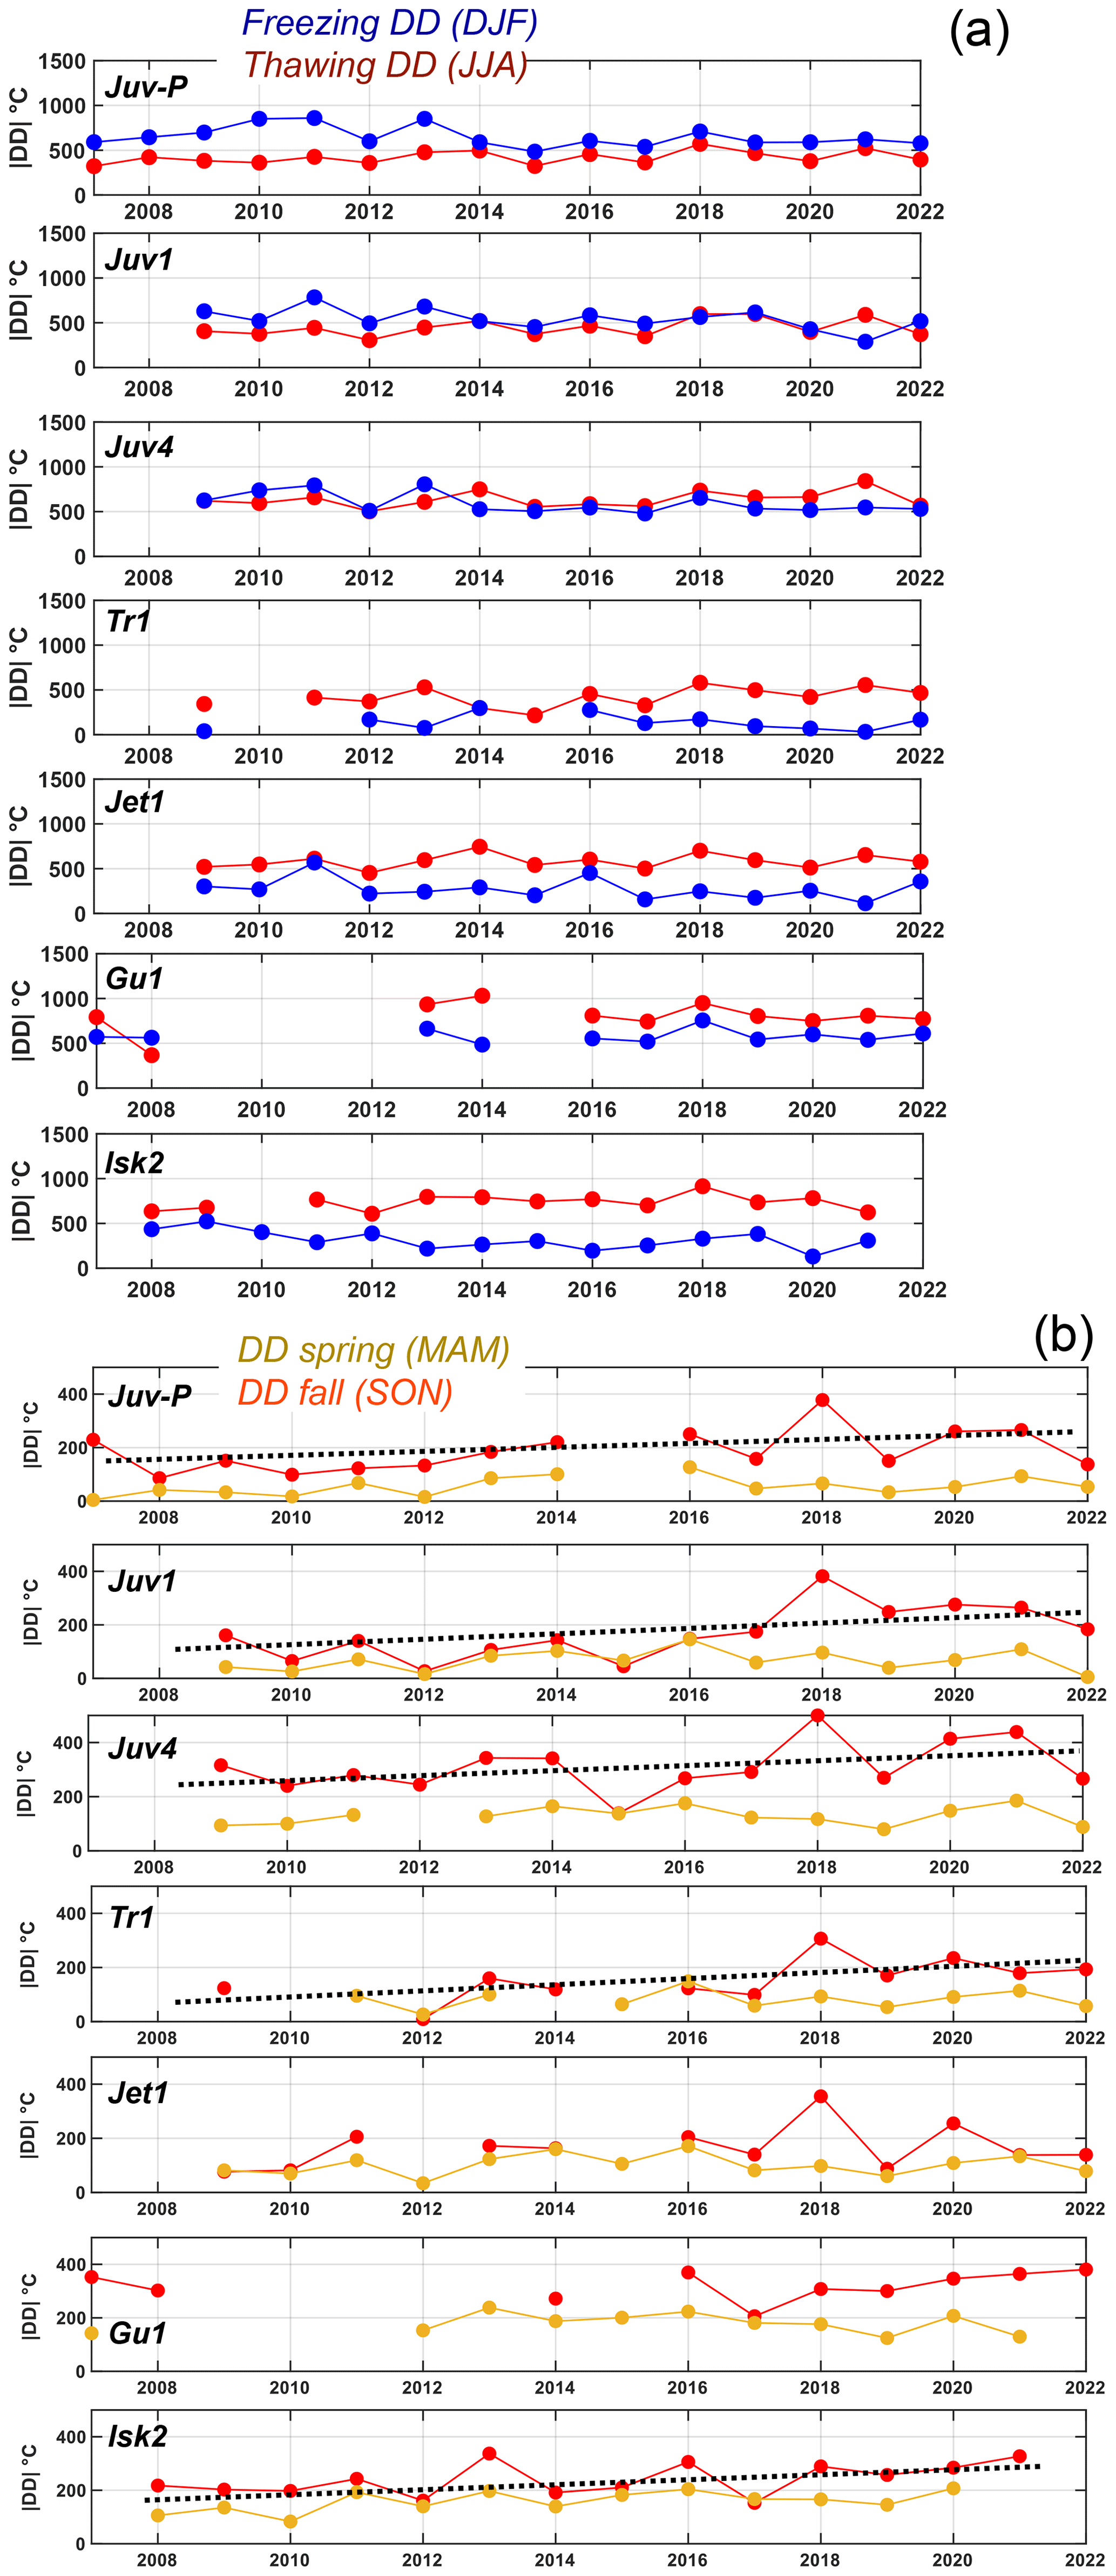
Figure C1Seasonal degree-day (DD) development of GST during the measurement period. (a) Freezing and thawing DD during winter and summer, respectively. Winter is DJF (December, January February), and summer is JJA (June, July, August). All sites show a trend for winter DD decreases and summer DD increases. However, winter DD decreases were higher (+50 to 100 DD ∘C per decade) than summer decreases (−10 to −50 DD ∘C per decade). (b) DDs during the shoulder seasons for spring in MAM (March, April, May) and autumn in SON (September, October, November). All sites show a positive trend towards higher DDs; however, the trend during autumn is much higher, with values between 60–150 DD ∘C per decade in relation to spring values (<10 DD ∘C per decade). Linear trends are calculated as normal linear regressions between time and temperature, and long-term decadal changes are based on the slope of the regression (a).
In Norway, inversions are frequent in the Finnmark area (Iškoras) (Fig. D1a) and in the eastern parts of southern Norway (Tronfjell) (Fig. D1b). In Iškoras, we observe strong winter inversions between the valley bottom and the tree line and normal negative lapse rates above (Fig. D1c). During the winter months, the average monthly air temperature in the valley bottom is colder than on the mountain top, producing positive lapse rates. During spring and autumn, lapse rates are close to 0 ∘C / 100 m, while during summer, lapse rates of ca. −0.5 ∘C / 100 m are common (Fig. D1c). Towards the coast, normal negative lapse rates dominate, with values around −0.5 ∘C / 100 m at our borehole locations. In southern Norway, Tronfjell shows a similar pattern to Iškoras (Fig. D1d). The magnitude of the inversion during the winter months is, however, less pronounced than in Finnmark (Fig. D1a, b). Further west towards the Juvflye permafrost observatory, the inversion pattern is visible during the winter months but is far less pronounced (Fig. D1e).
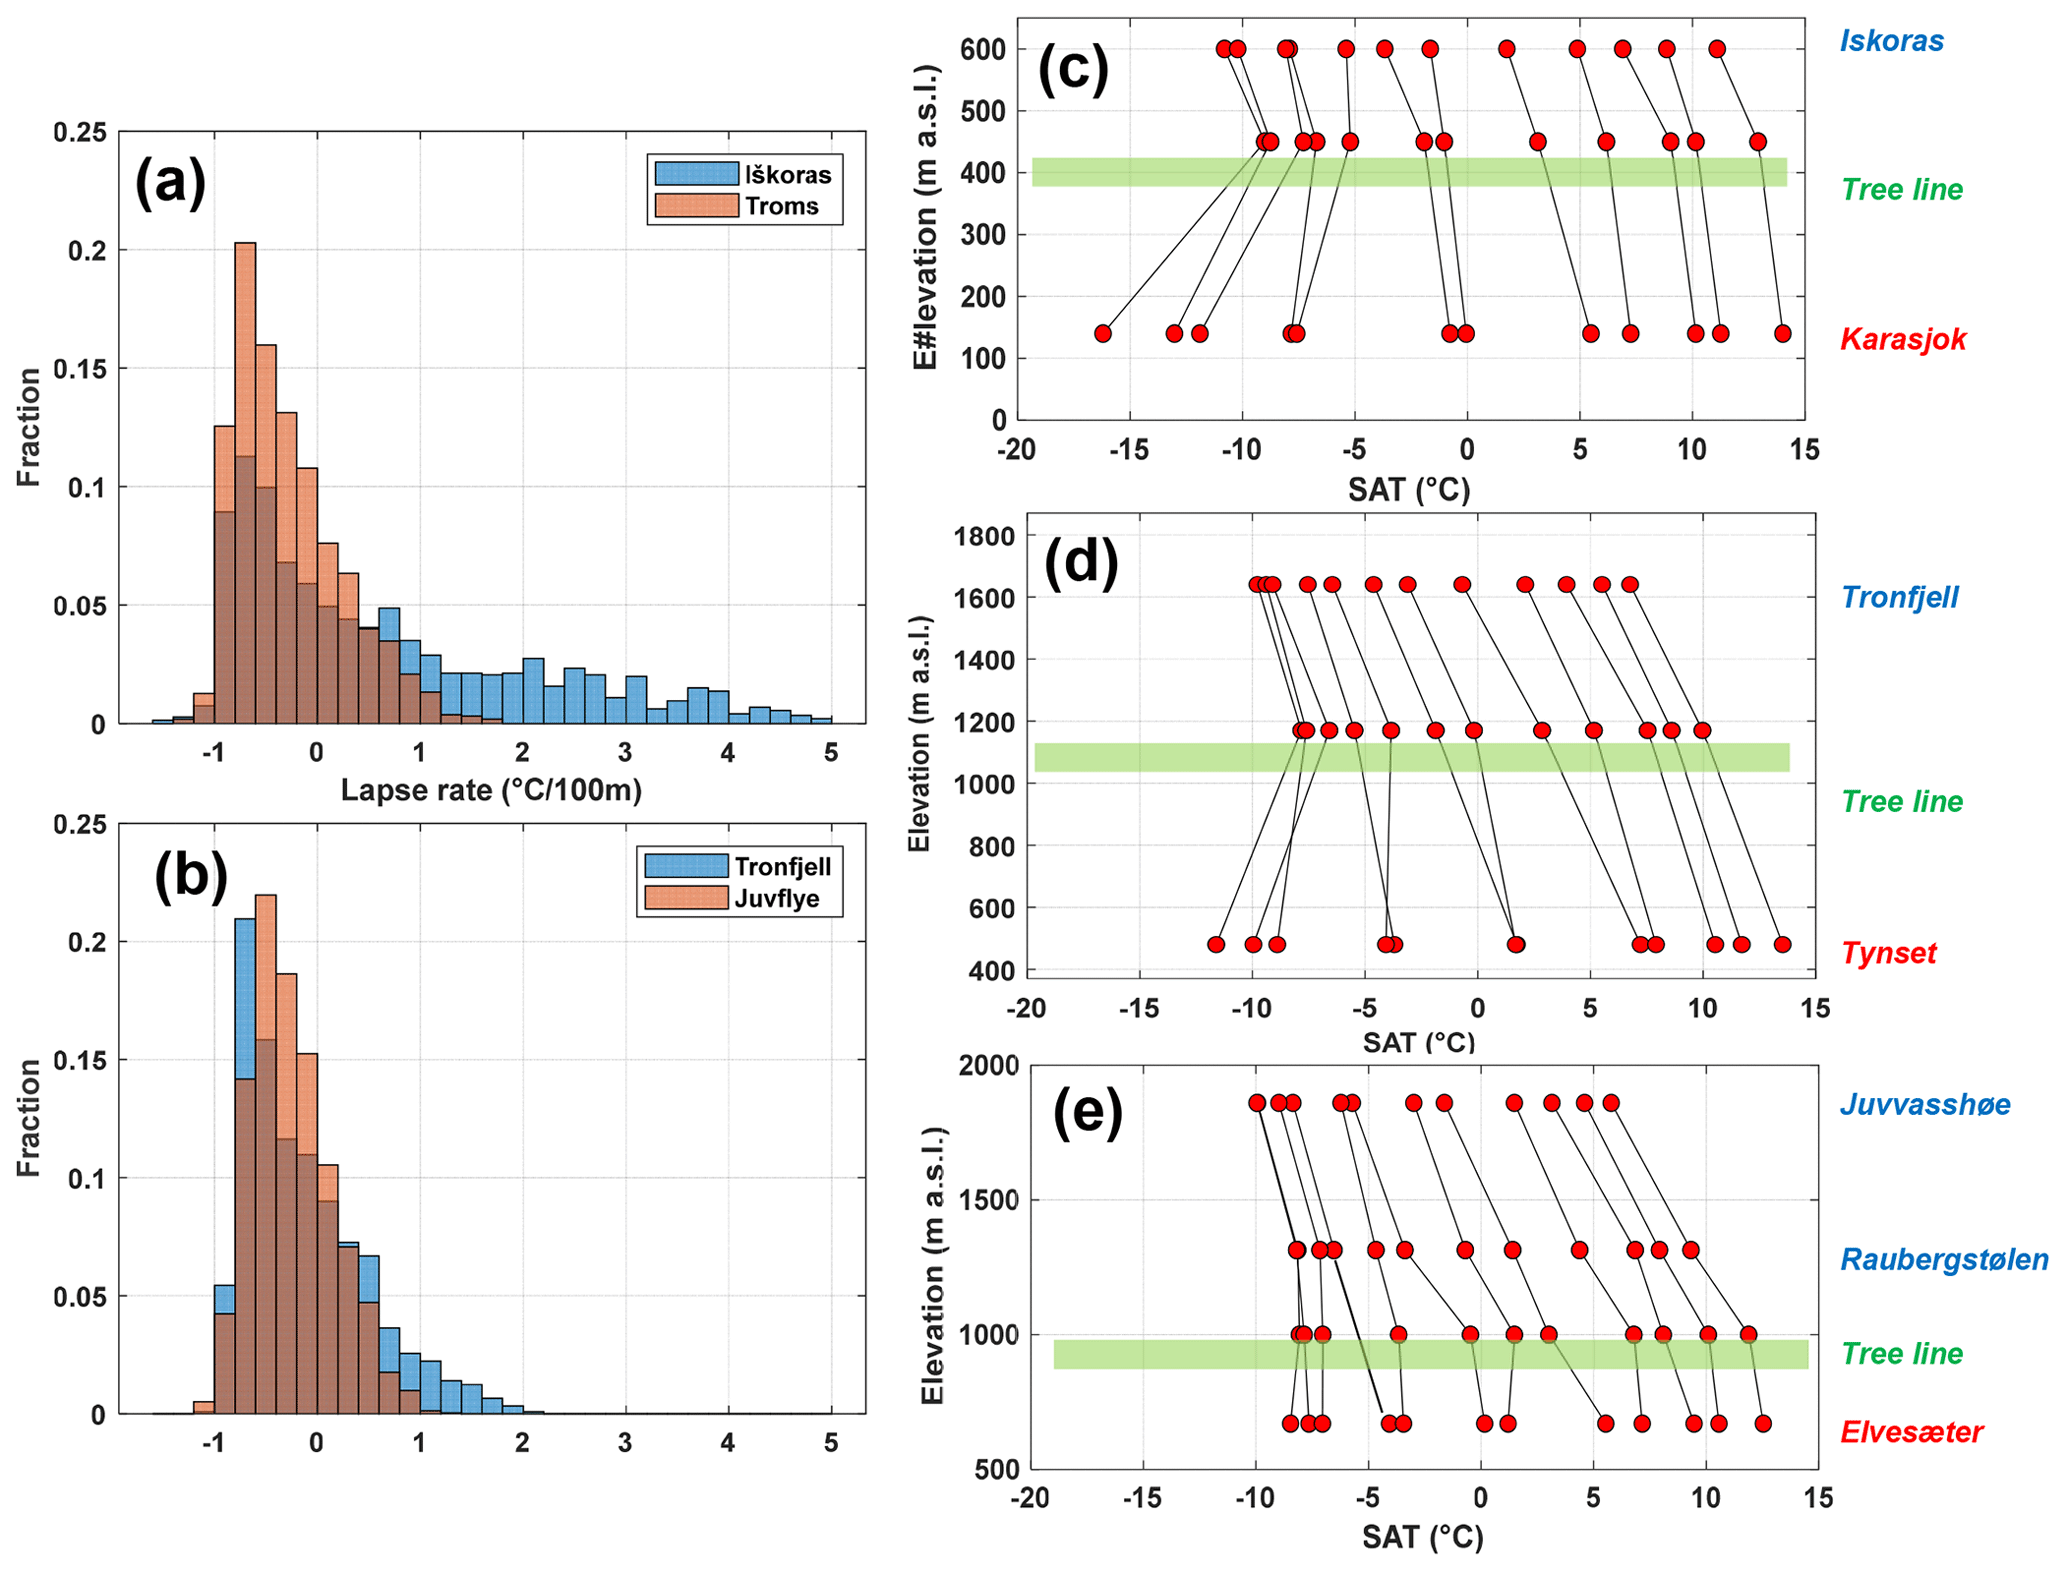
Figure D1Frequency and magnitude distribution of daily lapse rates for the permafrost observatories, calculated for the winter months (DJFM) based on SAT observations. (a) Northern Norway – Iškoras: between Iškoras (Isk2) and Karasjok weather stations (500 m elevation difference); Troms: between Nordnesfjellet and Skibotn weather stations (ca. 600 m a.s.l.). (b) Southern Norway – Tronfjell: Tr1 and Tynset weather stations (1100 m difference); Juvflye: between Juvvasshøe and Elveseter weather stations (1200 m difference). The orange and blue bars show lapse rate frequencies for the more maritime and continental sites, respectively. Mean monthly lapse rates for the period 2010 to 2020 at Iskôras (c), Tronfjell (d) and Juvflye (e) observatories. The horizontal green bars in (c), (d) and (e) denote the tree line.
Daily ground temperatures at the sites, along with air (SAT) and ground surface (GST) temperatures which are not covered by operational weather stations, are stored here: https://doi.org/10.11582/2023.00128 (Etzelmüller, 2023).
The operational weather station and permafrost data are freely available at the Norwegian Meteorological Institute (MET Norway) through the Frost API: https://frost.met.no/observations/v0.csv?sources=SN15270,SN97710&elements=mean(soil_temperature P1D)&referencetime=1999-01-01/2023-12-31&fields=referenceTime,elementId,sourceId,value,level (last access: 21 December 2023) and “seKlima”: https://seklima.met.no/days/mean(air_temperature P1D),surface_snow_thickness/custom_period/SN15270,SN97710/en/1999-01-01T00:00:00+01:00;2023-12-31T23:59:59+01:00 (last access: 13 December 2023) (Met Norway, 2023).
To access the FROST API you need to create a user (https://frost.met.no/auth/requestCredentials.html, last access: 18 December 2023), with your email-address.
BE initiated and followed up with this study, analysed the data, and wrote the first drafts of the paper. BE led the projects which established the boreholes in southern Norway (except Juvflye-PACE) and Iceland and participated in the projects responsible for the remainder of the boreholes. KI contributed with the data from Juvflye-PACE and Iskoras-BH2, along with the analyses of climate development. JC helped with the modelling exercise and provided the snow data from Iceland. SW helped with the modelling of CryoGrid2, and both CHa and CHi provided and analysed the ERT information. All the authors contributed to the writing and revision of the paper.
At least one of the (co-)authors is a member of the editorial board of The Cryosphere. The peer-review process was guided by an independent editor, and the authors also have no other competing interests to declare.
Publisher’s note: Copernicus Publications remains neutral with regard to jurisdictional claims made in the text, published maps, institutional affiliations, or any other geographical representation in this paper. While Copernicus Publications makes every effort to include appropriate place names, the final responsibility lies with the authors.
The data collection was carried out over many years and was mainly made to happen with the help of the academic institutions of the main authors, such as the Norwegian Meteorological Institute and the Universities of Oslo, Fribourg and Zurich in Norway and Switzerland, respectively. The data collection was aided by the help of many individuals over several years of field work, scientific discussion and cooperation; we therefore want to thank sincerely (in alphabetical order) Martin Bathen, Hanne H. Christiansen, Trond Eiken, Herman Farbrot, Regula Frauenfelder, Kjersti Gisnås, Tobias Hipp, Ole Humlum, Cécile Pellet, Siri Jakobsen, Karsten Vedel Johansen, Antoni G. Lewkowicz, Karianne S. Lilleøren, Benjamin Mewes, Thomas V. Schuler and Rune Strand Ødegård. We want to thank all the mentioned institutions and individuals.
This study is based on the results and implementation of the scientific equipment derived from the funding of various research projects. The deep borehole Juvflye-PACE was drilled during the EU 4th Framework programme (PACE – Permafrost and Climate in Europe; ENV4-CT97-0492 and BBW 97.0054-1) and was later supported by The European Science Foundation (PACE21; NW.GC/24 Network 112). The Norwegian Research Council funded the boreholes in northern Norway via the IPY-TSP Norway project (grant no. 176033/S30), in Iceland (Permafrost on Iceland, grant no. 157837/V30) and in southern Norway (CRYOLINK – Permafrost and seasonal frost in southern Norway, grant no. 185987/V30). Permafrost Young Researchers Network's contribution to the TSP project in the Nordic countries is acknowledged. The Swiss National Science Foundation (project TEMPS, grant no. 136279), the German National Science Foundation SPCC (grant no. HA3475/3-1) supported, in addition, the geophysical surveys.
This paper was edited by Jürg Schweizer and reviewed by P. Holmlund and one anonymous referee.
Andersen, J. L., Egholm, D. L., Knudsen, M. F., Jansen, J. D., and Nielsen, S. B.: The periglacial engine of mountain erosion – Part 1: Rates of frost cracking and frost creep, Earth Surf. Dynam., 3, 447–462, https://doi.org/10.5194/esurf-3-447-2015, 2015.
Arnalds, O.: The soils of Iceland, Springer, ISBN 9401796211, 2015.
Bengtsson, L., Andrae, U., Aspelien, T., Batrak, Y., Calvo, J., de Rooy, W., Gleeson, E., Hansen-Sass, B., Homleid, M., and Hortal, M.: The HARMONIE–AROME model configuration in the ALADIN–HIRLAM NWP system, Mon. Weather Rev., 145, 1919–1935, 2017.
Berthling, I. and Etzelmuller, B.: The concept of cryo-conditioning in landscape evolution, Quaternary Res., 75, 378–384, https://doi.org/10.1016/j.yqres.2010.12.011, 2011.
Biskaborn, B. K., Smith, S. L., Noetzli, J., Matthes, H., Vieira, G., Streletskiy, D. A., Schoeneich, P., Romanovsky, V. E., Lewkowicz, A. G., Abramov, A., Allard, M., Boike, J., Cable, W. L., Christiansen, H. H., Delaloye, R., Diekmann, B., Drozdov, D., Etzelmüller, B., Grosse, G., Guglielmin, M., Ingeman-Nielsen, T., Isaksen, K., Ishikawa, M., Johansson, M., Johannsson, H., Joo, A., Kaverin, D., Kholodov, A., Konstantinov, P., Kröger, T., Lambiel, C., Lanckman, J.-P., Luo, D., Malkova, G., Meiklejohn, I., Moskalenko, N., Oliva, M., Phillips, M., Ramos, M., Sannel, A. B. K., Sergeev, D., Seybold, C., Skryabin, P., Vasiliev, A., Wu, Q., Yoshikawa, K., Zheleznyak, M., and Lantuit, H.: Permafrost is warming at a global scale, Nat. Commun., 10, 264, https://doi.org/10.1038/s41467-018-08240-4, 2019.
Borge, A. F., Westermann, S., Solheim, I., and Etzelmüller, B.: Strong degradation of palsas and peat plateaus in northern Norway during the last 60 years, The Cryosphere, 11, 1–16, https://doi.org/10.5194/tc-11-1-2017, 2017.
Christiansen, H. H., Etzelmuller, B., Isaksen, K., Juliussen, H., Farbrot, H., Humlum, O., Johansson, M., Ingeman-Nielsen, T., Kristensen, L., Hjort, J., Holmlund, P., Sannel, A. B. K., Sigsgaard, C., Akerman, H. J., Foged, N., Blikra, L. H., Pernosky, M. A., and Ødegård, R. S.: The Thermal State of Permafrost in the Nordic Area during the International Polar Year 2007-2009, Permafrost Periglac., 21, 156–181, https://doi.org/10.1002/ppp.687, 2010.
Crochet, P. and Jóhannesson, T.: A data set of gridded daily temperature in Iceland, 1949–2010, Jökull, 61, 1–17, https://www.vedur.is/media/vedurstofan/utgafa/hlidarefni/J61-CrochetJohannesson.pdf (last access: 13 December 2023), 2011.
Czekirda, J., Westermann, S., Etzelmüller, B., and Jóhannesson, T.: Transient modelling of permafrost distribution in Iceland, Front. Earth Sci., 7, 130, https://doi.org/10.3389/feart.2019.00130, 2019.
Dyrrdal, A. V., Saloranta, T., Skaugen, T., and Stranden, H. B.: Changes in snow depth in Norway during the period 1961–2010, J. Hydrology Research, 44, 169–179, https://doi.org/10.2166/nh.2012.064, 2012.
Egholm, D. L., Andersen, J. L., Knudsen, M. F., Jansen, J. D., and Nielsen, S. B.: The periglacial engine of mountain erosion – Part 2: Modelling large-scale landscape evolution, Earth Surf. Dynam., 3, 463–482, https://doi.org/10.5194/esurf-3-463-2015, 2015.
Etzelmüller, B.: Permafost data Norway Iceland, Norstore [data set], https://doi.org/10.11582/2023.00128, 2023.
Etzelmüller, B., Guglielmin, M., Hauck, C., Hilbich, C., Hoelzle, M., Isaksen, K., Noetzli, J., Oliva, M., and Ramos, M.: Twenty years of European mountain permafrost dynamics – the PACE legacy, Environ. Res. Lett., 15, 104070, https://doi.org/10.1088/1748-9326/abae9d, 2020a.
Etzelmüller, B., Patton, H., Schomacker, A., Czekirda, J., Girod, L., Hubbard, A., Lilleøren, K. S., and Westermann, S.: Icelandic permafrost dynamics since the Last Glacial Maximum–model results and geomorphological implications, Quaternary Sci. Rev., 233, 106236, https://doi.org/10.1016/j.quascirev.2020.106236, 2020b.
Farbrot, H., Etzelmüller, B., Gudmundsson, A., Schuler, T. V., Eiken, T., Humlum, O., and Björnsson, H.: Thermal characteristics and impact of climate change on mountain permafrost in Iceland, J. Geophys. Res., 112, F03S90, https://doi.org/10.1029/2006JF000541, 2007.
Farbrot, H., Hipp, T. F., Etzelmuller, B., Isaksen, K., Odegard, R. S., Schuler, T. V., and Humlum, O.: Air and Ground Temperature Variations Observed along Elevation and Continentality Gradients in Southern Norway, Permafrost Periglac., 22, 343–360, https://doi.org/10.1002/ppp.733, 2011.
Farbrot, H., Isaksen, K., Etzelmuller, B., and Gisnas, K.: Ground Thermal Regime and Permafrost Distribution under a Changing Climate in Northern Norway, Permafrost Periglac., 24, 20–38, https://doi.org/10.1002/Ppp.1763, 2013.
French, H. M.: The periglacial environment, 4th edn., Wiley-Blackwll, London, 544, pp., ISBN 978-1-119-13278-3, 2017.
Gisnås, K., Etzelmüller, B., Lussana, C., Hjort, J., Sannel, B., Isaksen, K., Westermann, S., Kuhry, P., Christiansen, H. H., Frampton, A., and Åkermann, J.: Permafrost map for Norway, Sweden and Finland, Permafrost Periglac., 20, 2–19, https://doi.org/10.1002/ppp.1922, 2016.
Gruber, S. and Haeberli, W.: Permafrost in steep bedrock slopes and its temperature-related destabilization following climate change, J. Geophys. Res.-Earth, 112, F02S18, https://doi.org/10.1029/2006jf000547, 2007.
Gunnarsson, A., Garðarsson, S. M., and Sveinsson, Ó. G. B.: Icelandic snow cover characteristics derived from a gap-filled MODIS daily snow cover product, Hydrol. Earth Syst. Sci., 23, 3021–3036, https://doi.org/10.5194/hess-23-3021-2019, 2019.
Hales, T., and Roering, J. J.: Climatic controls on frost cracking and implications for the evolution of bedrock landscapes, J. Geophys. Res.-Earth, 112, F02033, https://doi.org/10.1029/2006JF000616, 2007.
Hales, T. C. and Roering, J. J.: A frost “buzzsaw” mechanism for erosion of the eastern Southern Alps, New Zealand, Geomorphology, 107, 241–253, https://doi.org/10.1016/j.geomorph.2008.12.012, 2009.
Hauck, C.: Frozen ground monitoring using DC resistivity tomography, Geophys. Res. Lett., 29, 12-1–12-4, https://doi.org/10.1029/2002GL014995, 2002.
Hauck, C., Isaksen, K., Vonder Mühll, D., and Sollid, J. L.: Geophysical surveys designed to delineate the altitudinal limit of mountain permafrost: an example from Jotunheimen, Norway, Permafrost Periglac., 15, 191–205, 2004.
Hersbach, H., Bell, B., Berrisford, P., Hirahara, S., Horányi, A., Muñoz-Sabater, J., Nicolas, J., Peubey, C., Radu, R., and Schepers, D.: The ERA5 global reanalysis, Q. J. Roy. Meteor. Soc., 146, 1999–2049, 2020.
Hilbich, C., Hauck, C., Mollaret, C., Wainstein, P., and Arenson, L. U.: Towards accurate quantification of ice content in permafrost of the Central Andes – Part 1: Geophysics-based estimates from three different regions, The Cryosphere, 16, 1845–1872, https://doi.org/10.5194/tc-16-1845-2022, 2022.
Hipp, T., Etzelmüller, B., Farbrot, H., Schuler, T. V., and Westermann, S.: Modelling borehole temperatures in Southern Norway – insights into permafrost dynamics during the 20th and 21st century, The Cryosphere, 6, 553–571, https://doi.org/10.5194/tc-6-553-2012, 2012.
Hugelius, G., Strauss, J., Zubrzycki, S., Harden, J. W., Schuur, E. A. G., Ping, C.-L., Schirrmeister, L., Grosse, G., Michaelson, G. J., Koven, C. D., O'Donnell, J. A., Elberling, B., Mishra, U., Camill, P., Yu, Z., Palmtag, J., and Kuhry, P.: Estimated stocks of circumpolar permafrost carbon with quantified uncertainty ranges and identified data gaps, Biogeosciences, 11, 6573–6593, https://doi.org/10.5194/bg-11-6573-2014, 2014.
Isaksen, K., Holmlund, P., Sollid, J. L., and Harris, C.: Three deep alpine-permafrost boreholes in Svalbard and Scandinavia, Permafrost Periglac., 12, 13–25, 2001.
Isaksen, K., Hauck, C., Gudevang, E., Ødegård, R. S., and Sollid, J. L.: Mountain permafrost distribution on Dovrefjell and Jotunheimen, southern Norway, based on BTS and DC resistivity tomography data, Norsk Geogr. Tidsskr., 56, 122–136, 2002.
Isaksen, K., Odegard, R. S., Etzelmuller, B., Hilbich, C., Hauck, C., Farbrot, H., Eiken, T., Hygen, H. O., and Hipp, T. F.: Degrading Mountain Permafrost in Southern Norway: Spatial and Temporal Variability of Mean Ground Temperatures, 1999–2009, Permafrost Periglac., 22, 361–377, https://doi.org/10.1002/ppp.728, 2011.
Isaksen, K., Lutz, J., Sørensen, A. M., Godøy, Ø., Ferrighi, L., Eastwood, S., and Aaboe, S.: Advances in operational permafrost monitoring on Svalbard and in Norway, Environ. Res. Lett., 17, 095012, https://doi.org/10.1088/1748-9326/ac8e1c, 2022.
King, L.: Zonation and ecology of high mountain permafrost in Scandinavia, Geografisk Annaler, 68A, 131–139, 1986.
Kjellman, S. E., Axelsson, P. E., Etzelmüller, B., Westermann, S., and Sannel, A. B. K.: Holocene development of subarctic permafrost peatlands in Finnmark, northern Norway, Holocene, 28, 1855–1869, 2018.
Kleman, J. and Hättestrand, C.: Frozen-bed Fennoscandian and Laurentide ice sheets during the Last Glacial Maximum, Nature, 402, 63–66, 1999.
Krautblatter, M., Funk, D., and Günzel, F. K.: Why permafrost rocks become unstable: a rock–ice-mechanical model in time and space, Earth Surf. Proc. Land., 38, 876–887, https://doi.org/10.1002/esp.3374, 2013.
Lewkowicz, A. G. and Bonnaventure, P. P.: Equivalent Elevation: A New Method to Incorporate Variable Surface Lapse Rates into Mountain Permafrost Modelling, Permafrost Periglac., 22, 153–162, https://doi.org/10.1002/ppp.720, 2011.
Lewkowicz, A. G., Etzelmuller, B., and Smith, S. L.: Characteristics of Discontinuous Permafrost based on Ground Temperature Measurements and Electrical Resistivity Tomography, Southern Yukon, Canada, Permafrost Periglac., 22, 320–342, https://doi.org/10.1002/ppp.703, 2011.
Lilleøren, K. S., Etzelmuller, B., Schuler, T. V., Gisnas, K., and Humlum, O.: The relative age of mountain permafrost – estimation of Holocene permafrost limits in Norway, Global Planet. Change, 92–93, 209–223, https://doi.org/10.1016/j.gloplacha.2012.05.016, 2012.
Loke, M. H. and Barker, R. D.: Rapid least-squares inversion of apparent resistivity pseudosections using a quasi-Newton method, Geophys. Prospect., 44, 131–152, 1995.
Lussana, C., Saloranta, T., Skaugen, T., Magnusson, J., Tveito, O. E., and Andersen, J.: seNorge2 daily precipitation, an observational gridded dataset over Norway from 1957 to the present day, Earth Syst. Sci. Data, 10, 235–249, https://doi.org/10.5194/essd-10-235-2018, 2018a.
Lussana, C., Tveito, O. E., and Uboldi, F.: Three-dimensional spatial interpolation of 2 m temperature over Norway, Q. J. Roy. Meteor. Soc., 144, 344–364, https://doi.org/10.1002/qj.3208, 2018b.
Martin, L., Nitzbon, J., Aas, K., Etzelmüller, B., Kristiansen, H., and Westermann, S.: Stability conditions of peat plateaus and palsas in northern Norway, J. Geophys. Res.-Earth, 124, 705–719, https://doi.org/10.1029/2018JF004945, 2019.
Martin, L., Nitzbon, J., Scheer, J., Aas, K. S., Eiken, T., Langer, M., Filhol, S., Etzelmüller, B., and Westermann, S.: Lateral thermokarst patterns in permafrost peat plateaus in northern Norway, The Cryosphere, 15, 3423–3442, https://doi.org/10.5194/tc-15-3423-2021, 2021.
Met Norway: Norway, permafrost- and air temperature and snow depth, Met Norway [data set], https://seklima.met.no/days/mean(air_temperature P1D),surface_snow_thickness/custom_period/SN15270,SN97710/en/1999-01-01T00:00:00+01:00;2023-12-31T23:59:59+01:00, last access: 13 December 2023.
Miner, K. R., Turetsky, M. R., Malina, E., Bartsch, A., Tamminen, J., McGuire, A. D., Fix, A., Sweeney, C., Elder, C. D., and Miller, C. E.: Permafrost carbon emissions in a changing Arctic, Nature Reviews Earth & Environment, 3, 55–67, https://doi.org/10.1038/s43017-021-00230-3, 2022.
Obu, J., Westermann, S., Bartsch, A., Berdnikov, N., Christiansen, H. H., Dashtseren, A., Delaloye, R., Elberling, B., Etzelmüller, B., and Kholodov, A.: Northern Hemisphere permafrost map based on TTOP modelling for 2000–2016 at 1 km2 scale, Earth-Sci. Rev., 193, 299–316, https://doi.org/10.1016/j.earscirev.2019.04.023, 2019.
Ødegård, R. S., Sollid, J. L., and Liestøl, O.: Ground temperature measurements in mountain permafrost, Jotunheimen, southern Norway, Permafrost Periglac., 3, 231–234, 1992.
Ødegård, R. S., Nesje, A., Isaksen, K., Andreassen, L. M., Eiken, T., Schwikowski, M., and Uglietti, C.: Climate change threatens archaeologically significant ice patches: insights into their age, internal structure, mass balance and climate sensitivity, The Cryosphere, 11, 17–32, https://doi.org/10.5194/tc-11-17-2017, 2017.
Oldenborger, G. A. and LeBlanc, A. M.: Monitoring changes in unfrozen water content with electrical resistivity surveys in cold continuous permafrost, Geophys. J. Int., 215, 965–977, 2018.
Pall, P., Tallaksen, L. M., and Stordal, F.: A Climatology of Rain-on-Snow Events for Norway, J. Climate, 32, 6995–7016, 2019.
Penna, I. M., Magnin, F., Nicolet, P., Etzelmüller, B., Hermanns, R. L., Böhme, M., Kristensen, L., Nöel, F., Bredal, M., and Dehls, J. F.: Permafrost controls the displacement rates of large unstable rock-slopes in subarctic environments, Global Planet. Change, 220, 104017, https://doi.org/10.1016/j.gloplacha.2022.104017, 2023.
Rizzi, J., Nilsen, I. B., Stagge, J. H., Gisnås, K., and Tallaksen, L. M.: Five decades of warming: impacts on snow cover in Norway, Hydrol. Res., 49, 670–688, 2018.
Romanovsky, V. E., Smith, S. L., and Christiansen, H. H.: Permafrost Thermal State in the Polar Northern Hemisphere during the International Polar Year 2007–2009: a Synthesis, Permafrost Periglac., 21, 106–116, https://doi.org/10.1002/Ppp.689, 2010.
Saloranta, T. M.: Simulating snow maps for Norway: description and statistical evaluation of the seNorge snow model, The Cryosphere, 6, 1323–1337, https://doi.org/10.5194/tc-6-1323-2012, 2012.
Saloranta, T. M.: Operational snow mapping with simplified data assimilation using the seNorge snow model, J. Hydrol., 538, 314–325, 2016.
Smith, M. W. and Riseborough, D. W.: Climate and the limits of permafrost: A zonal analysis, Permafrost Periglac., 13, 1–15, https://doi.org/10.1002/ppp.410, 2002.
Smith, S. L., O'Neill, H. B., Isaksen, K., Noetzli, J., and Romanovsky, V. E.: The changing thermal state of permafrost, Nature Reviews Earth & Environment, 3, 10–23, 2022.
Sollid, J. L., Isaksen, K., Eiken, T., and Ødegård, R. S.: The transition zone of mountain permafrost on Dovrefjell, southern Norway, in: Eight International Conference on Permafrost, Proceedings, Zurich, Switzerland, 21–25 July 2003, Vol. 2, 1085–1090, ISBN 90 5809 582 7, 2003.
Van Everdingen, R. O. (Ed.): Multi-language glossary of permafrost and related ground-ice terms in chinese, english, french, german, Arctic Inst. of North America University of Calgary, https://globalcryospherewatch.org/reference/glossary_docs/Glossary_of_Permafrost_and_Ground-Ice_IPA_2005.pdf (last access: 13 December 2023), 1998.
Vikhamar-Schuler, D., Isaksen, K., Haugen, J. E., Tømmervik, H., Luks, B., Schuler, T. V., and Bjerke, J. W.: Changes in winter warming events in the Nordic Arctic Region, J. Climate, 29, 6223–6244, https://doi.org/10.1175/JCLI-D-15-0763.1, 2016.
Westermann, S., Boike, J., Langer, M., Schuler, T. V., and Etzelmüller, B.: Modeling the impact of wintertime rain events on the thermal regime of permafrost, The Cryosphere, 5, 945–959, https://doi.org/10.5194/tc-5-945-2011, 2011.
Westermann, S., Schuler, T. V., Gisnås, K., and Etzelmüller, B.: Transient thermal modeling of permafrost conditions in Southern Norway, The Cryosphere, 7, 719–739, https://doi.org/10.5194/tc-7-719-2013, 2013.
Williams, P. J. and Smith, M. W.: The Frozen Earth: Fundamentals of geocryology, Cambridge University Press, Cambridge, 300 pp., https://doi.org/10.1017/CBO9780511564437, 1989.
- Abstract
- Introduction
- Field sites and data
- Methods
- Results
- Discussion
- Conclusions
- Appendix A: Surface offset (SO)
- Appendix B: Ground temperatures and active-layer thickness
- Appendix C: Seasonal variations in ground surface temperature (GST)
- Appendix D: Inversion settings at the study site
- Data availability
- Author contributions
- Competing interests
- Disclaimer
- Acknowledgements
- Financial support
- Review statement
- References