the Creative Commons Attribution 4.0 License.
the Creative Commons Attribution 4.0 License.
 | 18 Dec 2023
Control of the temperature signal in Antarctic proxies by snowfall dynamics
Aymeric P. M. Servettaz
Cécile Agosta
Christoph Kittel
Anaïs J. Orsi
Antarctica, the coldest and driest continent, is home to the largest ice sheet, whose mass is predominantly recharged by snowfall. A common feature of polar regions is the warming associated with snowfall, as moist oceanic air and cloud cover increase the surface temperature. Consequently, snow that accumulates on the ice sheet is deposited under unusually warm conditions. Here we use a polar-oriented regional atmospheric model to study the statistical difference between average and snowfall-weighted temperatures. During snowfall, the warm anomaly scales with snowfall amount, with the strongest sensitivity occurring at low-accumulation sites. Heavier snowfall in winter helps to decrease the annual snowfall-weighted temperature, but this effect is overwritten by the event-scale warming associated with precipitating atmospheric systems, which particularly contrast with the extremely cold conditions that occur in winter. Consequently, the seasonal range of snowfall-weighted temperature is reduced by 20 %. On the other hand, the annual snowfall-weighted temperature shows 80 % more interannual variability than the annual temperature due to the irregularity of snowfall occurrence and its associated temperature anomaly. Disturbances of the apparent annual temperature cycle and interannual variability have important consequences for the interpretation of water isotopes in precipitation, which are deposited with snowfall and commonly used for paleotemperature reconstructions from ice cores.
- Article
(11126 KB) - Full-text XML
- BibTeX
- EndNote


-
Snow precipitation events in Antarctica are associated with positive surface temperature anomalies that scale with snowfall rates.
-
Temperature during snowfall has a seasonal amplitude that is reduced by 20 % relative to the daily temperature.
-
The annual snowfall-weighted temperature shows 80 % more interannual variability than the annual temperature.
-
Water isotopes reflect the snowfall-weighted temperature and may be affected by such biases.
Antarctica is the coldest and driest continent on earth and almost entirely covered by ice. The surface temperature remains below freezing year-round over most of the continent, allowing the snow to accumulate and form the ice sheet, which is recharged primarily by snowfall. Precipitating atmospheric systems in polar regions are known to increase the surface temperature (Uotila et al., 2011). This is because atmospheric perturbations and clouds strongly disturb the surface energy balance: while short-wave radiation is reduced during overcast weather, the absorption of snow-emitted long-wave radiation and downward radiation from the cloud base cause the net radiative heat flux to warm the surface (Nardino and Georgiadis, 2003; Van Den Broeke et al., 2006). Snow that accumulates on the Antarctic ice sheet is mostly deposited under cloudy conditions, except in the higher parts of the Antarctic Plateau, where clear-sky precipitation forms a large part of the total ice accumulation (Stenni et al., 2016; Fujita and Abe, 2006; Bromwich, 1988). Even for clear-sky precipitation, despite the absence of clouds, a vapour-rich atmosphere emits more long-wave radiation and warms the surface (Gallée and Gorodetskaya, 2010; Genthon et al., 2013). Atmospheric perturbations can increase the surface wind speed (Argentini et al., 2014; Vignon et al., 2017; Baas et al., 2019). This weakens or breaks the surface temperature inversion as increased turbulent mixing incorporates warmer air from the upper temperature inversion layer (Hirasawa et al., 2000; Vignon et al., 2019; Heinemann et al., 2019). In addition to modifying the local energy balance, synoptic systems effectively transport heat inland in Antarctica (Carleton and Whalley, 1988; Giovinetto et al., 1992). Large atmospheric perturbations thus modify the heat flux and surface temperature (Uotila et al., 2011), causing occasional surface warming exceeding 10 ∘C (Ganeshan et al., 2022). Atmospheric rivers, which are extreme water vapour fluxes associated with some cyclones, are also associated with intense warming, particularly in winter (Wille et al., 2021). Consequently, days with snow or ice accumulation in Antarctica are warmer than average.
Knowledge of the temperature variability in Antarctica strongly relies on paleoclimate studies to extend the time period beyond the observation period of the satellite era (Jones et al., 2016). Among various temperature proxies, stable water isotopes in ice are the most used in paleoclimate studies in Antarctica (Stenni et al., 2017) due to the widely available base material and a good understanding of the fractionation processes associated with precipitation formation (Markle and Steig, 2022). Due to Rayleigh distillation during the transport of moisture to cold regions, water isotopes reflect the condensation temperature of precipitation (Dansgaard, 1964). However, the relationship between the average temperature at a location and isotopes in the snow is altered by the deposition dynamics of snowfall-borne water isotopes (Werner et al., 2000; Persson et al., 2011; Casado et al., 2020), post-deposition processes such as ablation–redeposition and sublimation–condensation cycles (Steen-Larsen et al., 2014; Touzeau et al., 2016; Stenni et al., 2016; Münch et al., 2017; Hughes et al., 2021), and the difference between the condensation and surface temperatures (Buizert et al., 2021; Liu et al., 2023). Water isotope measurements characterize the ice deposited during snowfall events, so δ18O (following the δ notation as in Dansgaard, 1964) is thought to better correlate with the snowfall-weighted temperature than the average temperature (Stenni et al., 2016; Fujita and Abe, 2006), as shown in isotope-enabled models (Sturm et al., 2010). Differences between the snowfall-weighted temperature and average temperature remain poorly described. Characterizing these differences will thus help us to understand the signal recorded in water isotopes and quantify the effects of precipitation intermittency on Antarctic ice cores (Masson-Delmotte et al., 2011).
In Antarctica, the top 10 % of the daily precipitation events at a location can generate most of the annual accumulation amount and interannual variability (Turner et al., 2019). Consequently, these events control the temperature signal imprinted in the isotopic composition of the deposited snow. The few days when most of the snow is accumulated may not represent average conditions because they are associated with temperature increases and may occur anytime in the year, causing aliasing of the seasonal signal due to irregular sampling. Quantifying the temperature changes associated with snowfall could highlight key mechanisms for the interpretation of water isotopes in snow and ice, and it can ultimately improve water-isotope-based temperature reconstructions. Although the different heat transport mechanisms are relatively well understood and included in current atmospheric models, a climatology of the warming associated with snowfall events has not been made so far.
The covariance of precipitation and temperature at synoptic and seasonal scales was shown to affect the isotope–temperature slope by changing the temperature that can effectively be recorded in an ice core (Sime et al., 2008). Changes in recordable temperature may be linked to precipitation changes rather than temperature changes (Krinner et al., 2006). In addition, the intermittency of precipitation induces isotopic variability unrelated to the temperature, which is especially important at the interannual scale for the low-accumulation East Antarctic Plateau (Casado et al., 2020). Spatial and temporal changes in snowfall intermittency impact the recordable temperature (Sime et al., 2008), which is partly responsible for the spatial and temporal variations in isotope–temperature slope values (Sime et al., 2009a, b; Klein et al., 2019). Sub-sampling the temperature signal by snowfall affects the recordable temperature in water isotopes, but the extent of this effect and its variability among the variety of precipitation regimes in the entire Antarctic continent have been poorly characterized. Although post-deposition effects can further modify isotope–temperature slopes after deposition (Sime et al., 2011; Casado et al., 2018), understanding the temperature changes (which are related to the snow precipitation) at the time of deposition at different timescales and locations can help us to explain some of the spatial and temporal diversity of the slopes.
Here, we study the surface temperature changes associated with snowfall, aiming to understand the signal that a precipitation-based proxy would carry at the time of its deposition. Using the polar-oriented regional atmospheric model MAR, which has been extensively evaluated for its representation of the Antarctic surface mass balance (Agosta et al., 2019) and temperature (Kittel et al., 2021), we compute snowfall-weighted statistics to evaluate the average bias and interannual variability of temperature across Antarctica for the period 1979–2020. We focus our analysis on the quantification of the temperature anomaly, defined as the difference from the daily climate normal temperature, and suggest possible effects on water isotopes.
2.1 Regional atmospheric model
We use the polar-oriented regional atmospheric model MAR version 3.12 to assess the variability of snowfall and temperature in Antarctica. Version 3.11 of this model has shown good performance when representing the surface mass balance (defined as the total precipitation minus sublimation and runoff; Agosta et al., 2019), temperature (Kittel et al., 2021), and cloud (Kittel et al., 2022) variability. The version used here (3.12) differs mainly in the temperature transition of rainfall to snowfall (both can now co-occur in the model) and the correction of the snowpack temperature (Antwerpen et al., 2022) as well as albedo tuning for the dense Antarctic snow. The simulation domain is on an Antarctic polar stereographic projection (EPSG:3031) with a horizontal resolution of 35×35 km. The MAR model is nudged to ERA5, the latest re-analysis product of the European Center for Medium-Range Weather Forecasts, which gives the most accurate representation of both temperature and surface mass balance in Antarctica among climate re-analyses (Gossart et al., 2019). The use of the MAR regional model provides further detail in the near-surface atmospheric layers and spatial scale compared to ERA5. The simulation used in this study covers the period 1979–2020 (42 years). There is a notable lack of direct snowfall observations in the low-accumulation regions of Antarctica, which hinders our ability to directly evaluate the model for this parameter. The modelled surface mass balance can be evaluated against the observed accumulation, but this includes several processes, ranging from snowfall to snow drift, the evaporation of falling snow, and evaporation–condensation on the snow surface, each of which comes with its own uncertainties. We evaluate the performance of MARv3.12 in representing the temperature and surface mass balance in Figs. A1–A4.
2.2 Temperature averaging, temperature difference, and temperature anomaly: definitions and notation
Although the temperature recorded in water isotopes is imprinted at the condensation level (Jouzel and Merlivat, 1984), we chose to use the 2 m air temperature for simplicity because condensation levels change both spatially and temporally. Studies using water isotopes usually bypass condensation to surface temperature changes by directly calibrating the isotope–temperature slope with the 2 m temperature in most cases (e.g. Jouzel et al., 2007; Stenni et al., 2017) or applying a ratio of temperature changes that would be amplified at the surface (e.g. Jouzel et al., 2003). If we used the condensation-level temperature, the difference from the climate normal would depend on the level of precipitation formation that is vertically spread on the atmospheric column, making the comparison more complex. With the condensation temperature, we would expect weaker seasonal cycles because winter surface cooling is amplified by a strong inversion, but the long-term temperature variability may not change much, as implied by deglaciation simulations (Liu et al., 2023). Choosing the 2 m temperature also enables comparison with available observations, and this is the level considered in many paleotemperature reconstructions.
In this study, we use the average temperature calculated with the arithmetic mean,
and the snowfall-weighted temperature, defined as the weighted average of the temperature with the daily snowfall rate as the weighting coefficient:
In both cases, Tday refers to the temperature on a given day, and SFday is the snowfall on the same day. Temperature averages can be computed for the entire study period (ndays=15 341), a year (ndays=366), or on a given day of year (ndays=42, used for the climate normals and ). We define the climate normal temperature for each model grid cell as the average for the same day of year across the 42 years, and we subsequently apply a 30 d rolling mean to smooth the signal.
To quantify the difference in temperature associated with snowfall, we define the snowfall-weighted temperature difference as
This metric was previously described as “precipitation-weighted biasing” in Sime et al. (2008), but we choose not to call it a bias to avoid confusion with the modelling temperature bias, which refers to the difference between the modelled and observed temperatures here.
Decomposition of the daily temperature Tday into the climate normal temperature on that day () and the daily anomaly with respect to the climate normal () allows us to separate the seasonal and non-seasonal effects of snowfall weighting:
A summary of the abbreviations used is given in Table 1.
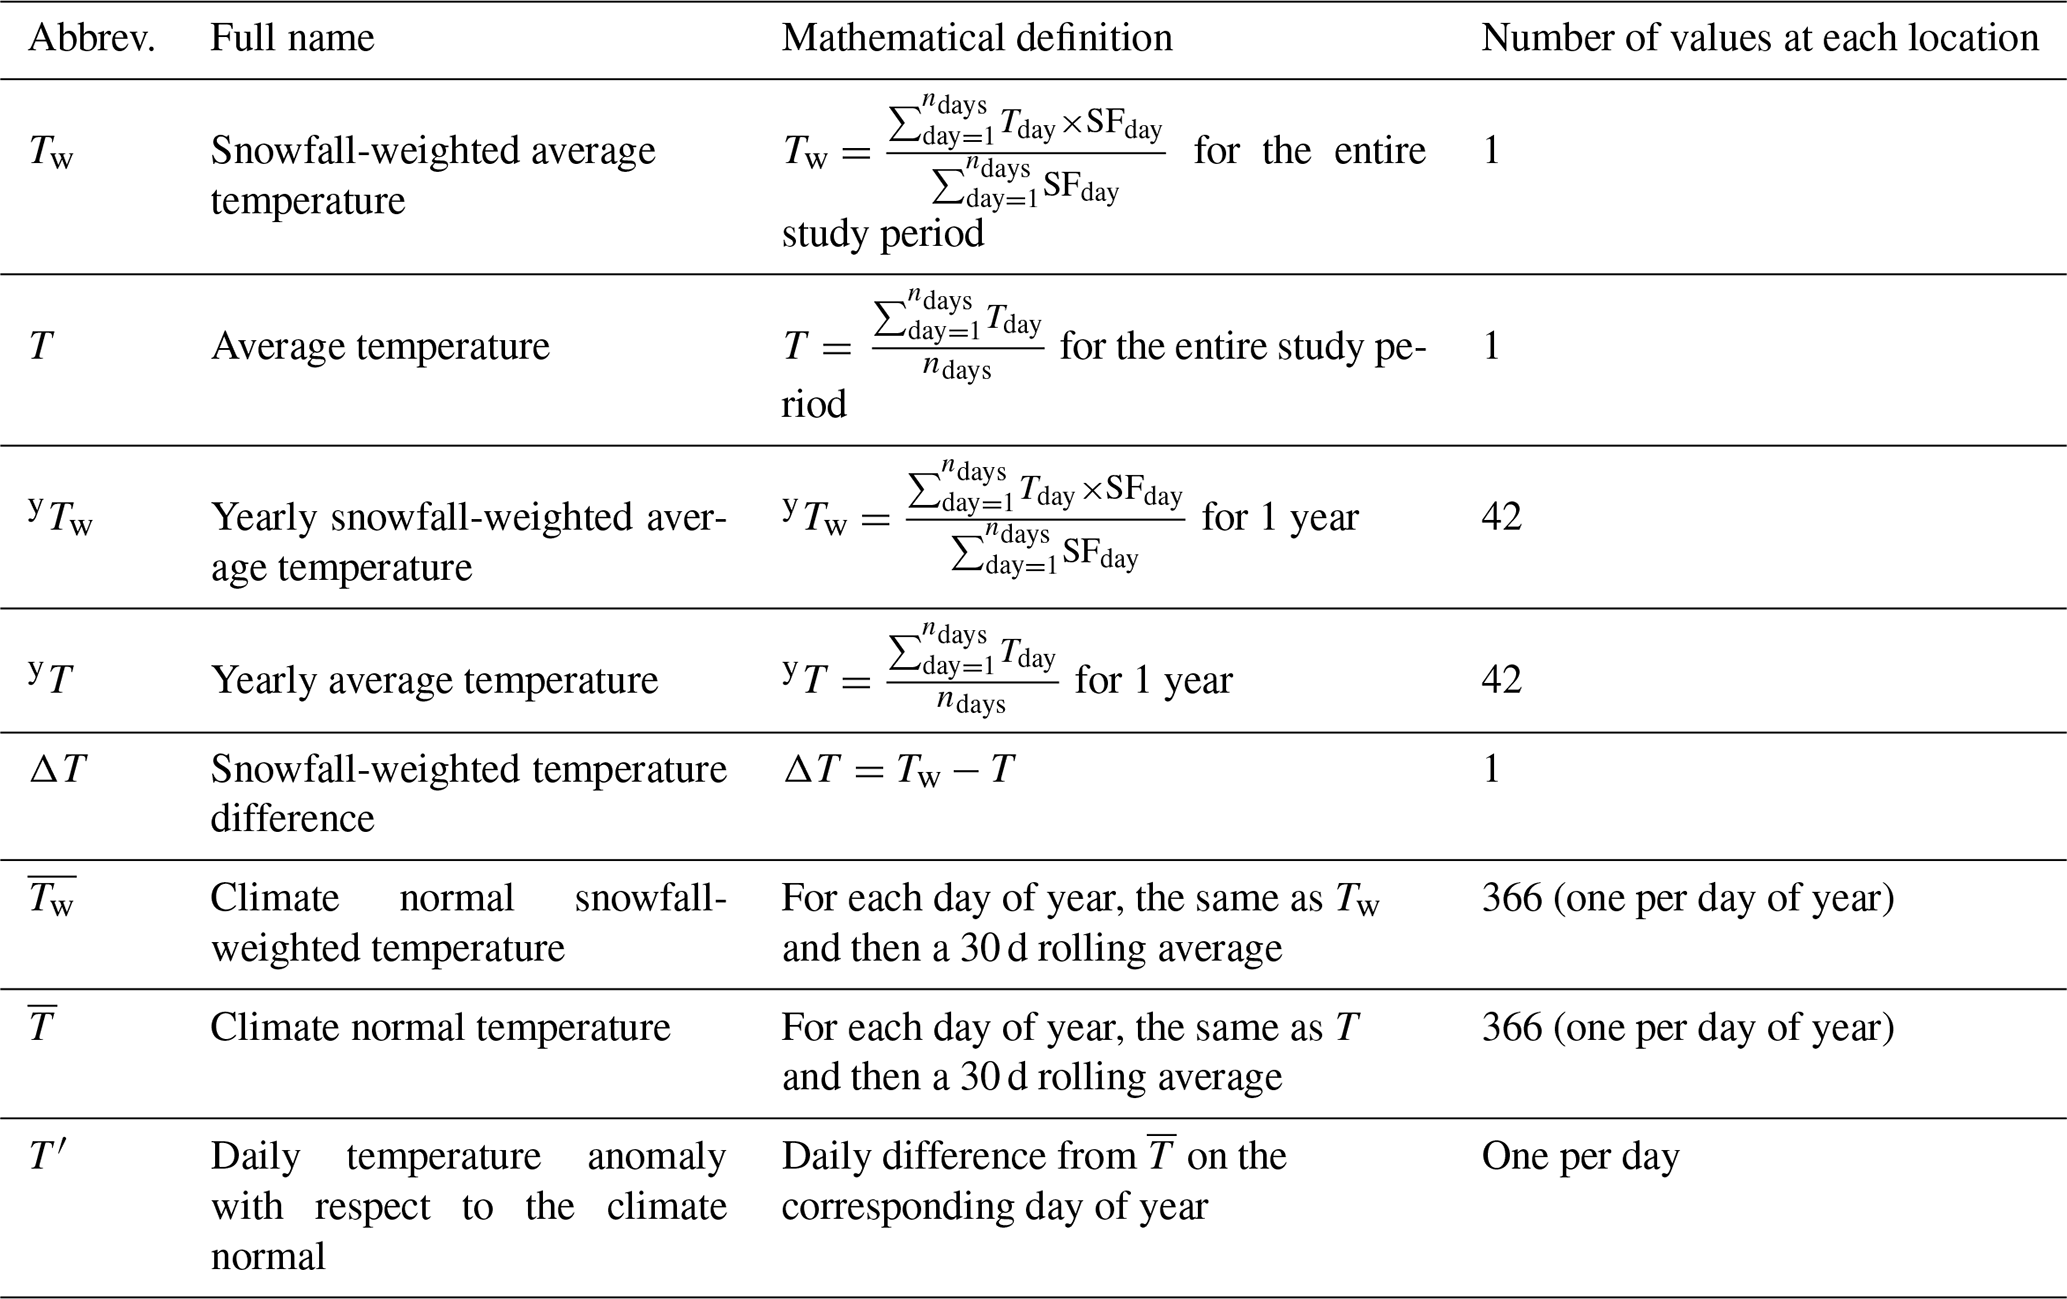
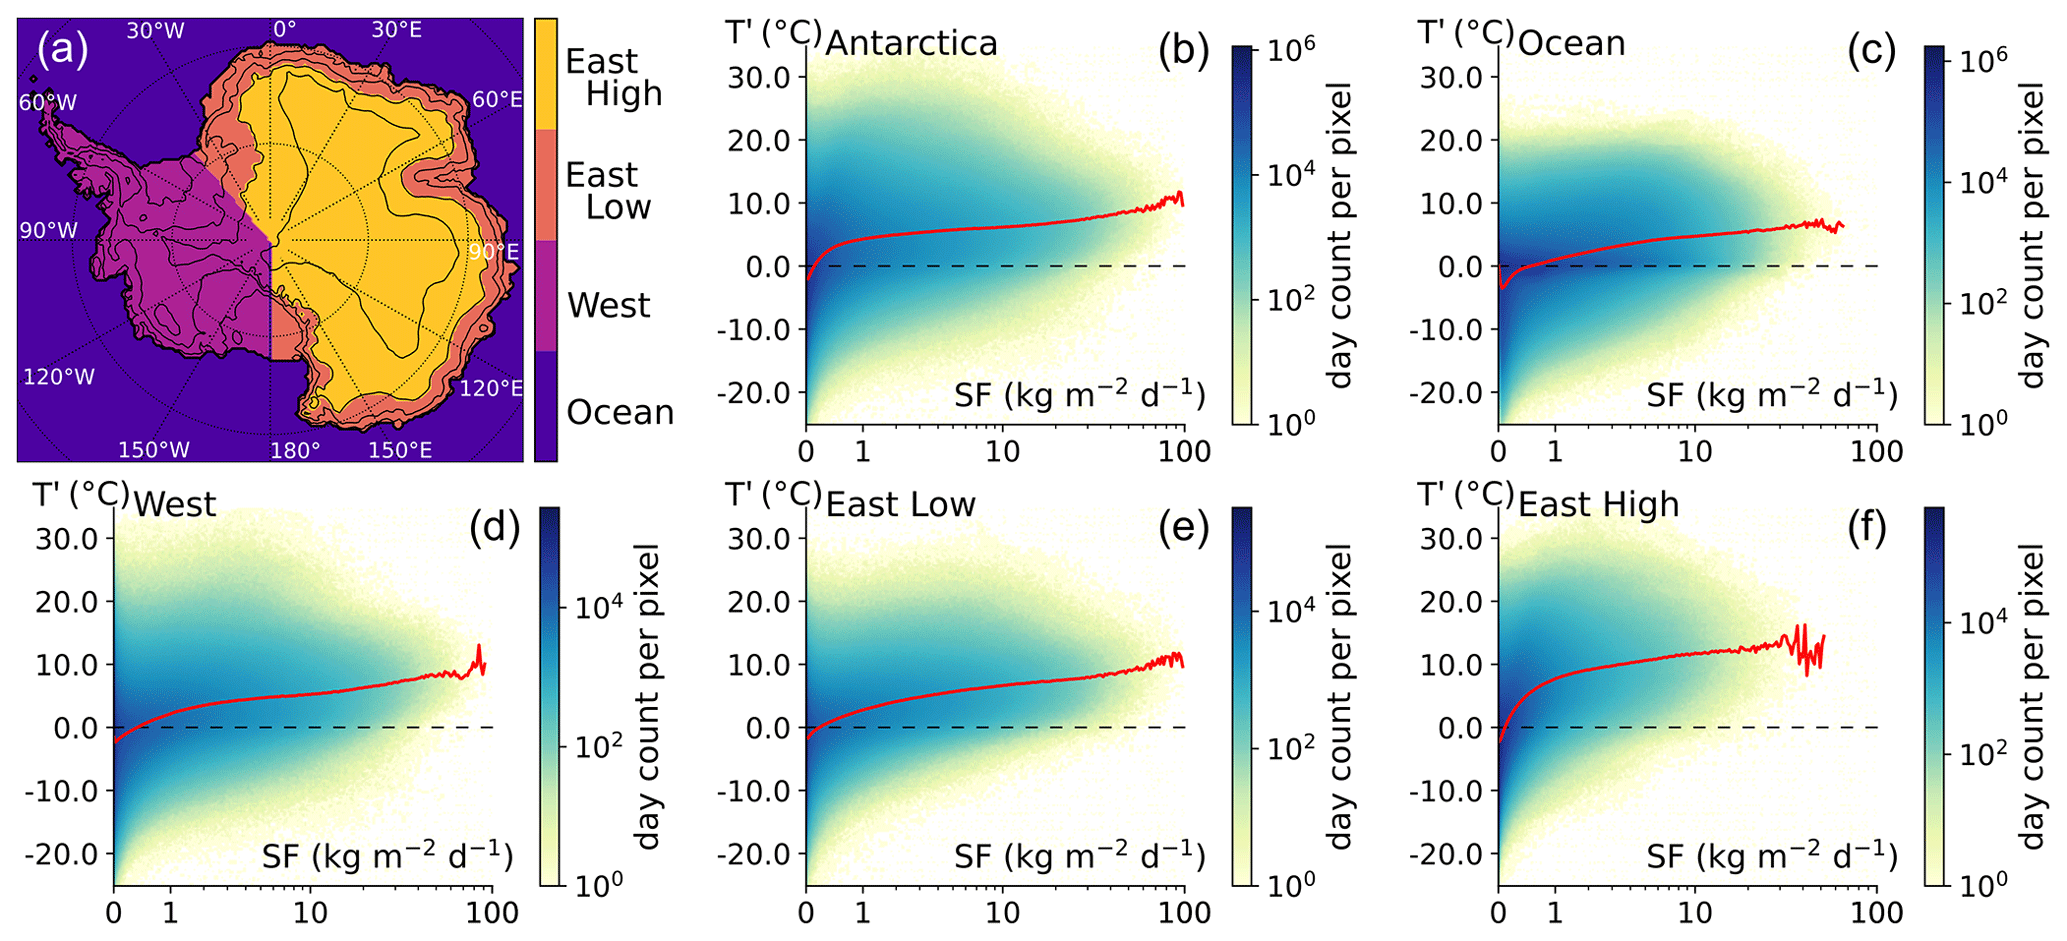
Figure 1Scatter heatmaps of the daily temperature anomaly with respect to the climate normal as a function of daily snowfall for different major regions of Antarctica for the period 1979–2020. The temperature anomaly T′ is defined as the difference between the daily 2 m temperature and the climate normal (the temperature on the average seasonal cycle for this day; see Sect. 2) on the corresponding model cell for each day. Scatter heatmaps are represented for each region defined in (a), with the heatmap for Antarctica (b) regrouping every point on the surface of the Antarctic ice sheet (including ice shelves). Ocean (c) is the remaining model domain in the Southern Ocean. Antarctica is further subdivided into west (d), for longitudes between 180 and 40∘ W; east low (e), for longitudes between 40∘ W and 180∘ E and elevations below 2000 m; and east high (f), for longitudes between 40∘ W and 180∘ E and elevations above 2000 m. For heatmaps (b–f), the red line represents the average temperature anomaly given the snowfall rate, dashed lines highlight (no anomaly), the x axis scales with log10(1 + snowfall), and the scatter density is the number of days in each pixel-sized bin after projection onto the logarithmic snowfall scale.
3.1 Average temperature during snowfall
The temperature during snowfall is statistically higher than the average temperature on the same day, as shown by the mostly positive temperature anomalies (Fig. 1). Despite a wide distribution of temperature anomalies at any given snowfall rate, the average temperature anomaly increases with snowfall. Over Antarctica, there is a +5 ∘C increase between snowfall rates of 0 (no snowfall) to 1 kg m−2 d−1, and a gradual increase of another +5 ∘C as snowfall rates increase from 1 up to 100 kg m−2 d−1. Conversely, days without snowfall are 2 ∘C cooler than average. For major regions of Antarctica, similar patterns are modelled, with negative temperature anomalies on days without snowfall and increasing temperature anomalies of up to +10 ∘C for snowfall exceeding 50 kg m−2 d−1. The main difference for East Antarctic high elevations (Fig. 1f) is that the temperature anomalies reach the +5 ∘C threshold for snowfall rates of less than 1 kg m−2 d−1.
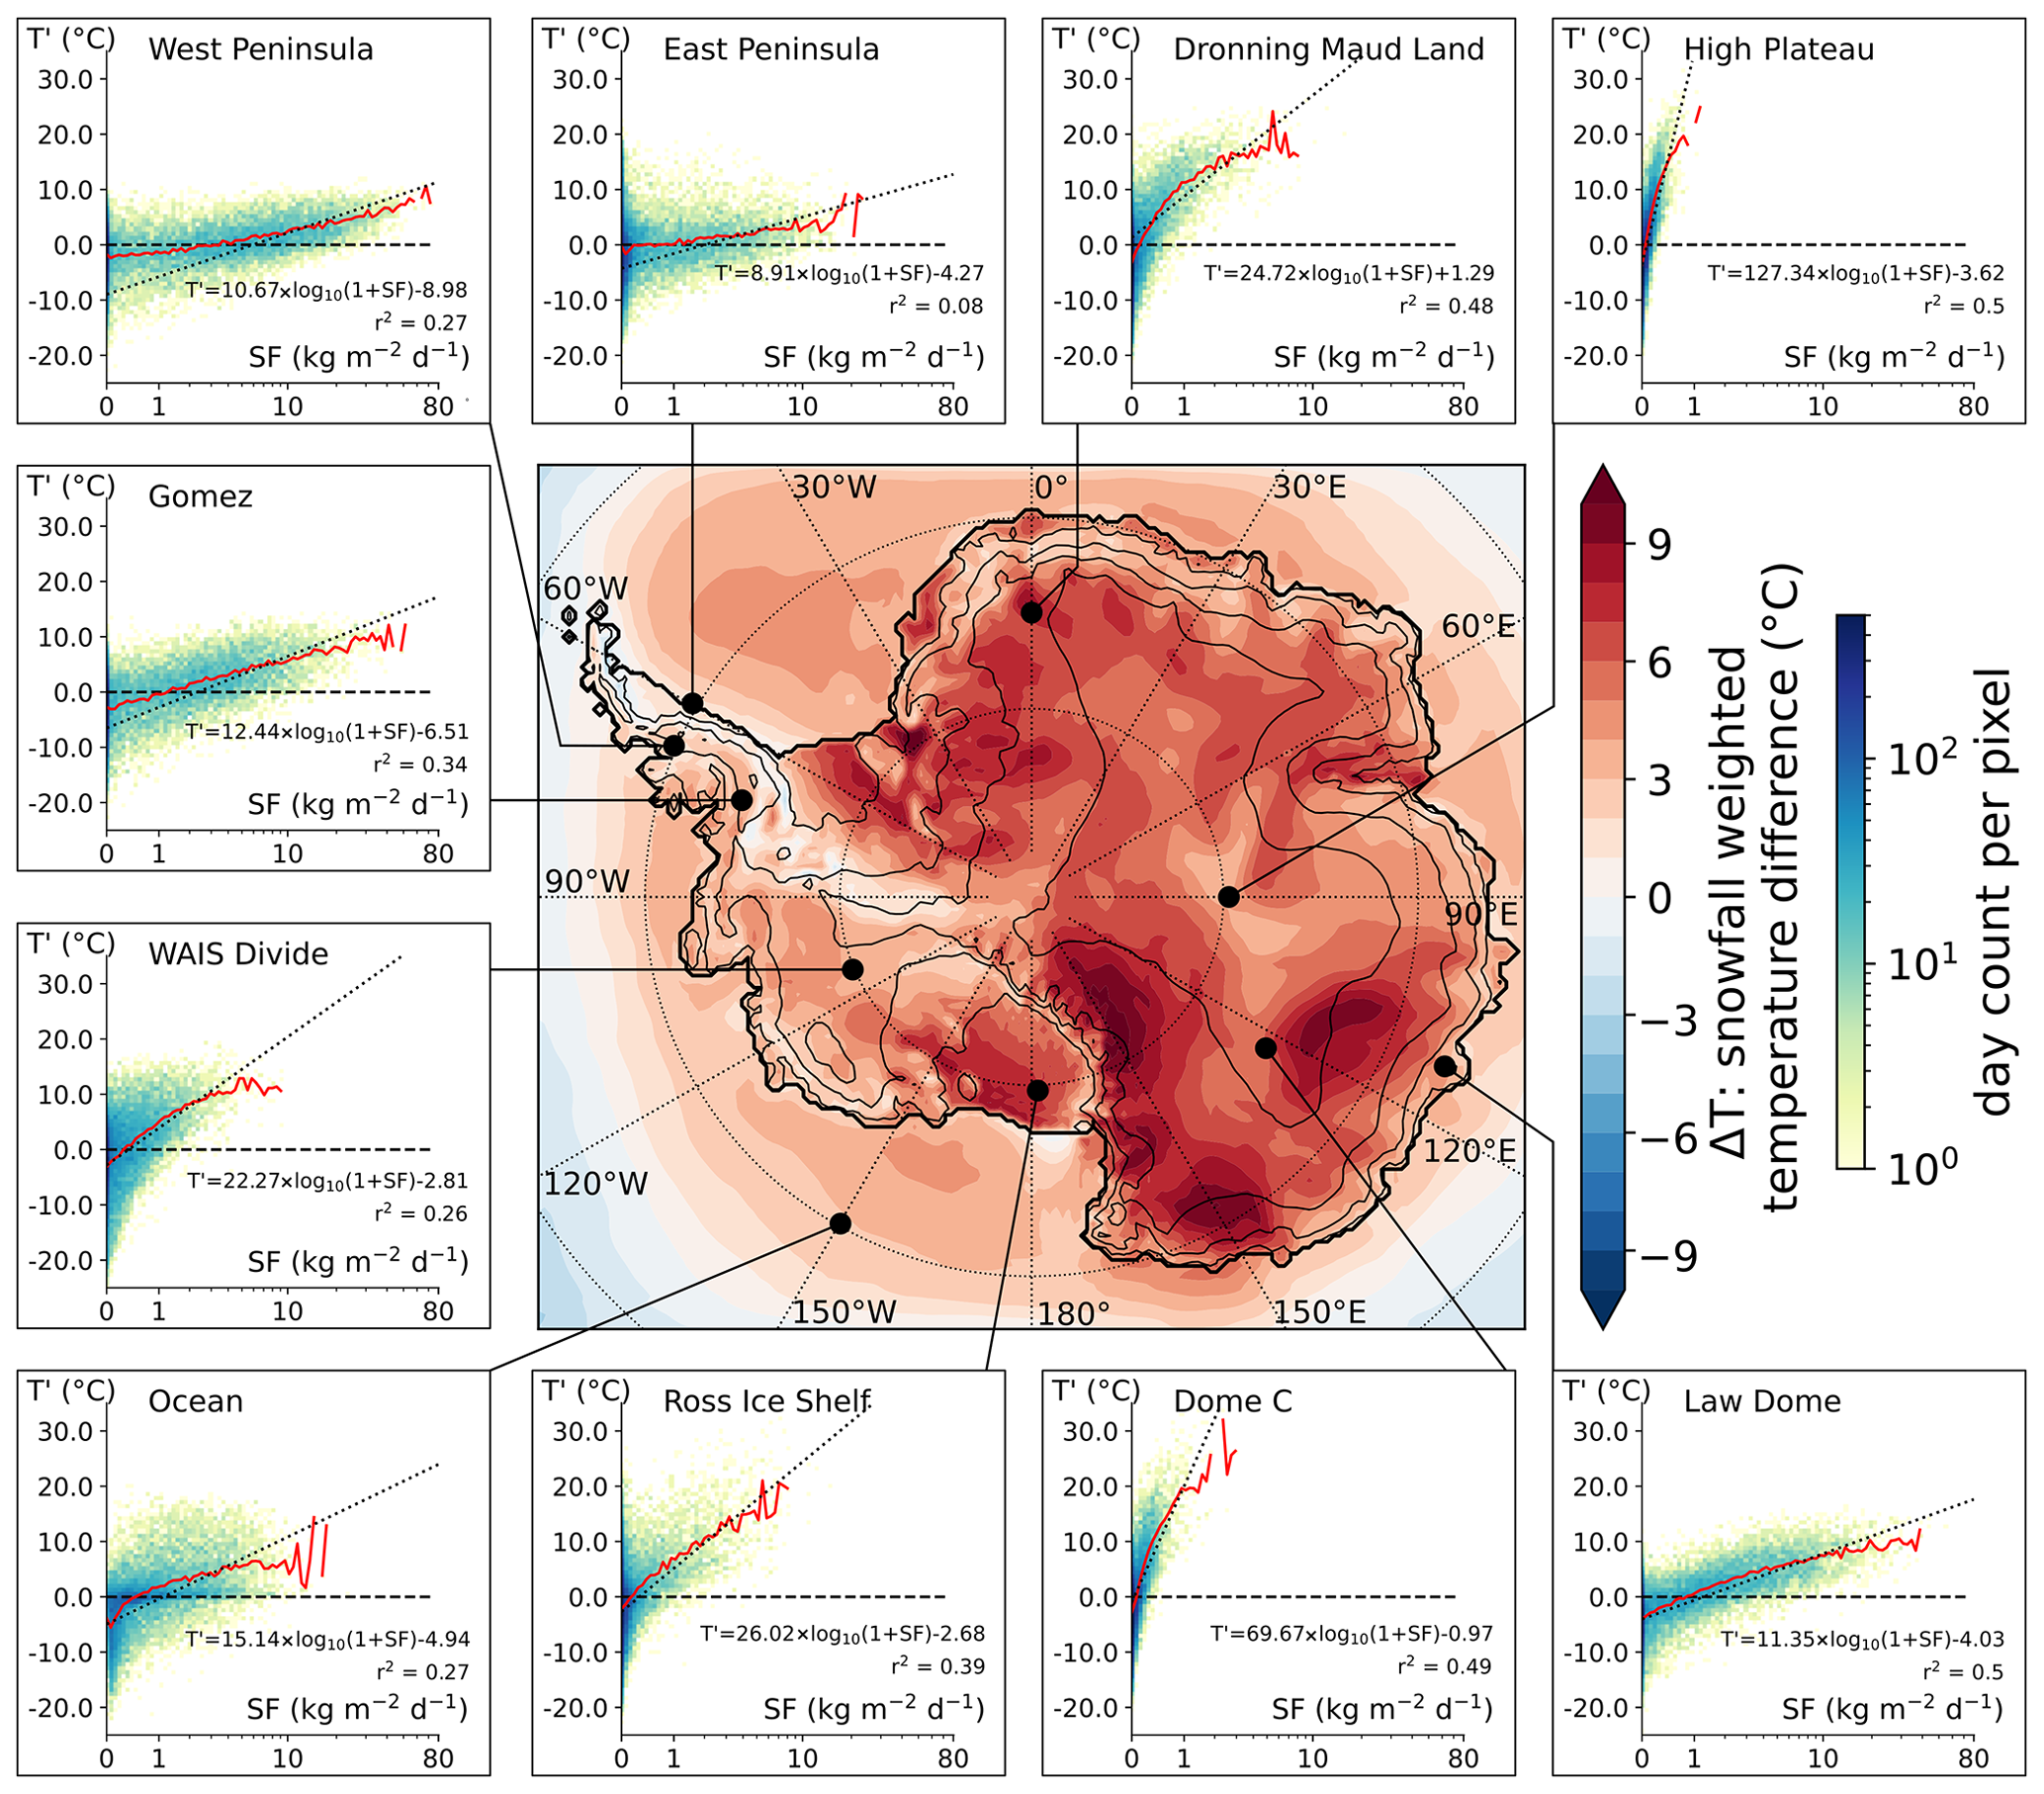
Figure 2Map of snowfall-weighted 2 m temperature differences (ΔT), and scatter heatmaps of site-specific temperature anomalies (T′) against snowfall rates (SF). Thick black lines indicate the extent of the Antarctic continent (including ice shelves). Thin lines show the 100, 1000, 2000, and 3000 m elevation contours. Black dots show the locations of 10 selected locations where the scatter density heatmap of temperature anomaly with respect to climate normal is shown in an inset (as in Fig. 1, but for a single model cell). Dotted lines represent linear trends computed for each inset on the log10(1 + SF) scale using snowfall-weighting coefficients (following the regression method described in Servettaz et al., 2020). Days without snowfall or with extremely low snowfall rates (below 0.05 kg m−2 d−1) were excluded from the trend computation. All trends are significant (p value <0.01). T′: temperature anomaly with respect to climate normal; SF: snowfall.
The positive anomaly associated with snowfall affects all of the Antarctic continent, although with varying intensity, as shown by the map of differences between the snowfall-weighted temperature and average temperature (denoted ΔT, Fig. 2; abbreviations listed in Table 1). Over the entire Antarctic continent and ice shelves, ΔT averages 5.4 ∘C. While coastal regions and West Antarctica show ΔT values of 0 to 5 ∘C, the East Antarctic Plateau and ice shelves reach ΔT values of up to 10 ∘C. Interestingly, ΔT is highest in large topographical depressions such as the Recovery (20∘ W, 80∘ S), Aurora (115∘ E, 75∘ S), and Wilkes (150∘ E, 70∘ S) basins or the Byrd glacier catchment inland of the Transantarctic Mountains (150∘ E, 80∘ S). On the other hand, over steep slopes and ridges, the snowfall-weighted temperature is relatively close to the average temperature. Note that hoar frost is computed separately from snowfall in the model and occurs in cold conditions (Schlosser et al., 2016). Therefore, ice accumulated by hoar frost can mitigate the warm conditions associated with snowfall, but this is not depicted by ΔT, which accounts only for snowfall. Another modelling study by Sime et al. (2008) showed ΔT values of up to 10 ∘C in East Antarctica and lower values of about 5 ∘C in West Antarctica for the present day, consistent with the results presented here. Our results mostly differ in the coastal regions, which may relate to the increased resolution used in this study or differences in modelling the physical processes of the katabatic-affected Antarctic slopes. In this work we focus on the quantitative temperature increase, but the degradation of the climatic signal due to the loss of correlation induced by precipitation intermittency has been treated in similar studies (Sime et al., 2011; Casado et al., 2020).
Table 2Values of the temperature anomaly (T′) for snowfall rates higher than 1 kg m−2 d−1. Locations of sites are shown in Fig. 2. For each site, the average (arithmetic) and quantiles for different percentages are shown.
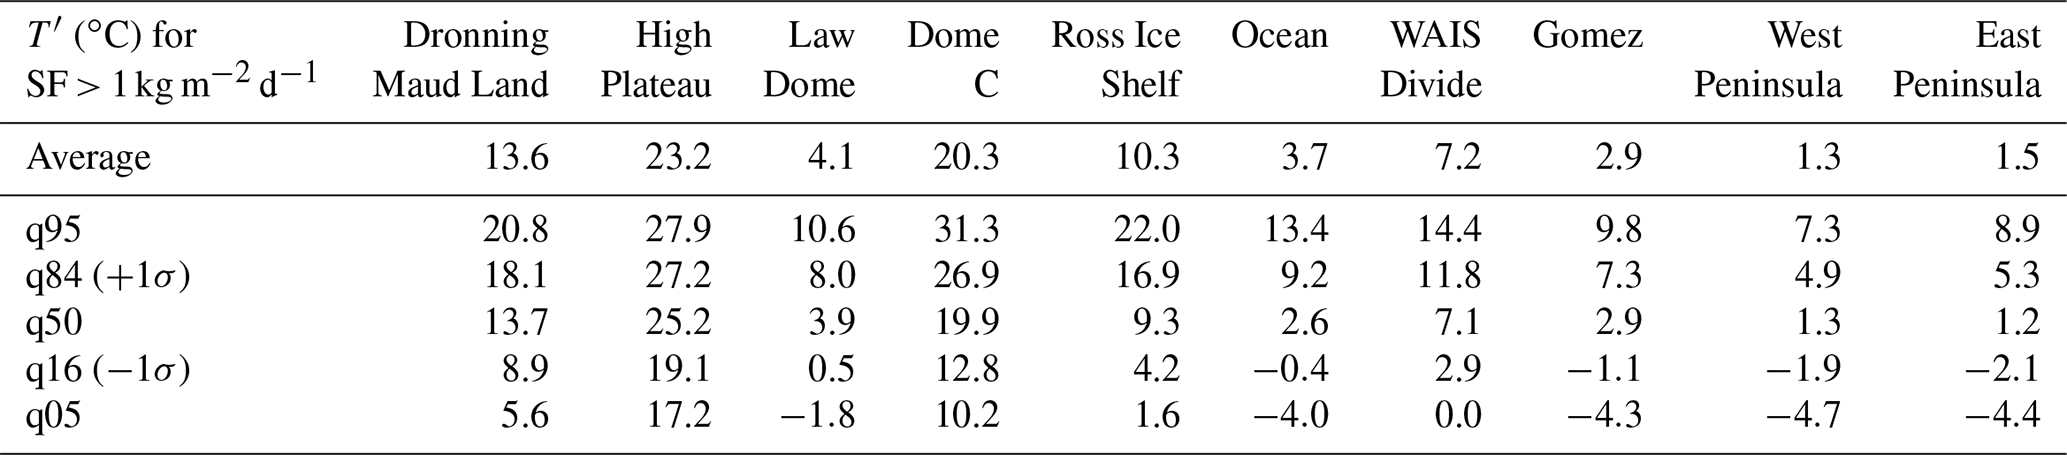
To better understand the temperature anomaly associated with snowfall at the Antarctic scale, we analyse 10 sites where the impact of extreme precipitation events on the total accumulation has previously been discussed (Turner et al., 2019), and we show the temperature–snowfall relationship at these locations (insets in Fig. 2). There are strong differences between sites located near the coast (Law Dome, East and West Peninsula, Gomez) compared to high-elevation sites on the East Antarctic Plateau (High Plateau, Dronning Maud Land, Dome C): high-elevation sites are characterized by low snowfall rates, but events causing a snowfall larger than 1 kg m−2 d−1 are accompanied by a temperature increase of more than 10 ∘C on average, and commonly up to 20 ∘C (Table 2). These high-elevation sites with low snowfall and large temperature anomalies are responsible for the sharp increase in temperature associated with low snowfall rates (Fig. 1f). Most locations reach temperature anomalies close to 10 ∘C at their respective maximum snowfalls (WAIS Divide, Gomez, Law Dome), except for sites where dry warming usually occurs, driven by foehn (East Peninsula) or katabatic adiabatic compression (coastal slopes). Each site shows an increasing temperature trend with snowfall rate, with steeper slopes for sites with low accumulation (Fig. 2). Overall, days with snowfall are statistically warmer than average conditions, and they are increasingly so for higher snowfall rates at a given location.
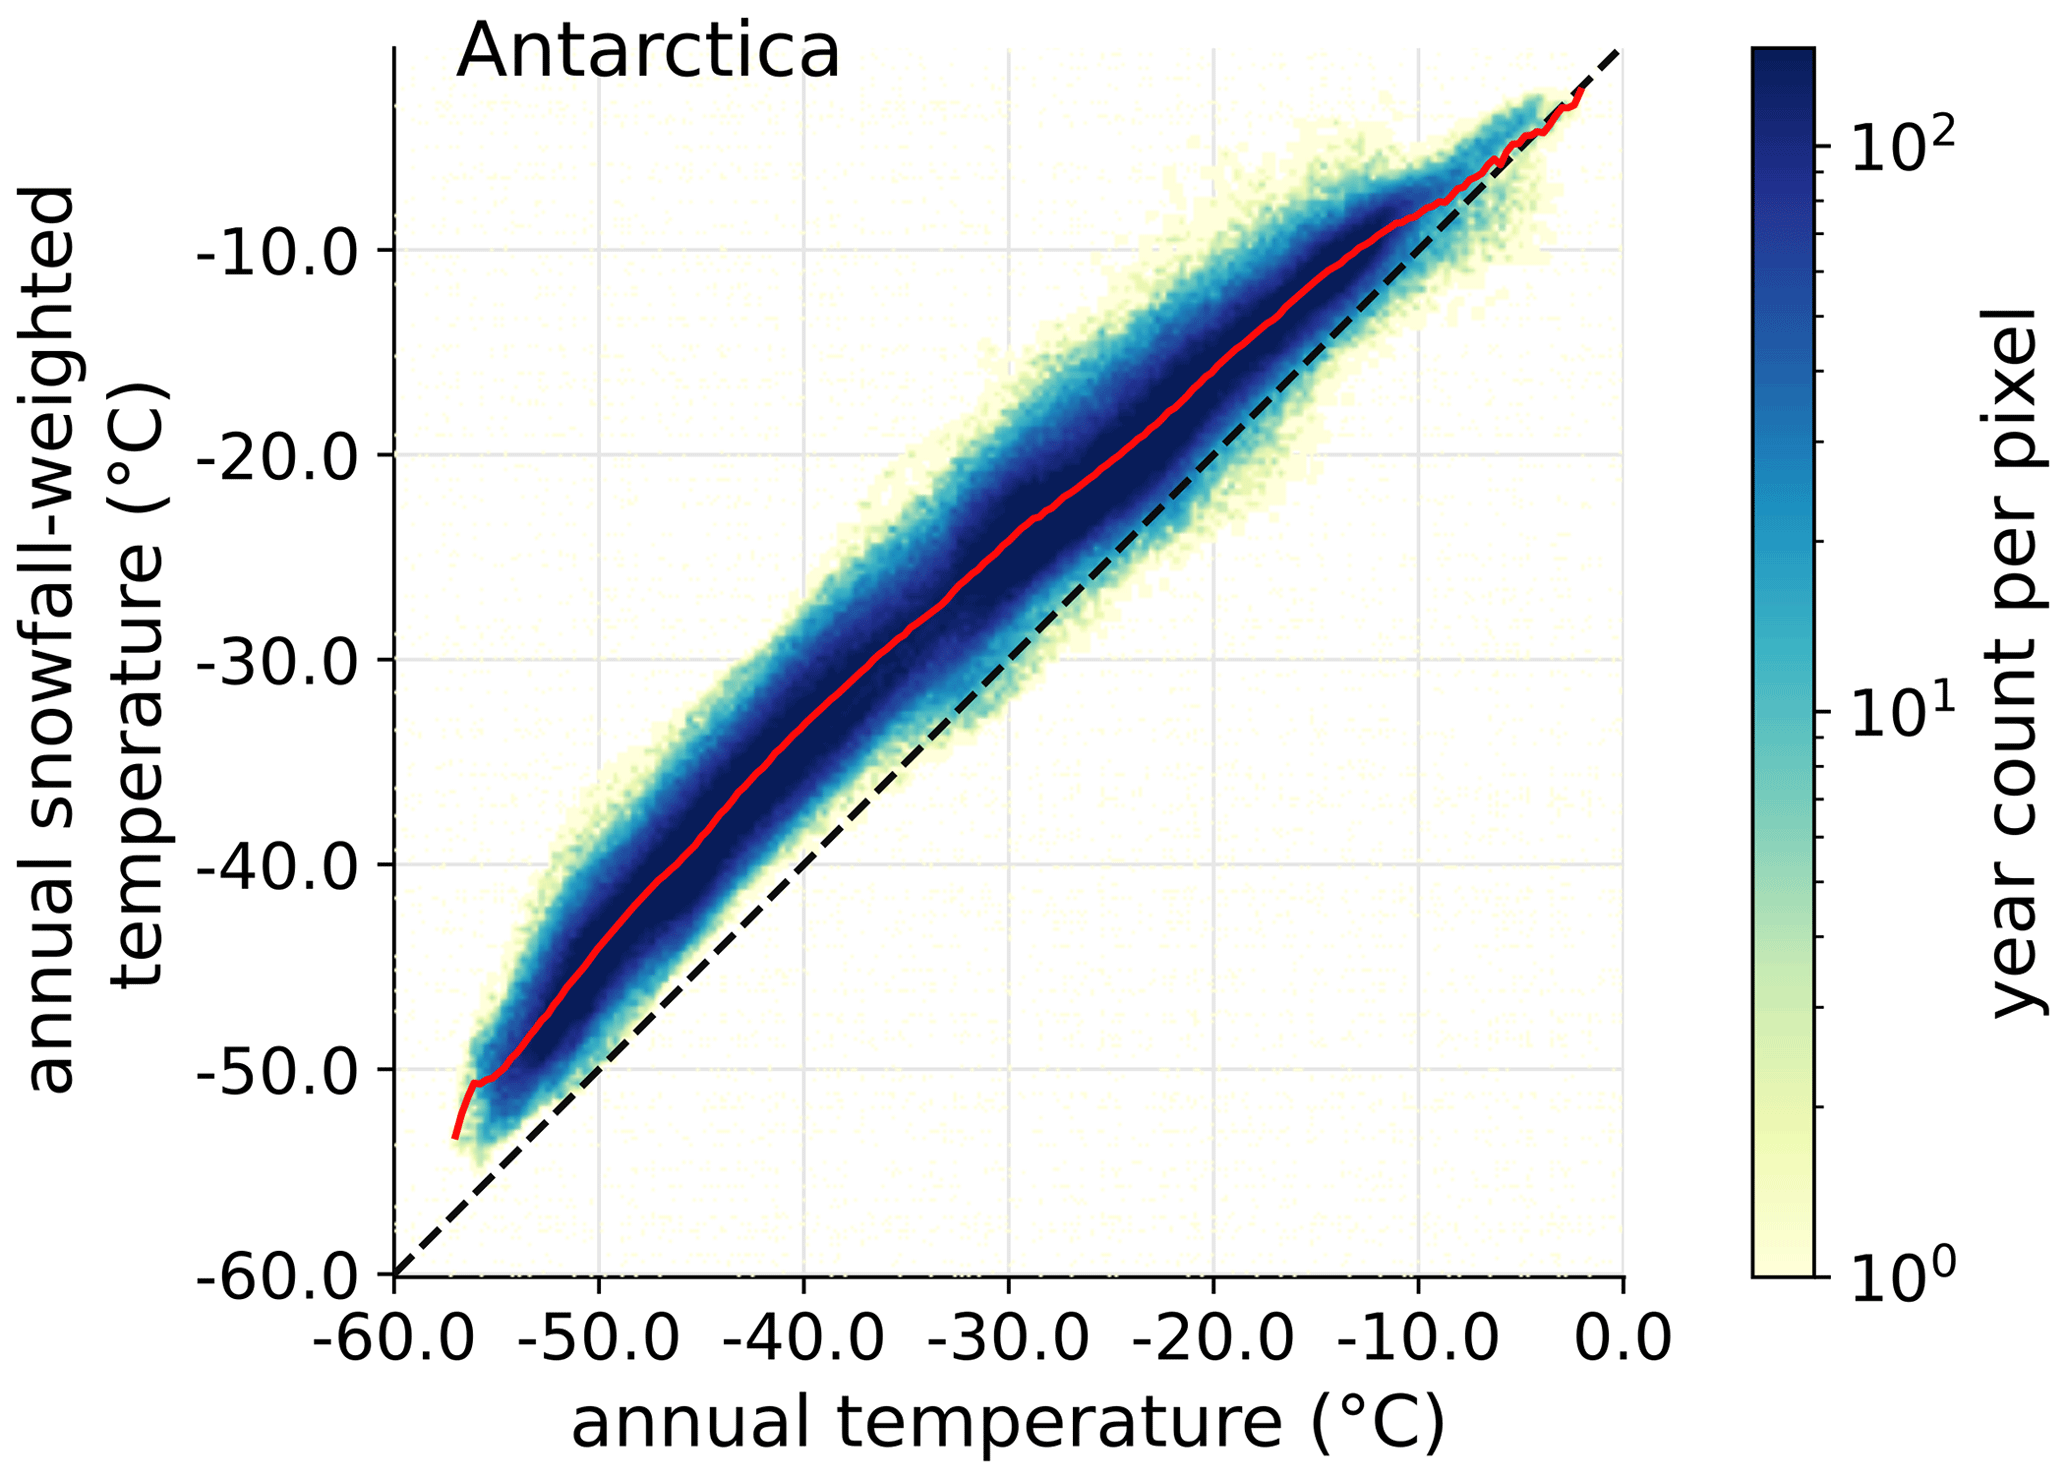
Figure 3Scatter heatmap of annual snowfall-weighted temperature (Tw) as a function of annual temperature (T) for every model point on the surface of the Antarctic ice sheet (including ice shelves). The continuous red line represents the average snowfall-weighted temperature given the annual temperature. The dashed line highlights the 1:1 line.
The analysis of yearly snowfall-weighted temperature (yTw) and “true” yearly temperature (yT, Fig. 3) further supports that the effect of snowfall weighting is not constant and may depend on local parameters including the temperature, but also probably the precipitation regimes. Importantly, yTw is not linearly related with yT, suggesting that changes in the annual temperature are not matched by proportional changes in the snowfall-weighted temperature. This relationship may also change depending on whether we average annually or at other time resolutions. Besides, any given yT is matched with a large distribution of yTw, which means that snowfall weighting induces variability in the temperature.

Figure 4Seasonal cycles of temperature and snowfall averaged over Antarctica. (a) Climate normals of temperature () and snowfall-weighted temperature (). Shading indicates the 1σ standard deviation. (b) Monthly snowfall, with the 1σ standard deviation indicated by error bars. All modelled points on the Antarctic continent, including ice shelves, are included in both panels. Climate normal temperatures were computed as the arithmetic (for ) or snowfall-weighted (for ) average for the same day of year across the 1979–2020 period and then smoothed with a 30 d rolling mean (see Sect. 2).
3.2 Variability of the temperature during snowfall
Snowfall events, in particular large precipitation events, are an important source of variability in the Antarctic climate (Turner et al., 2019). As there is a clear link between snowfall intensity and the temperature anomaly, the variability of snowfall translates into a variability of temperature. We first investigate the seasonality of temperature anomalies associated with snowfall (Fig. 4) by considering the climate normal snowfall-weighted temperature (, see Sect. 2 for details on computation) and the climate normal temperature (). differs from by 3 ∘C in summer and up to 8 ∘C in winter on average on the Antarctic ice sheet. The larger difference in winter results from the attenuation of near-surface temperature inversion during the passage of precipitating atmospheric systems. Indeed, reaches extremely low temperatures in winter, driven by the strong surface radiative cooling (Connolley, 1996; Hudson and Brandt, 2005; Genthon et al., 2021). While it contributes to large variability in winter temperatures compared to the summer season (Ricaud et al., 2017), snowfall consistently occurs under warm conditions. The seasonal amplitude of is thus 20 % lower than that of on average in Antarctica (Fig. 5). The reduction in seasonal amplitude occurs consistently over the Antarctic continent and is strongest on coastal slopes.
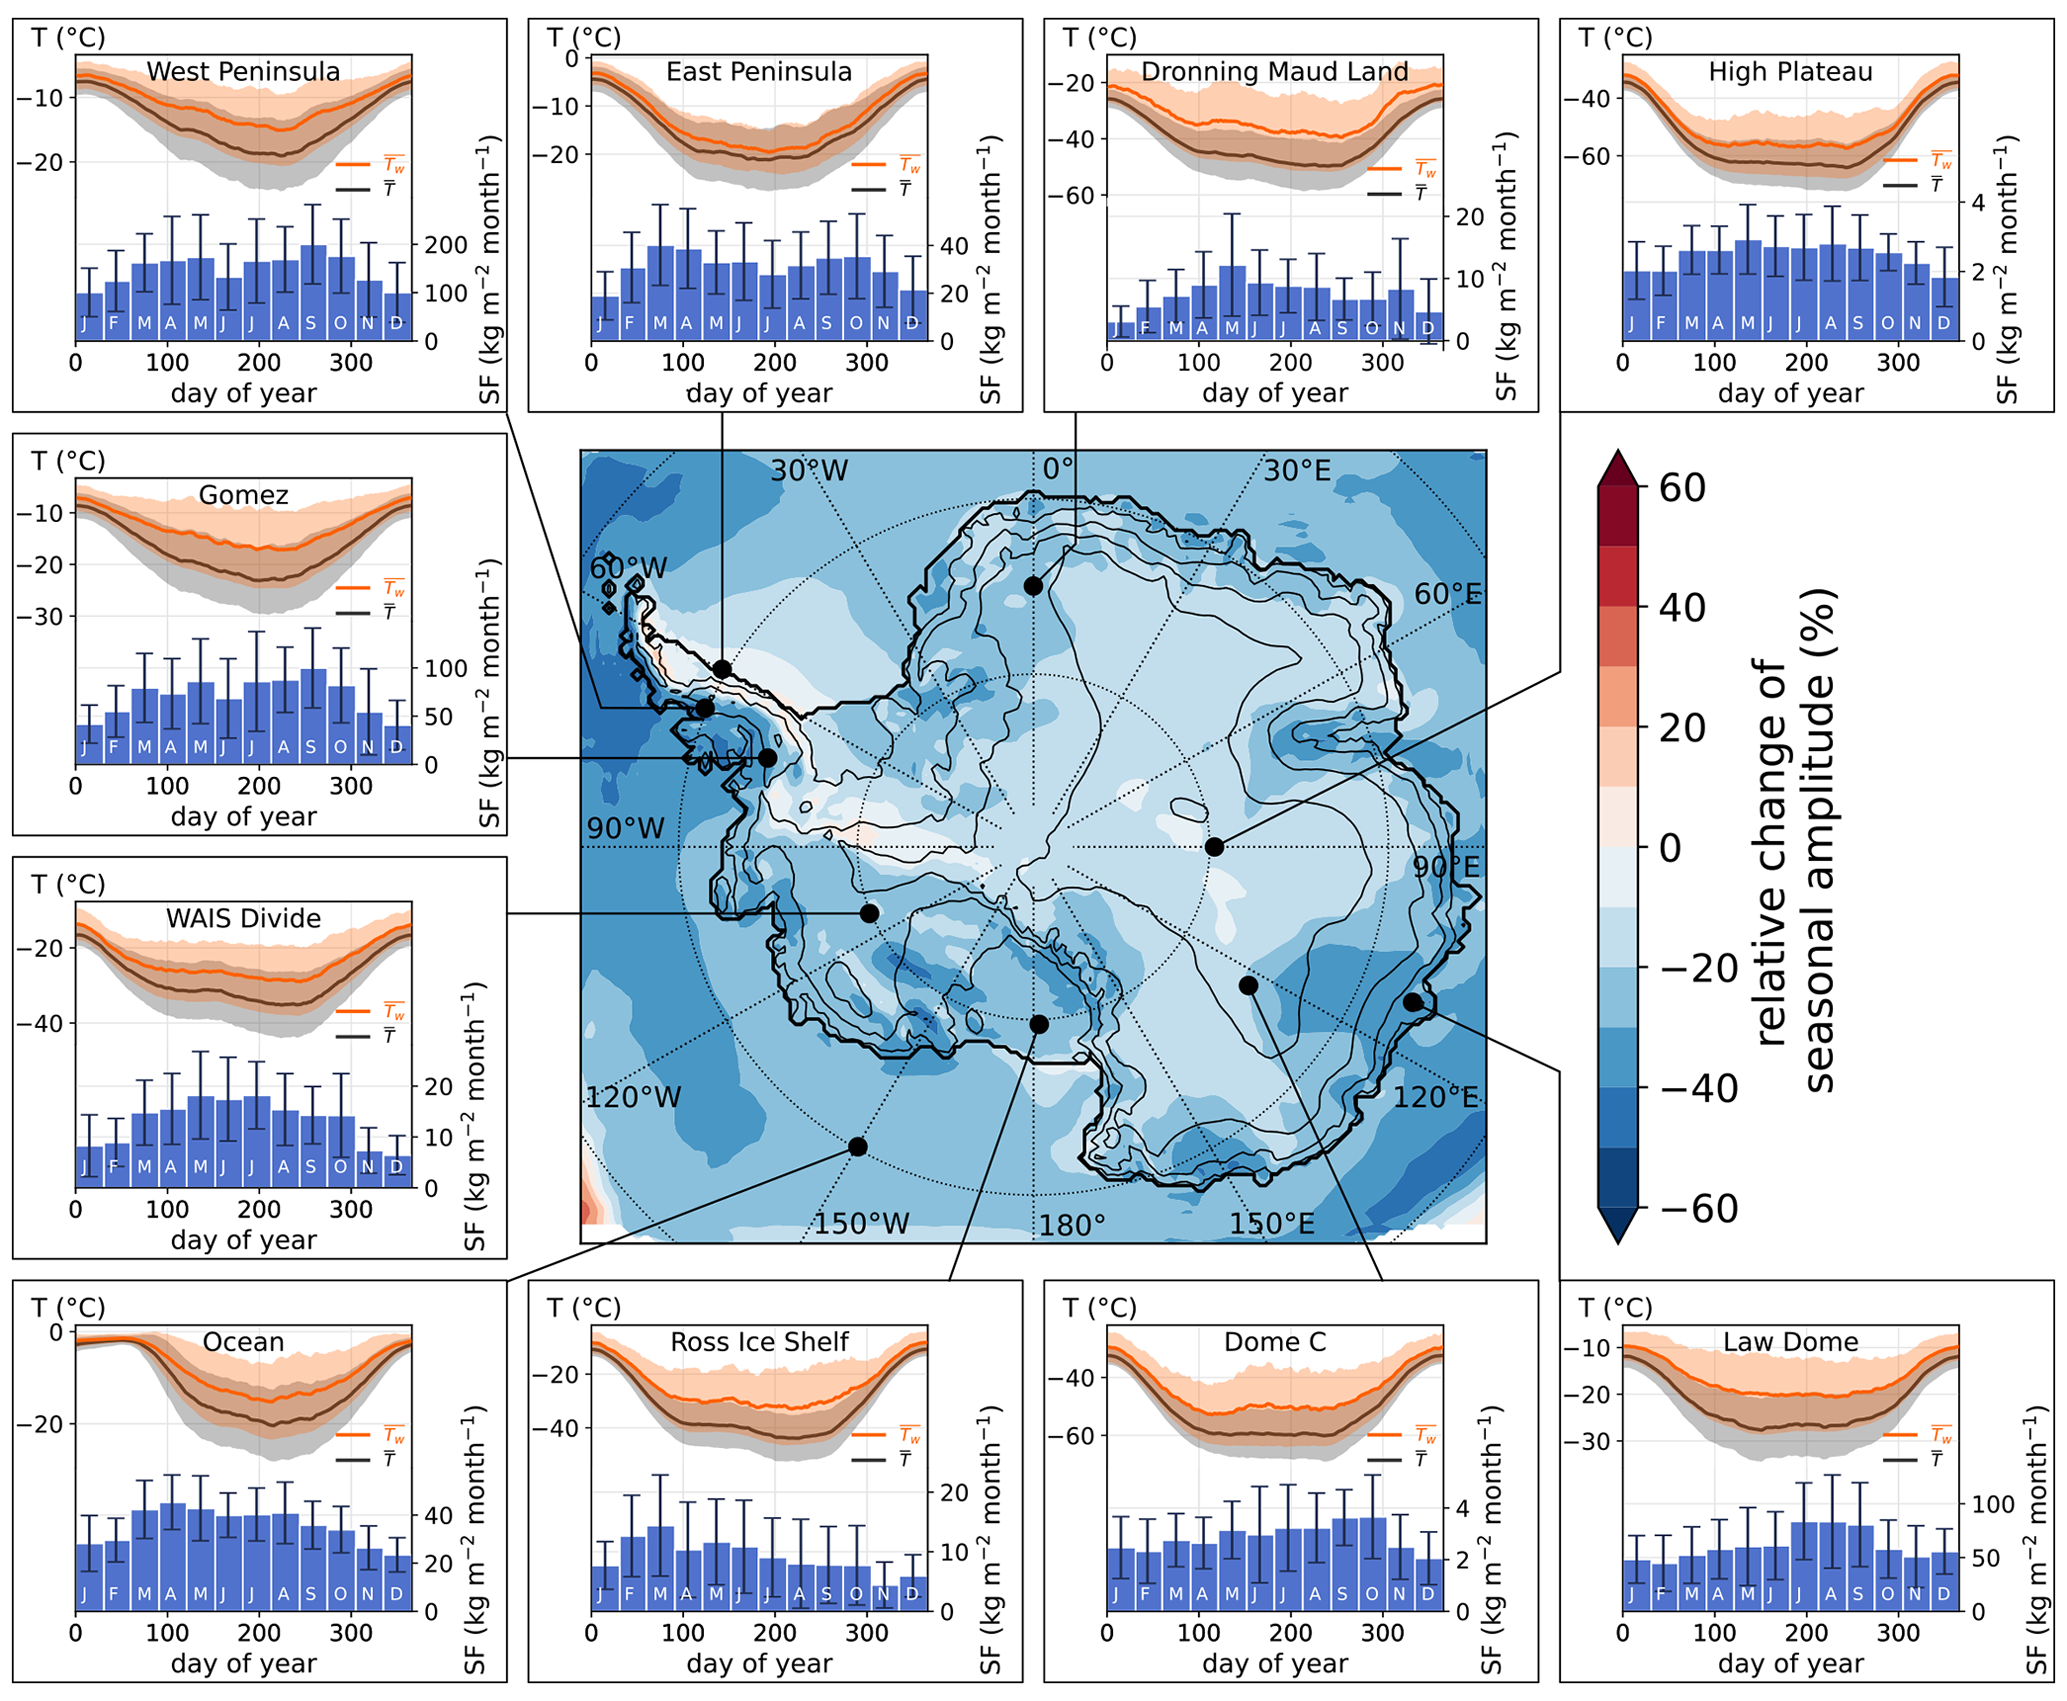
Figure 5Map of the relative change in seasonal amplitude, defined as the ratio of standard deviations for each model cell, where SD is the standard deviation. Insets show seasonal cycles of temperature and snowfall for a selection of 10 sites in Antarctica. For each site, climate normals are shown for temperature (), snowfall-weighted temperature (), and monthly snowfall, similarly to Fig. 4. Climate normal temperatures were computed as the arithmetic (for ) or snowfall-weighted (for ) average for the same day of year across the 1979–2020 period and then smoothed with a 30 d rolling mean.
In winter, cyclogenesis is slightly higher (Uotila et al., 2011) and atmospheric blocking is more frequent (Wille et al., 2021; Scarchilli et al., 2011), increasing the probability of poleward moisture transport and Antarctic snowfall. This results in higher snowfall in the winter months at the Antarctic scale (Fig. 4b) and causes the snowfall-weighted temperature to be influenced more by the winter season, when the snowfall-related warming is the strongest.
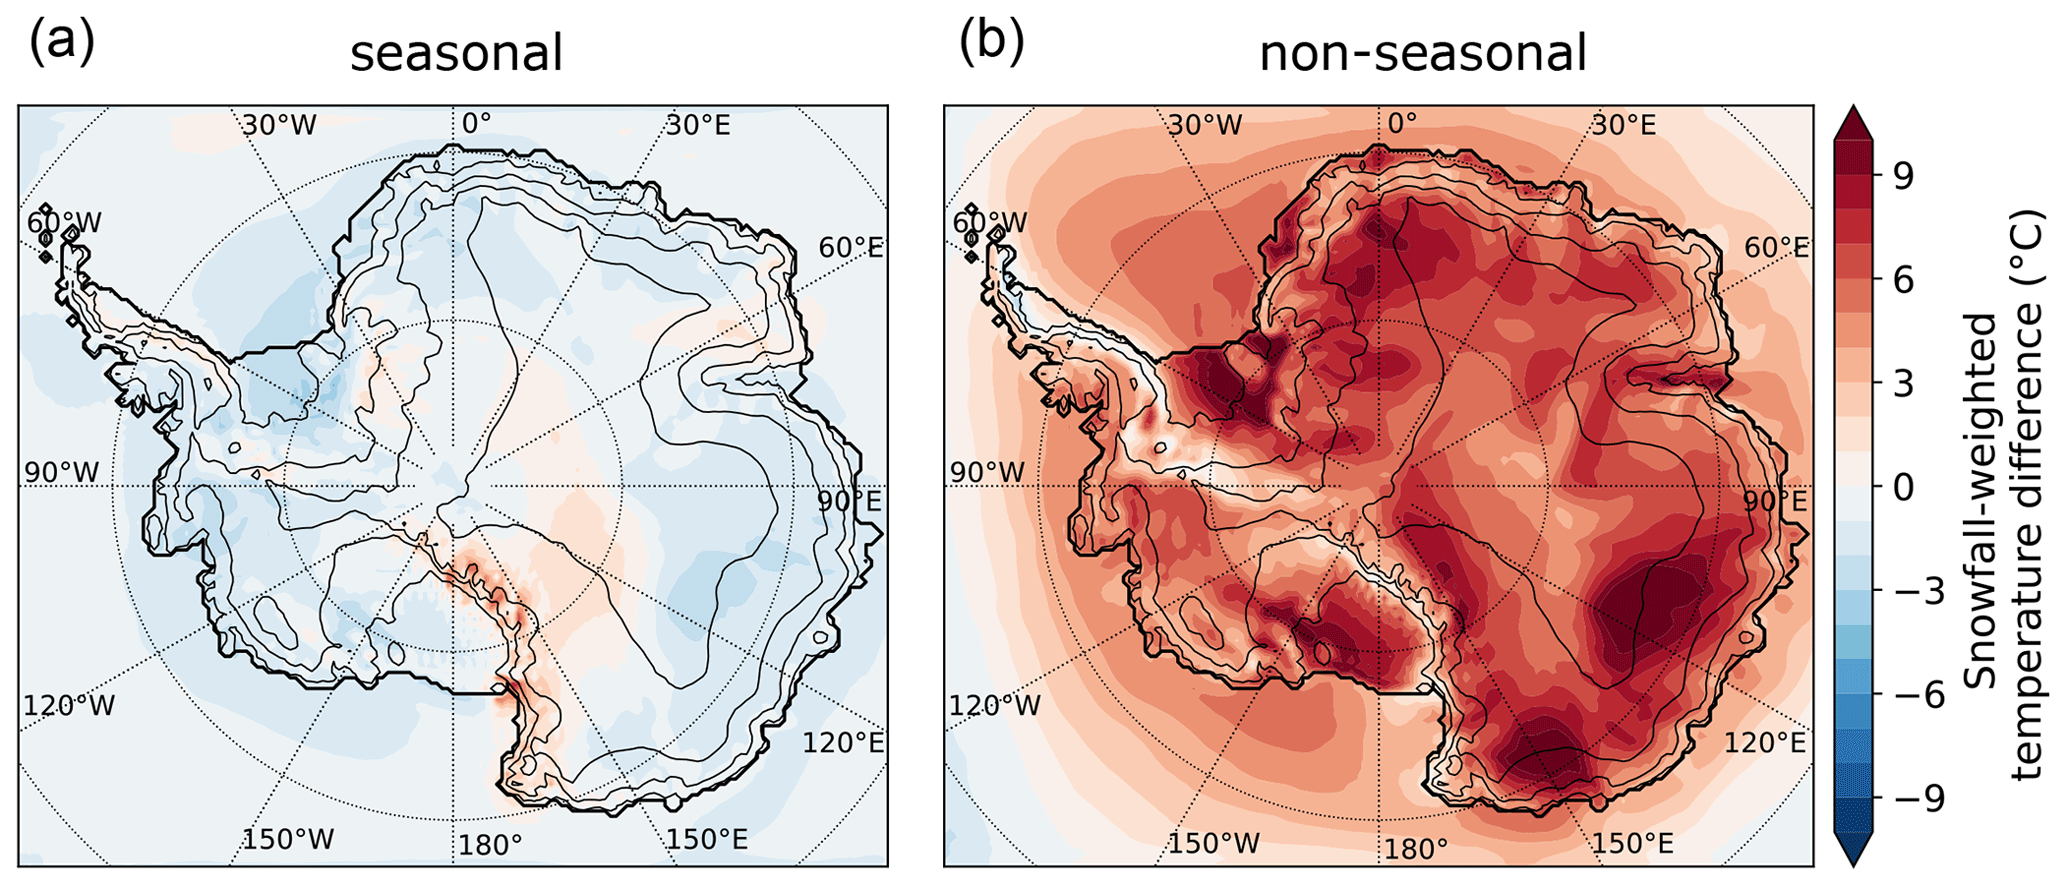
Figure 6Seasonal and non-seasonal effects of snowfall weighting on the temperature difference (ΔT). (a) The seasonal effect on the temperature difference reflects the temperature changes induced by snowfall seasonality. (b) Non-seasonal effects of snowfall weighting, revealing the influence of snowfall-event-related warming. Summing both maps results in the map shown in Fig. 2 (see Sect. 2).
We decompose the contributions of the seasonal distribution of snowfall (Fig. 6a) and the event-related daily temperature anomaly (Fig. 6b) to ΔT. As most of Antarctica receives more snowfall in winter (Palerme et al., 2017), the difference induced by seasonality averages −0.7 ∘C over the ice sheet but rarely exceeds −3 ∘C. On the contrary, snowfall-event-related warming causes a difference of +6.1 ∘C and dominates the difference between snowfall-weighted and all-day temperatures. These results are also in good agreement with the frequency decomposition of Sime et al. (2008), who showed that most of the ΔT signal was in the synoptic signal, comparable to the daily anomaly of the temperature used here. Although the seasonal signal is mostly negative in Fig. 6a, we note weakly positive ΔT in Victoria Land, where Sime et al. (2008) also found positive ΔT for their seasonally band-passed signal. The extent of this positive region is greater in Sime et al. (2008), extending well within continental East Antarctica, but this may be related to the discrepancy in modelled seasonal precipitation for the dry East Antarctic plateau, with the summer precipitation maximum causing positive ΔT in Sime et al. (2008) as opposed to the winter maximum causing negative ΔT here (Figs. 5 and 6, High Plateau site). In another study using the same method, Masson-Delmotte et al. (2011) find much stronger ΔT over the East Antarctic plateau, which is linked to seasonal effects on temperature. However, this difference is likely to have emerged from the ERA40 re-analysis used, which was documented as having a lack of winter precipitation and cyclone intensity in winter in the driest regions of Antarctica (Bromwich et al., 2007; Marshall, 2009), which leads to unrealistically large seasonal effects of precipitation weighting.
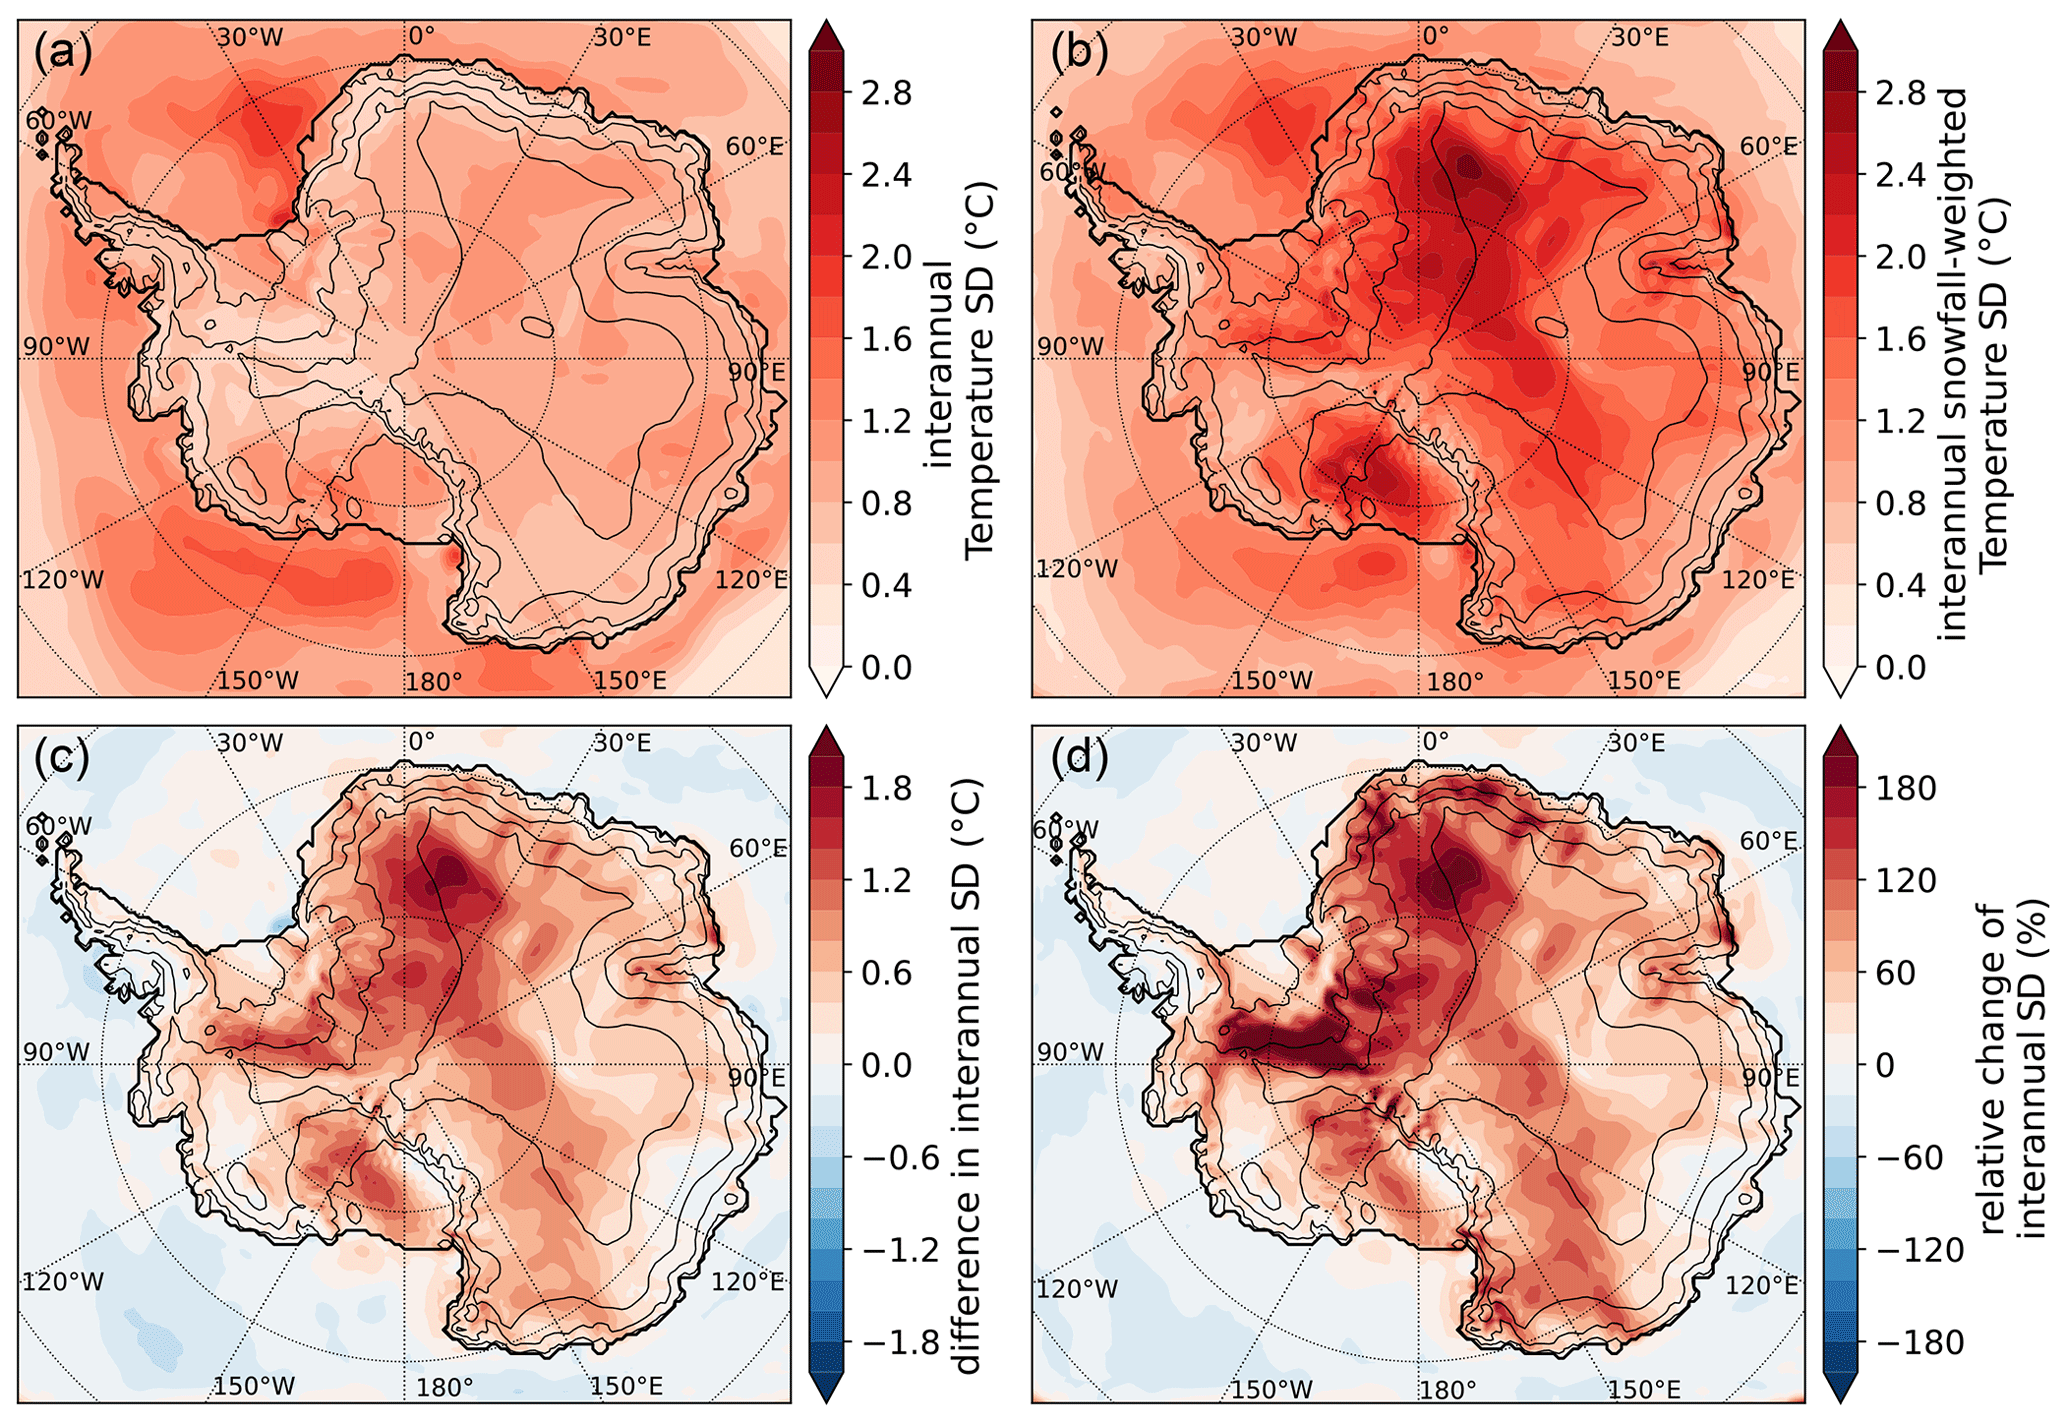
Figure 7Maps of the change in the interannual standard deviation of temperature induced by snowfall weighting. (a) Standard deviation of the yearly averaged temperature SD(yT). (b) Standard deviation of the annually snowfall-weighted temperature SD(yTw). (c) Difference in standard deviations SD(yTw)−SD(yT). (d) Relative change in standard deviation, given by . For all definitions, SD is the standard deviation and yTw and yT are the yearly snowfall-weighted temperature and yearly average temperature, respectively. Thick black lines indicate the extent of the Antarctic continent (including ice shelves). Thin lines show the 100, 1000, 2000, and 3000 m elevation contours.
The dampened seasonal amplitude of the snowfall-weighted temperature results from averaging across 42 years, smoothing out interannual variability. While the yearly averaged temperature (yT) is relatively stable over time (Fig. 7a), the interannual snowfall is highly variable, especially for the winter season (Casado et al., 2020; Turner et al., 2019). This causes the yearly snowfall-weighted temperature (yTw) to vary significantly from one year to another, with the standard deviation increased by +80 % on average over the ice sheet compared to yT (Fig. 7d). The variability is especially increased in Dronning Maud Land and the eastern part of West Antarctica facing the Ronne Ice Shelf, where the interannual variability of yTw can be 200 % larger than the variability of yT. Previous studies highlighted that the large variability of winter temperatures causes the winter season to be dominant in the interannual temperature variability, as a warm year is usually due to a warm winter, which is often accompanied by one or multiple snowfall events in winter (Persson et al., 2011; Casado et al., 2020; Servettaz et al., 2020). Despite the reduced seasonality of the snowfall-weighted temperature and the tendency to oversample warm winters, its interannual variability is increased. In other words, the temperature averaged equally over all days of a year is more stable than the temperature taken during snowfall only. This is because of the sporadic nature of snowfall, which causes the temperature to be subsampled on a limited number of days (Fujita and Abe, 2006; Turner et al., 2019) at random times of the year and with a temperature bias which depends on precipitation intensity. On the interannual scale, the variability of yearly averaged temperature is thus enhanced when weighting with snowfall.
3.3 Implications for water isotopes
Water isotopes are used in Antarctic paleoclimate studies as a proxy for temperature due to the relationship between air temperature at condensation and the isotopic ratio in precipitation (Stenni et al., 2017; Dansgaard, 1964). Ice cores retrieve material accumulated over time onto the ice sheet, where the ice mass contribution depends on the snowfall. Therefore, snowfall-weighted temperatures provide an analogue to the isotopes we can expect to measure in an ice core. We thus discuss how the temperature during snowfall may affect δ18O at the time of snow deposition, prior to post-deposition effects that occur later and further modify snow isotopes. Although we mainly discuss water isotopes due to their preponderance in paleotemperature studies in Antarctica, these effects would theoretically apply to any snowfall-dependent temperature proxy.
Water isotopes in snow are deposited under warmer-than-normal conditions (Fig. 2), which leads to a higher-than-expected δ18O. Some climatic information is lost for δ18O as cold days are not recorded or they are recorded with lower weight. Previous works suggested that δ18O could be seasonally biased due to the annual cycle of snowfall (Markle and Steig, 2022; Werner et al., 2000; Persson et al., 2011), but here we show that the temperature increase associated with precipitation events is clearly the main factor controlling the snowfall-weighted temperature in Antarctica. The variety of ΔT values across modern Antarctica suggest that it depends on precipitation regimes and the amplitude of temperature change during precipitation at a given site. The stability of ΔT over time is thus decisive for temperature reconstructions based on isotopes because temporal changes in ΔT could accompany temperature and precipitation changes and hinder the δ18O-based reconstructions. Here, the short study period does not allow us to evaluate temporal changes in ΔT, but such changes may be responsible for modifications of δ18O–temperature slopes at longer timescales, as was suggested for the glacial-interglacial range (Buizert et al., 2021). Previous studies also highlighted that, despite being weaker than non-seasonal effects in absolute value, seasonal effects on ΔT are more likely to vary with climate as the seasonality of precipitation changes (Sime et al., 2008) in response to sea ice and moisture source changes (Holloway et al., 2016). Given the spatial variability of ΔT, we advise against the use of spatial gradients to define isotope–temperature slopes for temporal reconstructions.
Moreover, the reduced annual cycle of relative to may reflect an annual cycle of δ18O with attenuated amplitude, which can explain why the seasonal δ18O–temperature slope appears to be lower in precipitation δ18O studies than in simple isotopic models (Casado et al., 2018). On the other hand, averaging temperature and isotopes yearly to define the δ18O–temperature slope may increase the slope value because of the higher interannual variability of δ18O induced by the irregularity of the snowfall distribution, similarly to the snowfall-weighted temperature. Links were found between Antarctic temperature and large-scale atmospheric circulation patterns in the Southern Hemisphere such as the Southern Annular Mode (abbreviated to SAM, Marshall and Thompson, 2016), which possibly influence the δ18O (Abram et al., 2014; Kino et al., 2021). Nevertheless, we did not find any significant correlation between the SAM and the yearly or monthly snowfall-weighted temperature difference. Detecting possible links between the SAM, or other climate modes, and the precipitation-weighted temperature (or δ18O) would require a more detailed investigation and may be explored in a different study.
Slopes of snowfall-weighted δ18O of precipitation against snowfall-weighted temperature have previously been suggested (Fujita and Abe, 2006; Sturm et al., 2010; Servettaz et al., 2020). The precipitation-weighted δ18O makes physical sense because it mimics the ice core signal (omitting the post-deposition effects), but paleoclimate reconstructions seek the temperature rather than the snowfall-weighted temperature. This work highlights the critical importance of event-related warming for the temperature during snowfall, as it reduces the seasonal amplitude, while the irregular snowfall distribution enhances the interannual variability of the temperature possibly recorded in water isotopes. This explains, at least partly, the higher interannual variability of precipitation-weighted δ18O, which causes an increased δ18O–temperature slope across most of Antarctica at the interannual scale compared to the seasonal scale (Goursaud et al., 2018), and low correlations between modelled δ18O and temperature at the annual scale (Münch et al., 2021). Simulation of δ18O signals that would be recorded in Antarctic Peninsula ice cores also revealed that the interannual variability in δ18O may show a poor correlation to temperature variability, even in high-accumulation regions (Sime et al., 2009a). Non-linearities in the snowfall-weighted temperature as the temperature and climate change (Fig. 3) may be responsible for the non-linear responses of isotopes to temperature and the underestimation of the temperature maximum in warm periods through increased winter precipitation (Sime et al., 2009b).
Understanding the effect of snowfall weighting on the average temperature at ice coring sites will help us to reconstruct paleotemperatures more accurately. Depending on the targeted time frame for temperature reconstruction from isotopes, be it seasonal (Jones et al., 2023) or pluriannual (Stenni et al., 2017), the reconstructed temperature range may be lessened or increased. Moreover, using slopes that are variable over time would result in better temperature quantification because the slope depends on the temperature range and the location (Sime et al., 2009b) and may vary over time (Klein et al., 2019).
Quantifying the local effect of snowfall weighting on the temperature range can help refine the temperature–isotope slopes for more accurate estimation, and it should be done for different settings ranging from glacial to warmer-than-present interglacial climates. Future temperature reconstructions could consider proceeding in two steps: (1) determine the snowfall-weighted temperature from water isotopes, for which the correlation is generally good and can be determined by Rayleigh-type models (e.g. Markle and Steig, 2022), and then (2) determine the average (non-weighted) temperature through the site-calibrated Tw–T slope, calculated for the matching temporal resolution (similarly to Fig. 3, but here we only show the yTw–yT slope computed with yearly averages and include all of Antarctica), while accounting for the difference in temperature between the condensation level and surface, often dictated by inversion strength. Greater snowfall-weighted temperature differences at low-accumulation sites suggest that changes in snowfall regimes could impact the temperature difference and thus bias the reconstructions from isotopes. Further work is necessary to fully understand how changes in snowfall dynamics may influence temperature reconstructions from isotopes, which may be facilitated by atmospheric models equipped with isotopes.
We evaluated the temperature during snowfall in Antarctica using the regional atmospheric climate model MAR. Positive temperature anomalies usually accompany snowfalls, and the anomalies tend to increase with snowfall rate at any given site. The slope of the temperature increase as a function of snowfall rate is strongest at sites with low accumulation, so even locations with low snowfall rates experience a strong snowfall-weighted temperature difference. Over the Antarctic continent, this difference averages 5.4 ∘C. Temperature anomalies are typically strongest in winter, which leads to a 20 %-reduced amplitude of the seasonal cycle of temperature during snowfall. Larger temperature anomalies during winter also offset the slightly higher seasonal contribution of winter precipitation, which would reduce the snowfall-weighted temperature by 0.7 ∘C. Year-to-year irregularities in snowfall distribution contribute to the random subsampling of temperature and increase the interannual variability of the snowfall-weighted temperature, making it 80 % more variable. Under the assumption that water isotopes reflect the snowfall-weighted temperature, these biases will transfer to the isotopic signal in ice cores, which may explain the necessity to adjust isotope–temperature slope values depending on the time frame of the reconstruction. Non-linearities in the snowfall-weighted temperature compared to the site temperature confirm previous results which indicated that using linear isotope–temperature slopes may lead to overestimated temperature decreases in cold periods and underestimated temperature increases in warm periods. While we focused on the 1979–2020 period in this study, potential changes in precipitation regimes at longer timescales may be associated with changes in the snowfall-weighted biases, and these deserve attention in future studies aimed at adjusting the isotope–temperature slopes accordingly to achieve quantitatively accurate paleotemperature reconstructions.
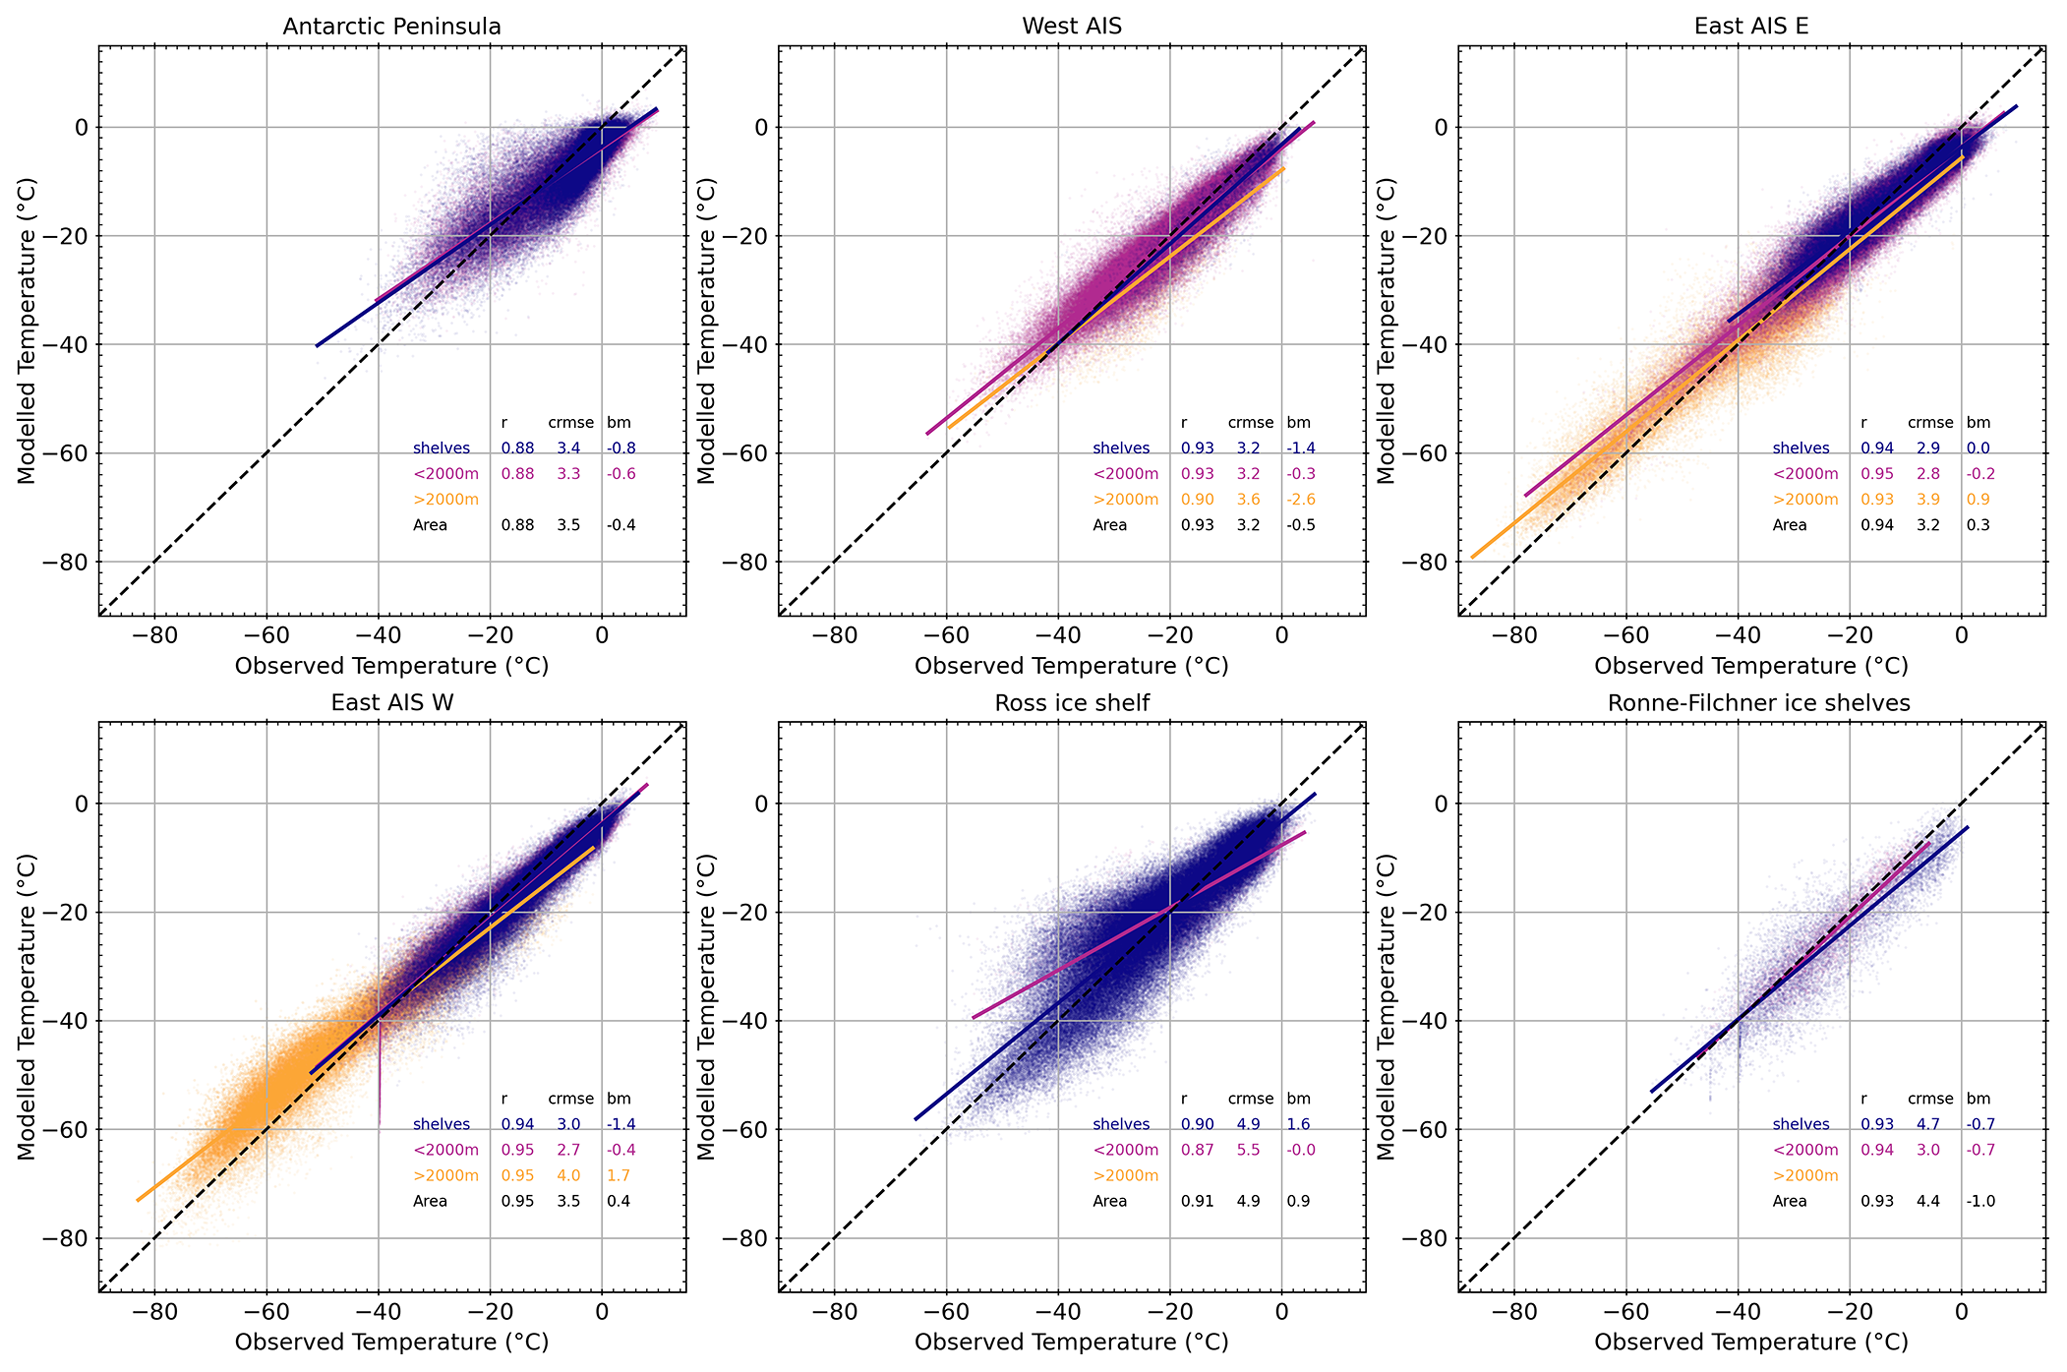
Figure A1Evaluation of the model performance in representing temperature. Scatterplots and linear regressions of modelled (MAR v3.12) vs. observed temperature (from a compilation of automatic weather stations and other measurements; Mottram et al., 2021) for different regions (as in Kittel et al., 2021). Slopes that are slightly lower than 1 indicate that the natural range of temperature variability is greater than what the model can achieve, although the difference is minor. The residual mean square error (RMSE) measures the scattering of modelled temperatures around the observed temperature, and the bias mean (BM) measures the average difference from the observed temperature. Both give an estimation of imprecision of the model.
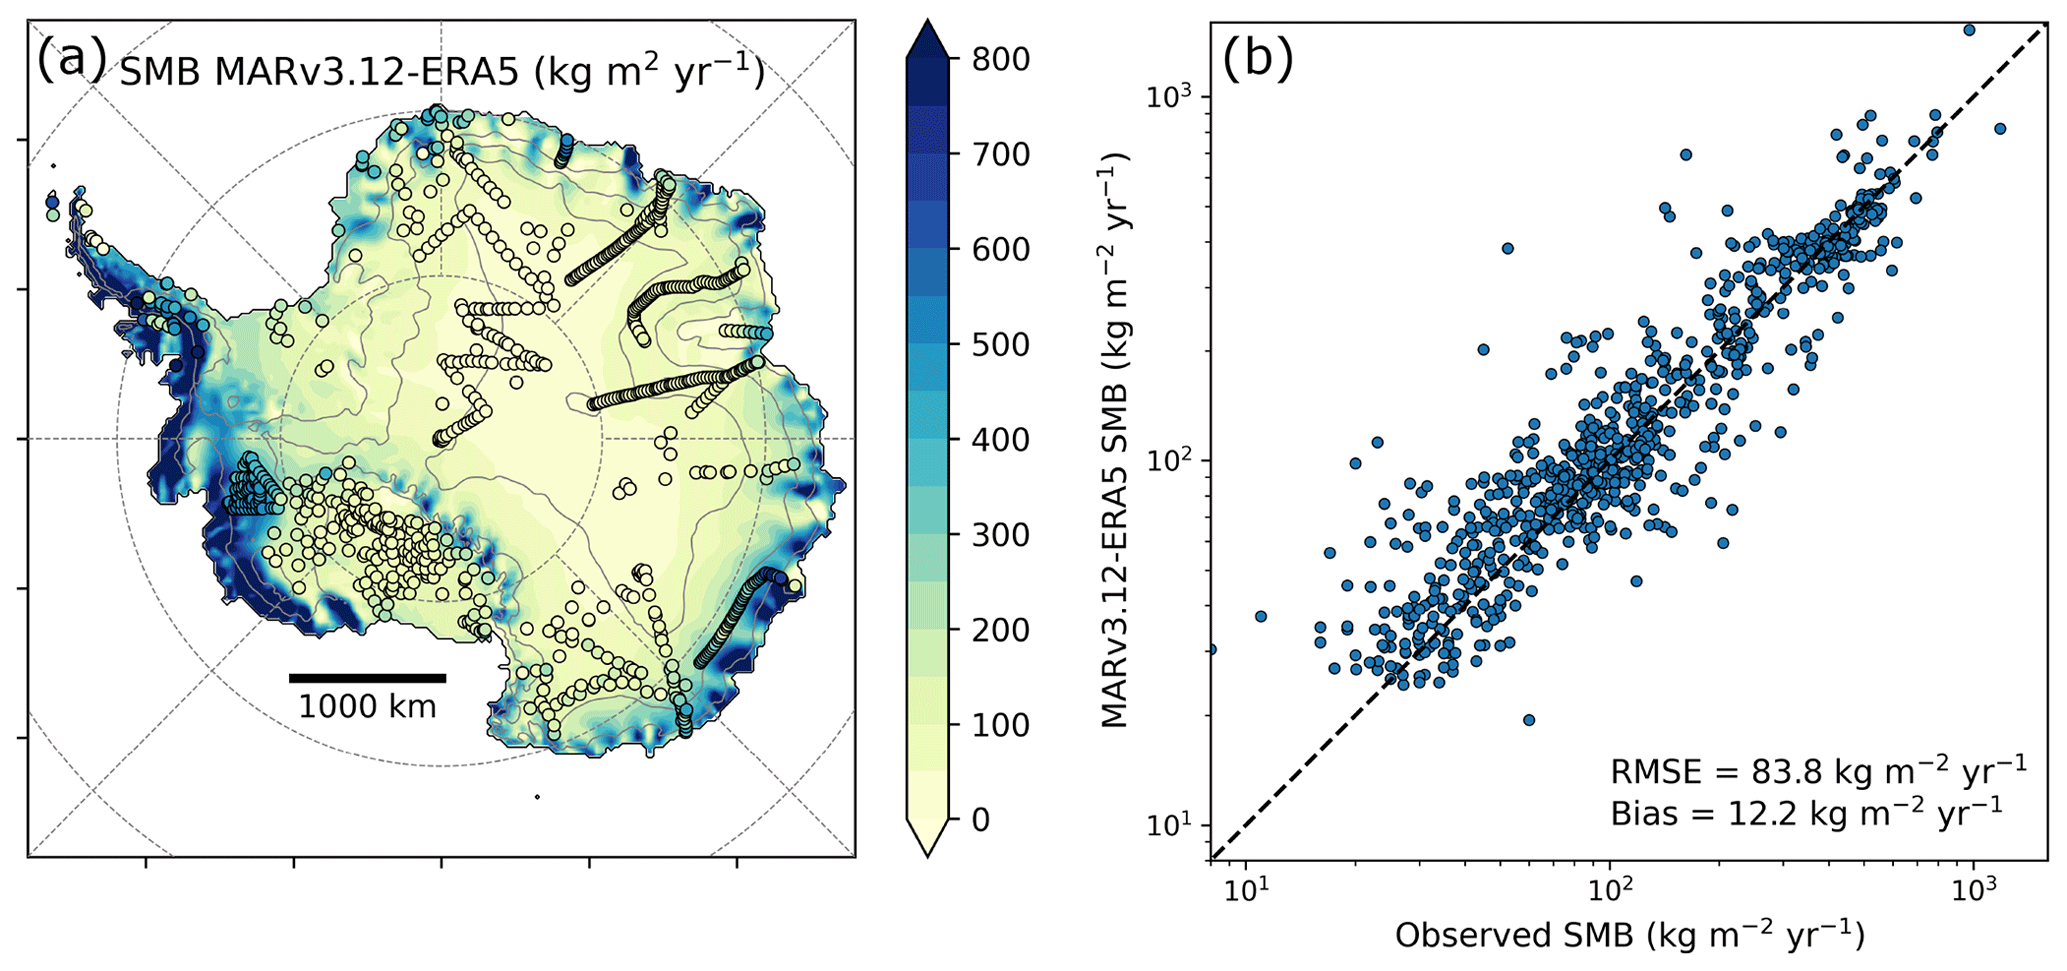
Figure A2Evaluation of the model performance in representing surface mass balance. (a) Map of surface mass balance (SMB), defined as precipitation minus evaporation and runoff in MARv2.13, compared to accumulation observations (Wang et al., 2016) represented as colour dots. (b) Log-scale scatterplot of modelled SMB vs. accumulation observations. The modelled SMB is higher than the observations by a bias of 12.2 kg m−2 yr−1.
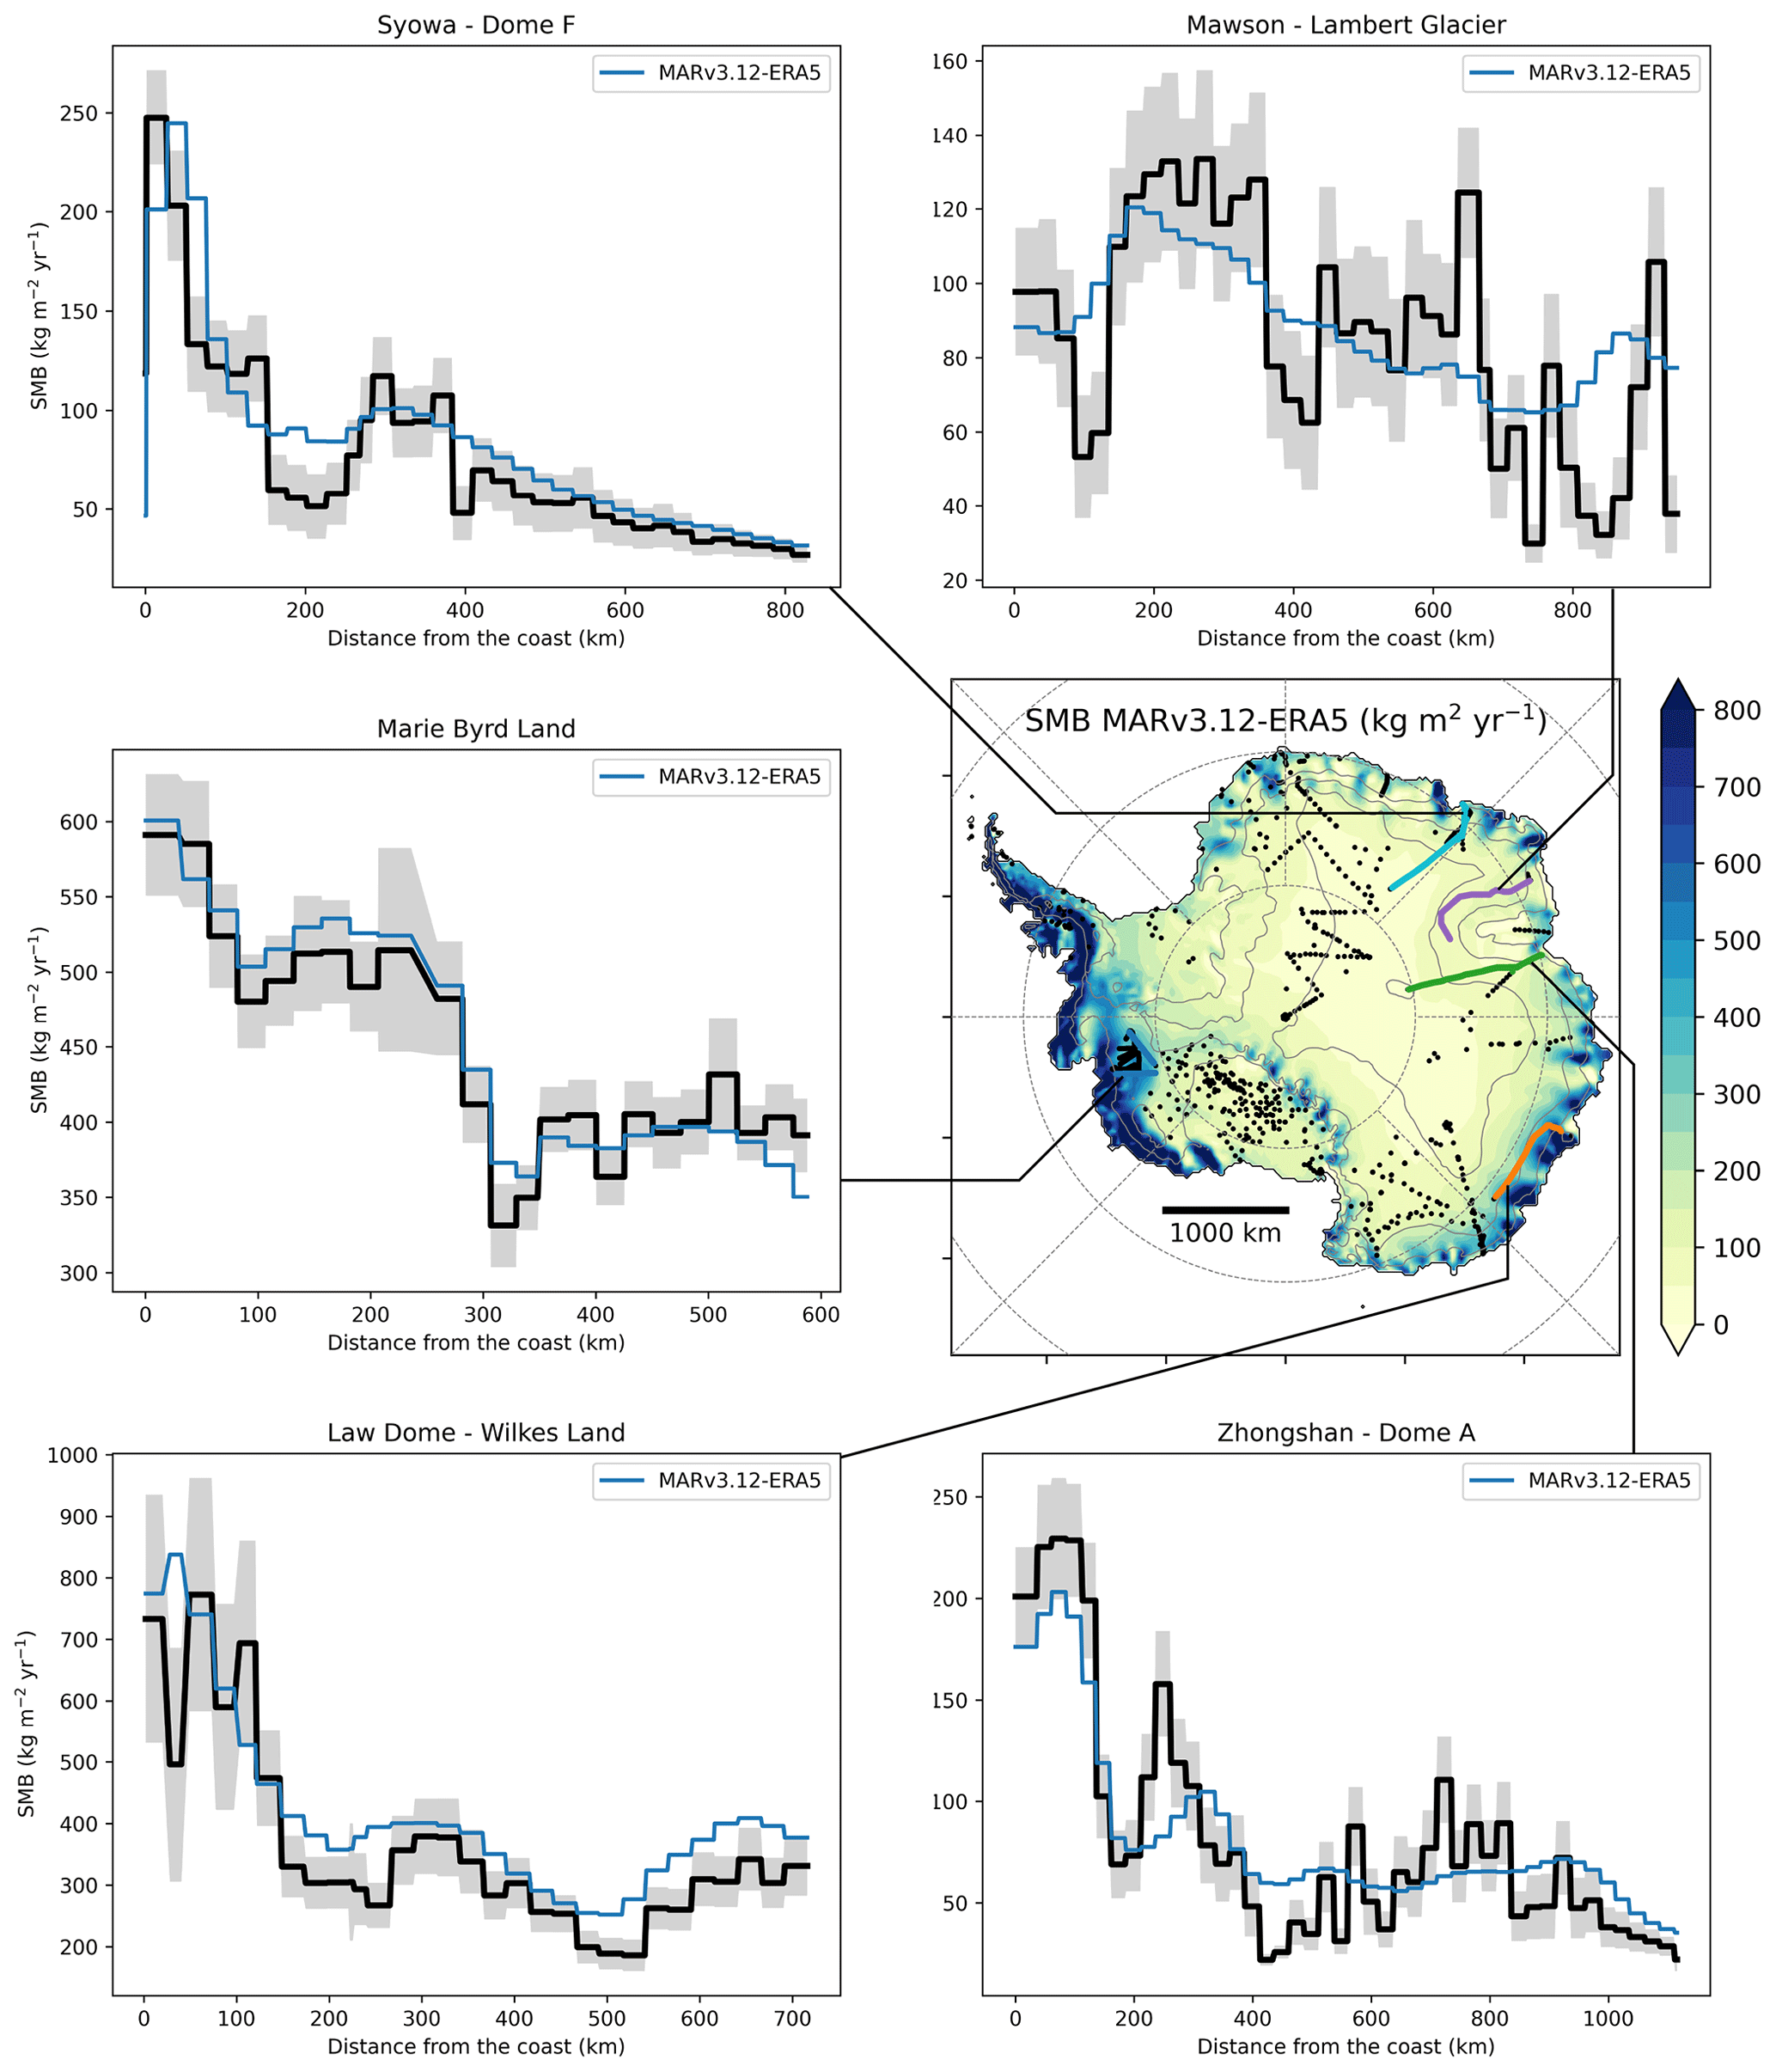
Figure A3Evaluation of the surface mass balance model performance along transects. The surface mass balance (SMB), defined as precipitation minus evaporation and runoff in MARv2.13, is compared to observations (Wang et al., 2016) along five transects represented by coloured lines on the map. MAR tends to slightly overestimate the SMB at high-elevation sites and to underestimate the variability of small-scale changes. This could be attributed to unresolved drifting snow transport in MAR due to a coarser than real topography (Agosta et al., 2019). Despite these flaws, the modelled SMB follows the observed spatial trends in accumulation remarkably well.
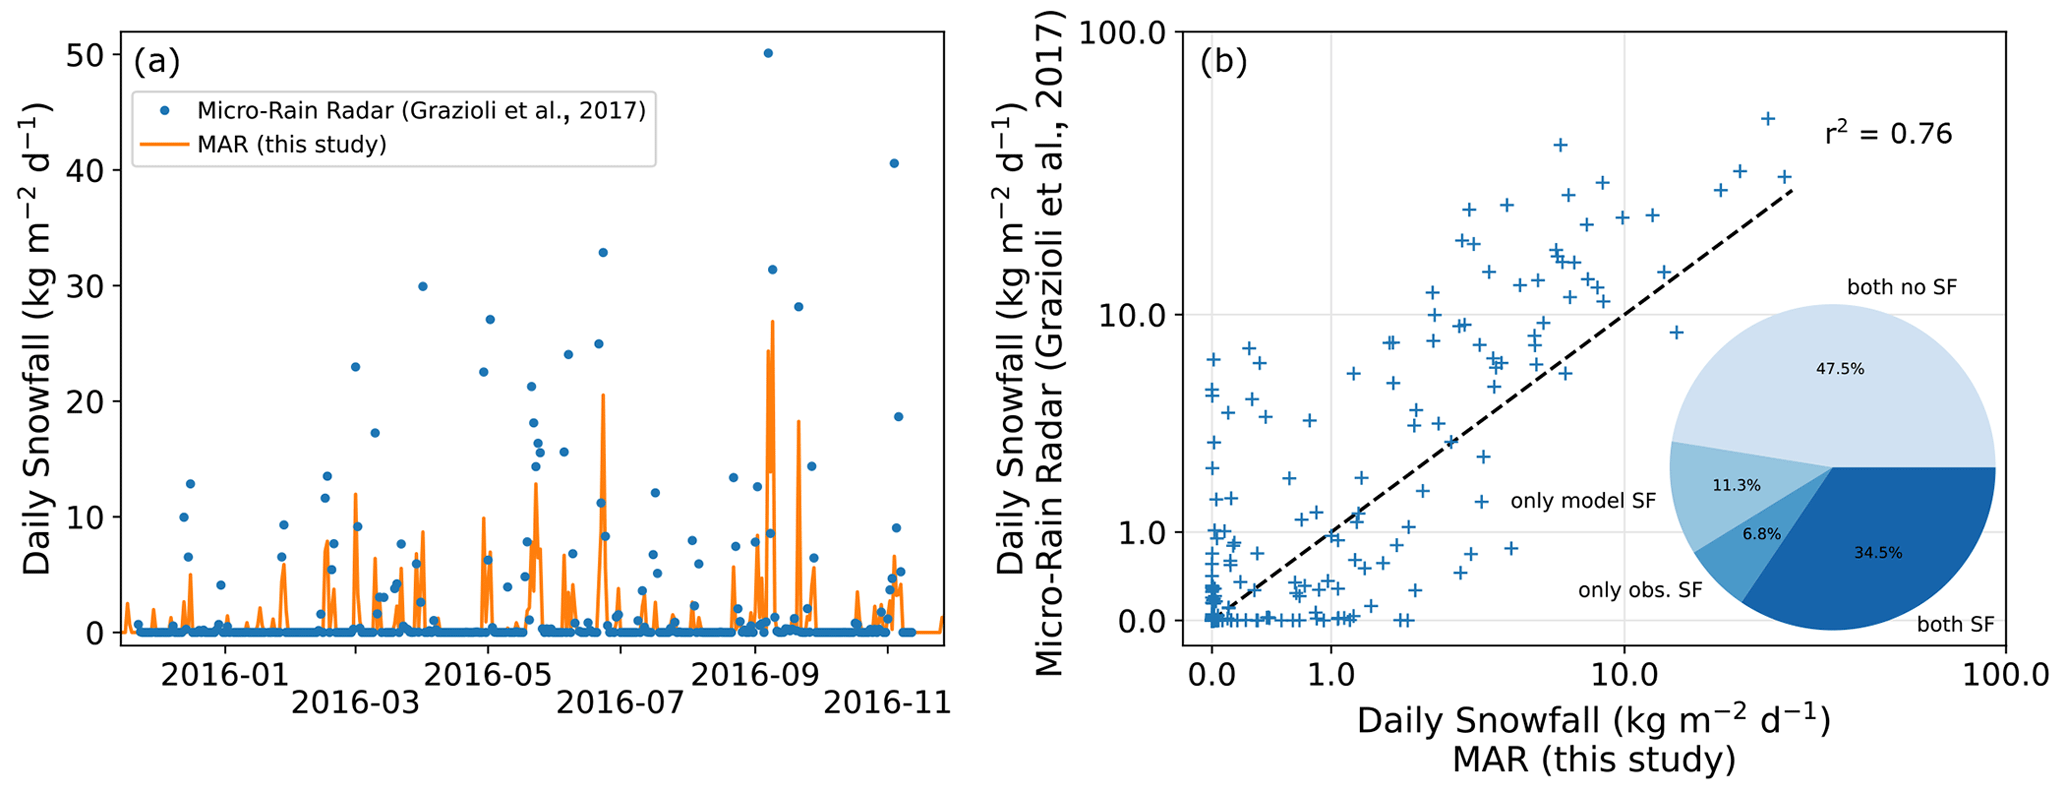
Figure A4Evaluation of the ability of MAR to match the snowfall timing observed with micro-rain radar at Dumont D'Urville station (66∘ S, 140∘ E; Grazioli et al., 2017). Micro-rain radar data indicate snow passing through the atmospheric layer 300 m above the surface, while the modelled snowfall is shown for the surface only, where some of the snow may have sublimated. (a) Time series of modelled and observed snowfall for the year 2016. (b) Scatterplot of observed vs. modelled snowfall. The pie chart indicates the percentage of days with matching or mismatching snowfall in the model and observations, with discrepancies noted for about 18 % of the days in total.
The code for the regional atmospheric climate model MAR (Modèle Atmosphérique Régional) is available upon registration at https://gitlab.com/Mar-Group/MARv3 (Fettweis et al., 2023). The Python code for computations and figure creation is available at https://doi.org/10.5281/zenodo.10369485 (Servettaz, 2023).
The MAR simulation used in this study is publicly available at https://doi.org/10.5281/zenodo.8408864 (Agosta et al., 2023).
CA and CK participated in the development of the MAR model and its application in the Antarctic region. APMS designed the study, performed formal analysis of the model outputs, and wrote the initial draft. APMS, CA, and CK created figures. AJO provided ideas and guidance for the manuscript composition. All authors contributed to writing and editing the manuscript.
The contact author has declared that none of the authors has any competing interests.
Publisher's note: Copernicus Publications remains neutral with regard to jurisdictional claims made in the text, published maps, institutional affiliations, or any other geographical representation in this paper. While Copernicus Publications makes every effort to include appropriate place names, the final responsibility lies with the authors.
This article is part of the special issue “Ice core science at the three poles (CP/TC inter-journal SI)”. It is not associated with a conference.
This research has been supported by the Japan Agency for Marine-Earth Science and Technology (grant no. YRF2021-SERVETTAZ).
This paper was edited by Tas van Ommen and reviewed by three anonymous referees.
Abram, N. J., Mulvaney, R., Vimeux, F., Phipps, S. J., Turner, J., and England, M. H.: Evolution of the Southern Annular Mode during the past millennium, Nat. Clim. Change, 4, 564–569, https://doi.org/10.1038/nclimate2235, 2014.
Agosta, C., Amory, C., Kittel, C., Orsi, A., Favier, V., Gallée, H., van den Broeke, M. R., Lenaerts, J. T. M., van Wessem, J. M., van de Berg, W. J., and Fettweis, X.: Estimation of the Antarctic surface mass balance using the regional climate model MAR (1979–2015) and identification of dominant processes, The Cryosphere, 13, 281–296, https://doi.org/10.5194/tc-13-281-2019, 2019.
Agosta, C., Servettaz, A. P. M., Kittel, C., and Orsi, A. J.: MARv312-albCor105-spinup6_daily (MARv312-albCor105-spinup6-upload1), Zenodo [data set], https://doi.org/10.5281/zenodo.8408864 (last updated: October 2023), 2023.
Antwerpen, R. M., Tedesco, M., Fettweis, X., Alexander, P., and van de Berg, W. J.: Assessing bare-ice albedo simulated by MAR over the Greenland ice sheet (2000–2021) and implications for meltwater production estimates, The Cryosphere, 16, 4185–4199, https://doi.org/10.5194/tc-16-4185-2022, 2022.
Argentini, S., Pietroni, I., Mastrantonio, G., Viola, A. P., Dargaud, G., and Petenko, I.: Observations of near surface wind speed, temperature and radiative budget at Dome C, Antarctic Plateau during 2005, Antarct. Sci., 26, 104–112, https://doi.org/10.1017/S0954102013000382, 2014.
Baas, P., van de Wiel, B. J. H., van Meijgaard, E., Vignon, E., Genthon, C., van der Linden, S. J. A., and de Roode, S. R.: Transitions in the wintertime near-surface temperature inversion at Dome C, Antarctica, Q. J. Roy. Meteor. Soc., 145, 930–946, https://doi.org/10.1002/qj.3450, 2019.
Bromwich, D. H.: Snowfall in high southern latitudes, Rev. Geophys., 26, 149–168, https://doi.org/10.1029/RG026i001p00149, 1988.
Bromwich, D. H., Fogt, R. L., Hodges, K. I., and Walsh, J. E.: A tropospheric assessment of the ERA-40, NCEP, and JRA-25 global reanalyses in the polar regions, J. Geophys. Res.-Atmos., 112, D10111, https://doi.org/10.1029/2006JD007859, 2007.
Buizert, C., Fudge, T. J., Roberts, W. H. G., Steig, E. J., Sherriff-Tadano, S., Ritz, C., Lefebvre, E., Edwards, J., Kawamura, K., Oyabu, I., Motoyama, H., Kahle, E. C., Jones, T. R., Abe-Ouchi, A., Obase, T., Martin, C., Corr, H., Severinghaus, J. P., Beaudette, R., Epifanio, J. A., Brook, E. J., Martin, K., Chappellaz, J., Aoki, S., Nakazawa, T., Sowers, T. A., Alley, R. B., Ahn, J., Sigl, M., Severi, M., Dunbar, N. W., Svensson, A., Fegyveresi, J. M., He, C., Liu, Z., Zhu, J., Otto-Bliesner, B. L., Lipenkov, V. Y., Kageyama, M., and Schwander, J.: Antarctic surface temperature and elevation during the Last Glacial Maximum, Science, 372, 1097–1101, https://doi.org/10.1126/science.abd2897, 2021.
Carleton, A. M. and Whalley, D.: Eddy transport of sensible heat and the life history of synoptic systems: A statistical analysis for the Southern Hemisphere winter, Meteorl. Atmos. Phys., 38, 140–152, https://doi.org/10.1007/BF01029778, 1988.
Casado, M., Landais, A., Picard, G., Münch, T., Laepple, T., Stenni, B., Dreossi, G., Ekaykin, A., Arnaud, L., Genthon, C., Touzeau, A., Masson-Delmotte, V., and Jouzel, J.: Archival processes of the water stable isotope signal in East Antarctic ice cores, The Cryosphere, 12, 1745–1766, https://doi.org/10.5194/tc-12-1745-2018, 2018.
Casado, M., Münch, T., and Laepple, T.: Climatic information archived in ice cores: impact of intermittency and diffusion on the recorded isotopic signal in Antarctica, Clim. Past, 16, 1581–1598, https://doi.org/10.5194/cp-16-1581-2020, 2020.
Connolley, W. M.: The Antarctic Temperature Inversion, Int. J. Climatol., 16, 1333–1342, https://doi.org/10.1002/(SICI)1097-0088(199612)16:12<1333::AID-JOC96>3.0.CO;2-6, 1996.
Dansgaard, W.: Stable isotopes in precipitation, Tellus, 16, 436–468, https://doi.org/10.1111/j.2153-3490.1964.tb00181.x, 1964.
Fettweis, X., Gallée, H., Schayes, G., Jourdain, N. C., Menegoz, M., Agosta, C., Beaumet, J., Grailet, J.-F., Amory, C., Kittel, C., Favier, V., Chekki, M., Kiepas, P., Tedstone, A., Delaygue, G., and Dietrich, L. J.: Modèle Atmosphérique Régional MAR version 3.12, Gitlab [code], https://gitlab.com/Mar-Group/MARv3 (last access: October 2023), 2023.
Fujita, K. and Abe, O.: Stable isotopes in daily precipitation at Dome Fuji, East Antarctica, Geophys. Res. Lett., 33, L18503, https://doi.org/10.1029/2006GL026936, 2006.
Gallée, H. and Gorodetskaya, I. V.: Validation of a limited area model over Dome C, Antarctic Plateau, during winter, Clim. Dynam., 34, 61–72, https://doi.org/10.1007/s00382-008-0499-y, 2010.
Ganeshan, M., Yang, Y., and Palm, S. P.: Impact of Clouds and Blowing Snow on Surface and Atmospheric Boundary Layer Properties Over Dome C, Antarctica, J. Geophys. Res.-Atmos., 127, e2022JD036801, https://doi.org/10.1029/2022JD036801, 2022.
Genthon, C., Six, D., Gallée, H., Grigioni, P., and Pellegrini, A.: Two years of atmospheric boundary layer observations on a 45-m tower at Dome C on the Antarctic plateau, J. Geophys. Res.-Atmos., 118, 3218–3232, https://doi.org/10.1002/jgrd.50128, 2013.
Genthon, C., Veron, D., Vignon, E., Six, D., Dufresne, J.-L., Madeleine, J.-B., Sultan, E., and Forget, F.: 10 years of temperature and wind observation on a 45 m tower at Dome C, East Antarctic plateau, Earth Syst. Sci. Data, 13, 5731–5746, https://doi.org/10.5194/essd-13-5731-2021, 2021.
Giovinetto, M. B., Bromwich, D. H., and Wendler, G.: Atmospheric net transport of water vapor and latent heat across 70∘ S, J. Geophys. Res.-Atmos., 97, 917–930, https://doi.org/10.1029/91JD02485, 1992.
Gossart, A., Helsen, S., Lenaerts, J. T. M., Broucke, S. V., van Lipzig, N. P. M., and Souverijns, N.: An Evaluation of Surface Climatology in State-of-the-Art Reanalyses over the Antarctic Ice Sheet, J. Climate, 32, 6899–6915, https://doi.org/10.1175/JCLI-D-19-0030.1, 2019.
Goursaud, S., Masson-Delmotte, V., Favier, V., Orsi, A., and Werner, M.: Water stable isotope spatio-temporal variability in Antarctica in 1960–2013: observations and simulations from the ECHAM5-wiso atmospheric general circulation model, Clim. Past, 14, 923–946, https://doi.org/10.5194/cp-14-923-2018, 2018.
Grazioli, J., Genthon, C., Boudevillain, B., Duran-Alarcon, C., Del Guasta, M., Madeleine, J.-B., and Berne, A.: Measurements of precipitation in Dumont d'Urville, Adélie Land, East Antarctica, The Cryosphere, 11, 1797–1811, https://doi.org/10.5194/tc-11-1797-2017, 2017.
Heinemann, G., Glaw, L., and Willmes, S.: A Satellite-Based Climatology of Wind-Induced Surface Temperature Anomalies for the Antarctic, Remote Sensing, 11, 1539, https://doi.org/10.3390/rs11131539, 2019.
Hirasawa, N., Nakamura, H., and Yamanouchi, T.: Abrupt changes in meteorological conditions observed at an inland Antarctic Station in association with wintertime blocking, Geophys. Res. Lett., 27, 1911–1914, https://doi.org/10.1029/1999GL011039, 2000.
Holloway, M. D., Sime, L. C., Singarayer, J. S., Tindall, J. C., Bunch, P., and Valdes, P. J.: Antarctic last interglacial isotope peak in response to sea ice retreat not ice-sheet collapse, Nat. Commun., 7, 12293, https://doi.org/10.1038/ncomms12293, 2016.
Hudson, S. R. and Brandt, R. E.: A Look at the Surface-Based Temperature Inversion on the Antarctic Plateau, J. Climate, 18, 1673–1696, https://doi.org/10.1175/JCLI3360.1, 2005.
Hughes, A. G., Wahl, S., Jones, T. R., Zuhr, A., Hörhold, M., White, J. W. C., and Steen-Larsen, H. C.: The role of sublimation as a driver of climate signals in the water isotope content of surface snow: laboratory and field experimental results, The Cryosphere, 15, 4949–4974, https://doi.org/10.5194/tc-15-4949-2021, 2021.
Jones, J. M., Gille, S. T., Goosse, H., Abram, N. J., Canziani, P. O., Charman, D. J., Clem, K. R., Crosta, X., de Lavergne, C., Eisenman, I., England, M. H., Fogt, R. L., Frankcombe, L. M., Marshall, G. J., Masson-Delmotte, V., Morrison, A. K., Orsi, A. J., Raphael, M. N., Renwick, J. A., Schneider, D. P., Simpkins, G. R., Steig, E. J., Stenni, B., Swingedouw, D., and Vance, T. R.: Assessing recent trends in high-latitude Southern Hemisphere surface climate, Nat. Clim. Change, 6, 917–926, https://doi.org/10.1038/nclimate3103, 2016.
Jones, T. R., Cuffey, K. M., Roberts, W. H. G., Markle, B. R., Steig, E. J., Stevens, C. M., Valdes, P. J., Fudge, T. J., Sigl, M., Hughes, A. G., Morris, V., Vaughn, B. H., Garland, J., Vinther, B. M., Rozmiarek, K. S., Brashear, C. A., and White, J. W. C.: Seasonal temperatures in West Antarctica during the Holocene, Nature, 613, 292–297, https://doi.org/10.1038/s41586-022-05411-8, 2023.
Jouzel, J. and Merlivat, L.: Deuterium and oxygen 18 in precipitation: Modeling of the isotopic effects during snow formation, J. Geophys. Res., 89, 11749, https://doi.org/10.1029/JD089iD07p11749, 1984.
Jouzel, J., Vimeux, F., Caillon, N., Delaygue, G., Hoffmann, G., Masson-Delmotte, V., and Parrenin, F.: Magnitude of isotope/temperature scaling for interpretation of central Antarctic ice cores, J. Geophys. Res.-Atmos., 108, 4361–4372, https://doi.org/10.1029/2002JD002677, 2003.
Jouzel, J., Masson-Delmotte, V., Cattani, O., Dreyfus, G., Falourd, S., Hoffmann, G., Minster, B., Nouet, J., Barnola, J. M., Chappellaz, J., Fischer, H., Gallet, J. C., Johnsen, S. J., Leuenberger, M., Loulergue, L., Luethi, D., Oerter, H., Parrenin, F., Raisbeck, G., Raynaud, D., Schilt, A., Schwander, J., Selmo, E., Souchez, R., Spahni, R., Stauffer, B., Steffensen, J. P., Stenni, B., Stocker, T. F., Tison, J. L., Werner, M., and Wolff, E. W.: Orbital and Millennial Antarctic Climate Variability over the Past 800,000 Years, Science, 317, 793–796, https://doi.org/10.1126/science.1141038, 2007.
Kino, K., Okazaki, A., Cauquoin, A., and Yoshimura, K.: Contribution of the Southern Annular Mode to Variations in Water Isotopes of Daily Precipitation at Dome Fuji, East Antarctica, J. Geophys. Res.-Atmos., 126, e2021JD035397, https://doi.org/10.1029/2021JD035397, 2021.
Kittel, C., Amory, C., Agosta, C., Jourdain, N. C., Hofer, S., Delhasse, A., Doutreloup, S., Huot, P.-V., Lang, C., Fichefet, T., and Fettweis, X.: Diverging future surface mass balance between the Antarctic ice shelves and grounded ice sheet, The Cryosphere, 15, 1215–1236, https://doi.org/10.5194/tc-15-1215-2021, 2021.
Kittel, C., Amory, C., Hofer, S., Agosta, C., Jourdain, N. C., Gilbert, E., Le Toumelin, L., Vignon, É., Gallée, H., and Fettweis, X.: Clouds drive differences in future surface melt over the Antarctic ice shelves, The Cryosphere, 16, 2655–2669, https://doi.org/10.5194/tc-16-2655-2022, 2022.
Klein, F., Abram, N. J., Curran, M. A. J., Goosse, H., Goursaud, S., Masson-Delmotte, V., Moy, A., Neukom, R., Orsi, A., Sjolte, J., Steiger, N., Stenni, B., and Werner, M.: Assessing the robustness of Antarctic temperature reconstructions over the past 2 millennia using pseudoproxy and data assimilation experiments, Clim. Past, 15, 661–684, https://doi.org/10.5194/cp-15-661-2019, 2019.
Krinner, G., Magand, O., Simmonds, I., Genthon, C., and Dufresne, J.-L.: Simulated Antarctic precipitation and surface mass balance at the end of the twentieth and twenty-first centuries, Clim. Dynam., 28, 215–230, https://doi.org/10.1007/s00382-006-0177-x, 2006.
Liu, Z., He, C., Yan, M., Buizert, C., Otto-Bliesner, B. L., Lu, F., and Zeng, C.: Reconstruction of Past Antarctic Temperature Using Present Seasonal δ18O–Inversion Layer Temperature: Unified Slope Equations and Applications, J. Climate, 36, 2933–2957, https://doi.org/10.1175/JCLI-D-22-0012.1, 2023.
Markle, B. R. and Steig, E. J.: Improving temperature reconstructions from ice-core water-isotope records, Clim. Past, 18, 1321–1368, https://doi.org/10.5194/cp-18-1321-2022, 2022.
Marshall, G. J.: On the annual and semi-annual cycles of precipitation across Antarctica, Int. J. Climatol., 29, 2298–2308, https://doi.org/10.1002/joc.1810, 2009.
Marshall, G. J. and Thompson, D. W. J.: The signatures of large-scale patterns of atmospheric variability in Antarctic surface temperatures: Antarctic Temperatures, J. Geophys. Res.-Atmos., 121, 3276–3289, https://doi.org/10.1002/2015JD024665, 2016.
Masson-Delmotte, V., Buiron, D., Ekaykin, A., Frezzotti, M., Gallée, H., Jouzel, J., Krinner, G., Landais, A., Motoyama, H., Oerter, H., Pol, K., Pollard, D., Ritz, C., Schlosser, E., Sime, L. C., Sodemann, H., Stenni, B., Uemura, R., and Vimeux, F.: A comparison of the present and last interglacial periods in six Antarctic ice cores, Clim. Past, 7, 397–423, https://doi.org/10.5194/cp-7-397-2011, 2011.
Mottram, R., Hansen, N., Kittel, C., van Wessem, J. M., Agosta, C., Amory, C., Boberg, F., van de Berg, W. J., Fettweis, X., Gossart, A., van Lipzig, N. P. M., van Meijgaard, E., Orr, A., Phillips, T., Webster, S., Simonsen, S. B., and Souverijns, N.: What is the surface mass balance of Antarctica? An intercomparison of regional climate model estimates, The Cryosphere, 15, 3751–3784, https://doi.org/10.5194/tc-15-3751-2021, 2021.
Münch, T., Kipfstuhl, S., Freitag, J., Meyer, H., and Laepple, T.: Constraints on post-depositional isotope modifications in East Antarctic firn from analysing temporal changes of isotope profiles, The Cryosphere, 11, 2175–2188, https://doi.org/10.5194/tc-11-2175-2017, 2017.
Münch, T., Werner, M., and Laepple, T.: How precipitation intermittency sets an optimal sampling distance for temperature reconstructions from Antarctic ice cores, Clim. Past, 17, 1587–1605, https://doi.org/10.5194/cp-17-1587-2021, 2021.
Nardino, M. and Georgiadis, T.: Cloud type and cloud cover effects on the surface radiative balance at several Polar sites, Theor. Appl. Climatol., 74, 203–215, https://doi.org/10.1007/s00704-002-0708-2, 2003.
Palerme, C., Claud, C., Dufour, A., Genthon, C., Wood, N. B., and L'Ecuyer, T.: Evaluation of Antarctic snowfall in global meteorological reanalyses, Atmos. Res., 190, 104–112, https://doi.org/10.1016/j.atmosres.2017.02.015, 2017.
Persson, A., Langen, P. L., Ditlevsen, P., and Vinther, B. M.: The influence of precipitation weighting on interannual variability of stable water isotopes in Greenland, J. Geophys. Res., 116, D20120, https://doi.org/10.1029/2010JD015517, 2011.
Ricaud, P., Bazile, E., del Guasta, M., Lanconelli, C., Grigioni, P., and Mahjoub, A.: Genesis of diamond dust, ice fog and thick cloud episodes observed and modelled above Dome C, Antarctica, Atmos. Chem. Phys., 17, 5221–5237, https://doi.org/10.5194/acp-17-5221-2017, 2017.
Scarchilli, C., Frezzotti, M., and Ruti, P. M.: Snow precipitation at four ice core sites in East Antarctica: provenance, seasonality and blocking factors, Clim. Dynam., 37, 2107–2125, https://doi.org/10.1007/s00382-010-0946-4, 2011.
Schlosser, E., Stenni, B., Valt, M., Cagnati, A., Powers, J. G., Manning, K. W., Raphael, M., and Duda, M. G.: Precipitation and synoptic regime in two extreme years 2009 and 2010 at Dome C, Antarctica – implications for ice core interpretation, Atmos. Chem. Phys., 16, 4757–4770, https://doi.org/10.5194/acp-16-4757-2016, 2016.
Servettaz, A. P. M., Orsi, A. J., Curran, M. A. J., Moy, A. D., Landais, A., Agosta, C., Winton, V. H. L., Touzeau, A., McConnell, J. R., Werner, M., and Baroni, M.: Snowfall and Water Stable Isotope Variability in East Antarctica Controlled by Warm Synoptic Events, J. Geophys. Res.-Atmos., 125, e2020JD032863, https://doi.org/10.1029/2020JD032863, 2020.
Servettaz, A. P. M.: Figure notebook for “Control of the temperature signal in Antarctic proxies by snowfall dynamics” (Version 1.0), Zenodo [code], https://doi.org/10.5281/zenodo.10369485 (last updated: December 2023), 2023.
Sime, L. C., Tindall, J. C., Wolff, E. W., Connolley, W. M., and Valdes, P. J.: Antarctic isotopic thermometer during a CO2 forced warming event, J. Geophys. Res.-Atmos., 113, D24119, https://doi.org/10.1029/2008JD010395, 2008.
Sime, L. C., Marshall, G. J., Mulvaney, R., and Thomas, E. R.: Interpreting temperature information from ice cores along the Antarctic Peninsula: ERA40 analysis, Geophys. Res. Lett., 36, L18801, https://doi.org/10.1029/2009GL038982, 2009a.
Sime, L. C., Wolff, E. W., Oliver, K. I. C., and Tindall, J. C.: Evidence for warmer interglacials in East Antarctic ice cores, Nature, 462, 342–345, https://doi.org/10.1038/nature08564, 2009b.
Sime, L. C., Lang, N., Thomas, E. R., Benton, A. K., and Mulvaney, R.: On high-resolution sampling of short ice cores: Dating and temperature information recovery from Antarctic Peninsula virtual cores, J. Geophys. Res.-Atmos., 116, D20117, https://doi.org/10.1029/2011JD015894, 2011.
Steen-Larsen, H. C., Masson-Delmotte, V., Hirabayashi, M., Winkler, R., Satow, K., Prié, F., Bayou, N., Brun, E., Cuffey, K. M., Dahl-Jensen, D., Dumont, M., Guillevic, M., Kipfstuhl, S., Landais, A., Popp, T., Risi, C., Steffen, K., Stenni, B., and Sveinbjörnsdottír, A. E.: What controls the isotopic composition of Greenland surface snow?, Clim. Past, 10, 377–392, https://doi.org/10.5194/cp-10-377-2014, 2014.
Stenni, B., Scarchilli, C., Masson-Delmotte, V., Schlosser, E., Ciardini, V., Dreossi, G., Grigioni, P., Bonazza, M., Cagnati, A., Karlicek, D., Risi, C., Udisti, R., and Valt, M.: Three-year monitoring of stable isotopes of precipitation at Concordia Station, East Antarctica, The Cryosphere, 10, 2415–2428, https://doi.org/10.5194/tc-10-2415-2016, 2016.
Stenni, B., Curran, M. A. J., Abram, N. J., Orsi, A., Goursaud, S., Masson-Delmotte, V., Neukom, R., Goosse, H., Divine, D., van Ommen, T., Steig, E. J., Dixon, D. A., Thomas, E. R., Bertler, N. A. N., Isaksson, E., Ekaykin, A., Werner, M., and Frezzotti, M.: Antarctic climate variability on regional and continental scales over the last 2000 years, Clim. Past, 13, 1609–1634, https://doi.org/10.5194/cp-13-1609-2017, 2017.
Sturm, C., Zhang, Q., and Noone, D.: An introduction to stable water isotopes in climate models: benefits of forward proxy modelling for paleoclimatology, Clim. Past, 6, 115–129, https://doi.org/10.5194/cp-6-115-2010, 2010.
Touzeau, A., Landais, A., Stenni, B., Uemura, R., Fukui, K., Fujita, S., Guilbaud, S., Ekaykin, A., Casado, M., Barkan, E., Luz, B., Magand, O., Teste, G., Le Meur, E., Baroni, M., Savarino, J., Bourgeois, I., and Risi, C.: Acquisition of isotopic composition for surface snow in East Antarctica and the links to climatic parameters, The Cryosphere, 10, 837–852, https://doi.org/10.5194/tc-10-837-2016, 2016.
Turner, J., Phillips, T., Thamban, M., Rahaman, W., Marshall, G. J., Wille, J. D., Favier, V., Winton, V. H. L., Thomas, E., Wang, Z., Broeke, M. van den, Hosking, J. S., and Lachlan-Cope, T.: The Dominant Role of Extreme Precipitation Events in Antarctic Snowfall Variability, Geophys. Res. Lett., 46, 3502–3511, https://doi.org/10.1029/2018GL081517, 2019.
Uotila, P., Vihma, T., Pezza, A. B., Simmonds, I., Keay, K., and Lynch, A. H.: Relationships between Antarctic cyclones and surface conditions as derived from high-resolution numerical weather prediction data, J. Geophys. Res.-Atmos., 116, D07109, https://doi.org/10.1029/2010JD015358, 2011.
Van Den Broeke, M., Reijmer, C., Van As, D., and Boot, W.: Daily cycle of the surface energy balance in Antarctica and the influence of clouds, Int. J. Climatol., 26, 1587–1605, https://doi.org/10.1002/joc.1323, 2006.
Vignon, E., van de Wiel, B. J. H., van Hooijdonk, I. G. S., Genthon, C., van der Linden, S. J. A., van Hooft, J. A., Baas, P., Maurel, W., Traullé, O., and Casasanta, G.: Stable boundary-layer regimes at Dome C, Antarctica: observation and analysis, Q. J. Roy. Meteor. Soc., 143, 1241–1253, https://doi.org/10.1002/qj.2998, 2017.
Vignon, É., Traullé, O., and Berne, A.: On the fine vertical structure of the low troposphere over the coastal margins of East Antarctica, Atmos. Chem. Phys., 19, 4659–4683, https://doi.org/10.5194/acp-19-4659-2019, 2019.
Wang, Y., Ding, M., van Wessem, J. M., Schlosser, E., Altnau, S., van den Broeke, M. R., Lenaerts, J. T. M., Thomas, E. R., Isaksson, E., Wang, J., and Sun, W.: A Comparison of Antarctic Ice Sheet Surface Mass Balance from Atmospheric Climate Models and In Situ Observations, J. Climate, 29, 5317–5337, https://doi.org/10.1175/JCLI-D-15-0642.1, 2016.
Werner, M., Mikolajewicz, U., Heimann, M., and Hoffmann, G.: Borehole versus isotope temperatures on Greenland: Seasonality does matter, Geophys. Res. Lett., 27, 723–726, https://doi.org/10.1029/1999GL006075, 2000.
Wille, J. D., Favier, V., Gorodetskaya, I. V., Agosta, C., Kittel, C., Beeman, J. C., Jourdain, N. C., Lenaerts, J. T. M., and Codron, F.: Antarctic Atmospheric River Climatology and Precipitation Impacts, J. Geophys. Res.-Atmos., 126, e2020JD033788, https://doi.org/10.1029/2020JD033788, 2021.