the Creative Commons Attribution 4.0 License.
the Creative Commons Attribution 4.0 License.
 | 06 Dec 2023
Brief communication: Surface energy balance differences over Greenland between ERA5 and ERA-Interim
Christian B. Rodehacke
Gerrit Lohmann
We compare the main atmospheric drivers of the melt season over the Greenland Ice Sheet (GrIS) in ERA5 and ERA-Interim (ERAI) in their overlapping period 1979–2018. In summer, ERA5 differs significantly from ERAI, especially in the melt regions. Small-scale ERA5 − ERAI differences near the ice sheet's margins and over steep slopes can be explained by the different resolution, while the large-scale differences indicate a different representation of physical processes in the two reanalyses: averaged over the lower parts of the GrIS, the mean near-surface air temperature is 1 K lower, while the mean downward shortwave radiation at the surface is on average 15 W m−2 higher than in ERAI. Comparison with observational weather station data shows a significant warm bias in ERAI and, for ERA5, a significant positive bias in downward shortwave radiation. Consequently, methods that previously estimated the GrIS surface mass balance from the ERAI surface energy balance need to be carefully recalibrated before converting to ERA5 forcing.
- Article
(2505 KB) - Full-text XML
-
Supplement
(2593 KB) - BibTeX
- EndNote


Greenland summer temperatures are experiencing a persistent positive trend. In coastal instrumental temperature records, Hanna et al. (2021) diagnose a significant 1.7 K increase from 1991 to 2019, and an ensemble mean of SSP5-8.5 projections yields a warming of 5.3 K from the first to last 2 decades of the 21st century. Considering a wider range of scenarios, projections generally indicate warming over Greenland, which is weaker than across the remaining Arctic, slightly stronger than the global trends, and mostly comparable to trends over Northern Hemisphere land surfaces (Lee et al., 2021, Fig. 4.19). The associated increase in surface melt and runoff leads to a reduction in the Greenland Ice Sheet (GrIS) surface mass balance (SMB) that ultimately raises the global sea level. According to the conservative estimate of Hanna et al. (2021), the equivalent sea-level rise amounts to more than 10 cm by the end of this century for the SSP5-8.5 scenario. Surface mass and energy balance models (EBMs hereafter), such as the Bergen Snow Simulator (BESSI) (Born et al., 2019) or the diurnal Energy Balance Model (dEBM) (Krebs-Kanzow et al., 2021), represent the key physical processes that determine the surface mass balance, and they can be used to directly infer changes in SMB from basic surface climate variables, which typically include surface downward shortwave and longwave radiation, near-surface air temperature, and precipitation.
EBMs provide a low-cost alternative to computationally intensive regional climate model simulations to downscale the SMB and reproduce the narrow ablation zone along the lower-elevation ice sheet margins. In a model intercomparison (Fettweis et al., 2020), EBMs were shown to be able to reconstruct the 1979–2012 SMB of the GrIS from relatively coarse-resolution ERA-Interim climate reanalysis, even though EBMs proved to be somewhat less skillful than regional climate models (RCMs), which may be partly related to the relatively coarse resolution of the ERA-Interim forcing (approximately 79 km) compared to the higher resolution of participating RCMs of up to 5.5 km. However, ERA-Interim was suspended in 2018 and was replaced by the ongoing ERA5 reanalysis product, which provides a higher horizontal resolution (approximately 30 km) and dates back further to 1940. Thus, the potential and relevance of EBMs have increased when used in combination with this higher-resolution climate forcing now available.
It is, therefore, desirable to update current SMB simulations based on EBMs to ERA5 forcing and, where necessary, to adjust existing EBM parameters, which will require an assessment of the differences between the two data products due to changes in the near-surface radiation scheme, cloud scheme, or surface boundary layer. To this end, we compare key climate properties between ERA5 and ERA-Interim to complement previous comparisons (Wang et al., 2019; King et al., 2022; Delhasse et al., 2020) focusing on the Greenland (summer) surface energy balance.
We use two global atmospheric reanalysis datasets produced by the European Centre for Medium-Range Weather Forecasts (ECMWF). The ECMWF Reanalysis – Interim (ERA-Interim, hereafter ERAI) covers the period from January 1979 to August 2019 and has a spatial resolution of about 80 km with 60 vertical levels over Greenland. The more recent ECMWF Reanalysis v5 (ERA5) begins in January 1940, runs until the present, and has a finer resolution of about 30 km with 137 vertical levels. We compare climate properties that primarily control surface ablation over the Greenland Ice Sheet (GrIS) for those years entirely covered by both the ERA-Interim and ERA5 datasets, i.e., the joint period 1979–2018. Specifically, we compare the 2 m air temperature (T2m), downward shortwave radiation at the surface (SWD), effective atmospheric emissivity (ϵ), and downward longwave radiation at the surface (LWD).
The analysis focuses on the summer months (June, July, and August, hereafter JJA) and the lower parts of the ice sheets between sea level and 2000 m elevation. The effective atmospheric emissivity ϵ is derived from the LWD and T2m according to the Stefan–Boltzmann law:
where σ is the Stefan–Boltzmann constant.
For these variables, we analyze mean differences (Fig. 1) and standard deviations (Fig. S1 in the Supplement) of corresponding ERA5 − ERAI differences for the summers in the 1979–2018 overlap period. A corresponding comparison of the annual fields can be found in the Supplement (Figs. S2 and S3). All climate variables considered were bilinearly interpolated to the 1 km grid used by the Ice Sheet Model Intercomparison Project for CMIP6 (ISMIP6) (note that effective emissivity is calculated from the coarse-resolution LWD and T2m and is then interpolated).
We also scale temperatures with respect to a common orography, the 1 km ISMIP6 orography hismip (Morlighem et al., 2014), to reduce those temperature differences which are related to differences in topography between both reanalyses (resulting from the higher horizontal resolution in ERA5). To this end, a lapse rate of K m−1 is applied to adjust ERA5 and ERAI 2 m air temperatures:
where T2mint and hint are the interpolated near-surface air temperature and surface elevation from the respective reanalysis datasets (i.e., ERA5 or ERA-Interim). The applied lapse rate is at the low end of summer lapse rates over Greenland slopes estimated from ERA5 and ERA-Interim 2 m air temperatures, which typically vary between −5 K km−1 and −7 K km−1 (Fig. S4), in agreement with climate simulations (Erokhina et al., 2017). A comparison of the mean T2m ERA5 − ERAI differences for different lapse rate choices (0, −5, −7, −10 K km−1) is provided in the Supplement (Figs. S5, S6).
To also compare the reanalysis data to observational data, we bilinearly interpolate T2m, SWD, and emissivity (ϵ) and LWD from the 1 km grid to locations of automatic weather stations (AWSs) from the Programme for Monitoring of the Greenland Ice Sheet and Greenland Climate Network (PROMICE) (Fausto et al., 2021; Ahlstrom et al., 2008). We consistently apply the lapse rate correction of −5 K km−1 to downscale T2m to the altitude of the weather stations and compare it to monthly mean near-surface air temperature measurements. A comparison with uncorrected temperatures is given in the Supplement (Fig. S7). This comparison with observational data is similar, but not identical, to parts of Delhasse et al. (2020) because we use a different interpolation strategy and apply a lapse rate correction to account for altitude differences.
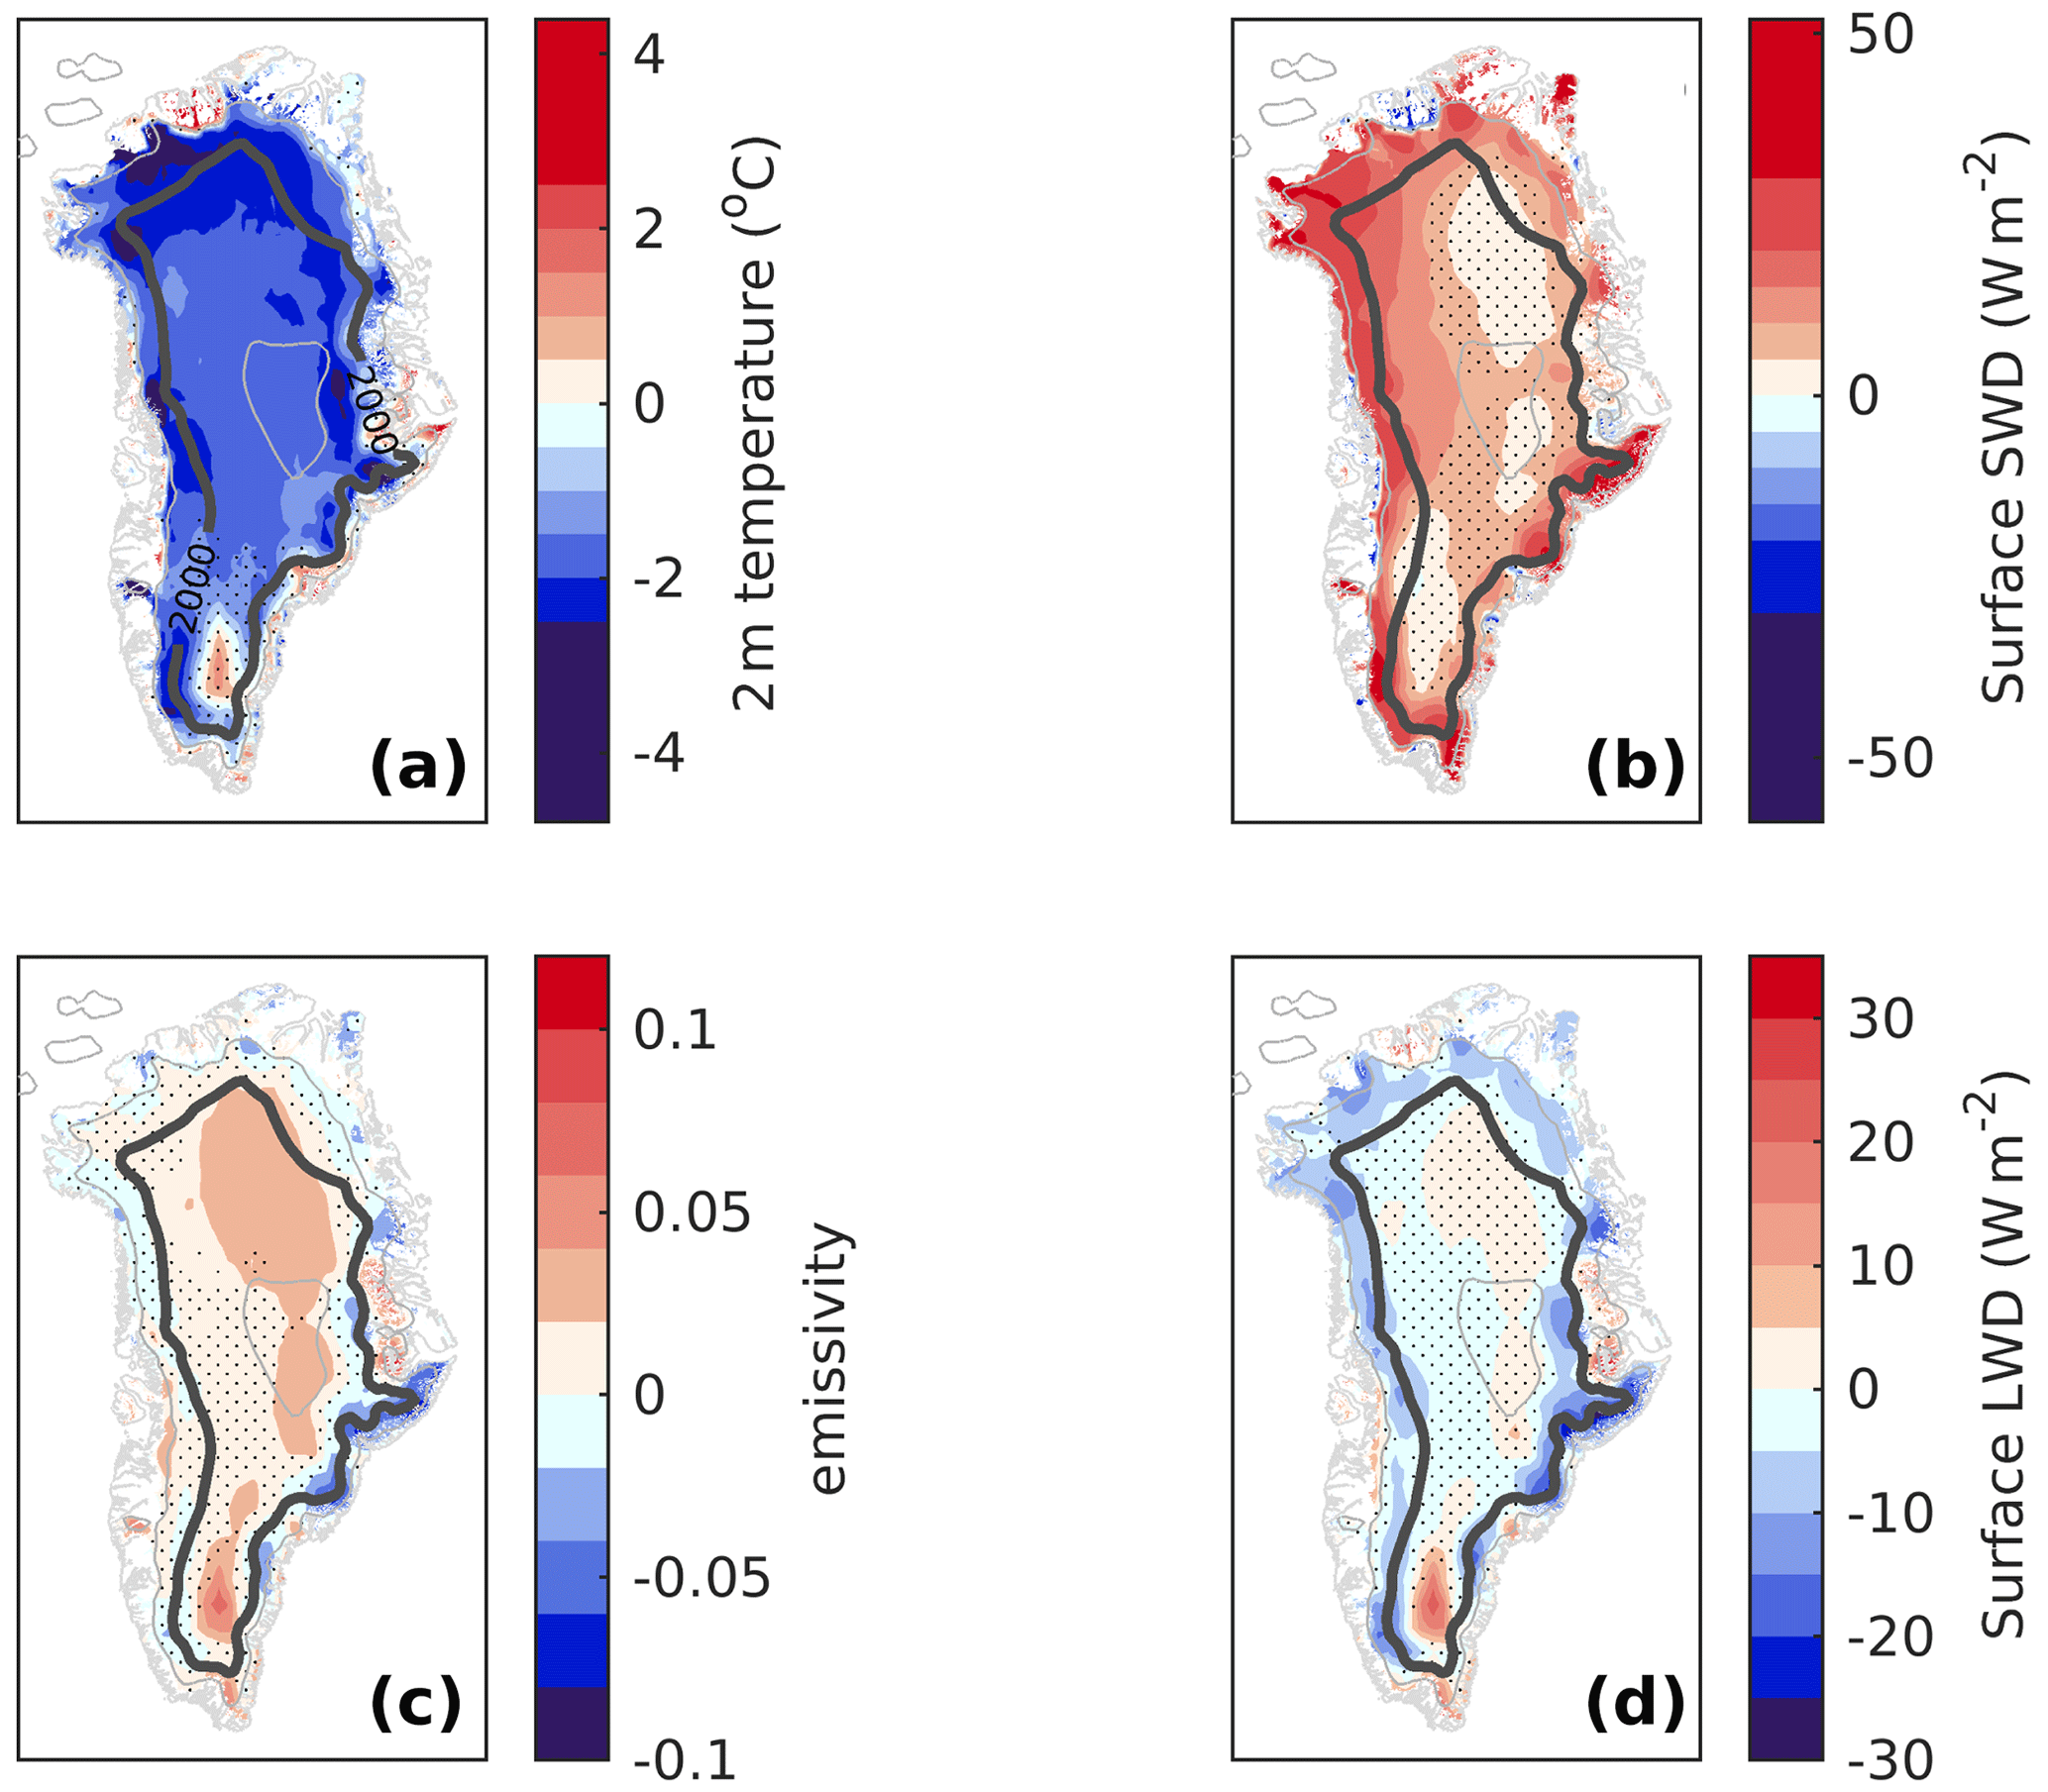
Figure 1The 1979–2018 mean of the differences between ERA5 and ERAI for the summer seasons (i.e., June, July, and August, JJA). The four panels show lapse-rate-corrected 2 m air temperature (a), downward shortwave radiation (b), emissivity (c), and downward longwave radiation (d). Stippling indicates regions where the temporal mean of differences is smaller than 2 standard deviations of its interannual variability. The solid gray line depicts the elevation of 2000 m.
During the summer months, ERA5 and ERAI exhibit pronounced differences in the variables considered (Fig. 1). Over the entire 40-year period, mean summer T2m in ERA5 is more than 1 K lower than in ERAI over most parts of the ice sheet, except for the southeastern margins and the southern dome region. The mean difference exceeds 2 standard deviations of its interannual variability almost everywhere north of 66∘ N. The applied lapse rate correction of −5 K km−1 appears to be well chosen as the spatial difference between the two reanalysis products increases when no lapse rate correction is applied or a higher lapse rate of −10 K km−1 is chosen (Fig. S5).
The summer SWD is larger in ERA5 than in ERAI over the main ice sheet. The mean differences exceed 2 standard deviations in the lower parts of the ice sheet, where SWD in ERA5 exceeds SWD in ERAI by approximately 15 W m−2. Only isolated ice caps and the outermost margins of the main ice sheet show a distortion of the opposite sign in some places. Downward longwave radiation over the lower parts of the ice sheet is lower in ERA5, which, in most parts, seems to be related to the lower temperature, while atmospheric emissivity shows no remarkable change. An exception is the central–eastern margin, where the lower LWD in ERA5 is related to a significantly lower effective atmospheric emissivity and points to a qualitatively different climate regime (here the mean differences in emissivity and LWD exceed 2 standard deviations between 66 and 70∘ N). Finally, neither difference in longwave or shortwave radiation is associated with a correspondingly different cloud cover in ERA5 (Fig. S8 in the Supplement).
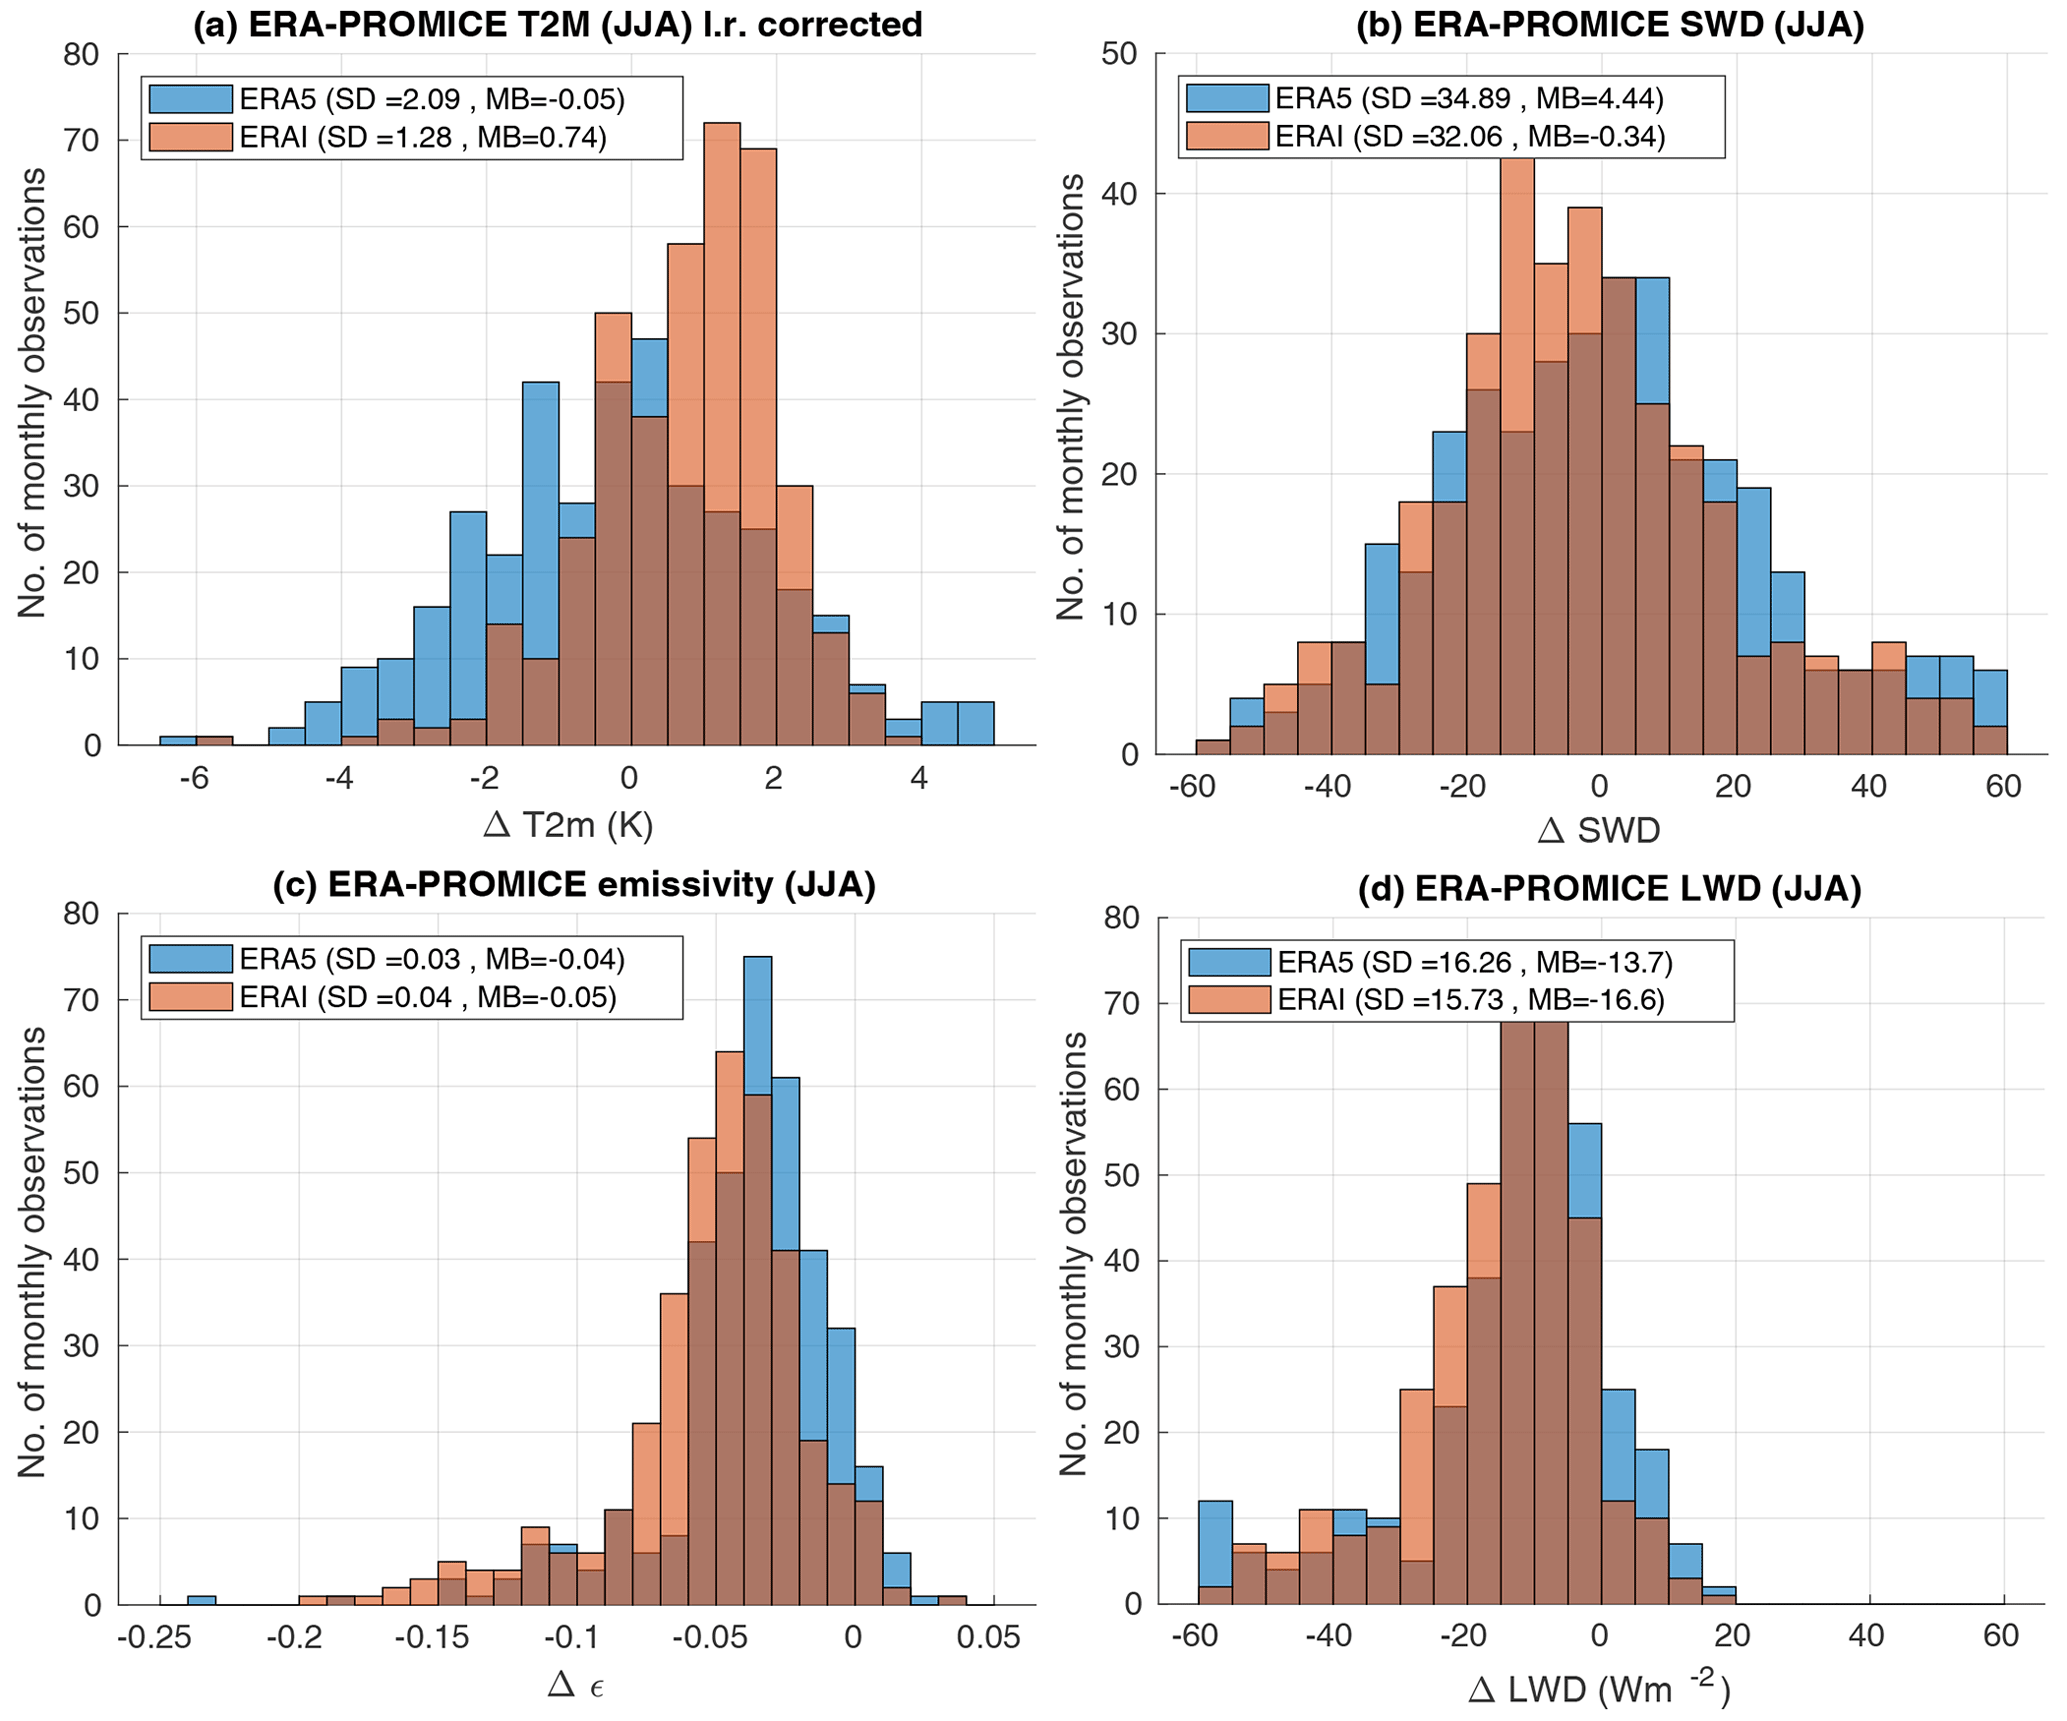
Figure 2Distribution of ERA5 and ERAI biases with respect to monthly PROMICE observations for the summer months (June, July, August) in 2007–2016: 2 m air temperature (a), downward shortwave radiation (b), emissivity (c), and downward longwave radiation (d). The text box insets provide the standard deviation (SD) and mean biases (MBs) for the respective distributions.
A comparison with AWS measurements from the PROMICE network (Fausto et al., 2021; Ahlstrom et al., 2008) (Fig. 2) shows no significant bias in the ERA5 summer temperatures, while the ERAI summer temperatures are significantly higher than the observations, with a mean bias of 0.74 K (according to t tests with a 0.05 significance level). Here again a lapse rate correction of 5 K km−1 was applied to correct for elevation differences between the interpolated reanalysis data and the elevation of the AWS. A comparison with uncorrected temperatures reveals that the lapse rate correction reduces the spread of the reanalysis data around the observational data considerably but also reinforces the warm bias in ERAI (Fig. S7). Figure 2 also shows a larger scatter in SWD around observed station data, a significant positive bias in SWD for ERA5, and a significant negative bias in emissivity and LWD for both reanalyses. There is no significant bias in the ERAI SWD data. In the case of LWD, both bias and spread can be reduced by recalculating LWD from emissivity and the lapse-rate-corrected T2m (Fig. S9).
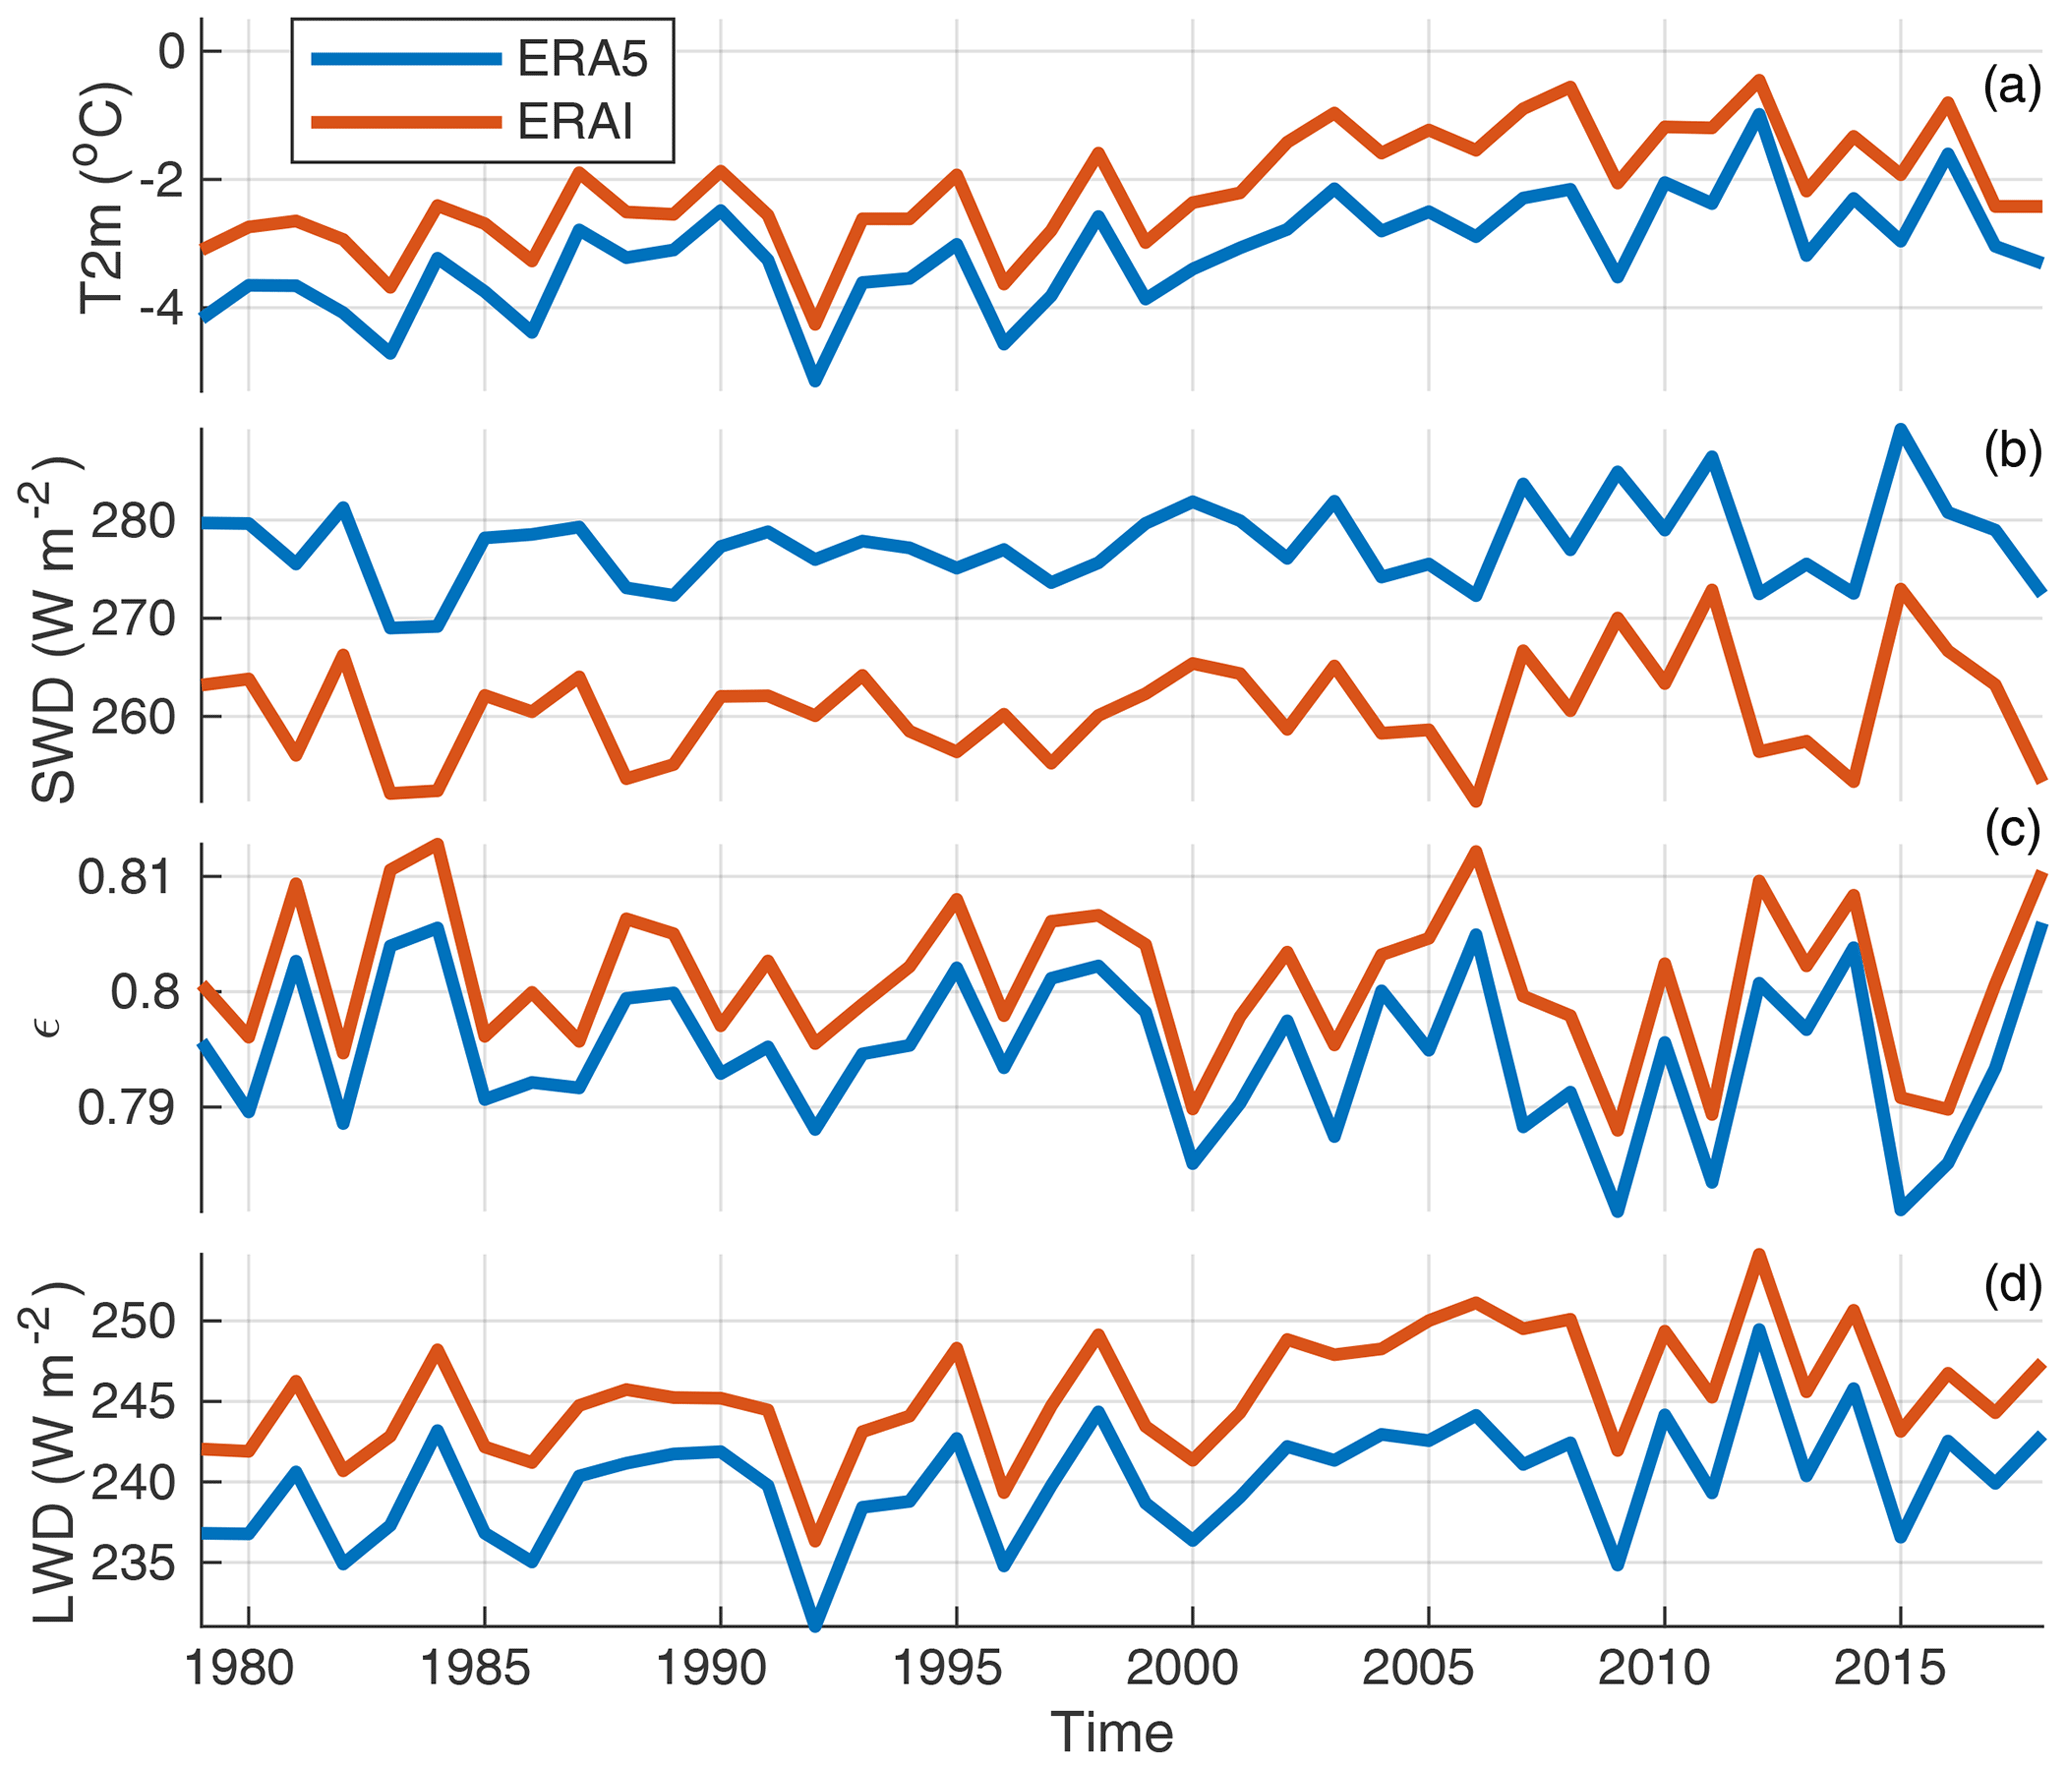
Figure 3The 1979–2016 yearly summer means of interpolated (a) lapse-rate-corrected 2 m air temperature, (b) downward surface shortwave radiation, (c) emissivity, and (d) downward longwave radiation for ERA5 (blue) and ERAI (red) averaged over the 0 to 2000 m elevation range of the GrIS.
Over the lower parts of the ice sheet (<2000 m), differences are pronounced, as shown by the temporal evolution of the fields considered (Fig. 3). In Fig. 3, the elevation range considered covers the ablation zone, which is generally limited to altitudes below 2000 m above sea level; analysis in 1000 m intervals from 0 to 4000 m is provided in Figs. S10–S13. The averaged lapse-rate-corrected ERA5 − ERAI 2 m air temperature difference varies here around a mean of −1.0 K with a standard deviation of 0.24 K (Fig. 3). This difference is enhanced by 25 % during the period between 2002 and 2009, when it is consistently above −1.25 K. This colder period in ERA5 may be partly related to a known cold bias of ERA5 in the lower stratosphere between 2002 and 2006 (one reason why ECMWF released ERA5.1, a rerun of this period; Simmons et al., 2020). The mean difference in SWD varies around 16.7 W m−1 with a standard deviation of 1.6 W m−1, and for LWD it varies around 6.9 W m−1 with a standard deviation of 1.1 W m−1. Differences in effective emissivity also remain largely stable over time, with a mean difference of −0.0063 and a standard deviation of 0.0017.
These differences in the ablation zone imply that using either ERAI or ERA5 climate to drive the same energy balance model will result in different surface melt rate distributions in the GrIS. We use the simplified formulation of the surface energy balance for a melting snow surface, as given in Krebs-Kanzow et al. (2018), to estimate the resulting melt rate difference as about
where A is the albedo of the surface, is the density of water, is the latent heat of fusion, and the parameter k1 is chosen to be 10 . The differences between ERA5 and ERAI of and yield a range from for a low albedo of A=0.4 in the dark bare ice zone to −2 mm d−1 for a fresh snow albedo of A=0.9. Therefore, melt rates from ERA5 are expected to remain mostly lower than the respective estimates based on ERAI, especially at higher altitudes where albedo is generally high. This would result in a lower equilibrium line and stronger melt gradients between the equilibrium line and the ice sheet's margin. However, stronger SWD differences may overcompensate for the lower temperatures in the darker parts of the ablation zone and consequently lead to stronger melt estimates under ERA5 forcing.
Our comparison reveals substantial and spatially and temporally coherent differences between ERA5 and ERA-Interim, resulting in a modified surface energy balance over the GrIS. ERA5 is characterized by systematically lower near-surface air temperatures and more intense insolation in summer. To some degree, differences can be related to the higher spatial resolution of ERA5. In the case of near-surface air temperature, small-scale, resolution-dependent differences can be removed largely by a uniform lapse rate correction, while large-scale differences on the order of remain and appear unrelated to resolution differences. The difference in downward shortwave radiation (SWD) is particularly pronounced along the ice sheet's margins and may in part be related to the higher spatial resolution of ERA5 and a sharper transition of cloud properties from the coastal zone to the interior ice sheet. However, differences in downward shortwave radiation do not generally correspond to differences in atmospheric emissivity, which indicates differences between the two reanalyses in cloud parameterization or radiation scheme.
Correcting the near-surface air temperatures with a lapse rate of −5 K km−1 not only reduces the differences between the two reanalysis products but also improves the comparison with monthly observations from PROMICE weather stations for both datasets. This result is consistent with slope lapse rates diagnosed from both datasets and stresses the benefit of this simple downscaling method when dealing with coarse-resolution temperature fields.
In contrast to Delhasse et al. (2020), we find a significant warm bias of ERAI relative to weather station data, but this is only fully evident when a lapse rate correction is applied, while SWD appears to be slightly overestimated in ERA5.
The observed differences between ERA5 and ERAI have implications for the estimation of surface melt and ultimately the release of runoff. Replacing ERAI with ERA5 forcing in an energy balance model of the GrIS may therefore require some recalibration to reproduce existing observations (e.g., Shepherd et al., 2020).
The reanalysis datasets are provided by the European Centre for Medium-Range Weather Forecasts 45 (ECMWF). Information about ERA-Interim and ERA5 is given at https://www.ecmwf.int/en/forecasts/dataset/ecmwf-reanalysis-interim (last access: 12 November 2021; ECMWF, 2021) and https://doi.org/10.24381/cds.f17050d7 (last access: 12 November 2021; Hersbach et al., 2023). The PROMICE Automatic Weather Station data are available at https://dataverse.geus.dk/dataverse/AWS (How et al., 2022).
The supplement related to this article is available online at: https://doi.org/10.5194/tc-17-5131-2023-supplement.
UKK performed the analysis and led the manuscript writing. All the authors contributed to the interpretation of the results and the proofreading of the manuscript.
The contact author has declared that none of the authors has any competing interests.
Publisher's note: Copernicus Publications remains neutral with regard to jurisdictional claims made in the text, published maps, institutional affiliations, or any other geographical representation in this paper. While Copernicus Publications makes every effort to include appropriate place names, the final responsibility lies with the authors.
We thank the scientific editor and the two reviewers, whose insight and suggestions improved this paper.
Uta Krebs-Kanzow acknowledges the Helmholtz Climate Initiative REKLIM (Regional Climate Change) and the PoF IV “Changing Earth – Sustaining our Future” research program of the Alfred Wegener Institute. Christian Rodehacke received funding from the European Union's Horizon 2021 research and innovation program under grant agreement no. 101056939 for the RESCUE project, and he also received funding via the Alfred Wegener Institute's PACES2 research program.
The article processing charges for this open-access publication were covered by the Alfred Wegener Institute, Helmholtz Centre for Polar and Marine Research (AWI).
This paper was edited by Alexander Robinson and reviewed by two anonymous referees.
Ahlstrom, A. P., Gravesen, P., Andersen, S. B., van As, D., Citterio, M., Fausto, R. S., Nielsen, S., Jepsen, H. F., Kristensen, S. S., Christensen, E. L., Stenseng, L., Forsberg, R., Hanson, S., Petersen, D., and Team, P. P.: A new programme for monitoring the mass loss of the Greenland ice sheet, Geological Survey of Denmark and Greenland Bulletin, 15, 61–64, 2008. a, b
Born, A., Imhof, M. A., and Stocker, T. F.: An efficient surface energy–mass balance model for snow and ice, The Cryosphere, 13, 1529–1546, https://doi.org/10.5194/tc-13-1529-2019, 2019. a
Delhasse, A., Kittel, C., Amory, C., Hofer, S., van As, D., S. Fausto, R., and Fettweis, X.: Brief communication: Evaluation of the near-surface climate in ERA5 over the Greenland Ice Sheet, The Cryosphere, 14, 957–965, https://doi.org/10.5194/tc-14-957-2020, 2020. a, b, c
ECMWF: ECMWF Reanalysis – Interim (ERA-Interim), ECMWF [data set], https://www.ecmwf.int/en/forecasts/dataset/ecmwf-reanalysis-interim, last access: 12 November 2021. a
Erokhina, O., Rogozhina, I., Prange, M., Bakker, P., Bernales, J., Paul, A., and Schulz, M.: Dependence of slope lapse rate over the Greenland ice sheet on background climate, J. Glaciol., 63, 568–572, https://doi.org/10.1017/jog.2017.10, 2017. a
Fausto, R. S., van As, D., Mankoff, K. D., Vandecrux, B., Citterio, M., Ahlstrøm, A. P., Andersen, S. B., Colgan, W., Karlsson, N. B., Kjeldsen, K. K., Korsgaard, N. J., Larsen, S. H., Nielsen, S., Pedersen, A. Ø., Shields, C. L., Solgaard, A. M., and Box, J. E.: Programme for Monitoring of the Greenland Ice Sheet (PROMICE) automatic weather station data, Earth Syst. Sci. Data, 13, 3819–3845, https://doi.org/10.5194/essd-13-3819-2021, 2021. a, b
Fettweis, X., Hofer, S., Krebs-Kanzow, U., Amory, C., Aoki, T., Berends, C. J., Born, A., Box, J. E., Delhasse, A., Fujita, K., Gierz, P., Goelzer, H., Hanna, E., Hashimoto, A., Huybrechts, P., Kapsch, M.-L., King, M. D., Kittel, C., Lang, C., Langen, P. L., Lenaerts, J. T. M., Liston, G. E., Lohmann, G., Mernild, S. H., Mikolajewicz, U., Modali, K., Mottram, R. H., Niwano, M., Noël, B., Ryan, J. C., Smith, A., Streffing, J., Tedesco, M., van de Berg, W. J., van den Broeke, M., van de Wal, R. S. W., van Kampenhout, L., Wilton, D., Wouters, B., Ziemen, F., and Zolles, T.: GrSMBMIP: intercomparison of the modelled 1980–2012 surface mass balance over the Greenland Ice Sheet, The Cryosphere, 14, 3935–3958, https://doi.org/10.5194/tc-14-3935-2020, 2020. a
Hanna, E., Cappelen, J., Fettweis, X., Mernild, S. H., Mote, T. L., Mottram, R., Steffen, K., Ballinger, T. J., and Hall, R. J.: Greenland surface air temperature changes from 1981 to 2019 and implications for ice-sheet melt and mass-balance change, Int. J. Climatol., 41, E1336–E1352, https://doi.org/10.1002/joc.6771, 2021. a, b
Hersbach, H., Bell, B., Berrisford, P., Biavati, G., Horányi, A., Muñoz Sabater, J., Nicolas, J., Peubey, C., Radu, R., Rozum, I., Schepers, D., Simmons, A., Soci, C., Dee, D., and Thépaut, J.-N.: ERA5 monthly averaged data on single levels from 1940 to present, Copernicus Climate Change Service (C3S) Climate Data Store (CDS) [data set], https://doi.org/10.24381/cds.f17050d7 (last access: 21 November 2021), 2023. a
How, P., Abermann, J., Ahlstrom, A. P., Andersen, S. B., Box, J. E., Citterio, M., Colgan, W. T., Fausto, R. S., Karlsson, N. B., Jakobsen, J., Langley, K., Larsen, S. H., Mankoff, K. D., Pedersen, A. O., Rutishauser, A., Shield, C. L., Solgaard, A. M., van As, D., Vandecrux, B., and Wright, P. J.: PROMICE and GC-Net automated weather station data in Greenland, GEUS Dataverse [data set], https://dataverse.geus.dk/dataverse/AWS (last access: 30 November 2017), 2022. a
King, J. C., Marshall, G. J., Colwell, S., Arndt, S., Allen-Sader, C., and Phillips, T.: The Performance of the ERA-Interim and ERA5 Atmospheric Reanalyses Over Weddell Sea Pack Ice, J. Geophys. Res.-Oceans, 127, 9, https://doi.org/10.1029/2022JC018805, 2022. a
Krebs-Kanzow, U., Gierz, P., and Lohmann, G.: Brief communication: An ice surface melt scheme including the diurnal cycle of solar radiation, The Cryosphere, 12, 3923–3930, https://doi.org/10.5194/tc-12-3923-2018, 2018. a
Krebs-Kanzow, U., Gierz, P., Rodehacke, C. B., Xu, S., Yang, H., and Lohmann, G.: The diurnal Energy Balance Model (dEBM): a convenient surface mass balance solution for ice sheets in Earth system modeling, The Cryosphere, 15, 2295–2313, https://doi.org/10.5194/tc-15-2295-2021, 2021. a
Lee, J.-Y., Marotzke, J., Bala, G., Cao, L., Corti, S., Dunne, J. P., Engelbrecht, F., Fischer, E., Fyfe, J. C., Jones, C., Maycock, A., Mutemi, J., Ndiaye, O., Panickal, S., and Zhou, T.: Future global climate: scenario-based projections and near-term information, in: Climate Change 2021: The Physical Science Basis. Contribution of Working Group I to the Sixth Assessment Report of the Intergovernmental Panel on Climate Change, edited by: Masson-Delmotte, V., Zhai, P., Pirani, A., Connors, S. L., Péan, C., Berger, S., Caud, N., Chen, Y., Goldfarb, L., Gomis, M. I., Huang, M., Leitzell, K., Lonnoy, E., Matthews, J. B. R., Maycock, T. K., Waterfield, T., Yelekçi, O., Yu, R., and Zhou, B., 553–672, Cambridge University Press, Cambridge, https://doi.org/10.1017/9781009157896.006, 2021. a
Morlighem, M., Rignot, E., Mouginot, J., Seroussi, H., and Larour, E.: Deeply incised submarine glacial valleys beneath the Greenland ice sheet, Nat. Geosci., 7, 418–422, https://doi.org/10.1038/NGEO2167, 2014. a
Shepherd, A., Ivins, E., Rignot, E., Smith, B., van den Broeke, M., Velicogna, I., Whitehouse, P., Briggs, K., Joughin, I., Krinner, G., Nowicki, S., Payne, T., Scambos, T., Schlegel, N., A, G., Agosta, C., Ahlstrom, A., Babonis, G., Barletta, V. R., Bjork, A. A., Blazquez, A., Bonin, J., Colgan, W., Csatho, B., Cullather, R., Engdahl, M. E., Felikson, D., Fettweis, X., Forsberg, R., Hogg, A. E., Gallee, H., Gardner, A., Gilbert, L., Gourmelen, N., Groh, A., Gunter, B., Hanna, E., Harig, C., Helm, V., Horvath, A., Horwath, M., Khan, S., Kjeldsen, K. K., Konrad, H., Langen, P. L., Lecavalier, B., Loomis, B., Luthcke, S., McMillan, M., Melini, D., Mernild, S., Mohajerani, Y., Moore, P., Mottram, R., Mouginot, J., Moyano, G., Muir, A., Nagler, T., Nield, G., Nilsson, J., Noel, B., Otosaka, I., Pattle, M. E., Peltier, W. R., Pie, N., Rietbroek, R., Rott, H., Sorensen, L. S., Sasgen, I., Save, H., Scheuchl, B., Schrama, E., Schroeder, L., Seo, K.-W., Simonsen, S. B., Slater, T., Spada, G., Sutterley, T., Talpe, M., Tarasov, L., van de Berg, W. J., van der Walt, W., van Wessem, M., Vishwakarma, B. D., Wiese, D., Wilton, D., Wagner, T., Wouters, B., and Wuite, J.: Mass balance of the Greenland Ice Sheet from 1992 to 2018, Nature, 579, 233, https://doi.org/10.1038/s41586-019-1855-2, 2020. a
Simmons, A., Soci, C., Nicolas, J., Bell, B., Berrisford, P., Dragani, R., Flemming, J., Haimberger, L., Healy, S., Hersbach, H., Horányi, A., Inness, A., Munoz-Sabater, J., Radu, R., and Schepers, D.: Global stratospheric temperature bias and other stratospheric aspects of ERA5 and ERA5.1, European Center For Medium Range Weather Forecasts, https://doi.org/10.21957/rcxqfmg0, 2020. a
Wang, C., Graham, R. M., Wang, K., Gerland, S., and Granskog, M. A.: Comparison of ERA5 and ERA-Interim near-surface air temperature, snowfall and precipitation over Arctic sea ice: effects on sea ice thermodynamics and evolution, The Cryosphere, 13, 1661–1679, https://doi.org/10.5194/tc-13-1661-2019, 2019. a