the Creative Commons Attribution 4.0 License.
the Creative Commons Attribution 4.0 License.
 | 03 Nov 2023
Brief communication: Alternation of thaw zones and deep permafrost in the cold climate conditions of the East Siberian Mountains, Suntar-Khayata Range
Sergei Serikov
Anatoly Kirillin
Andrey Litovko
Maxim Sivtsev
The Suntar-Khayata Range includes numerous natural phenomena interacting with or depending on permafrost conditions. Here, we examine some patterns of deep permafrost and talik zones on adjacent sites. A 210 m deep borehole in siltstone bedrock was equipped for the temperature monitoring of the topmost 15 m and measurements of a deep permafrost temperature profile in July 2010. The temperature curvature in the upper part has a bend, which is consistent with the upper portion justified by climate warming, and shows a steady-state linear geothermal profile below 85 m depth with a high geothermal heat flux. A shallow borehole situated at the river floodplain was used to investigate the thaw zone's temperature regime. The temperatures down to 6.7 m deep have been monitored at 5 min intervals during heavy rainfall, and the temperature readings have behaved quite peculiarly. The thickness of the seasonal freezing layer reaches 5.7 m; moreover the ground temperature increases to 6 ∘C at 6.7 m depth by groundwater heat transfer. This study provides some new insights into the permafrost condition at one of the coldest places in the Northern Hemisphere.
- Article
(3543 KB) - Full-text XML
-
Supplement
(822 KB) - BibTeX
- EndNote


The East Siberian Mountains encompass about half of the East Siberian landmass, but at the same time little is known about permafrost in this mountainous terrain. On the other hand, the existing unique environmental conditions and natural cryosphere phenomena (e.g., glaciers; aufeis; “Pole of Cold” Oymyakon located at 63∘15′ N, 143∘9′ E and Verkhoyansk located at 67∘33′ N, 133∘23′ E) are interesting for the widespread scientific community (Lytkin and Galanin, 2016; Makarieva et al., 2022; Takahashi et al., 2011). Despite the increasing efforts in global permafrost mapping, this area has almost no data on direct permafrost measurements and observations, which would be especially relevant in these data-scarce regions.
One of the main permafrost parameters is the permafrost thickness (Osterkamp and Gosink, 1991), which has considerable importance for paleo-climate reconstruction, hydrogeology description, deposit exploitation, etc. The permafrost temperature profile is controlled by the initial surface temperature, bedrock thermal properties and geothermal heat flux (Lachenbruch and Marshall, 1986). Most frequently, the data about deep permafrost are acquired during geological prospecting works for potential deposits. The high costs of deep borehole drilling limit its acquisition facilities, but in our case, we have access to a deep, open borehole on a gold ore deposit. In a previous study, we focused on monitoring the active layer temperature regime at a widespread soil pit network in a nearby area. But, the temperature regimes at the layer of zero annual amplitude (ZAA) and seasonal freezing layer as well as deep temperature profiles have never been presented before (Sysolyatin et al., 2020).
For the continuous permafrost in eastern Siberia, taliks can only exist under specific conditions because of the severe climate. Since the heat balance of the subarctic is clearly not cold enough to induce talik formation, groundwater processes are more often involved. Taliks formed by thermal waters and open taliks (below large rivers) are well known, but taliks confined to coarse-grained permeable sediments of riverbanks are poorly studied (Makarieva et al., 2019). Floodplain sediments can accumulate water during the warm period and gradually empty in the winter (Mikhailov, 2015). The occurrence of such taliks forms a favorable environment for the growth of thermophilic plants out of their species range – e.g., poplar or a willow shrub formation.
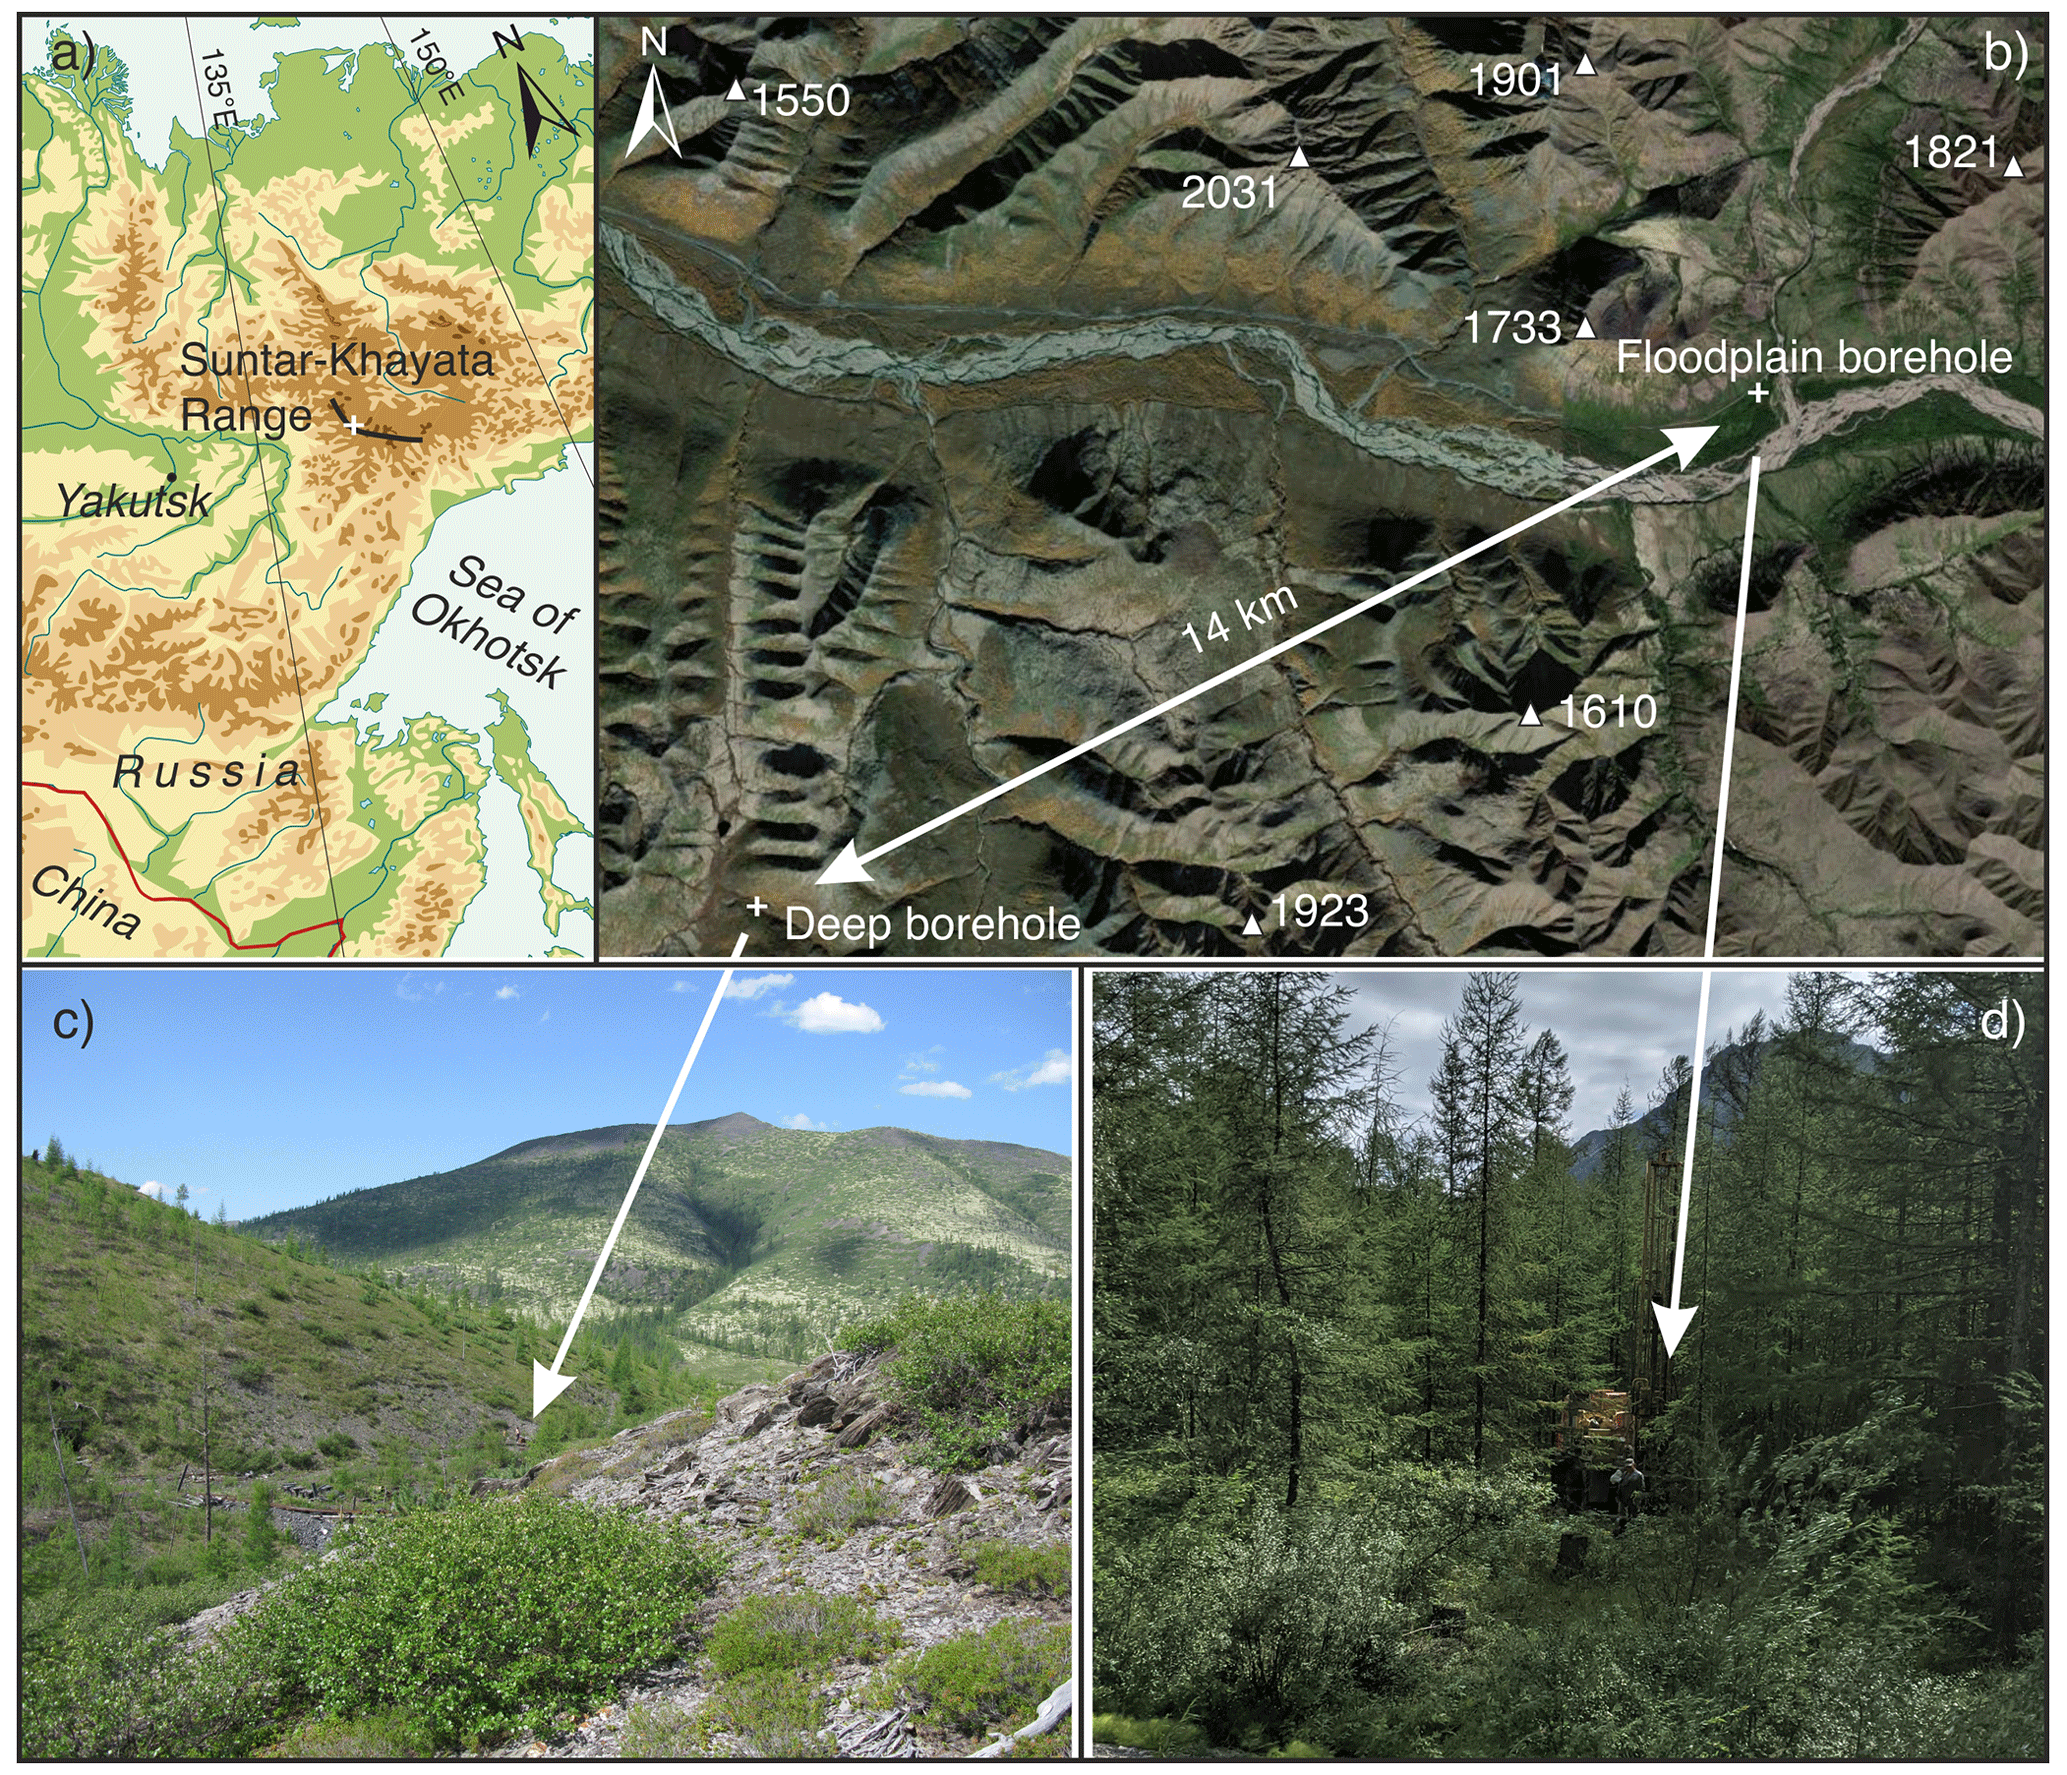
Figure 1Study area description and picture of sites' environment. Panel (a) shows a modified physical map of the location of the study area in eastern Siberia (map source: © GeoAtlas 1998). (b) Maxar image of Vostochnaya Khandyga basin with altitudes of peaks. (c) Deep borehole site at V-shaped valley. (d) Shallow borehole site at river plain.
In this brief communication, we present the thermal regime of typical permafrost and talik sites at the Suntar-Khayata Range. The successful embedding of a shallow borehole allows us to examine the active layer temperature evolution in a floodplain talik for the first time. We aim to do the following: (1) define the thickness and long-term thermal regime of permafrost and (2) infer the possible extent of talik zones, discuss the origin of their formation, and show the impact of heavy rainfall on the ground temperature regime and slope stability. This study presents the general permafrost conditions and discusses possible ways to improve the permafrost mapping of the East Siberian Mountains.
The Suntar-Khayata Range is located at the southern boundary of the East Siberian Mountains and serves as a watershed between the Aldan and Indigirka River basins (Fig. 1). At altitudes between 2000 and 2959 m a.s.l. (above sea level), a glacial area persists, representing the largest of the present glaciation in Siberia – with about 195 glaciers covering 163 km2 (Ananicheva et al., 2010). The study area is represented by alpine relief with the height of the peaks from 1550 to 2031 m a.s.l. The shallow borehole is located at the valley basin of the Vostochnaya Khandyga River at 850 m a.s.l. (Fig. 1d), and the deep borehole is located in the narrow V-shaped Vostochnaya Khandyga tributary valley at 1100 m a.s.l. altitude (Fig. 1c). Late Paleozoic sandstone, siltstone and clay slate are prevalent bedrock of the mountain rock, whereas the valley sediments consist of coarse-grained alluvium strata (Sokolov et al., 2015). Kurums exist at the foot and middle part of the mountain slopes. They have widespread distribution (Lytkin and Galanin, 2016), and boulders can reach up to 3 m in diameter.
The climate conditions were recorded at a weather station 43 km east of the study site (Vostochnaya, WMO24679), situated at 1288 m a.s.l. The mean annual air temperature (MAAT) ranges from −15.3 to −11.2 ∘C. The average precipitation is about 280 mm and the maximum annual snow thickness varies from 16 to 60 cm for the 1966–2018 period. Direct air temperature observation around the borehole at the floodplain shows the existence of winter temperature inversion at altitudes between 800 and 1400 m a.s.l. (Sysolyatin et al., 2020). The flora is not very diverse. Dwarf Siberian pine is occupying the top part of the slopes between 1400 and 1600 m a.s.l. and able to accumulate significant snow cover. Siberian larch is growing on gentle and steep slopes and on flat surfaces reflecting the most severe permafrost conditions. The poplars have a limited extent adjacent to the riverbank.
According to our soil pit monitoring network (Sysolyatin et al., 2020), the mean annual ground temperature ranges from −1.1 to −10.6 ∘C at 1 m depth. The active layer varies from 0.5 to 2.7 m, and the mean January ground surface temperature can drop to −31 ∘C. No direct observation of precipitation or snow thickness is available for the study area, but its influence is obviously significant. For instance, in 2021 anomalous heavy rains gave rise to numerous debris flows and the appearance of debris avalanches as well as an abrupt change in the talik temperature regime (Supplement, Fig. 3).
The deep borehole was drilled for the prospecting of the orogenic gold deposit prospect by a geological company in 1991. Organic material is almost absent, and the soil thickness does not exceed 0.5–0.8 m. Core samples (with marked depth intervals) were stocked close to the drilling site, where four samples have been collected for laboratory studies. In 2010, the sintered ice plug in the topmost 5 m was redrilled to establish a temperature monitoring site. In 2020, the temperature measurements were made at intervals of 5 m for depths from 20 to 150 m and 10 m for depths between 150 and 210 m, by using a movable high-precision negative temperature coefficient thermistor and multiconductor cable. To reduce the impact of convection, the hole was plugged by dense material.
Table 1General parameters of equipment and operating timing of the loggers installed at different depths inside the boreholes during the control period.
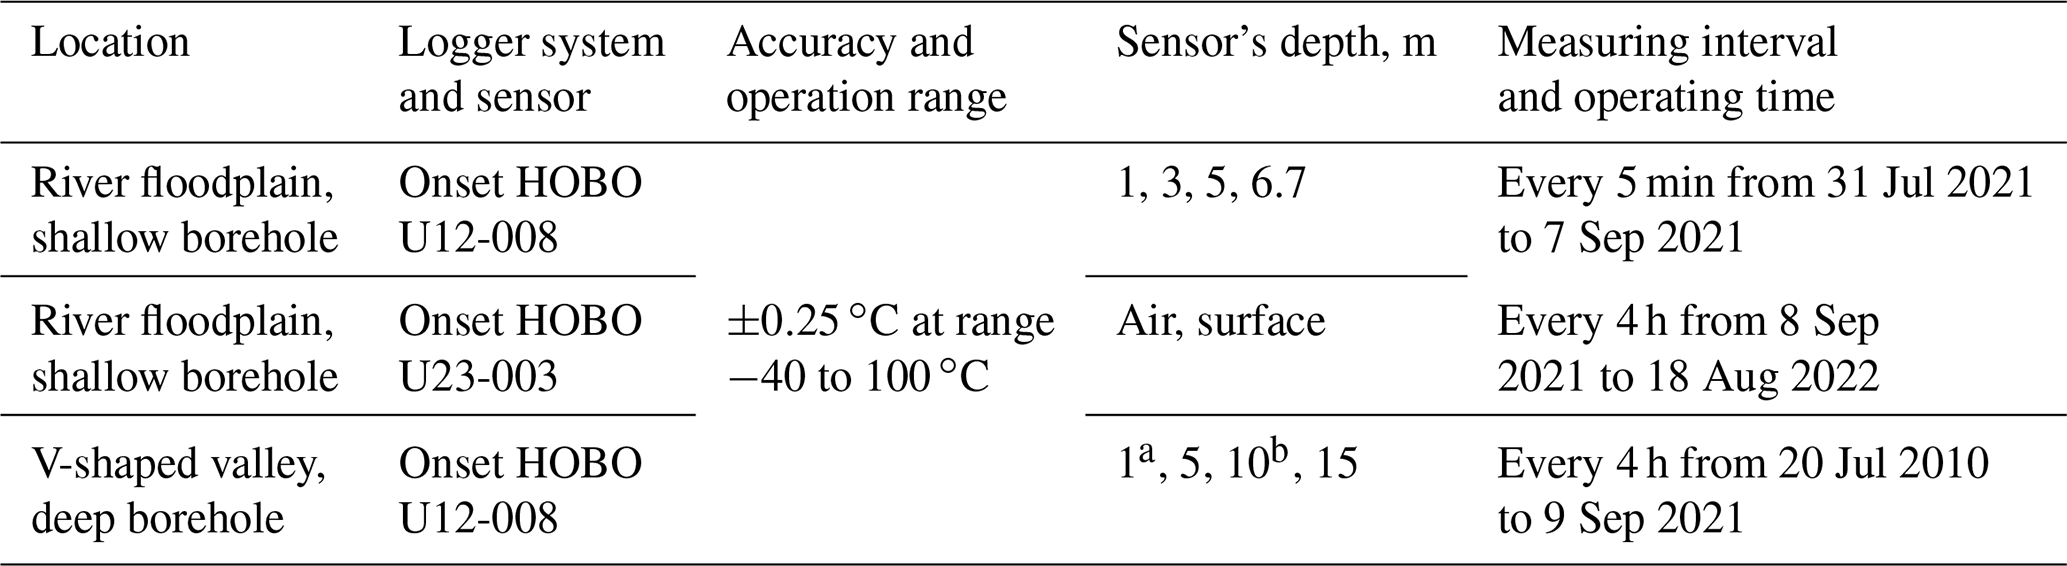
a Nonvalid because of the close position to the borehole's iron case tube. b Nonvalid because of giving incorrect temperature data over long periods.
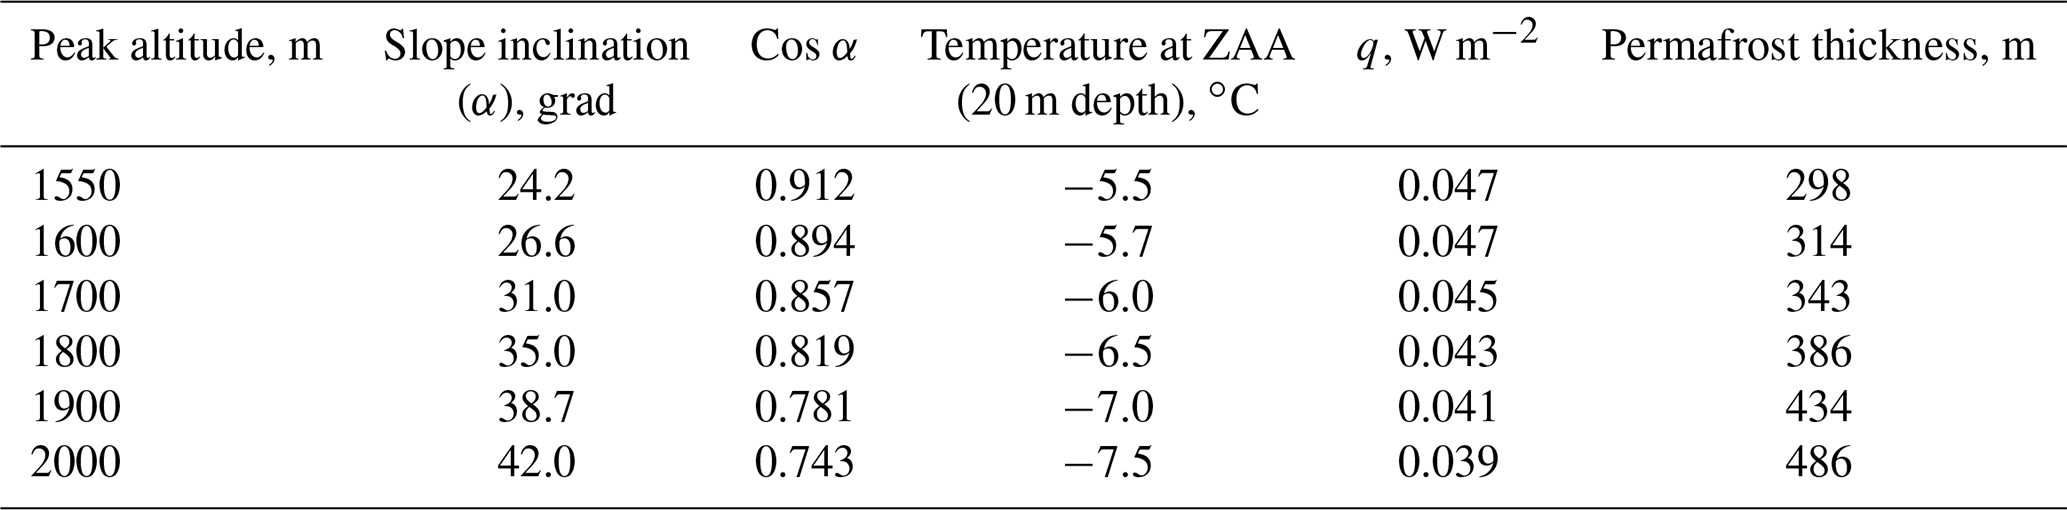
Table 2Permafrost thickness based on the assumption that MAGT and permafrost heat flow are decreasing under step-up of peak's height.
The shallow borehole was drilled using a wheeled-hammer drilling rig with air circulation in gravel alluvium sediments. The temperature disturbance was assumed to be negligible after a few days. The hole was cased with a PVC pipe with an inner diameter of 20 mm, and the sensors were inserted at 1, 3, 5 and 6.7 m depths. The space around the casing was filled with sand and well cuttings. The first attempt to drill a borehole in the floodplain reached a depth of 12 m, but a failure of drilling tools halted the process. At the end of July, the stratum was relatively dry.
Ground temperatures were monitored continuously within the shallow and deep boreholes down to 6.7 and 15 m for 1 and 9 years, respectively. Measurements were made every 4 h with TMC50-HD thermistors that were attached to four-channel Onset HOBO data loggers (U12-008 model). Air and ground surface temperatures (2 cm depth) were acquired for the shallow borehole site by using a two-channel data logger (U23-003). Table 1 shows the operation design of the different logger systems situated at the sites and in the interior of the boreholes. Since the sensors are installed in the deep borehole at 5 and 15 m, we report the mean annual ground temperature to determine the offset of heat wave penetration from the surface. In accordance with the local climatic conditions and thermal properties of the bedrock, MAGT (mean annual ground temperature) was calculated for the periods of September–August and January–December for depths of 5 and 15 m, respectively, to account for an equal seasonal cycle. For the shallow boreholes, the data presented for the high-frequency logging period (every 5 min) from 31 July to 8 September are used to trace the impact of heavy-rain infiltration events on the subsurface thermal regime.
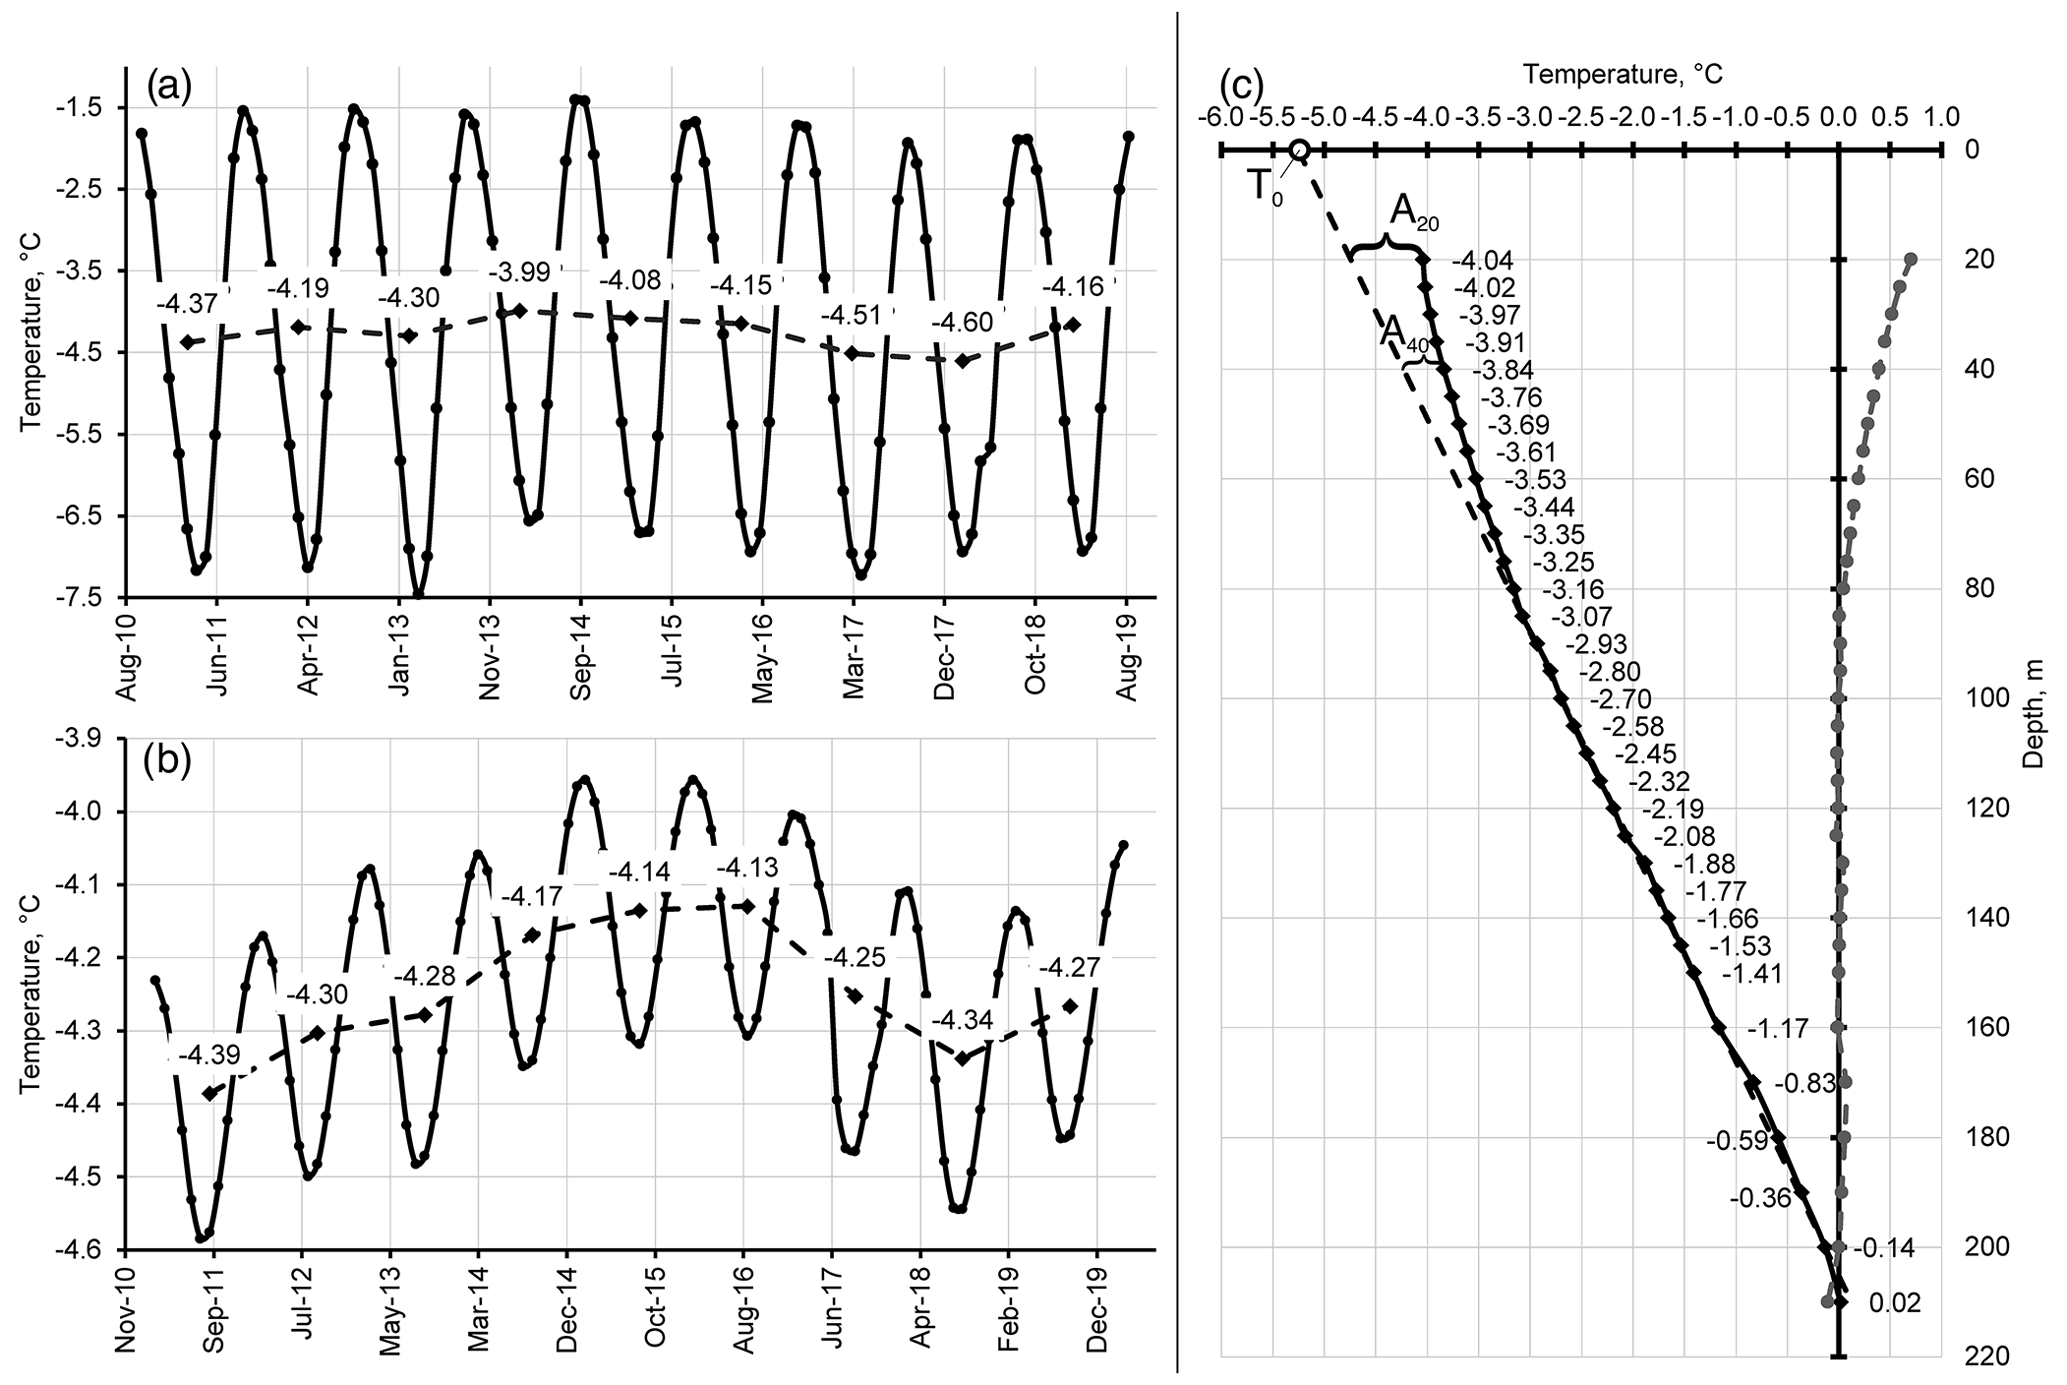
Figure 2Thermal regime of permafrost conditions in the deep borehole. Mean monthly and annual ground temperature evolution at 5 m (a) and 15 m (b) depth. (c) Temperature profile (solid line), best linear fit (dashed line) and current offset from extrapolated temperature (dotted line).
4.1 Permafrost temperature evolution
At the V-shaped valley site, only two of the four sensors (5 and 15 m) have useful and reliable data for analysis (Fig. 2a and b). The ground temperatures below 0 ∘C were recorded for the whole monitoring period at 5 m depth. The observed average MAGT is −4.25 ∘C for both depths. The ground temperature evolution shows a sinusoidal pattern with smooth drifting, following the changing climate condition. At 5 and 15 m depth, the amplitude ranges from 6.2 to 0.6 ∘C, respectively, for the whole measurement period. The fluctuations of the mean annual ground temperature did not exceed 0.61 ∘C at 5 m and 0.26 ∘C at 15 m. The warming trend that has been highlighted for the 2010 to 2015 period was changing to equivalent cooling until 2019 at both depths. On the basis of the thermal diffusivities obtained from four core samples in a deep borehole (ranging between 1.21 and 1.96 m2 s−1), the ZAA depth might vary from 10.9 to 13.9 m.
4.2 Permafrost thickness and thermal conditions
The permafrost thickness observed by these direct measurements does not exceed 205–210 m in the deep borehole at the V-shaped valley. Figure 2c presents a detailed temperature profile. Below the assumed depth of ZAA (20 m), the permafrost temperature increases downward with a gradient ranging from 0.01 to 0.038 Cm−1. From the whole temperature curve, the mean gradient was calculated as 0.0214 Cm−1. The initial surface temperature ( ∘C) is obtained by best-fit linear extrapolation from a depth interval of 85–160 m due to the uniform value of the gradient (Lachenbruch and Marshall, 1986). The values of the temperature anomaly (offset value from linear fit) at 20 m (A20) and 40 m (A40) were calculated as 0.70 and 0.39 ∘C, respectively.
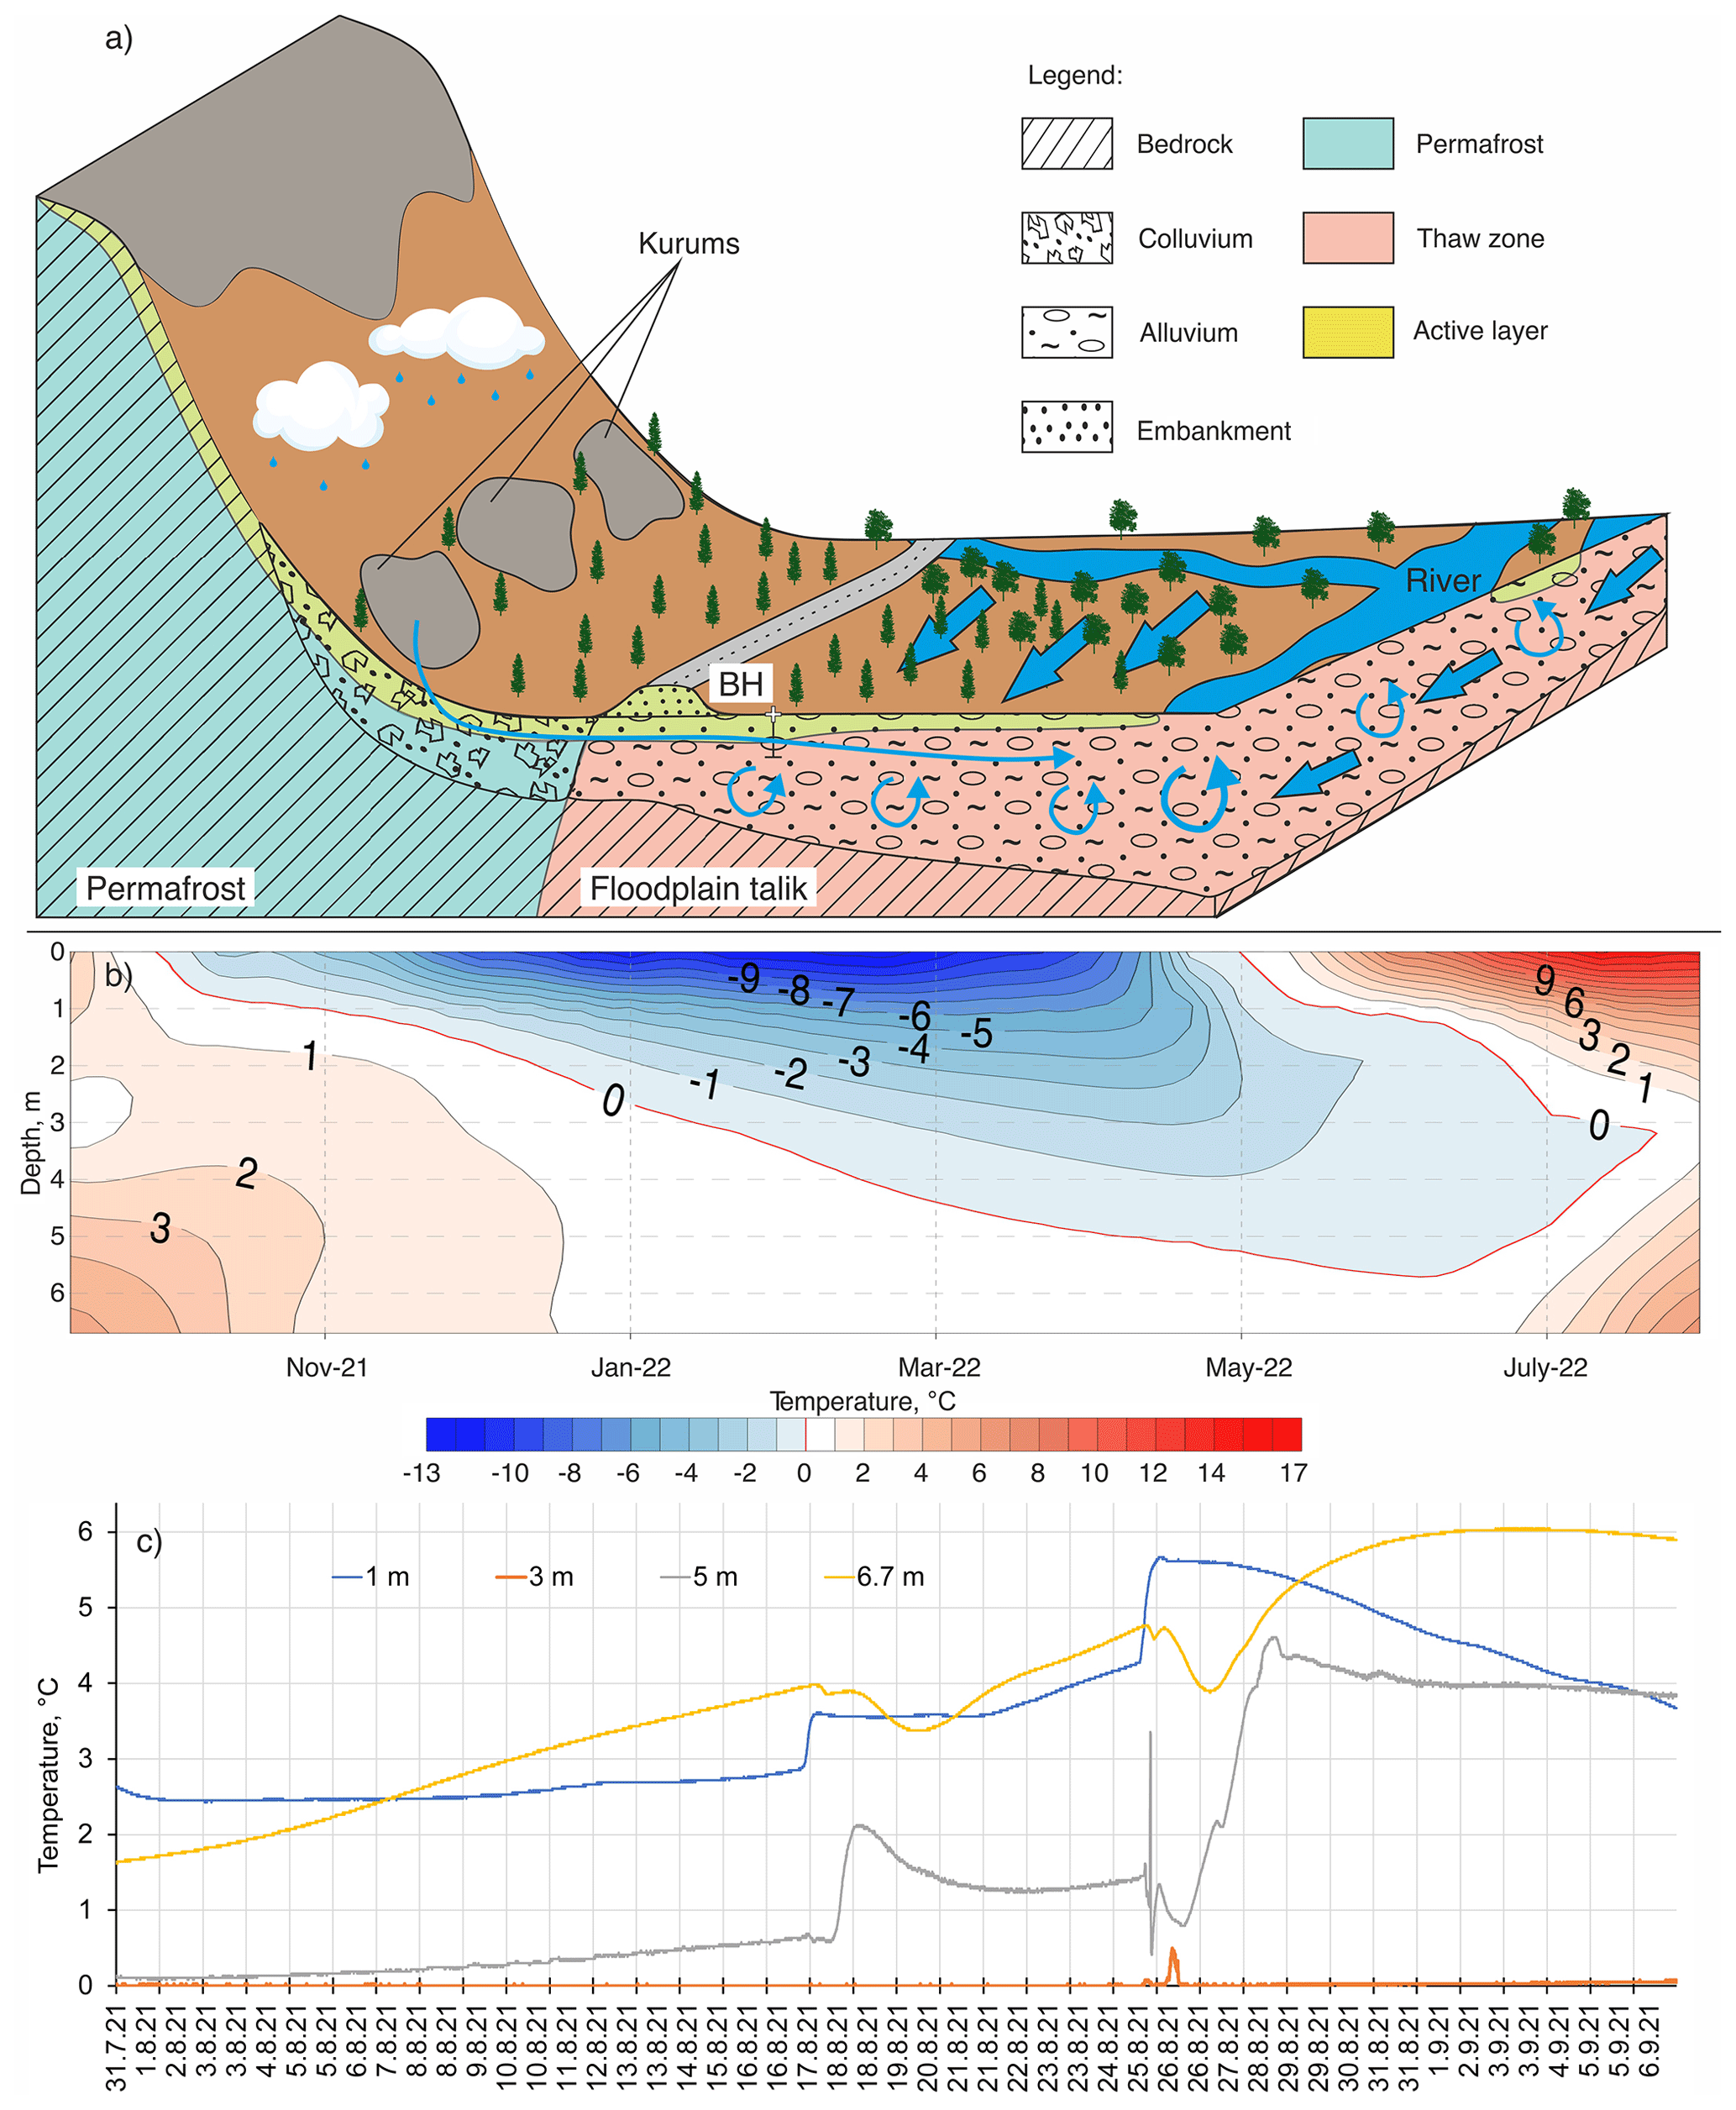
Figure 3(a) The scenario of groundwater flow of the floodplain talik. (b) Annual ground temperature evolution. (c) Temperature fluctuation at a heavy-rain event.
4.3 Talik temperature regime
A simple geomorphology sketch of the shallow borehole site is presented in Fig. 3a, and Fig. 3b and c show an annual and monthly temperature time series for the floodplain site, respectively. The pattern of the 1 m depth temperature evolution is consistent with the air and surface temperature evolution. The temperatures ranged from −6.3 to 6.6 ∘C and from −13.7 to 20.7 ∘C, respectively. Surprisingly, the temperature variation at 3 m depth was smaller than for the sensors below, just from −2 to 1.6 ∘C. The refreezing at 3 m depth began at the end of January, and the zero-curtain period spans from approximately the end of June to September, dividing the floodplain (overburden) sediments into three zones – upper active layer, intermediate frozen layer and bottom permanent talik. The spike in Fig. 3c is related to the percolation of warm rainwater to 3 m depth, probably through a casing tube. The most peculiar temperature behavior is found for the 5 and 6.7 m depth sensors, which is surely related to the heat advection of groundwater movement. The patterns of temperature changes at 5 m depth are more linear, whereas they are more exponential at 6.7 m. The maximum absolute temperature ranged between 4.4 ∘C (5 m) and 7.7 ∘C (6.7 m), while minimum temperatures oscillated between −0.2 ∘C (5 m) and 0.3 ∘C (6.7 m). The ground at a depth of 5 m remained unfrozen for more than 75 % of the time of the year. In an isopleth plot, the talik appears below to 5.7 m and obviously continues downward (Fig. 3b). At an air temperature of −9.9 ∘C and a MAGST (mean annual ground surface temperature) of −1.8 ∘C, the MAGT for the observation period (almost a year) is −1.1, −0.1, 1.1 and 1.8 ∘C for depths of 1, 3, 5 and 6.7 m, respectively.
Permafrost thickness is one of the major components of the cryosphere and is closely related to geothermal heat flux. According to Balobaev et al. (1985) the Suntar-Khayata Range is characterized by the high values of geothermal heat flux from 0.08–0.10 W m−2, usually concentrating under narrow V-shaped valleys. Through numerous geothermal measurements at the following orogenic gold deposits (Nezjdaninskoye), specific patterns of thermal conditions were determined; thus, the inclination angle of the surface reduces the geothermal heat flux according to the following equation:
where q is the calculated geothermal heat flux, q0 is the initial geothermal heat flux and α is the slope angle.
The interaction between altitude and surface temperature has also been presented in previous studies and might decrease the MAGST to −6.5 ∘C at 1800 m a.s.l. mountain peaks (Sysolyatin et al., 2020). As mentioned above, the MAGT at 5 m depth has a similar value to the ZAA temperature. Using Eq. (2) (the steady-state equation) and expecting the decrease in the ZAA temperature upon upward height, the permafrost thickness was calculated (Table 1) (Carslow and Jager, 1959; Guglielmin et al., 2011). By core samples, bedrock effective thermal conductivity is 2.41 W m−2 K−1 and q0=0.052 W m−2 in the permafrost body at the base altitude surface level: 1100 m. According to the orographic configuration of the study area, the permafrost thickness at local peaks 2000 m a.s.l. can reach ∼500 m.
where Z is the estimated permafrost thickness in meters, T is the temperature at the ZAA depth in degrees Celsius, λ is the effective thermal conductivity in W m−2 K−1 and q is the geothermal heat flux in permafrost in watts per square meter (W m−2) (from Eq. 1).
The extrapolation of the linear portion of the temperature curve to the surface results in significant differences in the current temperature curve from the initial MAGST features (Lachenbruch and Marshall, 1986). Two variants of changes are considered: a temperature change at the surface and a temperature change at the ZAA. For instance, assuming thermal diffusivity is m2 s−1, the surface temperature shift around 1.4 ∘C would be ongoing from 22 to 81 years with respect to the step, linear or exponential way of change. When the temperature shifts by 0.7 ∘C at the ZAA, the response time will expand to a range of 19 to 90 years. With the available data about the rate of air temperature change at the closest weather station, the second variant is the most plausible. It should be noted that the snow cover can change the surface temperature by more than 5 ∘C (Gisnas et al., 2014), which is much larger than the air temperature change over the last 80 years (IPCC, 2014).
As mentioned previously, the talik appearance can only be caused by the thermal influence of superficial water or groundwater in the cold environments of northeastern Siberia. The absence of permafrost under large rivers and in the areas adjacent to hot springs is well known. Nevertheless, in our case, where the distance from the main stream exceeded 1 km, the presence of the talik was not assumed before. The reason for the existence of the talik is ambiguous. One possibility is the migration of rainwater infiltrating through the “windows” of the kurums (block streams) on the adjacent slope. The timing of the thermal impact of rainfall is clearly evident on the temperature graph at a depth of 1 m. These spikes have been well explained before (Hinkel et al., 2001). The divergent temperature response at depths of 5 and 6.7 m is difficult to explain. Perhaps it may be related to the interaction of rainfall with the permafrost occurrence at depth. It could also have been due to a delay in the influence of the groundwater supply from the river. However, the response time is largely consistent with the first hypothesis. The groundwater certainly influences the river when considering the thawing cycle. The isopleth plot clearly shows that the temperature at a depth of 5 and 6.7 m begins to increase earlier than at a depth of 3 m. This means that the proximity to the groundwater is accelerating warming for the coarse-grained sediments. To solve this issue, it would be necessary to install additional piezometric and temperature monitoring sites. It would also be necessary to carry out temperature measurements of the river water.
The interactions between groundwater and permafrost have been examined in numerous studies (e.g., Ge et al., 2011; Kane et al., 2013; Walvoord and Kurylyk, 2016). But the features of floodplain taliks for the Kolyma region have only recently been considered and are not well understood (Mikhailov, 2015). It is noted as the crucial reason for the formation of the winter river flow. The floodplain taliks of the region are capable of accumulating huge amounts of water and gradually return it to the river during the low-flow cold season. The most influential factors are the slope of the river floodplain and the permeability of the sediments. The volume of the sand backfill material usually decreases downward to the aquiclude, which increases permeability and capaciousness of the aquifer. The reason for the appearance of such a large talik is probably just related to the site-specific conditions of the study area. A sufficiently reliable marker may be the area of poplar trees, tending to warmer environments. However, in our case, at the drilling site the vegetation was represented by moss and larch that is more typical of permafrost landscapes.
An increase in liquid precipitation, along with an increase in air temperature, is one of the most obvious consequences of global warming (Savelieva et al., 2000; Yang et al., 2005). For the permafrost zone, heavy rainfall often acts as a trigger for geomorphological processes (Borgatti and Soldati, 2013). The effect of heavy rainfalls on permafrost is most pronounced for the mountainous areas.
The behavior of the upper part of the permafrost during flooding rains creates reasons for the activation of slope processes. Heavy rains at the end of August 2021 were the trigger for seven large landslides on a 5 km section of the Kolyma highway, temporarily stopping traffic (Supplement). The high concentration of landslides in this section is explained by the aspect and angle of the slope, which creates favorable conditions for an increase in the active layer. The abrupt and abundant saturation with rainwater led to the critical weighting of soil material, after which the stability of the slope was disrupted. Landslide processes were also observed everywhere during field investigations in other areas with a lower inclination and with northern and eastern aspects. The descriptions of such scenarios are given in many sources, but the detailed process for regions of northeastern Siberia is poorly understood at this time (Frauenfelder et al., 2018; Geertsema et al., 2006; Gruber and Haeberli, 2007).
This study provides insight into the thermal patterns of permafrost and taliks that can be valuable for future studies of the East Siberian Mountains. Permafrost is almost continuously distributed with a thickness reaching 500 m. Thermal properties of the bedrock were obtained through laboratory determinations, and a negligible permafrost temperature trend was identified as a result of long-term monitoring. Due to the successful location of the borehole and high-frequency measurements during rare heavy rains in August 2021, unusually high values of daily precipitation were recorded in the Suntar-Khayata Mountains (Verkhoyansk Ridge, Siberia). Due to the abundance of liquid precipitation, peculiarities of the configuration of permafrost and thaw zones, and site morphology, the temperature regime of the soils has a peculiar feature down to a depth of 6.7 m. The size of the talik zone can be very significant, which must be considered in mapping, designing and modeling. A wide range of multidisciplinary research is required to improve the understanding of permafrost conditions in this area.
The long-term temperature monitoring data sets (.xlm) are available upon contact with Robert Sysolyatin.
The evidence of debris landslides is added as a Supplement. The supplement related to this article is available online at: https://doi.org/10.5194/tc-17-4601-2023-supplement.
RG and SS proposed the initial idea and carried out this study by designing research sites, analyzing data, and organizing – as well as being responsible for – the compilation and quality control of the observations. RG, SS, AL and MS handled the fieldwork. AK was responsible for the laboratory determination of rock thermal properties. RG prepared the paper with contributions from SS, AK, AL and MS.
The contact author has declared that none of the authors has any competing interests.
Publisher’s note: Copernicus Publications remains neutral with regard to jurisdictional claims made in the text, published maps, institutional affiliations, or any other geographical representation in this paper. While Copernicus Publications makes every effort to include appropriate place names, the final responsibility lies with the authors.
The authors acknowledge the Melnikov Permafrost Institute for logistic and fieldwork support. The authors acknowledge the valuable input of the reviewer Lutz Schirrmeister, the anonymous reviewer and the editor Christian Hauck for their comments, suggestions and technical corrections which helped improve the paper.
This research has been supported by the Russian Science Foundation (grant no. 22-27-20073) and the Republic of Sakha (Yakutia).
This paper was edited by Christian Hauck and reviewed by Lutz Schirrmeister and one anonymous referee.
Ananicheva, M. D., Krenke, A. N., and Barry, R. G.: The Northeast Asia mountain glaciers in the near future by AOGCM scenarios, The Cryosphere, 4, 435–445, https://doi.org/10.5194/tc-4-435-2010, 2010.
Balobaev, V. T., Devyatkin, V. N., Gavriliev, R. I., and Rusakov, V. G.: About geothermophysical researching of mineral deposits at north-east region, Geol. Geol. Explor., 5, 36–37, 1985.
Borgatti, L. and Soldati, M.: 7.30 Hillslope Processes and Climate Change, in: Treatise on Geomorphology, Elsevier, 306–319, https://doi.org/10.1016/B978-0-12-374739-6.00180-9, 2013.
Carslow, H. S. and Jager, J. C.: Conduction of Heat in Solids, Oxford University Press, New York, 1959.
Frauenfelder, R., Isaksen, K., Lato, M. J., and Noetzli, J.: Ground thermal and geomechanical conditions in a permafrost-affected high-latitude rock avalanche site (Polvartinden, northern Norway), The Cryosphere, 12, 1531–1550, https://doi.org/10.5194/tc-12-1531-2018, 2018.
Ge, S., McKenzie, J., Voss, C., and Wu, Q.: Exchange of groundwater and surface-water mediated by permafrost response to seasonal and long term air temperature variation, Geophys. Res. Lett., 38, L14402, https://doi.org/10.1029/2011GL047911, 2011.
Geertsema, M., Clague, J. J., Schwab, J. W., and Evans, S. G.: An overview of recent large catastrophic landslides in northern British Columbia, Canada, Eng. Geol., 83, 120–143, https://doi.org/10.1016/j.enggeo.2005.06.028, 2006.
Gisnås, K., Westermann, S., Schuler, T. V., Litherland, T., Isaksen, K., Boike, J., and Etzelmüller, B.: A statistical approach to represent small-scale variability of permafrost temperatures due to snow cover, The Cryosphere, 8, 2063–2074, https://doi.org/10.5194/tc-8-2063-2014, 2014.
Gruber, S. and Haeberli, W.: Permafrost in steep bedrock slopes and its temperature-related destabilization following climate change, J. Geophys. Res.-Surf., 112, F02S18, https://doi.org/10.1029/2006jf000547, 2007.
Guglielmin, M., Balks, M. R., Adlam, L. S., and Baio, F.: Permafrost Thermal Regime from Two 30-m Deep Boreholes in Southern Victoria Land, Antarctica, Permafrost Periglac., 22, 129–139, https://doi.org/10.1002/ppp.715, 2011.
Hinkel, K. M., Paetzold, F., Nelson, F. E., and Bockheim, J. G.: Patterns of soil temperature and moisture in the active layer and upper permafrost at Barrow, Alaska: 1993–1999, Global Planet. Change, 29, 293–309, https://doi.org/10.1016/S0921-8181(01)00096-0, 2001.
IPCC: Climate Change 2014, in Synthesis Report, Contribution of Working Groups I, II and III to the Fifth Assessment Report of the Intergovernmental Panel on Climate Change, p. 151, Geneva, Switzerland, ISBN 978-92-9169-143-2, 2014.
Kane, D. L., Yoshikawa, K., and McNamara, J. P.: Regional groundwater flow in an area mapped as continuous permafrost, NE Alaska (USA), Hydrogeol. J., 21, 41–52, https://doi.org/10.1007/s10040-012-0937-0, 2013.
Lachenbruch, A. H. and Marshall, B. V.: Changing Climate: Geothermal Evidence from Permafrost in the Alaskan Arctic, Science, 234, 689–696, https://doi.org/10.1126/science.234.4777.689, 1986.
Lytkin, V. M. and Galanin, A. A.: Rock glaciers in the Suntar-Khayata Range, Ice Snow, 56, 511–524, https://doi.org/10.15356/2076-6734-2016-4-511-524, 2016.
Makarieva, O., Nesterova, N., Post, D. A., Sherstyukov, A., and Lebedeva, L.: Warming temperatures are impacting the hydrometeorological regime of Russian rivers in the zone of continuous permafrost, The Cryosphere, 13, 1635–1659, https://doi.org/10.5194/tc-13-1635-2019, 2019.
Makarieva, O., Nesterova, N., Shikhov, A., Zemlianskova, A., Luo, D., Ostashov, A., and Alexeev, V.: Giant Aufeis–Unknown Glaciation in North-Eastern Eurasia According to Landsat Images 2013–2019, Remote Sens., 14, 4248, https://doi.org/10.3390/rs14174248, 2022.
Mikhailov, V. M.: Geographical regularities of distribution of floodplain taliks, Izv. Ross. Akad. Nauk. Seriya Geogr., 65, 65–74, https://doi.org/10.15356/0373-2444-2014-1-65-74, 2015.
Osterkamp, T. E. and Gosink, J. P.: Variations in permafrost thickness in response to changes in paleoclimate, J. Geophys. Res.-Sol. Ea., 96, 4423–4434, https://doi.org/10.1029/90JB02492, 1991.
Savelieva, N., Semiletov, I., Vasilevskaya, L., and Pugach, S.: A climate shift in seasonal values of meteorological and hydrological parameters for Northeastern Asia, Prog. Oceanogr., 47, 279–297, https://doi.org/10.1016/S0079-6611(00)00039-2, 2000.
Sokolov, S. D., Tuchkova, M. I., Ganelin, A. V., Bondarenko, G. E., and Layer, P.: Tectonics of the South Anyui Suture, Northeastern Asia, Geotectonics, 49, 3–26, https://doi.org/10.1134/S0016852115010057, 2015.
Sysolyatin, R., Serikov, S., Zheleznyak, M., Tikhonravova, Y., Skachkov, Y., Zhizhin, V., and Rojina, M.: Temperature monitoring from 2012 to 2019 in central part of Suntar-Khayat Ridge, Russia, J. Mt. Sci., 17, 2321–2338, https://doi.org/10.1007/s11629-020-6175-3, 2020.
Takahashi, S., Sugiura, K., Kameda, T., Enomoto, H., Kononov, Y., Ananicheva, M. D., and Kapustin, G.: Response of glaciers in the Suntar–Khayata range, eastern Siberia, to climate change, Ann. Glaciol., 52, 185–192, https://doi.org/10.3189/172756411797252086, 2011.
Walvoord, M. A. and Kurylyk, B. L.: Hydrologic Impacts of Thawing Permafrost-A Review, Vadose Zone J., 15, vzj2016.01.0010, https://doi.org/10.2136/vzj2016.01.0010, 2016.
Yang, D., Kane, D., Zhang, Z., Legates, D., and Goodison, B.: Bias corrections of long-term (1973–2004) daily precipitation data over the northern regions, Geophys. Res. Lett., 32, L19501, https://doi.org/10.1029/2005GL024057, 2005.