the Creative Commons Attribution 4.0 License.
the Creative Commons Attribution 4.0 License.
 | 30 Oct 2023
In situ 10Be modeling and terrain analysis constrain subglacial quarrying and abrasion rates at Sermeq Kujalleq (Jakobshavn Isbræ), Greenland
Brandon L. Graham
Jason P. Briner
Nicolás E. Young
Allie Balter-Kennedy
Michele Koppes
Joerg M. Schaefer
Kristin Poinar
Elizabeth K. Thomas
Glacial erosion creates diagnostic landscapes and vast amounts of sediment. However, knowledge about the rate at which glaciers erode and sculpt bedrock and the proportion of quarried (plucked) versus abraded material is limited. To address this, we quantify subglacial erosion rates and constrain the ratio of quarrying to abrasion during a recent, ∼ 200-year long overriding of a bedrock surface fronting, Sermeq Kujalleq (Jakobshavn Isbræ), Greenland, by combining 10Be analyses, a digital terrain model, and field observations. Cosmogenic 10Be measurements along a 1.2 m tall quarried bedrock step reveal a triangular wedge of quarried rock. Using individual 10Be measurements from abraded surfaces across the study area, we derive an average abrasion rate of 0.13 ± 0.08 mm yr−1. By applying this analysis across a ∼ 1.33 km2 study area, we estimate that the Greenland Ice Sheet quarried 378 ± 45 m3 and abraded 322 ± 204 m3 of material at this site. These values result in an average total erosion rate of 0.26 ± 0.16 mm yr−1, with abrasion and quarrying contributing in roughly equal proportions within uncertainty. Additional cosmogenic 10Be analysis and surface texture mapping indicate that many lee steps are relicts from the prior glaciation and were not re-quarried during the recent overriding event. These new observations of glacier erosion in a recently exposed landscape provide one of the first direct measurements of quarrying rates and indicate that quarrying accounts for roughly half of the total glacial erosion in representative continental shield lithologies.
- Article
(7771 KB) - Full-text XML
- BibTeX
- EndNote


Distinctive features of glacier erosion characterize most glaciated regions, ranging from polished bedrock surfaces to overdeepened fjords. Additionally, vast amounts of sediment are produced via glacial erosion. The Greenland Ice Sheet accounts for a disproportionate delivery of sediment to the oceans, which impacts marine ecosystems and carbon sequestration (e.g., Overeem et al., 2017). The two dominant mechanisms of glacier erosion are subglacial quarrying and abrasion (Alley et al., 2019). Quarrying occurs when bedrock blocks are episodically entrained and removed by overriding glaciers (e.g., Hallet, 1996; Iverson, 2012; Koppes, 2022). Abrasion occurs via the gradual wearing down of bedrock surfaces as rock fragments are entrained and pressed into the bed by sliding ice (Hallet, 1979; Iverson, 1990, Koppes, 2022). The rate at which each of these processes occurs is dictated by rock properties (e.g., Matthes, 1930; Dühnforth et al., 2010; Krabbendam and Glasser, 2011), glacio-hydraulic factors (e.g., Egholm et al., 2012; Zoet et al., 2013; Anderson, 2014), and climate (e.g., Cook et al., 2020; Koppes, 2022). Although the result of the work done by glaciers on landscapes is dramatic, observational datasets that constrain how quickly landscapes are modified by ice remain sparse (Alley et al., 2019).
Despite considerable challenges in observing erosional processes occurring under ice, our understanding of subglacial erosion rates continues to expand. Total glacial erosion rates (i.e., abrasion plus quarrying) have been inferred using a variety of both direct and indirect approaches (e.g., Hallet et al., 1996; Herman et al., 2021; Koppes, 2022) and are found to generally fall between 0.01 and ≥1 mm yr−1; however, higher rates have been measured on short (annual–decadal) timescales (e.g., Koppes and Montgomery, 2009; Cowton et al., 2012). Attempts at separating the components of quarrying and abrasion have been made based on sediment flux measurements (e.g., Loso et al., 2004; Riihimaki et al., 2005), cosmogenic nuclide inversions across subglacial bedforms (e.g., Briner and Swanson, 1998), and theoretical considerations related to sparsely versus intensely fractured bedrock (e.g., Anderson, 2014). To date, measurements that isolate the eroded rock volume that can be attributed to quarrying are rare.
Here, we quantify subglacial erosion at a site that experienced a well-constrained advance–retreat cycle of Sermeq Kujalleq (Jakobshavn Isbræ), a major outlet glacier in West Greenland (Fig. 1). We partition total erosion into abrasion and quarrying by pairing cosmogenic 10Be measurements with analysis of a high-resolution terrain model and field mapping of bedrock surface textures. We model the accumulation of cosmogenic 10Be that we measured across a quarried bedrock step to reconstruct the surface profile of the removed material and the abrasion depth in adjacent surfaces. Our data allow us to identify which bedrock steps experienced quarrying during the most recent advance of the ice versus those unaltered since the prior glaciation. We thus calculate the volume of rock removed during the recent overriding event by abrasion and quarrying and estimate the average erosion rate of each over the duration of glacier overriding.
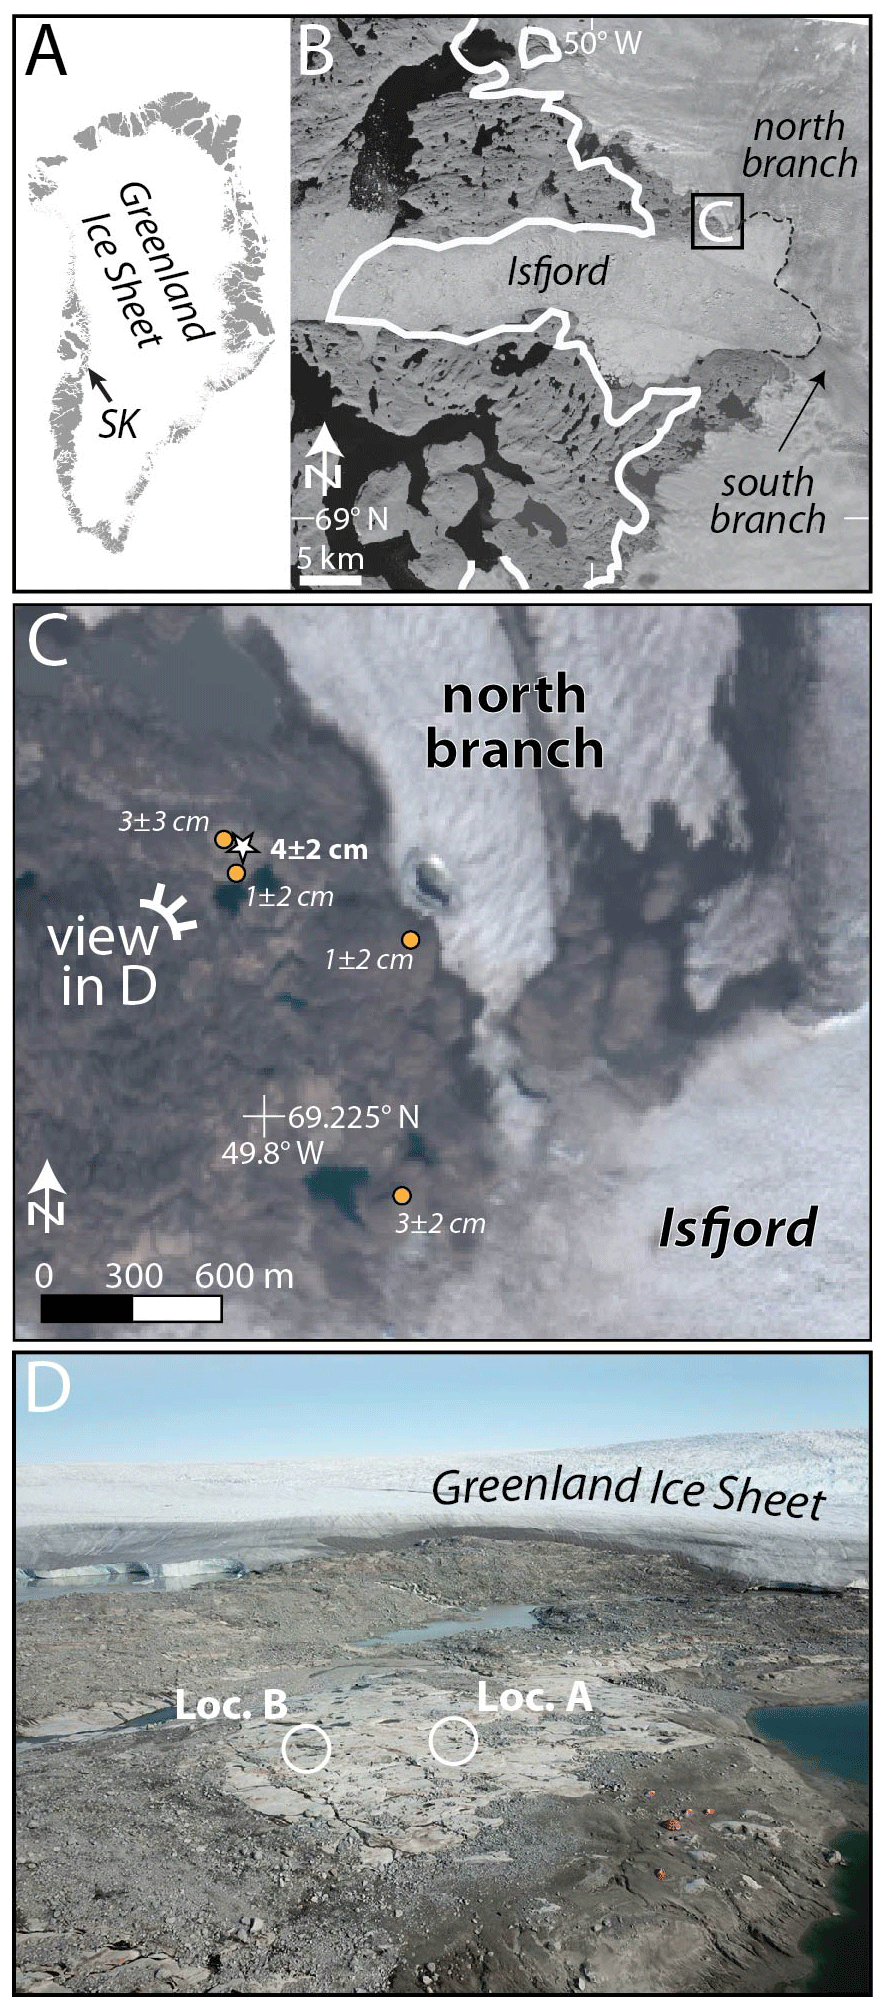
Figure 1(a) Greenland. (b) Study region in August 2018; the white line shows the extent of Sermeq Kujalleq in 1850 CE, and the dashed line is the 2018 terminus. (c) Study area showing glacial erosion depths from Balter-Kennedy et al. (2021) and this study (star). (d) Oblique drone photograph of the study area (point of view shown in panel c) showing study sites A and B (located near the star in panel c). The base image in panels (b) and (c) is a Landsat satellite image.
Greenland Ice Sheet margins are presently retreating, exposing terrain that was ice-covered during the latest Holocene advance that generally coincides with the Little Ice Age (Kjær et al., 2022). The northern and southern branches of Sermeq Kujalleq merged and extended westward ∼ 35 km within the fjord to attain the “historical limit,” which was observed in the fjord in 1850 CE (Fig. 1; Weidick and Bennike, 2007). Along the fjord, the historical limit is represented by a recognizable trimline, and north and south of the fjord, prominent end moraines can be mapped to demarcate the extent of the “historical advance.” In addition to the 1850 CE observation, this latest Holocene advance–retreat cycle has been dated in this region with lake sediment records (Briner et al., 2010, 2011) and a variety of imagery datasets (Csatho et al., 2008). The retreat of ice at our study site took place between 2008 and 2010 CE.
During the Last Glacial Maximum (LGM), the Greenland Ice Sheet margin in the Sermeq Kujalleq sector rested on the continental shelf edge in Baffin Bay far west of Disko Bugt (e.g., Hogan et al., 2016). During the last deglaciation, the ice sheet margin retreated eastward and eventually onto land on the eastern shores of Disko Bugt around 10 000 years ago. Later the ice margin retreated to within (east of) the extent of ice later attained during the historical limit. Prior authors calculated the timing of deglaciation to the historical limit at 7500 years ago (Young et al., 2011; Balter-Kennedy et al., 2021) and to the present ice position at 7400 years ago. It is thought that Sermeq Kujalleq receded during the Holocene deglaciation to a position ∼ 20 km inland of the present ice margin (Weidick et al., 1990; Kajanto et al., 2020). We infer that ice flowed over our study site for a duration of 220 ± 5 years. The advanced phase timing stems from prior research at an ice-dammed lake (which drained in 1990) that was first dammed (based on varve counts) around 1800 CE (Briner et al., 2011). As in Young et al. (2016), we estimate that the ice had advanced across our study area about a decade prior to it reaching the site of the ice-dammed lake, resulting in our estimate of 1790 CE as the timing of ice arrival in our study area. The retreat of ice from our study site in 2010 CE is based on historical imagery (Balter-Kennedy et al., 2021). Our study builds on Young et al. (2016) and Balter-Kennedy et al. (2021), who utilized cosmogenic 10Be measurements to quantify total subglacial erosion rates of the gneissic bedrock in this area (Fig. 1).
In August 2018, we investigated a bedrock forefield adjacent to the northern branch of Sermeq Kujalleq at 69.23∘ N and 49.81∘ W. The surface of glacially abraded and quarried bedrock exhibits pristine features of glacial erosion (Fig. 2). The study site contains competent, hard crystalline rock with widely spaced fractures (on the order of several meters). We measured ice flow orientations, noted rock surface texture (variations in surface roughness are accompanied by tonal differences in the color of rock surfaces), used drone imagery to generate a high-resolution digital terrain model, and collected samples for cosmogenic 10Be measurements.
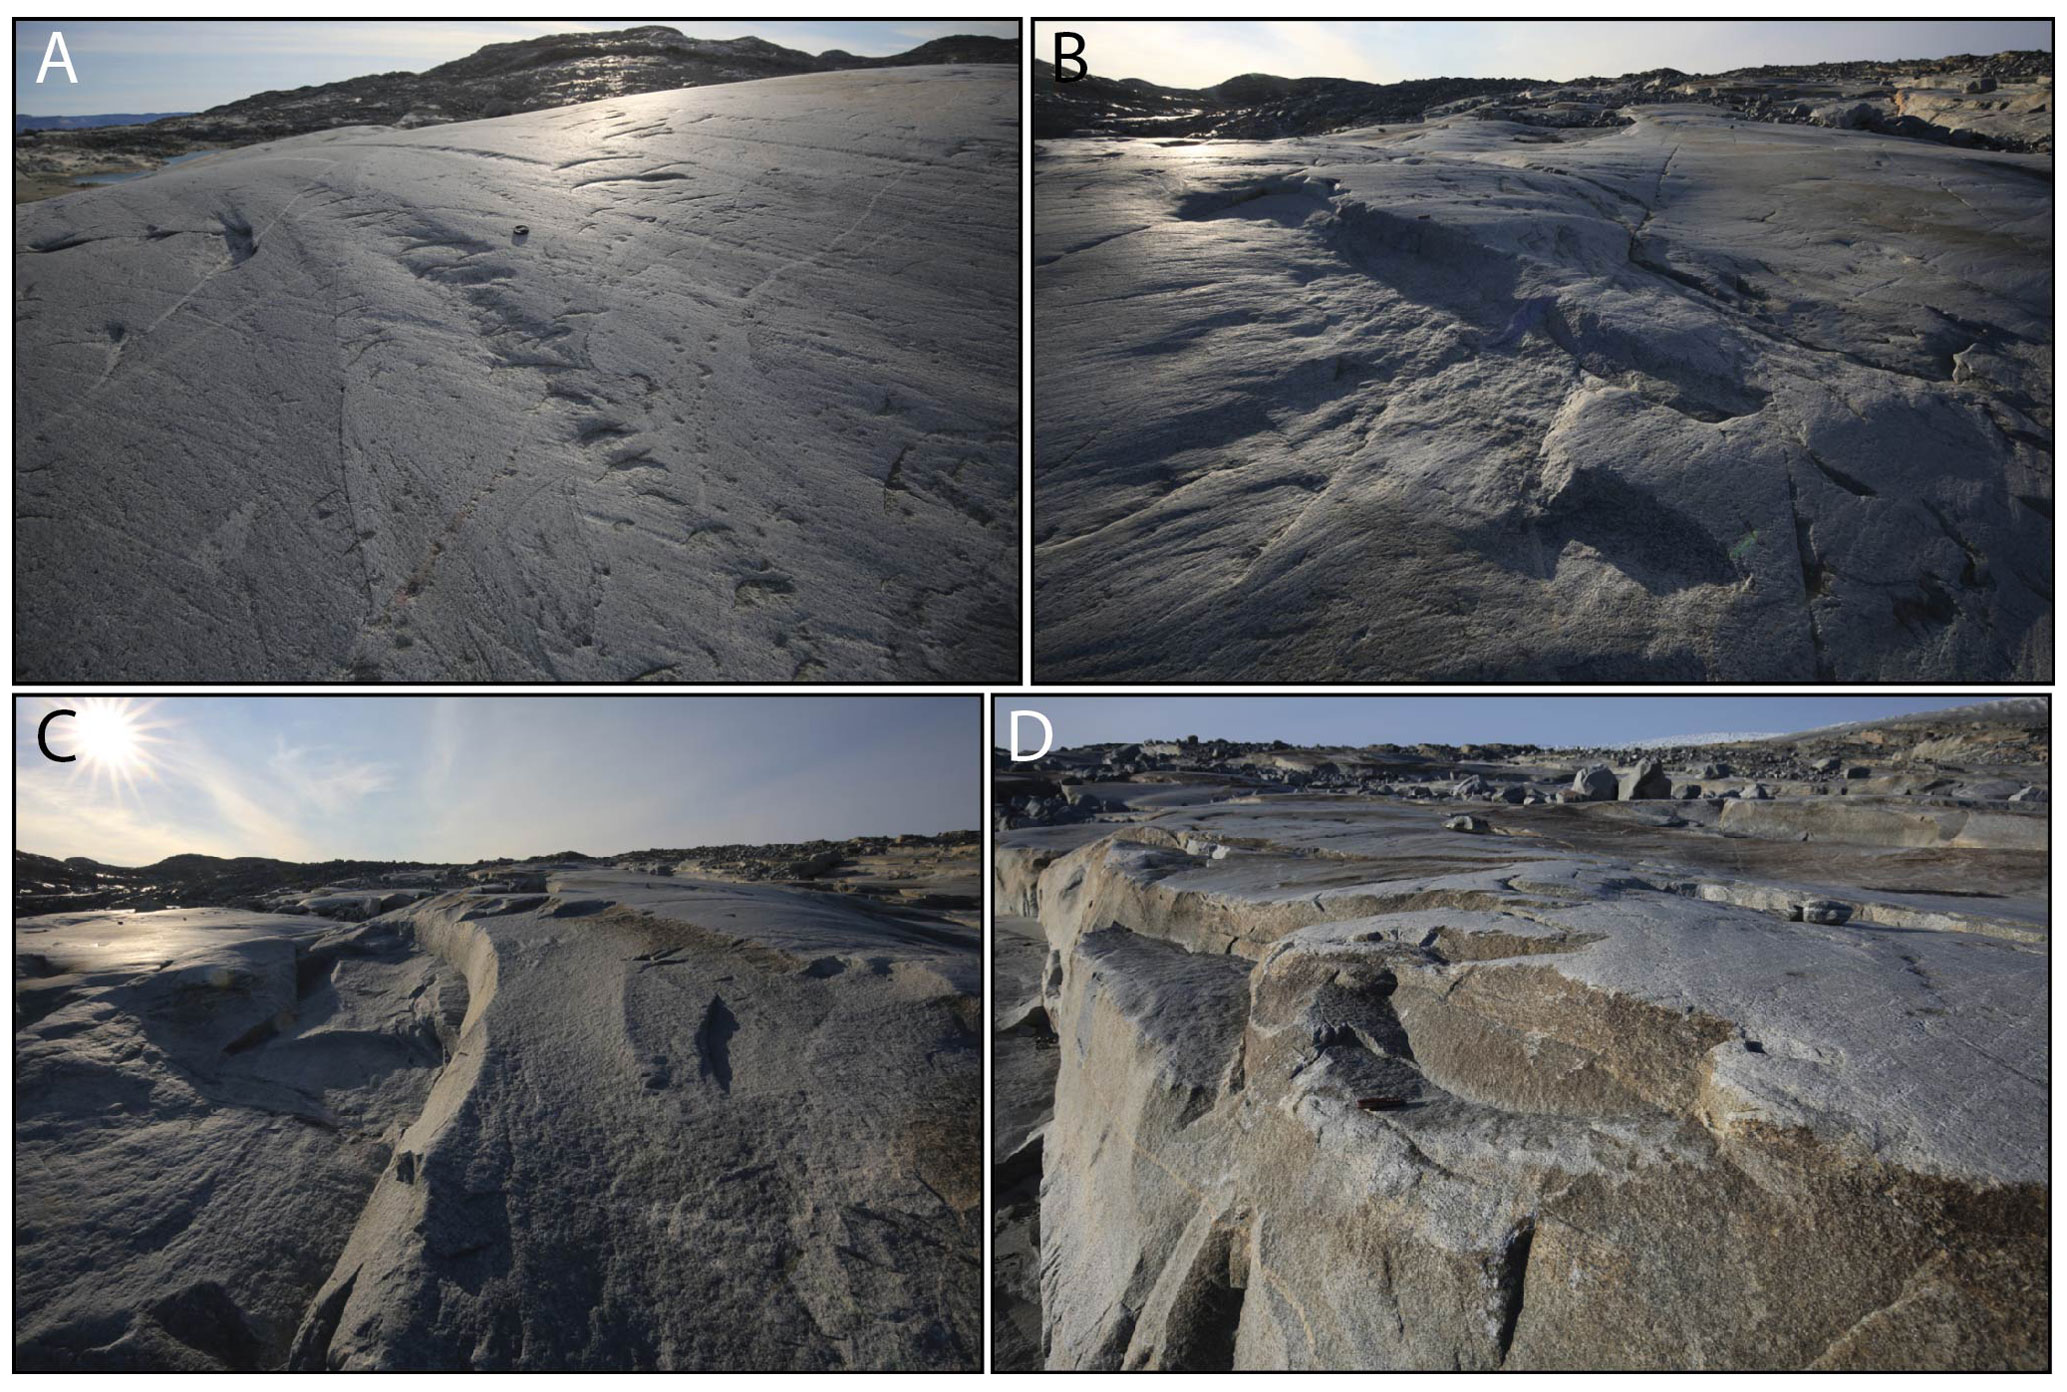
Figure 2Photographs of surfaces in the study area. (a) Heavily abraded and polished surface showing one of the many “gouge trains” (view to SW). (b) Small lee step (approximately 20 cm high) within a heavily abraded and polished zone; note the downflow from the lee cliff in a zone with more lightly abraded surfaces. (c) Fresh surfaces with minor grain-to-grain relief and limited evidence for abrasion shown within quarrying “scars”. (d) Focus on a lee step (approximately 1 m high) showing the transition from a heavily abraded stoss surface (lightly colored) to darker-colored, fresh lee faces; some of the dark color in this image is from subglacial precipitate “staining”.
Two stoss and lee land forms were chosen for detailed cosmogenic 10Be analysis, with the goal of characterizing quarrying volume and timing. The premise of this approach requires no 10Be in these surfaces inherited from prior to previous glaciation (the LGM in this case). After extensive 10Be dating in the region of heavily scoured surfaces, inheritance seems absent (e.g., Young et al., 2013a). We chose one land form (Location A; Fig. 3a) to (1) estimate the dimensions of the bedrock removed based on the geometry of a quarried divot, where there is a sharp transition from rough to abraded surface roughness surrounding the quarried zone; and (2) use 10Be concentrations in samples collected from the quarried divot to reconstruct the profile of the pre-quarried surface. We created a 3D forward model of cosmogenic 10Be production to estimate the shape of the quarried material (single or multiple blocks) at location A. The fundamental setup of our conceptual model is shown in Fig. 4. At another site (Location B; Fig. 3b), there are two adjacent lee steps, each exhibiting a different surface roughness (one rougher, one smoother). Here, we measured the 10Be concentration at the base of each step to test our hypothesis that different surface roughnesses relate to quarrying during the historical (Little Ice Age) overriding versus the prior LGM glaciation.
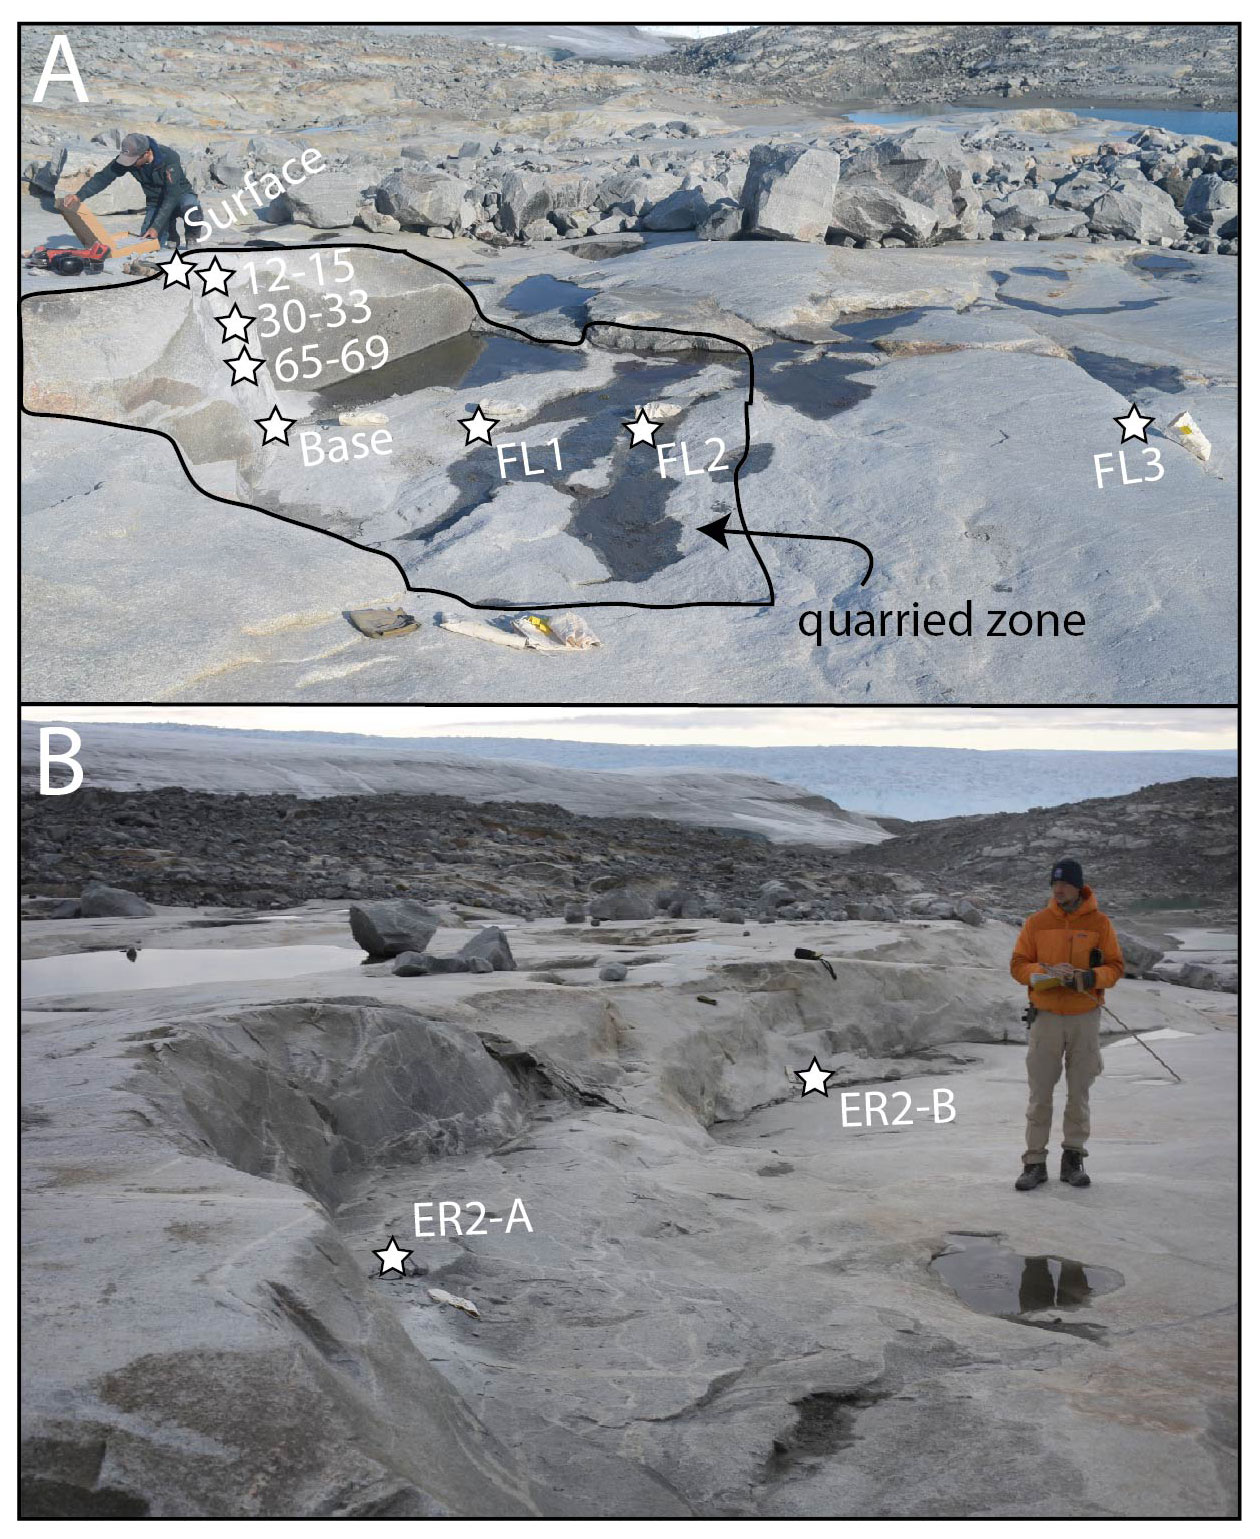
Figure 3(a) Study location A; the enclosed area is the extent of the quarried material. Stars are the locations of 10Be measurements. (b) Study location B; pair of quarried zones with a fresh, rough lee surface (left; sample ER2-A) and a smooth, abraded lee surface (right; sample ER2-B).
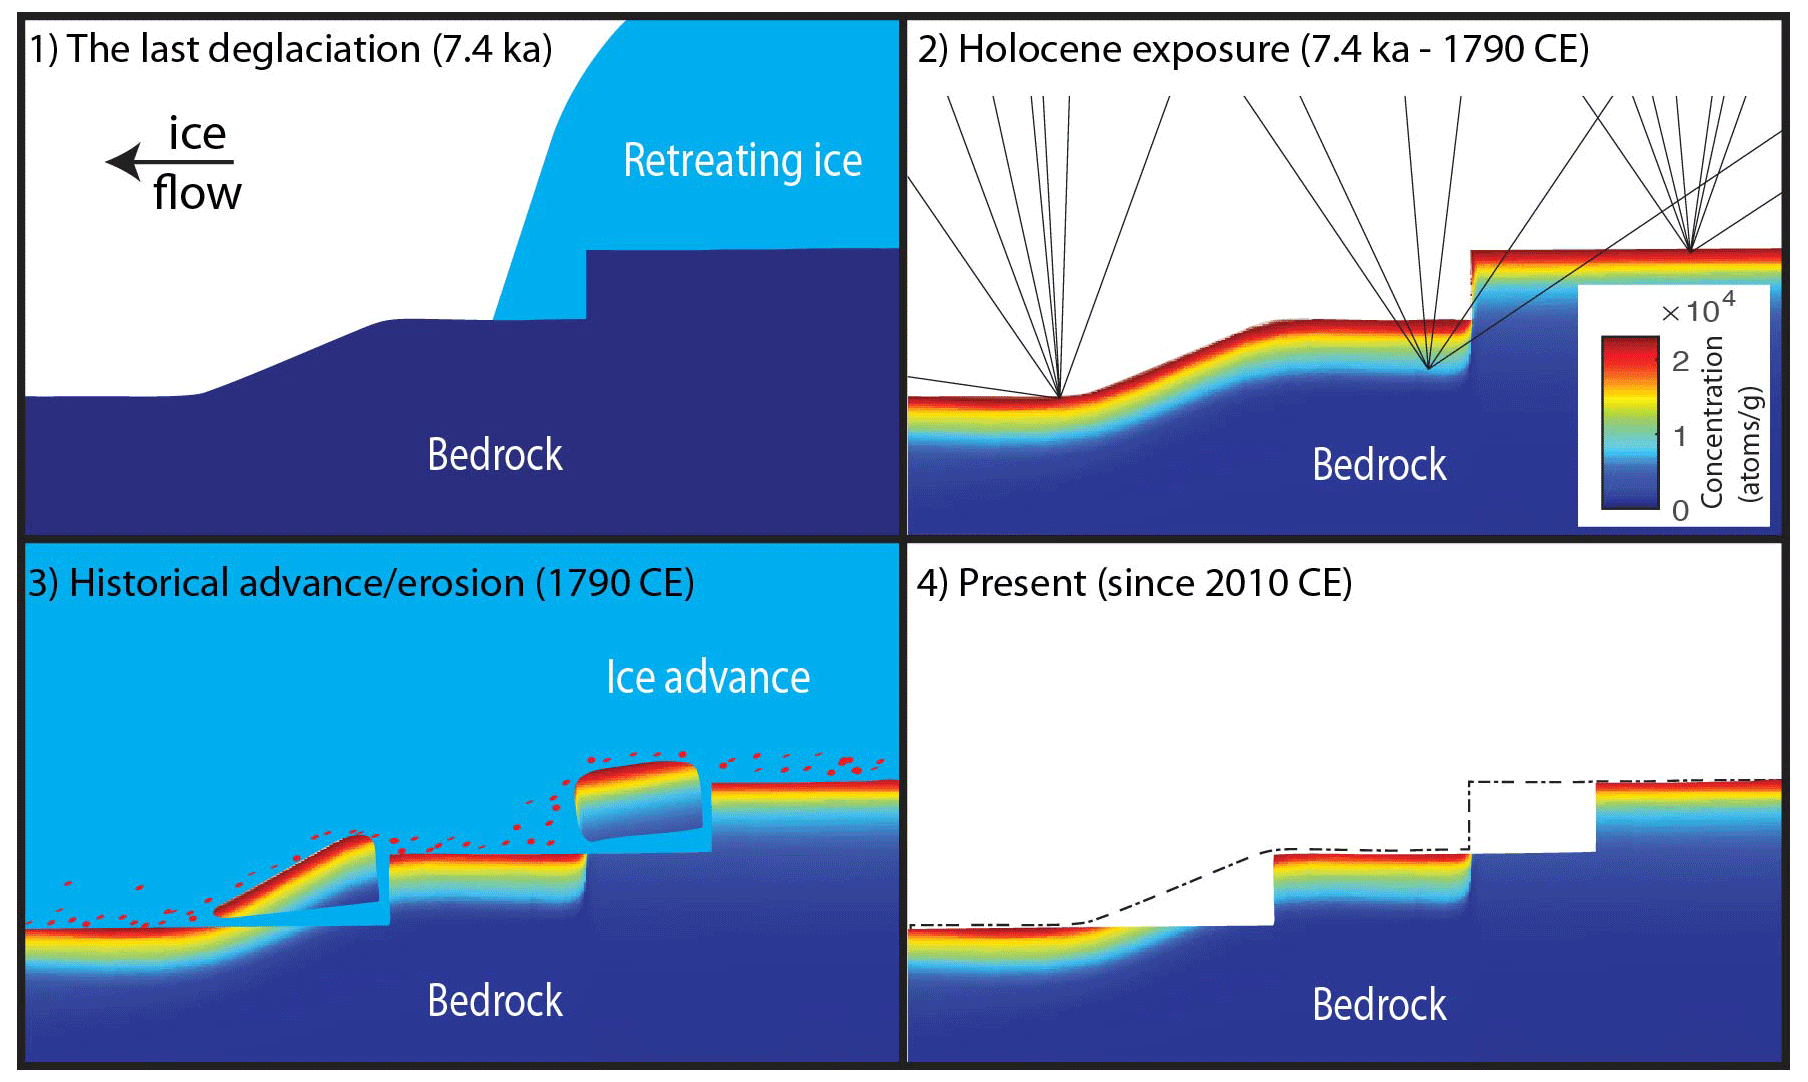
Figure 4Concept model for 10Be production and concentration for the field area. (1) Retreat of the ice sheet from the field area (7.4 ka). Erosion during the last glaciation is sufficient to remove 10Be to background levels. (2) The paleo-surface is exposed to cosmic radiation during the Holocene until ice overrides at ∼ 1790 CE, building up 10Be in the upper ∼ 2 m of bedrock. (3) Ice re-advances and erodes via abrasion and quarrying during the historical advance. (4) The present-day surface is exposed in 2010 CE.
3.1 Field sampling for 10Be analysis
At Location A, we measured 10Be concentrations in five samples on the lee face: the top of the lee cliff (“surface”) and from 12–15, 30–33, 65–69, and 110–115 cm at the base. Wide, thin samples were collected (30 cm width × 3–5 cm height × 2–4 cm depth) to optimize the quartz mass within a narrow depth range and to minimize depth integration. We also collected three samples along the horizontal floor, two from within the quarried scar (1.2 and 2.1 m from the cliff base) and one beyond the distal edge of the quarried scar from a polished surface (5 m from the cliff base; Fig. 3). At Location B, we collected one sample from the base of the lee cliff from each zone (Fig. 3). All the samples were collected with a combination of a Hilit-brand angle grinder with 12.7 cm diameter diamond bit blades, a hammer, and a chisel. At all the sampling locations, field observations of topographic shielding were collected using a Brunton compass. Location and elevation were collected with a GPS time-averaging smartphone application with ±5 m accuracy.
3.2 Terrain analysis and surface textures
Aerial imagery was collected with a DJI Mavic Pro uncrewed aerial vehicle (UAV) with continuous and overlapping nadir imagery acquired using DJI smartphone app software. Maps Made Easy (https://www.mapsmadeeasy.com, last access: 26 April 2023) was used to generate orthoimagery and a digital elevation model (DEM) of the field area using structure-from-motion principles (Graham, 2023). Mosaic imagery was used as a base layer for field-mapping three surface roughness categories of the stoss and lee land forms based on the degree of freshness (1: freshly fractured exposed surfaces with minor grain-to-grain relief and no apparent abrasion; 2: lightly abraded; 3: heavily abraded and polished). We also observed that the fresh-appearing fracture surfaces exhibited darker surface colors and that smoother surface textures exhibited lighter surface colors. The orientations of ice flow indicators consisting of striae, chatter marks, and crescentic gouges were measured using a compass.
3.3 Beryllium-10 laboratory methods
All physical rock processing and isolation of quartz for 10Be analysis were performed at the University at Buffalo Cosmogenic Isotope Laboratory (Corbett et al., 2016; Kohl and Nishiizumi, 1992). Pure quartz was processed at the Lamont-Doherty Earth Observatory cosmogenic dating laboratory following established beryllium-extraction procedures. We processed eight samples from Location A and two samples from Location B. AMS measurements of were performed at the Center for Accelerator Mass Spectrometry at Lawrence Livermore National Laboratory (LLNL-CAMS) with references relative to the 07KNSTD standard of a known ratio of 2.85 × 10⁻¹² (Nishiizumi et al., 2007). Measured 1σ analytical uncertainty ranged from 1.77 % to 3.43 % (Table 1). Apparent exposure ages were calculated using the online cosmogenic age calculator v3 (Balco et al., 2008) and the Baffin Bay 10Be production rate calibration dataset (Balco et al., 2008; Young et al., 2013b). Apparent exposure age refers to the calculated age if the samples were at the surface and experienced zero erosion. Although these apparent ages are not used in our erosion models, they are instructive in analyzing and visualizing the context of the data based on a priori assumptions.
Table 1MCMC parameters a priori and a posteriori.
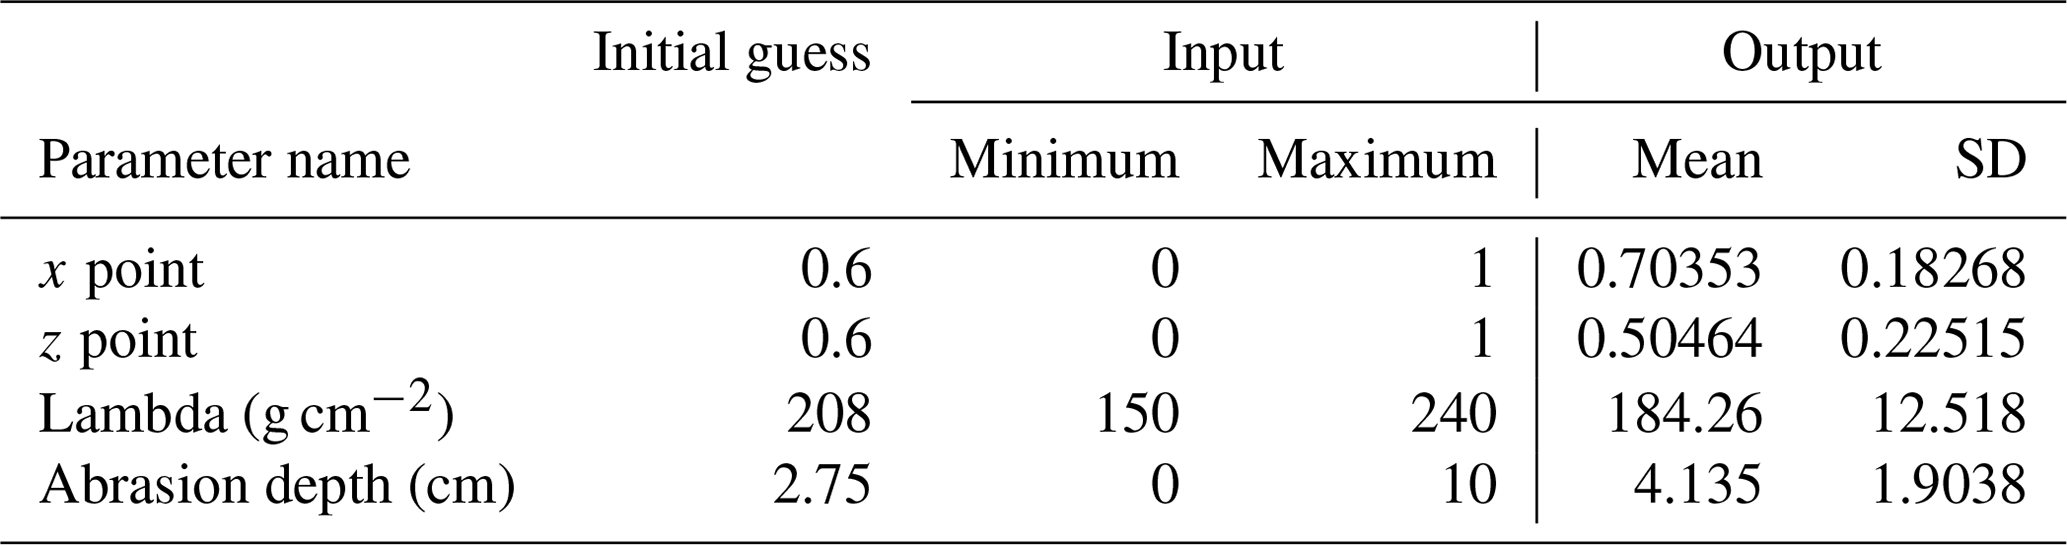
The a priori input into the MCMC inverse and the a posteriori output from the model runs are those that minimized the chi-squared reduction. SD: standard deviation.
3.4 Cosmogenic nuclide modeling
Following Balco (2011), we created a 3D forward model (Graham, 2023) of cosmogenic 10Be production in the upper 1.2 m of the glacially eroded bedrock at Location A using the known exposure and burial history. The history we adopt is shown in Fig. 4 and is as follows: exposure from 7400 years ago to 1790 CE (∼ 7200 years of exposure), burial from 1790 to 2010 CE (220 years of burial or erosion), and exposure from 2011 to 2018 CE (year of sample collection). We use the model to not only quantify the pre-quarrying surface, but also to determine the sensitivity of the specific sampling locations in the resulting divot. We thus prioritized certain sample locations from the vertical (lee) face to optimize the number of samples measured. To start, we simulated the 10Be concentrations using a variety of pre-quarrying surface shape geometries ranging from a rectangular cross section to a triangular cross section to a geometry that is the same as the present-day surface. End-members of these pre-quarrying surface options are illustrated as the purple, green, and red lines in Fig. 5b. Three-dimensional representations were generated by extending the 2D surface profiles laterally. This simplified the hypothetical surface models and was justified by the presence of laterally similar surface profiles observed on the landscape. Simulated cosmic particle bombardment was prescribed based on Gosse and Phillips (2001) for azimuth and elevation angles through the simulated overlaying bedrock to each sample location.
We next created an inverse model to solve for the pre-quarrying surface profile at Location A. An adaptive Metropolis–Hastings Markov chain Monte Carlo (MCMC) MATLAB solver package (Haario et al., 2006) was implemented to estimate the parameters necessary for minimizing the chi-squared reduction of the estimated 10Be concentrations to the measured 10Be concentrations. The unknown parameters were (1) the surface profile x (horizontal distance within the quarried block) inflection point, (2) the surface profile z (depth) inflection point, (3) the depth of the surface abrasion applied equally across all the samples, and (4) the absolute attenuation length (Λabs) of the high-energy neutron spallation through the rock. Acceptable a priori parameter ranges were initially prescribed (Table 1). We used the MCMC inversion to solve for the posterior parameters that correspond to the minimized 10Be concentrations through the chi-squared reduction. Due to the relatively shallow maximum sample depth (∼ 1.2 m) and the small amount of abrasion previously estimated by Balter-Kennedy et al. (2021), muon production is minimal and approximately linear across the narrow depth range. Therefore, we treated production via muons as a linear function of depth across all the sample sites using a computationally efficient approximation of muon production rates near the Earth's surface (Balco, 2017).
The surface profile was generated via a point with X, Z coordinates located within the pre-quarrying geometries prescribed above. To expand laterally, a 25-point smoothed surface interpolation (MATLAB function pchip) was applied between the generated point and the edges of the quarried block (top of the stoss cliff and the rough-to-smooth transition around the perimeter of the quarried block). The initial estimate of abrasion depth for the model is based on an abrasion depth estimate from the surface sample 18JAK-Surface following the methods described in Briner and Swanson (1998) and Young et al. (2016) and is independent of but complementary to results obtained by Balter-Kennedy et al. (2021). The absolute attenuation length (Λabs) is based on the range of values estimated in Gosse and Phillips (2001). Most estimations of spallation attenuation with depth rely on the apparent attenuation length (Λapp) because they assume a horizontally infinite half-space or a flat surface profile, which the sample lies beneath at some depth z (cm). Due to the off-zenith incoming cosmic particles traveling through an increasing length of mass, an integrated value of attenuation results in the apparent attenuation (Dunai, 2010). Because our research incorporates a complex surface model, the absolute attenuation length is required to properly simulate the attenuation through varying thicknesses of rock from off-zenith angles. Our inversion results in an estimate for an absolute attenuation length of 184 ± 13 g cm−2. When converted to an apparent attenuation length via Λapp = abs, this becomes 141 ± 10 g cm−2 and is within the range reported for the Arctic by Gosse and Phillips (2001).
3.5 Terrain analysis and volume of quarried material
We applied the resulting most probable profile of the quarried block at Location A (see Results) to other divots that were quarried during the historical advance. Incidentally, the shape of the quarried material is consistent with, and could largely be defined by, the non-quarried surfaces surrounding the quarried divots. Informed by results from the cosmogenic nuclide measurements at Location B and surface texture mapping, we identified which of the quarried divots were excavated during the historical advance versus glacier overriding associated with the last glaciation. The latter quarried zones were excluded from the analysis to prevent overestimation of the quarried rock volume attributed to the historical overriding event. All geographical information system (GIS) analysis was performed in QGIS Desktop 3.16 Long Term Release, with all the datasets transformed to NSIDC Sea Ice Polar Stereographic North. The UAV-generated DEM, with a nominal 0.03 m raster cell size after transformation, was re-gridded to 0.05 m cell size to which all further raster analysis was standardized. We defined our field area based on the extent of an exceptionally bedrock-rich part of the glacier forefield, with a higher degree of surface sediment cover around its periphery. Some areas of sediment cover from within our outlined study zone are excluded because they occluded accurate identification of the underlying surface texture and are not included in area calculations of the study site.
We defined the quarried zones attributed to the historical advance with polygons and removed them from the DEM of the present-day surface. We then interpolated a synthetic surface across the missing holes in the DEM to recreate the pre-1790 CE surface, or “paleo-surface”, using the geometry guided by results from Location A. Next, we generated a difference map between the paleo-surface DEM and the present-day surface DEM. We then summed these values from the difference map. Finally, when applying the resultant abrasion rate across the study area, we estimated a cavity area below each of the historically quarried zones (assuming a seasonally averaged cavity roof of 45∘) and subtracted this area from the total study area.
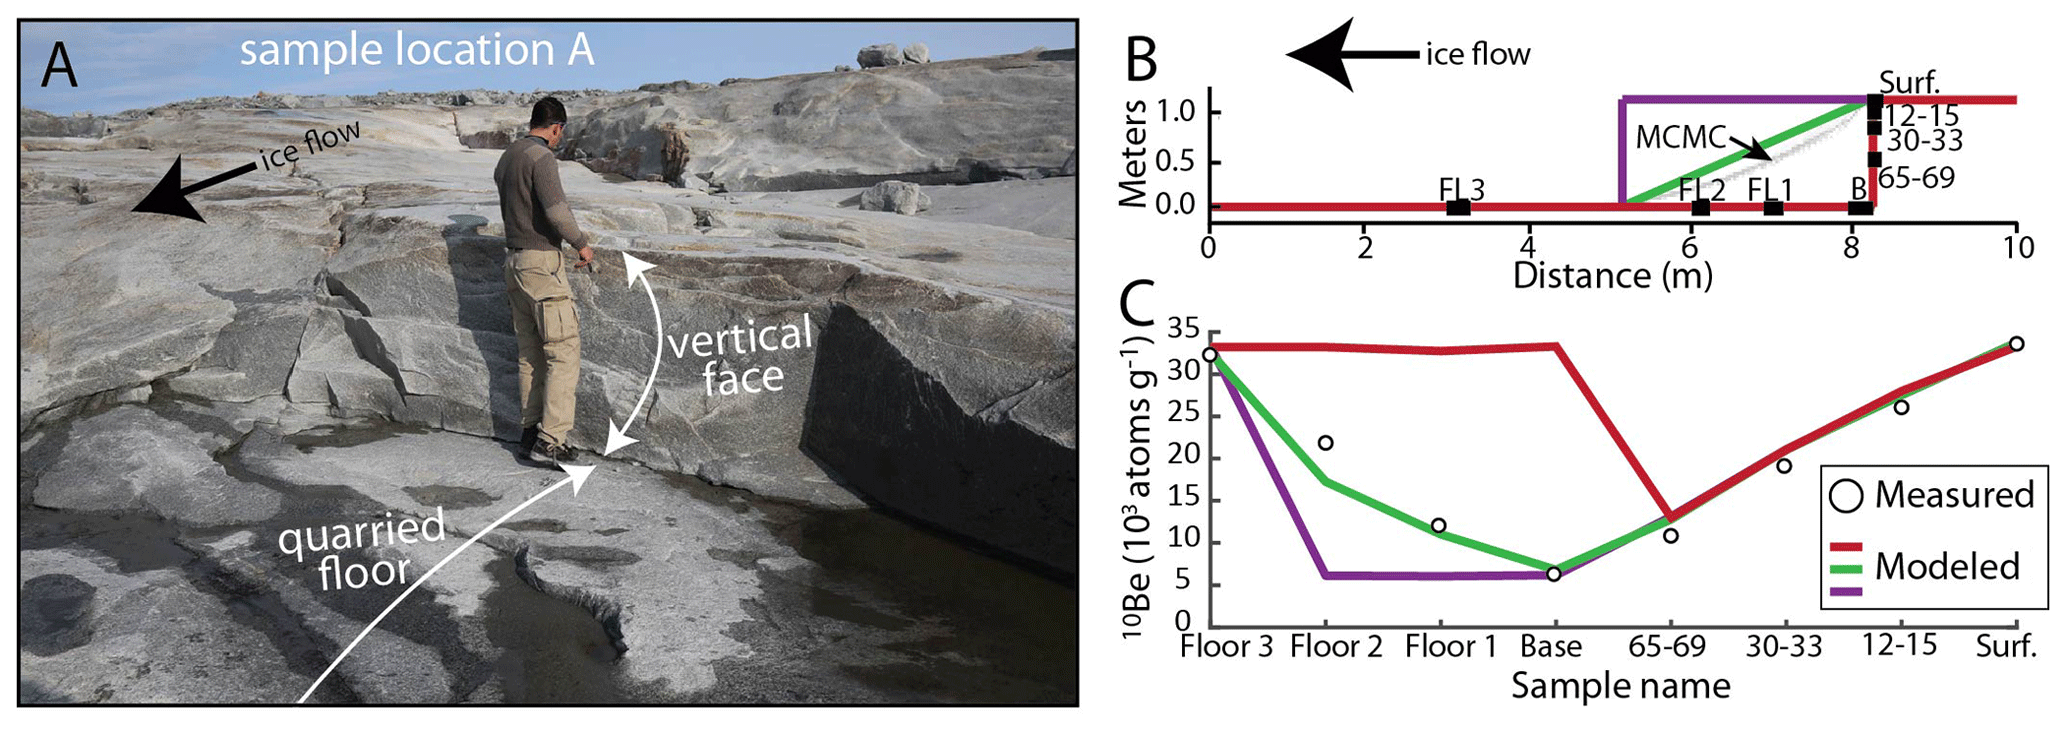
Figure 5(a) Photograph of Location A (see also Fig. 3a) showing a fresh quarried face and floor. (b) Cross-sectional representation of the 3D model domain for Location A. Sample locations are marked as black boxes. The red line shows the present-day surface profile, while the purple and green lines show the rectangular and triangular pre-quarrying surface profiles, respectively, used in forward modeling. The thin gray lines are the minimized surface profiles from the MCMC inversion. (c) Measured (small circles) and simulated (lines in color) 10Be concentrations of the three forward-model scenarios; the colors match those in panel (b).
The 10Be concentrations from Location A (Table 2) decrease with depth and increase along the floor outwards from the lee cliff base (Fig. 5a and b). All the samples result in lower apparent exposure ages than the estimated exposure duration of 7200 years (7400 years deglaciation minus 200 years of subsequent burial), indicating that glacial erosion took place recently. The best fit of our forward model is a triangular wedge shape of removed material (Fig. 5b and c, green). This shape is supported by the surface morphology and textures adjacent to the quarried divot. Furthermore, this triangular wedge shape is supported by the MCMC model, which reveals a slightly concave pre-quarried block surface (see “MCMC” in Fig. 5b). Additionally, our MCMC modeling using all samples at Location A yielded a surface abrasion depth of 4.1 ± 1.9 cm (Table 1). When using individual samples from the top (stoss) side of the lee ledge and from beyond the quarried divot, we derive abrasion depths of 2.7 ± 1.1 and 5.8 ± 1.1 cm, respectively.
Table 2Beryllium-10 sample data.
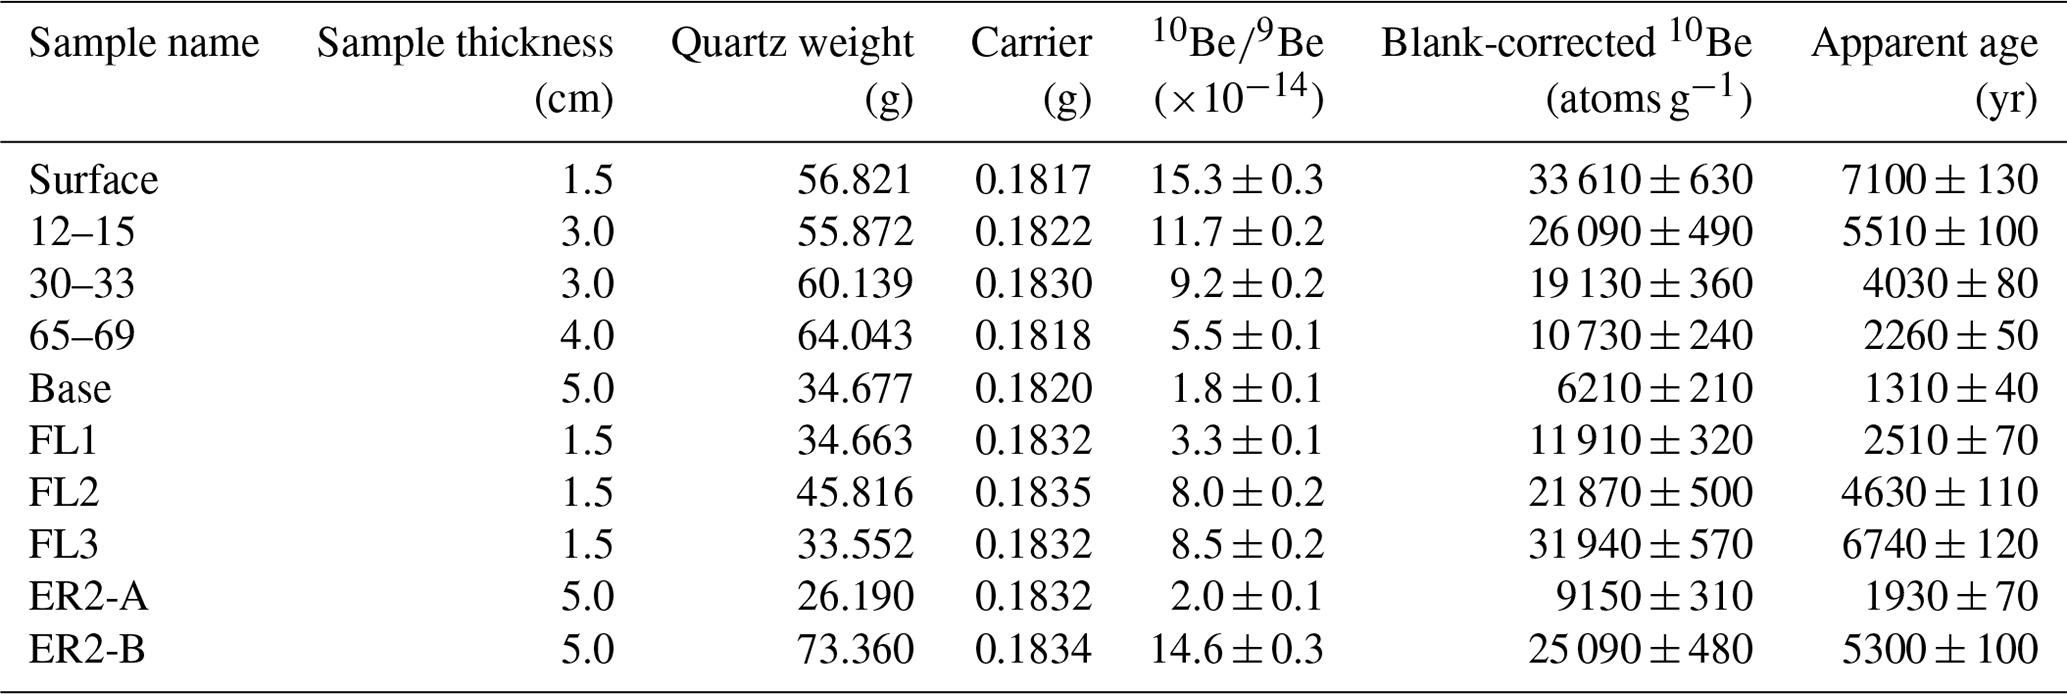
Location A samples were located at 69.2316∘ N and 49.8093∘ W. Location B samples (ER2) were located at 69.2318∘ N and 49.8103∘ W. All the samples were at an elevation of 107 m a.s.l. Sample density is 2.65 g cm−3, and the 07KNSTD Be standard was used. The apparent age is the St scaling apparent exposure duration, assuming no shielding.
To estimate an abraded volume of the study site, we consider several distinct abrasion rates calculated across the study area. Combining abrasion depths mentioned above with four nearby values reported by Balter-Kennedy et al. (2021) yields an average abrasion depth of 2.78 ± 1.84 cm and an abrasion rate of 0.126 ± 0.084 mm yr−1 (Table 3). Calculating the volume of material abraded requires the removal of areas where cavities existed in the immediate lee of bedrock steps. Although cavities change in size seasonally, we estimate that 12 % of the field area consists of cavities assuming a 45∘ sloping cavity roof from the lip of bedrock steps. We thus calculate a volume of 323 ± 204 m3.
Table 3Eroded rock volume and glacial erosion rates.
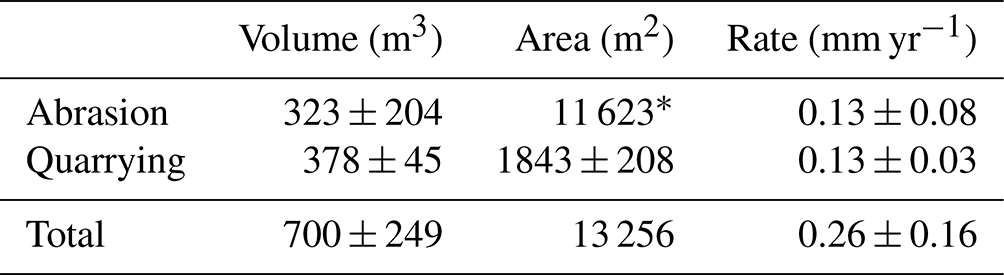
* This value is 12 % less than the total area because of the estimated area of subglacial cavities.
Results from Location B show significant differences in the measured 10Be concentrations between the two lee steps. Sample ER2-A was collected at the base of an 85 cm tall lee face that exhibits a fresh (non-polished) surface texture and a darker color (Fig. 3c). Its apparent exposure age of 2.3 ka (accounting for shielding using the present topography) is significantly less than the expected age of ∼ 7.2 ka, indicating quarrying during the historical advance over the site. Sample ER2-B is from the base of a 120 cm tall lee cliff and exhibits a lightly abraded texture and lighter color (Fig. 3b). Its apparent exposure age when accounting for shielding using the present topography is 6.9 ka. We attribute the difference in the apparent age of sample ER2-B and its expected age of 7.2 ka to a few centimeters of abrasion and, more importantly, to a lack of quarrying during the historical advance. Thus, the results from Location B indicate that other bedrock steps that exhibit smoother, lightly abraded surfaces were quarried during LGM glaciation and that only rougher, darker-colored surfaces in some lee faces were quarried during the historical advance.
Our field mapping of rock surface textures exhibits quarried zones with a mixture of rough-fractured and smooth-abraded lee surfaces. We identified 73 quarried zones classified with rough-textured, dark-colored surfaces (“historical” quarrying) and 84 quarried zones classified as having slight smoothing and a lighter surface tone (quarrying during the last glaciation; Fig. 6). Of the 73 quarried zones, 63 were identified as triangularly shaped based on the localized topography around each quarried zone, as was the case at Location A, which we confirmed with cosmogenic nuclide measurements and modeling. The remaining 10 locations were identified as likely to have been rectangular blocks, and the rock volume quarried at these sites was calculated by doubling the volume generated by a triangular cross section.
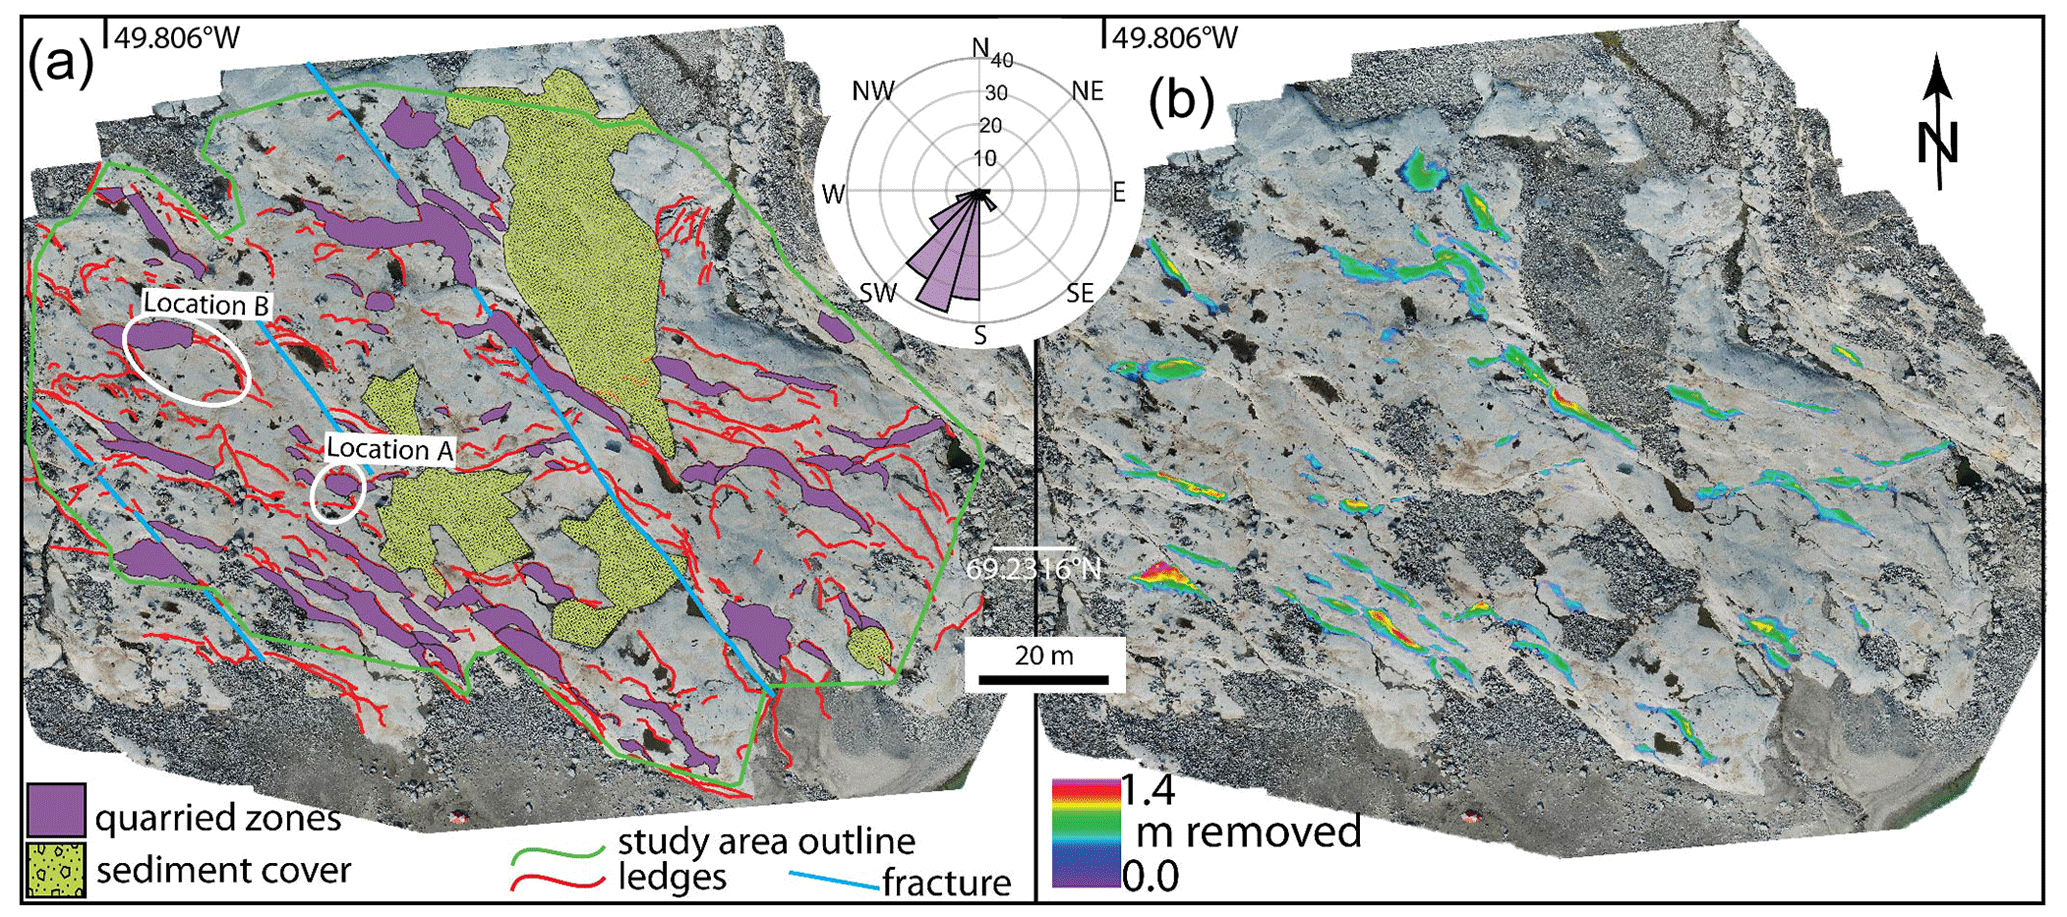
Figure 6(a) Orthoimage of the field area showing fractures (blue lines) and lee cliff faces (red lines). Zones quarried during the most recent glacial advance are outlined in purple and sediment cover in yellow. The rose diagram (inset) shows all the measured ice flow indicators (in the direction of ice flow). (b) Elevation differences in quarried divots assigned to block removal during the historical advance.
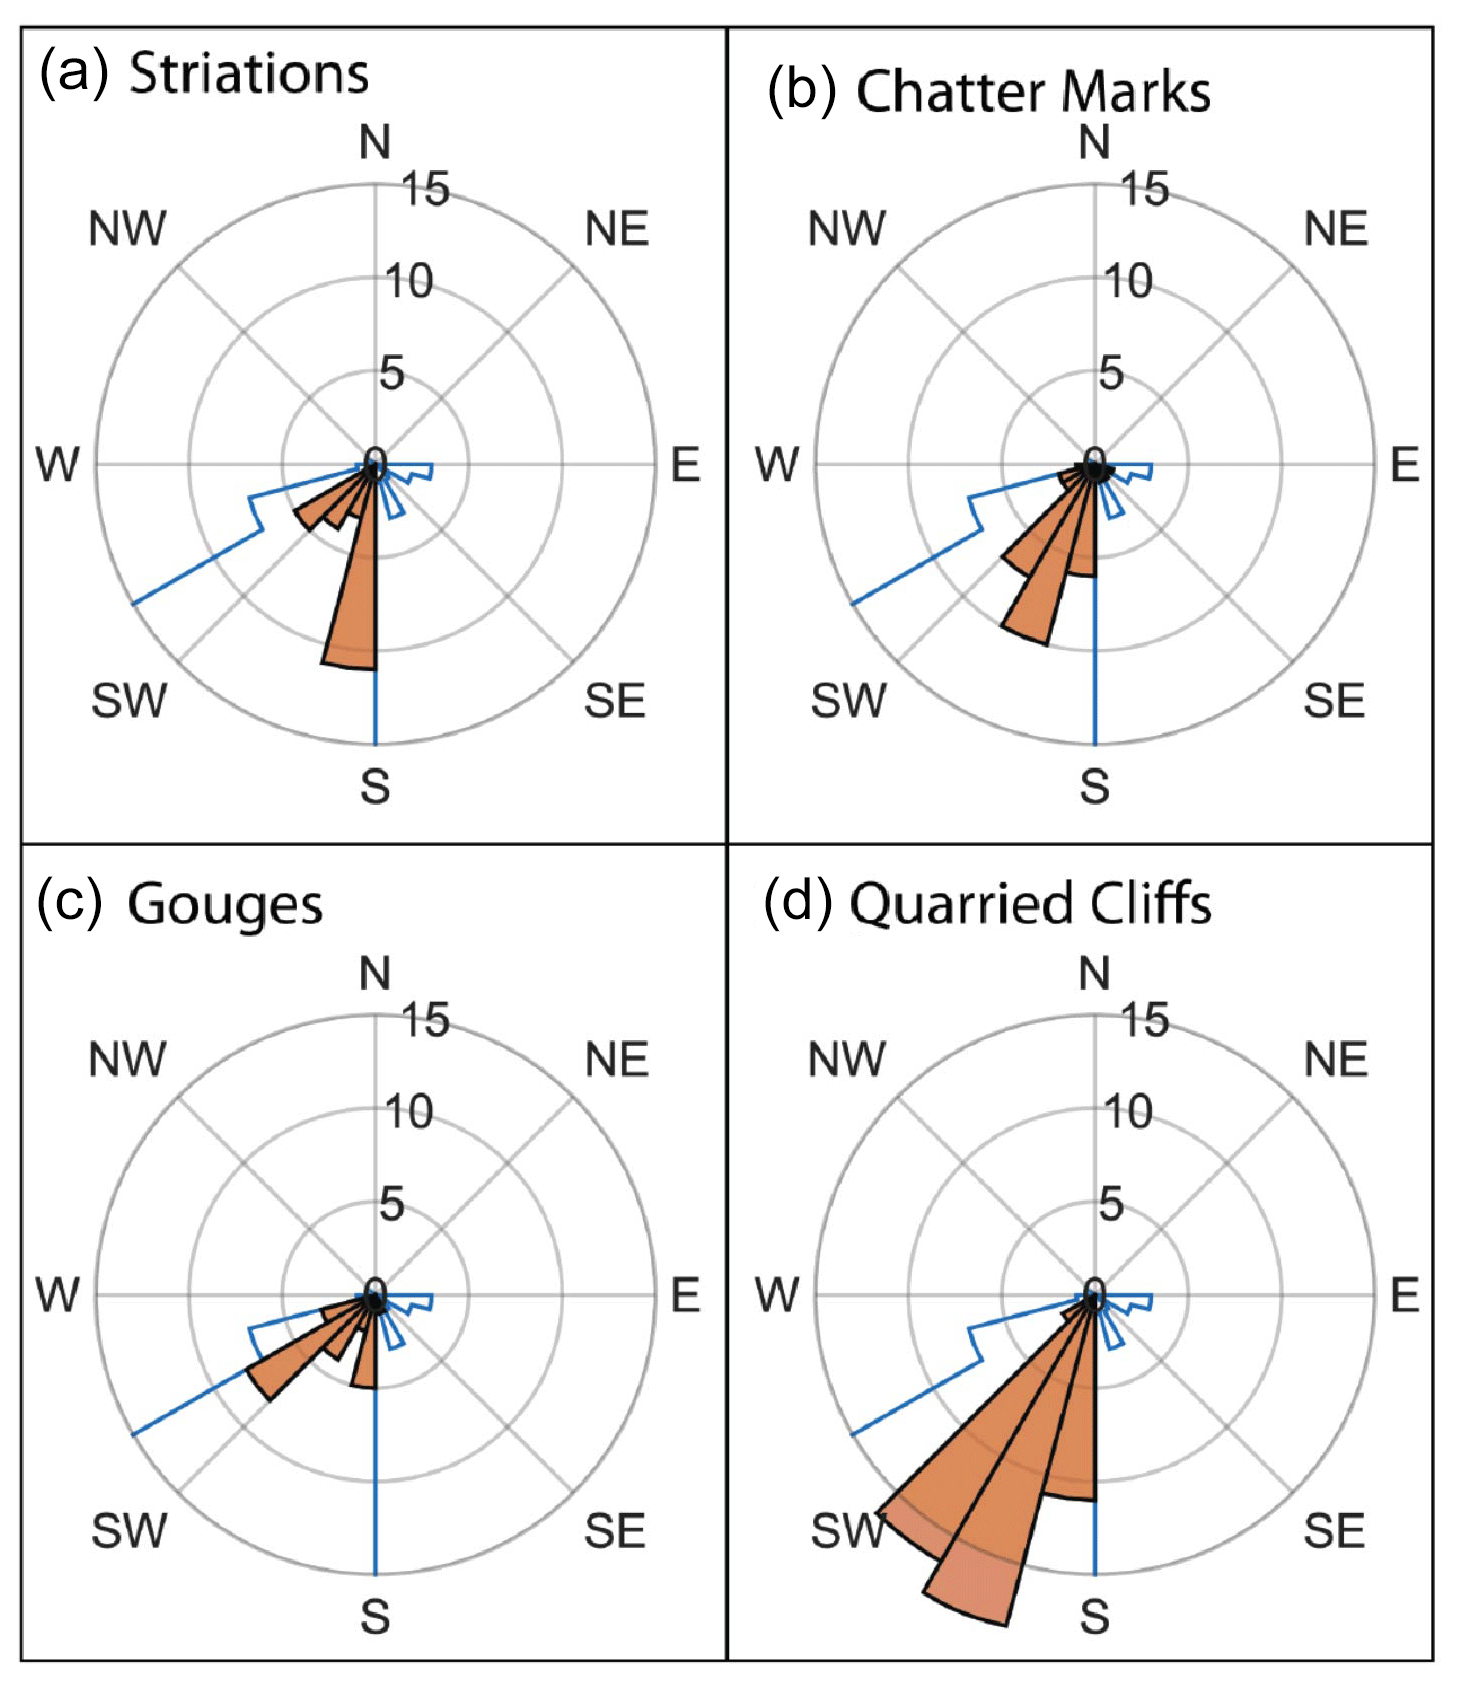
Figure 7The orientation of ice flow indicators subdivided into type. Blue lines encompass orientations from all the ice flow indicators combined (see Fig. 6).
We calculate an area of quarried material during the historical advance of 1635–2050 m2 (the derivation of this range is discussed below) of the total 13 256 m2 field area (12 %–15 %) and a quarried volume of 378 ± 45 m3 (Table 3). Using the duration of overriding during the historical advance, this equates to an equivalent quarrying rate of 0.13 ± 0.03 mm yr−1 when averaged across the study site. We calculate a combined (total) eroded rock volume of 700 ± 249 m3 and a total subglacial erosion rate of 0.26 ± 0.16 mm yr−1, of which 47 % is attributed to abrasion and 53 % is attributed to quarrying.
Measurements of ice flow indicators, including striations, crescentic gouges, and chatter marks, reveal a southerly to southwesterly (180∘ to 225∘) ice flow direction (Fig. 7). When sorted by type of ice flow indicator, a pattern emerges showing an evolution of flow direction during the most recent ice advance. Small striations, being the most likely to represent the final ice flow direction before deglaciation, show the most recent ice flow direction toward the south. Crescentic gouges and chatter marks, which are more likely to persist after some surface abrasion, reveal a southwesterly direction of ice flow. This shift likely represents the evolving flow direction and velocity change as ice flow over the field area increased in speed, shifted to the southwest, and thickened during the maximum phase of the historical advance. Although the velocity of ice over the study site during the maximum phase of the advance is not known, in 1985, when the site was still covered, surface velocity was in the 150–300 m yr−1 range (Howat, 2020). Based on the orientation of quarrying ledges and ice flow indicators, it appears that much of the quarrying occurred when the ice flowed southwest during the period with presumably the highest ice flow speed and thickness of the historical advance.
We provide a new approach to quantifying the quarried volume of sediment across a glacial landscape and to establishing the relative contributions of quarrying and abrasion. Due to the inherent difficulty in measuring quarrying directly, previous estimates relied on computational models or proxy inferences made from measurements of proglacial sediment discharge (Hallet, 1996; Loso et al., 2004; Riihimaki et al., 2005; Ugelvig et al., 2018). Quarrying estimates from stream sediments (i.e., bedload) require assumptions about the portion of the suspended load that is also derived from quarrying (Riihimaki et al., 2005). Here, our measurements of quarrying volume and rate stem from the combination of in situ 10Be measurements and terrain analysis.
Our erosion rate measurements are similar to other estimates for glacial erosion in Greenland and beyond (Koppes and Montgomery, 2009; Cook et al., 2020). Our total erosion rate of 0.32 ± 0.09 mm yr−1 is similar to what Balter-Kennedy et al. (2021) found at the same site using both surface 10Be measurements (0.4–0.8 mm yr−1) and a 10Be depth profile from a 4 m deep rock core (0.3–0.6 mm yr−1). Although these rates are lower than those found using a sediment budget approach in southwestern Greenland (4.8 ± 2.6 mm yr−1; Cowton et al., 2012), they are similar to centennial-scale erosion rate estimates of 0.29–0.34 mm yr−1 in northwestern Greenland (Hogan et al., 2020).
Quarrying is inferred to be highly dependent on glaciological and lithological conditions, including bedrock hardness and fracture spacing (Dühnforth et al., 2010; Krabbendam and Glasser, 2011; Iverson, 2012). Based on the hard nature of the bedrock with widely spaced fractures, we would expect abrasion to dominate at our field site (Dühnforth et al., 2010; Anderson, 2014). However, despite only 12 %–15 % of the field site by area exhibiting recent quarrying, we calculate that 53 % of the total glacial erosion occurred as quarrying.
Our MCMC results and field observations suggest that, prior to quarrying, the bedrock surface was relatively low-relief, likely with wave cavities in lee locations (Zoet et al., 2013) as opposed to stepped geometries that are more often considered in theoretical studies of quarrying (e.g., Anderson et al., 1982; Hallet, 1996; Iverson, 2012; Anderson, 2014). Despite bedrock characteristics inhibiting quarrying, the Greenland Ice Sheet experiences significant seasonal and subseasonal changes in subglacial hydrology in this area (Das et al., 2008; Andrews et al., 2014), which is thought to aid quarrying processes (Anderson, 2014; Ugelvig et al., 2018). Propagating fractures that are presumed to eventually lead to failure and quarrying appear to not solely rely on pre-existing fractures in the bedrock at our study site. The fracturing process, i.e., high clast–bed contact forces exerted by clasts embedded in basal ice pressing onto the bed, leads to the formation of crescentic gouges (Gilbert, 1906; Harris, 1943; Krabbendam et al., 2017) that we observed in abundance in the field (Fig. 2a). That many crescentic gouge trains increase in size toward quarried ledges – with a crescentic gouge at the lip of many edges – may indicate that gouge formation is a fracture nucleation point that leads to quarrying events in this field area (Figs. 2 and 8).
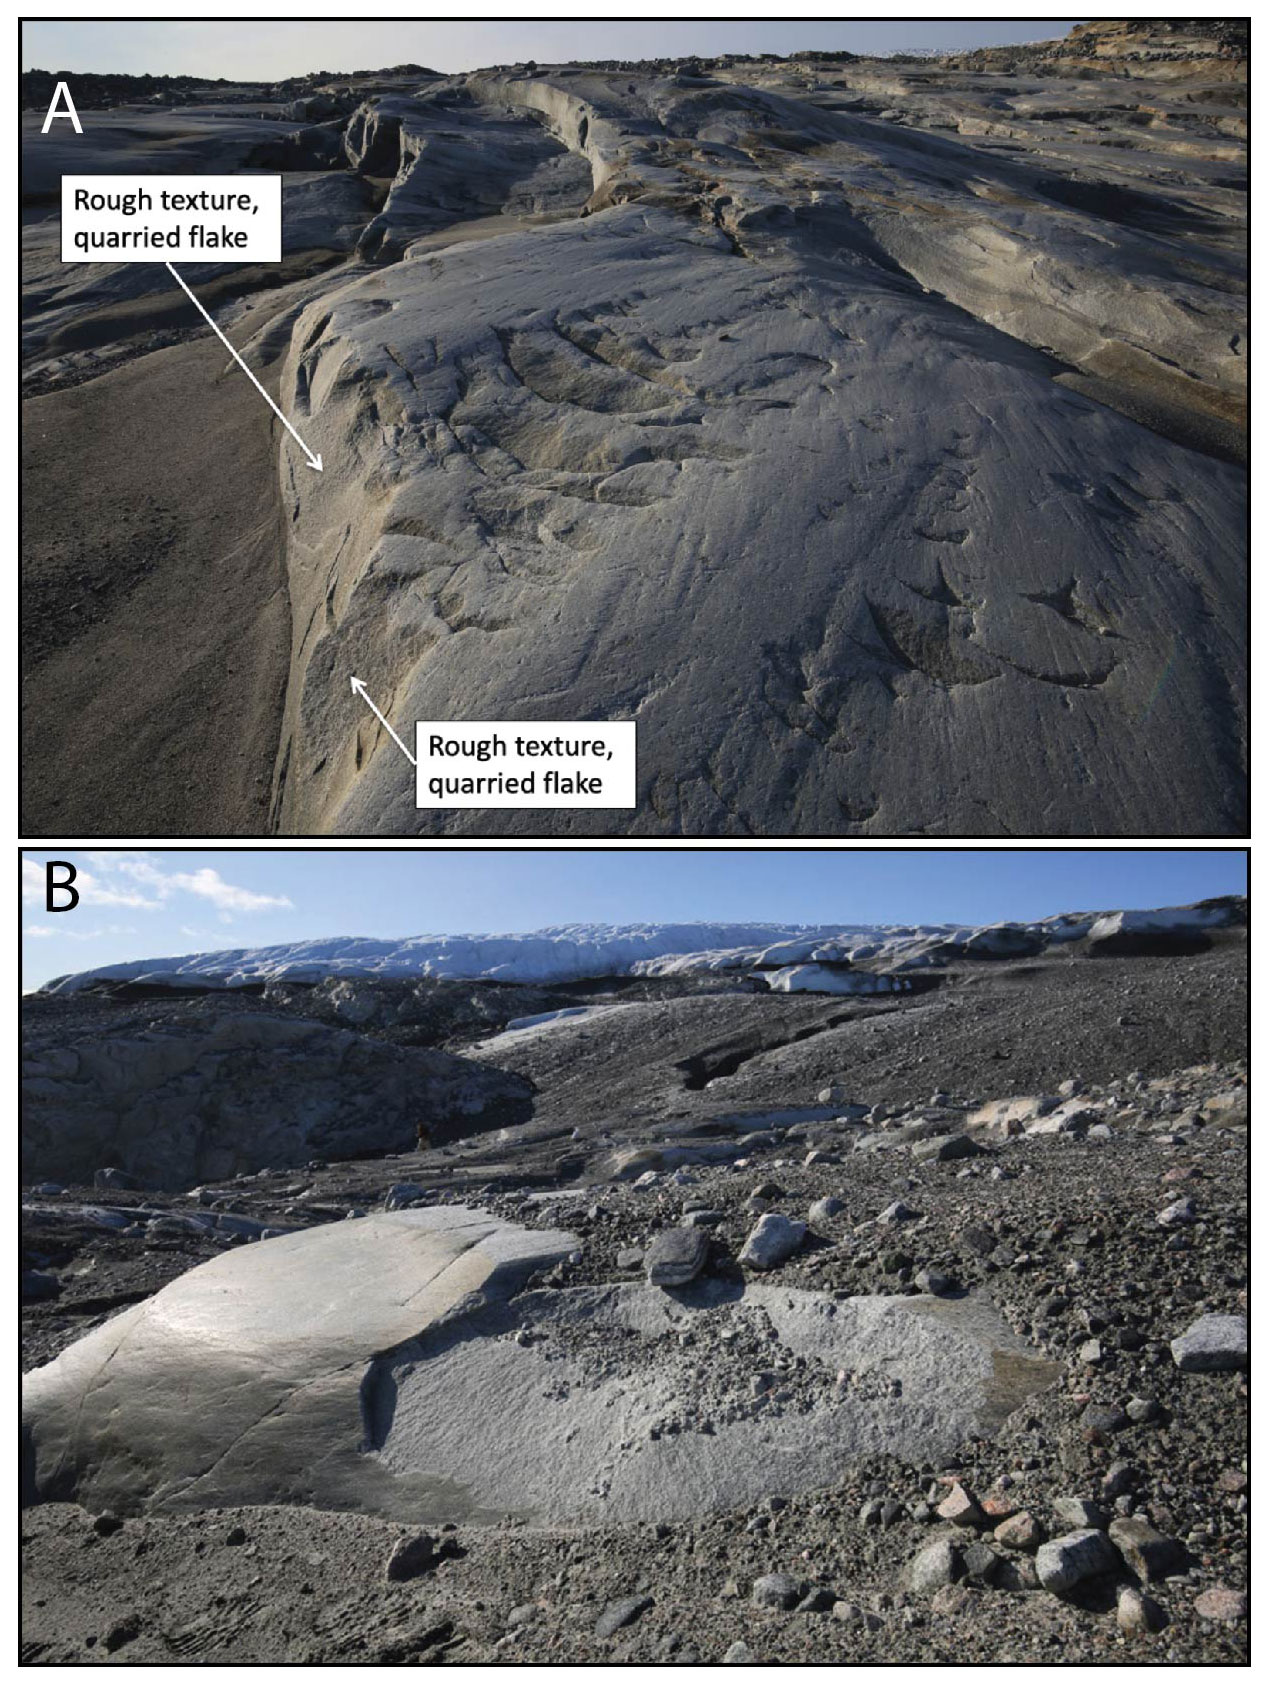
Figure 8Photographs showing the relationship between crescentic gouges and quarrying in the study area. (a) Gouge trains leading to a lee face with evidence for quarried flakes initiated by a gouge process (ice flow from upper right to lower left). (b) Example of an angled (and polished) lee face from which a relatively thin flake has been quarried and removed.
There are uncertainties associated with calculating erosion depth, volume, and rate. We do not expect uniform abrasion across the study area given the stepped nature of the terrain and localized variations in basal stress. At Location A, we find a lower abrasion depth at the lip of the divot (2.7 ± 1.1 cm) than in the floor beyond the quarried zone (5.8 ± 1.0 cm). We do not have enough data to elucidate predictable spatial patterns of more or less abrasion across the study site; instead, we rely on an average of a number of data points that provide a useful representative abrasion depth to apply across our field area.
It is useful to further consider uncertainties, such as those perhaps associated with our erosion thickness, volume, and rate results. Abrasion depth estimates reported here have high uncertainty due to the inherent measurement error in measuring cosmogenic nuclide concentration. An analysis of errors in Young et al. (2016) and Balter-Kennedy et al. (2021) for shallow abrasion depths shows a consistently appreciable uncertainty in relation to the low magnitudes of rock removal via abrasion. The measurement uncertainties for samples in the companion study of Balter-Kennedy et al. (2021) are ∼ 2.5–3 cm, but when the estimated depth of abrasion is small and similar to the mean uncertainty, the uncertainty can result in a significant range of the abraded depth. One advantage of our experiment at Location A is that multiple samples were used in the MCMC inversion, reducing the uncertainty in the estimated abrasion depth. Unfortunately, even with the added resolving power of multiple samples, the uncertainty in the abrasion depth is still 46 %.
When converting the abrasion depth to an abrasion rate, another source of uncertainty is the duration of erosion. While the timing of recent deglaciation and exposure is well-constrained, the timing of burial is less well-constrained. We use the overriding duration of 1790–2010 CE used in Balter-Kennedy et al. (2021), which is based on prior work in the area (Briner et al., 2011; Young et al., 2016). Although we use an absolute date range in our erosion rate calculations, the initiation of glaciation at the onset of the historical advance at our study site is reconstructed, not observed, and the initiation timing of overriding would affect the calculated erosion rates. If the ice arrived decades earlier (we think this is more likely than ice arriving later than 1800 CE), our calculated erosion rates would decrease, but the ratio of abrasion to quarrying and the total depth of glacial erosion during the historical advance would be unaffected.
An additional source of uncertainty relates to the reconstructed profile of the paleo-surface slope of quarried blocks and thus of the volume of each removed block. We use the 3D nuclide production inversion of the quarried zone at Location A to guide the shape for other quarried zones. To estimate the uncertainty of each quarried block and the cumulative uncertainty of the quarried volume across the study site, each zone was analyzed for the likelihood of having a pre-quarrying sloped, triangular profile versus a more rectangular, stair–step profile. It is possible, perhaps likely, that at least some pre-quarried surfaces were somewhere between sloped (triangular block removed) and stepped (rectangular block removed) and not one or the other.
The uncertainty in our estimates of quarried rock volume is independent of the cosmogenic nuclide concentration. To estimate uncertainty in our manual outlining of each area of the quarried zones, a 0.5 m buffer was extended at the edge of the floor of each quarried zone; this edge is based on changes in surface texture from rough to smooth as recorded in the high-resolution orthoimagery. The location of this transition is also dictated by the presence or absence of chatter marks or crescentic gouges, surface patina, and rock color. While many locations have a well-defined transition, 0.5 m is an upper limit on our ability to define this boundary. The lee cliff is a well-defined feature on the landscape and is accurately identified from the orthoimagery, with assistance using other products such as the DEM and the Hillshade and Roughness QGIS processing products. We consider our 0.5 m buffer on the extent along the quarried floor to be a conservative estimate. When used to define the volume of each block, we find that the 0.5 m buffer equates to a volume range of 379 ± 45 m3 and a quarried area of 1842 ± 100 m2 (12 %–15 % of the study area).
Our inverse modeling of cosmogenic nuclide production at Location A highlights the continued importance of cosmogenic nuclides in glacier erosion studies. Optimizing sampling locations to estimate the parameters of interest (surface geometry of a removed block, depth of abrasion, and attenuation length) was important for our inversion results. The sensitivity analysis to determine how samples were important in our forward-model scenarios aided in sample selection for processing. The samples along the horizontal lee floor (FL1, FL2) are the most important for constraining the surface profile shape. Samples at the present-day surfaces (Surface, FL3) are the most important for constraining the depth of abrasion, while the samples collected along the vertical lee cliff are sensitive to the depth of abrasion and the attenuation length. In fact, not all samples collected along the vertical cliff were needed for the analysis, while additional samples along the floor near the quarrying–abrasion transition could have been beneficial.
Our pairing of cosmogenic nuclide analysis with inverse modeling of cosmogenic nuclide production through quarried material, along with topographic and morphologic analysis of a recently deglaciated bedrock landscape, provides one of the first direct observation-based estimates of glacial quarrying and partitioning of glacial erosion processes. We found that quarried volume generally matched that of abrasion despite a hard crystalline bedrock with wide fracture spacing and a low-relief surface morphology, all conspiring to limit quarrying. It seems that quarrying mostly took place via triangular wedge removal at this site. Field observations suggest that clast–bed impacts evidenced by abundant crescentic gouges are a possible mechanism to nucleate quarrying events, assisted by seasonal and subseasonal fluctuations in subglacial water pressure. These results are a small addition to a field that needs further analysis. However, field data like these are important for grounding landscape evolution models with observational datasets and for providing fundamental information for understanding coupled glacier–hydrology–sediment production processes. Ultimately, the results of our work invite further analysis at this field site, including testing of both theoretical and computational models of glacial erosion.
Code and data are available on GitHub at https://github.com/w0gpr/Cosmo3D (last access: 26 April 2023) and Zenodo (https://doi.org/10.5281/zenodo.7858913, Graham, 2023).
BLG, JPB, NEY, and ABK designed the study and collected field data. BLG, JPB, and JMS led rock sample preparation and 10Be analysis. BLG modeled 10Be production, computed terrain analysis, and derived erosion results. MK, KP, and EKT provided significant input throughout the course of this research. BLG and JPB prepared the paper with contributions from all the co-authors.
At least one of the (co-)authors is a member of the editorial board of The Cryosphere. The peer-review process was guided by an independent editor, and the authors also have no other competing interests to declare.
Publisher’s note: Copernicus Publications remains neutral with regard to jurisdictional claims made in the text, published maps, institutional affiliations, or any other geographical representation in this paper. While Copernicus Publications makes every effort to include appropriate place names, the final responsibility lies with the authors.
This article is part of the special issue “Icy landscapes of the past”. It is not associated with a conference.
We thank Chris Sbarra and Rosanne Schwartz for sample processing, CH2MHill Polar Field Services for supporting fieldwork, and Alan Hidy at Lawrence Livermore National Laboratory for beryllium isotope measurements. We also thank Maarten Krabbendam and Jakob Heyman for helpful reviewer comments.
This research has been supported by the US National Science Foundation (grant no. 1504267 to Jason P. Briner and grant no. 1503959 to Nicolás E. Young and Joerg M. Schaefer). Joerg M. Schaefer received funding from the Vetlesen Foundation.
This paper was edited by Arjen Stroeven and reviewed by Jakob Heyman and Maarten Krabbendam.
Alley, R. B., Cuffey, K. M., and Zoet, L. K.: Glacial erosion: status and outlook, Ann. Glaciol., 60, 1–13, https://doi.org/10.1017/aog.2019.38, 2019.
Anderson, R. S.: Evolution of lumpy glacial landscapes, Geology, 42, 679–682, https://doi.org/10.1130/G35537.1, 2014.
Anderson, R. S., Hallet, B., Walder, J., and Aubry, B. F.: Observations in a cavity beneath Grinnell Glacier, Earth Surf. Process. Landforms, 7, 63–70, https://doi.org/10.1002/esp.3290070108, 1982.
Andrews, L. C., Catania, G. A., Hoffman, M. J., Gulley, J. D., Lüthi, M. P., Ryser, C., Hawley, R. L., and Neumann, T. A.: Direct observations of evolving subglacial drainage beneath the Greenland Ice Sheet, Nature, 514, 80–83, https://doi.org/10.1038/nature13796, 2014.
Balco, G.: Contributions and unrealized potential contributions of cosmogenic-nuclide exposure dating to glacier chronology, 1990–2010, Quaternary Sci. Rev., 30, 3–27, https://doi.org/10.1016/j.quascirev.2010.11.003, 2011.
Balco, G.: Production rate calculations for cosmic-ray-muon-produced 10Be and 26Al benchmarked against geological calibration data, Quat. Geochronol., 39, 150–173, https://doi.org/10.1016/j.quageo.2017.02.001, 2017.
Balco, G., Stone, J. O., Lifton, N. A., and Dunai, T. J.: A complete and easily accessible means of calculating surface exposure ages or erosion rates from 10Be and 26Al measurements, Quat. Geochronol., 3, 174–195, https://doi.org/10.1016/j.quageo.2007.12.001, 2008.
Balter-Kennedy, A., Young, N. E., Briner, J. P., Graham, B. L., and Schaefer, J. M.: Centennial- and Orbital-Scale Erosion Beneath the Greenland Ice Sheet Near Jakobshavn Isbræ, J. Geophys. Res.-Earth, 126, e2021JF006429, https://doi.org/10.1029/2021JF006429, 2021.
Briner, J. P. and Swanson, T. W.: Using inherited cosmogenic 36Cl to constrain glacial erosion rates of the Cordilleran ice sheet, Geology, 26, 3–6, https://doi.org/10.1130/0091-7613(1998)026<0003:UICCTC>2.3.CO;2, 1998.
Briner, J. P., Stewart, H. A. M., Young, N. E., Philipps, W., and Losee, S.: Using proglacial-threshold lakes to constrain fluctuations of the Jakobshavn Isbræ ice margin, western Greenland, during the Holocene, Quaternary Sci. Rev., 29, 3861–3874, https://doi.org/10.1016/j.quascirev.2010.09.005, 2010.
Briner, J. P., Young, N. E., Thomas, E. K., Stewart, H. A. M., Losee, S., and Truex, S.: Varve and radiocarbon dating support the rapid advance of Jakobshavn Isbræ during the Little Ice Age, Quaternary Sci. Rev., 30, 2476–2486, https://doi.org/10.1016/j.quascirev.2011.05.017, 2011.
Cook, S. J., Swift, D. A., Kirkbride, M. P., Knight, P. G., and Waller, R. I.: The empirical basis for modelling glacial erosion rates, Nat. Commun., 11, 759, https://doi.org/10.1038/s41467-020-14583-8, 2020.
Corbett, L. B., Bierman, P. R., and Rood, D. H.: An approach for optimizing in situ cosmogenic 10Be sample preparation, Quat. Geochronol., 33, 24–34, https://doi.org/10.1016/j.quageo.2016.02.001, 2016.
Cowton, T., Nienow, P., Bartholomew, I., Sole, A., and Mair, D.: Rapid erosion beneath the Greenland ice sheet, Geology, 40, 343–346, https://doi.org/10.1130/G32687.1, 2012.
Csatho, B., Schenk, T., Van Der Veen, C. J., and Krabill, W. B.: Intermittent thinning of Jakobshavn Isbrae, West Greenland, since the little ice age, J. Glaciol., 54, 131–144, https://doi.org/10.3189/002214308784409035, 2008.
Das, S. B., Joughin, I., Behn, M. D., Howat, I. M., King, M. A., Lizarralde, D., and Bhatia, M. P.: Fracture Propagation to the Base of the Greenland Ice Sheet During Supraglacial Lake Drainage, Science, 320, 778–781, https://doi.org/10.1126/science.1153360, 2008.
Dühnforth, M., Anderson, R. S., Ward, D., and Stock, G. M.: Bedrock fracture control of glacial erosion processes and rates, Geology, 38, 423–426, https://doi.org/10.1130/G30576.1, 2010.
Dunai, T. J.: Cosmogenic Nuclides: Principles, Concepts and Applications in the Earth Surface Sciences, 1st edn., Cambridge University Press, https://doi.org/10.1017/CBO9780511804519, 2010.
Egholm, D. L., Pedersen, V. K., Knudsen, M. F., and Larsen, N. K.: Coupling the flow of ice, water, and sediment in a glacial landscape evolution model, Geomorphology, 141–142, 47–66, https://doi.org/10.1016/j.geomorph.2011.12.019, 2012.
Gilbert, G. K.: Crescentic gouges on glaciated surfaces, Geol. Soc. Am. Bull., 17, 303–316, https://doi.org/10.1130/GSAB-17-303, 1906.
Gosse, J. C. and Phillips, F. M.: Terrestrial in situ cosmogenic nuclides: theory and application, Quaternary Sci. Rev., 20, 1475–1560, https://doi.org/10.1016/S0277-3791(00)00171-2, 2001.
Graham, B.: w0gpr/Cosmo3D: v1.0.0, Zenodo [data set], https://doi.org/10.5281/zenodo.7858913, 2023.
Haario, H., Laine, M., Mira, A., and Saksman, E.: DRAM: Efficient adaptive MCMC, Stat. Comput., 16, 339–354, https://doi.org/10.1007/s11222-006-9438-0, 2006.
Hallet, B.: Glacial quarrying: a simple theoretical model, Ann. Glaciol., 22, 1–8, https://doi.org/10.1017/S0260305500015147, 1996.
Hallet, B., Hunter, L., and Bogen, J.: Rates of erosion and sediment evacuation by glaciers: A review of field data and their implications, Global Planet. Change, 12, 213–235, https://doi.org/10.1016/0921-8181(95)00021-6, 1996.
Harris Jr., S. E.: Friction cracks and the direction of glacial movement, J. Geol., 51, 244–258, https://doi.org/10.1086/625148, 1943.
Herman, F., De Doncker, F., Delaney, I., Prasicek, G., and Koppes, M.: The impact of glaciers on mountain erosion, Nat. Rev. Earth Environ., 2, 422–435, https://doi.org/10.1038/s43017-021-00165-9, 2021.
Hogan, K. A., Cofaigh, C. Ó., Jennings, A. E., Dowdeswell, J. A., and Hiemstra, J. F.: Deglaciation of a major palaeo-ice stream in Disko Trough, West Greenland, Quaternary Sci. Rev., 147, 5–26, https://doi.org/10.1016/j.quascirev.2016.01.018, 2016.
Hogan, K. A., Jakobsson, M., Mayer, L., Reilly, B. T., Jennings, A. E., Stoner, J. S., Nielsen, T., Andresen, K. J., Nørmark, E., Heirman, K. A., Kamla, E., Jerram, K., Stranne, C., and Mix, A.: Glacial sedimentation, fluxes and erosion rates associated with ice retreat in Petermann Fjord and Nares Strait, north-west Greenland, The Cryosphere, 14, 261–286, https://doi.org/10.5194/tc-14-261-2020, 2020.
Howat, I.: MEaSUREs Greenland Ice Velocity: Selected Glacier Site Velocity Maps from Optical Images, Version 3, NASA National Snow and Ice Data Center Distributed Active Archive Center, Boulder, Colorado USA [data set], https://doi.org/10.5067/RRFY5IW94X5W, 2020.
Iverson, N. R.: Laboratory Simulations Of Glacial Abrasion: Comparison With Theory, J. Glaciol., 36, 304–314, https://doi.org/10.3189/002214390793701264, 1990.
Iverson, N. R.: A theory of glacial quarrying for landscape evolution models, Geology, 40, 679–682, https://doi.org/10.1130/G33079.1, 2012.
Kajanto, K., Seroussi, H., de Fleurian, B., and Nisancioglu, K. H.: Present day Jakobshavn Isbræ (West Greenland) close to the Holocene minimum extent, Quaternary Sci. Rev., 246, 106492, https://doi.org/10.1016/j.quascirev.2020.106492, 2020.
Kjær, K. H., Bjørk, A. A., Kjeldsen, K. K., Hansen, E. S., Andresen, C. S., Siggaard-Andersen, M. L., Khan, S. A., Søndergaard, A. S., Colgan, W., Schomacker, A., and Woodroffe, S.: Glacier response to the Little Ice Age during the Neoglacial cooling in Greenland, Earth-Sci. Rev., 227, 103984, https://doi.org/10.1016/j.earscirev.2022.103984, 2022.
Kohl, C. P. and Nishiizumi, K.: Chemical isolation of quartz for measurement of in-situ-produced cosmogenic nuclides, Geochim. Cosmochim. Ac., 56, 3583–3587, https://doi.org/10.1016/0016-7037(92)90401-4, 1992.
Koppes, M. N.: Rates and Processes of Glacial Erosion, in: Treatise on Geomorphology, Elsevier, 169–181, https://doi.org/10.1016/B978-0-12-818234-5.00032-8, 2022.
Koppes, M. N. and Montgomery, D. R.: The relative efficacy of fluvial and glacial erosion over modern to orogenic timescales, Nat. Geosci., 2, 644–647, https://doi.org/10.1038/ngeo616, 2009.
Krabbendam, M. and Glasser, N. F.: Glacial erosion and bedrock properties in NW Scotland: Abrasion and plucking, hardness and joint spacing, Geomorphology, 130, 374–383, https://doi.org/10.1016/j.geomorph.2011.04.022, 2011.
Krabbendam, M., Bradwell, T., Everest, J. D., and Eyles, N.: Joint-bounded crescentic scars formed by subglacial clast-bed contact forces: Implications for bedrock failure beneath glaciers, Geomorphology, 290, 114–127, https://doi.org/10.1016/j.geomorph.2017.03.021, 2017.
Loso, M. G., Anderson, R. S., and Anderson, S. P.: Post–Little Ice Age record of coarse and fine clastic sedimentation in an Alaskan proglacial lake, Geology, 32, 1065–1068, https://doi.org/10.1130/G20839.1, 2004.
Matthes, F. E.: Geologic history of the Yosemite Valley, US Geological Survey, https://doi.org/10.3133/pp160, 1930.
Nishiizumi, K., Imamura, M., Caffee, M. W., Southon, J. R., Finkel, R. C., and McAninch, J.: Absolute calibration of 10Be AMS standards, Nuclear Instruments and Methods in Physics Research Section B: Beam Interactions with Materials and Atoms, 258, 403–413, https://doi.org/10.1016/j.nimb.2007.01.297, 2007.
Overeem, I., Hudson, B. D., Syvitski, J. P. M., Mikkelsen, A. B., Hasholt, B., van den Broeke, M. R., Noël, B. P. Y., and Morlighem, M.: Substantial export of suspended sediment to the global oceans from glacial erosion in Greenland, Nat. Geosci., 10, 859–863, https://doi.org/10.1038/ngeo3046, 2017.
Riihimaki, C. A.: Sediment evacuation and glacial erosion rates at a small alpine glacier, J. Geophys. Res., 110, F03003, https://doi.org/10.1029/2004JF000189, 2005.
Ugelvig, S. V., Egholm, D. L., Anderson, R. S., and Iverson, N. R.: Glacial erosion driven by variations in meltwater drainage, J. Geophys. Res.-Earth, 123, 2863–2877, https://doi.org/10.1029/2018JF004680, 2018.
Weidick, A. and Bennike, O.: Quaternary glaciation history and glaciology of Jakobshavn Isbræ and the Disko Bugt region, West Greenland: a review, GEUS Bulletin, 14, 1–78, https://doi.org/10.34194/geusb.v14.4985, 2007.
Weidick, A., Oerter, H., Reeh, N., Thomsen, H. H., and Thorning, L.: The recession of the Inland Ice margin during the Holocene climatic optimum in the Jakobshavn Isfjord area of West Greenland, Global Planet. Change, 2, 389–399, https://doi.org/10.1016/0921-8181(90)90010-A, 1990.
Young, N. E., Briner, J. P., Stewart, H. A. M., Axford, Y., Csatho, B., Rood, D. H., and Finkel, R. C.: Response of Jakobshavn Isbrae, Greenland, to Holocene climate change, Geology, 39, 131–134, https://doi.org/10.1130/G31399.1, 2011.
Young, N. E., Briner, J. P., Rood, D. H., Finkel, R. C., Corbett, L. B., and Bierman, P. R.: Age of the Fjord Stade moraines in the Disko Bugt region, western Greenland, and the 9.3 and 8.2 ka cooling events, Quaternary Sci. Rev., 60, 76–90, https://doi.org/10.1016/j.quascirev.2012.09.028, 2013a.
Young, N. E., Schaefer, J. M., Briner, J. P., and Goehring, B. M.: A 10Be production rate calibration for the Arctic, J. Quaternary Sci., 28, 515–526, https://doi.org/10.1002/jqs.2642, 2013b.
Young, N. E., Briner, J. P., Maurer, J., and Schaefer, J. M.: 10Be measurements in bedrock constrain erosion beneath the Greenland Ice Sheet margin, Geophys. Res. Lett., 43, 11708–11719, https://doi.org/10.1002/2016GL070258, 2016.
Zoet, L. K., Alley, R. B., Anandakrishnan, S., and Christianson, K.: Accelerated subglacial erosion in response to stick-slip motion, Geology, 41, 159–162, https://doi.org/10.1130/G33624.1, 2013.