the Creative Commons Attribution 4.0 License.
the Creative Commons Attribution 4.0 License.
 | 09 Oct 2023
Brief communication: Comparison of the performance of thermistors and digital temperature sensors in a mountain permafrost borehole
Lars Widmer
Marcia Phillips
Chasper Buchli
Monitoring mountain-permafrost temperatures in boreholes is challenging regarding the resilience and long-term temperature stability of the sensor systems. Whilst resistance thermistors boast a high accuracy, they are prone to drift when exposed to moisture, pressure or cable strain. Supplementing or replacing them with digital bandgap temperature sensors requires careful analysis of the sensor performance. We carry out a first comparison of two temperature sensor systems under field conditions in mountain permafrost at 15 identical depths in 1 borehole. Temperature values, sensing delays and noise levels are compared and discussed.
- Article
(1585 KB) - Full-text XML
- BibTeX
- EndNote


In mountain permafrost, temperatures need to be measured over several decades before climate effects can be quantified. High-quality, accurate borehole temperature measurements are challenging due to slope deformation (Noetzli and Pellet, 2022), rising water content (Phillips et al., 2020), rockfall and lightning (Noetzli et al., 2021). Since the late 1980s, resistance thermistors have been used in permafrost boreholes (mainly due to their high accuracy) for long-term monitoring (PERMOS, 2019; Haberkorn et al., 2021; Harris et al., 2001). However, thermistors are liable to drift if moistened (causing them to register erroneously high temperatures) or when the wires are stretched (causing erroneously low temperatures) (Luethi and Phillips, 2016). If initially watertight tubes and cables are damaged with time, moisture penetrates the sensor system. Wire stretching or compression can be induced by borehole deformation. Ideally, sensor recalibration is carried out at regular intervals to determine whether drift is occurring. However, the extraction and recalibration of borehole sensors are often impossible due to borehole deformation. In this case, the performance of sensors located in the active layer can be evaluated during the spring and/or autumn zero curtain, when ground temperature remains at 0 ∘C during phase change. Due to the lack of a zero curtain beneath the active layer it is difficult to discern between the initial stages of drift and naturally induced warming and/or cooling (Luethi and Phillips, 2016) without recalibration or duplicate measurements.
Sensor duplication is thus ideal to ensure the long-term continuity and quality of ground temperature data (Noetzli et al., 2021) using either two identical systems or, preferably, two separate and different ones, reducing the likelihood of simultaneous failure. Ideally, one system consists of the hitherto well-tested resistance thermistors. Other types of temperature sensors need to be evaluated for their long-term suitability in this challenging environment. Here we analyse the performance of two temperature-sensing systems – thermistors and digital bandgap temperature sensors – which were installed in a tubed borehole in 2019 in a steep, creeping mountain-permafrost talus slope. Our aim is to identify and quantify similarities and differences between the two systems and to determine their suitability for permafrost conditions.
1.1 Site description
Muot da Barba Peider is a NW-oriented 38∘ talus slope at 2980 m a.s.l. above Pontresina in the eastern Swiss Alps. The rock consists of gneiss, and the coarse-grained talus layer is around 1.5 to 2.0 m thick, fining downwards, with a volumetric ice content of approximately 10 % in autumn, when moisture in the active layer freezes. Active-layer thickness varies across the slope and in recent years has been between 1.8 and 4 m thick (http://www.permos.ch, last access: 1 November 2022). The underlying bedrock is permanently frozen and contains a little ice in cracks and pores. The talus creeps around 10–20 cm per year (Phillips and Kenner, 2021).
1.2 Instrumentation and methods
In 1996 two 20 m vertical boreholes (B1 MBP_0196 and B2 MBP_0296) were drilled and equipped with thermistors. Their data are available in the PERMOS database (http://www.permos.ch). As some of the thermistors in B1 and B2 were damaged or started to drift over time (PERMOS, 2019), a 20 m vertical borehole B3 (MBP_0319) was drilled between B1 and B2 in 2019. The aim was to secure the existing Muot da Barba Peider temperature data series with an initial overlap to allow for comparison. B3 was equipped with two types of temperature sensors, as specified in Table 1, installed in parallel in view of acquiring data for as long as possible. The borehole was furnished with a watertight PVC tube. We installed a concrete chamber with an iron lid at the ground surface to house the data logger and the batteries. Sensors are at 0.5, 1.0, 1.5, 2.0, 2.5, 3.0, 3.5, 4.0, 5.0, 6.0, 8.0, 10.0, 13.5, 17.5 and 20.0 m depth for both sensor strings. They were calibrated simultaneously at 0 ∘C in a double-walled ice-water bath using the factory-calibrated Steinhart–Hart equation for the thermistors and additional offset values for both sensor types.
The temperatures are logged using a Campbell CR1000X logger powered by two 12 V, 12 Ah lead-acid batteries. Measurements are taken at 30 min intervals, averaged and saved in 2 h intervals. The data presented were obtained from 16 January 2020 to 12 March 2023. Unfortunately, gaps exist for both time series, caused by battery or logger failure (Fig. 1d), and no full year of gapless data with both systems could be acquired yet. As both systems worked simultaneously during all seasons we can compare their performance during freezing, thawing and zero curtains and in periods with positive temperatures in the active layer.
The comparisons were performed with Python using the packages Numpy (Harris et al., 2020) and SciPy (Virtanen et al., 2020).
Table 1Overview of differences and similarities between the two sensor types.
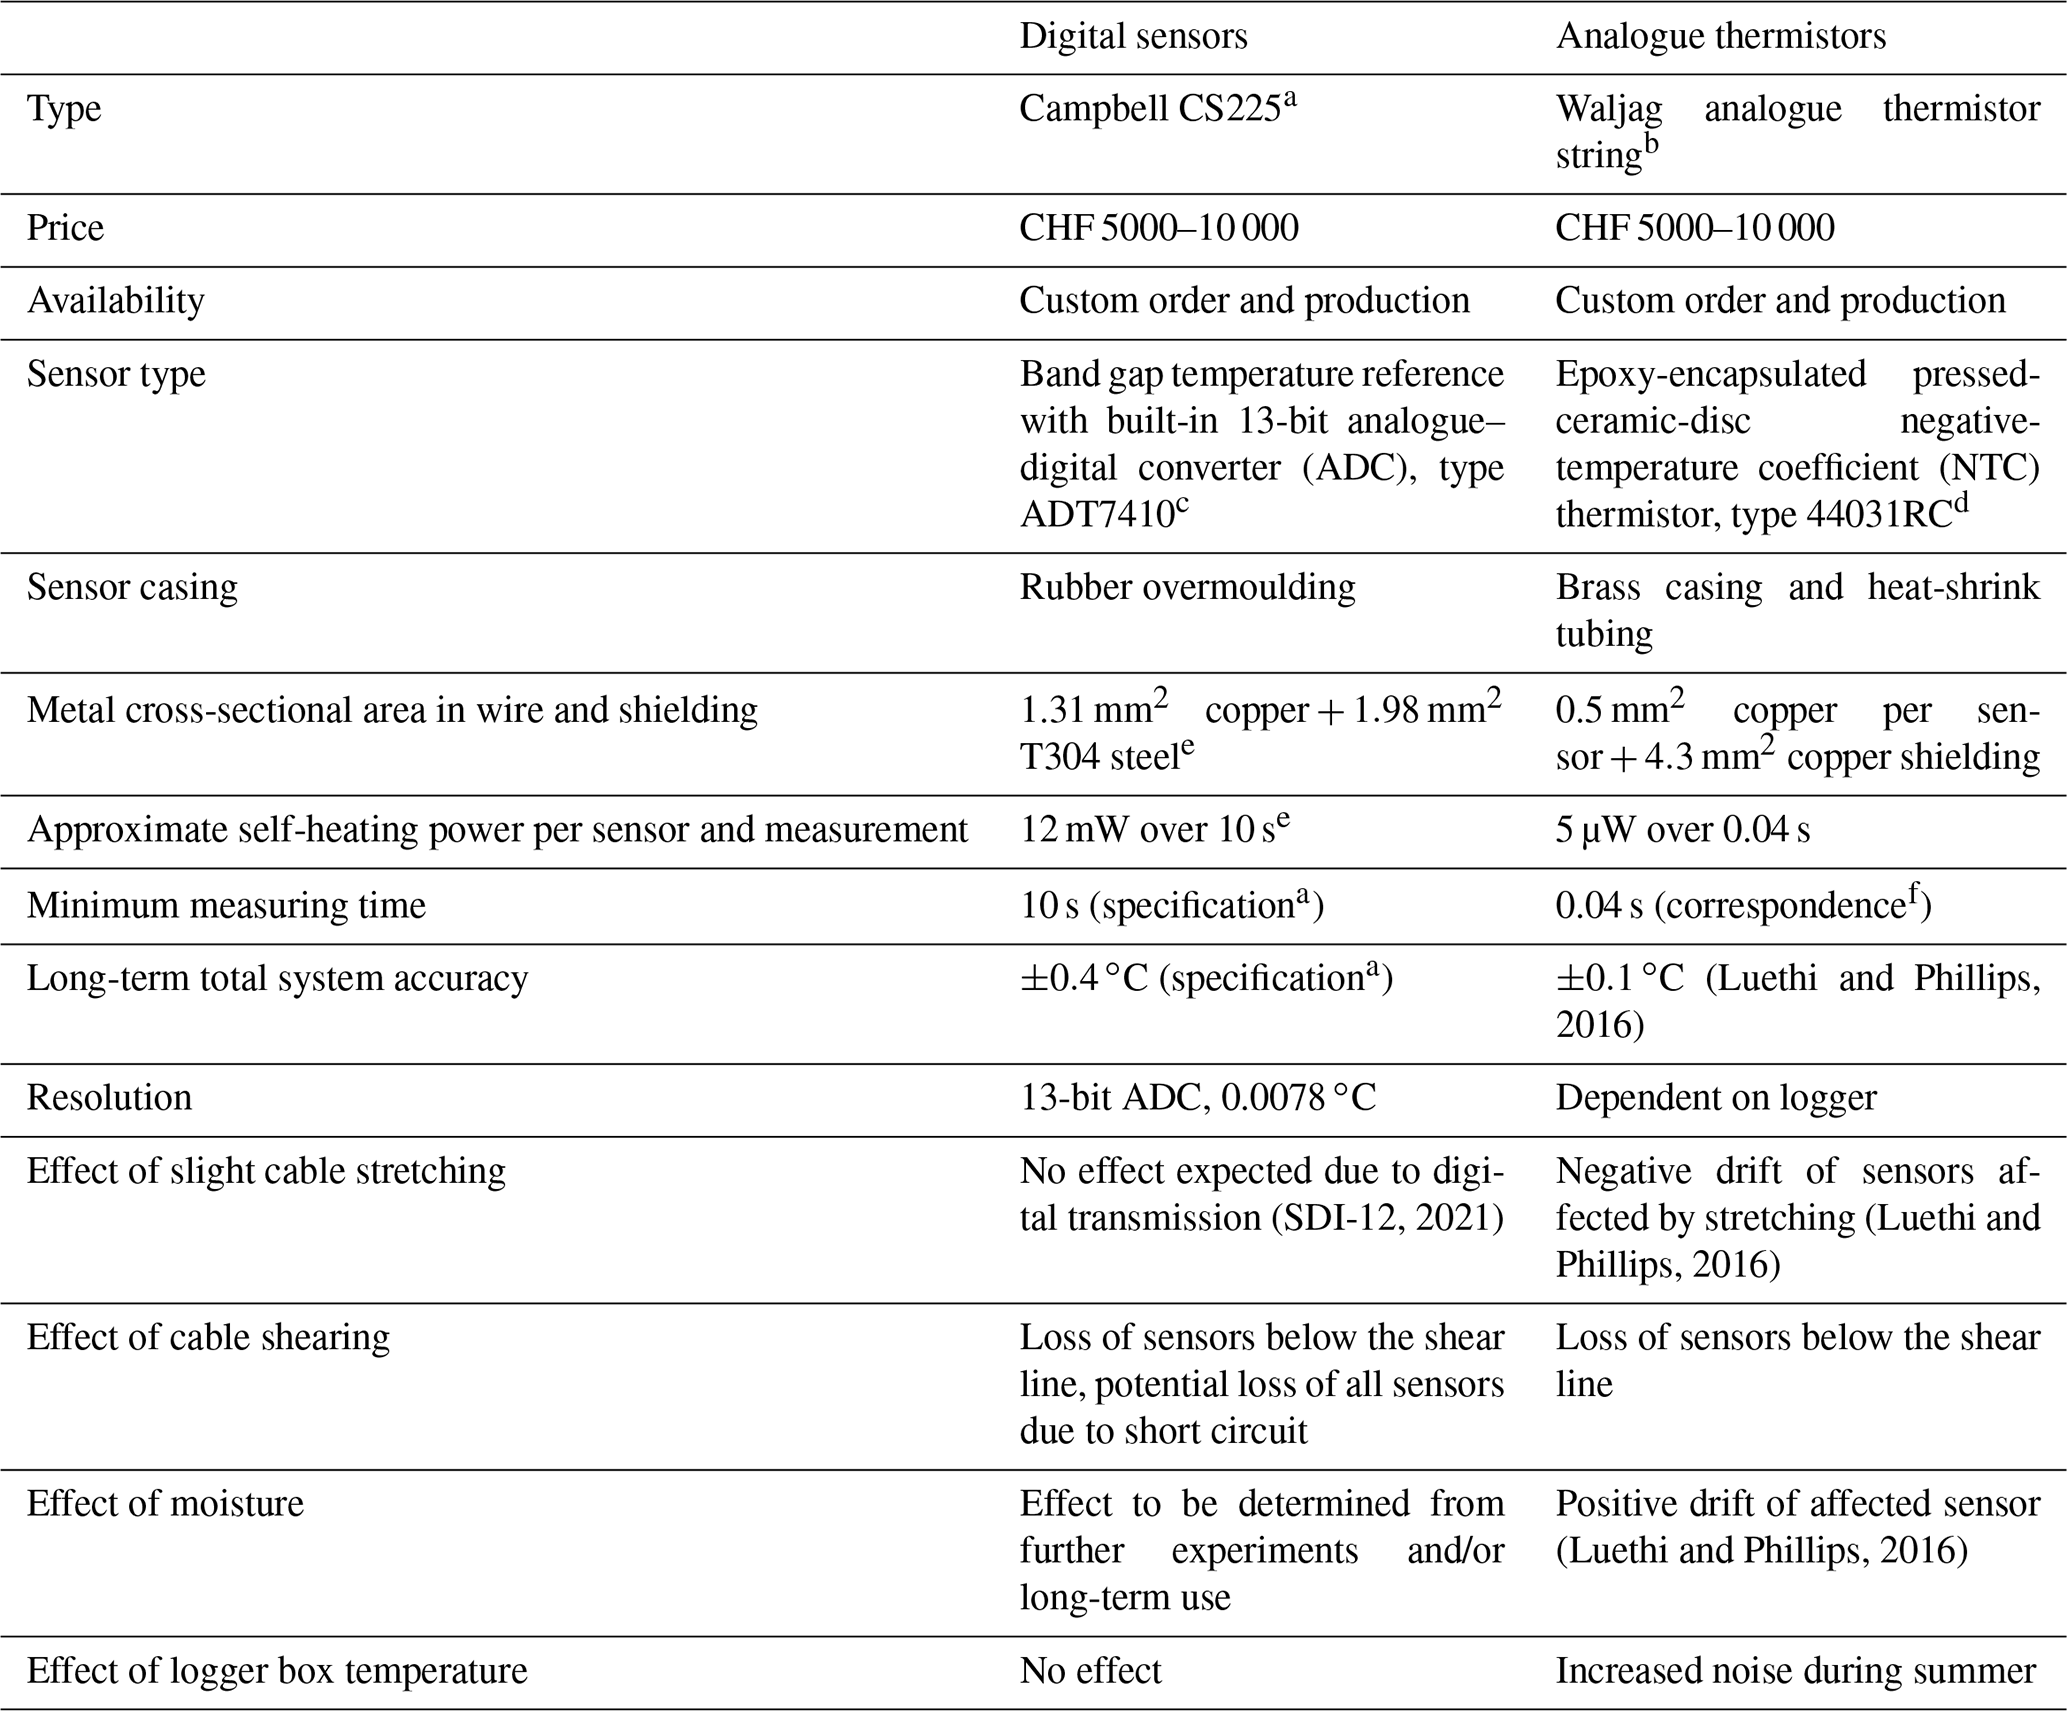
a https://s.campbellsci.com/documents/us/manuals/cs225.pdf (last access: 1 November 2022). b https://www.waljag.ch/angebot/permafrost/ (last access: 1 November 2022). c https://www.analog.com/en/products/adt7410.html#product-documentation (last access: 1 November 2022). d https://www.te.com/usa-en/product-11026199-00.html (last access: 1 November 2022). e Correspondence with Campbell Scientific. f Correspondence with Waljag GmbH.
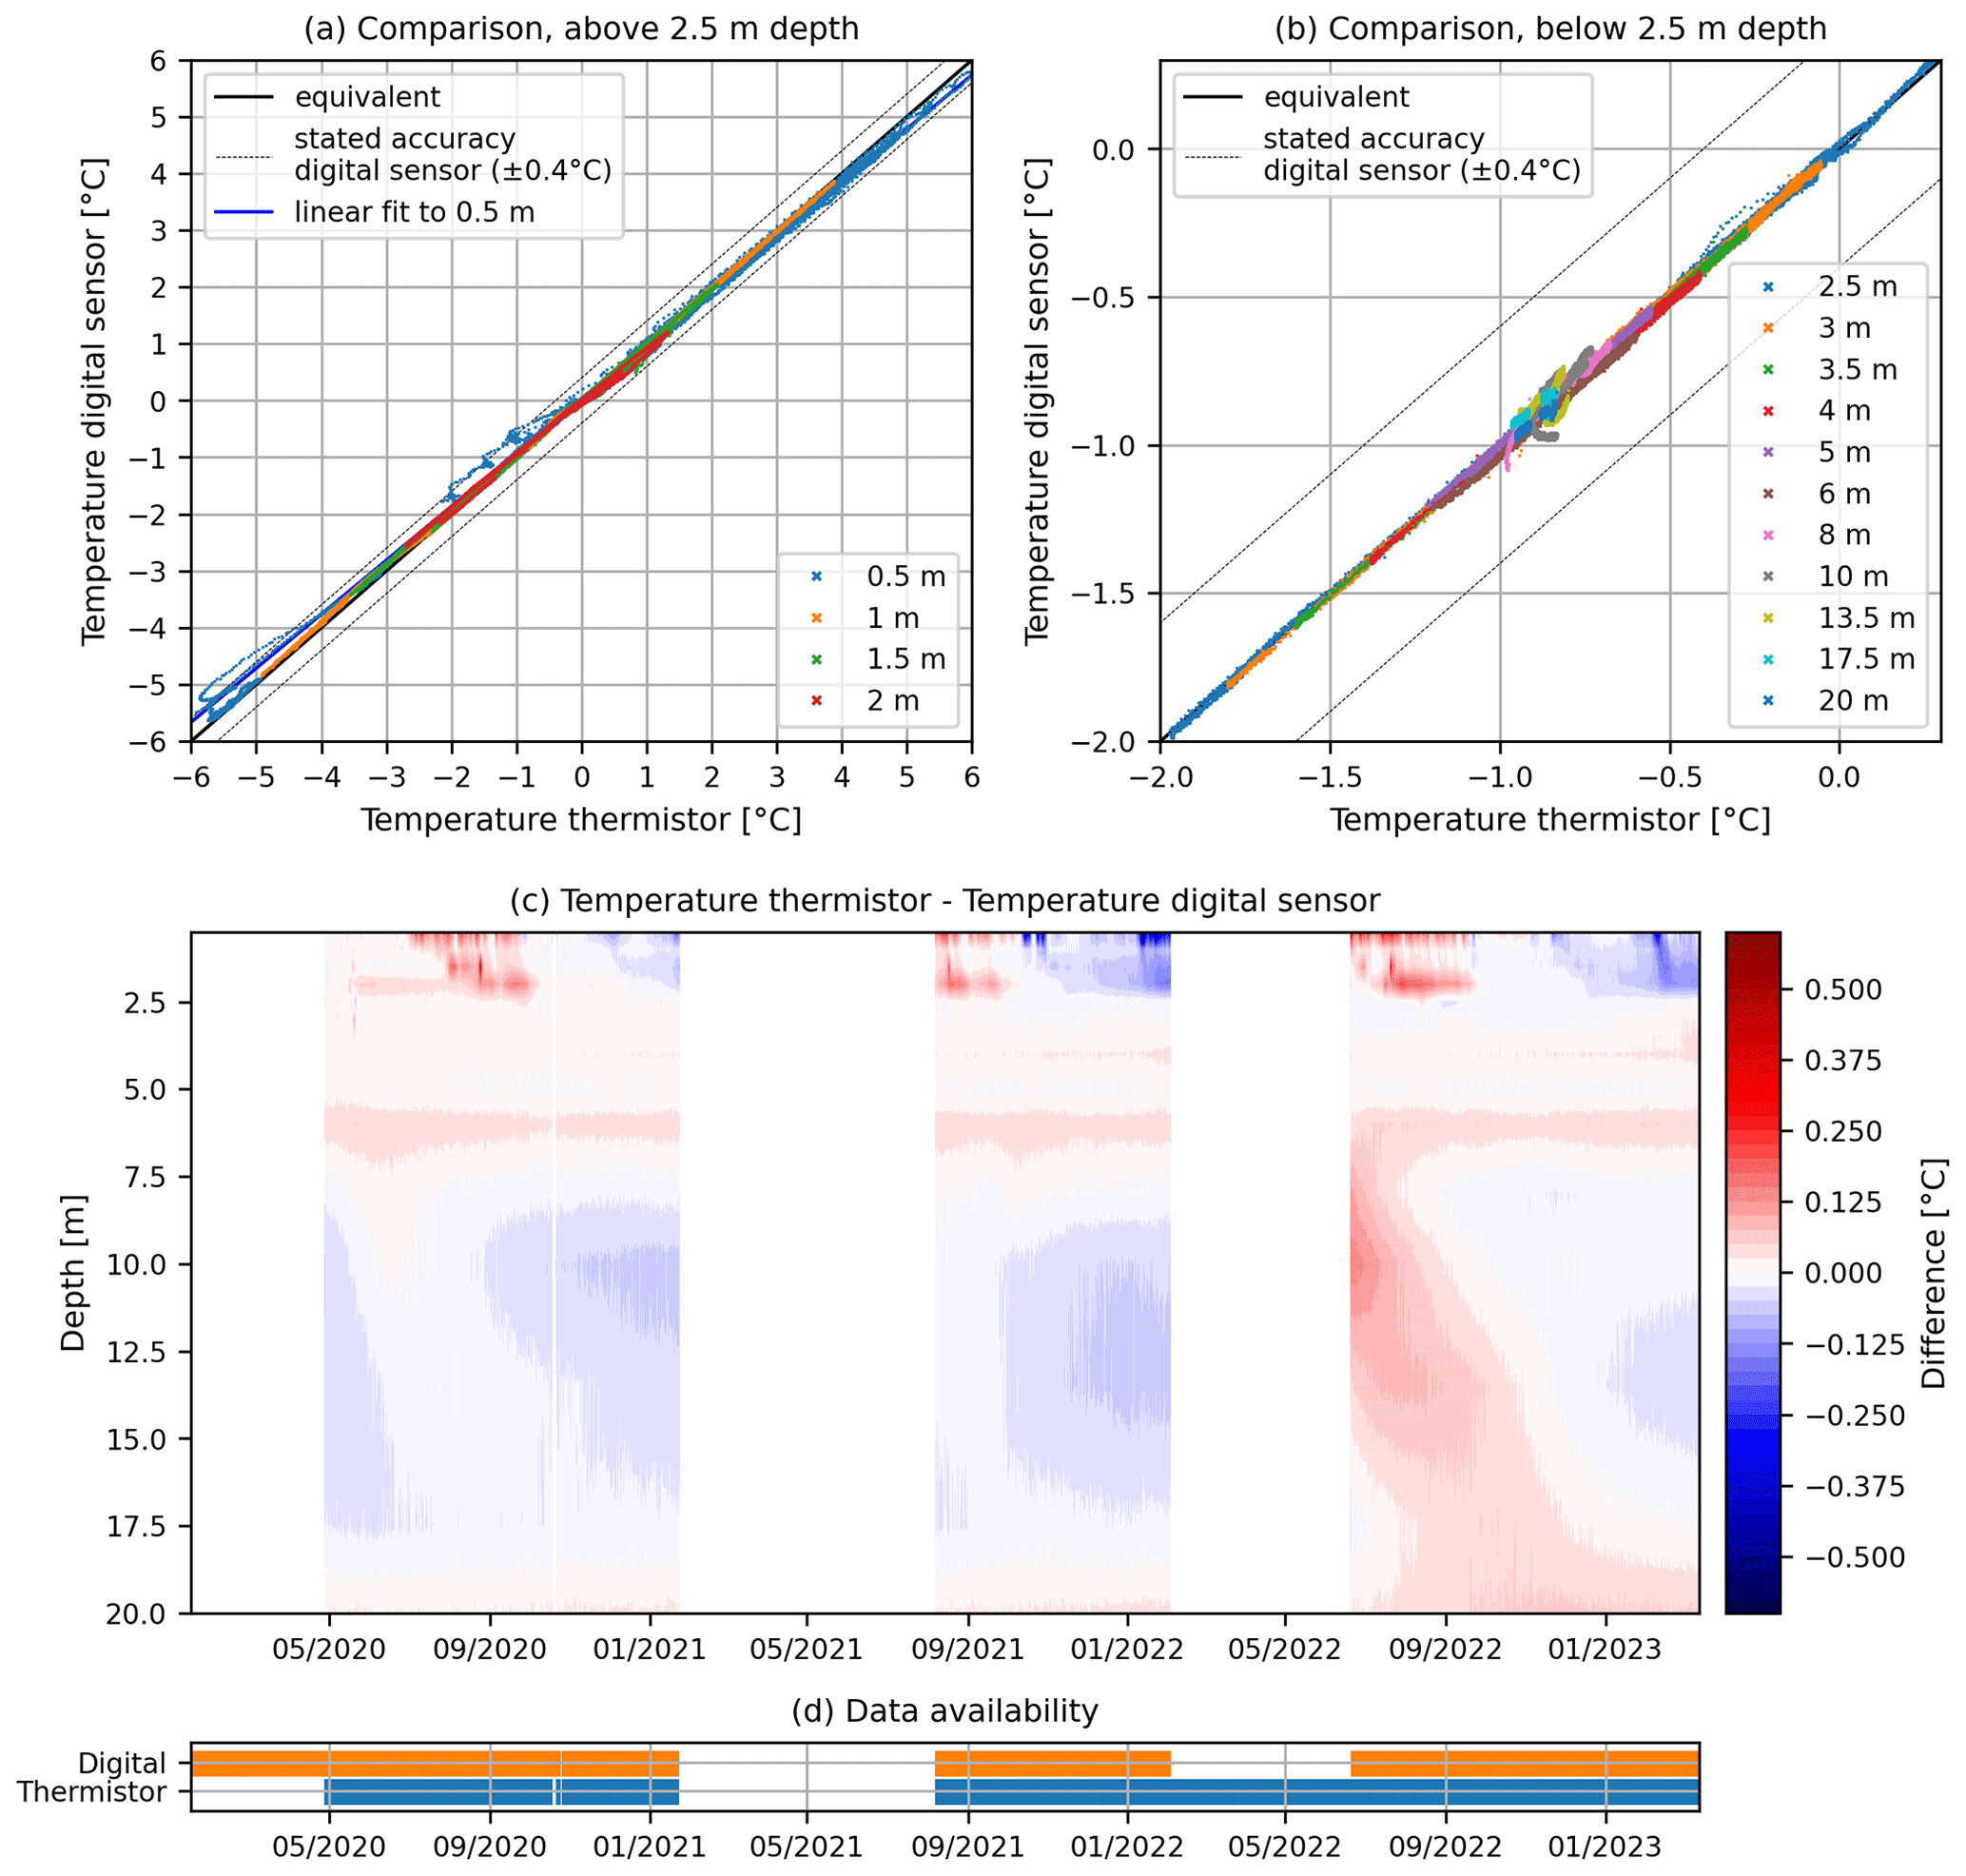
Figure 1Comparison of thermistor and digital sensor temperatures for different depths above (a) and below (b) 2.5 m depth. (c) Differences between the thermistor temperature data and the digital sensor data with depth and time. (d) Valid temperature recordings available for the digital sensors and thermistors over time.
The direct comparisons (Fig. 1a and b) show good agreement between the sensor types with a correlation coefficient of 0.966. The dashed lines represent a difference of ±0.4 ∘C between the sensors, which is the specified accuracy of the digital sensors. The data acquired in the active layer reveal that the digital sensors register approximately 5 % lower temperatures above 0 ∘C and 5 % higher temperatures below, compared to the thermistors. The agreement between the data values generally improves with depth (Fig. 1c). However, there are also some discrepancies between 10 and 17.5 m depth, particularly from January 2022 to September 2022. As air and near-surface temperatures were higher in summer 2022 than during the previous two summers, we surmise that the differences may be related to the influencing factors presented in the Discussion, such as the logger temperature and the thermal conductivity of the measurement system.
2.1 Comparison of measured system delay
To estimate the reaction delay between the two sensor types, the time series were filtered using a convolution with a Hann window (Harris, 1978) with a width of 24 values. Using a 2 h recording interval we obtained a 48 h smoothing window (see, for example, Fig. 2b). The digital sensors' time series was then refined by piecewise linear interpolation between all data points to obtain data points at 0.1 h intervals instead of 2 h. The Pearson correlation coefficient was calculated using time-shifted versions of the digital sensors' and thermistors' time series. These are shown in Fig. 2a for selected depths over a range of time shifts. Below 3.5 m temperatures change too slowly to determine the delay and are not shown. The maximum coefficient of correlation is achieved at 4.9, 3.2, 8.9 and 7.8 h delay for the digital sensors at 0.5, 1.0, 1.5 and 2.0 m depth, respectively. We observe similar delays when temperature both rises and falls.
2.2 Comparison of measured system noise
In Fig. 2b the digital sensor signals look noisier than the thermistors' signals. The noise level was calculated for the entire measurement period as well as July to August 2020 (high logger box temperatures) and December 2021 to January 2022 (low logger box temperatures). The standard deviation (SD) of both sensor types' noise was estimated using a method inspired by Sari et al. (2012). The sensor time series is first filtered by convolving with the same 24-value-wide Hann window as in Sect. 2.1. The mean of the absolute difference between smoothed and measured values is multiplied by 1.253 to get the estimated noise SD (Sari et al., 2012). The result is shown in Fig. 2c. For a stationary signal, a long convolution window and purely Gaussian noise, the procedure results in the exact noise SD. The borehole temperature changes slowly, and we assume the measurement noise to be of Gaussian nature. Figure 2c shows that the near-surface sensors have higher estimated noise SD. This is likely an artefact, as they have a less stationary signal due to daily variations in temperature. In the overall noise SD estimate for sensors at 5 m depth or deeper, the digital sensors have an estimated noise SD of between and ∘C and the thermistors a noise SD between and ∘C. The logger box temperature is only relevant for the thermistors, as they display more noise in summer than in winter.
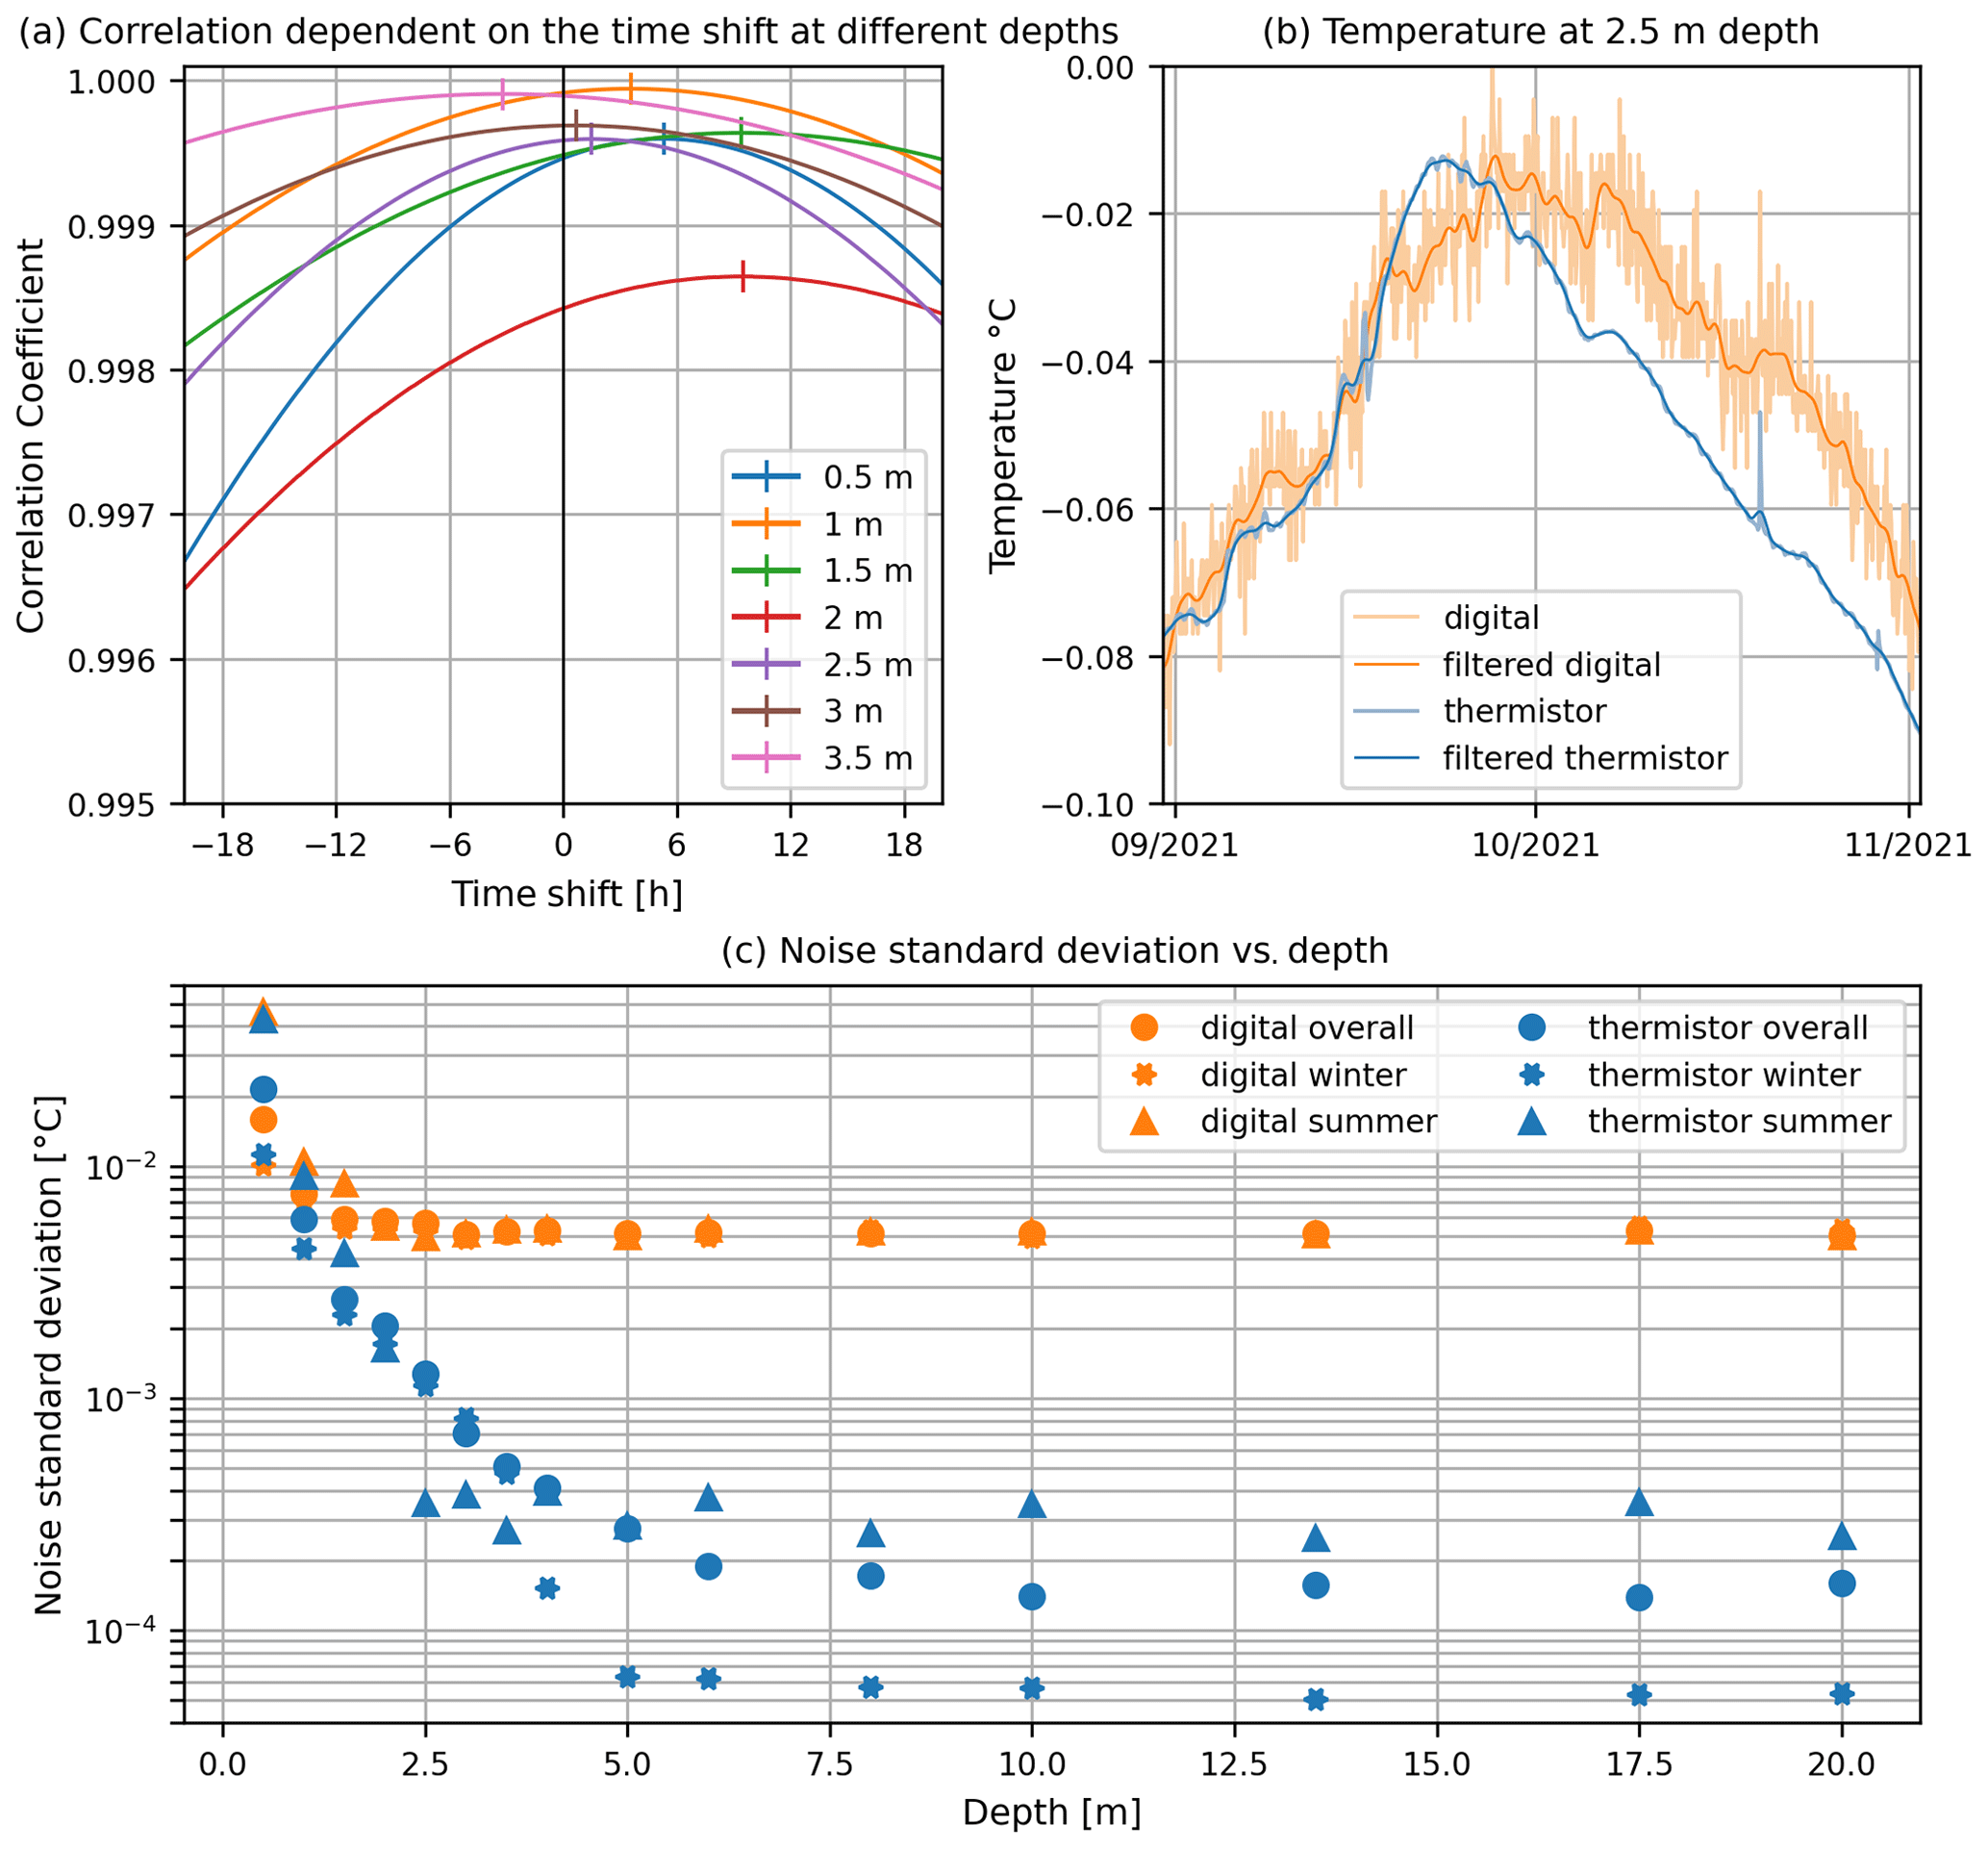
Figure 2(a) Correlation coefficients of the thermistors and digital sensors vs. applied time shift between the sensors. Maxima are marked with vertical ticks and can be read as the approximate delay of the digital sensor vs. the thermistors. (b) Temperature measurements at 2.5 m depth between 1 September 2021 and 1 November 2021. (c) Estimated standard deviation (SD) of the estimated noise vs. depth of the sensor. The digital sensors' noise is clearly higher than the thermistors', but only the thermistors show a clear difference between summer and winter conditions.
The fact that both sensor systems shown here failed (either simultaneously or at different times) during the period between 2019 and 2023, as shown in Fig. 1d, underlines the importance of sensor duplication. The long-term performance as well as the effect of moisture on the digital sensors is not yet known and will only be revealed in a few years.
For temperature monitoring in permafrost the accuracy of temperature sensors around 0 ∘C is most important, so it is common to rely on single-point calibration at 0 ∘C (Noetzli et al., 2021; Streletskiy et al., 2022). Multi-point calibration is significantly more challenging, as it requires an alcohol bath and accurate reference thermometers instead of an ice-water bath. The approximately 5 % difference in slope between the thermistors' and digital thermometers' temperatures found here underlines that a multi-point calibration might improve the sensor performance and agreement significantly. White et al. (2014) recommend a two-point calibration for a temperature range of 10 ∘C with an expected uncertainty of about 0.1 ∘C. The digital sensors register temperature changes with a delay on the order of 1–10 h compared to the thermistors. This could have two causes: (a) higher insulation and thermal mass of the digital thermometers and/or (b) higher thermal conductivity along the thermistor’s cable due to the larger copper cross-sectional area. A delay can have disadvantages in ground layers with daily temperature fluctuations, but the rapid reaction of the thermistors may not entirely reflect the true ground temperature. During the summer months logger temperatures can produce noise in the thermistor data. Even then, the digital sensors are significantly noisier than the thermistors, but the noise level is acceptable for both sensor types as it is significantly lower than their respective accuracy. The measurement frequency could be increased to reduce noise but has to be weighed against the increase in self-heating and power consumption.
We compare two temperature sensor systems (resistance thermistors and digital bandgap temperature sensors) in mountain permafrost at 15 identical depths in 1 borehole. Temperature values, sensing delays and noise levels are compared and discussed. Overall, the differences between the temperature sensor types are minimal, with fewer than 5 % of all values outside of a 0.1 ∘C difference. Since the risk of sensor failure in mountain-permafrost boreholes is considerable, we can conclude that it is best to measure with at least two temperature strings. Using different types of sensor strings further reduces the chance of simultaneous failure.
We will collect and analyse a longer time series to characterize the measurement delay of the digital sensors more accurately. Experiments should be carried out using identical encapsulation systems. Whereas the long-term behaviour of thermistors is well known in mountain permafrost, we do not yet know how digital temperature sensors will react to moisture, cable stretching or cable damage. To test the effects of calibration and linearity, both sensor types should be tested against a reference thermometer in a laboratory setting. An experiment measuring heat conduction along the wires of the temperature strings would be useful to quantify differences in reaction time. The self-heating of both sensor types should also be determined. This first analysis of temperatures measured using two systems in a mountain-permafrost borehole gives initial useful insight into their advantages and disadvantages.
The thermistor data from the borehole are available at https://www.permos.ch/doi/permos-dataset-2023-1-1 (Swiss Permafrost Monitoring Network, 2023; borehole MBP_0319). The data from the digital temperature sensors can be acquired from Marcia Phillips (phillips@slf.ch).
LW: investigation, methodology, formal analysis, visualization, writing (original draft preparation). MP: conceptualization, investigation, methodology, funding acquisition, writing (original draft preparation). CB: resources, software, writing (review and editing).
The contact author has declared that none of the authors has any competing interests.
Publisher's note: Copernicus Publications remains neutral with regard to jurisdictional claims in published maps and institutional affiliations.
Canton Grisons is thanked for providing logistical support for drilling. The companies Waljag and Campbell Scientific produced the temperature sensors and are thanked for their useful advice during the design of the measurement set-up. We are grateful to the SLF electronics and mechanical workshop for their technical support and Jeannette Nötzli for her thorough proofreading. We thank the editor and the two reviewers for their constructive comments.
This research has been supported by the Swiss Permafrost Monitoring Network (PERMOS) and the Federal Office for the Environment (FOEN), who funded the drilling and instrumentation of the borehole.
This paper was edited by Regula Frauenfelder and reviewed by Philippe Schoeneich and Ivar-Kristian Waarum.
Haberkorn, A., Kenner, R., Noetzli, J., and Phillips, M.: Changes in Ground Temperature and Dynamics in Mountain Permafrost in the Swiss Alps, Front. Earth Sci., 9, 626686, https://doi.org/10.3389/feart.2021.626686, 2021.
Harris, C., Haeberli, W., Vonder Mühll, D., and King, L.: Permafrost monitoring in the high mountains of Europe: the PACE Project in its global context, Permafrost Periglac. Process., 12, 3–11, https://doi.org/10.1002/ppp.377, 2001.
Harris, C. R., Millman, K. J., van der Walt, S. J., Gommers, R., Virtanen, P., Cournapeau, D., Wieser, E., Taylor, J., Berg, S., Smith, N. J., Kern, R., Picus, M., Hoyer, S., van Kerkwijk, M. H., Brett, M., Haldane, A., del Río, J. F., Wiebe, M., Peterson, P., Gérard-Marchant, P., Sheppard, K., Reddy, T., Weckesser, W., Abbasi, H., Gohlke, C., and Oliphant, T. E.: Array programming with NumPy, Nature, 585, 357–362, https://doi.org/10.1038/s41586-020-2649-2, 2020.
Harris, F. J. J. P. O. T. I.: On the use of windows for harmonic analysis with the discrete Fourier transform, in: Proceedings of the IEEE, 66, 51–83, https://doi.org/10.1109/PROC.1978.10837, 1978.
Luethi, R. and Phillips, M.: Challenges and solutions for long-term permafrost borehole temperature monitoring and data interpretation, Geogr. Helv., 71, 121–131, https://doi.org/10.5194/gh-71-121-2016, 2016.
Noetzli, J. and Pellet, C.: Swiss Permafrost Bulletin 2021, 22, https://doi.org/10.13093/permos-bull-2021, 2022.
Noetzli, J., Arenson, L. U., Bast, A., Beutel, J., Delaloye, R., Farinotti, D., Gruber, S., Gubler, H., Haeberli, W., Hasler, A., Hauck, C., Hiller, M., Hoelzle, M., Lambiel, C., Pellet, C., Springman, S. M., Vonder Muehll, D., and Phillips, M.: Best Practice for Measuring Permafrost Temperature in Boreholes Based on the Experience in the Swiss Alps, Front. Earth Sci., 9, 607875, https://doi.org/10.3389/feart.2021.607875, 2021.
PERMOS: Permafrost in Switzerland 2014/2015 to 2017/2018, 104 pp., https://doi.org/10.13093/permos-rep-2019-16-19, 2019.
Phillips, M. and Kenner, R.: Periglacial Landscapes and Protection Measures Above Pontresina, in: Landscapes and Landforms of Switzerland, edited by: Reynard, E., Springer International Publishing, Cham, 397–407, https://doi.org/10.1007/978-3-030-43203-4_28, 2021.
Phillips, M., Haberkorn, A., Kenner, R., and Noetzli, J.: Current changes in mountain permafrost based on observations in the Swiss Alps., Swiss Bull. Angew. Geol., 25, 53–63, 2020.
Sari, S., Roslan, H., and Shimamura, T.: Noise Estimation by Utilizing Mean Deviation of Smooth Region in Noisy Image, Fourth International Conference on Computational Intelligence, Modelling and Simulation, Kuantan, Malaysia, 2012, 232–236, https://doi.org/10.1109/CIMSim.2012.89, 2012.
SDI-12 Support Group (Technical Commitee): SDI-12 A Serial-Digital Interface Standard for Microprocessor-Based Sensors Version 1.4, https://sdi-12.org/archives_folder/SDI-12_version-1_4-Jan-30-2021.pdf (last access: 1 November 2022), 2021.
Streletskiy, D., Noetzli, J., Smith, S. L., Vieira, G., Schoeneich, P., Hrbacek, F., and Irrgang, A. M.: Measurement Recommendations and Guidelines for the Global Terrestrial Network for Permafrost (GTN-P), Zenodo [data set], https://doi.org/10.5281/zenodo.5973079, 2022.
Swiss Permafrost Monitoring Network (PERMOS): Swiss Permafrost Monitoring Network Database (PERMOS Database), Swiss Permafrost Monitoring Network (PERMOS) [data set], https://www.permos.ch/doi/permos-dataset-2023-1-1, 2023.
Virtanen, P., Gommers, R., Oliphant, T. E., Haberland, M., Reddy, T. E., Cournapeau,D., Burovski, E., Peterson, P., Weckesser, W., Bright, J., van der Walt, S., Brett, M., Wilson, J., Millman, K. J., Mayorov, N., Nelson, A. R. J., Jones, E., Kern, R., Larson, E., Carey, C. J., Polat, İ., Feng, Y., Moore, E. W., VanderPlas, J., Laxalde, D., Perktold, J., Cimrman, R., Henriksen, I., Quintero, E. A., Harris, C. R., Archibald, A. M., Ribeiro,A. H., Pedregosa, F., van Mulbregt, P., Vijaykumar, A., Bardelli, A. P., Rothberg, A., Hilboll, A., Kloeckner, A., Scopatz, A., Lee, A., Rokem, A., Woods, C. N., Fulton, C., Masson, C., Häggström, C., Fitzgerald, C., Nicholson, D., Hagen, D. R., Pasechnik, D. V., Olivetti, E., Martin, E., Wieser, E., Silva, F., Lenders, F., Wilhelm, F., Young, G., Price, G. A., Ingold, G. A. L., Allen, G. E., Lee, G. R., Audren, H., Probst, I., Dietrich, J. P., Silterra, J., Webber, J. T., Slavič, J., Nothman, J., Buchner, J., Kulick, J., Schönberger, J., de Miranda Cardoso, J. V., Reimer, J., Harrington, J., Rodríguez, J. L. C., Nunez, I. J., Kuczynski, J., Tritz, K., Thoma, M., Newville, M., Kümmerer, M., Bolingbroke, M., Tartre, M., Pak, M., Smith, N., Nowaczyk, N., Shebanov, N., Pavlyk, O., Brodtkorb, P. A., Lee, P., McGibbon, R. T., Feldbauer, R., Lewis, S., Tygier, S., Sievert, S., Vigna, S., Peterson, S., More, S., Pudlik, T., Oshima, T., Pingel, T. J., Robitaille, T. P., Spura, T., Jones, T. R., Cera, T., Leslie, T., Zito, T., Krauss, T., Upadhyay, U., Halchenko, Y. O., and Vázquez, B. Y.: SciPy 1.0 Contributors, SciPy 1.0: Fundamental Algorithms for Scientific Computing in Python, Nature Methods, 17, 261–272, https://doi.org/10.1038/s41592-019-0686-2, 2020.
White, D. R., Hill, K., del Campo, D., Izquierdo, C. G., and Consultative Committee for Thermometry under the auspices of the International Committee for Weights and Measures: Guide on secondary thermometry: Thermistor thermometry, Bureau International des Poids et Mesures, https://www.bipm.org/documents/20126/41773843/Guide-SecTh-Thermistor-Thermometry.pdf/87e2fdc8-14fc-e977-918e-b801752d06a0 (last access: 1 November 2022), 2014.