the Creative Commons Attribution 4.0 License.
the Creative Commons Attribution 4.0 License.
 | 14 Sep 2023
Environmental controls on observed spatial variability of soil pore water geochemistry in small headwater catchments underlain with permafrost
Jeffrey M. Heikoop
Emma Lathrop
Dea Musa
Brent D. Newman
Chonggang Xu
Rachael E. McCaully
Carli A. Arendt
Verity G. Salmon
Amy Breen
Vladimir Romanovsky
Katrina E. Bennett
Cathy J. Wilson
Stan D. Wullschleger
Soil pore water (SPW) chemistry can vary substantially across multiple scales in Arctic permafrost landscapes. The magnitude of these variations and their relationship to scale are critical considerations for understanding current controls on geochemical cycling and for predicting future changes. These aspects are especially important for Arctic change modeling where accurate representation of sub-grid variability may be necessary to predict watershed-scale behaviors. Our research goal is to characterize intra- and inter-watershed soil water geochemical variations at two contrasting locations in the Seward Peninsula of Alaska, USA. We then attempt to identify the key factors controlling concentrations of important pore water solutes in these systems. The SPW geochemistry of 18 locations spanning two small Arctic catchments was examined for spatial variability and its dominant environmental controls. The primary environmental controls considered were vegetation, soil moisture and/or redox condition, water–soil interactions and hydrologic transport, and mineral solubility. The sampling locations varied in terms of vegetation type and canopy height, presence or absence of near-surface permafrost, soil moisture, and hillslope position. Vegetation was found to have a significant impact on SPW NO concentrations, associated with the localized presence of nitrogen-fixing alders and mineralization and nitrification of leaf litter from tall willow shrubs. The elevated NO concentrations were, however, frequently equipoised by increased microbial denitrification in regions with sufficient moisture to support it. Vegetation also had an observable impact on soil-moisture-sensitive constituents, but the effect was less significant. The redox conditions in both catchments were generally limited by Fe reduction, seemingly well-buffered by a cache of amorphous Fe hydroxides, with the most reducing conditions found at sampling locations with the highest soil moisture content. Non-redox-sensitive cations were affected by a wide variety of water–soil interactions that affect mineral solubility and transport. Identification of the dominant controls on current SPW hydrogeochemistry allows for qualitative prediction of future geochemical trends in small Arctic catchments that are likely to experience warming and permafrost thaw. As source areas for geochemical fluxes to the broader Arctic hydrologic system, geochemical processes occurring in these environments are particularly important to understand and predict with regards to such environmental changes.
- Article
(7363 KB) - Full-text XML
-
Supplement
(5535 KB) - BibTeX
- EndNote


Permafrost thaw in the Arctic is causing significant changes to landscape structure (Kokelj and Jorgenson, 2013; Rowland et al., 2010), hydrology (Hiyama et al., 2021; Kurylyk and Walvoord, 2021; Liljedahl et al., 2016; Vonk et al., 2019; Walvoord and Kurylyk, 2016), vegetation (Lara et al., 2018; Myers-Smith et al., 2011; Sturm et al., 2001; Tape et al., 2012, 2006), and biogeochemistry (O'Donnell et al., 2021; Frey and McClelland, 2009; Salmon et al., 2019; Vonk et al., 2019). The integrated hydrogeochemical effects of these environmental changes are already apparent in the chemistry of the large Arctic rivers, where fluxes of carbon and nutrients are increasing, leading to enhanced nutrient loadings, with strong implications for the global carbon cycle (Bring et al., 2016; Fuchs et al., 2020; McClelland et al., 2016). While the watershed areas of large Arctic rivers are vast, recent studies suggest that solute concentrations in these large rivers are likely controlled by solute generation processes occurring at much smaller scales (Harms and Ludwig, 2016; Koch et al., 2013; Shogren et al., 2019; Vonk et al., 2015).
While there is a rapidly growing body of literature focused on observing and understanding environmental changes over time with further Arctic warming, relatively few studies directly address the existing spatial variability, within catchments or across catchments, and we are not aware of any studies that have combined field observations with thermodynamic modeling in an effort to understand the causes of the existing spatial variability. Therefore, we have a limited understanding of the key environmental controls on the spatial distribution of soil pore water solute concentrations. In this study, we quantitatively evaluate the spatial variability of soil pore water (SPW) geochemistry within and between two distinct catchments underlain with permafrost and then seek to identify the source of the observed spatial variability.
This study takes advantage of a scientifically diverse array of observations and datasets made available by the Next-Generation Ecosystem Experiments (NGEE) Arctic project, sponsored by the US Department of Energy Office of Science. Most of the locations studied herein were selected by the NGEE Arctic project to provide co-located measurements in a wide range of vegetation types, nested within representative hillslopes and catchments. Although selected largely to represent a range of vegetation structure, such as shrub abundance and canopy height, these locations also have considerable variability in other environmental parameters including but not limited to soil moisture and temperature, presence or absence of near-surface permafrost, and maximum observed thaw depth (Tables 1 and 2). The vegetation-delineated sampling approach provides an opportunity to not only quantify the biogeochemical variability of SPW in Arctic environments but also to investigate the root causes of that observed variability. Data from additional sampling locations, available from a co-located study, were also utilized when possible.
Table 1Teller station physical characteristics. NA – not available.
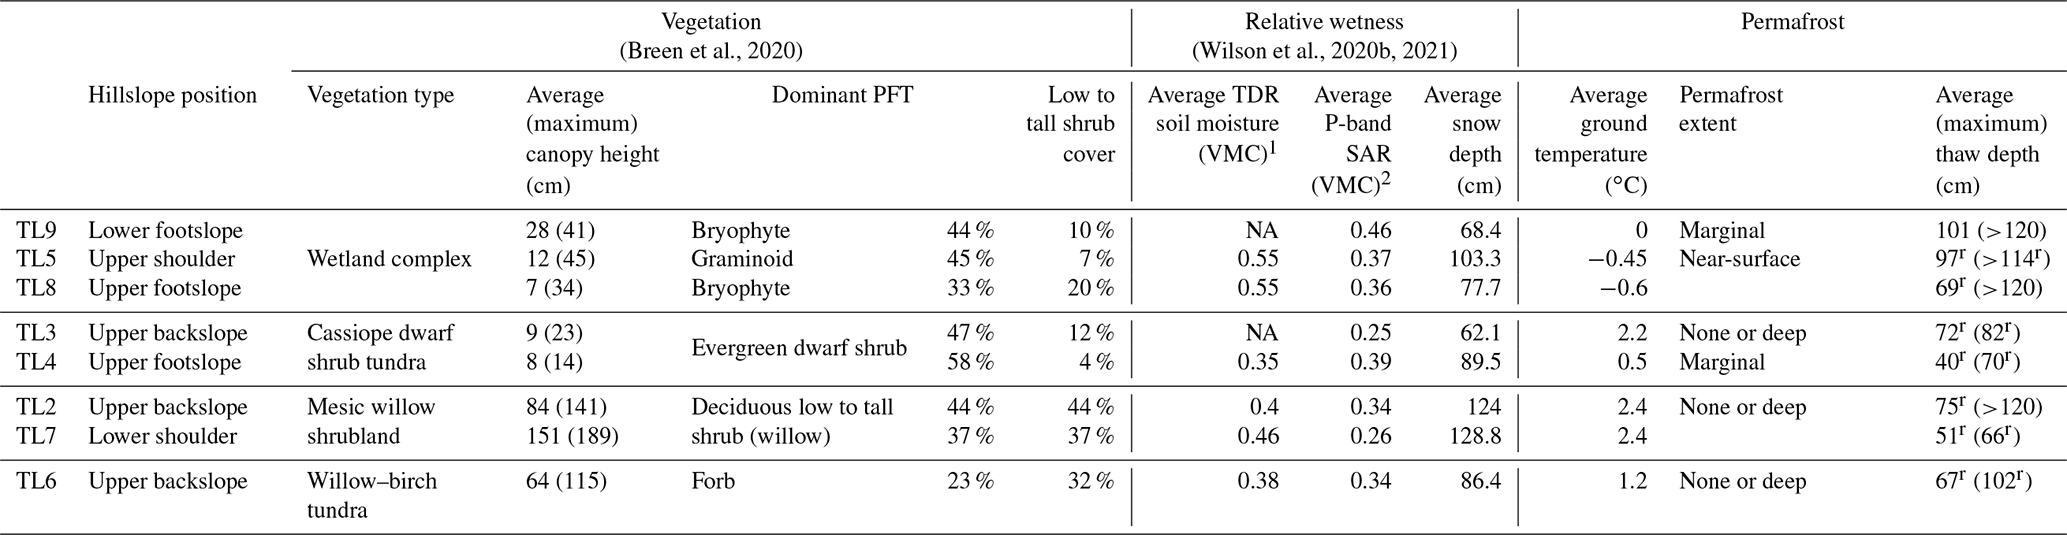
PFT – plant functional type; dwarf shrub (height <40 cm), low shrub (height 40–200 cm), low to tall shrub (height 40 to >200 cm tall). Deciduous shrub PFT classes identify the dominant species in the plant community as either willow or willow and birch. There is no alder at the Teller site. Low to tall shrub cover represents the sum of deciduous low shrubs, deciduous low to potentially tall willow and birch, and deciduous low to tall alder. 1 Single-point soil moisture measurements. Data are more accurate than P-band SAR (synthetic aperture radar) but represent a much smaller spatial scale. 2 P-band SAR has 30 m resolution. r Resistive layer was rock; all others are permafrost. A temperature probe was used to determine if the resistive layer was permafrost (≤0 ∘C) or rock (>2 ∘C). Thaw depth is an average of four measurements from the vegetation plot corners within the IS and was measured at the end of the growing season.
Table 2Kougarok station physical characteristics. NA – not available.
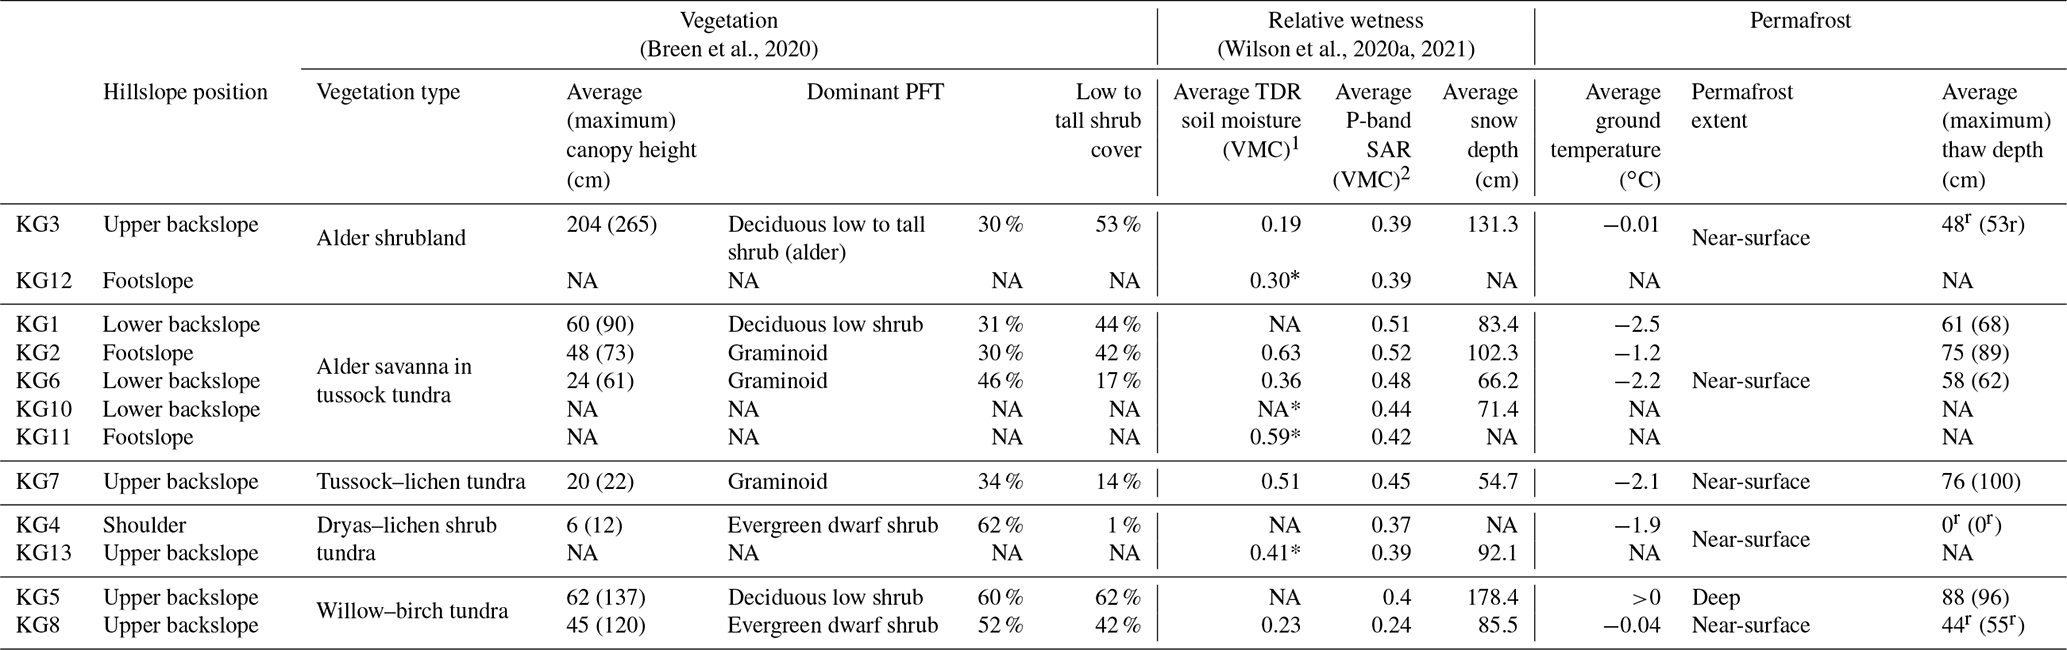
Note: PFT – plant functional type. Deciduous shrub PFT classes identify the dominant species in the community as either willow, alder, willow and birch, or alder, willow, and birch. Low to tall shrub cover represents the sum of deciduous low shrubs, deciduous low to potentially tall willow and birch, and deciduous low to tall alder. 1 Single-point soil moisture measurements. Data are more accurate than P-band SAR but represent a much smaller spatial scale. 2 P-band SAR has 30 m resolution. * Average gravimetric water content measurements, corrected to VMC (volumetric moisture content) by bulk density. r Resistive layer was rock; all others are permafrost. A temperature probe was used to determine if the resistive layer was permafrost (≤0 ∘C) or rock (>2 ∘C). Thaw depth is an average of four measurements from the vegetation plot corners within the station and was measured at the end of the growing season.
Our overarching hypothesis is that vegetation type and hillslope position are the dominant controls on spatial variability of SPW geochemistry at the NGEE Arctic field sites located on the Seward Peninsula. Vegetation type seems likely to have a significant effect on SPW geochemistry both directly and indirectly. Indirect effects would include vegetation canopy impacts on soil moisture (through evapotranspiration and snow trapping). Direct effects of vegetation would include nutrient cycle changes resulting from the annual deposition of plant litter. Such a direct effect can be augmented at sites populated by alder shrubs due to the ability of this genus of deciduous shrubs to form a symbiotic relationship with nitrogen-fixing Frankia, which they host in underground root nodules (Salmon et al., 2019). Nitrogen fixation associated with alders has previously been shown to accelerate local nitrogen cycling (Binkley et al., 1992; Clein and Schimel, 1995; Bühlmann et al., 2014). Soil moisture will also affect SPW geochemistry, particularly of redox-sensitive species, by limiting oxygen diffusion and thus controlling which regions develop anoxic or reducing geochemical conditions. Soil moisture impacts will likely be correlated with vegetation type as well as hillslope position and the presence or absence of perching layers, including permafrost, all of which impact the vertical and horizontal drainage characteristics of a watershed. Chemical species that are not redox-sensitive or controlled by biogeochemical reactions are likely to be affected by transport, solubility, and water–sediment–organic matter interactions and are therefore largely controlled by hillslope position as well as soil moisture.
Identifying the dominant controls on solute concentration variability within each catchment and across catchments will facilitate better projections of future soil pore hydrogeochemistry in permafrost landscapes and how these signatures are related to changing soil moisture and increasing tundra shrub abundance in a changing Arctic (Bring et al., 2016; Myers-Smith et al., 2011; Prowse et al., 2015a; Salmon et al., 2019; Sturm et al., 2001; Tape et al., 2012, 2006; Wrona et al., 2016). Arctic warming and associated permafrost thaw will increase hydrological connectedness between terrestrial and aquatic environments through deepening of the active layer and the formation of deeper, more coherent groundwater flow paths (Bring et al., 2016; Harms and Jones, 2012; Prowse et al., 2015a, b). Meanwhile, changes in hydrogeochemical signatures in larger Arctic rivers are likely to originate in smaller catchments (McClelland et al., 2016; Prowse et al., 2015b; Shogren et al., 2019; Spence et al., 2015). In this sense, changes in hydrogeochemistry in small Arctic catchments not only impact hydrogeochemistry at much larger scales but also prognosticate the future hydrogeochemistry of larger Arctic rivers.
2.1 Site descriptions
This study focuses on two sites with permafrost on the Seward Peninsula of western Alaska, the Teller-27 catchment and the Kougarok-64 hillslope (Fig. 1). The Teller-27 catchment, henceforth “Teller”, is a small (∼ 2.25 km2) headwater catchment located west of mile marker 27 along the Nome–Teller Highway northwest of Nome, Alaska. The Kougarok-64 hillslope, henceforth “Kougarok”, is a hillslope (∼ 2.0 km2) located west of mile marker 64 along the Nome–Taylor Highway northeast of Nome, Alaska. We utilized data from “intensive stations” at both Teller and Kougarok where concentrated, multi-year, co-located observations of soil water chemistry, vegetation characteristics, soil moisture and temperature, and other measurements have been collected as part of the NGEE Arctic research project. These are identified as TL number (Teller station number) or KG number (Kougarok station number) in Figs. 2 and 3, respectively. It should be noted that Teller and Kougarok are not “paired watersheds” in the classical sense, differing in only one major characteristic, which provides the basis for comparison. Instead, Teller and Kougarok differ in many respects and are both representative of the broad range of hillslope conditions common on the Seward Peninsula. Detailed descriptions of Teller and Kougarok have been published previously (Jafarov et al., 2018; Léger et al., 2019; Philben et al., 2019, 2020; Salmon et al., 2019; Yang et al., 2020); therefore, only the catchment characteristics that are probable sources of variability in SPW chemistry will be highlighted here.
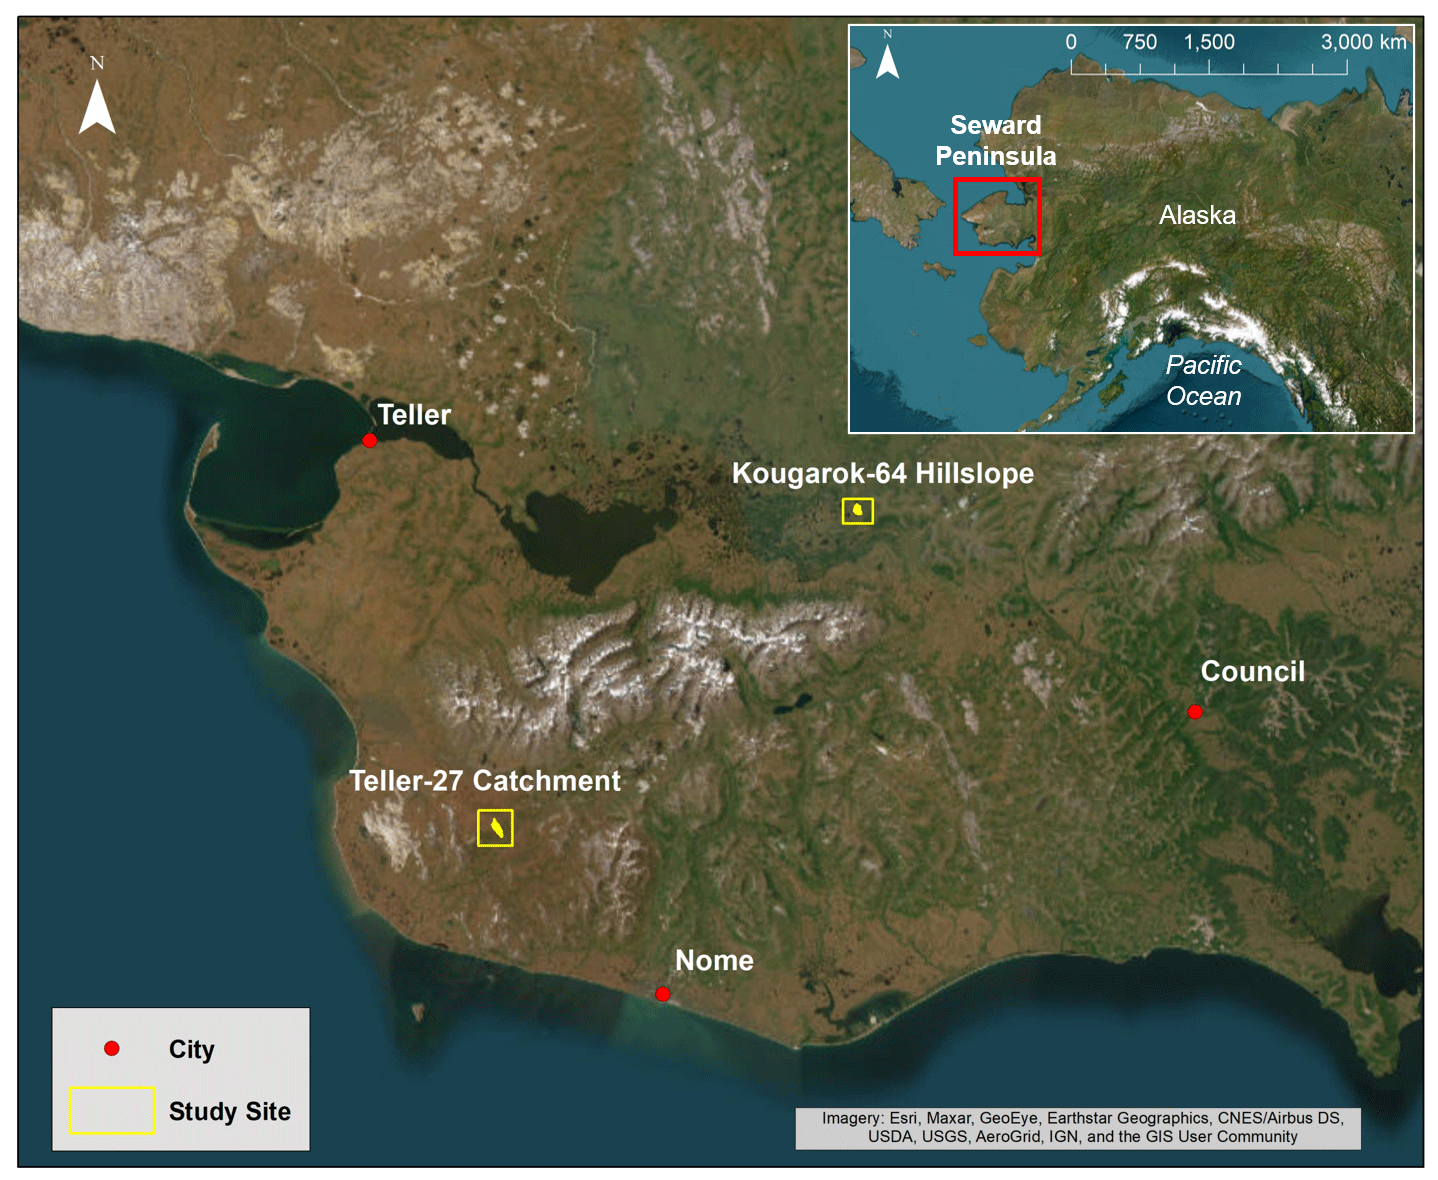
Figure 1Location of the Teller and Kougarok field sites with respect to the municipalities of Teller, Nome, and Council. All are located on the Seward Peninsula in northwestern Alaska. RGB composite imagery from the 8-band WorldView-2 imagery obtained on 14 July 2017 at 1.5 m resolution downloaded from the DigitalGlobe website (https://www.digitalglobe.com/, last access: 14 July 2017).
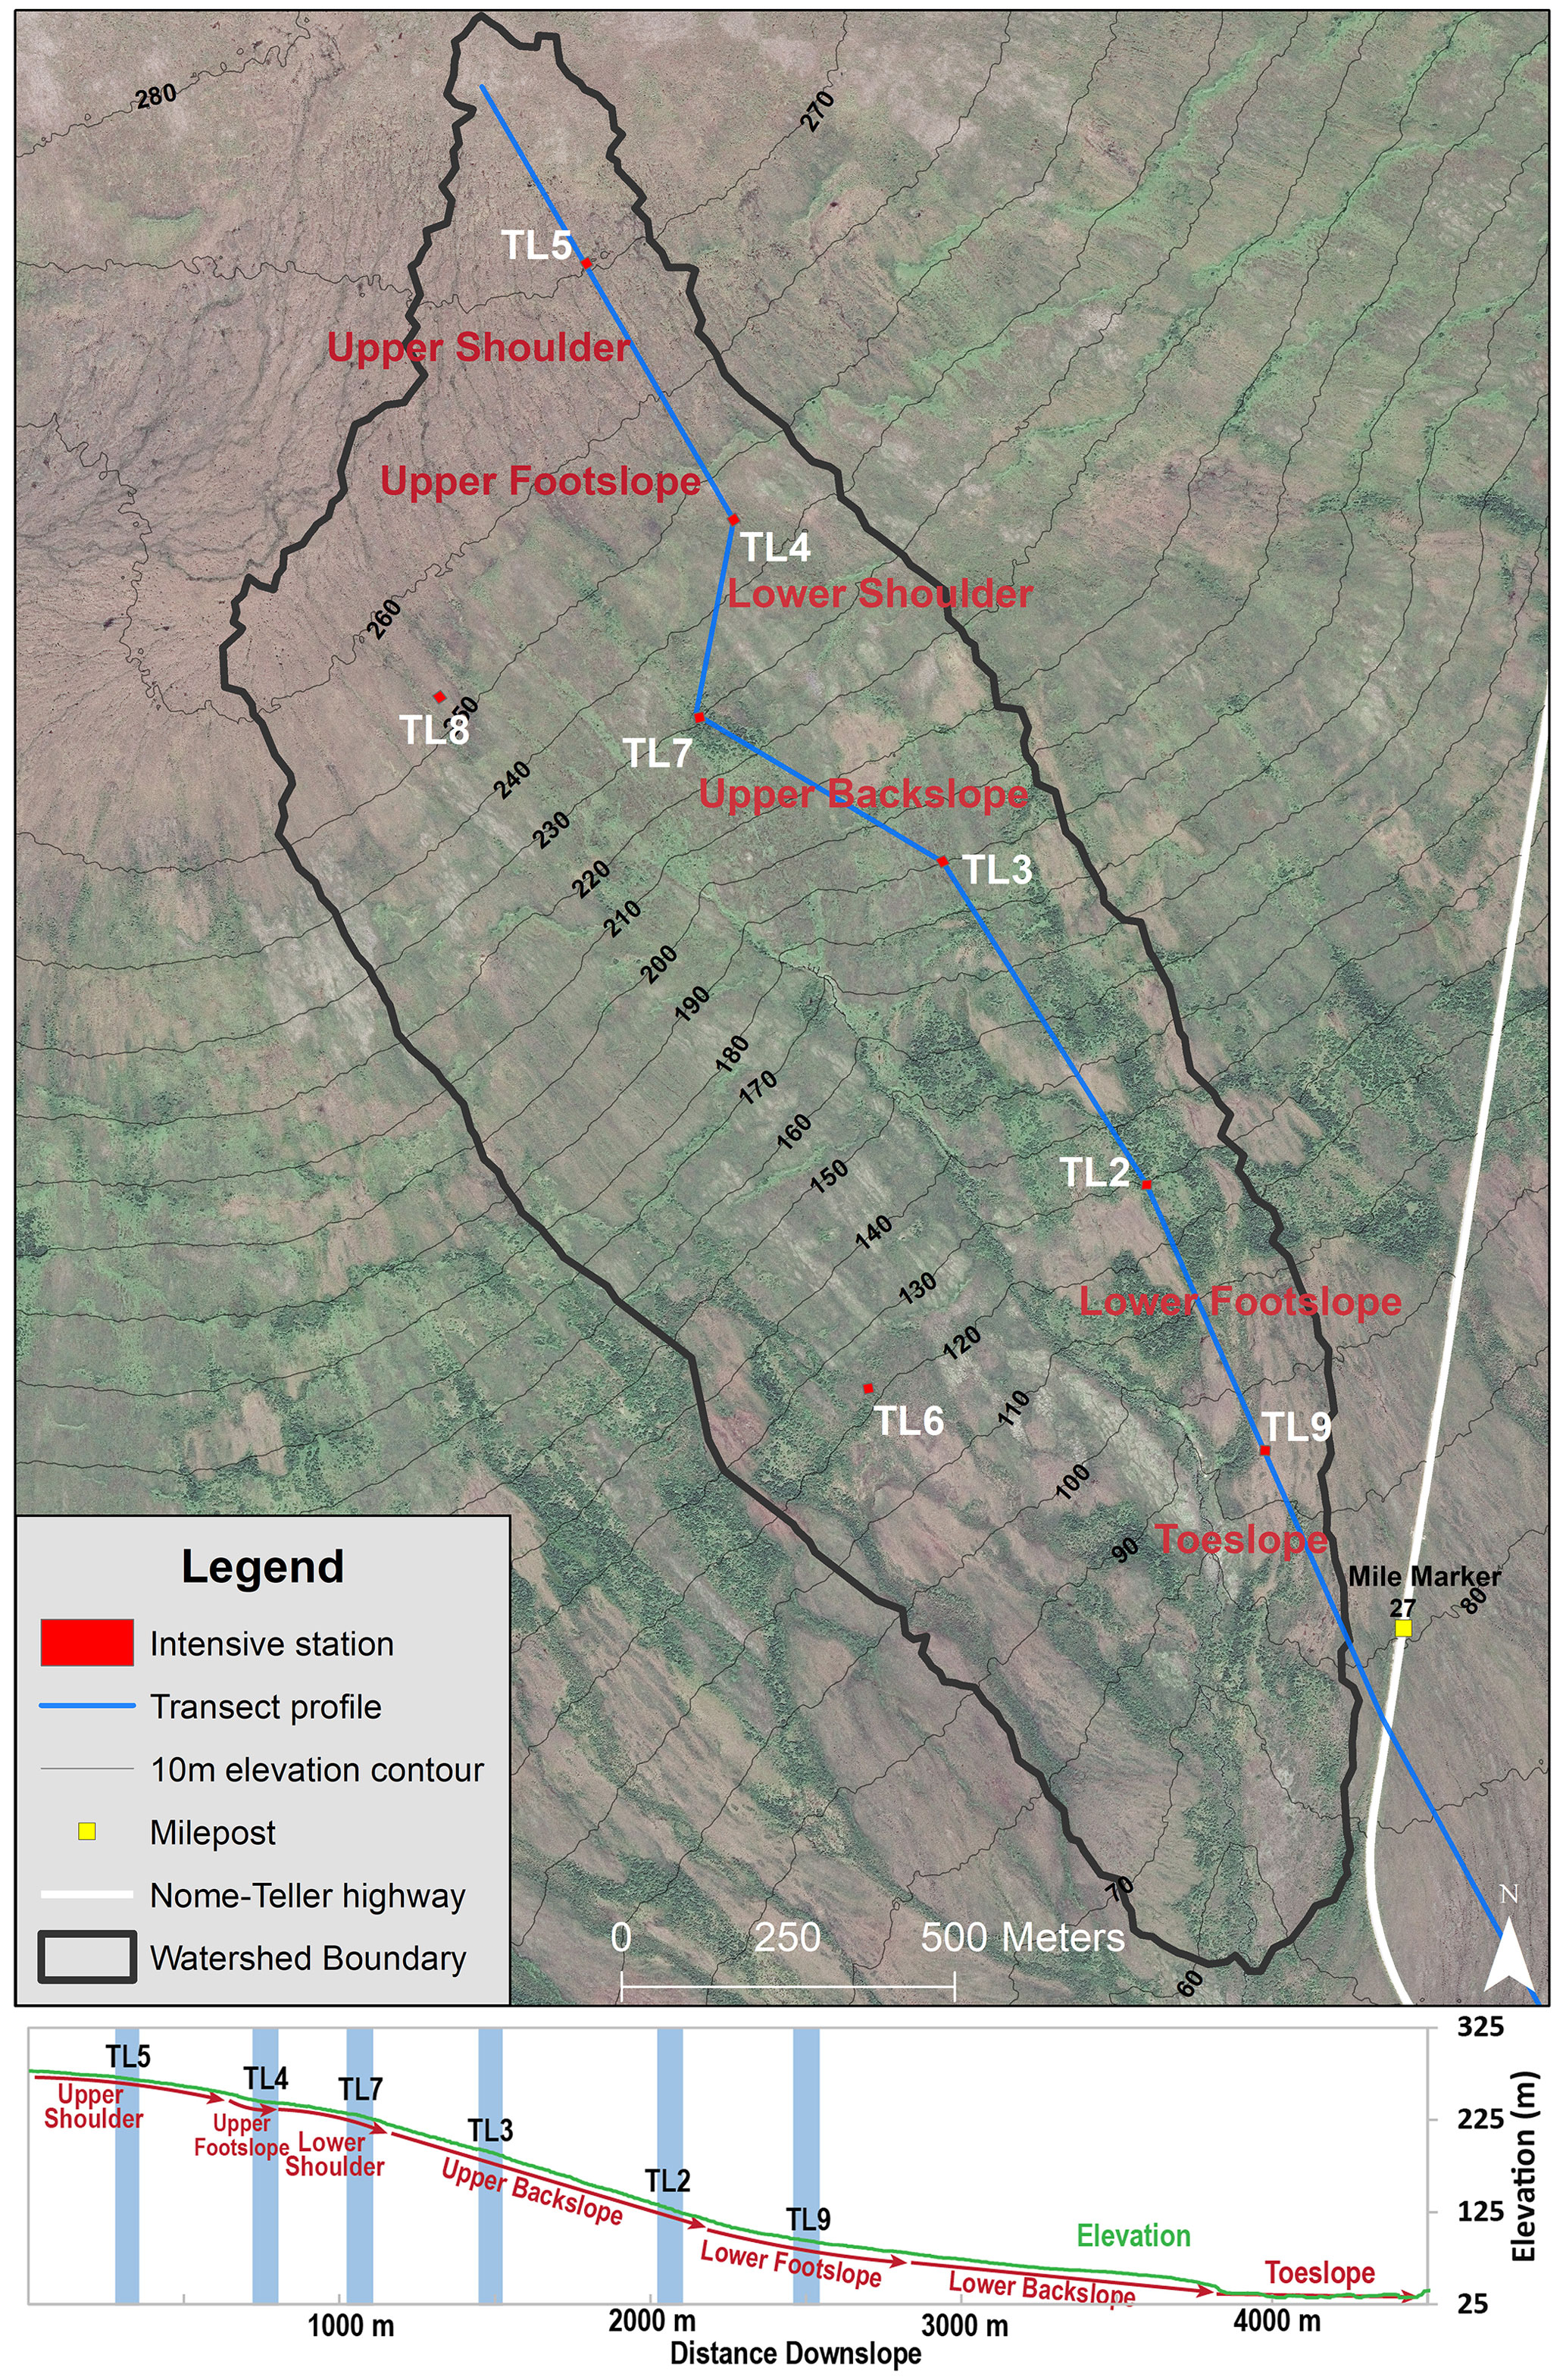
Figure 2Topographic map of Teller. Station areas are shown as red polygons and the topographic station transect is given as a solid blue line. The hillslope transect elevation profile is given below the map in green, with stations along the transect in blue and hillslope positions noted with red arrows and text. RGB composite imagery from the 8-band WorldView-2 imagery obtained on 27 July 2011 at 1.5 m resolution downloaded from the DigitalGlobe website (https://www.digitalglobe.com/, last access: 27 July 2011).
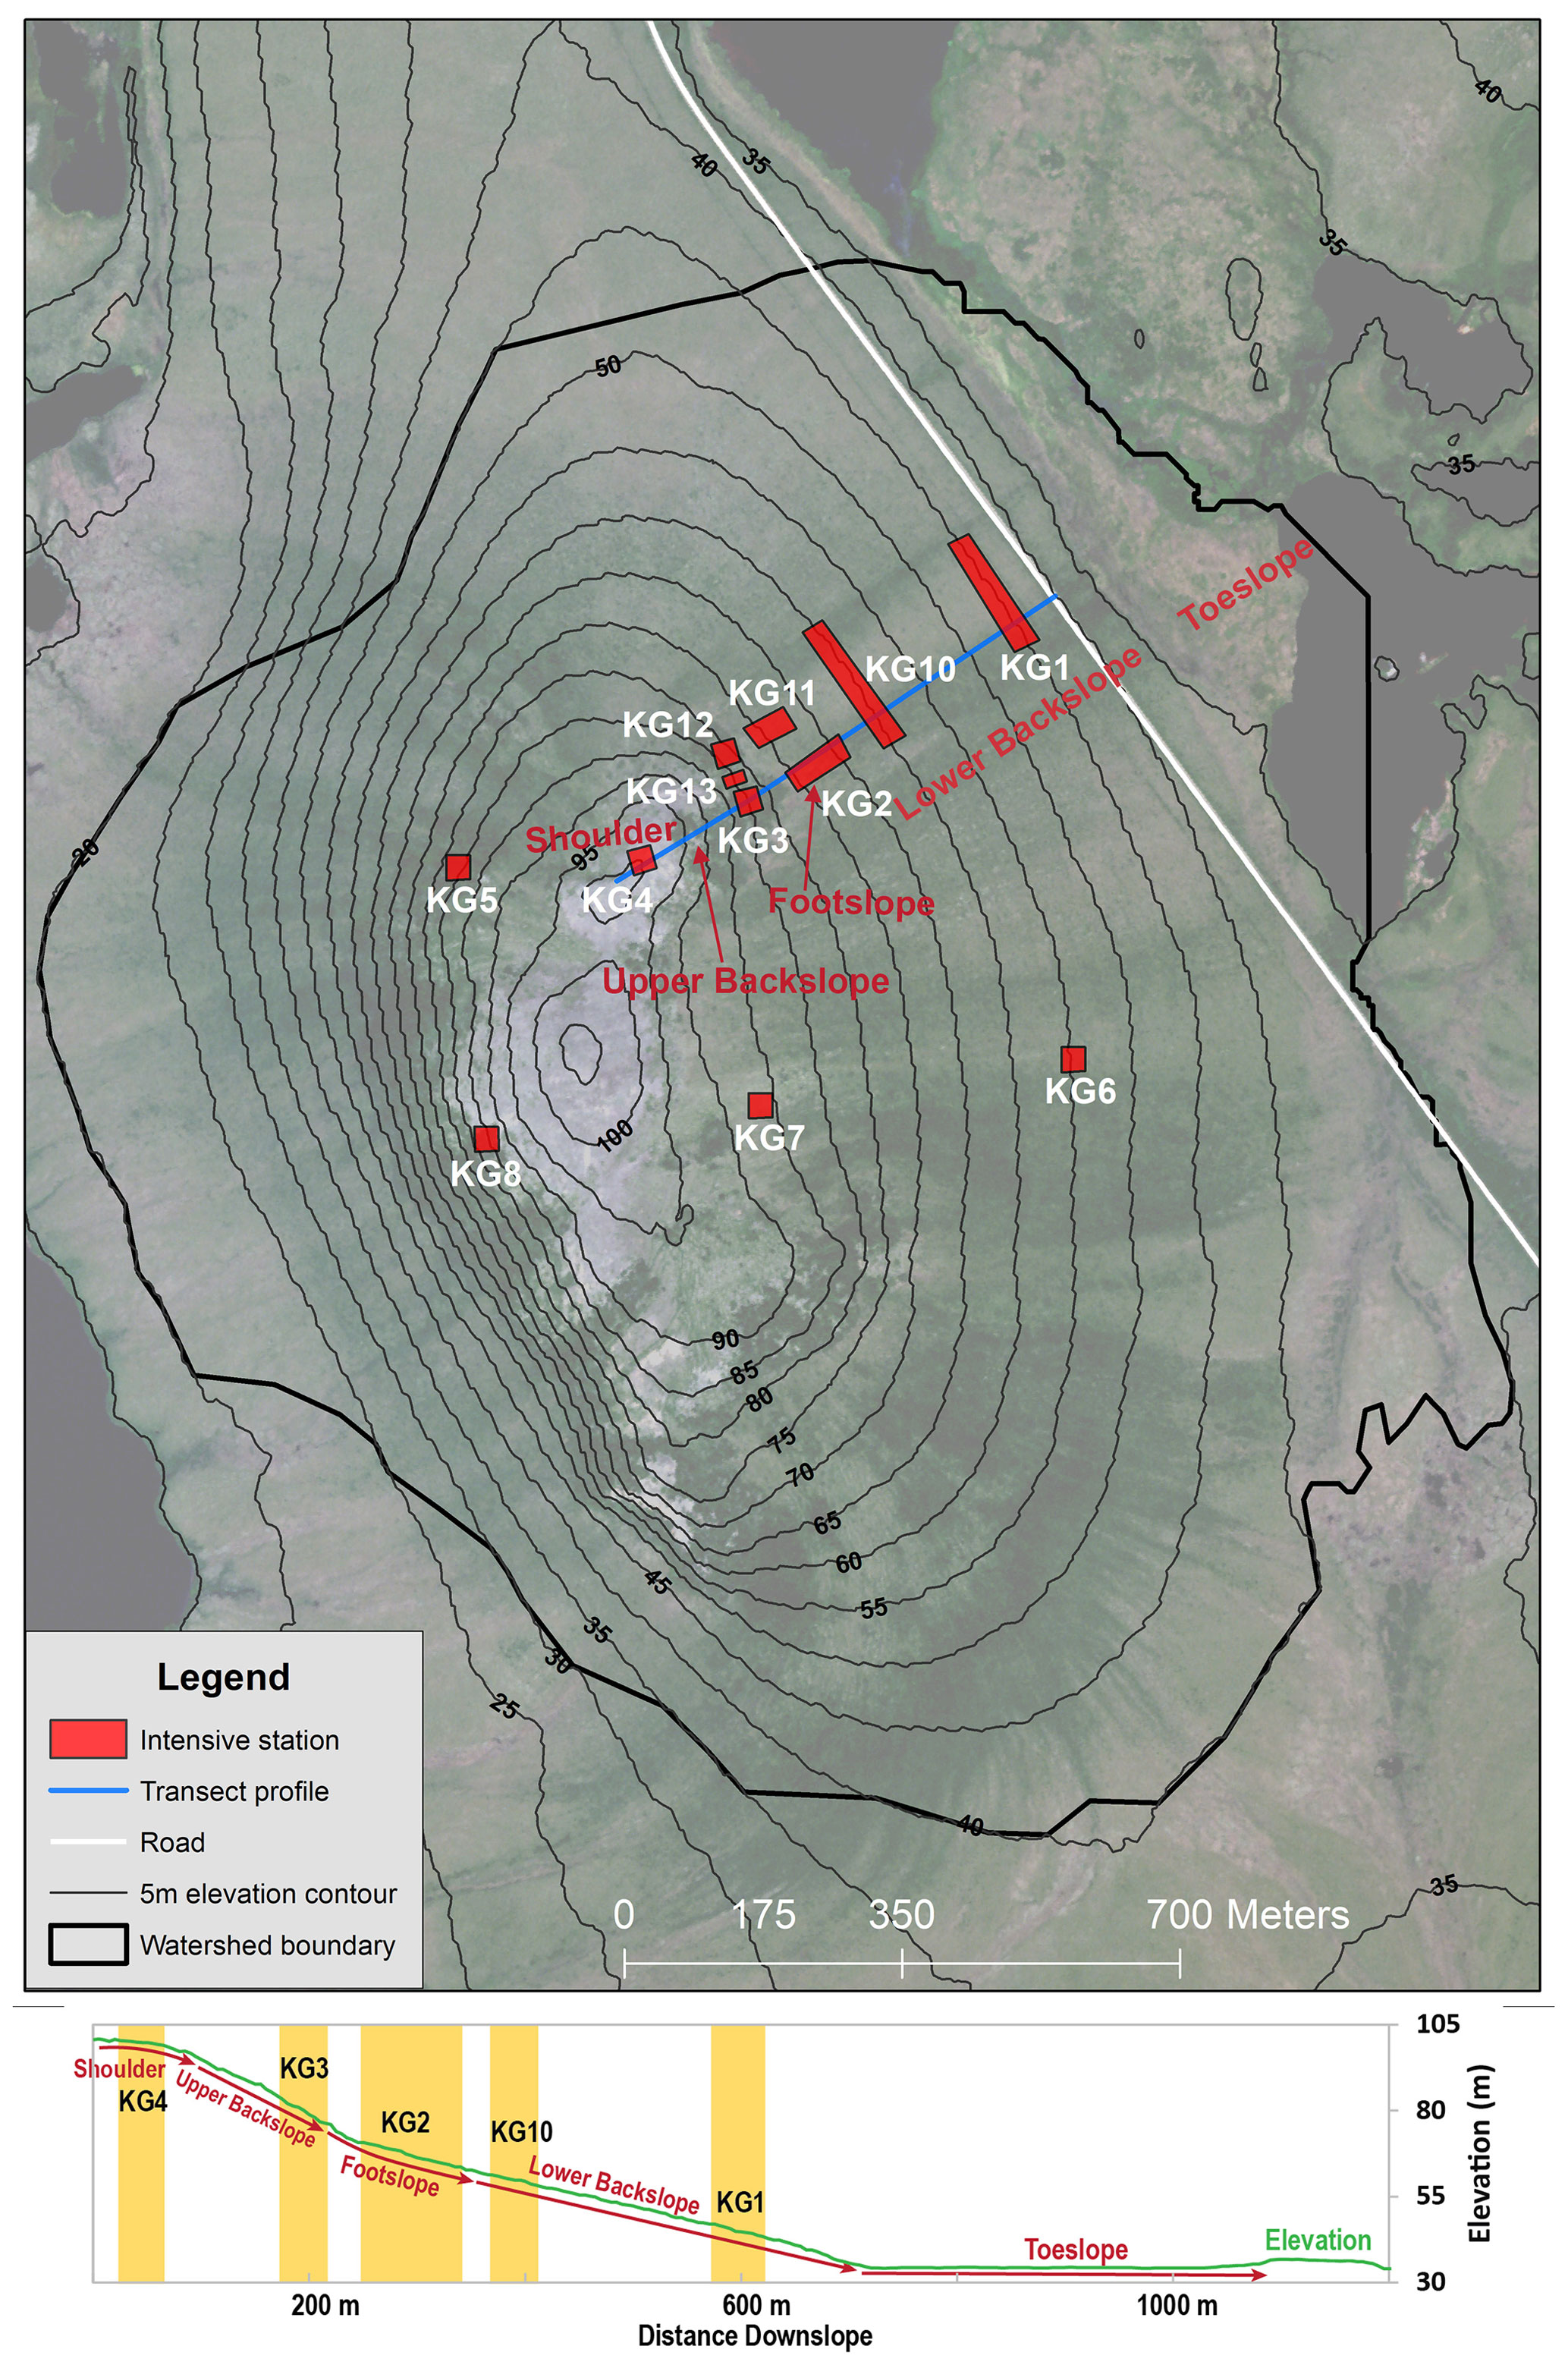
Figure 3Topographic map of Kougarok. Station areas are shown as red polygons and the station transect is given as a solid blue line. The transect elevation profile is given below the map in green, with stations along the transect in yellow and hillslope positions noted with red arrows and text. RGB composite imagery from the 8-band WorldView-2 imagery obtained on 14 July 2017 at 1.5 m resolution downloaded from the DigitalGlobe website (https://www.digitalglobe.com/, last access: 14 July 2017).
Teller is a discrete catchment with a well-defined central drainage, a vertical declivity of approximately 200 m, and a catchment area of approximately 2.25 km2. Temperature probes, soil pits, coring activities, and geophysical interpretations at Teller have confirmed the catchment is underlain with discontinuous permafrost (Léger et al., 2019). The upper shoulder of Teller (near station 5, Figs. 2 and 5) is underlain with near-surface permafrost and appears to be a degraded peat plateau. The resultant microtopography of the degraded peat and the shallow perching horizon caused by the permafrost creates a landscape of unsaturated peat mounds surrounded by ponds and saturated soils. Downslope of the peat plateau, the Teller hillslope has highly variable soil moisture and vegetation (Table 1). The microtopography within the lower footslope looks similar to the upper shoulder, but the peat appears more severely degraded and the cause of the perched water table is less clear. Léger et al. (2019) suggest the presence of permafrost at a depth of 1–2 m at Teller station 9 (Fig. 2), but the perching could also be caused by a layer of silt, at a depth of approximately 30 cm (Graham et al., 2018). The full extent of permafrost and silt in this region of the catchment remains unknown, but the thaw depth in July 2018 was greater than 1 m and maintained a perched water table (Philben et al., 2020), suggesting perching could be the result of silt rather than permafrost. Vegetation type, moisture content, permafrost extent, and hillslope position for all Teller stations are summarized in Table 1.
Kougarok differs in many ways from Teller, although both have characteristics that are typical of hillslopes on the Seward Peninsula. Kougarok is a convex hillslope, with a vertical declivity of approximately 70 m. The study area at Kougarok is approximately 2.0 km2. Soil temperature measurements at Kougarok suggest that the vast majority of the site is underlain by shallow continuous permafrost (Romanovsky et al., 2021a); Kougarok station 5 is an exception, where the permafrost is deeper (Romanovsky et al., 2021a). The upper shoulder of Kougarok is a well-drained rocky outcrop composed of metagranitic rock Hopkins and Karlstrom, 1955; Till et al., 2011). Saturated soils are not prevalent until the footslope and the lower backslope, where Kougarok stations 2, 11, 10, 1, and 6 are situated (Fig. 3). The lower backslope is characterized by persistent saturation between ubiquitous tussocks, formed by the tussock cotton grass Eriophorum vaginatum. The tussock–lichen tundra at Kougarok introduces microtopography and spatially variable saturation; in this sense, the Kougarok tussocks are analogous to the peat mounds and hummocks at Teller but on different spatial scales and formed by different processes. Kougarok has numerous patches of alder shrubland in an altitudinal band within the upper backslope; it should be emphasized that Teller lacks tussock–lichen tundra and alder (Alnus viridis ssp. fruticosa) shrubs that are a feature of Kougarok. While continuous permafrost largely remains, the Kougarok site appears to be undergoing environmental changes as evidenced by an increase in alder coverage over the past decades (Salmon et al., 2019). Soil profiles underneath the alder patches are rocky with shallow bedrock and warmer permafrost (Table 2). Shrub tundra (alder savanna in tussock tundra and willow–birch tundra) dominates the lower backslope, where the annual active layer thickness is typically less than 100 cm. Vegetation type, moisture content, permafrost extent, and hillslope position at all Kougarok stations are summarized in Table 2.
2.2 Sampling and analytical approach
SPWs were sampled using two complementary techniques. Fiberglass wicks (Frisbee et al., 2010) were deployed in the upper 30 cm of soils at stations where shallow soils were unsaturated. These wicks were left in place from year to year and only replaced if damage was observed or suspected. The sample reservoirs from the wicks were collected whenever possible, usually a few times each summer. MacroRhizons (Rhizosphere Research Products; Netherlands) were used at stations that were more saturated, also targeting the upper 30 cm of soils. Both techniques were used at stations of intermediate saturation, where both could be deployed effectively. MacroRhizons represent a relatively discrete temporal sampling event (minutes to hours), whereas wicks represent cumulative water collected over longer periods (weeks to months). It is in this sense that the two techniques are complementary. Unfortunately, due to saturation variability both techniques could not be used at all stations and conditions at some Kougarok stations were sometimes too dry to collect meaningful volumes of SPW using either method. Additional SPW data from Kougarok were supplemented from a separate study focused on alder-related nutrient dynamics (McCaully et al., 2022). These data were collected by MacroRhizons and are captured as Kougarok stations 10–13, which were not among the original stations established by the NGEE Arctic program. A total of 309 SPW samples from Kougarok were collected and analyzed, whereas a total of 89 SPW samples from Teller were collected and analyzed.
After collection, SPW cation concentrations were measured in triplicate by inductively coupled plasma optical emission spectroscopy (Optima 2100 DV; PerkinElmer, USA) following US EPA Method 200.7. Inorganic anion concentrations were measured by ion chromatography (DX-600; Dionex, USA) following US EPA Method 300.0. B, F, K, Na, and Si concentrations collected by wicks were excluded from the dataset due to known issues with these ions leeching from fiberglass wick samplers (Perdrial et al., 2014; Wallenberger and Bingham, 2010). This effect is illustrated in Supplement Fig. S1, and the lack of such an effect for divalent cations is shown in Supplement Fig. S2. Comparison of data from wicks and MacroRhizons, along with the observations from Perdrial et al. (2014), demonstrates that remaining constituents discussed herein were not affected by collection with fiberglass wicks. Alkalinity, pH, and EH are all critical geochemical parameters that are susceptible to change during storage (Petrone et al., 2007); because of the large amount of data from wicks these parameters were not considered further, except in the context of thermodynamic modeling.
Observations related to vegetation, soil moisture, and permafrost extend were compiled from datasets made available by the NGEE Arctic project and are given for Teller in Table 1 and for Kougarok in Table 2. The reported soil moisture contents were derived from an average of gravimetric measurements (2017 and 2018) and time domain reflectometry measurements (2017 and 2019) and from remotely sensed P-band synthetic aperture radar (2017). End-of-winter snow depths were measured in March and April of 2016, 2017, and 2018. The annual average ground temperature was measured using in situ temperature sensors (HOBO U30 DataLogger) at a depth of 1.5 m below the ground surface (Romanovsky et al., 2021a, b), and the active layer thicknesses were determined by a frost probe in September 2019 at the end of the growing season. Vegetation data were collected at the peak of the growing season in mid to late July 2016 and 2017 at the NGEE Arctic Kougarok and Teller field sites, respectively. The distribution of plant communities in the Arctic is primarily controlled by landscape, topography, soil chemistry, soil moisture, and the plants that historically colonized an area (Raynolds, 2019). Soil-available rooting depth, which can be limited by shallow depths to bedrock, permafrost, or the water table, can also restrict plant growth and survival of certain species by reducing access to water and nutrients. We surveyed the dominant plant communities along each hillslope, which varied in their shrub abundance, canopy height, and structure, to characterize the vegetation composition at the sites following the recommended protocol of Walker et al. (2016). Extensive field site details and vegetation sampling methods are more thoroughly described in previous studies (Salmon et al., 2019; Langford et al., 2019; Yang et al., 2020; Sulman et al., 2021; Yang et al., 2021).
For this study, we provide summary statistics for vegetation plots associated with intensive stations. Vegetation composition plots within each intensive station were chosen subjectively in areas of homogeneous and representative vegetation varying in size from 1 to 25 m2 depending on canopy structure and height. The surveyed plot area was 1 × 1 m for all plant communities except for the taller-stature willow–birch tundra, mesic willow shrubland (2.5 × 2.5 m), and alder shrubland (5 × 5 m). For each plot, all plant species (vascular plants, lichens, and bryophytes) were recorded along with visual estimates of their percent cover. For plots with multiple canopies, field cover estimates were recorded as absolute cover, meaning that the total cover per plot can be >100 %. We calculated relative cover values (adding to 100 %) from the field data and use these for all subsequent analyses.
Plant species were further aggregated into nine plant functional types (PFTs), groupings of plant species that share similar growth forms and roles in ecosystem function (Wullschleger et al., 2014), based on growth patterns and plant traits. PFTs in this study include (1) nonvascular mosses and lichens; (2) deciduous and evergreen shrubs of various height classes, including an alder PFT; (3) graminoids; and (4) forbs. Photos of representative PFTs from both sites are given in Supplement Figs. S9–S17. Canopy height was estimated within each plot for each PFT as the average of four measurements, including a maximum canopy height. Active layer depth was measured at the end of the growing season for all plots in September 2018 using a frost probe. A temperature probe was used to determine if the resistive layer was permafrost (≤0 ∘C) or rock (>2 ∘C). Thaw depth is an average of four measurements from the vegetation plot corners.
2.3 Statistical analysis
Principal component analysis (PCA) and the Mann–Whitney U test (MWUT) were both used to investigate dominant environmental controls on solute concentrations in SPWs at Teller and Kougarok. PCA is an exploratory data analysis tool that reduces the dimensionality of large complex datasets and considers how components (i.e., solute concentrations) vary together. Because PCA was predominately used as a screening tool to reveal geochemical correlations that may not have been evident by traditional geochemical causations or inference, a detailed discussion of the PCA results is reserved for the Supplement. The MWUT was used to test for significant differences in solute concentrations between Teller and Kougarok (inter-site variability) and between stations at each site (intra-site variability). The MWUT is a nonparametric method of challenging a null hypothesis, which in this case is the assumption that the concentrations of a given solute are not systematically greater at either site or at any particular station. Water chemistry data are typically not normally distributed, and thus nonparametric difference tests such as the MWUT are preferred. The MWUT challenges the distribution of values, not the means. In this work, the level of significance associated with the null hypothesis was operationally defined as 0.05, which equates to a 95 % chance that an observed statistical difference is real and not coincidental. This error rate is operationally defined per contrast (i.e., a 95 % chance that the observed statistical difference in nitrate concentrations between Teller station 9 and Teller station 7 is real or that the observed statistical difference in sulfate concentrations between Teller and Kougarok is real) as opposed to family-wise (i.e., a 95 % chance that all of the observed and reported statistical differences are real and not coincidental). MWUTs were completed using the methods described in Corder and Foreman (2009), and PCA was completed using packages available in R statistical software version 3.3.6 (Corder and Foreman, 2009; R Core Team, 2020). For all analyses, concentrations below the method detection limit were operationally defined as half the detection limit, in agreement with Helsel (2005, p. 43). While the emphasis of this study was on site and station (i.e., spatial) variability, it should be recognized that seasonal and interannual variability could also be significant. To minimize seasonal forcing on the variability observed, all SPW geochemical data presented were collected during the thaw season between June and September.
2.4 Thermodynamic modeling
To investigate thermodynamic controls on solute behavior, particularly solubility limitations, thermodynamic modeling exercises were undertaken using PHREEQC, a thermodynamic geochemical modeling code, and PhreePlot, which facilitates repetitive PHREEQC calculations through looping (Kinniburgh and Cooper, 2011; Parkhurst and Appelo, 2013). Because this study was focused on elucidating the primary geochemical controls on solute concentrations in SPWs and not on developing a rigorous transport model, representative concentrations were used instead of station-specific concentrations. Representative “low”, “median”, and “high” concentration conditions were proxied from the 25th, 50th, and 100th concentration percentiles, respectively, taken from both Teller and Kougarok (Supplement Table S4). Meanwhile, representative pH and EH ranges were determined either through direct measurement (pH) or indirectly by correlating dissolved Fe2+ concentrations and pH with a redox condition through geochemical models and the Nernst equation. Modeling exercises were performed utilizing the phreeqc.dat database, with the only modification being the suppression of methane production by inorganic carbonate reduction. Modeling exercises were performed at the default PHREEQC modeling temperature (25 ∘C), as the selection of an alternative defensible temperature was nontrivial; temperatures on the Seward Peninsula span a very wide range and it is unclear what temperature would be most suitable for mineral solubility limitation modeling. Ultimately, because the thermodynamic models were used as a tool to understand what could be controlling soil pore water solute concentrations and were not intended to model the system or to predict future concentrations, the default temperature was decided to be the most suitable. While there is some temperature dependence of mineral solubility, the differences in predicted solubility between 4 and 25 ∘C did not impact the interpretation of our results (Supplement Fig. S8). Methane production was “turned off” to maintain carbonate availability under reducing conditions to help identify any possible carbonate minerals that could be precipitating. Because alkalinity was only measured in a small number of samples, carbonate concentration percentiles were estimated from charge imbalances. Alkalinity and charge imbalance were very well correlated in samples where alkalinity was measured (Supplement Fig. S3). Although not a particularly rigorous modeling exercise, this approach was sufficient to identify mineral phases that could be controlling solute generation processes through solubility limitations.
3.1 Physical characteristics of stations (co-located studies)
Controls on the observed spatial variability of SWP solute concentrations at Teller and Kougarok stations were deduced, in part, from differences in physical features and conditions of each station. Quantitative measures of many of these physical characteristics were available from the interdisciplinary studies co-located at the Teller and Kougarok stations. The extent of permafrost, ground temperature, active layer depth, soil moisture content, snow depth, vegetation type, vegetation canopy height, dominant plant functional type, and hillslope position were all complied from these co-located studies. Using these measures, the physical characteristics of each station are summarized in Tables 1 and 2, grouped by vegetation type.
3.2 Inter-site variability: Teller versus Kougarok
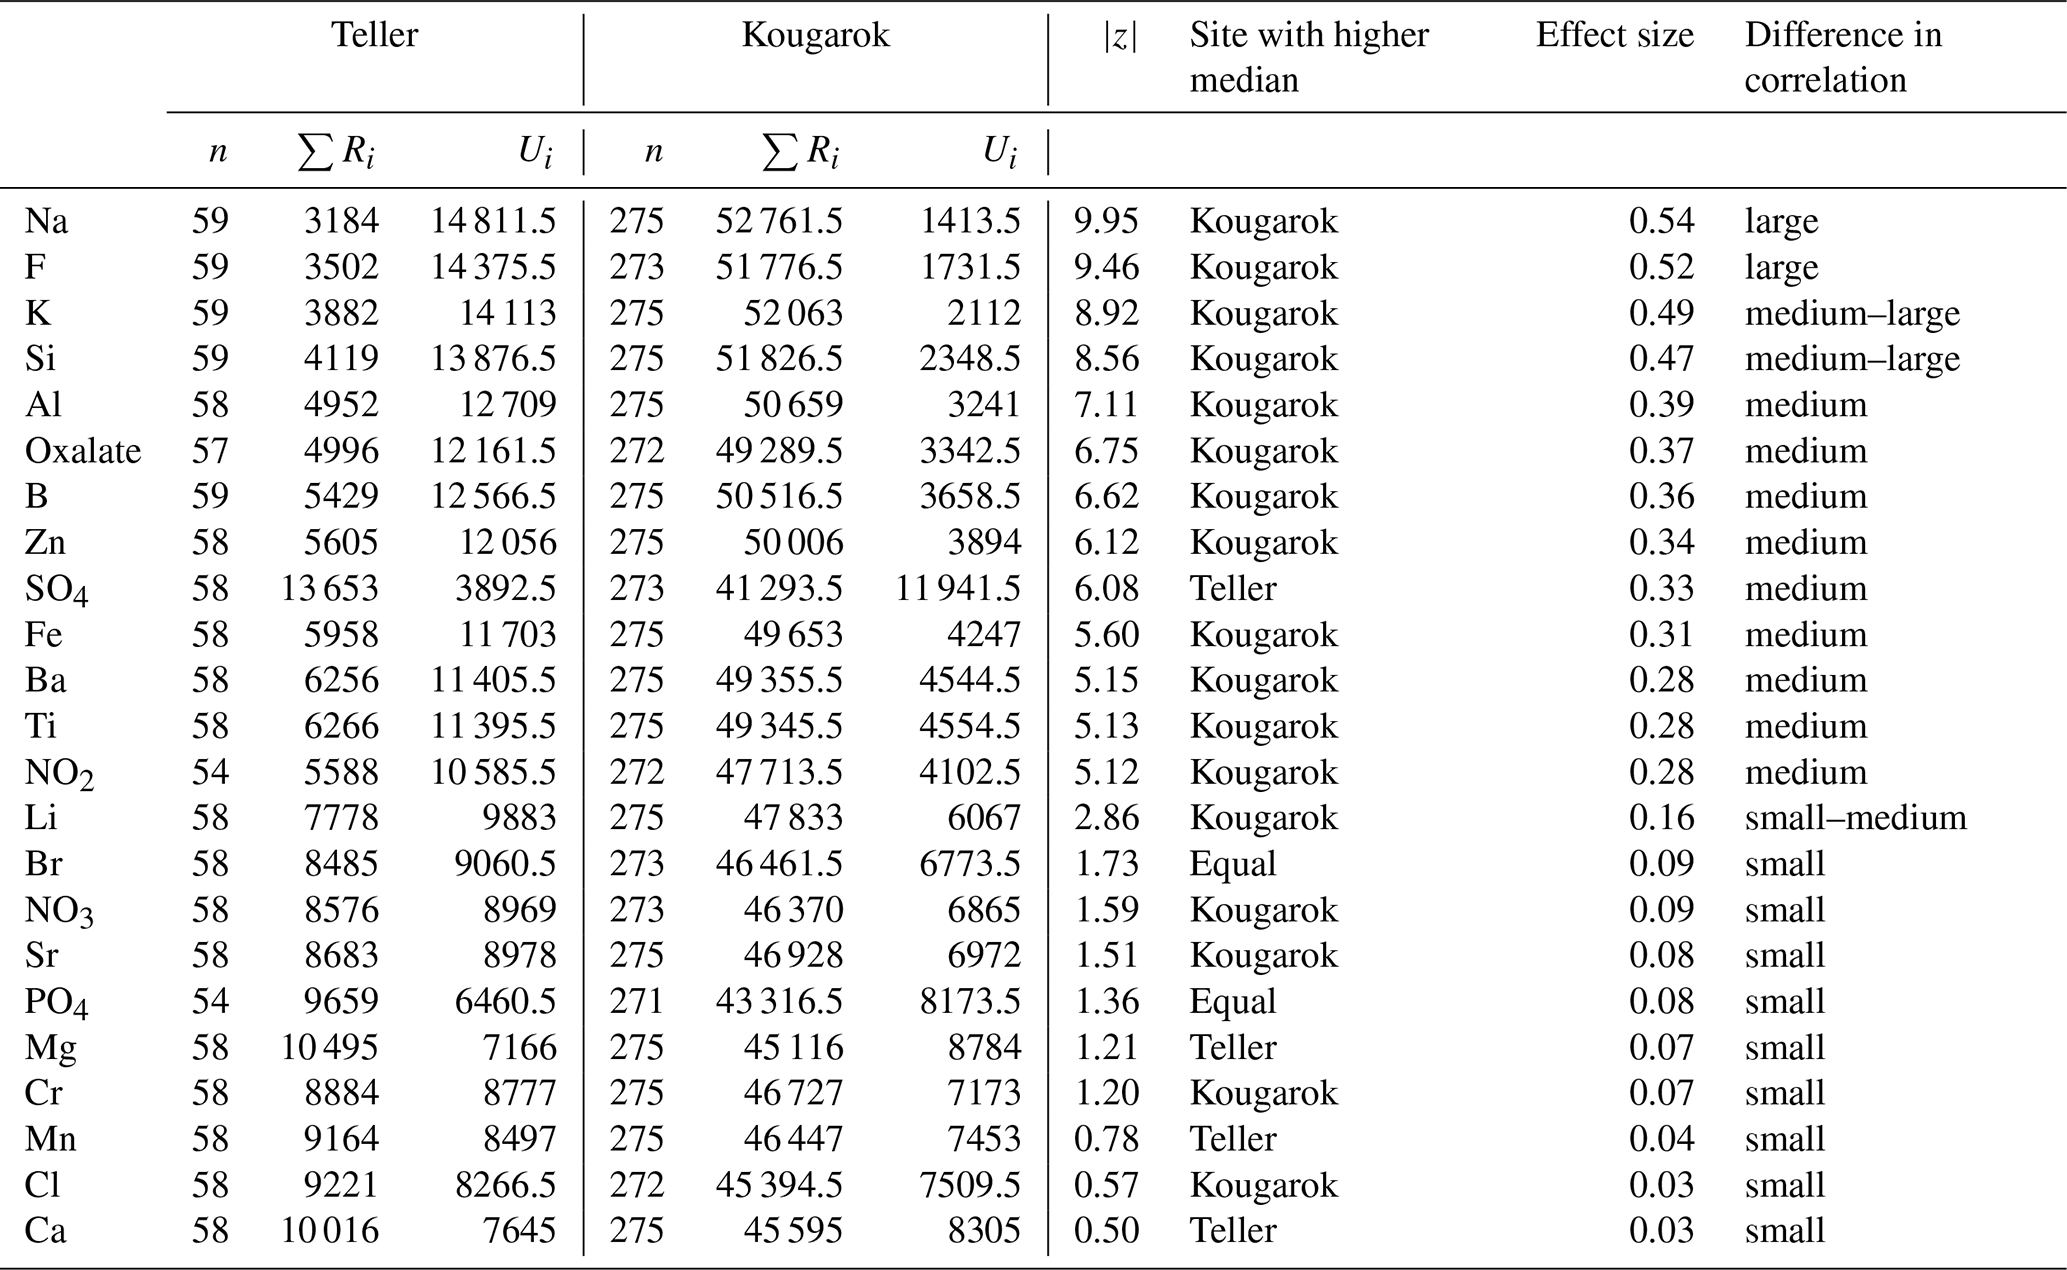
Mann–Whitney U testing revealed that the concentrations of 14 of the 23 constituents analyzed were significantly different () between Teller and Kougarok (Table 3). The effect size, a measure of how significantly different the concentrations were, were large for Na and F; medium–large for K and Si; medium for Al, oxalate, B, Zn, SO, Fe, Ba, Ti, and NO; and small—medium for Li. The terminology and thresholds for these semi-quantitative differences in correlation were taken from Corder and Foreman (2009). Mann–Whitney U testing revealed that SPW concentrations of many constituents were significantly different between Teller and Kougarok (Table 3). When concentrations were significantly different between the sites, Kougarok generally exhibited the higher concentrations of the two. SPW concentrations of Na, F, K, Si, Al, oxalate, B, Zn, Fe, Ba, Ti, NO2, and Li were all significantly greater at Kougarok than Teller, while only SO concentrations were significantly greater at Teller. Meanwhile, the concentrations of Br, NO, Sr, PO4, Mg, Cr, Mn, Cl, and Ca were not significantly different between Teller and Kougarok. A summary of the inter-site MWUT results are given in Table 3.
3.3 Intra-site variability: Teller and Kougarok stations
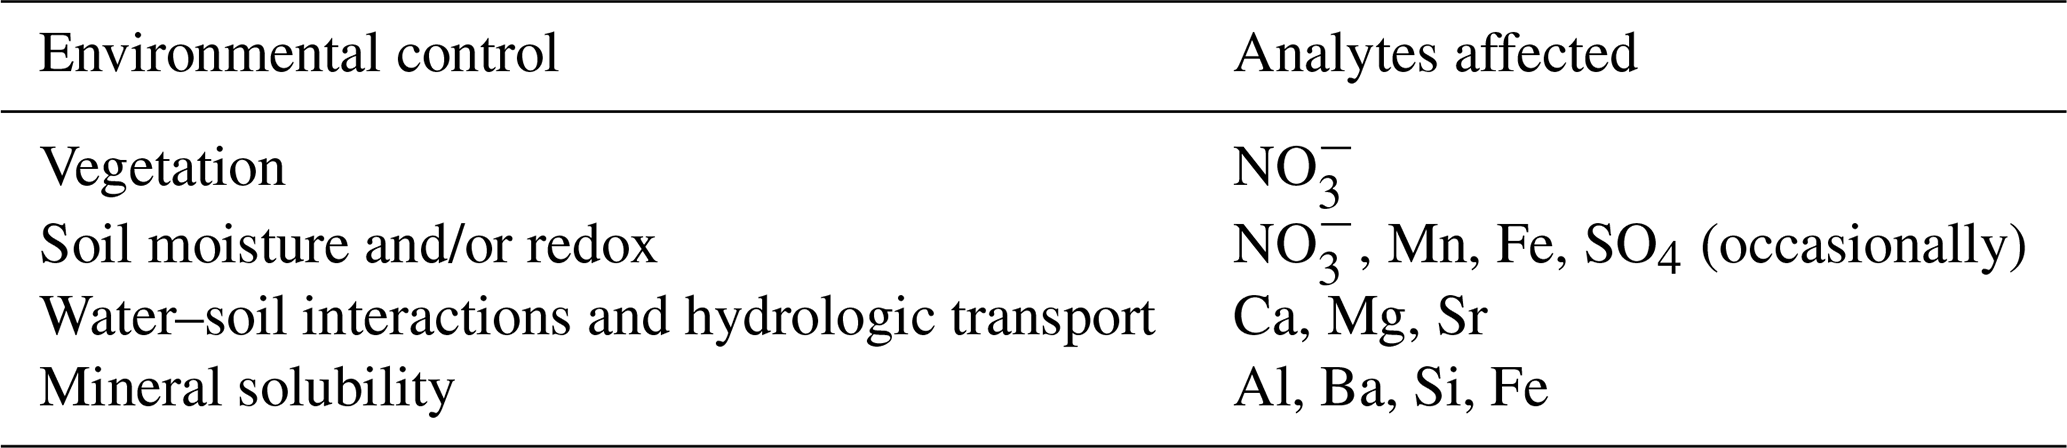
Mann–Whitney U testing was also used to test for intra-site differences between stations at both Teller and Kougarok. Boxplots and compact letter displays are used to visualize the within-site variability of a select group of constituents of interest (COIs), which are given in Fig. 4. Tables of the results of the intra-site MWUTs for all constituents that were monitored, including those that did not demonstrate some systematic inter-station variability or were not otherwise of interest, are given in the Supplement. Our interpretation of the major environmental controls on the observed spatial variability of SPW solute concentrations between stations are shown in Table 4. Each of these controls, including vegetation effects, soil moisture and redox effects, weathering, water–soil interactions and hydrological transport effects, and mineral solubility effects, is considered in detail in the following sections.
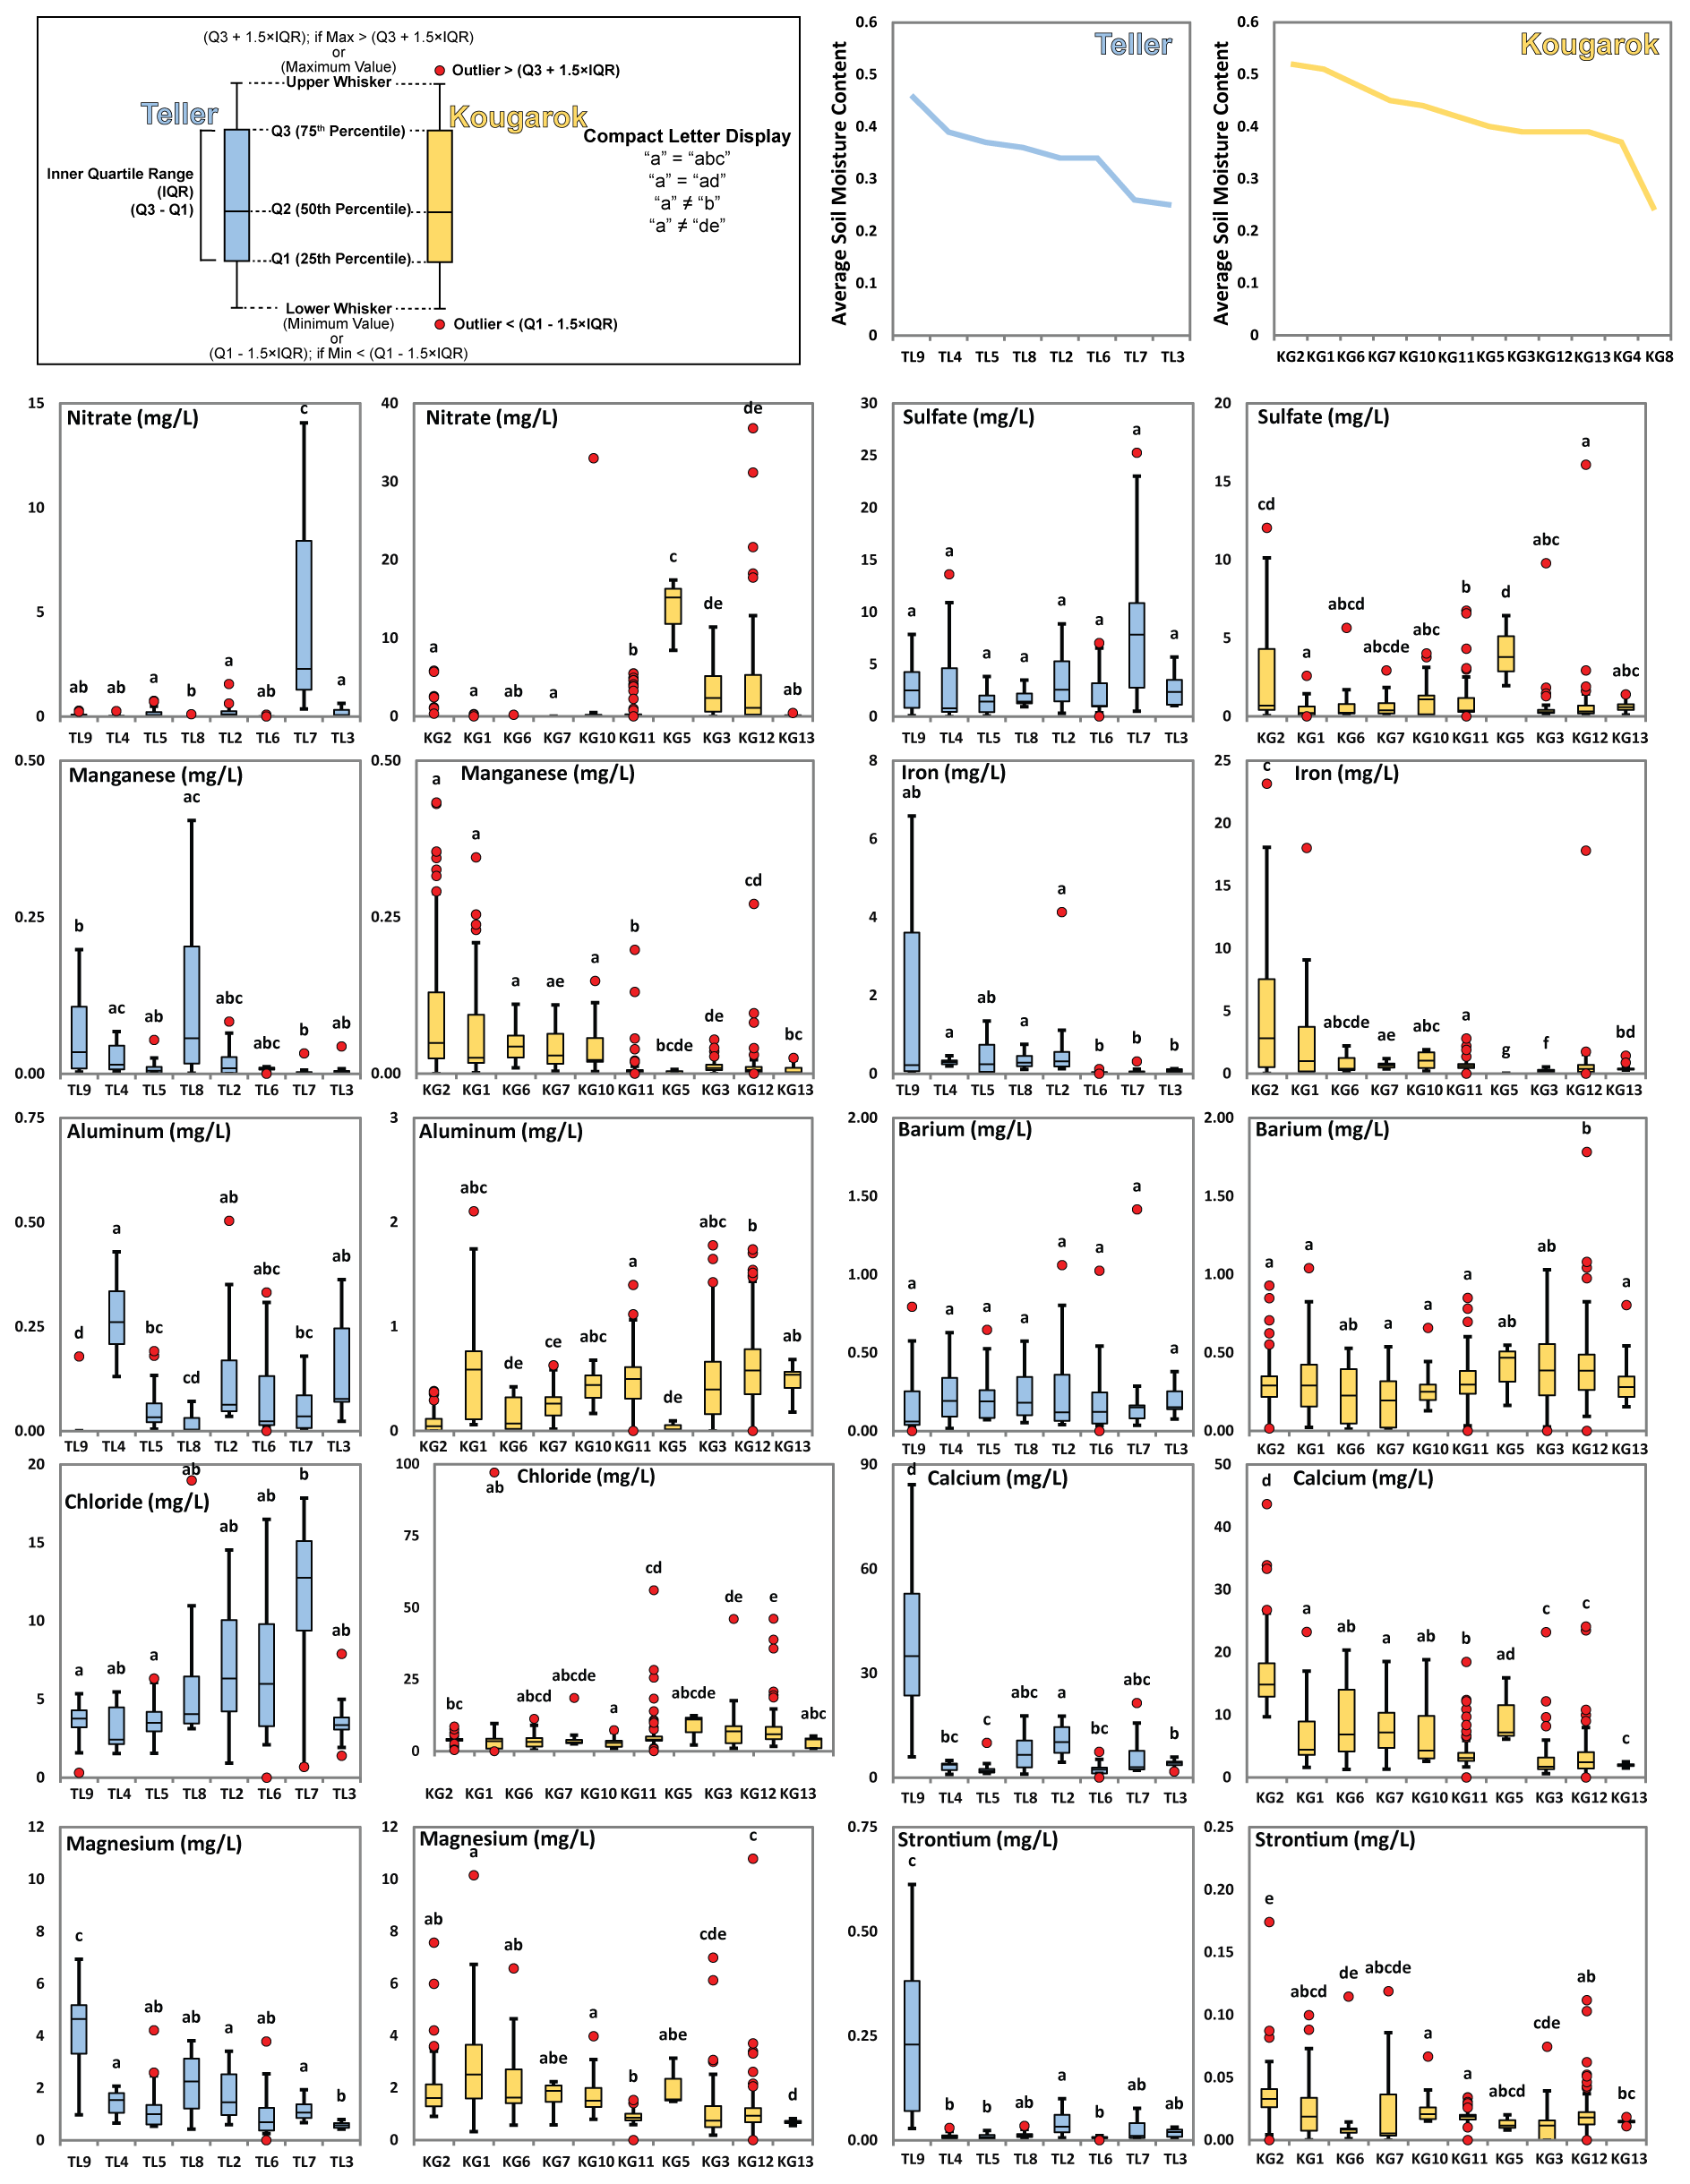
Figure 4Mean COI concentrations at Teller (blue) and Kougarok (yellow) stations. Stations are arranged (left to right) by soil moisture content determined by P-band SAR (top right). Boxplots show the first, second, and third data quartiles, with box whiskers representing either 150 % of the interquartile range (IQR), or the maximum or minimum value, when that value was less than 1.5 × IQR. Red circles represent data points outside of the 1.5 × IQR whiskers (i.e., outliers). Note that the concentration scales on the Teller and Kougarok plots often differ.
Table 4Dominant environmental controls on SPW geochemistry at Teller and Kougarok.
3.3.1 Vegetation effects
Vegetation can influence hydrogeochemical variability directly via vegetation-induced changes to elemental cycling and soil moisture contents or indirectly via the secondary impacts changes in soil moisture can have on mineral solubility or on the soil redox condition. The geochemical consequences of solubility and redox conditions are the focus of sections to follow; thus, this section will focus on direct vegetation effects via influences on elemental cycling and soil moisture via evapotranspiration and preferential trapping of snow.
NO was the only COI that showed a distinct effect from vegetation via elemental cycling. Elevated NO concentrations were associated with the presence of alder shrubs and, in some cases, willow shrubs. NO concentrations at both sites were generally low, with the exception of Kougarok stations 3, 5, and 12, and Teller station 7 (Fig. 4). Low to tall alder shrubs are the dominant vegetation type at Kougarok stations 3 and 12 (Table 2). Meanwhile, alders are present at Kougarok station 5 despite the dominant vegetation type being low willow and birch shrubs. Alders increase soil nitrogen through a symbiotic relationship with nitrogen-fixing bacteria that reside in their root nodules, thus, an association between NO concentrations and alder vegetation is expected (Salmon et al., 2019).
Perhaps more noteworthy was the lack of elevated NO concentrations at Kougarok stations 1, 2, 6, 10, and 11. The vegetation type at Kougarok stations 1, 2, 6, 10, and 11 is alder savanna in tussock tundra, which is a mixed graminoid–shrub tundra with shorter stature and lower density of alder shrubs, yet nonetheless nitrogen input via alder-derived nitrogen fixation is anticipated to occur. The lack of elevated NO suggests (1) that nitrogen fixation in alder savanna in tussock tundra is insufficient to result in an increase in NO concentrations, (2) that the Kougarok footslope and lower backslope are very nitrogen-limited and thus that NO is largely consumed by vegetation as it is fixed, or (3) that microbes in the Kougarok footslope and lower backslope rapidly denitrify the available NO as a substitute for oxygen in their metabolisms. The smaller shrub size and density in the alder savanna in tussock tundra certainly result in less accumulated leaf litter relative to the denser and larger alder shrubland intensive stations; as such, it seems reasonable that less nitrogen would be available at stations in alder savanna in tussock tundra. Meanwhile, isotopic measurements of nitrogen downslope of alder patches at Kougarok stations 12 and 3 also support the occurrence of denitrification (McCaully et al., 2022). Therefore, we believe the lack of elevated NO concentrations at Kougarok stations 1, 2, 6, 10, and 11 is a combination of less alder leaf litter and greater denitrification than at Kougarok stations 3, 5, or 12.
At Teller, only station 7 exhibited elevated NO concentrations relative to the rest of the catchment (Fig. 4). Teller station 7 is dominated by tall willow shrubs and is relatively dry. Mineralization and nitrification of willow leaf litter coupled with limited microbial denitrification are the presumed causes of elevated NO concentrations at Teller station 7. Teller station 2 also has tall willow shrubs but did not exhibit elevated NO concentrations. From the limited scope of this study, it is unclear why Teller station 2 did not exhibit elevated NO while station 7 did, but we suspect that higher seasonal moisture content and greater microbial denitrification at Teller station 2 likely played a role. Also of note was that despite significant intra-site NO concentration differences, inter-site differences were not significant () and that relatively few Kougarok stations showed elevated NO concentrations, despite a widespread alder presence. Increased microbial denitrification is suspected to balance increased nitrogen-fixation at these stations. This is consistent with previous studies that have noted higher nitrogen mineralization rates in acidic tundra than non-acidic tundra (Weiss et al., 2005); Kougarok is predominantly acidic tundra and Teller is non-acidic tundra.
The effect of vegetation on spatial variability of soil moisture was not readily observed in the volumetric moisture content of soil (Tables 1 and 2) but was somewhat apparent in the spatial variability of moisture-sensitive constituents, such as Cl (Fig. 4). The lack of a clear correlation between vegetation and soil moisture by TDR or P-band SAR observations is perhaps do to the coarseness of the P-band SAR observations and the strong seasonality associated with both methods. Moisture-sensitive constituents, such as Cl, may provide a more seasonally averaged tracer of soil moisture content at the stations. An increase in Cl concentrations with vegetation canopy height was apparent at Teller stations, suggesting an evapotranspiration effect. This trend was also apparent at Kougarok, but the differences were rarely significant. Overall, the spatial variability of soil-moisture-sensitive constituents, like Cl, was far less correlated with vegetation type than expected, perhaps due to preferential trapping of snow, which may offset the increased evapotranspiration of tall shrubs more than previously realized. Overall, Cl concentrations at Kougarok appeared to be more correlated with hillslope position than with vegetation canopy height (Fig. 4).
3.3.2 Soil moisture and redox effects
Soil moisture content can have a profound effect on redox-sensitive elements. Saturation limits oxygen diffusion into soil and thus forces microorganisms to utilize less energetic electron acceptors to metabolize organic matter. In an ideal system, soil microorganisms will use the strongest electron acceptor available, until it is exhausted. Although natural environments are not ideal systems, redox conditions in soils follow a more or less stepwise progression. Therefore, by evaluating the dissolved concentrations of NO, Mn, Fe, and SO in SPWs, it is possible to qualitatively assess soil redox conditions and their impact on hydrogeochemical variability.
The redox conditions at both Teller and Kougarok are generally limited by Fe reduction, with the most reducing conditions found at stations with the highest soil moisture content. As such, NO concentrations are generally low (Table 3), SO concentrations are relatively consistent (Fig. 4), and Mn and Fe concentrations increase with increasing soil moisture (Fig. 4). NO concentrations were generally low, except for drier stations in proximity to tall alders or willows. While NO inputs are discussed in the “Vegetation effects” section, the lack of high NO concentrations at wetter stations that contain alders suggests that soil moisture coupled with microbial denitrification bares a strong control on SPW NO concentrations. Meanwhile, SO concentrations at both sites are relatively constant across clear moisture and redox gradients (Fig. 4). This suggests that SO reduction is not pervasive at either site. Dissolved Fe concentrations were higher at stations with higher soil moisture content, consistent with Fe reduction. Similarly, Mn concentrations were slightly elevated at wetter stations. The concentrations of Mn, however, rarely rose above 0.05 mg L−1, suggesting either Mn solubility limitations or a lack of a significant Mn weathering source. Low Mn concentrations at Teller station 5, a wetter station on the upper shoulder of the Teller watershed (Table 1; Fig. 2), seem to support the latter conclusion, as do geochemical modeling exercises (Sect. 4.5). Together, these results suggest that the most reducing condition at both sites is typically limited to Fe reduction and that this only occurs at stations with the highest soil moisture contents.
3.3.3 Weathering, water–soil interaction, and hydrological transport effects
Weathering, water–soil interactions, and hydrological transport were identified as probable drivers of hydrogeochemical variability for some solutes. As noted by Philben et al. (2020), soil-derived solutes tend to accumulate in low-lying areas within watersheds. This is observed at Teller, where the concentrations of Ca, Sr, and Mg all increase dramatically at the transition from lower backslope to footslope (Fig. 5). Both Teller and Kougarok are underlain by carbonate-rich metamorphic facies, and Ca, Sr, and Mg are probable carbonate counter-cations. Weathering of Ca, Sr, and Mg carbonates and subsequent transport of these cations downslope explain this pattern of spatial variability. At Kougarok, concentrations of Ca, Mg, and Sr similarly increase from upper backslope to footslope, but concentrations of Ca and Sr decrease further down the lower backslope (stations 10 and 1), while Mg concentrations continue to increase. A possible explanation for this behavior is the greater affinity of cation exchange surfaces for Ca and Sr compared to Mg; thus, Ca and Sr are preferentially retained in the footslope whilst Mg is transported further down the lower backslope (Sparks, 2003, p. 189).
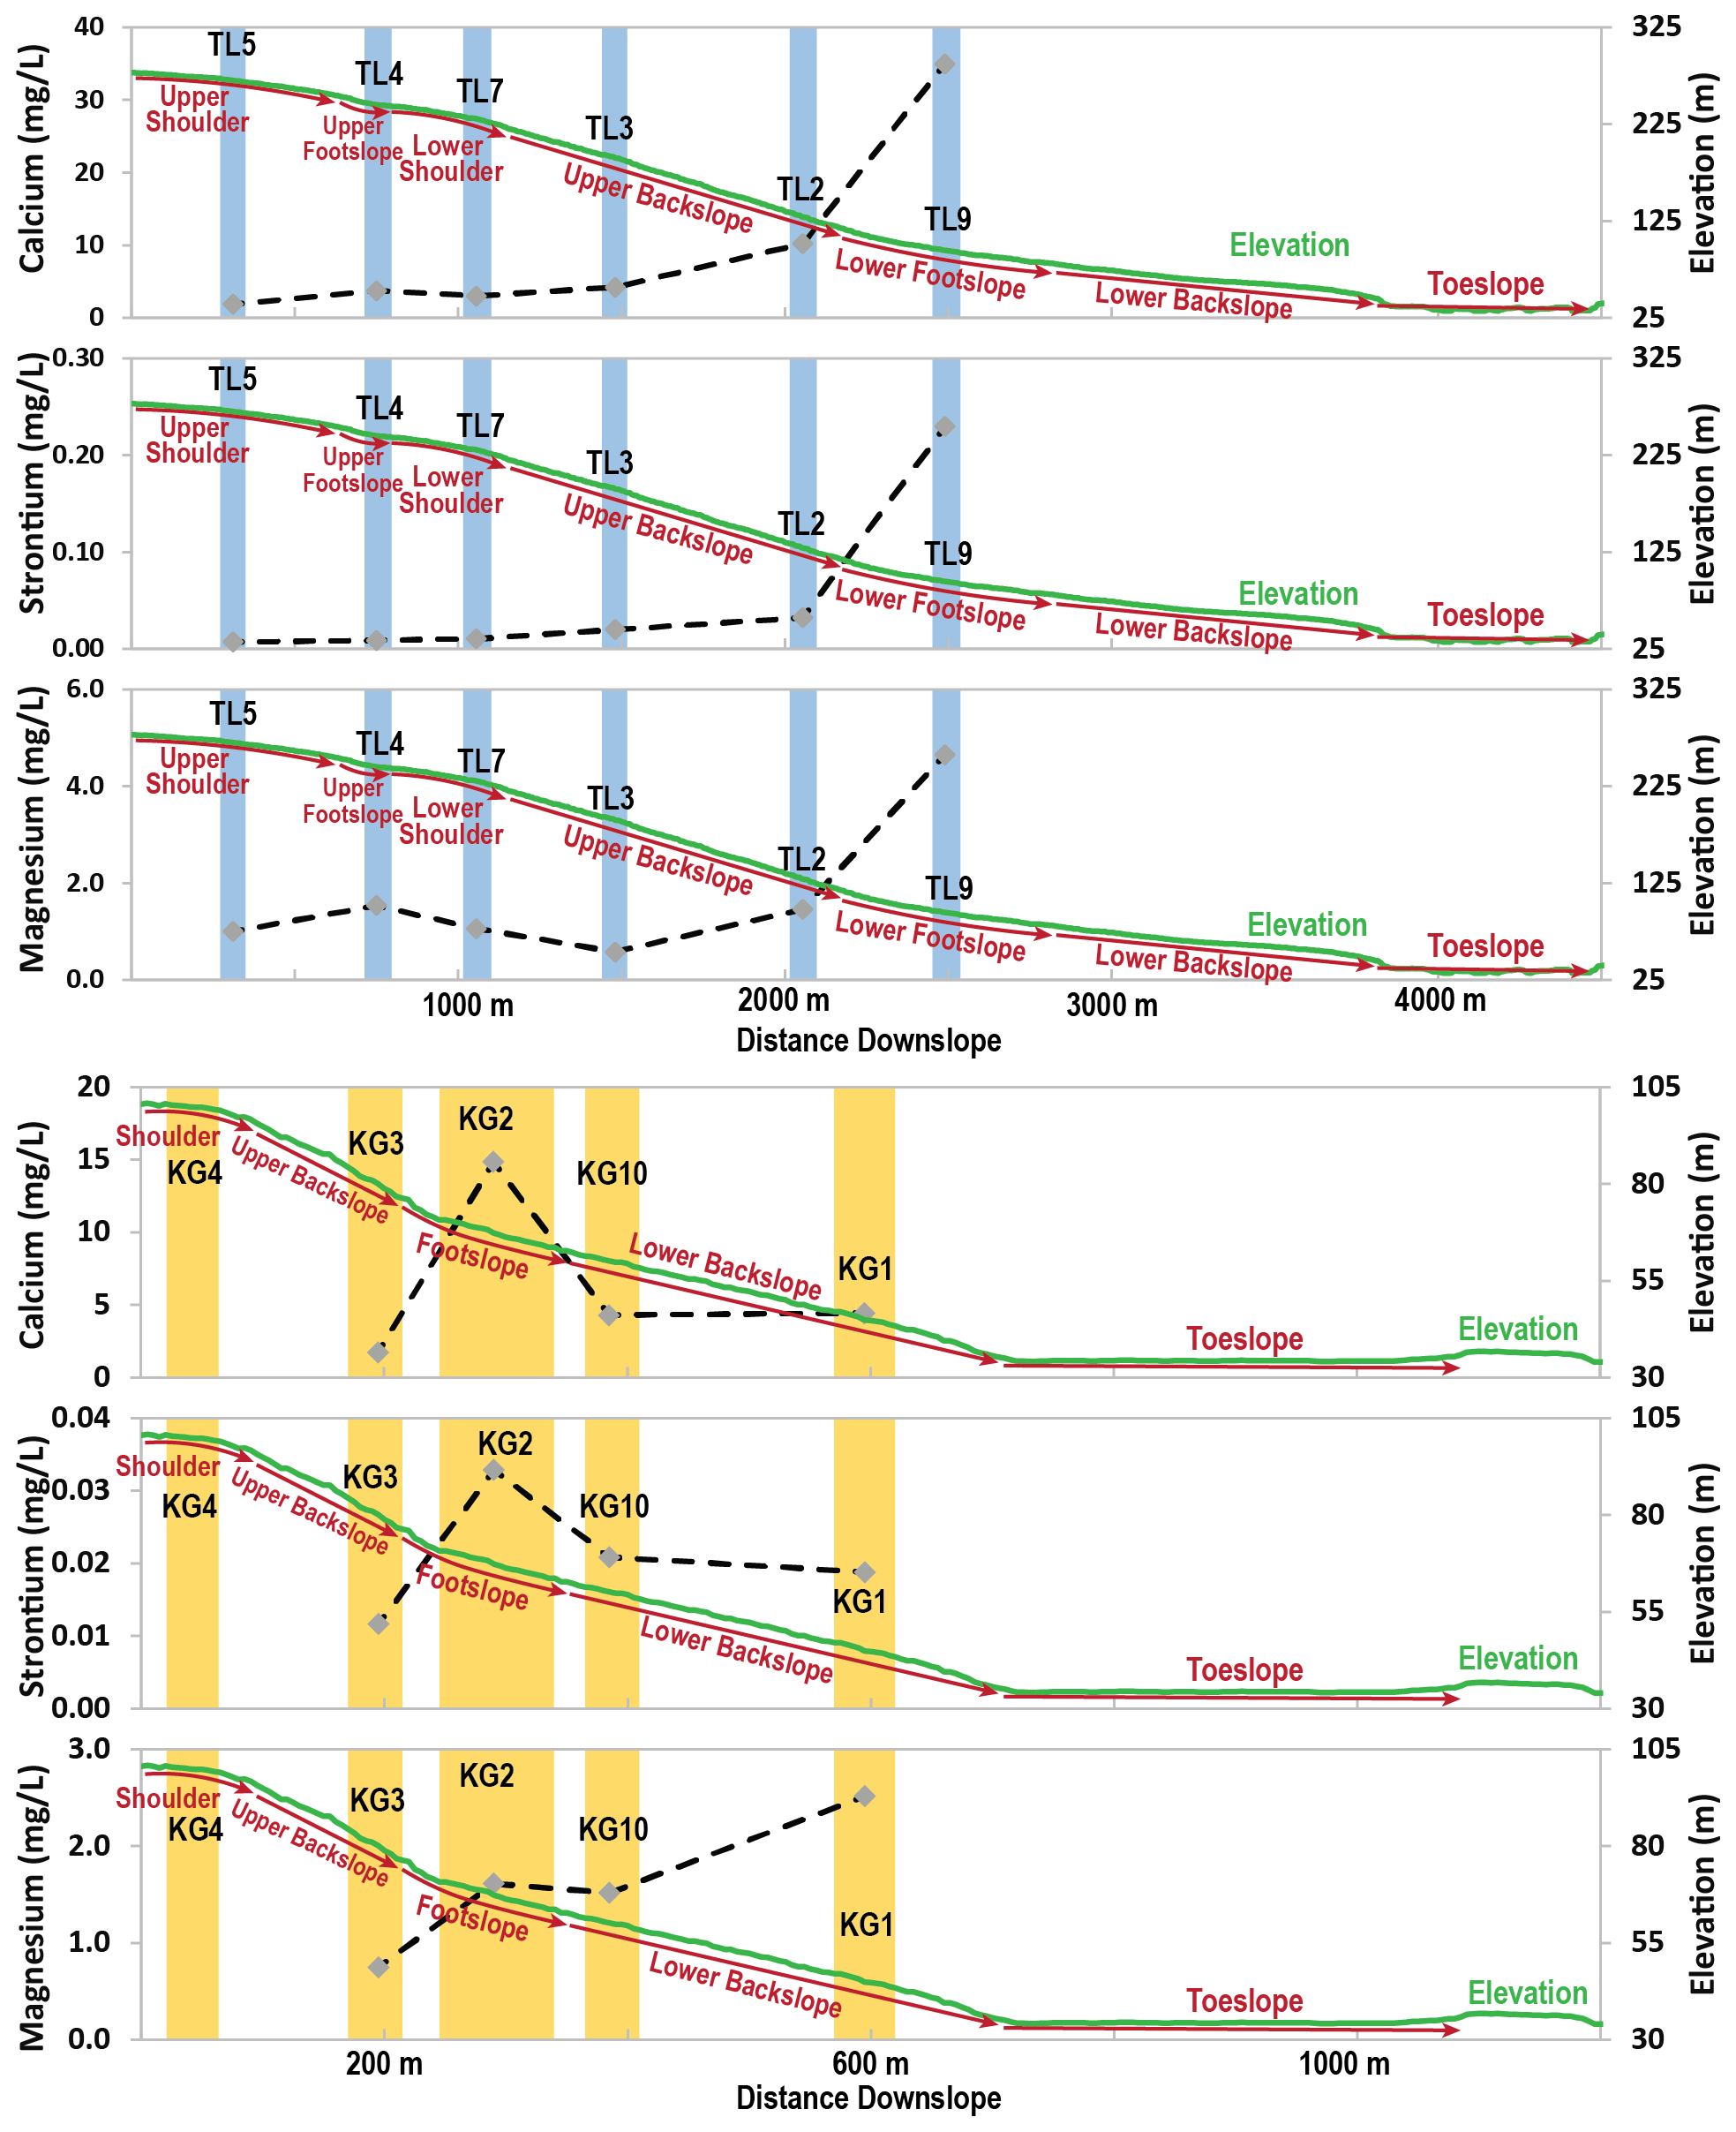
Figure 5Median (50th percentile) concentrations (gray diamonds with dashed black lines) of Ca, Sr, and Mg, with distance downslope at Teller (blue) and Kougarok (yellow) along topographic transects; areas of stations are indicated by blue and yellow coloring, respectively. The elevation profiles of the hillslopes are plotted in green on separate y axes (right axes). Topographic regions of both catchments are indicated by red arrows along the elevation gradient.
3.3.4 Mineral solubility effects
Although redox reactions are rarely at equilibrium in natural environments, comparison of field data with equilibrium models provides valuable semi-quantitative insight into the redox condition of natural environments. Because Fe appeared to be limiting the development of more reducing conditions (Sect. 4.3), select samples from both sites were measured for soluble Fe2+ following methods presented in Viollier et al. (2000). These concentrations of aqueous Fe2+ were then compared with model-predicted concentrations of Fe2+, when coupled with an infinite Fe(OH)3(am) phase, across a range of pH values (2–10) and fixed EH values of 400, 200, 0, and −200 mV; activity coefficients were assumed to be equal to 1. The measured and modeled Fe2+ concentrations are compared in Fig. 6, where concentrations that were below the method detection limit (0.05 mg L−1) are set equal to 0.025 mg L−1 (half the detection limit). Comparison of model-predicted Fe2+ concentrations with field data suggests that while Teller exhibits a narrower range of pH conditions than Kougarok, it exhibits a broader range of redox conditions (Fig. 6). Although several Fe2+ measurements were below the detection limit, suggesting oxidizing conditions, high Fe2+ concentrations in some samples suggested EH values below 0 mV. Therefore, Fe redox conditions at Teller ranged from mildly reducing to oxic and Fe redox conditions at Kougarok ranged from mildly oxic to oxic. Oxidation-reduction potentials (ORPs), calculated from pH, Fe2+ concentrations, and the Nernst equation, suggest that ORPs at Teller were as low as −69 mV, while the lowest ORP at Kougarok was +134 mV (Fig. 6). Maximum ORP values could not be determined quantitatively as some Fe2+ concentrations were below Fe2+ detection limits at both sites.
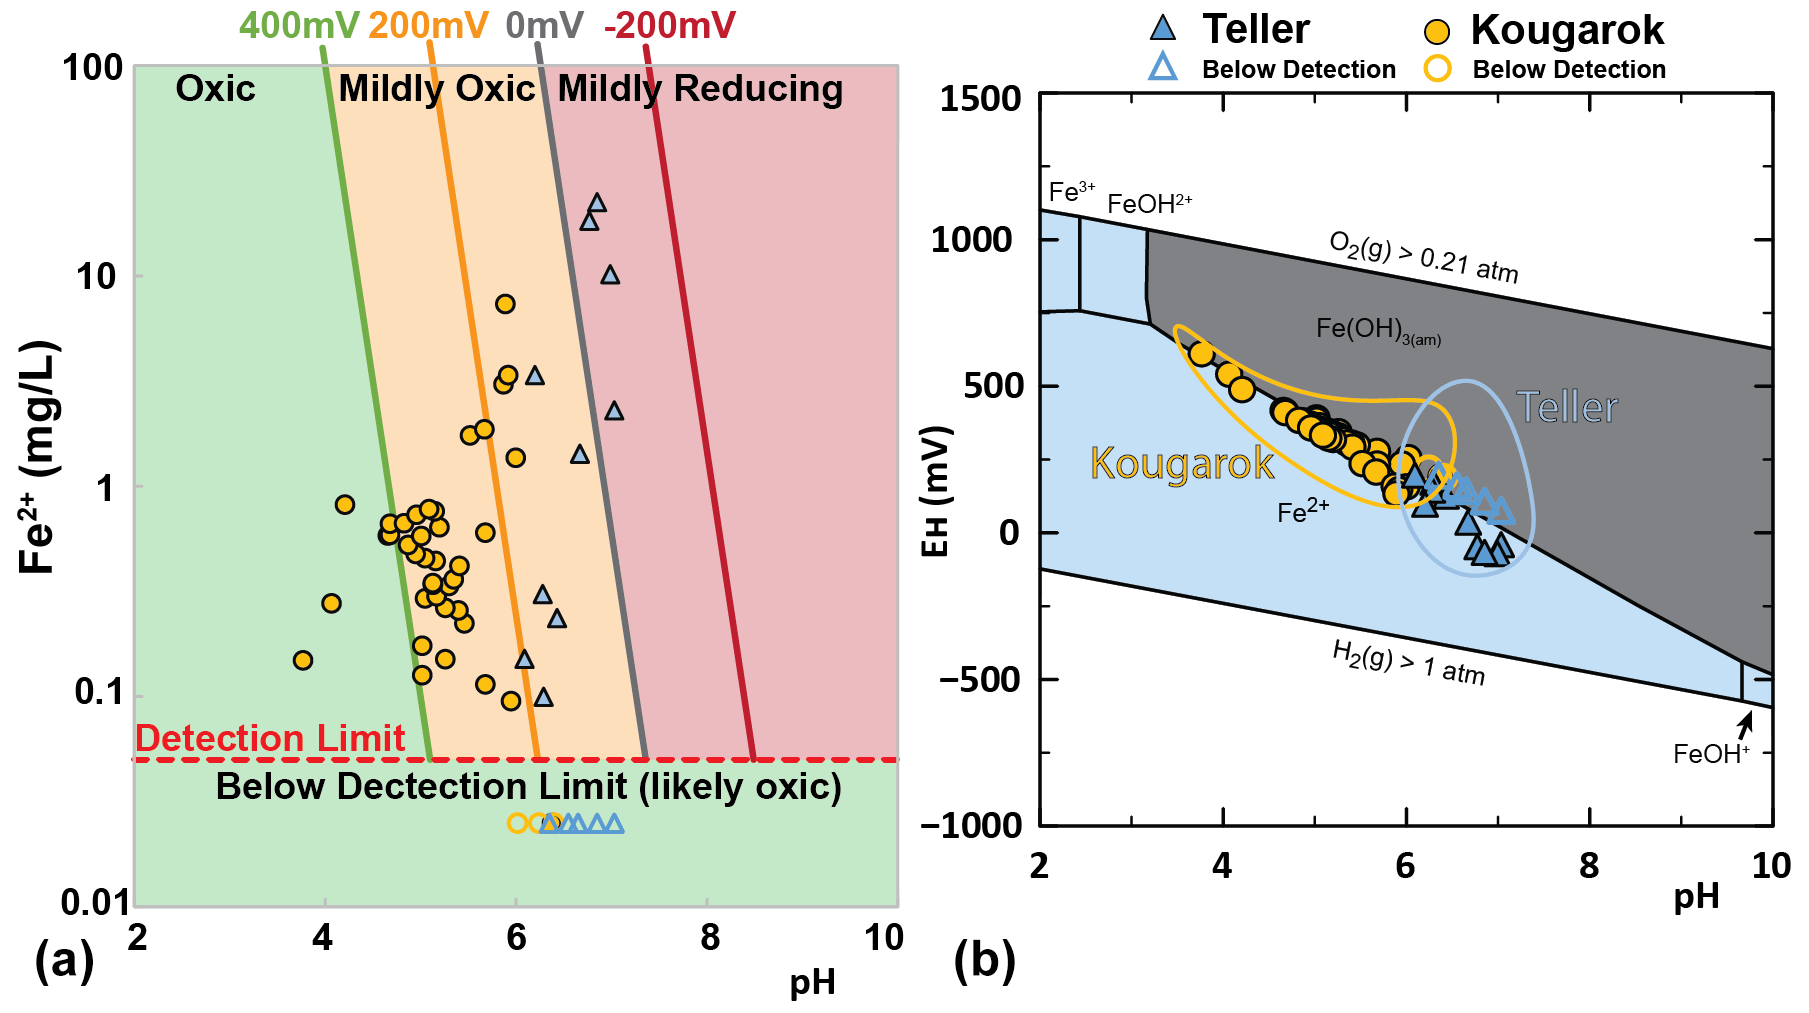
Figure 6(a) Model-predicted Fe2+ concentrations in saturated solutions of Fe(OH)3(am) at fixed EH conditions of 400 mV (green), 200 mV (orange), 0 mV (gray), and −200 mV (red), compared with field concentrations of Fe2+ at Teller (red circles) and Kougarok (yellow circles). (b) Fe predominance diagram, showing the dominant species of Fe under a range of EH and pH conditions. EH and pH regions relevant to Teller and Kougarok are outlined in blue and yellow, respectively. Samples with Fe2+ concentrations below the detection limit are given as color-coordinated open circles set at 0.025 mg L−1 (half the detection limit) in both sides of the figure.
EH and pH predominance diagrams were created from the 25th, 50th, and 100th concentration percentiles and are shown in Fig. 7 for the COIs where precipitation of mineral phases were predicted under some conditions. The concentrations for these diagrams were taken from filtered aqueous concentration data; thus, predicted mineral precipitation is an indication of nearly saturated or oversaturated conditions. The ranges of EH and pH conditions observed at Teller and Kougarok are overlaid as solid yellow and solid blue lines, respectively. Only the predominance diagrams that indicated possible mineral formation under the EH and pH conditions present at either site are shown in Fig. 7. These phases included Fe(OH)3(am) (Fe), siderite (Fe), Al(OH)3(am) (Al), chalcedony (Si), barite (Ba and SO4), calcite (Ca), dolomite (Ca and Mg), and rhodochrosite (Mn). Predominance diagrams for the remaining key COIs that were not predicted to form any mineral phases under any site conditions are given in Supplement Fig. 4.
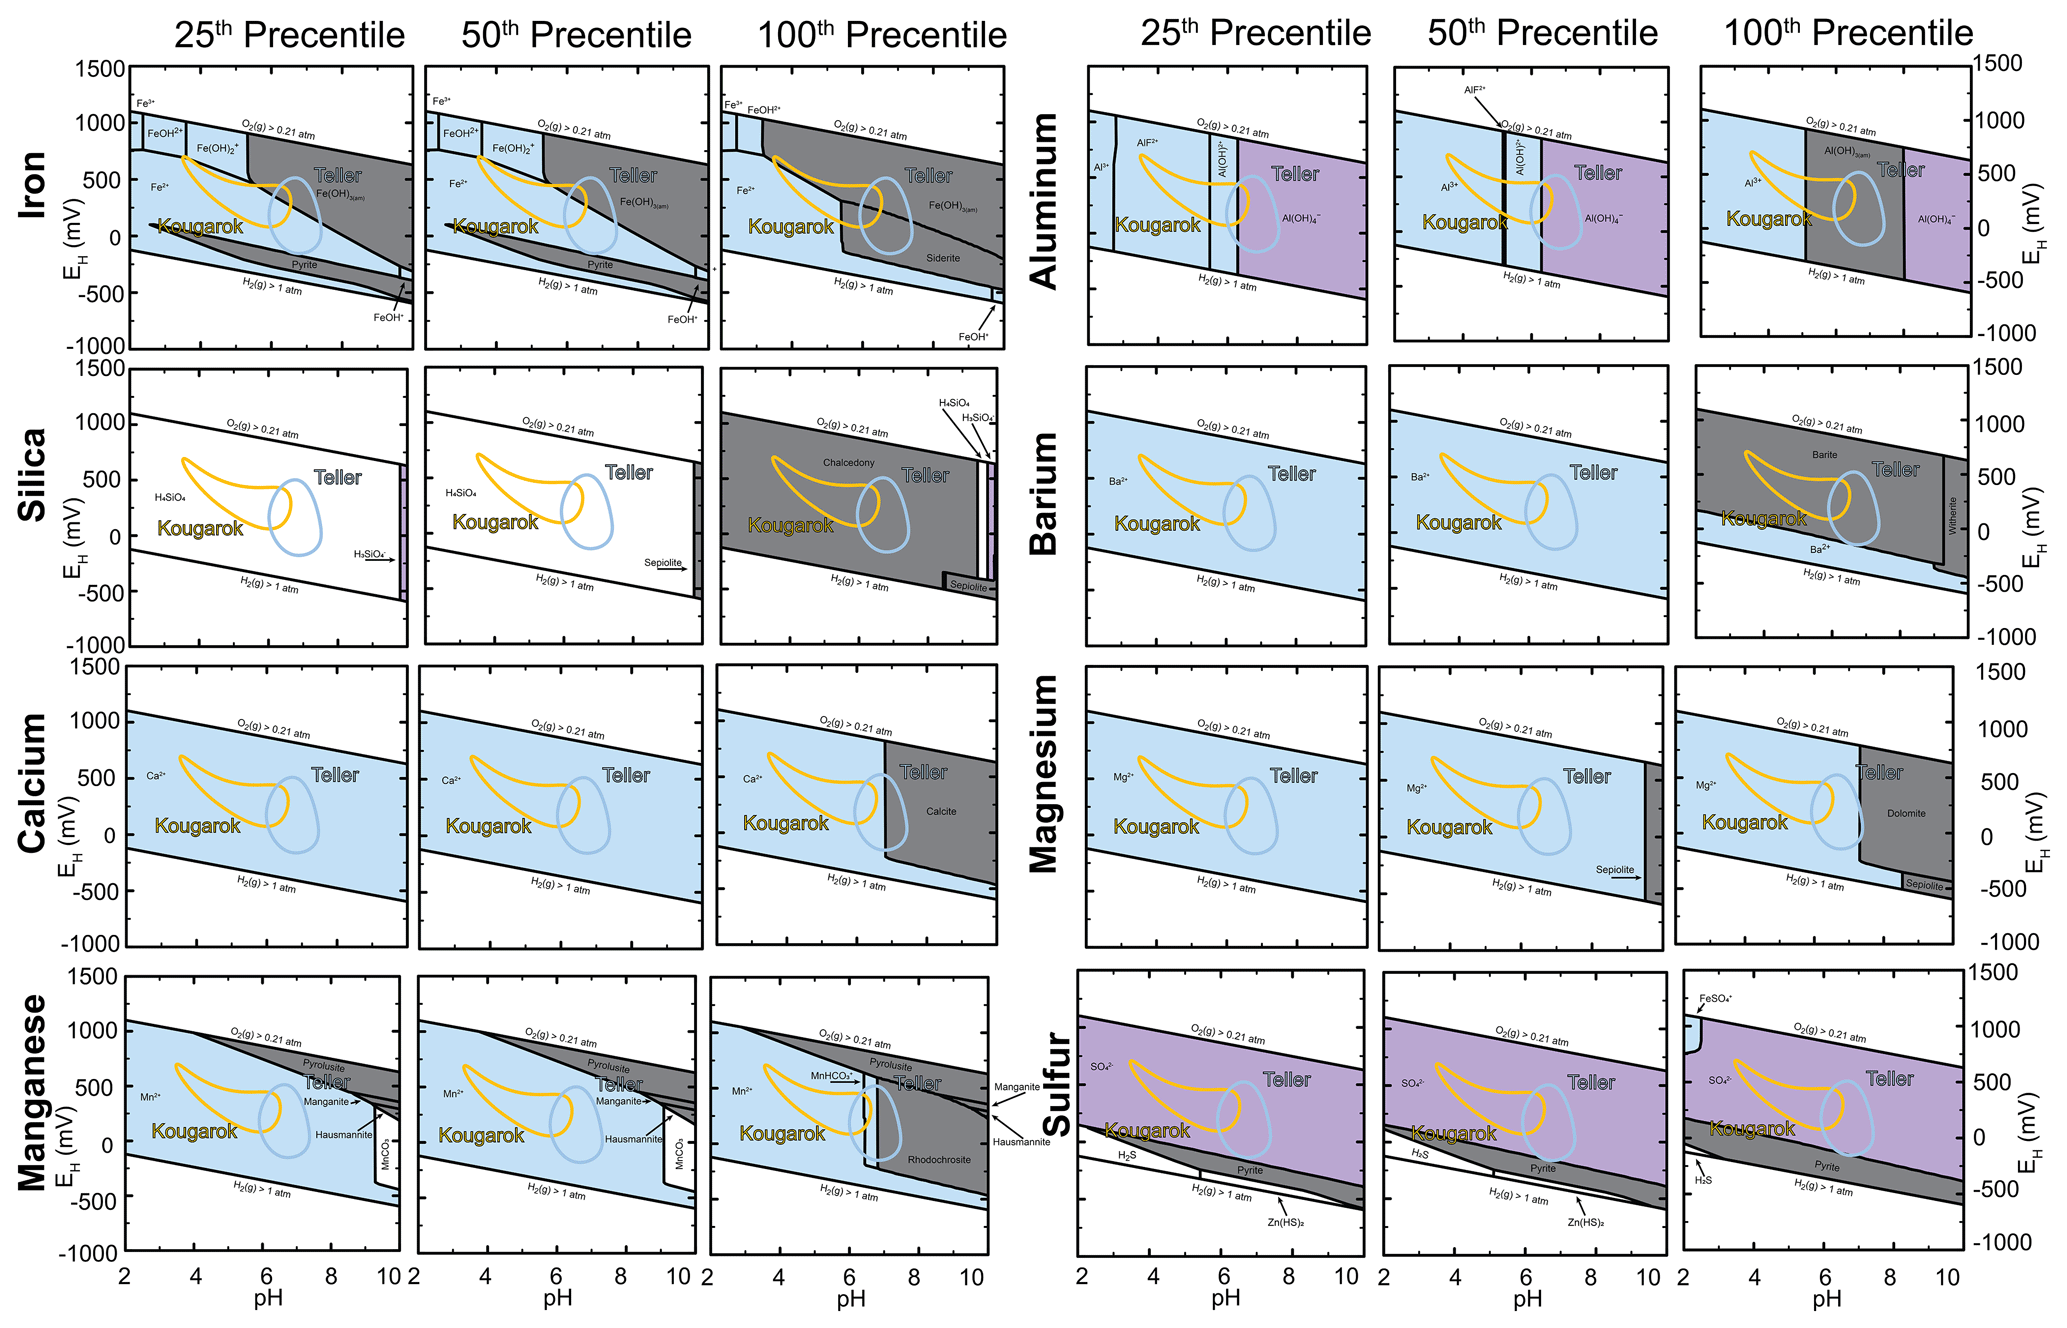
Figure 7EH and pH diagrams for key species that indicated possible mineral formation under the EH and pH conditions present at either Teller or Kougarok. The EH and pH conditions observed at Teller and Kougarok are overlaid as blue and yellow lines, respectively. Mineral species (solids) are shown in gray, cations are shown in blue, anions are shown in purple, and neutral species are shown in white. Predominance diagrams were created in PhreePlot using the phreeqc.dat data
To further examine which mineral phases could be controlling SPW solute concentrations, saturated conditions for the mineral phases identified in Fig. 7 were modeled using sweeps of pH values from 2–10 at various fixed EH values (400, 200, 0, and −200 mV). Predicted solute concentrations under the modeled saturated conditions were then compared with field data to find common trends. In general, if solute concentrations were frequently measured near the saturation of a mineral, or were identified to have similar dependence on pH or EH, it was inferred that the mineral phase could be controlling the generation of that solute. The mineral phases that were identified to possibly be controlling solute concentrations were Al(OH)3(am), Fe(OH)3(am), chalcedony, and barite. This does not preclude the presence of significant concentrations of other mineral phases, it only identifies these as possibly controlling the dissolved concentrations of Al, Fe, Si, and Ba, respectively. Although they do not provide mineralogical information, X-ray fluorescence (XRF) data reported by another study at Teller confirmed high concentrations of Al, Fe, Si, and Ba in the organic and mineral soil layers at that site (Graham et al., 2018). We are unaware of any similar studies at Kougarok, nor are we aware of any studies that would provide confirmatory mineralogical information, for example by X-ray diffraction (XRD).
Aluminum concentrations in SPWs at both Teller and Kougarok appear to be controlled by the dissolution and precipitation of amorphous Al hydroxide (Al(OH)3(am)) (Fig. 8). The solubility limit of Al(OH)3(am) has no redox dependence but is highly pH dependent. Aluminum concentrations were generally clustered near the solubility limit of Al(OH)3(am); ; log k=10.8. This suggests that Al SPW concentrations at both sites are controlled by wetting–drying (dissolution–precipitation) processes. It also suggests that there could be a significant amount of Al(OH)3(am) in the soils at both sites. While organic matter may also sorb to alumina surfaces, the adherence to the solubility of Al(OH)3(am) suggests that significant concentrations of Al are not complexed with dissolved organic matter. The predominance diagrams highlight (1) the strong pH dependence on the stability of Al(OH)3(am), (2) the influence dissolved F can have on Al speciation when Al concentrations are low, and (3) that Al is a cation at low pH and an anion at high pH (Fig. 7). Despite being a weathering product, Al concentrations show a dissimilar downslope trend to other weathering products, especially at Teller (Supplement Fig. S5). While the concentrations of weathering products generally increase with distance downslope, Al concentrations decrease. We suspect this can be attributed to increasing pH with distance downslope. Philben et al. (2020) reported a 1 pH unit increase in pH in organic soils along the Teller transect (Fig. 2), increasing from 5.6 at station 5 to 6.7 at station 9. Such an increase would decrease the solubility of Al(OH)3(am) and thus decrease the concentration of dissolved Al (Fig. 8).
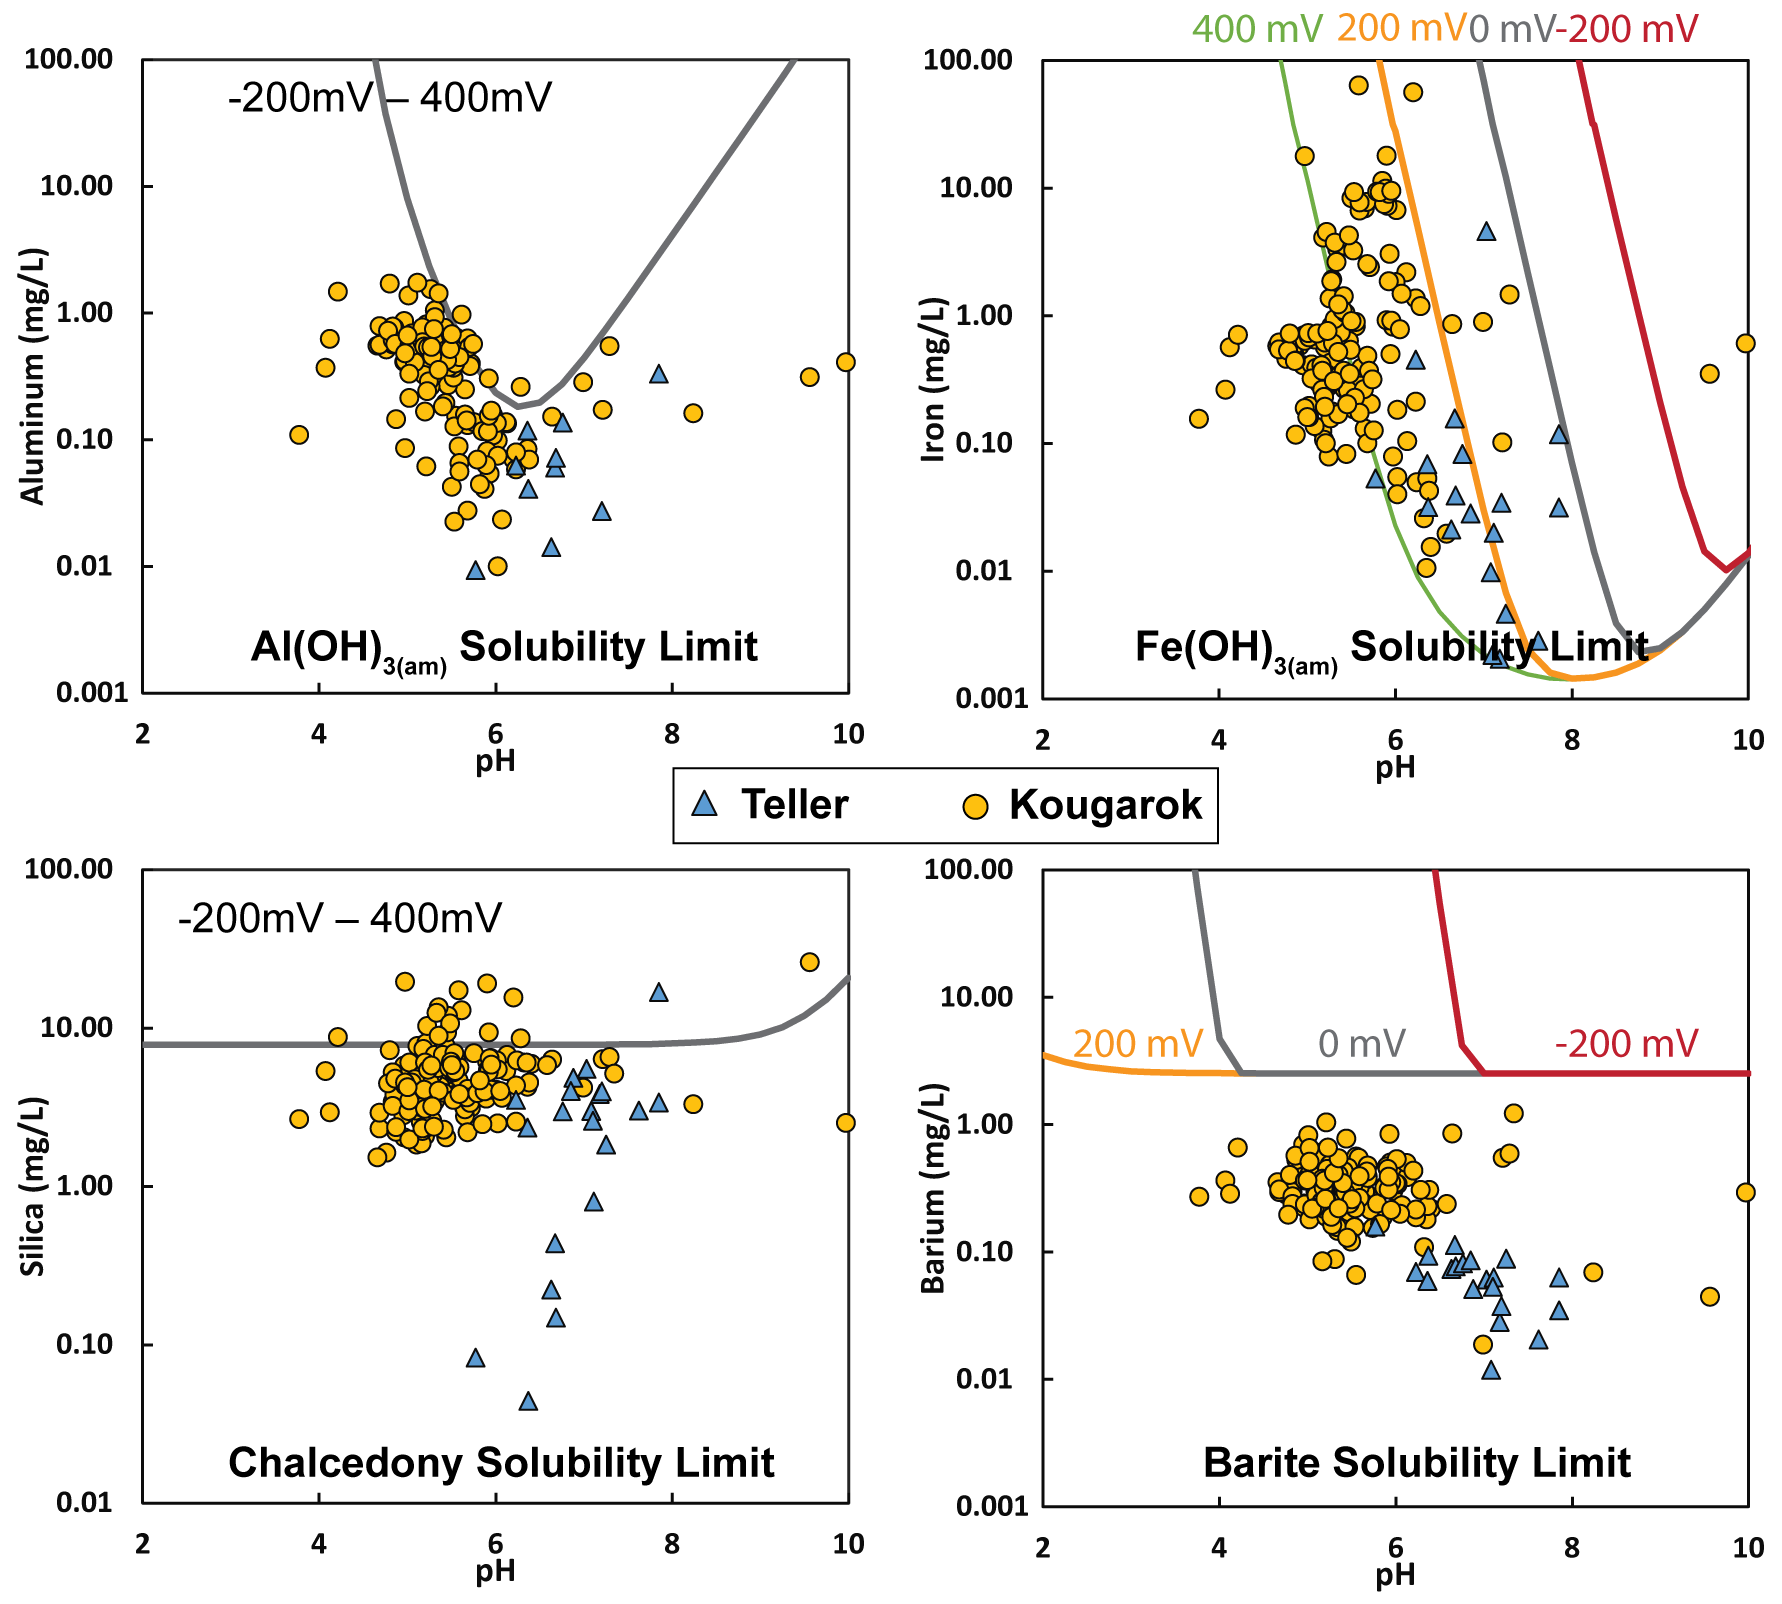
Figure 8Modeled solute concentrations in solutions saturated with Al(OH)3(am), Fe(OH)3(am), chalcedony, and barite, with respect to pH (x axis) and EH (model lines), overlaid with observed solute concentrations.
Similar to Al, Fe concentrations in SPWs at both Teller and Kougarok appear to be controlled by the dissolution and precipitation of amorphous Fe hydroxide (Fe(OH)3(am)). Fe concentrations were generally clustered near the solubility limit of Fe(OH)3(am) (Fig. 8). Unlike Al(OH)3(am), however, Fe(OH)3(am) solubility is dependent on the redox condition in addition to the pH; ; log k=16.0 (Fig. 8). Fe(III) is only sparingly soluble in aqueous solutions and reduction to Fe(II) significantly increases the solubility of Fe; thus, at a given pH value higher aqueous concentrations are predicted and observed under more reducing conditions (Fig. 8). Iron concentrations in SPWs at both sites generally follow the pH dependence of Fe(OH)3(am) solubility (Fig. 8). This suggests that SPW concentrations of Fe at both sites are controlled by wetting–drying (dissolution–precipitation) processes, coupled with the redox condition.
Si concentrations are frequently limited by the solubility of chalcedony (Fig. 8), a very finely grained form of SiO2, which is much more soluble than quartz; ; . Particularly at Kougarok, the dissolved Si concentrations, coupled with a lack of a strong pH or EH dependence, suggest a controlling influence of chalcedony (Fig. 8).
Ba concentrations also appear to be controlled by solubility, but rather than by the solubility of an oxide or a hydroxide phase, by the solubility of barite (Fig. 8) [; log k=9.97]. Unlike Al hydroxide or Fe hydroxide, barite solubility lacks a strong pH dependence and instead is dependent solely on the activities of Ba2+ and SO. Unlike Ba, SO concentrations are not limited by the solubility limit of barite and are generally higher and not well correlated with Ba concentrations. Together, these suggest that SO from another source (likely atmospheric deposition or sulfidic mineral oxidation) is suppressing barite dissolution and thus is reducing dissolved Ba concentrations. Barite solubility can exhibit a redox dependence if conditions are sufficiently reducing to reduce SO to sulfide (Neff, 2002). This shifts the equilibrium to greater dissolution of barite and therefore higher conditions of Ba. The lack of EH dependence in observational data further suggests that neither site exhibits significant SO reduction.
The 18 stations examined herein (8 at Teller and 10 at Kougarok) represent a wide range of vegetation types, soil moisture contents, permafrost extents, and hillslope positions. Coupling the spatial variability of these landscape characteristics with the spatial variability of SPW solute concentrations provides valuable insight into the dominant environmental controls on observed spatial variability of SPW geochemistry. It is our hope that correlating SPW geochemistry with readily observable and scalable landscape features will inform earth system modeling efforts in permafrost regions and provide fast and easy methods to determine if earth system models are working properly (i.e., predicting the correct trends). The inferred dominant environmental controls on the observed inter-site and intra-site variability of SPW solute concentrations are discussed in the following sections.
4.1 The dominant environmental controls on inter-site variability of SPW solute concentrations
Overall, the more frequent instance of significantly greater constituent concentrations at Kougarok suggests a systematic cause. The extensive low-gradient toe slope (Fig. 2) and lack of a well-defined drainage channel at Kougarok are likely causes of the systematically higher SPW solute concentrations at Kougarok. Water perching, the result of near-surface permafrost in the lower backslope and toe slope, is likely to increase evapotranspiration, thus leading to increased SPW solute concentrations. Significant evapotranspiration caused by supra-permafrost water table perching has been noted in several previous studies (Huang et al., 2022; Park et al., 2021; Sjöberg et al., 2020). Meanwhile, the lack of a drainage channel at Kougarok suggests that runoff (and therefore solute exports) is more limited than at Teller. Without a relatively rapid export mechanism such as a stream channel, solute transport is likely limited to interflow within the Kougarok hillslope over much of the thaw season, allowing weathering products to increase to significantly greater concentrations than those observed at Teller, where a well-defined drainage–export mechanism does exist. Field observations from pits at Kougarok confirm observable interflow at the site. Overall, our study suggests that evaporative concentration could be a significant control on SPW solute concentrations in permafrost catchments, especially in those with limited drainage and therefore a perched near-surface water table. This effect has been reported previously (Raudina et al., 2017), but does not appear to be widely considered, perhaps due to the generally few studies of SPW solutes in permafrost regions. We suggest future efforts to predict future SPW solute and nutrient dynamics directly address the impacts of evaporative concentration on permafrost catchments, especially with future permafrost thaw.
The exception to the general observation of elevated concentrations at Kougarok versus Teller was SO. Although the cause of consistently higher SO concentrations at Teller is unclear from the limited scope of this study, it seems likely to be due to a greater abundance of sulfidic bedrock material. The presence of sulfidic bedrock in the vicinity of Teller has been reported by mineral prospecting efforts (Brobst et al., 1971; Herreid, 1966; Mulligan, 1965); we are unaware of any such reports near Kougarok. It should be recognized that SO concentrations at both Kougarok and Teller are relatively low.
4.2 The dominant environmental controls on intra-site spatial variability of SPW solute concentrations
Vegetation influences on elemental cycles were only readily apparent for nitrogen, and although vegetation-induced changes to soil moisture content were discernible, they were far less significant than anticipated. NO was the only COI that exhibited a clear vegetation effect; elevated concentrations were associated with the presence of alder shrubs and, in some cases, tall willow shrubs. These increases in NO concentrations associated with alder nitrogen fixation and the mineralization and nitrification of willow leaf litter were frequently equipoised by increased microbial denitrification in regions sufficiently moist to support it; this is perhaps one of the most significant findings of this work. Although both Kougarok and Teller exhibited some indications of increased Cl concentrations in the presence of tall shrubs, the net vegetation effect on soil moisture was far less than hypothesized. Redox sensitivity was also less than hypothesized, and most stations seemed well-buffered at Fe redox conditions. The result of this buffering was generally low NO concentrations (except where vegetation effects dominated), consistent SO concentrations across clear redox gradients, and variable Mn and Fe concentrations. Mn concentrations were generally low, likely due to a limited source. Fe concentrations were higher at stations with higher soil moisture content, consistent with Fe reduction. Similar Fe redox cycling between soluble Fe(II) species and precipitated Fe oxyhydroxides in permafrost catchments has been reported recently (Patzner et al., 2022), which suggests that Fe redox buffering in permafrost landscapes is widespread. Weathering, water–soil interactions, and hydrological transport were probable drivers of variability for Ca, Sr, and Mg. Ca, Sr, and Mg all tended to accumulate in low-lying areas, although Ca and Sr demonstrated greater accumulation potential than Mg, likely via greater affinity of cation exchange surfaces for Ca and Sr compared to Mg. Mineral solubility limitations were the primary controls on Al (Al(OH)3(am)), Fe (Fe(OH)3(am)), Ba (barite), and Si (chalcedony) concentrations. This suggests that the SPW concentrations of these constituents will remain stable until those mineral phases are exhausted or soil pore hydrochemistry changes sufficiently to alter the solubility of those mineral phases. Supersaturation of Al with respect to gibbsite (crystalline Al(OH)3) and Si with respect to chalcedony in a permafrost wetland has been reported previously (Jessen et al., 2014). The solubility curves for gibbsite and Al(OH)3(am) are similar, with Al(OH)3(am) being slightly more soluble at all pH values due to the increased thermodynamic stability of the crystalline Al hydroxide mineral, gibbsite. Meanwhile, seasonal precipitation of Fe oxyhydroxides in permafrost peatlands and their effect on carbon cycling were the subject of an excellent paper by Patzner et al. (2022). Our study is the first observation we are aware of that reports the saturation controls of barite on Ba in permafrost SPWs, although that could be because relatively few studies consider barium concentrations; it is worthwhile to emphasize that Ba was not supersaturated with respect to barite but approached a saturated condition. Future studies should also note that changes in redox condition would significantly alter Fe(OH)3(am) solubility, whereas changes in pH conditions would significantly alter Al(OH)3(am) and Fe(OH)3(am) solubility.
Although discerning the environmental controls on spatial variability of SPW solute concentrations provides some high-level insight into the effects changes in landscape character may have on soil pore hydrochemistry, our scope was limited and leveraged on previously available datasets. We hope that the observations and trends discussed here aid future studies in the selection of appropriate sample sites and sampling schemes. Future studies should more fully consider the role of spatial variability of a catchment's solid phases (i.e., soils, leaf litter, and underlying geology). Soil digestions (elemental composition), sequential extractions (organic character), or XRD (mineralogical character) all would have been helpful in our work. Detailed geophysical surveys would have greatly aided our interpretation and increased the significance and impact of the work. More regular sampling of soil pore waters to capture the seasonality of active layer thaw as well as leaf fall and litter degradation would have also provided additional insight. For catchments with well-defined drainages, gauging stations with periodic sampling could also be very useful in interpretation (i.e., through concentration–discharge relationships). Overall, the significance of SPW in small Arctic headwater catchments as a key initial component in the freshwater hydrologic continuum is under-recognized, and such catchments warrant more detailed and systematic investigations.
The data that support the findings of this study are made openly available in the NGEE Arctic data repository at https://doi.org/10.5440/1735757 (Conroy et al., 2021).
The supplement related to this article is available online at: https://doi.org/10.5194/tc-17-3987-2023-supplement.
NAC, JMH, EL, BM, REM, CAA, VGS, AB, VR, and CJW contributed to data collection and compilation. NAC, JMH, EL, DM, and BN conceptualized the paper. NAC and EL performed statistical models. NAC performed geochemical models and produced the figures. NAC, JMH, EL, DM, BN, VGS, and AB prepared the text. All authors contributed to the final text.
The contact author has declared that none of the authors has any competing interests.
Publisher's note: Copernicus Publications remains neutral with regard to jurisdictional claims in published maps and institutional affiliations.
We would like to thank the Sitnasuak Native Corporation and the Mary's Igloo Native Corporation for their guidance and for allowing us to conduct this research on the traditional homelands of the Inupiat people. Funding was provided by the Next-Generation Ecosystem Experiments (NGEE Arctic) project, supported by the Office of Biological and Environmental Research in the US DOE Office of Science. We wish to thank Lauren Charsley-Groffman and Nathan Wales for their assistance with fieldwork as well as George Perkins, Oana Marina, Rose Harris, and Emily Kluk for their assistance with laboratory analyses.
Funding was provided by the Next-Generation Ecosystem Experiments (NGEE Arctic) project, supported by the Office of Biological and Environmental Research in the US DOE Office of Science.
This paper was edited by Adrian Flores Orozco and reviewed by two anonymous referees.
Binkley, D., Sollins, P., Bell, R., Sachs, D., and Myrold, D.: Biogeochemistry of Adjacent Conifer and Alder-Conifer Stands, Ecology, 73, 2022–2033, https://doi.org/10.2307/1941452, 1992.
Breen, A., Iversen, C., Salmon, V., VanderStel, H., Busey, B., and Wullschleger, S.: NGEE Arctic Plant Traits: Plant Community Composition, Kougarok Road Mile Marker 64, Seward Peninsula, Alaska, 2016, NGEE Arctic [data set], https://doi.org/10.5440/1465967, 2020.
Bring, A., Fedorova, I., Dibike, Y., Hinzman, L., Mård, J., Mernild, S. H., Prowse, T., Semenova, O., Stuefer, S. L., and Woo, M. -K.: Arctic terrestrial hydrology: A synthesis of processes, regional effects, and research challenges, J. Geophys. Res.-Biogeo., 121, 621–649, https://doi.org/10.1002/2015JG003131, 2016.
Brobst, D. A., Pinckney, D. M., and Sainsbury, C. L.:Geology and geochemistry of the Sinuk River Barite deposit, Seward Peninsula, Alaska, https://doi.org/10.3133/ofr7154, 1971.
Bühlmann, T., Hiltbrunner, E., and Körner, C.: Alnus viridis expansion contributes to excess reactive nitrogen release, reduces biodiversity and constrains forest succession in the Alps, Alp Botany, 124, 187–191, https://doi.org/10.1007/s00035-014-0134-y, 2014.
Clein, J. S. and Schimel, J. P.: Nitrogen turnover and availability during succession from alder to poplar in Alaskan taiga forests, Soil Biol. Biochem., 27, 743–752, https://doi.org/10.1016/0038-0717(94)00232-P, 1995.
Conroy, N., Heikoop, J., Newman, B., Wilson, C., Arendt, C., Perkins, G., and Wullschleger, S.: Soil Water Chemistry and Water and Nitrogen Isotopes, Teller Road Site and Kougarok Hillslope, Seward Peninsula, Alaska, 2016–2019, NGEE Arctic [data set], https://doi.org/10.5440/1735757, 2021.
Corder, G. W. and Foreman, D. I.: Nonparametric statistics for non-statisticians: a step-by-step approach, Wiley, Hoboken, NJ, 247 pp., ISBN 978-0-470-45461-9, 2009.
Frey, K. E. and McClelland, J. W.: Impacts of permafrost degradation on arctic river biogeochemistry, Hydrol. Process., 23, 169–182, https://doi.org/10.1002/hyp.7196, 2009.
Frisbee, M. D., Phillips, F. M., Campbell, A. R., and Hendrickx, J. M. H.: Modified passive capillary samplers for collecting samples of snowmelt infiltration for stable isotope analysis in remote, seasonally inaccessible watersheds 1: laboratory evaluation, Hydrol. Process., 24, 825–833, https://doi.org/10.1002/hyp.7523, 2010.
Fuchs, M., Nitze, I., Strauss, J., Günther, F., Wetterich, S., Kizyakov, A., Fritz, M., Opel, T., Grigoriev, M. N., Maksimov, G. T., and Grosse, G.: Rapid Fluvio-Thermal Erosion of a Yedoma Permafrost Cliff in the Lena River Delta, Front. Earth Sci., 8, 336, https://doi.org/10.3389/feart.2020.00336, 2020.
Graham, D., Kholodov, A., Wilson, C., Moon, J.-W., Romanovsky, V., and Busey, B.: Soil Physical, Chemical, and Thermal Characterization, Teller Road Site, Seward Peninsula, Alaska, 2016, NGEE Arctic [data set], https://doi.org/10.5440/1342956, 2018.
Harms, T. K. and Jones, J. B.: Thaw depth determines reaction and transport of inorganic nitrogen in valley bottom permafrost soils: Nitrogen cycling in permafrost soils, Glob. Change Biol., 18, 2958–2968, https://doi.org/10.1111/j.1365-2486.2012.02731.x, 2012.
Harms, T. K. and Ludwig, S. M.: Retention and removal of nitrogen and phosphorus in saturated soils of arctic hillslopes, Biogeochemistry, 127, 291–304, https://doi.org/10.1007/s10533-016-0181-0, 2016.
Helsel, D. R.: Nondetects and data analysis: statistics for censored environmental data, Wiley-Interscience, Hoboken, NJ, 250 pp., ISBN 0471671738, 2005.
Herreid, G. H.: Preliminary geology and geochemistry of the Sinuk River area, Seward Peninsula, Alaska, Alaska Division of Mines and Minerals, State of Alaska, https://doi.org/10.14509/353, 1966.
Hiyama, T., Yang, D., and Kane, D.: Permafrost Hydrology: Linkages and Feedbacks, in: Arctic Hydrology, Permafrost and Ecosystems, Springer, Cham, 471–491, ISBN 978-3-030-50930-9, 2021.
Hopkins, D. M. and Karlstrom, T. N. V.: Permafrost and Ground Water in Alaska, 69, United States Geological Survey Professional Paper 264-F, 1955.
Huang, Q., Ma, N., and Wang, P.: Faster increase in evapotranspiration in permafrost-dominated basins in the warming Pan-Arctic, J. Hydrol., 615, 128678, https://doi.org/10.1016/j.jhydrol.2022.128678, 2022.
Jafarov, E. E., Coon, E. T., Harp, D. R., Wilson, C. J., Painter, S. L., Atchley, A. L., and Romanovsky, V. E.: Modeling the role of preferential snow accumulation in through talik development and hillslope groundwater flow in a transitional permafrost landscape, Environ. Res. Lett., 13, 105006, https://doi.org/10.1088/1748-9326/aadd30, 2018.
Jessen, S., Holmslykke, H. D., Rasmussen, K., Richardt, N., and Holm, P. E.: Hydrology and pore water chemistry in a permafrost wetland, Ilulissat, Greenland, Water Resour. Res., 50, 4760–4774, https://doi.org/10.1002/2013WR014376, 2014.
Kinniburgh, D. and Cooper, D.: PhreePlot: Creating Graphical Output with Phreeqc [code], https://www.phreeplot.org/ (last access: 5 September 2023), 2011.
Koch, J. C., Runkel, R. L., Striegl, R., and McKnight, D. M.: Hydrologic controls on the transport and cycling of carbon and nitrogen in a boreal catchment underlain by continuous permafrost: C and N Fate in Boreal Catchments, J. Geophys. Res.-Biogeo., 118, 698–712, https://doi.org/10.1002/jgrg.20058, 2013.
Kokelj, S. V. and Jorgenson, M. T.: Advances in Thermokarst Research: Recent Advances in Research Investigating Thermokarst Processes, Permafrost and Periglac. Process., 24, 108–119, https://doi.org/10.1002/ppp.1779, 2013.
Kurylyk, B. L. and Walvoord, M. A.: Permafrost Hydrogeology, in: Arctic Hydrology, Permafrost and Ecosystems, Springer, Cham, 493–523, ISBN 978-3-030-50930-9, 2021.
Langford, Z. L., Kumar, J., Hoffman, F. M., Breen, A. L., and Iversen, C. M.: Arctic Vegetation Mapping Using Unsupervised Training Datasets and Convolutional Neural Networks, Remote Sensing, 11, 69, https://doi.org/10.3390/rs11010069, 2019.
Lara, M. J., Nitze, I., Grosse, G., and McGuire, A. D.: Tundra landform and vegetation productivity trend maps for the Arctic Coastal Plain of northern Alaska, Sci. Data, 5, 180058, https://doi.org/10.1038/sdata.2018.58, 2018.
Léger, E., Dafflon, B., Robert, Y., Ulrich, C., Peterson, J. E., Biraud, S. C., Romanovsky, V. E., and Hubbard, S. S.: A distributed temperature profiling method for assessing spatial variability in ground temperatures in a discontinuous permafrost region of Alaska, The Cryosphere, 13, 2853–2867, https://doi.org/10.5194/tc-13-2853-2019, 2019.
Liljedahl, A. K., Boike, J., Daanen, R. P., Fedorov, A. N., Frost, G. V., Grosse, G., Hinzman, L. D., Iijma, Y., Jorgenson, J. C., Matveyeva, N., Necsoiu, M., Raynolds, M. K., Romanovsky, V. E., Schulla, J., Tape, K. D., Walker, D. A., Wilson, C. J., Yabuki, H., and Zona, D.: Pan-Arctic ice-wedge degradation in warming permafrost and its influence on tundra hydrology, Nat. Geosci., 9, 312–318, https://doi.org/10.1038/ngeo2674, 2016.
McCaully, R. E., Arendt, C. A., Newman, B. D., Salmon, V. G., Heikoop, J. M., Wilson, C. J., Sevanto, S., Wales, N. A., Perkins, G. B., Marina, O. C., and Wullschleger, S. D.: High nitrate variability on an Alaskan permafrost hillslope dominated by alder shrubs, The Cryosphere, 16, 1889–1901, https://doi.org/10.5194/tc-16-1889-2022, 2022.
McClelland, J. W., Holmes, R. M., Peterson, B. J., Raymond, P. A., Striegl, R. G., Zhulidov, A. V., Zimov, S. A., Zimov, N., Tank, S. E., Spencer, R. G. M., Staples, R., Gurtovaya, T. Y., and Griffin, C. G.: Particulate organic carbon and nitrogen export from major Arctic rivers, Global Biogeochem. Cycles, 30, 629–643, https://doi.org/10.1002/2015GB005351, 2016.
Mulligan, J. J.: Examination of the Sinuk iron deposits, Seward Peninsula, Alaska, with a section by Hess, H. D., U.S. Bureau of Mines Open-File Report 8-65, 34 pp., 1965.
Myers-Smith, I. H., Forbes, B. C., Wilmking, M., Hallinger, M., Lantz, T., Blok, D., Tape, K. D., Macias-Fauria, M., Sass-Klaassen, U., Lévesque, E., Boudreau, S., Ropars, P., Hermanutz, L., Trant, A., Collier, L. S., Weijers, S., Rozema, J., Rayback, S. A., Schmidt, N. M., Schaepman-Strub, G., Wipf, S., Rixen, C., Ménard, C. B., Venn, S., Goetz, S., Andreu-Hayles, L., Elmendorf, S., Ravolainen, V., Welker, J., Grogan, P., Epstein, H. E., and Hik, D. S.: Shrub expansion in tundra ecosystems: dynamics, impacts and research priorities, Environ. Res. Lett., 6, 045509, https://doi.org/10.1088/1748-9326/6/4/045509, 2011.
Neff, J.: Barium in the Ocean, in: Bioaccumulation in Marine Organisms, 79–87, ISBN 978-0-08-043716-3, 2002.
Nossov, D. R., Hollingsworth, T. N., Ruess, R. W., and Kielland, K.: Development of Alnus tenuifolia stands on an Alaskan floodplain: patterns of recruitment, disease and succession, J. Ecol., 99, 621–633, https://doi.org/10.1111/j.1365-2745.2010.01792.x, 2011.
O'Donnell, J. A., Douglas, T., Barker, A., and Guo, L.: Changing Biogeochemical Cycles of Organic Carbon, Nitrogen, Phosphorus, and Trace Elements in Arctic Rivers, in: Arctic Hydrology, Permafrost and Ecosystems, Springer, Cham, 315–348, ISBN 978-3-030-50930-9, 2021.
Park, H., Tanoue, M., Sugimoto, A., Ichiyanagi, K., Iwahana, G., and Hiyama, T.: Quantitative Separation of Precipitation and Permafrost Waters Used for Evapotranspiration in a Boreal Forest: A Numerical Study Using Tracer Model, J. Geophys. Res.-Biogeo., 126, e2021JG006645, https://doi.org/10.1029/2021JG006645, 2021.
Parkhurst, D. and Appelo, C. A. J.: Description of input and examples for PHREEQC version 3: a computer program for speciation, batch-reaction, one-dimensional transport, and inverse geochemical calculations, U.S. Geological Survey [code], Reston, VA, https://www.usgs.gov/software/phreeqc-version-3 (last access: 5 September 2023), 2013.
Patzner, M. S., Kainz, N., Lundin, E., Barczok, M., Smith, C., Herndon, E., Kinsman-Costello, L., Fischer, S., Straub, D., Kleindienst, S., Kappler, A., and Bryce, C.: Seasonal Fluctuations in Iron Cycling in Thawing Permafrost Peatlands, Environ. Sci. Technol., 56, 4620–4631, https://doi.org/10.1021/acs.est.1c06937, 2022.
Perdrial, J. N., Perdrial, N., Vazquez-Ortega, A., Porter, C., Leedy, J., and Chorover, J.: Experimental Assessment of Passive Capillary Wick Sampler Suitability for Inorganic Soil Solution Constituents, Soil Sci. Soc. Am. J., 78, 486–495, https://doi.org/10.2136/sssaj2013.07.0279, 2014.
Petrone, K. C., Hinzman, L. D., Shibata, H., Jones, J. B., and Boone, R. D.: The influence of fire and permafrost on sub-arctic stream chemistry during storms, Hydrol. Process., 21, 423–434, https://doi.org/10.1002/hyp.6247, 2007.
Philben, M., Zheng, J., Bill, M., Heikoop, J. M., Perkins, G., Yang, Z., Wullschleger, S. D., Graham, D. E., and Gu, B.: Stimulation of anaerobic organic matter decomposition by subsurface organic N addition in tundra soils, Soil Biol. Biochem., 130, 195–204, https://doi.org/10.1016/j.soilbio.2018.12.009, 2019.
Philben, M., Taş, N., Chen, H., Wullschleger, S. D., Kholodov, A., Graham, D. E., and Gu, B.: Influences of Hillslope Biogeochemistry on Anaerobic Soil Organic Matter Decomposition in a Tundra Watershed, J. Geophys. Res.-Biogeo., 125, e2019JG005512, https://doi.org/10.1029/2019JG005512, 2020.
Prowse, T., Bring, A., Mård, J., and Carmack, E.: Arctic Freshwater Synthesis: Introduction, J. Geophys. Res.-Biogeo., 120, 2121–2131, https://doi.org/10.1002/2015JG003127, 2015a.
Prowse, T., Bring, A., Mård, J., Carmack, E., Holland, M., Instanes, A., Vihma, T., and Wrona, F. J.: Arctic Freshwater Synthesis: Summary of key emerging issues, J. Geophys. Res.-Biogeo., 120, 1887–1893, https://doi.org/10.1002/2015JG003128, 2015b.
R Core Team: R: A Language and Environment for Statistical Computing [code], https://www.r-project.org/ (last access: 5 September 2023), 2020.
Raudina, T. V., Loiko, S. V., Lim, A. G., Krickov, I. V., Shirokova, L. S., Istigechev, G. I., Kuzmina, D. M., Kulizhsky, S. P., Vorobyev, S. N., and Pokrovsky, O. S.: Dissolved organic carbon and major and trace elements in peat porewater of sporadic, discontinuous, and continuous permafrost zones of western Siberia, Biogeosciences, 14, 3561–3584, https://doi.org/10.5194/bg-14-3561-2017, 2017.
Raynolds, M. K.: A raster version of the Circumpolar Arctic Vegetation Map (CAVM), Remote Sens. Environ., 12, 111297, https://doi.org/10.1016/j.rse.2019.111297, 2019.
Romanovsky, V., Cable, W., and Dolgikh, K.: Soil Temperature and Moisture, Kougarok Road Mile Marker 64, Seward Peninsula, Alaska, beginning 2016, NGEE Arctic [data set], https://doi.org/10.5440/1581586, 2021a.
Romanovsky, V., Cable, W., and Dolgikh, K.: Soil Temperature and Moisture, Teller Road Mile Marker 27, Seward Peninsula, Alaska, beginning 2016, NGEE Arctic [data set], https://doi.org/10.5440/1581437, 2021b.
Rowland, J. C., Jones, C. E., Altmann, G., Bryan, R., Crosby, B. T., Hinzman, L. D., Kane, D. L., Lawrence, D. M., Mancino, A., Marsh, P., McNamara, J. P., Romanvosky, V. E., Toniolo, H., Travis, B. J., Trochim, E., Wilson, C. J., and Geernaert, G. L.: Arctic Landscapes in Transition: Responses to Thawing Permafrost, Eos Trans. AGU, 91, 229–230, https://doi.org/10.1029/2010EO260001, 2010.
Salmon, V. G., Breen, A. L., Kumar, J., Lara, M. J., Thornton, P. E., Wullschleger, S. D., and Iversen, C. M.: Alder Distribution and Expansion Across a Tundra Hillslope: Implications for Local N Cycling, Front. Plant Sci., 10, 1099, https://doi.org/10.3389/fpls.2019.01099, 2019.
Shogren, A. J., Zarnetske, J. P., Abbott, B. W., Iannucci, F., Frei, R. J., Griffin, N. A., and Bowden, W. B.: Revealing biogeochemical signatures of Arctic landscapes with river chemistry, Sci. Rep., 9, 12894, https://doi.org/10.1038/s41598-019-49296-6, 2019.
Sjöberg, Y., Jan, A., Painter, S. L., Coon, E. T., Carey, M. P., O'Donnell, J. A., and Koch, J. C.: Permafrost promotes shallow groundwater flow and warmer headwater streams, Water Res., 57, e2020WR027463, https://doi.org/10.1029/2020WR027463, 2020.
Sparks, D. L.: Environmental soil chemistry, 2nd edn., Academic Press, Amsterdam; Boston, 352 pp., ISBN 0126564469, 2003.
Spence, C., Kokelj, S., McCluskie, M., and Hedstrom, N.: Impacts of Hydrological and Biogeochemical Process Synchrony Transcend Scale, American Geophysical Union, Fall Meeting 2015, H13F-1603, 2015.
Sturm, M., Racine, C., and Tape, K.: Increasing shrub abundance in the Arctic, Nature, 411, 546–547, https://doi.org/10.1038/35079180, 2001.
Sulman, B. N., Salmon, V. G., Iversen, C. M., Breen, A. L., Yuan, F., and Thornton, P. E.: Integrating Arctic Plant Functional Types in a Land Surface Model Using Above- and Belowground Field Observations, J. Adv. Model. Earth Sy., 13, e2020MS002396, https://doi.org/10.1029/2020MS002396, 2021.
Tape, K., Sturm, M., and Racine, C.: The evidence for shrub expansion in Northern Alaska and the Pan-Arctic: Shrub Expansion in Northern Alaska and Pan-Arctic, Glob. Change Biol., 12, 686–702, https://doi.org/10.1111/j.1365-2486.2006.01128.x, 2006.
Tape, K. D., Hallinger, M., Welker, J. M., and Ruess, R. W.: Landscape Heterogeneity of Shrub Expansion in Arctic Alaska, Ecosystems, 15, 711–724, https://doi.org/10.1007/s10021-012-9540-4, 2012.
Till, A. B., Dumoulin, J. A., Werdon, M. B., and Bleick, H. A.: Bedrock geologic map of the Seward Peninsula, Alaska, and accompanying conodont data: U.S. Geological Survey Scientific Investigations Map 3131, 2 sheets, scale 1:500,000, 1 pamphlet, 75 pp., and database, https://pubs.usgs.gov/sim/3131/ (last access: 5 September 2023), 2011.
Viollier, E., Inglett, P. W., Hunter, K., Roychoudhury, A. N., and Van Cappellen, P.: The ferrozine method revisited: Fe(II)/Fe(III) determination in natural waters, Appl. Geochem., 15, 785–790, https://doi.org/10.1016/S0883-2927(99)00097-9, 2000.
Vonk, J. E., Tank, S. E., Bowden, W. B., Laurion, I., Vincent, W. F., Alekseychik, P., Amyot, M., Billet, M. F., Canário, J., Cory, R. M., Deshpande, B. N., Helbig, M., Jammet, M., Karlsson, J., Larouche, J., MacMillan, G., Rautio, M., Walter Anthony, K. M., and Wickland, K. P.: Reviews and syntheses: Effects of permafrost thaw on Arctic aquatic ecosystems, Biogeosciences, 12, 7129–7167, https://doi.org/10.5194/bg-12-7129-2015, 2015.
Vonk, J. E., Tank, S. E., and Walvoord, M. A.: Integrating hydrology and biogeochemistry across frozen landscapes, Nat. Commun., 10, 5377, https://doi.org/10.1038/s41467-019-13361-5, 2019.
Walker, D. A., Breen, A. L., Druckenmiller, L. A., Wirth, L. W., Fisher, W., Raynolds, M. K., Šibík, J., Walker, M. D., Hennekens, S., Boggs, K., Boucher, T., Buchhorn, M., Bültmann, H., Cooper, D. J., Daniëls, F. J. A., Davidson, S. J., Ebersole, J. J., Elmendorf, S. C., Epstein, H. E., Gould, W. A., Hollister, R. D., Iversen, C. M., Jorgenson, M. T., Kade, A., Lee, M. T., MacKenzie, W. H., Peet, R. K., Peirce, J. L., Schickhoff, U., Sloan, V. L., Talbot, S. S., Tweedie, C. E., Villarreal, S., Webber, P. J., and Zona, D.: The Alaska Arctic Vegetation Archive (AVA-AK), Phytocoenologia, 46, 221–229, https://doi.org/10.1127/phyto/2016/0128, 2016.
Wallenberger, F. T. and Bingham, P. A. (Eds.): Fiberglass and Glass Technology, Springer US, Boston, MA, https://doi.org/10.1007/978-1-4419-0736-3, 2010.
Walvoord, M. A. and Kurylyk, B. L.: Hydrologic Impacts of Thawing Permafrost-A Review, Vadose Zone J., 15, vzj2016.01.0010, https://doi.org/10.2136/vzj2016.01.0010, 2016.
Weiss, M., Hobbie, S. E., and Gettel, G. M.: Contrasting Responses of Nitrogen-Fixation in Arctic Lichens to Experimental and Ambient Nitrogen and Phosphorus Availability, Arctic, Antarctic, and Alpine Research, 37, 396–401, https://doi.org/10.1657/1523-0430(2005)037[0396:CRONIA]2.0.CO;2, 2005.
Wilson, C., Bolton, R., Busey, R., Lathrop, E., Dann, J., and Bennett, K.: End-of-Winter Snow Depth, Temperature, Density and SWE Measurements at Kougarok Road Site, Seward Peninsula, Alaska, 2018, NGEE Arctic [data set], https://doi.org/10.5440/1593874, 2020a.
Wilson, C., Bolton, R., Busey, R., Lathrop, E., Dann, J., Charsley-Groffman, L., and Bennett, K.: End-of-Winter Snow Depth, Temperature, Density and SWE Measurements at Teller Road Site, Seward Peninsula, Alaska, 2016–2018, NGEE Arctic [data set], https://doi.org/10.5440/1592103, 2020b.
Wilson, C., Dann, J., Bolton, R., Charsley-Groffman, L., Jafarov, E., Musa, D., and Wullschleger, S.: In Situ Soil Moisture and Thaw Depth Measurements Coincident with Airborne SAR Data Collections, Barrow and Seward Peninsulas, Alaska, 2017, NGEE Arctic [data set], https://doi.org/10.5440/1423892, 2021.
Wrona, F. J., Johansson, M., Culp, J. M., Jenkins, A., Mård, J., Myers-Smith, I. H., Prowse, T. D., Vincent, W. F., and Wookey, P. A.: Transitions in Arctic ecosystems: Ecological implications of a changing hydrological regime: Terrestrial and Freshwater Ecosystems, J. Geophys. Res.-Biogeo., 121, 650–674, https://doi.org/10.1002/2015JG003133, 2016.
Wullschleger, S. D., Epstein, H. E., Box, E. O., Euskirchen, E. S., Goswami, S., Iversen, C. M., Kattge, J., Norby, R. J., Van Bodegom, P. M., and Xu, X.: Plant functional types in Earth system models: past experiences and future directions for application of dynamic vegetation models in high-latitude ecosystems, Ann. Bot.-London, 114, 1–16, https://doi.org/10.1093/aob/mcu077, 2014.
Yang, D., Meng, R., Morrison, B. D., McMahon, A., Hantson, W., Hayes, D. J., Breen, A. L., Salmon, V. G., and Serbin, S. P.: A Multi-Sensor Unoccupied Aerial System Improves Characterization of Vegetation Composition and Canopy Properties in the Arctic Tundra, Remote Sensing, 12, 2638, https://doi.org/10.3390/rs12162638, 2020.
Yang, D., Morrison, B. D., Hantson, W., Breen, A. L., McMahon, A., Li, Q., Salmon, V. G., Hayes, D. J., and Serbin, S. P.: Landscape-scale characterization of Arctic tundra vegetation composition, structure, and function with a multi-sensor unoccupied aerial system, Environ. Res. Lett., 16, 085005, https://doi.org/10.1088/1748-9326/ac1291, 2021.