the Creative Commons Attribution 4.0 License.
the Creative Commons Attribution 4.0 License.
 | 13 Sep 2023
Modeling of surface energy balance for Icelandic glaciers using remote-sensing albedo
Sigurdur M. Gardarsson
Finnur Pálsson
During the melt season, absorbed solar energy, modulated at the surface by albedo, is one of the main governing factors controlling surface melt variability for glaciers in Iceland. An energy balance model was applied with the possibility of utilizing spatiotemporal Moderate Resolution Imaging Spectroradiometer (MODIS) satellite-derived daily surface albedo driven by high-resolution climate forcing data to reconstruct the surface energy balance (SEB) for all Icelandic glaciers for the period 2000–2021. The SEB was reconstructed from April through September for 2000–2021 at a daily time step with a 500 m spatial resolution. Validation was performed using observations from various glaciers spanning distinct locations and elevations with good visual and statistical agreement. The results show that spatiotemporal patterns for the melt season have high annual and interannual variability for Icelandic glaciers. The variability was influenced by high climate variability, deposition of light-absorbing particles (LAPs) from volcanic eruptions and dust hotspots in pro-glacial areas close to the glaciers. Impacts of LAPs can lead to significant melt enhancement due to lowering of albedo and increased short-wave radiative energy forced at the surface. Large impacts on the SEB were observed for years with high LAP deposits, such as the volcanic eruption years of 2004, 2010 and 2011 and the sand- and dust-rich year of 2019. The impacts of volcanic eruptions and other LAP events were estimated using historical mean albedo under the same climatology forcing to provide estimations of melt energy enhancements. The impact of LAPs was often significant even though the glaciers were far away from the eruption location. On average, the melt enhancements due to LAPs were ∼27 % in 2010, ∼16 % in 2011 and ∼14 % in 2019 for Vatnajökull, Hofsjökull and Langjökull.
- Article
(19167 KB) - Full-text XML
- BibTeX
- EndNote


Mass and energy balance changes in glaciers are useful indicators of changes in the cryosphere and climate (e.g., Jóhannesson, 1986; Jóhannesson et al., 1989; Slater et al., 2021). Projected future climate changes in the Northern Hemisphere would force reduction in the area and volume of existing glaciers and ice sheets, contributing significantly to global sea level rise (e.g., Gregory and Oerlemans, 1998; Zemp et al., 2019; Schmidt et al., 2020; Hofer et al., 2020; Goelzer et al., 2020). In the Northern Hemisphere, absorbed short-wave energy during the melt season is the primary energy source of surface melting of snow and glaciers (e.g., Male and Granger, 1981; Björnsson and Pálsson, 2008; Fernandes et al., 2009; Hudson, 2011; Box et al., 2012; Chen et al., 2016). Albedo of snow- and ice-covered surfaces is the unitless ratio of the radiant flux reflected from Earth's surface to the incident flux, and thus accurate representation of albedo is critical to understanding model surface melt (Schmidt et al., 2017). Changes in snow and ice cover duration and extent can magnify the effect on climate for warming and cooling due to the complex and self-enhancing ice–albedo feedback with temperature (Barnett et al., 2005; Adam et al., 2008; Choi et al., 2010; Hudson, 2011; Flanner et al., 2011; Box et al., 2012). Given the importance of snow and ice albedo as an amplifier of climate change, surface albedo has been defined as an essential climate variable and as a requirement for climate monitoring (WMO, 2011; Bojinski et al., 2014).
Iceland is an island (103 000 km2) located at major climatic boundaries in the North Atlantic Ocean, where changes in atmospheric circulation and ocean currents influence the climate. Iceland has a maritime climate with mild winters, cool summers and high average precipitation, especially in the fall and winter, sustaining a seasonal snowpack and glaciers (Einarsson, 1984; Perkins et al., 1998). The North Atlantic Current, a northeastward-flowing branch of the Gulf Stream, transports warm ocean water to the North Atlantic Subpolar Gyre, explaining milder climates at higher latitudes (Lozier et al., 1995; Rossby, 1996; Ólafsdóttir et al., 2010; Knudsen et al., 2012). Flowing along the southern and western Icelandic coast, the Irminger Current brings relatively warm Atlantic water towards Iceland, moderating the climate. The cold East Greenland Current, originating in cold polar waters, and the cold East Icelandic Current, a branch of the East Greenland Current, bring cold water masses towards the Icelandic coast in the north and east, respectively (Renner et al., 2018; Zhao et al., 2018). Associated with anthropogenic warming, global sea surface temperatures (SSTs) have been observed to increase in the past century. Future projections indicate further warming, although increased melting of the Greenland ice sheet and Arctic sea ice has been linked to local SST cooling south of Greenland, a region referred to as the North Atlantic warming hole (NAWH), with possible impacts on the surface mass balance of Icelandic glaciers (Rahmstorf et al., 2015; Alexander et al., 2018; Gervais et al., 2019; Keil et al., 2020; Noël et al., 2022).
The total area of glaciers in Iceland in 2019 was approximately 10 400 km2 (∼10 % of Iceland), containing about 3400 km3 of ice (in 2019) corresponding to ∼9 mm of potential global sea level rise (Björnsson and Pálsson, 2020; Aðalgeirsdóttir et al., 2020; Hannesdóttir et al., 2020). The mass balance of Icelandic glaciers has changed significantly over the last 3 decades, and all studies and projections indicate that the mass loss of Icelandic glaciers will continue and increase with accelerated warming in the Northern Hemisphere in the future (Jóhannesson et al., 2007; Schmidt et al., 2020; Noël et al., 2022).
Iceland has about 22 000 km2 of sandy deserts that are a major source of atmospheric dust and light-absorbing particles (LAPs) (Arnalds et al., 2016). Many of those areas are near glaciers and are sources of active dust emission defined as dust hotspots (e.g., glaciofluvial plains, sand plains). They have unstable surfaces and are prone to dust aerosol production that can deposit on snow and glacier surfaces, influencing the surface albedo and thus the radiative forcing (Björnsson and Pálsson, 2008; Wittmann et al., 2017; Dagsson-Waldhauserova et al., 2017; Gunnarsson et al., 2021).
Glacier mass and energy balance models generally do not simulate albedo changes caused by atmospheric dust and LAP deposition, as the processes involved are complex to model and dust sources can be far away from the glacier surface. In volcanic regions, eruptions can produce vast amounts of volcanic ash of diverse grain sizes, and even extremely thin tephra deposits on snow and ice surfaces can lead to significantly enhanced melt potential. However, in the cases of thick tephra layer deposits ( cm), surface melt processes can be prevented (Warren and Wiscombe, 1980; Möller et al., 2014; Wittmann et al., 2017; Möller et al., 2019; Gunnarsson et al., 2021). The majority of mass loss from glaciers in Iceland is due to surface mass balance processes. However, non-surface mass balance is non-negligible (through the processes of geothermal activity, volcanic eruptions, geothermal heat flux, calving, internal friction and water flow) even though these processes amount to only a fraction of the surface ablation (Björnsson et al., 2001, 2013; Aðalgeirsdóttir et al., 2020; Jóhannesson et al., 2020).
Research and monitoring of Icelandic glaciers is important for a range of reasons, e.g., civil security (because of jökulhlaups), subglacial volcanic activity, stability of river paths, runoff variability, long- and short-term changes due to climate change, natural variability and water resource forecasting for efficient hydropower production. Efficient water resource utilization requires forecasting on subdaily, daily and seasonal timescales for operational planning. Longer timescales (years and decades) are also important for refurbishment of older hydropower infrastructure as part of climate change adaption and development of new hydropower plants (Jóhannesson et al., 2007; Sveinsson, 2016). Hydropower production accounts for about 70 % of total energy production in Iceland. In an average hydrological year, about 50 % of inflow to reservoirs and diversions for hydropower energy production originates from annual glacier melt (Hjaltason et al., 2020). Additionally, because the current Icelandic energy system is a closed-loop system, with no import or export of energy (except for fossil fuels), high-quality forecasting capabilities are desirable.
The primary objective of this study is to understand and quantify melt season surface energy balance (SEB) for Icelandic glaciers using high-resolution meteorological climate forcing and remotely sensed glacier surface albedo from the Moderate Resolution Imaging Spectroradiometer (MODIS) sensor. The study builds on processing pipelines for albedo developed in Gunnarsson et al. (2021). This adds to the previous understanding of spatial and temporal distributions of melt energy, the main melt energy sources and the variability within and between glaciers in Iceland, and it provides insight into the melt enhancement due to volcanic eruptions and years with extensive LAP deposits. In the case of future volcanic eruptions or extensive LAP events, the presented methodology allows for rapid assessment of glacier albedo changes in near real time and the associated influence on surface energy balance, which can have a direct impact on glacier runoff and thus on hydropower production in Iceland and possibly civil infrastructure in some cases. Understanding LAP processes and impacts on SEB also aids in parameterizations of albedo for other modeling work where remotely sensed albedo may not be available, such as for historic and future modeling studies. The study also provides a comprehensive overview of the SEB of Icelandic glaciers since it is not limited to one glacier or glacier outlet as in many previous studies of surface energy balance.
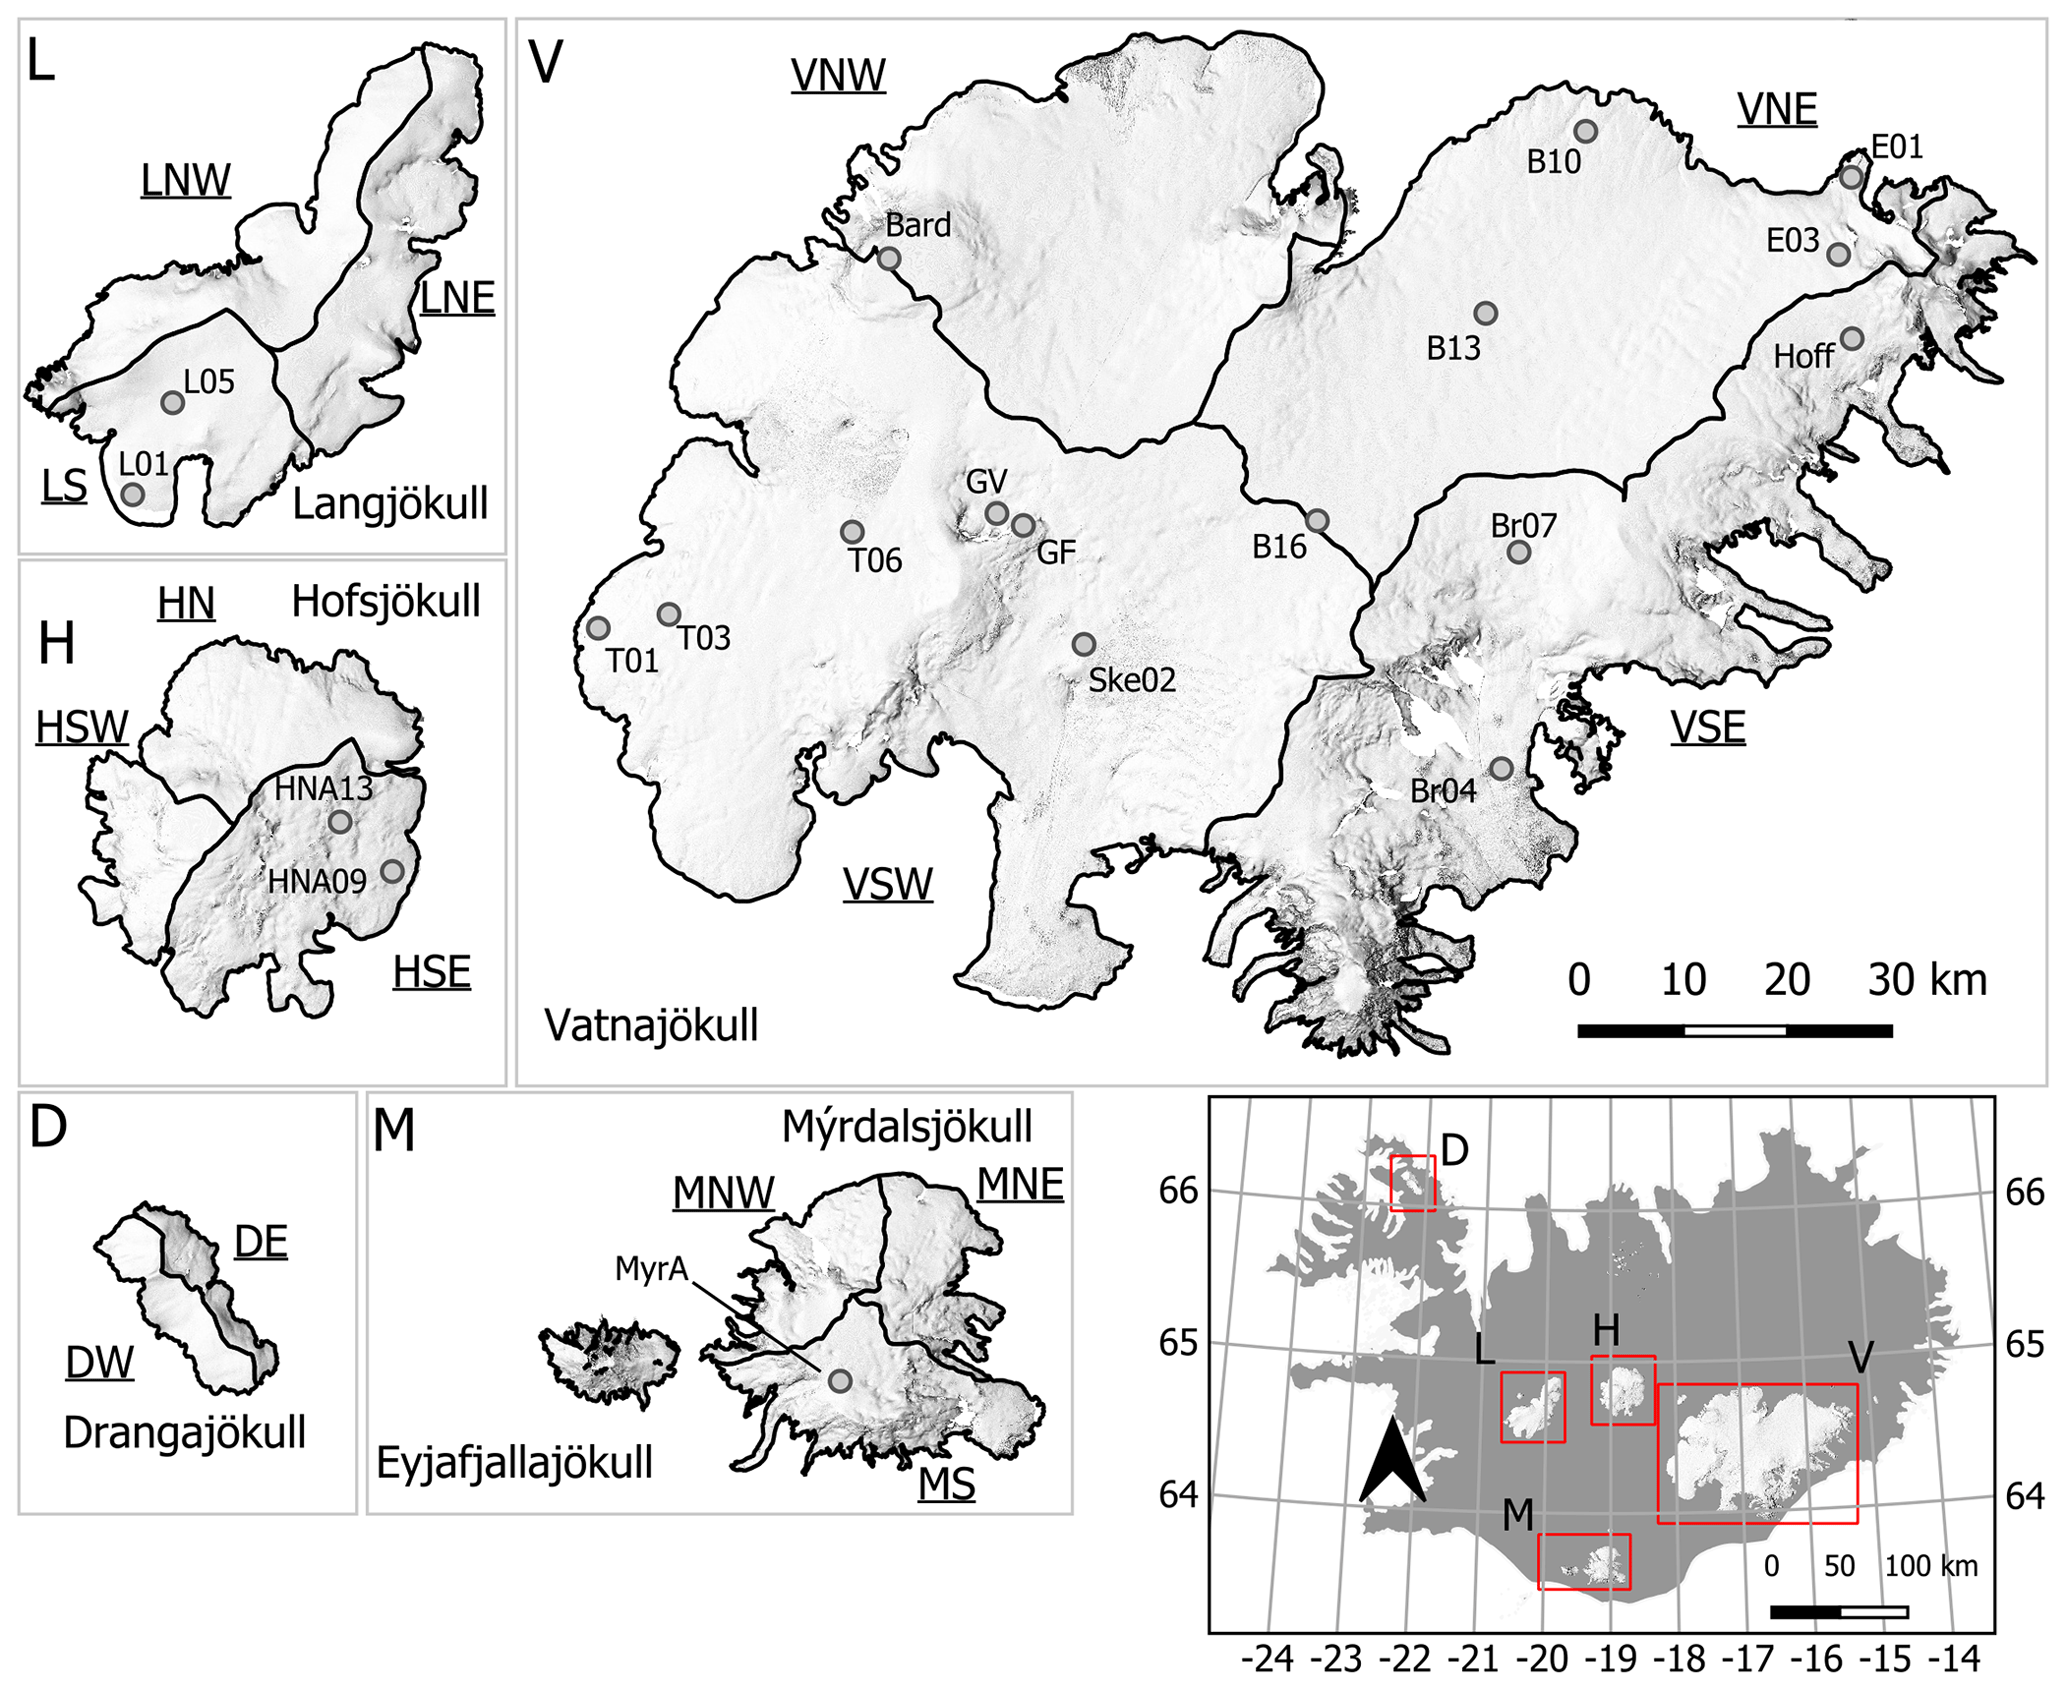
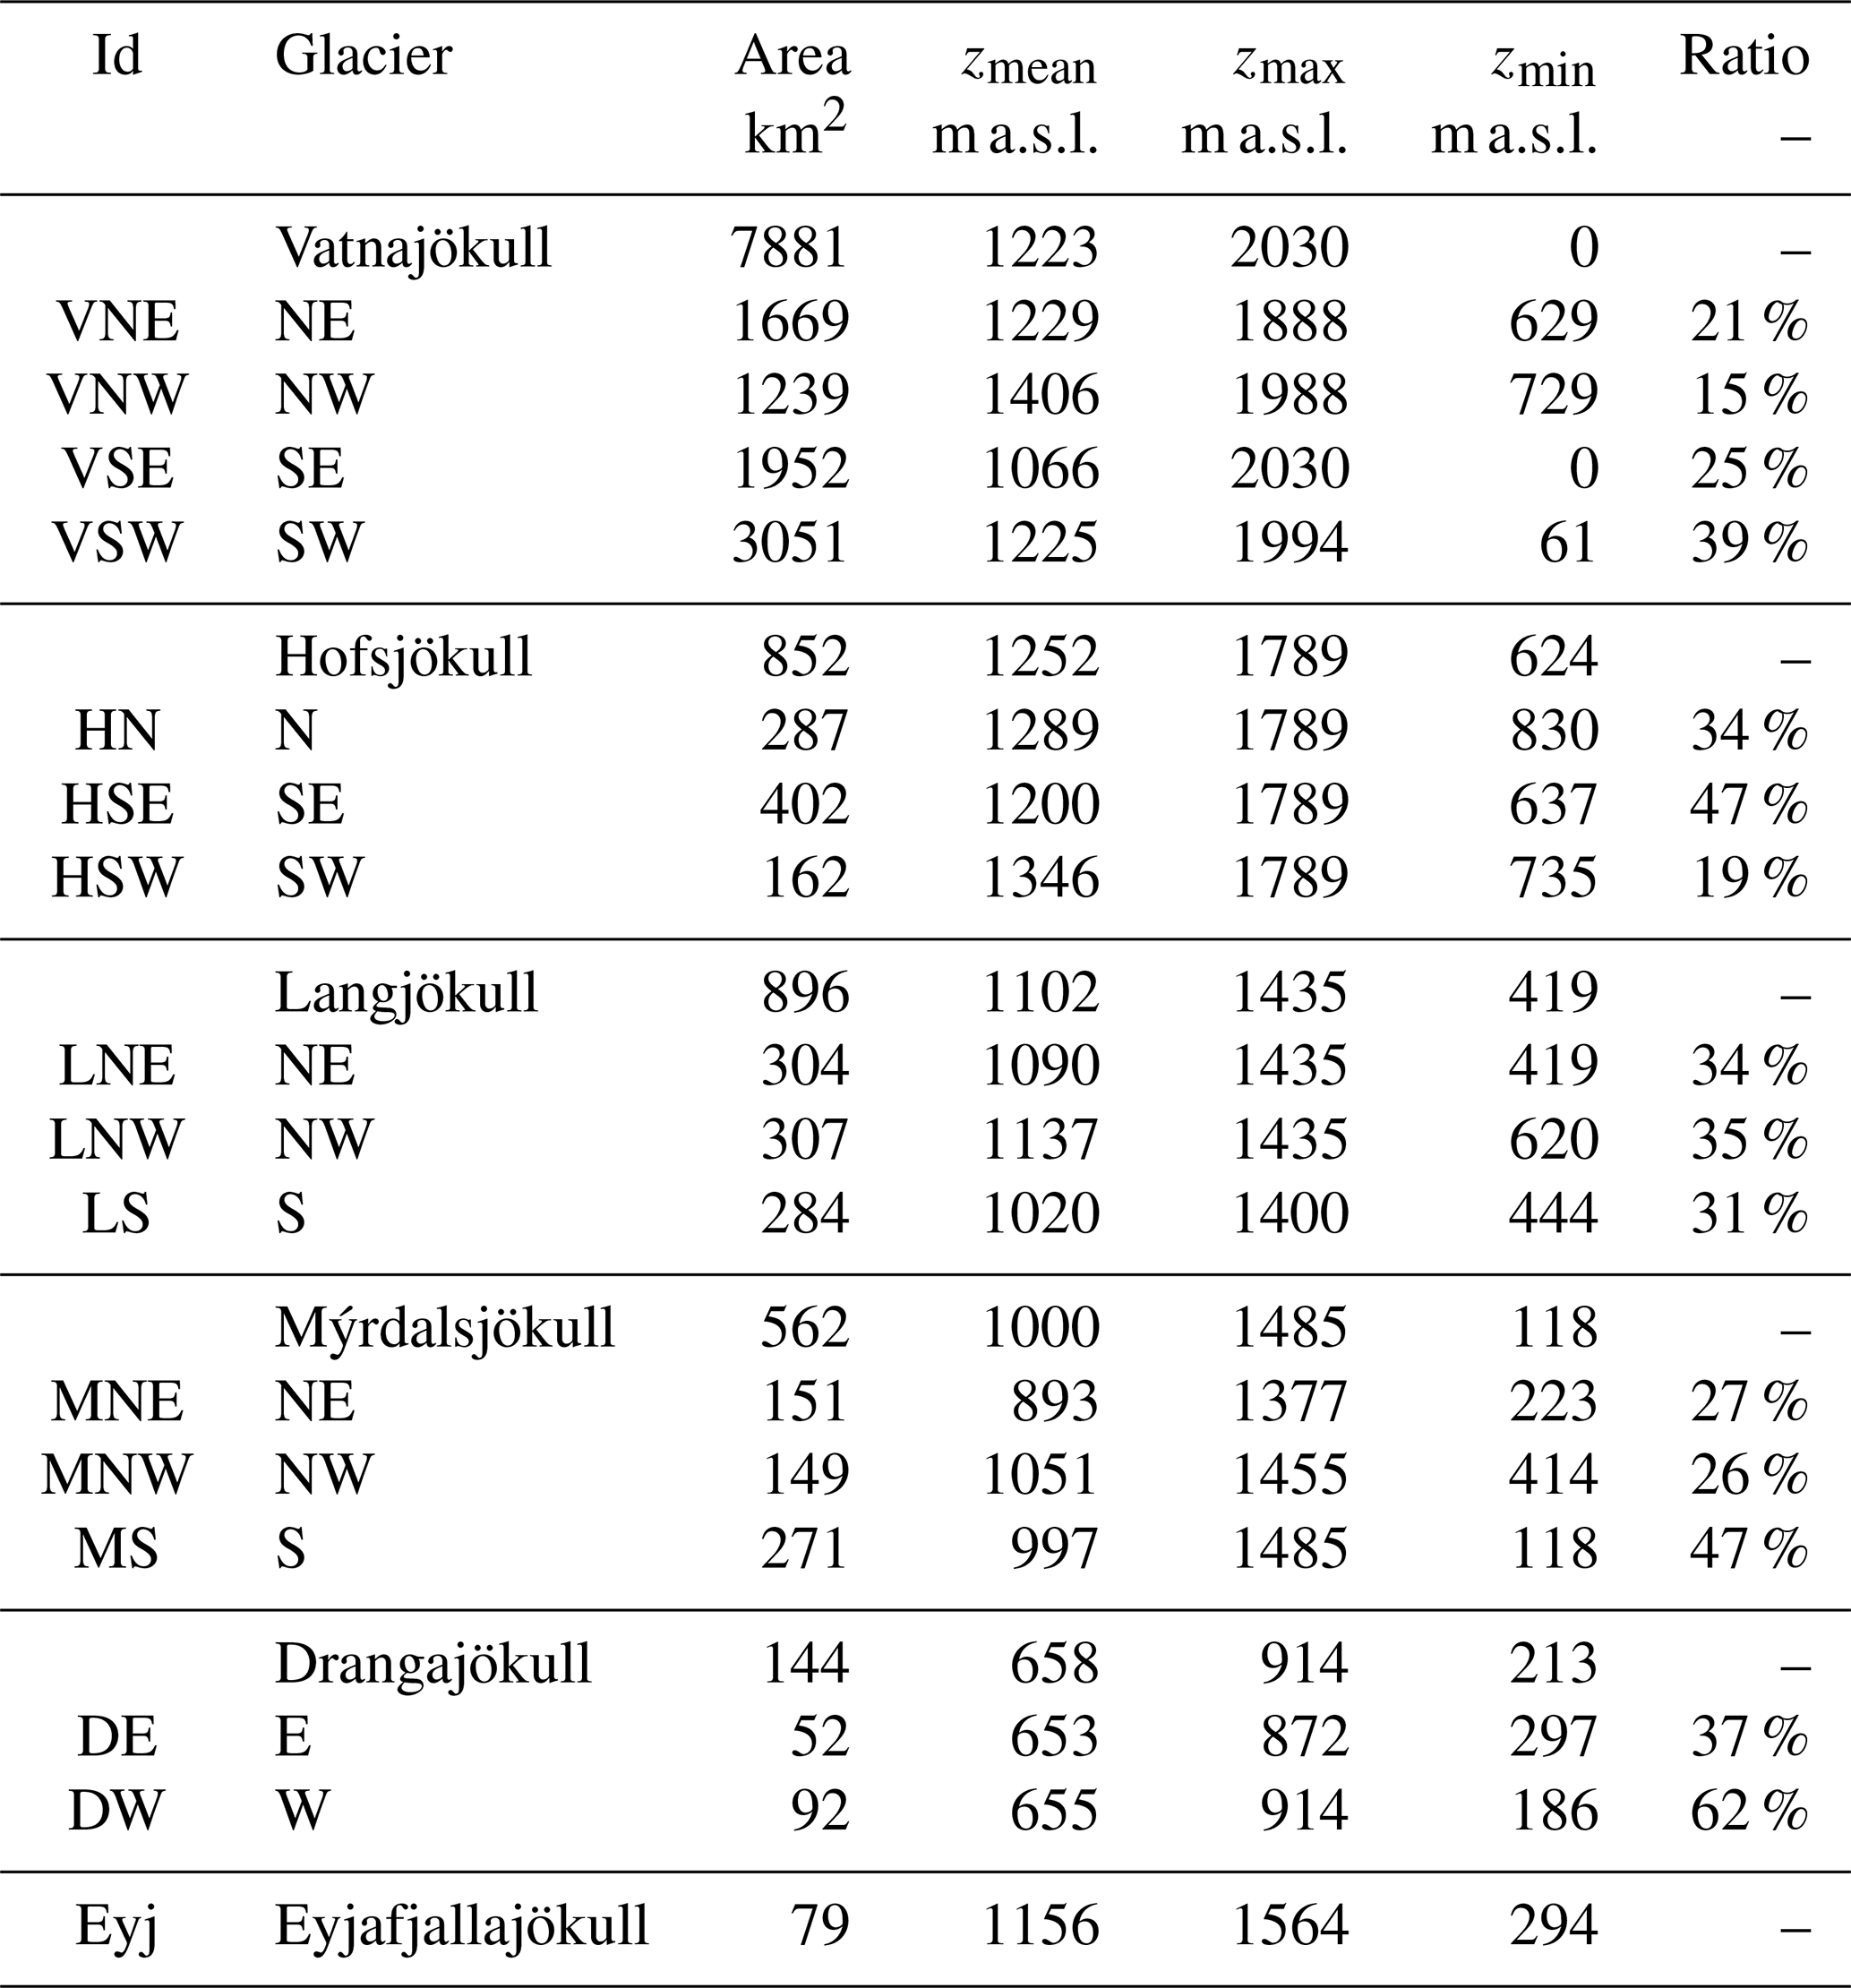
Figure 1Location map of Icelandic glaciers in this study. Vatnajökull, Langjökull, Hofsjökull, Mýrdalsjökull and Drangajökull are divided into the main ice flow basins for further detailed analysis. These delineated areas are annotated with underlined text (e.g., NW for northwest). Locations of automatic weather stations (AWSs) are shown with grey dots. Details of the AWSs are given in Table A1. Topographical properties of the ice caps and their sub-areas are listed in Table 1. The background is the shaded relief of lidar-surveyed glacier DEMs (Jóhannesson et al., 2013), and the catchment delineations are from Magnússon et al. (2016b) for Drangajökull and Björnsson (1988) for Hofsjökull, Björnsson et al. (2000a) for Mýrdalsjökull, and Pálsson et al. (2015, 2020) for Langjökull and Vatnajökull, respectively. The scale for Vatnajökull (V) applies to all the glacier maps (L, H, D, M and V).
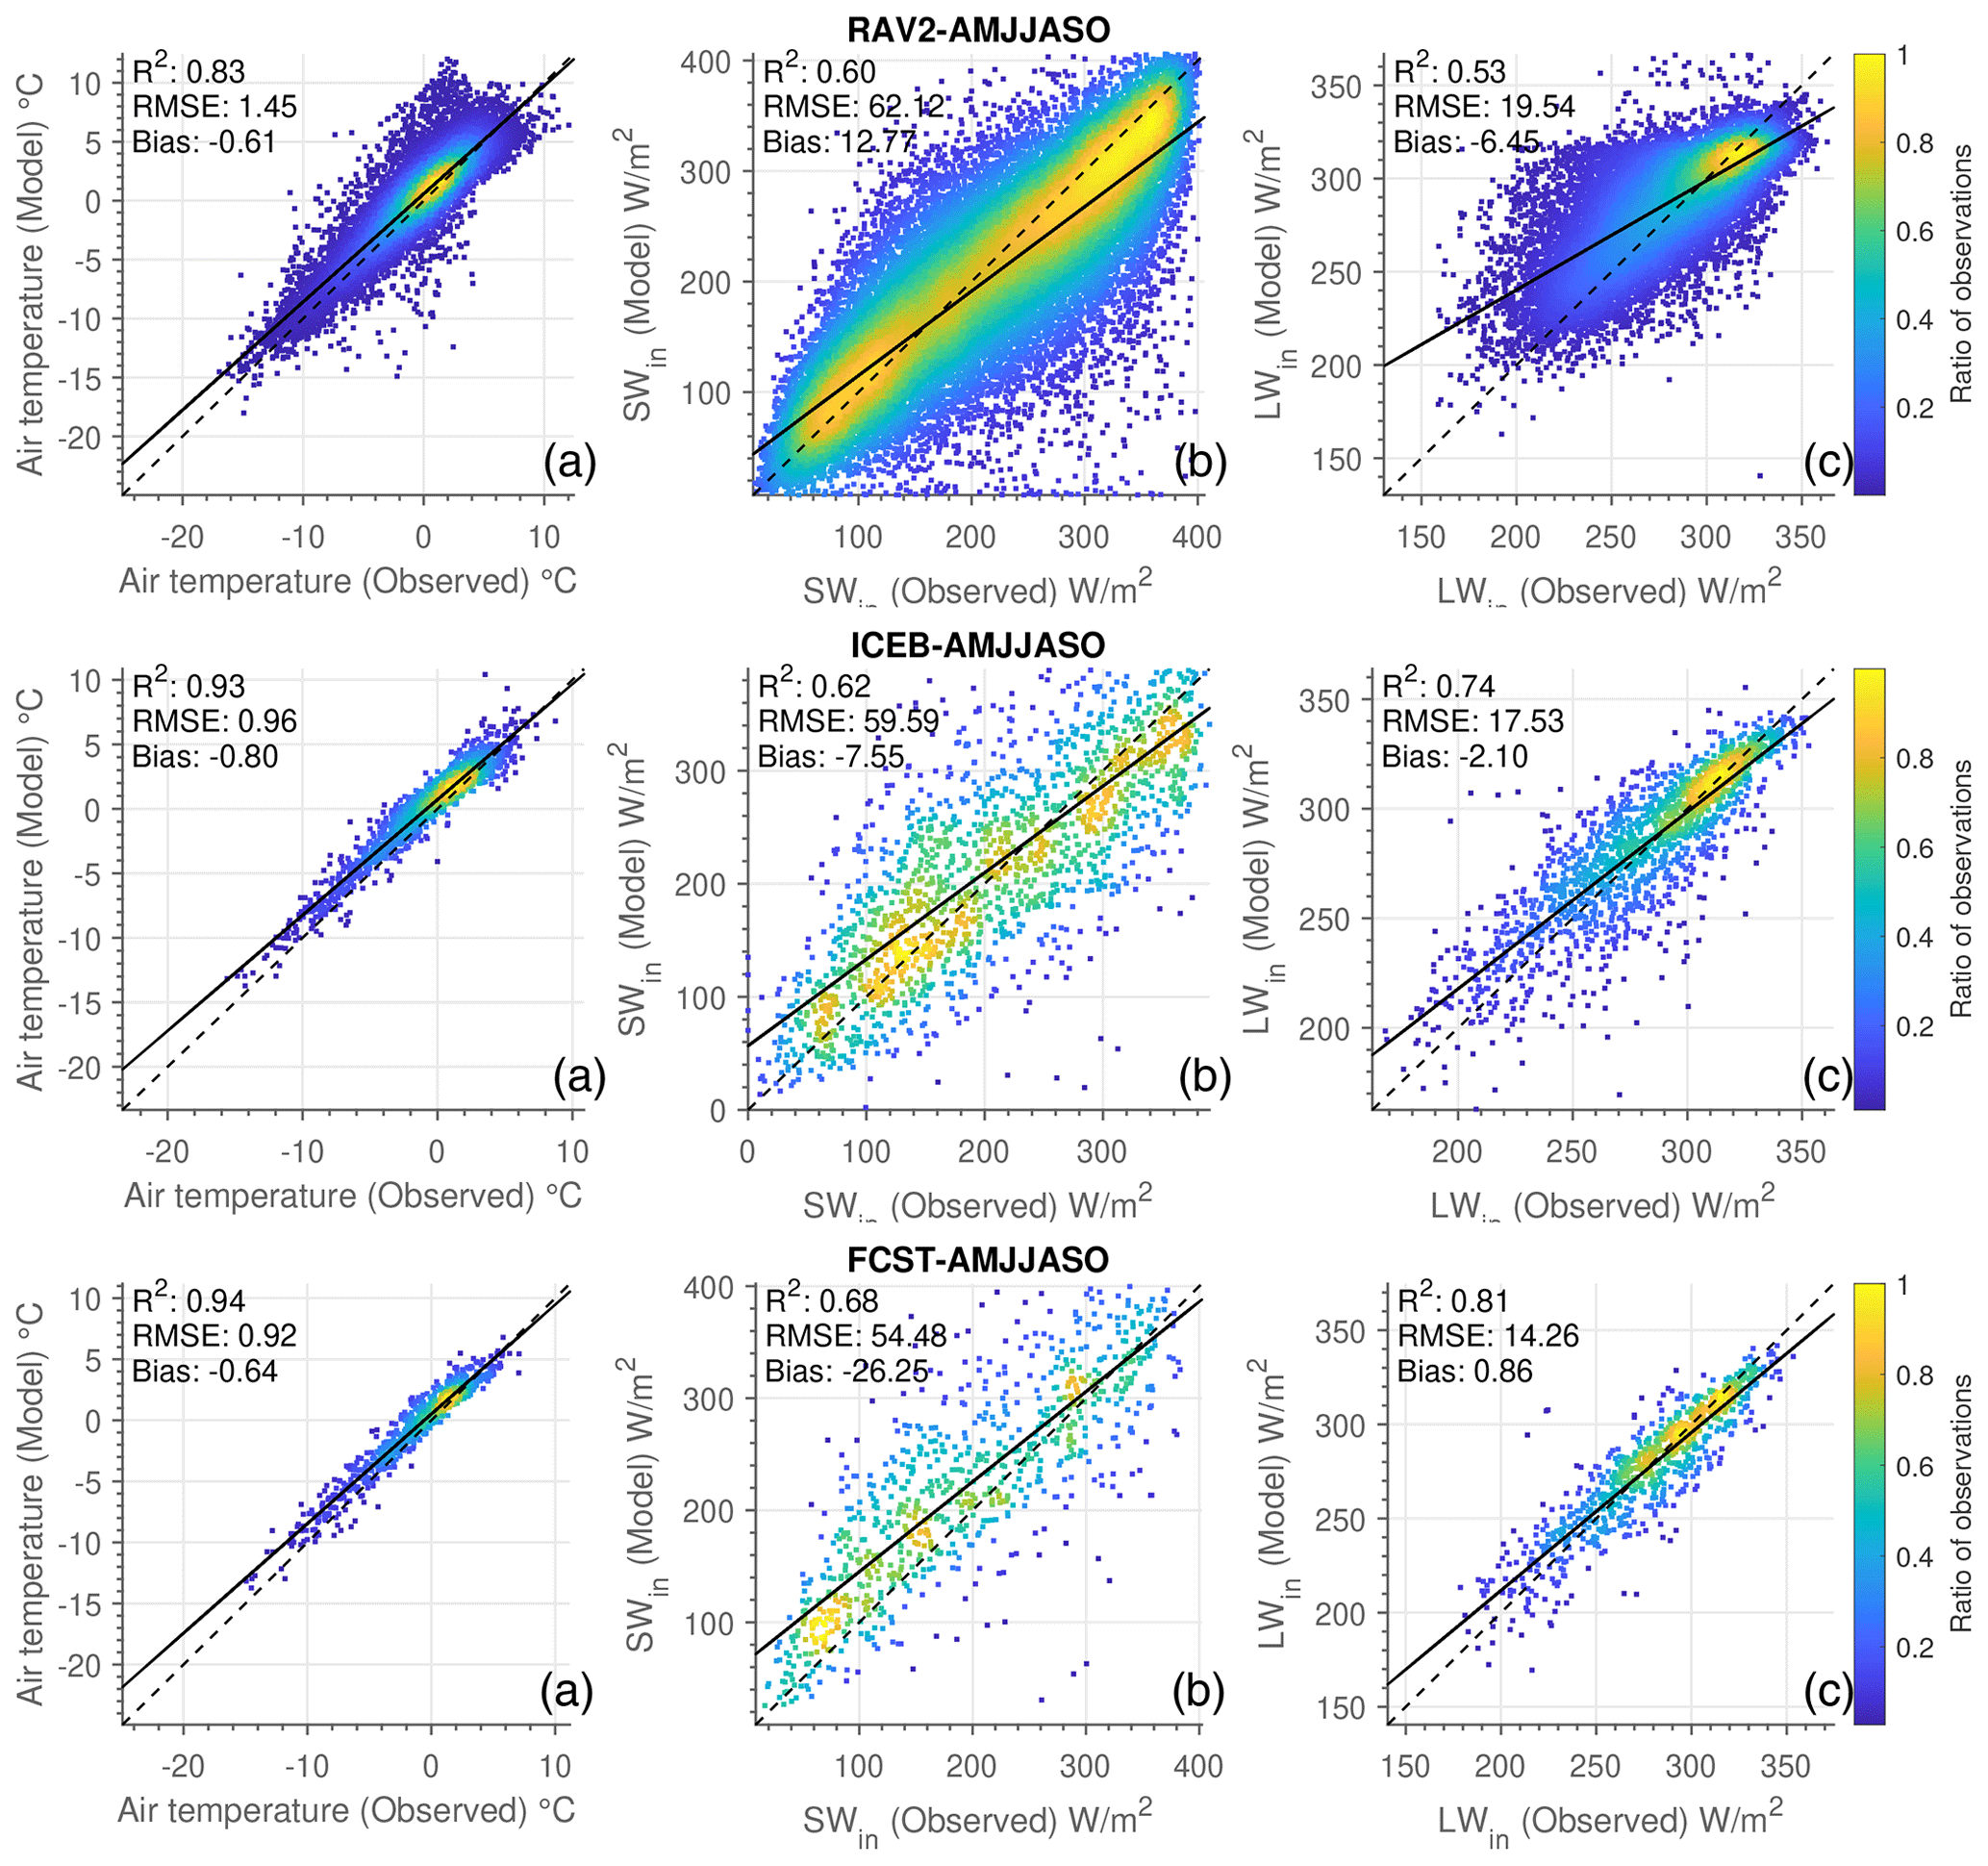
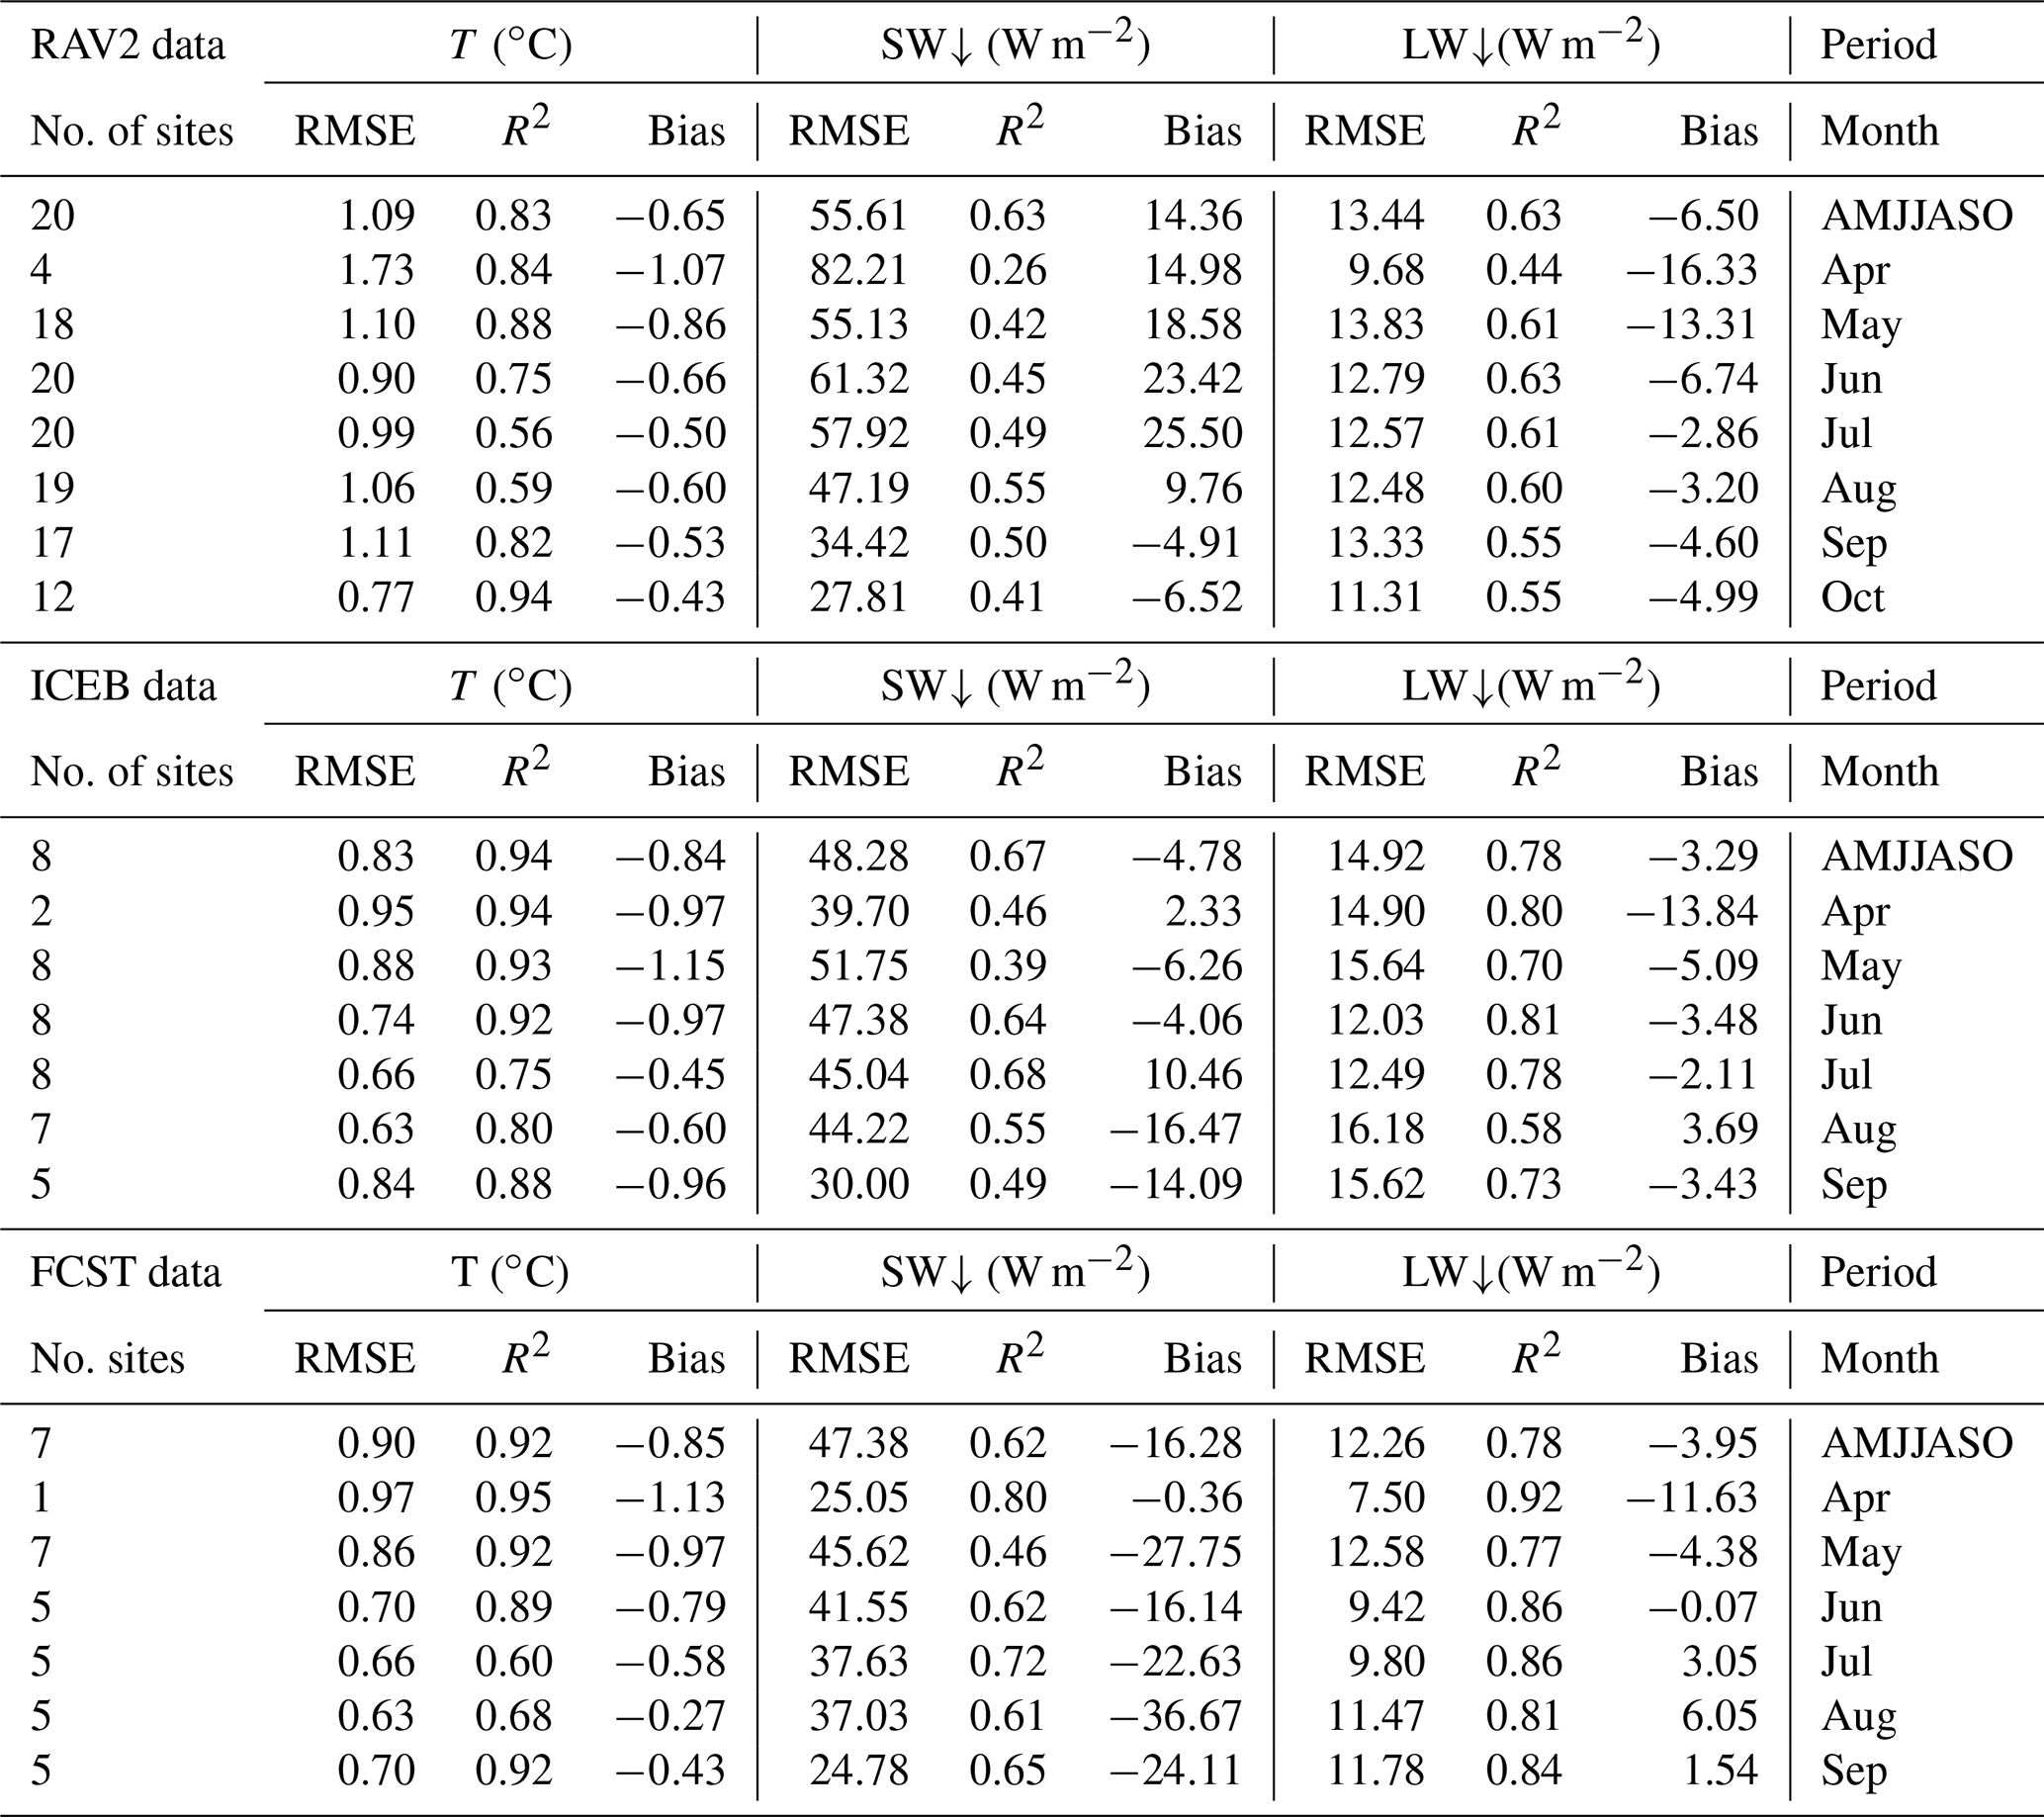
Figure 2Comparison of the downscaled daily model forcings, 2 m air temperature (a), incoming solar radiation (SW↓) (b) and incoming long-wave radiation (LW↓) (c) with ground observations from the GAWS network. Data are shown for averages from April through October (AMJJASO). Color shows the normalized (0–1) density distribution of data. Different rows indicate different data sources (RAV2, ICEB and FCST) used in the comparison; see Sect. 3.3. The dotted black line shows 1:1, and the black line shows the calculated linear fit to the data. Further details are in Table 2.
The analysis in this study covers the six largest Icelandic glaciers, i.e., Vatnajökull, Langjökull, Hofsjökull, Drangajökull, Mýrdalsjökull and Eyjafjallajökull (altogether about 97 % of the glaciated area in Iceland), although the model described in the study was applied to all the glaciers in Iceland. Figure 1 shows the outlines (black) of the six glaciers and their division into the main ice flow basins for detailed analysis. The ice flow basins are named according to the first letter of the respective ice cap and their location (e.g., VNW for the northwestern outlet of Vatnajökull). The catchment delineation is from Magnússon et al. (2016a) for Drangajökull, Björnsson (1988) and Björnsson et al. (2000b) for Hofsjökull and Mýrdalsjökull, and Pálsson and Gunnarsson (2015), Pálsson et al. (2013) and Pálsson et al. (2016) for Langjökull and Vatnajökull. The sub-areas are chosen as in Gunnarsson et al. (2021). For the six glaciers and the defined ice flow basins, topographic properties were extracted: area as well as the mean, maximum and minimum elevations, as shown in Table 1. Figure 1 also shows with grey dots the locations of the Icelandic Glacier Automatic Weather Stations (ICE-GAWS) sites used for validation purposes in this study. Glacier outlines were kept fixed throughout the study period (2000–2021) using the available delineation spanning 2007–2013 from Hannesdóttir et al. (2020). Since annual data were not available, this was selected as a midpoint representing an average glacier extent during the study period. Care must be taken when interpreting the results in glacier terminus areas, as active glaciated areas in 2000 might be dead ice or land in more recent times.
Table 1Topographic properties of the six main glacier catchments and their 15 sub-areas. The Id column refers to the subglacial areas shown in Fig. 1. Ratio defines the area percentage of each sub-area with respect to the relevant glacier total area. Elevation data are from Jóhannesson et al. (2013), and the glacier area is from Hannesdóttir et al. (2020).
Over the study period, three volcanic eruptions were observed in glaciated areas with extensive LAP deposits, affecting the SEB. In November 2004, an eruption in the subglacial volcano Grímsvötn, lasting 5–6 d, produced an estimated ∼0.06 km3 bulk volume of tephra (Jude-Eton et al., 2012; Oddsson et al., 2012). The tephra deposits from the eruption were mainly distributed northeast of Grímsvötn in a narrow plume (Oddsson et al., 2012). In 2010, an eruption in Eyjafjallajökull started on 14 April and lasted 23 d. The tephra plume, carrying an estimated volume of ∼0.27 km3 of tephra, was mostly directed towards the south and southeast (Gudmundsson et al., 2012). During the last days of the eruption, a short period of diverse wind directions brought notable LAP deposits to all the major glaciers. A second eruption occurred in Grímsvötn on 21 May 2011, lasting 7 d and releasing an estimated ∼0.8 km3 of basaltic tephra (Hreinsdóttir et al., 2014). The tephra deposits were mostly distributed south and southwest during the eruption, but a thin layer was noticeable on all of western Vatnajökull and in the regions in the southeast (Hreinsdóttir et al., 2014).
3.1 Meteorological in situ data
The ICE-GAWS network stores meteorological observations from automatic weather stations (AWSs) located at sites on Vatnajökull, Langjökull, Mýrdalsjökull and Hofsjökull since 1994, 2001, 2015 and 2016, respectively. Most of the stations were operated during the ablation season from May through September annually, but a few operate all year round. In total, 20 sites provided data for the study period; all the sites measure air temperature and incoming short-wave radiation, while 13 sites also measure incoming long-wave radiation. Details on data processing are provided in Gunnarsson et al. (2021). Table A1 provides details of the locations as well as the elevation and number of observations for each site in the Appendix, and Fig. 1 shows their locations. In the current study, observations of air temperature and short- and long-wave incoming radiation were used for validation purposes.
3.2 Surface albedo and cloud cover
For the SEB model applied in this study, snow albedo and ice surface albedo (α) were derived from MODIS data using processing models developed for Iceland by Gunnarsson et al. (2021). The products rely on the MOD10A1 (Terra satellite) and MYD10A1 (Aqua satellite) snow albedo (Scientific Data set: Snow Albedo Daily Tile) for the h17v02 grid tile, covering most of Iceland except for a small portion of the Snæfellsnes peninsula. Data were collected from the US National Snow and Ice Data Center (NSIDC) (Hall and Riggs, 2016a, b) for further processing. For the period from 23 February 2000 to 4 May 2002, albedo data were only based on Terra since Aqua was not yet in orbit. A total of 62 dates were missing for MOD10A1 and 12 for MYD10A1 for the study period (April through September each year), excluding data missing due to polar darkness from late November until late January each year. The albedo data produced in Gunnarsson et al. (2021) were based on version 6.0 of the MODIS data, but in this study they were reprocessed using version 6.1 without modifications to the processing steps.
For snow and ice surface albedo, daily merging was applied to the Terra MOD10A1 and Aqua MYD10A1 albedo data to reduce the number of cloud-obscured daily pixels; i.e., all non-cloud-obscured pixels were merged into a single tile from both products daily. Temporal aggregation was then applied to further reduce the number of cloud-obscured pixels. The temporal aggregation range was set as the number of days backwards and forwards from each center date to merge into a single stack for further processing. A temporal aggregation range of 5 d backwards or forwards was selected, allowing 11 d from both MOD10A1 and MYD10A1 to contribute data to the temporally aggregated product. This results in a total of 22 values that are potentially available for each pixel (i.e., 11 d of MOD10A1 and 11 d of MYD10A1). For each data stack containing the potential 22 values contributing albedo data, the mean was calculated to represent the daily surface albedo after median-based statistical rejection of outliers. The remaining pixels classified as clouds were classified statistically with four predicting variables, location (easting, northing), elevation (Z), and aspect, with a daily trained random forest model. Further information and details are in Gunnarsson et al. (2021).
Cloud cover data were based on the classifications of clouds in the M*D10A1 products (M*D35_L2 cloud mask). For each day the two tiles were merged, creating a daily cloud cover estimate at the time of satellite overpass (10:30 and 13:30 local time), i.e., cloud or no cloud. Data were then aggregated to monthly and melt season mean values accordingly.
3.3 Model forcing
Meteorological forcing based on the Weather Research and Forecast model (WRF version 3.6.1) coupled to the NOAH land surface model was used to provide climatological surface variables at a 2 km spatial resolution and a 1 h temporal resolution spanning the study period from 1 January 2000 to 30 September 2021. For the bulk of the period, data from the WRF-RAV2 configuration were used, developed for the climatological reanalysis RAV2 project (RAV2) (Rögnvaldsson, 2016). Since RAV2 was forced with boundary conditions from the European Centre for Medium-Range Weather Forecasts (ECMWF) ERA-Interim reanalysis (Berrisford et al., 2011), data availability overlapping the current study spans from 1 January 2000 through August 2019 due to the end of the life of ERA-Interim.
To extend the range of data availability past August 2019, the climatological reanalysis was extended with a model configuration nearly identical to RAV2, but the outer-domain boundary-condition forcing was from the Global Forecast System (GFS) from the US National Centers for Environmental Prediction (NCEP) weather forecast model (National Centers for Environmental Prediction, 2015). This product is referred to as the IceBox model configuration (ICEB) and provides data from 1 September 2018 to 1 September 2020. The IceBox model configuration was also run operationally as a forecasting system providing data four times per day that is referred to as FCST. To extend the analysis range even further, allowing the energy balance model presented here to cover the extraordinary summer weather in 2021, the forecast data from the IceBox domain starting on 1 April 2020 were aggregated to an hourly time series using the shortest forecasting step in each case. Further description of the RAV2 and IceBox model setup and output configuration is found in Rögnvaldsson (2016, 2020). Relevant meteorological surface data were extracted for use in the energy balance model, including air temperature at 2 m, wind speed, incoming long- and short-wave radiation, barometric pressure at the surface level and specific humidity; all were resampled to daily average values.
To downscale the meteorological forcing data from the 2 km WRF grid to the 463 m MODIS grid, the model uses the IslandsDEM digital elevation model from the National Land Survey of Iceland (https://atlas.lmi.is/mapview/?application=DEM, last access: 1 June 2020). A 20 m version of the elevation model was resampled to the native MODIS grid for further processing with bi-cubic interpolation using the griddata function in MATLAB (MathWorks, 2022). Elevation-dependent variables (air temperature and long-wave radiation) were adjusted for the difference between the coarse-resolution WRF DEM and the high-resolution IslandsDEM at 463 m using lapse rates. Other meteorological forcing data were downscaled with bi-cubic interpolation.
Statistical downscaling of temperature requires a temperature lapse rate often taken to be the free-air moist adiabatic lapse rate ranging from 6 to 7 K km−1 (Stone and Carlson, 1979). Hodgkins et al. (2013) investigated temperature lapse rates for outlet glaciers at Langjökull and southeastern Vatnajökull during 2003–2007. They reported mean monthly lapse rates ranging from 4.5 to 8.0 K km−1, with clear monthly variations from April to October. Generally, a higher lapse rate (6.5–8 K km−1 (mean for April, May and September of 7.0 K km−1)) was seen in spring and fall, with lower rates in summer (mean for June, July, August and September of 5.7 K km−1). This is in good agreement with results from Gardner et al. (2009) for Arctic glaciers, with an ablation seasonal mean of 4.9 K km−1. Crochet and Jóhannesson (2011) developed a one-parameter terrain model with a constant vertical lapse rate of 6.5 K km−1 with temperature observations for Iceland, excluding glaciers, validated to the ground base. Their results suggested that the assumption of a 6.5 K km−1 lapse rate was applicable in Iceland. Further work by Nawri et al. (2012) supports this. Here for glaciated areas a temperature lapse rate of 7.0 K km−1 was applied for JFMA (January–April) and SOND (September–December), while 5.5 K km−1 was applied for the active melt season, MJJA (May–August), following the results from Hodgkins et al. (2013).
Downward long-wave radiation is primarily determined by humidity and temperature vertical atmospheric profiles and thus is a function of elevation (Plüss and Ohmura, 1997; Ohmura, 2001). Hinkelman et al. (2015) used a constant long-wave radiation gradient of 29 W m−2 km−1 to correct for varying elevation (Marty et al., 2002). Enhancement of long-wave radiation by surrounding terrain emission is important when sky radiation is low, e.g., in cold and dry atmospheres generally at high elevations with steep topography (Sicart et al., 2006). In this study no adjustments were made to account for the enhancement of long-wave radiation due to terrain emission, as the effect is small on the large concave ice caps investigated. A lapse rate of 29 W m−2 km−1 was used for elevation difference adjustment between the WRF and MODIS grids.
In many studies, incoming short-wave radiance is separated into beam and diffuse components and corrections are made for terrain elevation, slope and tree-cover fractions (Bair et al., 2016; Rittger et al., 2016). Here, since the WRF data only provide total incoming short-wave radiation, no adjustments were made in this regard.
3.4 Surface energy balance
The physical processes driving surface melt over snow- and ice-covered surfaces are isolated using estimations of the SEB at a daily time step with a spatial resolution of 463 m. The SEB model used in this study was adopted from that of van As et al. (2005), which has previously been used on weather station data on the Greenland ice sheet (Van As, 2011; Charalampidis et al., 2015; van As et al., 2017; Vandecrux et al., 2018). The model was modified for the input model forcings described in the previous sections.
The SEB was closed by iteratively solving for surface temperature (Ts):
where SW↓ is the incoming short-wave radiation, α is the broadband albedo, LW↓ and LW↑ are the incoming and outgoing long-wave radiation, respectively, SHF (sensible heat flux) is the sensible heat flux, LHF is the latent heat flux, and G is the subsurface heat flux (assumed to be zero), with the fluxes defined as positive when adding energy to the surface. M is the energy surplus used for surface melt. Solutions for Ts>273.15 K indicate the availability of melt energy. If Ts was >273.15 K, Ts was set as 273.15 K and melt M was computed; otherwise, if Ts was ≤273.15 K, Ts was set to 273.15 K (0 ∘C) and no melt was assumed.
Outgoing long-wave radiation (LW↑) defines the energy emitted to space by Earth's surface and depends on surface temperature. Here, outgoing long-wave radiation was calculated based on the Stefan–Boltzmann law:
where ε is the broadband emissivity of snow and ice (0.98) (Salisbury et al., 1994) and σ is the Stefan–Boltzmann constant.
Turbulent fluxes of sensible heat SHF and latent heat LHF were estimated using the bulk aerodynamic approach with stability corrections based on Monin–Obukhov similarity theory (van As et al., 2005; Smeets and van den Broeke, 2008a). The SHF and LHF are expressed as
where ρ denotes air density, cp is the specific heat of dry air at constant pressure (1005 J K−1 kg−1), λ is the latent heat of sublimation, u* is the friction velocity, and T* and q* are turbulent scales of temperature and humidity, respectively, defined as
where κ=0.4 is the von Kármán constant; u, T and q are wind speed, air temperature and humidity at height z; and z0, zT and zq are surface roughness lengths associated with these parameters. The stability correction functions for momentum (ψm), heat (ψT) and humidity (ψq) depend on the stability parameter , where L* is the Obukhov length scale. The stability functions of Holtslag and Bruin (1988) for stable stratification and Paulson (1970) for unstable stratification are used.
Surface roughness lengths for heat and moisture were calculated for snow and ice separately as in Van As (2011). The surface roughness length for momentum (z0) varies considerably in time and space and generally is set to different constant values for snow and ice surfaces (Brock et al., 2006; Smeets and van den Broeke, 2008b). Reported values for surface roughness lengths of momentum range from 1 to 10 mm, while lower values generally apply for snow (0.1 mm) (Brock et al., 2006). Values of up to 60 mm have been reported at Breiðamerkurjökull, where ice hummocks up to almost 2 m in height can be formed during the melt season but are not representative of the majority of bare-ice areas of glaciers in Iceland (Smeets et al., 1999; Wildt et al., 2004).
Guðmundsson et al. (2009) applied z0 as 0.1, 2 and 10 mm for new snow, melting snow and ice, respectively, in the ablation zone in a SEB model for Langjökull, and Wildt et al. (2004) used similar values for Vatnajökull. Schmidt et al. (2017) applied a constant value of 1 mm for both snow and ice when modeling the energy balance for Vatnajökull. Since no data exist on the spatiotemporal variability of z0 for glaciers in Iceland, a simple classification scheme discriminating between snow and bare ice was applied based on surface albedo. For pixels with albedo values lower than or equal to 0.45 (bare ice), z0 was assigned as 3 mm; for pixels with albedo higher than 0.45, z0 was assigned as 1 mm (snow).
Potential meltwater was defined as the direct conversion of melt energy into water equivalent using the latent heat of fusion (0.26 mm d−1 / W m−2).
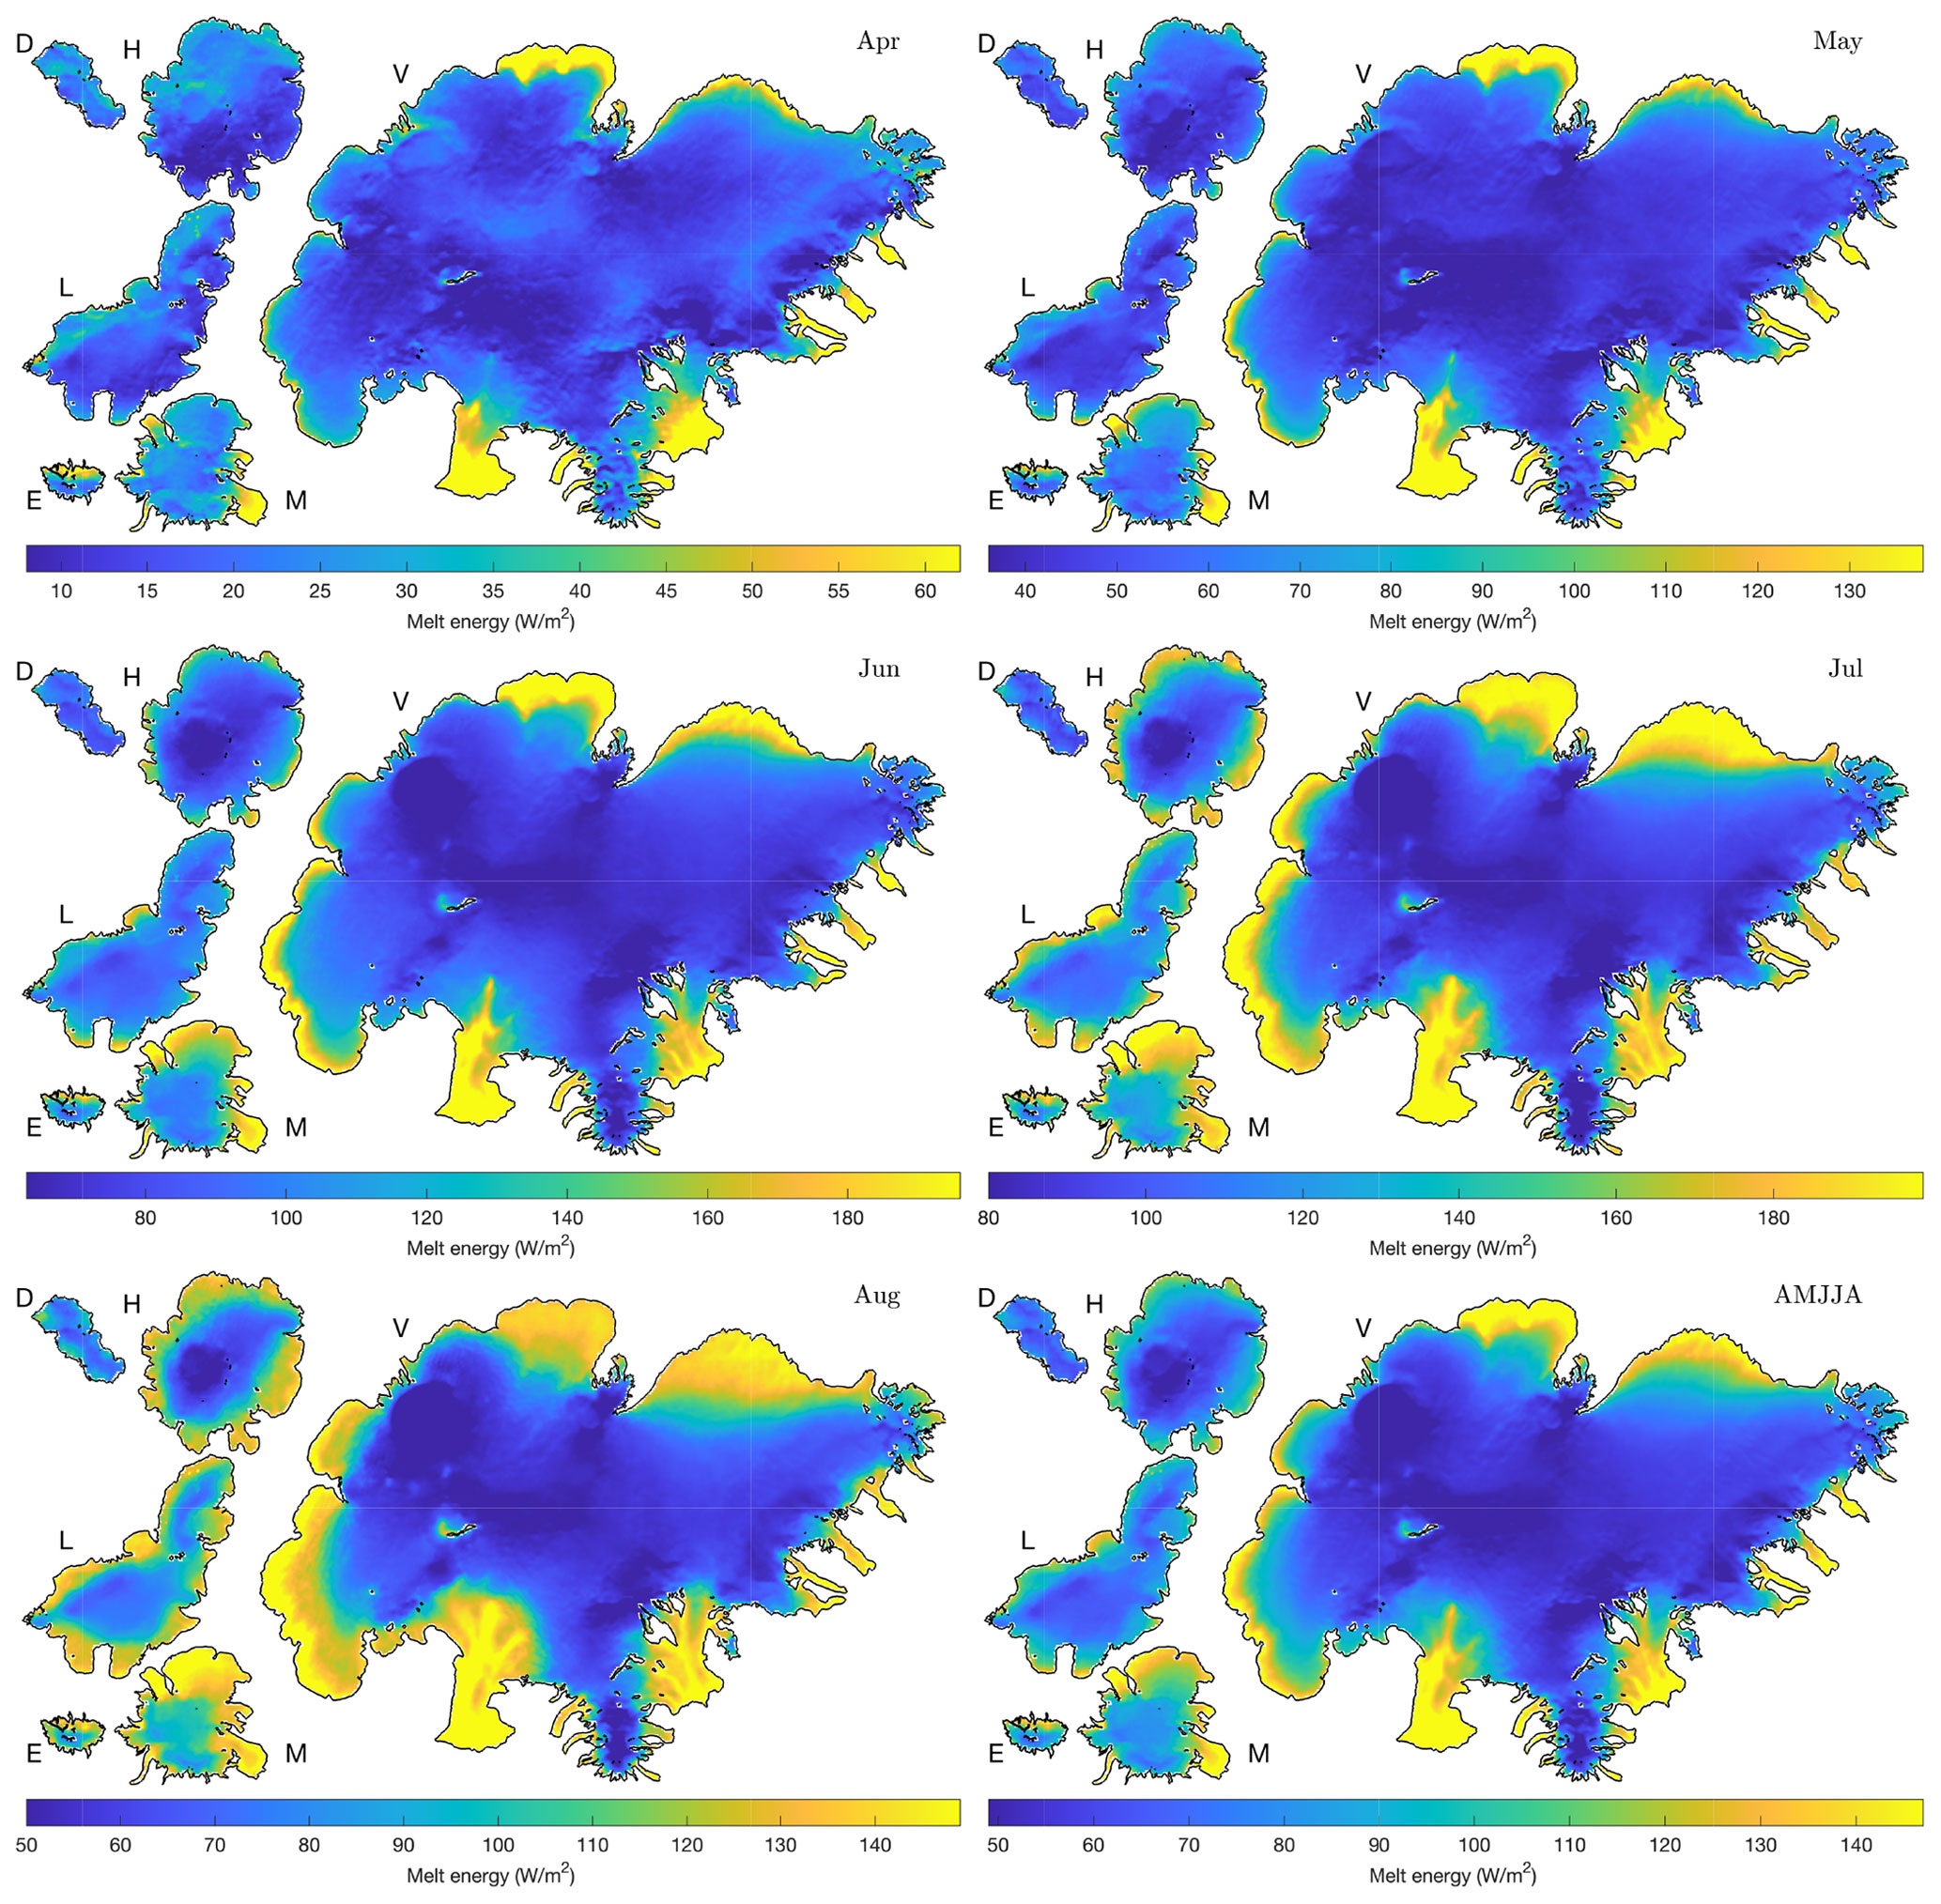
Figure 3Spatial patterns of mean melt energy for the period 2000–2019 (AMJJA). D: Drangajökull; H: Hofsjökull; V: Vatnajökull; L: Langjökull; E: Eyjafjallajökull; M: Mýrdalsjökull. Note that the color scale varies between months.
Table 2Summary statistics for daily incoming solar radiation (SW↓), incoming long-wave radiation (LW↓) and air temperature from different WRF configurations validated with ground observations. “No. of sites” refers to the number of stations that were available for comparison purposes for each period. All results for all months and the three variables SW↓, LW↓ and air temperature had a significant relationship (p<0.05).
4.1 Validation of meteorological forcings and model outputs
The downscaled meteorological forcings used for calculations of daily incoming short-wave radiation (SW↓), incoming long-wave radiation (LW↓), air temperature, outgoing short-wave radiation (SW↑), outgoing long-wave radiation (LW↑) and relative humidity (RH) from WRF were validated with in situ data. Figure 2 shows a comparison of observed and simulated daily air temperature at 2 m height, and SW↓ and LW↓ are the different WRF model configurations RAV2, ICEB and FCST. Generally, for the whole validation period, from 1 April to 30 October each year, the results show good agreement, both visually and statistically, for all the configurations and are within the ranges reported by Schmidt et al. (2017). Table 2 shows the validation results for the whole validation period, similar to Fig. 2 but also for each month within the full period. Table A2 in Appendix A shows statistical validation results for SW↑, LW↑ and relative humidity.
For air temperature, R2 is 0.83, 0.93 and 0.94 for the RAV2, ICEB and FCST configurations, respectively, for the whole period from April through October. For all the configurations, for both the full period and the monthly intervals, the temperature bias was negative in the range of −0.27 to −1.15 K. The smallest bias values were observed in July and August, with slightly higher values closer to spring. The consistent negative bias indicates that the model slightly overestimates air temperature.
Daily average SW↓ RMSE ranged from 24 to 62 W m−2, with the highest values during summer coinciding with the summer solstice. R2 is 0.63, 0.67 and 0.62 for the RAV2, ICEB and FCST configurations, respectively, for the whole period from April through October. For RAV2 the bias was mostly positive, ranging from 9 to 25 W m−2, with the exception of September and October, which have slightly negative bias values. The lower and negative values might be related to larger solar zenith angles as less incoming short-wave energy was available. During these months the contribution to melt from short-wave radiation was generally limited. For both ICEB and FCST, RMSE values were similar to results for RAV2, but bias values were more consistently negative. In this comparison, far fewer sites were available for validation because of the limited temporal range of the ICEB and FCST configurations.
LW↓ agreement was good, with RMSEs from 9 to 16 W m−2, R2 ranging from 0.44 to 0.86 and a general negative bias from −2 to −18 W m−2, with the exception of a mean bias of −16 W m−2 in April for RAV2. These outlying values might be related to the fact that spring maintenance of the ICE-GAWS stations generally takes place in late April or early May. The mean bias was consistently highest in April for all the WRF configurations and generally decreases into the summer months. The instrument-reported uncertainty in daily totals was less than 5 % (∼15 W m−2) for short-wave radiation and less than 10 % (∼30 W m−2) for long-wave radiation, which could partly explain some of the discrepancies.
Daily average RH had RMSEs ranging from 2 % to 6 % for all the WRF configurations. R2 ranged from 0.38 to 0.95, with an average value of 0.65. Bias values ranged from 4 % to 11 %. Limited temporal patterns were observed between the periods. The mean observed relative humidity from the automatic weather station network (AMJJASO) was 85.8 %, with a standard deviation of 15 % indicating limited variability. LW↑ RMSE values were similar to LW↓ (overall a bit lower), ranging from 2 to 9 W m−2. LW↑ R2 values were lower than for LW↓. Since LW↑ is a constant of ∼316 W m−2 under melting conditions (surface temperature =273.15 K), the average observed LW↓ was 306.58 W m−2 and 304.81 W m−2 for the model over the active melt season AMJJASO. SW↑, estimated through the WRF meteorological forcings and MODIS remotely sensed albedo, had an average RMSE value of 36 W m−2 (up to 70 W m−2), the average R2 was 0.47, and the negative bias was −14 W m−2. Further statistical details are in Table A2.
Overall, the performance of the different WRF configurations was similar, although it should be noted that the data period for RAV2 data spans 19 years, while far fewer data were available for validation of the ICEB (2 years) and FCST (2 years) configurations. Individual station comparison reveals no prominent patterns related to station elevation or location. Recent work by Schmidt et al. (2017) reported similar results when validating HIRHAM5 for surface mass balance calculations for Vatnajökull, while recent work by Huai et al. (2020) validating ERA-Interim and ERA5 against the PROMICE weather station network on the Greenland ice sheet reports an overall better comparison for the same statistical parameters. One explanation of the difference might relate to the lower overall cloud cover over the Greenland ice sheet compared to glaciers in Iceland, impacting weather simulations. Another explanation might relate to the fact that PROMICE short-wave radiation data are post-processed to adjust for station tilting, as inaccurate measurements in clear-sky conditions are expected, giving rise to better comparison (Van As, 2011; Fausto et al., 2021). Validation of MODIS albedo was done in Gunnarsson et al. (2021) and Gascoin et al. (2017) for glaciers in Iceland.
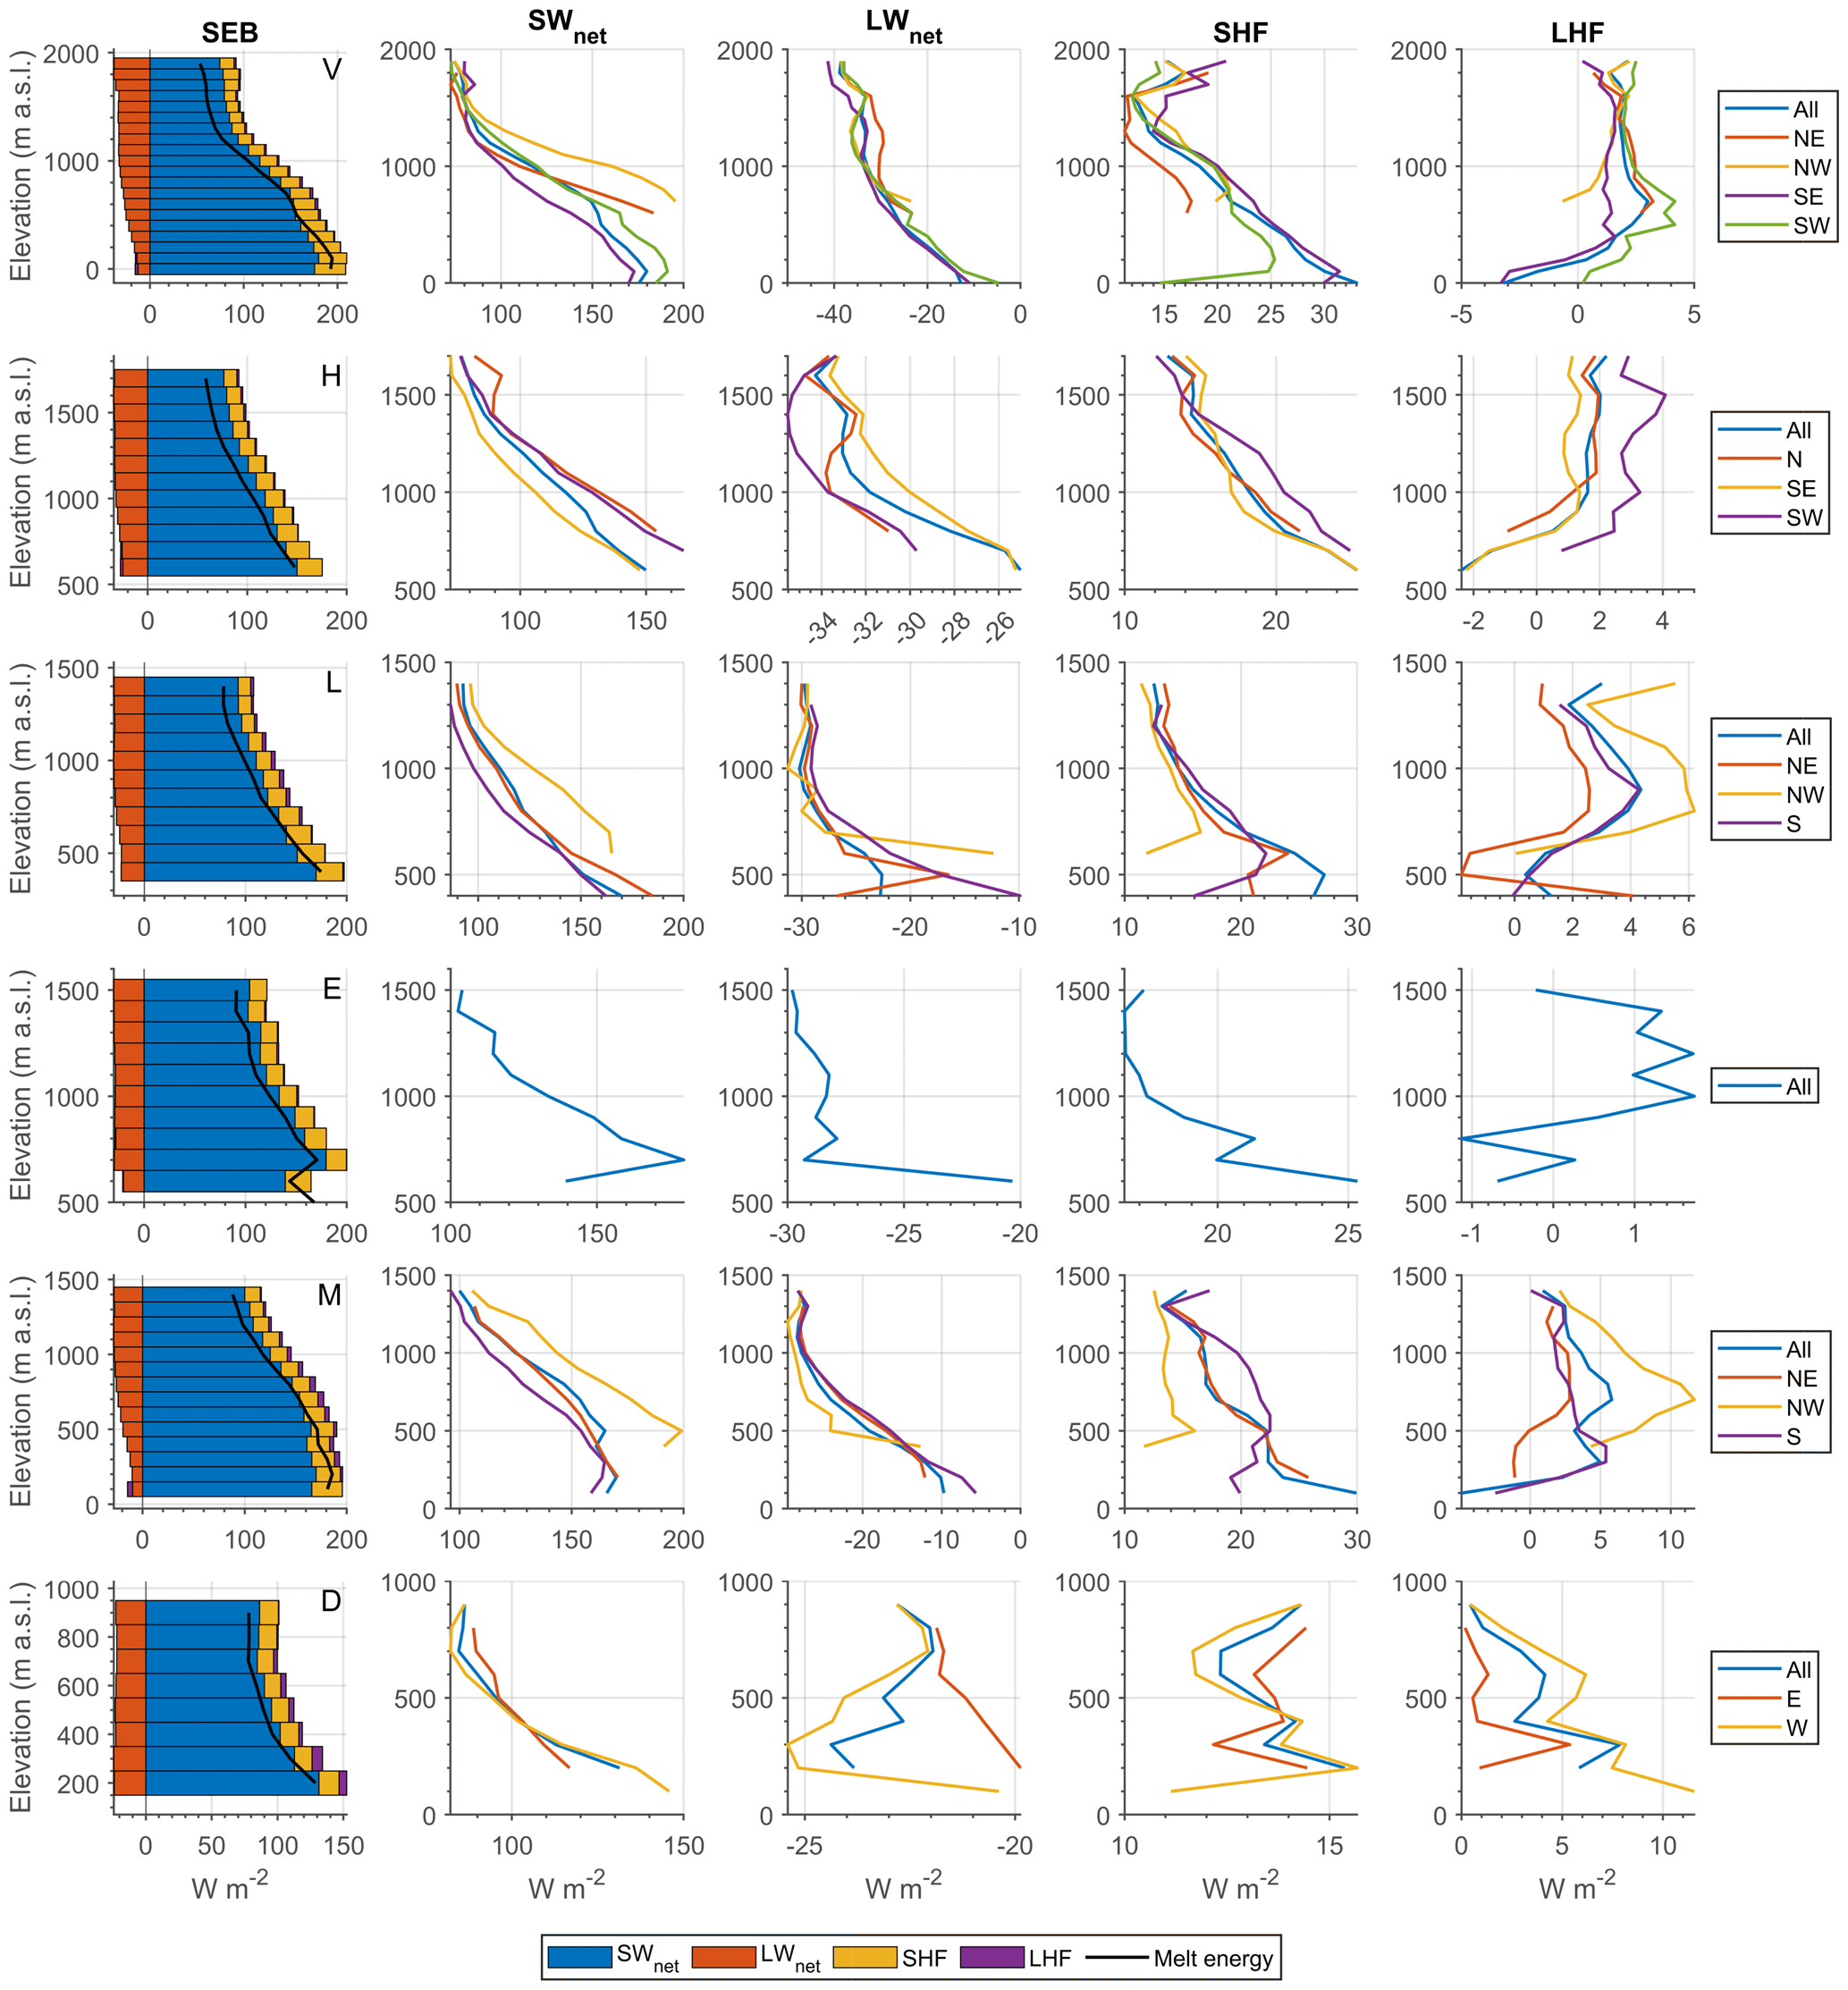
Figure 4Variation of surface energy balance components with elevation (100 m elevation bins). The first column of images shows the average MJJA energy balance by elevation for the whole glaciers. The other columns show individual SEB components for the glaciers and their main sub-areas as a function of elevation. (Sub-areas are defined in Fig. 1.) V: Vatnajökull; H: Hofsjökull; L: Langjökull; E: Eyjafjallajökull; M: Mýrdalsjökull; D: Drangajökull. Note that the horizontal scale varies between the panels. SWnet is the incoming short-wave radiation, LWnet is the net long-wave radiation, SHF is the sensible heat flux and LHF is the latent heat flux.
4.2 Surface energy balance seasonal and interannual variability
Figure 3 shows the spatial patterns for melt energy for the investigated glaciers over the period 2000–2021 for individual months in the extended melt season (AMJJA) and the extended melt season mean (AMJJA). Spatially, the highest melt energy was observed where the winter snow cover is generally completely ablated during summer, revealing dirty and impurity-rich ice. Lower melt energy values were found in the accumulation areas associated with higher elevations and a shorter period of positive SEB during the melt season. In April, limited melt occurs, although in areas near the terminus at the northern and southern Vatnajökull outlets and low-lying outlets of Mýrdalsjökull between 10 % and 15 % of the total mean, annual melt energy was observed. At the northern outlets of Vatnajökull, winter snow thickness is generally shallower than for the other outlets, exposing impurity-rich ice with low albedo sooner and enabling greater amounts of the incoming short-wave radiation to be forced at the surface. At the lower elevations of the Vatnajökull southern outlets, some extending down to sea level, average winter and spring temperatures are higher, inducing earlier melt-out of winter snow, which exposes impurity-rich ice and portions of the ablation area in April. In spring and early summer, the positive SEB contributes to the warming and ripening phases of the winter snow before the melt output phase contributing to melt can commence. The highest daily amounts of incoming short-wave energy occur in June and July, providing the largest quantities of melt energy associated with small solar zenith angles. As more impurity-rich ice was exposed in the ablation area, with lower surface albedo as the melt season progresses, more incoming short-wave energy was available at the surface, even in August with increasing solar zenith angles. Gunnarsson et al. (2021) revealed that the lowest observed albedo values in the accumulation area generally occur in early to mid August prior to precipitation falling as snow and form higher albedo, reducing short-wave net radiation (SWnet).
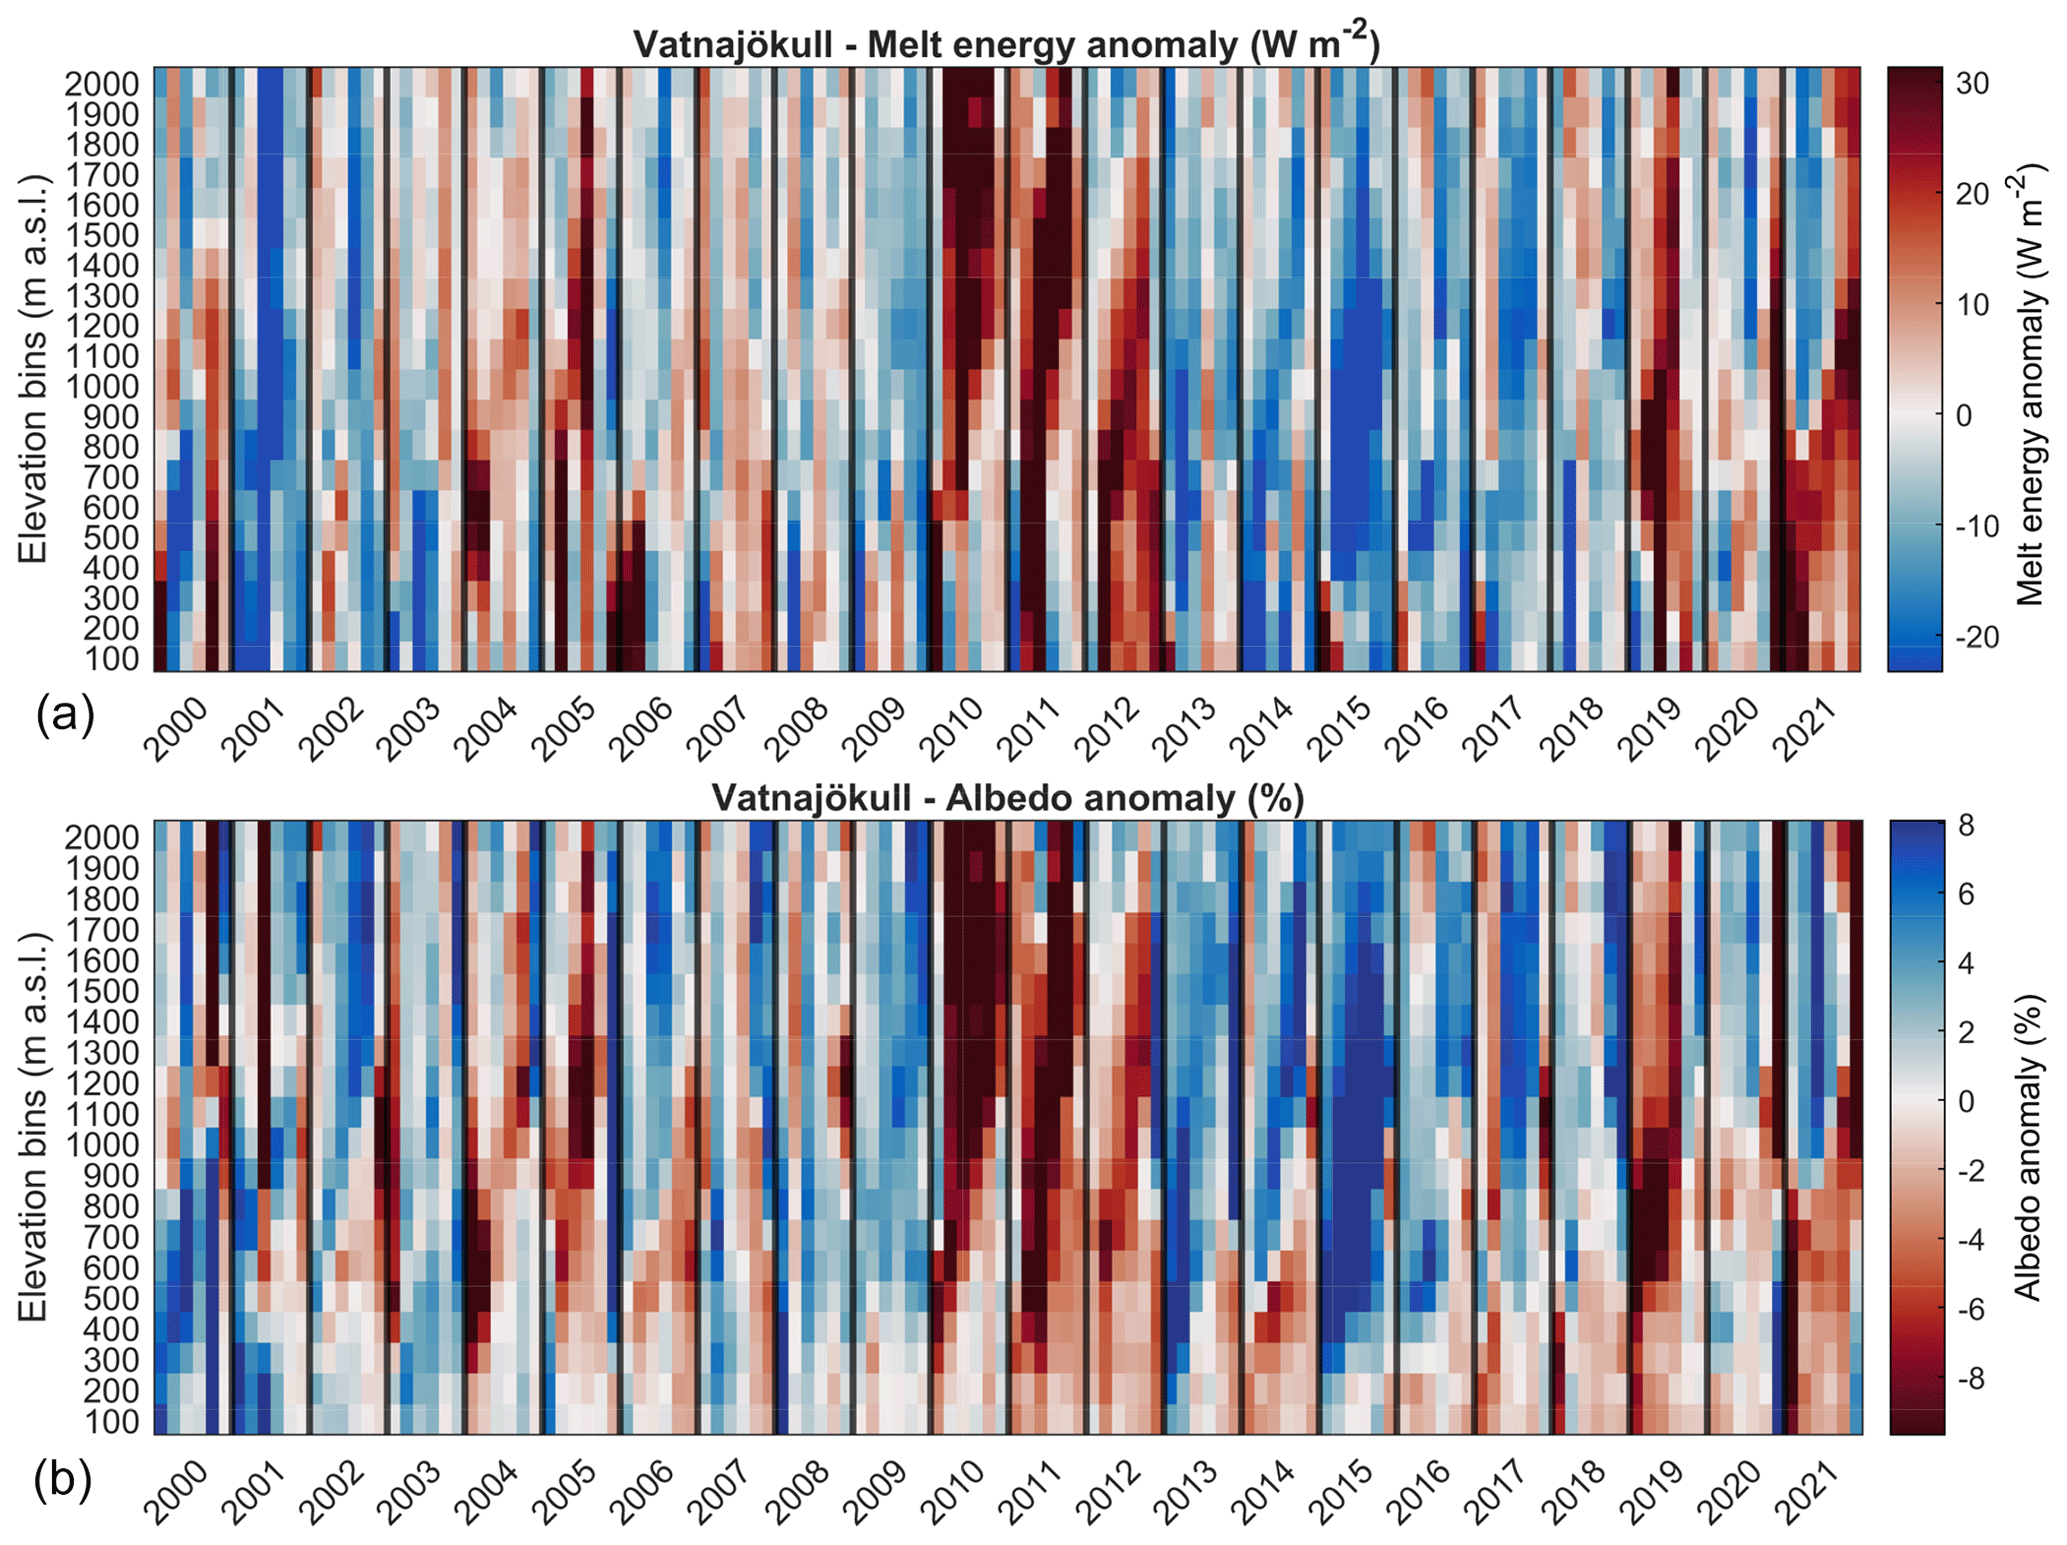
Figure 5Variation of monthly average melt energy (W m−2, a) and monthly albedo anomalies (b) for Vatnajökull. Elevation (vertical axis) is in bins of 100 m, and the horizontal axis shows monthly data for each year from April to September. Black vertical lines separate the years. Figures B1 to B5 in the Appendix are similar figures for the other glaciers.
Figure 4 shows the average SEB (MJJA) and its main components as a function of elevation in 100 m bands for the six largest ice caps and their sub-areas defined in Fig. 1. For all the glaciers, SWnet was the major SEB component for melt energy, while LWnet was generally an energy sink. The SHF was an energy source in the lower ablation area, generally decreasing with elevation as air temperatures decrease. High air temperatures, explained by the Icelandic maritime climate during summer, and generally low glacier elevations explain the positive melt energy contribution of the SHF. The LHF was quite small in all the cases, with much less variability with elevation than other melt energy components. Due to high humidity, the LHF was mostly positive.
For Vatnajökull, SWnet diminishes on average by −6.45 W m−2 per 100 m, with lower gradients for the northeastern and northwestern outlets (−8.95 and −11.1 W m−2 per 100 m, respectively). For Hofsjökull lower values were observed for the southwestern outlets (−9.0 W m−2 per 100 m), with −6.8 to 8.0 W m−2 per 100 m for the southeastern and northern outlets, respectively. At Langjökull the northeastern and northwestern outlets have lower gradients (−9.2 and −10.1 W m−2 per 100 m) than the southern outlet (−8.7 W m−2 per 100 m). The smaller glaciers had similar average values, −8.2, −5.9 and −6.0 W m−2 per 100 m, for Eyjafjallajökull, Mýrdalsjökull and Drangajökull, respectively.
Compared to other glaciers and ice sheets studied in the Northern Hemisphere, in the European Alps, Greenland and Svalbard, the results obtained are similar. SWnet is generally the main energy source for heating and melting of snow and ice during the melt season, and net long-wave radiation is an energy sink with a significant contribution from sensible heat fluxes, although significant variations can be found (Sicart et al., 2008; Oerlemans et al., 2009; van den Broeke et al., 2011; Franco et al., 2013; Karner et al., 2013; Huai et al., 2020). Partitioning of the SEB reveals a somewhat higher contribution from SWnet for Icelandic glaciers than other Northern Hemisphere glaciers and ice sheets, although this is dependent on local glacier conditions (Hock, 2005; Six et al., 2009). This was driven by lower albedo values due to LAPs, both deposited onto the surfaces of glaciers during summer and also from historical eruptions and dust events melting out in the impurity-rich bare-ice areas during the ablation season. Generally, the net radiation contribution by LWnet was mostly an energy sink (negative), reducing the SWnet contribution and increasing the relative contribution of the sensible heat fluxes to melt.
Latent heat fluxes contribute much less than sensible heat fluxes. Variation of SWnet with elevation depends strongly on albedo, generally increasing with elevation, as impurity-rich ice was exposed later in the melt season, or not at all, in the accumulation area. General albedo evolution in the accumulation area throughout the melt season was mainly driven by climatology, i.e., snow metamorphosis, not LAPs, although events of sand and dust deposits could be observed in the albedo data for individual years, impacting SWnet. MODIS albedo data do not allow for discrimination between snow metamorphosis and LAP impacts, but this assumption was based on albedo data in the accumulation area that seldom reached values low enough to reflect extensive LAPs on the surface unless related to years with volcanic eruptions. Figure 6 in Gunnarsson et al. (2021) shows the average elevation distribution of albedo.
Albedo gradients from Gunnarsson et al. (2021) follow similar patterns with elevation to those of SWnet (general albedo increase with elevation) for all the glaciers, demonstrating how SWnet was modulated by albedo. Cloud cover also influenced SWin, generally increasing slightly with elevation, although persistent cloud cover was observed at the terminus at Vatnajökull's northern outlets. Spatial distribution of cloud cover was reported in Gascoin et al. (2017) and Gunnarsson et al. (2021). LWnet was negative (energy sink) for all the glaciers and generally more negative with greater elevation. The variability was much less than for SWnet, ranging from −1.8 to −0.2 W m−2 per 100 m. Changes to SHF with elevation are similar to those of LWnet, decreasing by −1.62 to 0 W m−2 per 100 m, with limited elevation variability for Mýrdalsjökull and especially Drangajökull. LHF fluxes were small in all the cases, with non-significant elevation dependency.
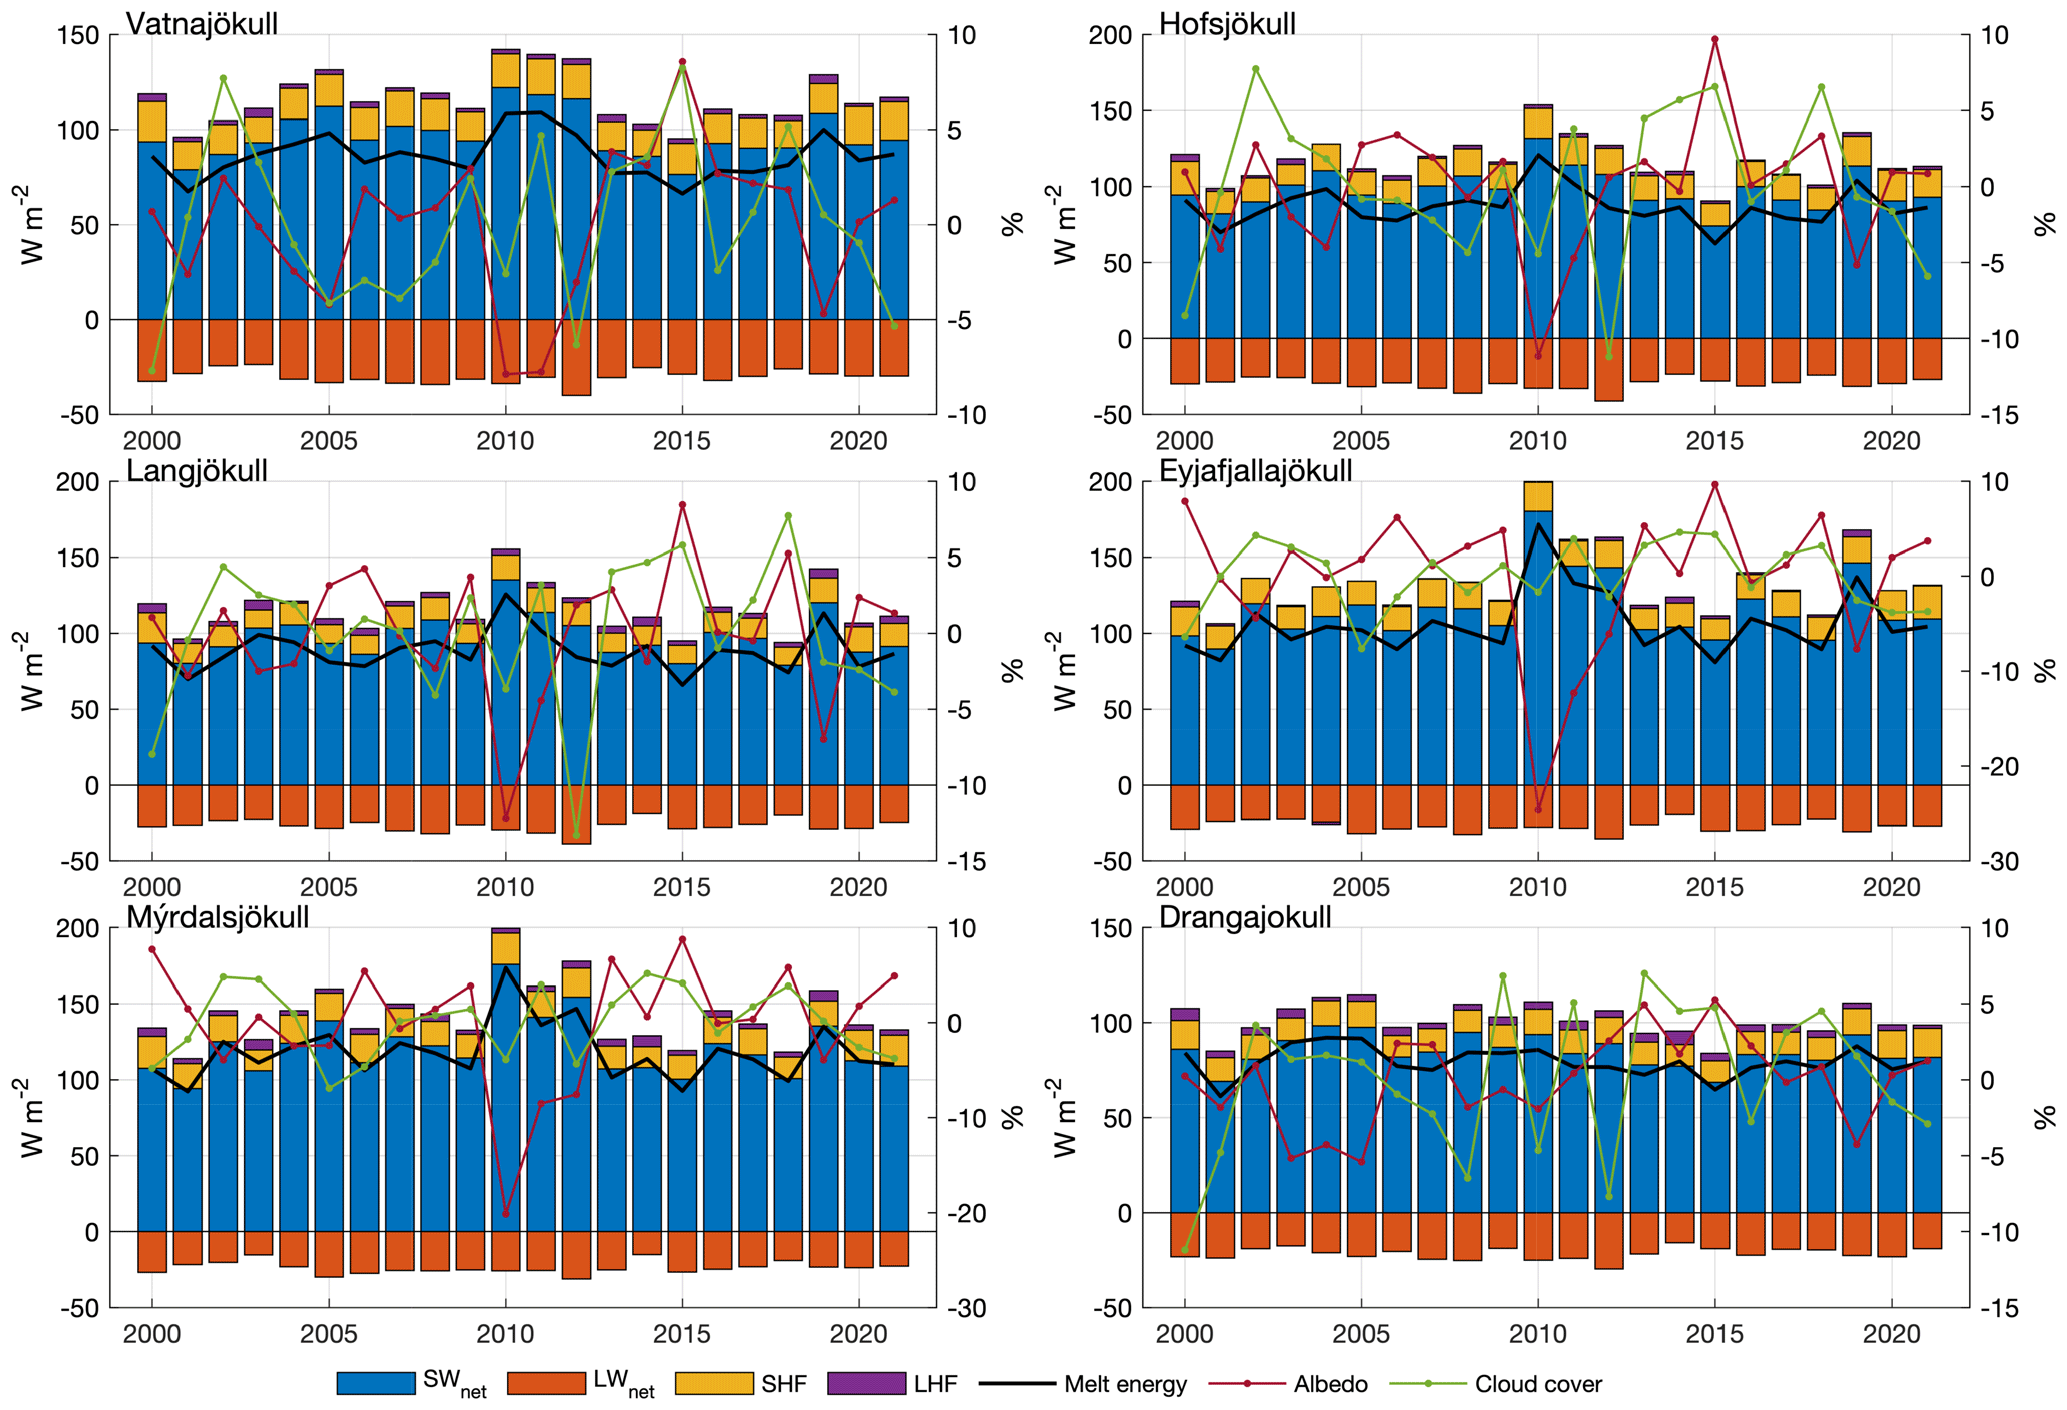
Figure 6Surface energy balance sources (colored bars) and the available melt energy (solid black line) for the period MJJA 2000–2021 (left vertical axis). The melt season mean albedo (purple) and cloud cover (green) for each glacier are shown as deviations from the period mean (right vertical axis). SWnet is the incoming short-wave radiation, LWnet is the net long-wave radiation, SHF is the sensible heat flux, and LHF is the latent heat flux.
Figure 5 shows the variation of the average monthly melt energy anomaly and albedo anomalies in 100 m elevation bins for Vatnajökull, spanning individual months from April through September for the study period. The anomalies show deviations from the period mean for each month and elevation bin. In years with high summer ablation, increased melt energy in the accumulation area was observed. The bare-ice areas generally reach a certain lower limit of albedo (0.1–0.25), limiting further effects of albedo on short-wave radiative forcing, although the timing of bare-ice exposure is important. Figures B1–B5 in Appendix B show similar patterns for the other glaciers studied.
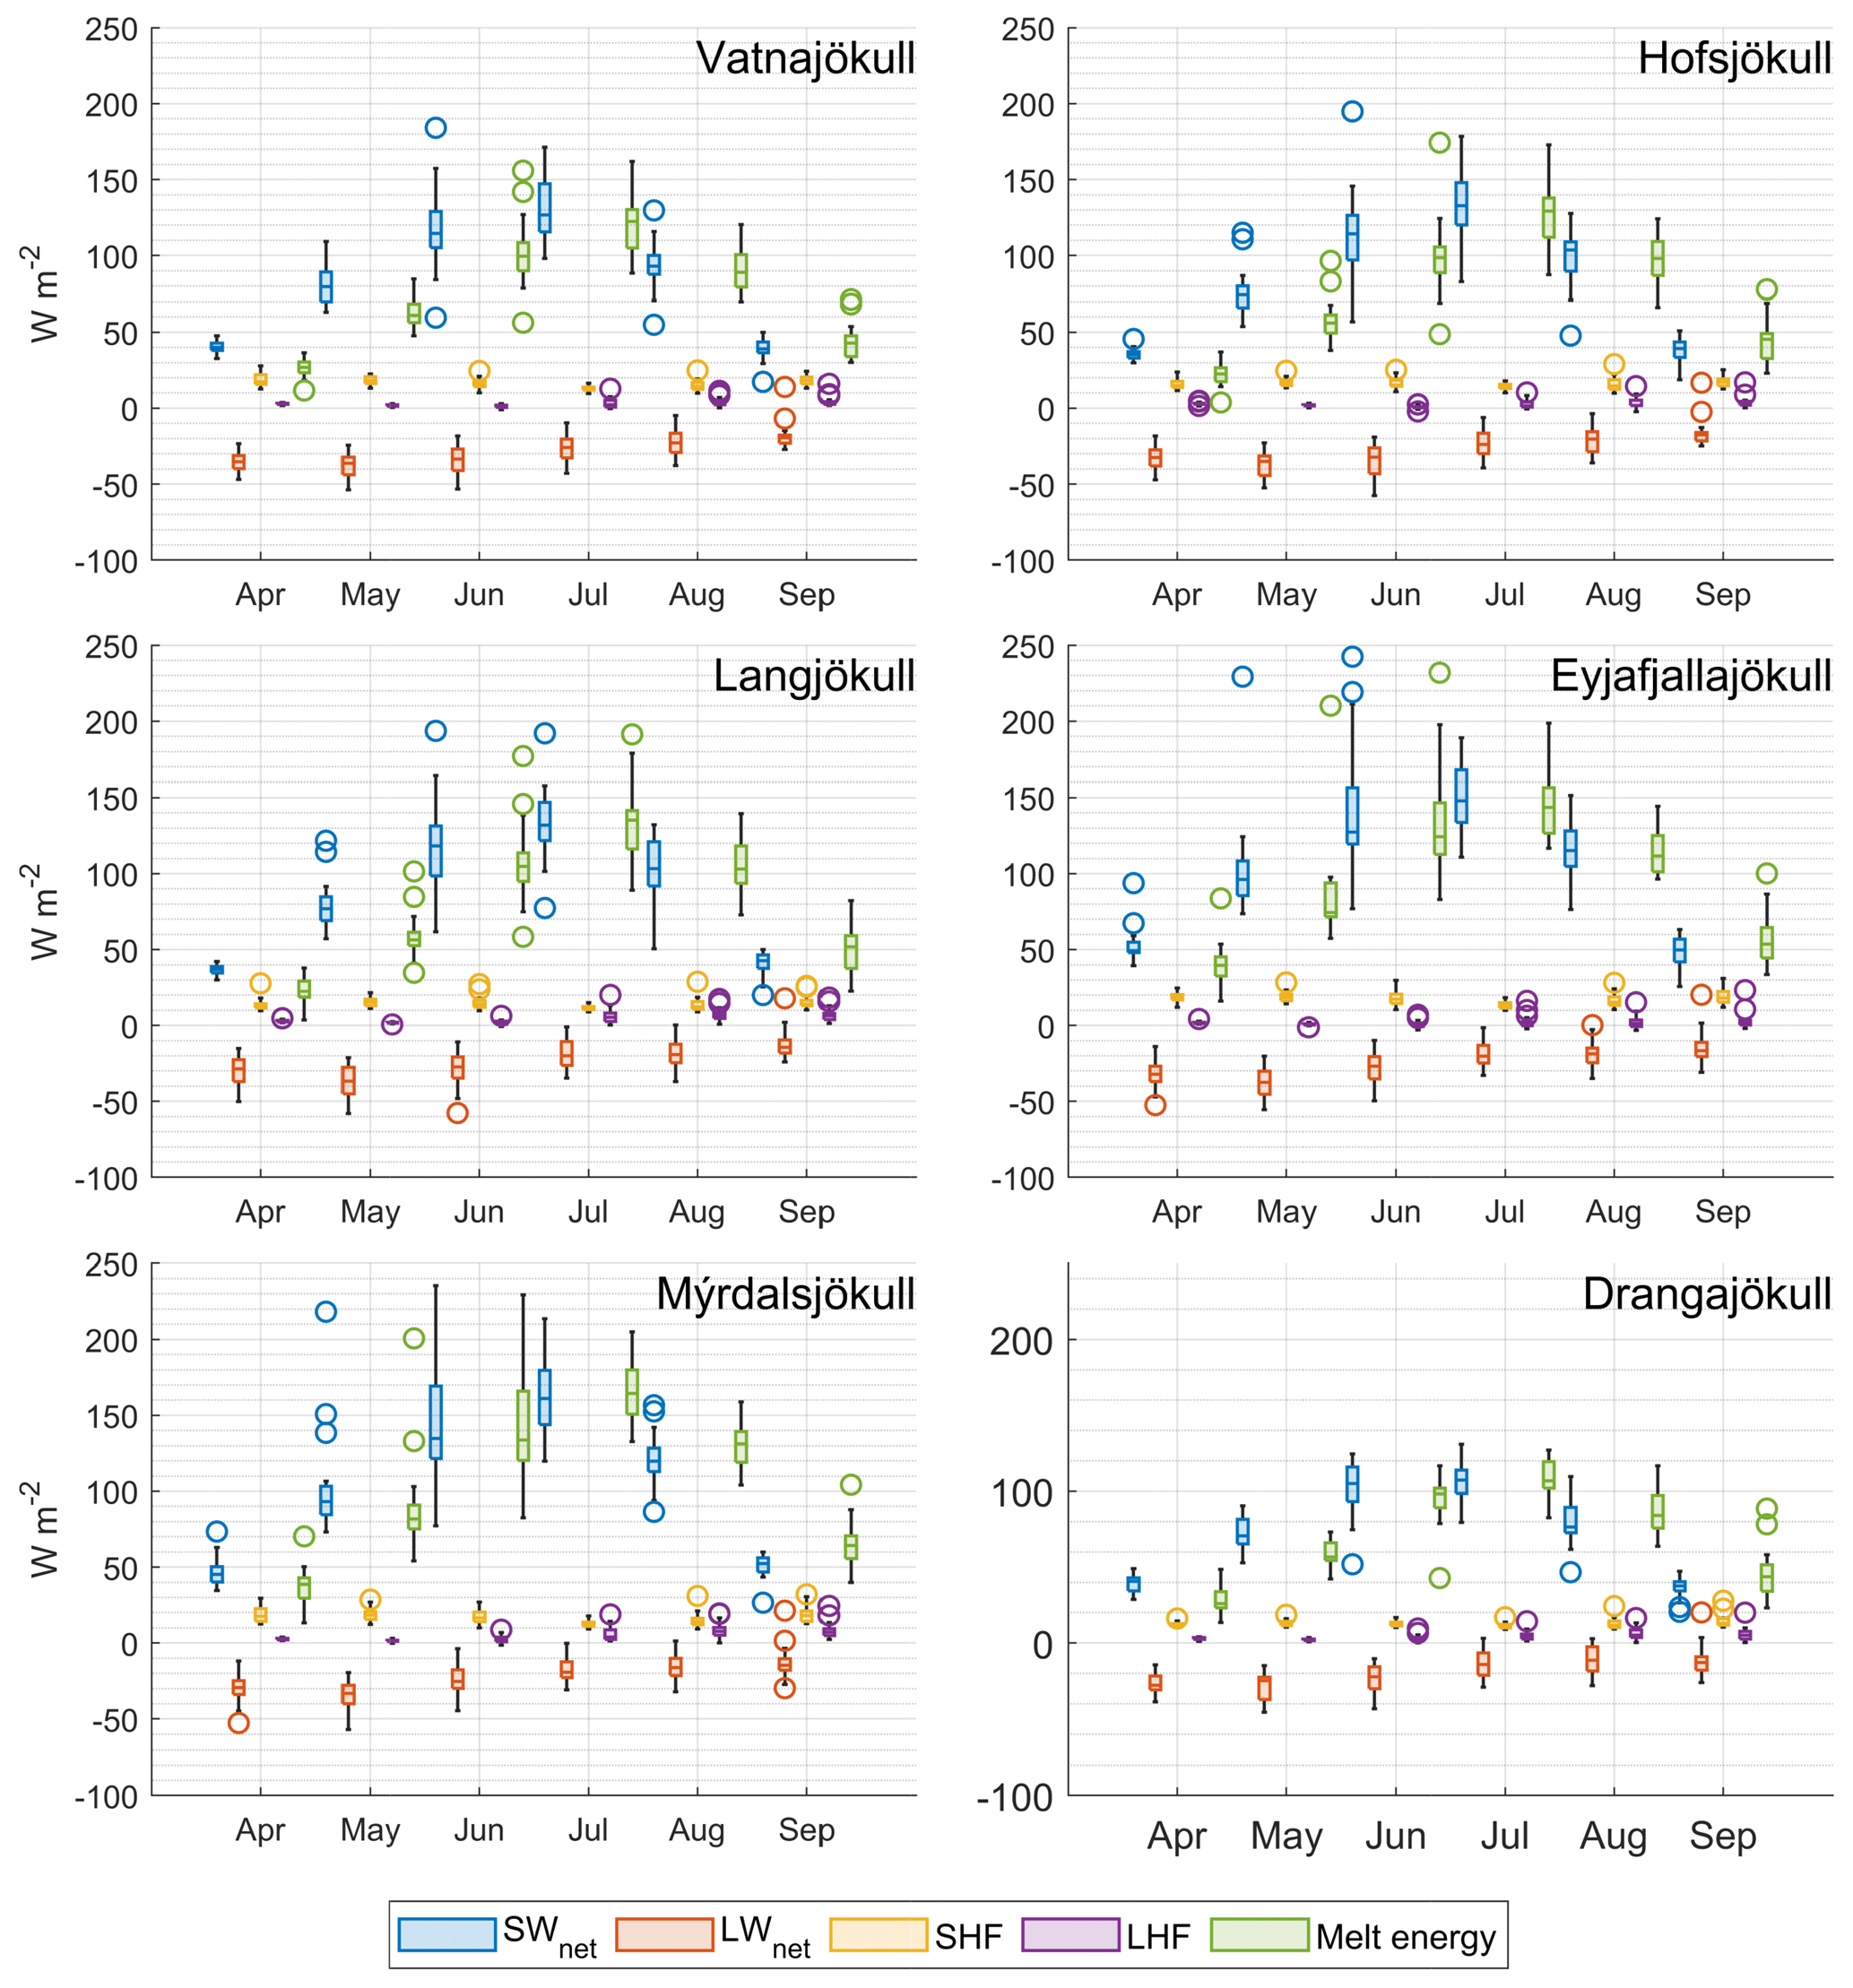
Figure 7The monthly average distribution of surface net energy balance components and melt energy for the glaciers studied. SWnet is the incoming short-wave radiation, LWnet is the net long-wave radiation, SHF is the sensible heat flux, and LHF is the latent heat flux. The line inside each box is the sample median, and the top and bottom edges of each box are the upper and lower quantiles (0.25 and 0.75), respectively. The whiskers that extend above and below each box connect the upper and lower quantiles to the non-outlier maximum and minimum. Circles represent outliers.
The figure shows that, in 2010 and 2011, tephra deposits at the upper elevations from the eruptions in Eyjafjallajökull (2010) and Grímsvötn (2011), greatly impacting albedo in the accumulation area. In 2012, below-average cloud cover extensively enhanced SWin radiation forcing, while some residual effects from tephra fallout in 2010 and 2011 were possible, increasing SWnet. Positive melt energy anomalies at lower elevations in 2015, 2016 and 2017 were related to rapid lowering of albedo associated with warm southerly winds and liquid precipitation in the first months of the melt season. Much colder temperatures and cloudy periods followed, constraining melt energy during the rest of the melt season. The high SEB in 2019 was largely due to negative albedo anomalies resulting from extensive LAP deposits from the near pro-glacial areas (unpublished data based on satellite images and operational web cameras in the field). This extended the actively melting areas higher into the usual accumulation zone, contributing more to the summer ablation by increasing melt at higher elevations. The year 2021 was unusual, as May and the first 3 weeks of June were highly influenced by clear skies but cold temperatures, the latter reversing completely in late June, with warm westerly and southerly winds and clear skies through August (Pálsson et al., 2022; Veðurstofa Íslands, 2022). Figure 6 shows the SEB for the study period and the decomposition into different SEB components, with melt season mean cloud cover and albedo anomalies. The SEB variability between melt seasons is mostly explained by SWnet variability, while LWnet and SHF partially explain the variance. As shown in Fig. 6, the latent heat flux made only a limited contribution to melt energy. SWnet was the dominant melt energy source for all the locations studied. LWnet acts as an energy sink ranging from −20 to −30 W m−2, with variability between the glaciers investigated around 4 W m−2. The figure shows that, for Vatnajökull, the melt season average SEB components were 97 (σ: 14.5), −30 (σ: 4.2 ), 16.6 (σ: 2.1) and 2.7 (σ: 1.1) W m−2 for SWnet, LWnet, SHF and LHF, respectively, for the period. Excluding 2010 and 2011, the SWnet was 92 (σ: 10.5) due to the enhancement effects of the volcanic eruptions for those years, and the average energy available for melt was 85 W m−2 for Vatnajökull. A higher SWnet was observed at the southern coast glaciers (Mýrdalsjökull, Eyjafjallajökull), which tend to have very low albedo values and earlier melt onset in spring. The southern coast glaciers were also close to unstable dust hotspot areas where seasonal snow melts out earlier than in the highlands, exposing erosive surfaces. Conversely, cloud cover was generally higher for the southern coast glaciers as well as for the coastal Drangajökull in the northwest, with cloud cover ranging from 75 % to 82 %, while less cloud cover, 70 %–74 %, was observed for the inland glaciers and their outlets Vatnajökull (except for the southeastern outlets), Langjökull and Hofsjökull. SWnet was strongly affected by both cloud cover and surface albedo; lower albedo and cloud cover values were observed for areas of high annual melt energy. SWnet correlates strongly with the average surface albedo (Pearson correlation coefficient, PCC: −0.85), where a general increase in albedo with a consequent decrease in SWnet was reduced with longitude (Gunnarsson et al., 2021). However, a non-significant relationship was found between cloud cover and LWnet (PCC 0.72 for Vatnajökull).
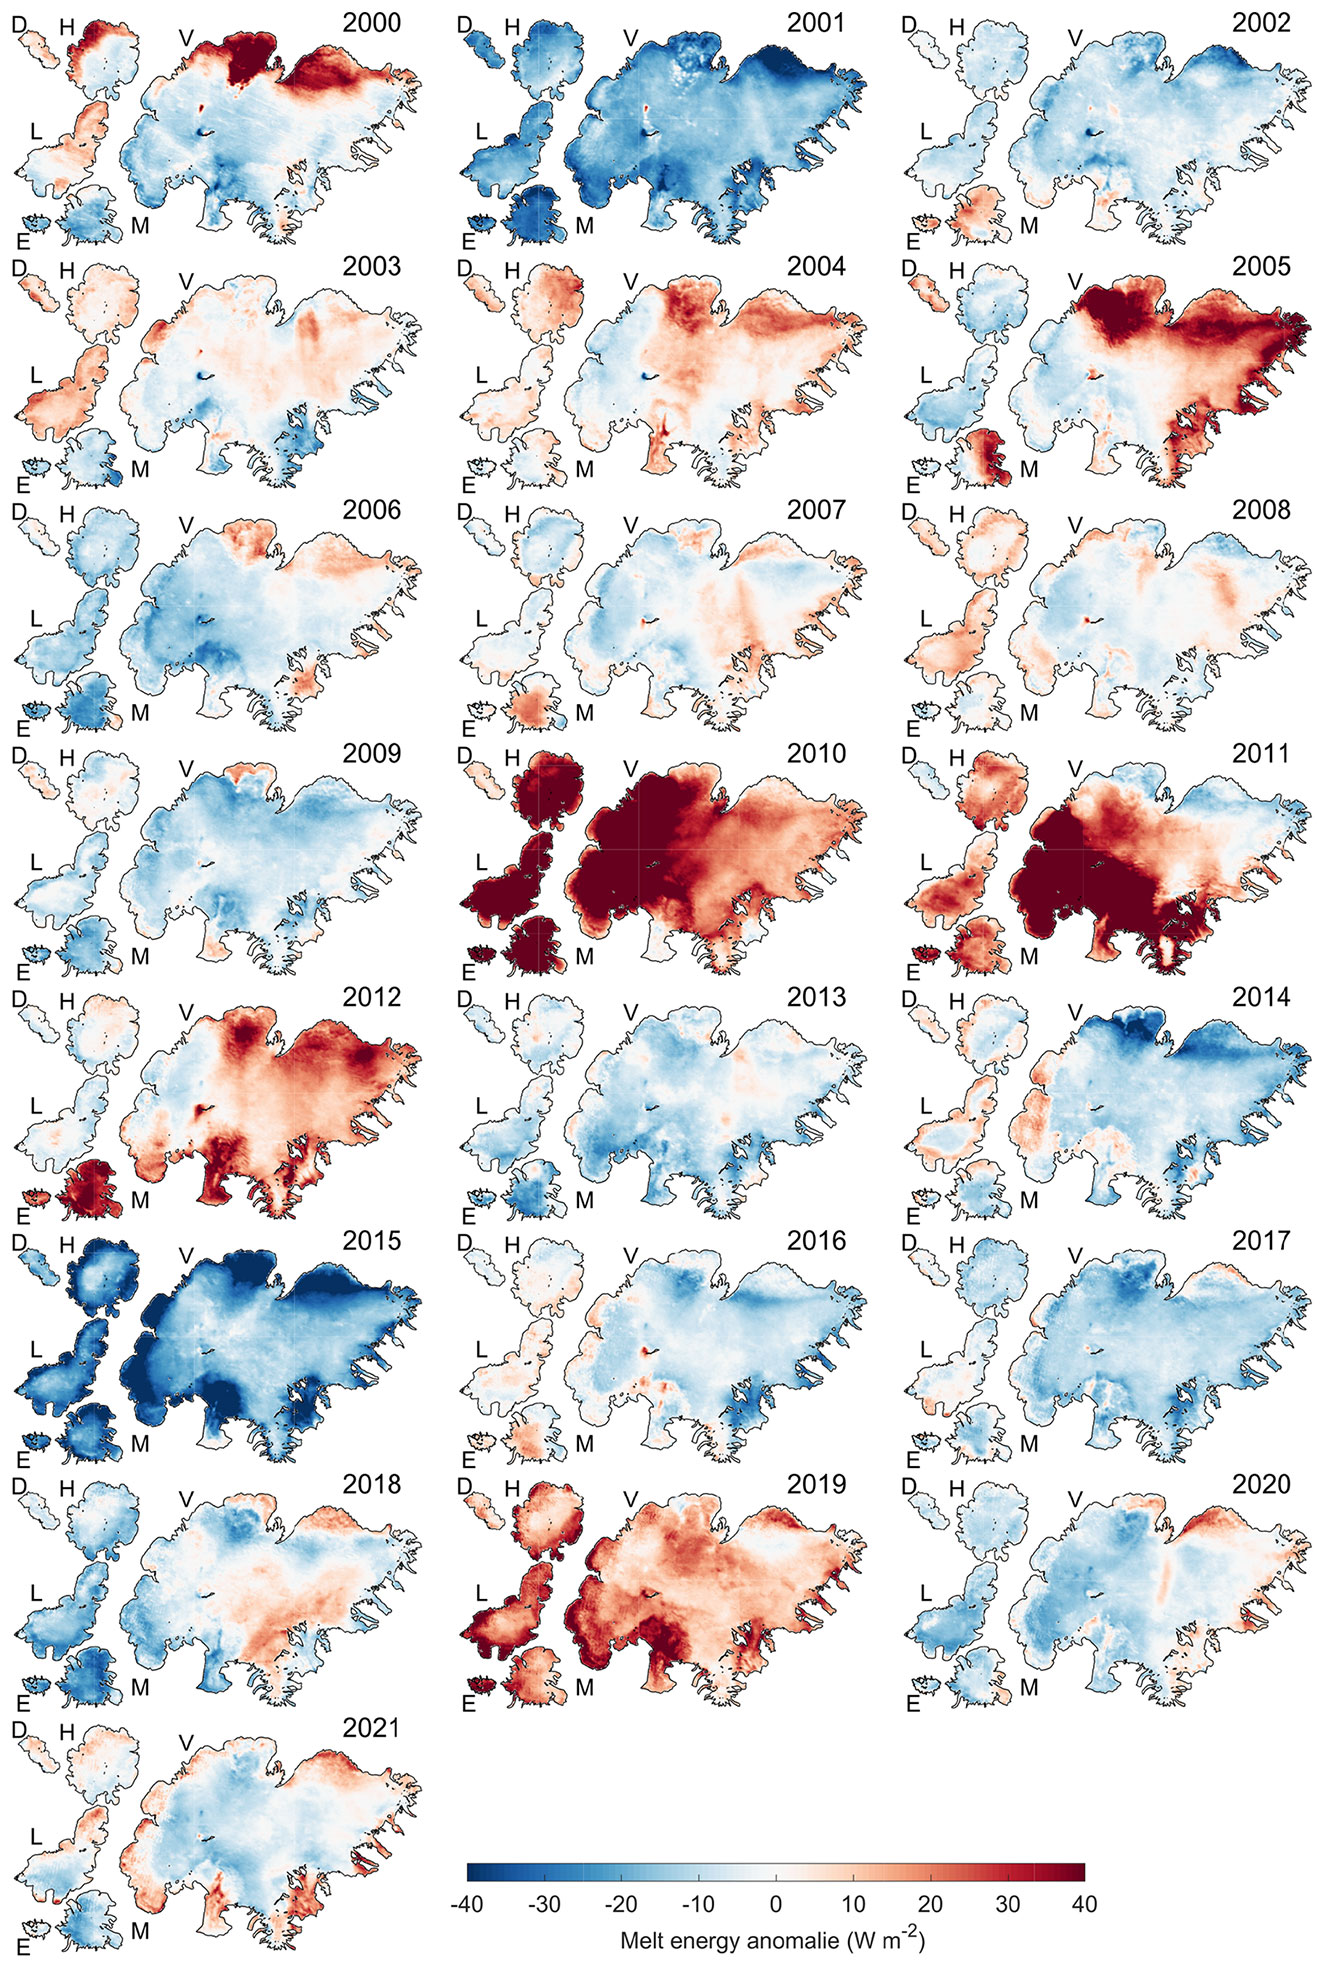
Figure 8Surface energy balance anomalies from the mean for MJJA 2000–2021. Red colors indicate average melt energy above average (more potential melt energy) while blue colors denote surface energy balance below average.
Figure 7 shows the monthly average distribution of SEB components and melt energy for the glaciers studied. For nearly all the glaciers, the SWnet and melt energy were highest in July, except for Drangajökull, which had similar SWnet values in June and July. This may be associated with there being fewer impurities in the exposed bare ice at Drangajökull compared to the other main glaciers, which are closer to volcanic activity and dust hotspots.
The highest variability of SWnet occurred in June and July, associated with the extent of bare-ice areas and driven by melt intensity in the following spring and previous winter snow depth. In April, the cold content of winter snow limits the melt energy available to produce meltwater, and winter snow still covers the impurity-rich ice in the ablation areas. LWnet was negative for all months at all locations, with a slight decrease (less negative) for the latter half of the melt season (JAS). Turbulent fluxes showed little variability between months for the averages presented, whereas SHF often had peaks associated with events or prolonged periods in which warm air was transported, enhancing melt.
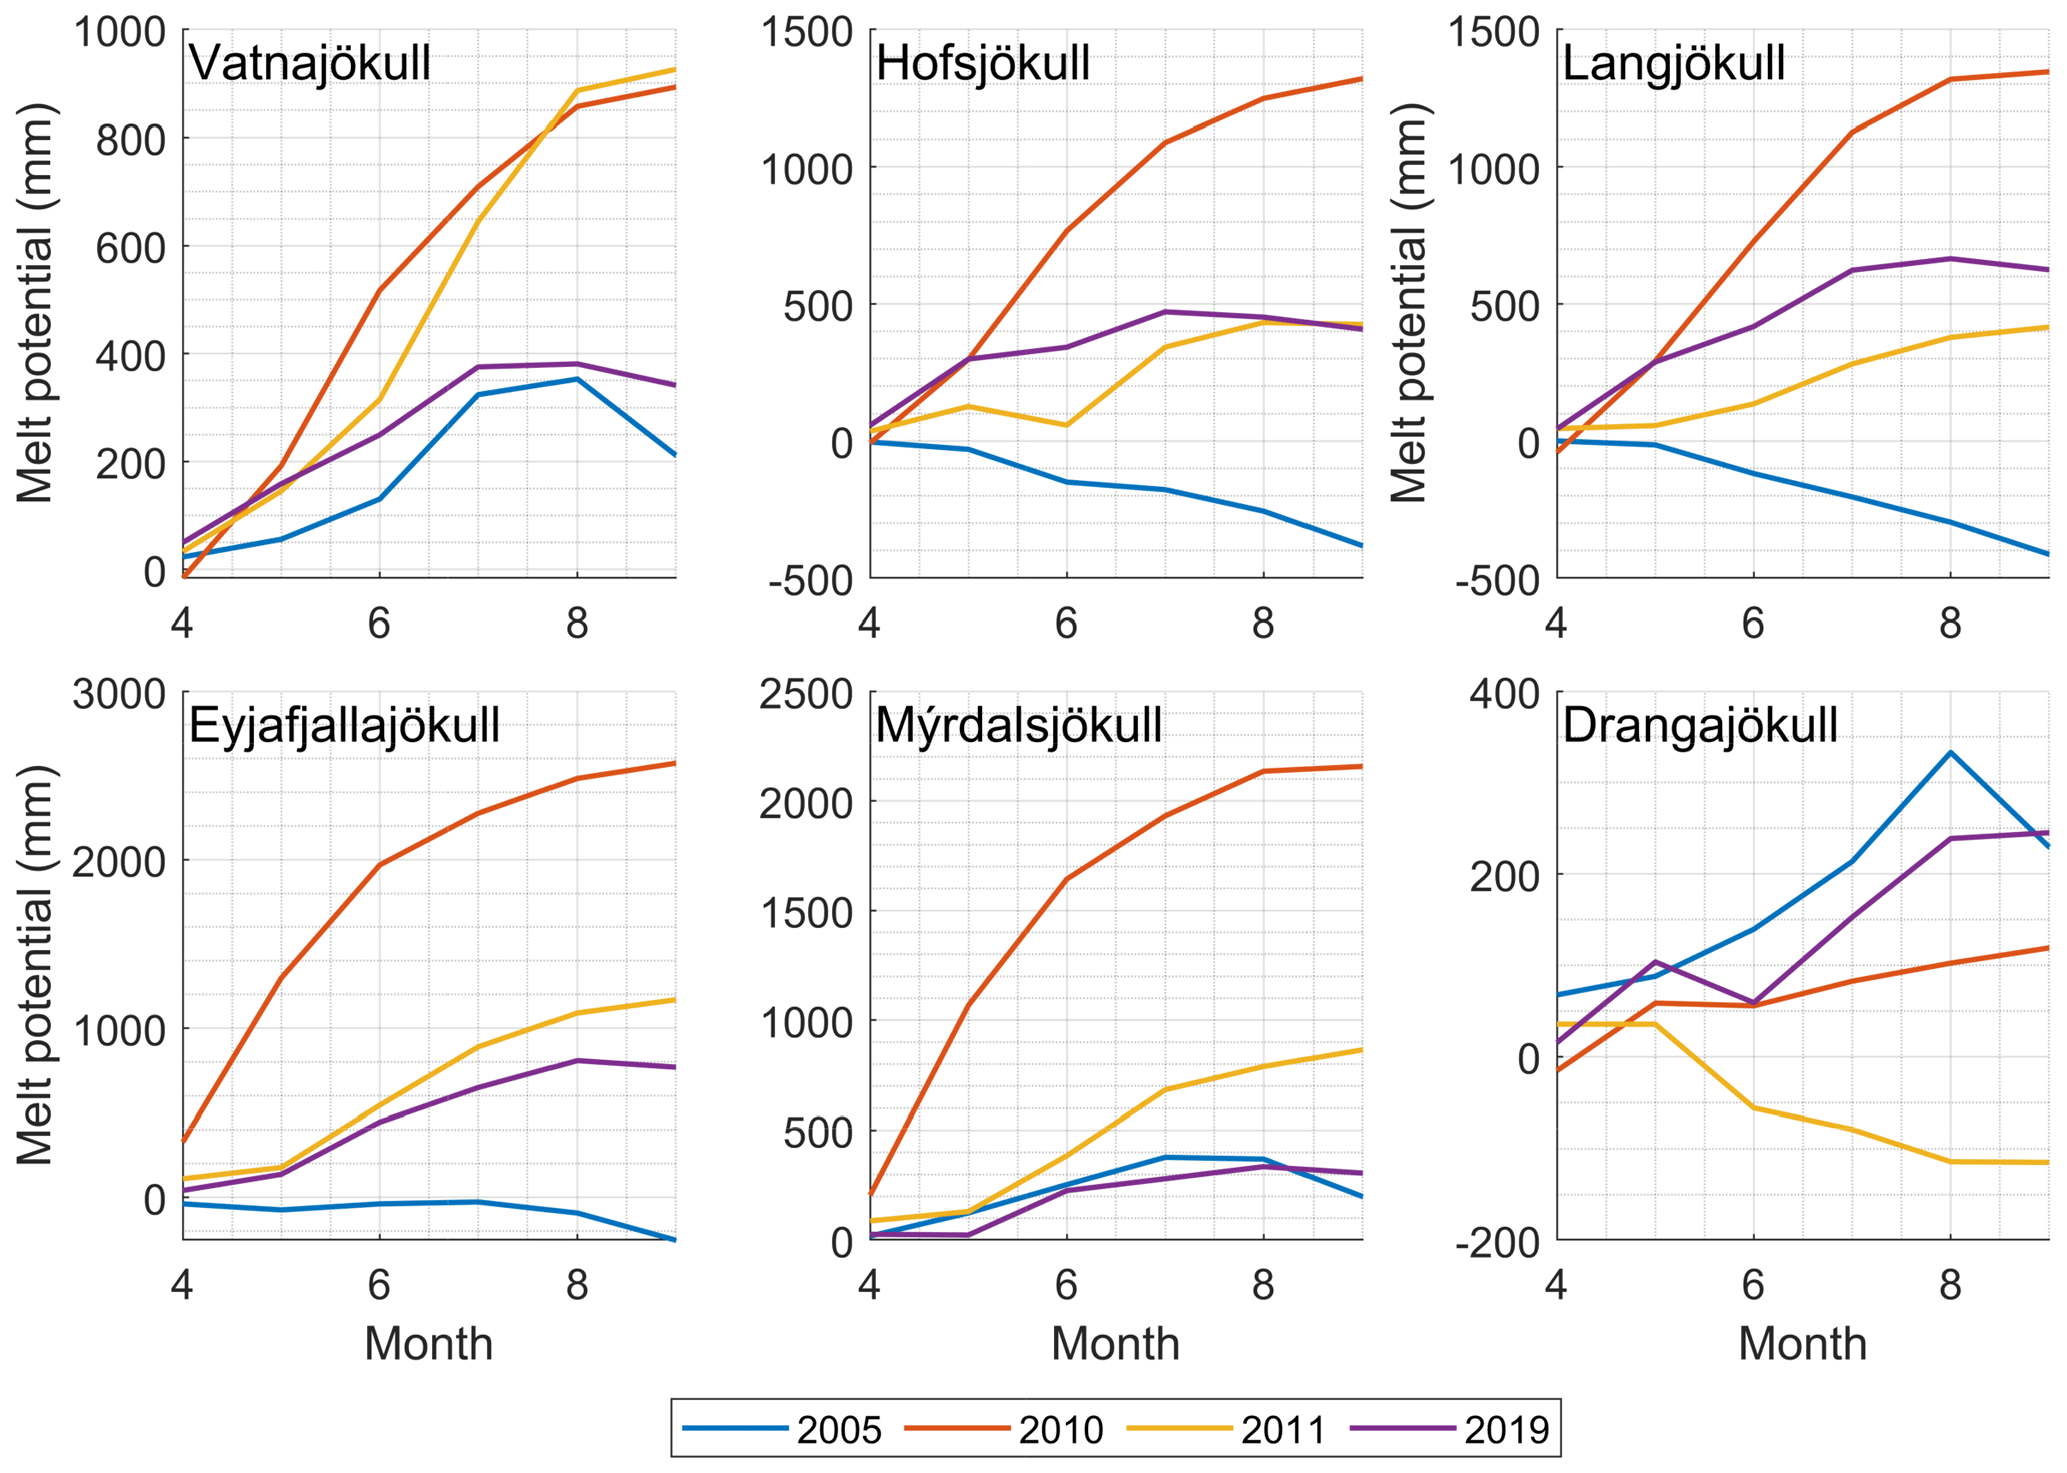
Figure 9Estimated increase in melt potential (millimeters of water) due to the effect LAPs had on the surface energy balance in 2005, 2010, 2011 and 2019. Data are shown as the increase in cumulative monthly melt potential due to LAPs, i.e., the difference in melt using historical average albedo (2000–2021 mean excluding 2010, 2011 and 2019 in the mean) and observed albedo for the selected years using the same climatological forcings. Note that the vertical scale varies between the panels.
4.3 Impacts of volcanic eruptions and other LAP events
Interannual SEB variability for Icelandic glaciers was generally high. Figure 8 shows SEB anomalies as deviations from the period mean. The 2004 eruption in Grímsvötn and the associated LAP deposits had some, though very limited, impact on ablation, since it took place in the fall prior to the buildup of the winter snowpack. In the following melt season (2005), impacts of the tephra deposits were observed at Vatnajökull. For Vatnajökull, the increase in SWnet was 15 % above the mean SWnet energy over the period. The impacts were notable in the northern and southeastern outlets, being 20 %–27 % SWnet above the mean of the study period. In southwestern Vatnajökull, SWnet was very close to the period mean, with a 1 % increase indicating the limited impact of the 2004 LAP deposits. The discrimination between tephra deposits from the eruption and loading of LAPs from other sources during the summer of 2005 is complex, and the extensive SWnet in southeastern Vatnajökull was perhaps a combination of both, i.e., added LAPs from dust hotspots in the northern highlands during the melt season and LAPs from the eruption. For Langjökull, Hofsjökull and Eyjafjallajökull, SWnet was below average, indicating that the influence of LAP deposits from the eruption was negligible. The northeastern outlet at Mýrdalsjökull had an increase in SWnet, more likely due to dust from the surrounding hotspots rather than residual effects from the eruption in 2004.
The figure shows that, for the period from 2000 to 2021, with the exception of Drangajökull, the highest MJJA melt energy was observed in 2010, associated with a warm, cloud-free summer and SWnet amplification due to LAP depositions from the Eyjafjallajökull eruption, generally lowering albedo. For Vatnajökull, the increase in SWnet was 25 % above the mean SWnet over the study period. For southwestern Vatnajökull, the SWnet was 33 % above the period mean, while it was 20, 29 and 16 % for the northeastern, northwestern and southeastern outlets, respectively, of Vatnajökull. At Hofsjökull, the increase in SWnet was about 35 % for the whole glacier, with the highest anomaly being 44 % for the southeastern outlet. Lower SWnet enhancements of 29 % were observed in the northern parts of Hofsjökull, and the southwestern outlet had an increase of 36 %. The impacts for Langjökull were similar to those for Hofsjökull, with the increase in radiative forcing being higher for the southern and northeastern outlets (42 % and 43 %, respectively) but lower for the north-facing outlet (29 %). The spatial variations in radiative forcings are mostly explained by the distribution of the volcanic ash plumes transported from Eyjafjallajökull in mid-May 2010 (Gunnarsson et al., 2021). For Mýrdalsjökull and Eyjafjallajökull, the impacts on SWnet had generally less spatial variability that is explained by the proximity to the LAP origin and the relative sizes of these glaciers. For Mýrdalsjökull, the average short-wave radiative forcing increase was 45 %, and it was 55 % for Eyjafjallajökull. In extensive areas of these glaciers, the tephra layer was thick enough to isolate the surface (larger than 2 cm) and limit the use of melt energy to produce meltwater.
In 2011, LAPs from the May subglacial eruption in Grímsvötn enhanced short-wave radiative forcing, mostly influencing the southwestern and southeastern outlets of Vatnajökull. The melt energy anomaly (compared to the average melt season) at southwestern Vatnajökull was 47 %. At the northeastern outlet, SWnet was slightly below average (99 % of mean), but the southeast and northwest observed some melt enhancement, 10 % and 7 %, respectively. For Hofsjökull and Langjökull, similar SWnet increases were observed, ranging between 14 % and 22 % and with less spatial variability than for the previous year. For Mýrdalsjökull and Eyjafjallajökull, smaller average melt enhancements were seen, 16 % and 25 %, respectively. A major climatological difference between 2010 and 2011 relates to the much higher average cloud cover in 2011 influencing SWin and generally lower air temperatures, reducing the melt enhancement potential from LAPs in 2011 compared to 2010. For both 2010 and 2011, limited impacts on SWnet forcing were observed for Drangajökull, indicating limited impacts of LAPs from the 2010 and 2011 eruptions.
In late April 2019, rapid melt-out of seasonal snow in the highlands was observed. This was followed by favorable conditions for airborne LAPs from dust hotspots and pro-glacial areas, enabling vast LAP deposits on glacier surfaces, with an associated decrease in albedo and potential for enhancing radiative forcing. For Vatnajökull, SWnet was 12 % above average, with 3 %, 8 % and 7 % SWnet above the mean for the northeast, northwest and southeast, respectively, but 18 % for the southwestern outlet. For Hofsjökull, SWnet was 16 % above average, with 10 %, 20 % and 14 % SWnet above the mean for the northern, southeastern and northwestern outlets, respectively. At Langjökull the values were somewhat higher: SWnet was 23 % above average, with 21 %, 20 % and 25 % SWnet above the mean for the northeastern, northwestern and southern outlets, respectively. SWnet was 12 % above average for Mýrdalsjökull, 26 % for Eyjafjallajökull and 10 % for Drangajökull. In 2019, cloud cover was generally slightly above average (more clouds), with a colder-than-average spring but a dry, warm spell in midsummer.
The onset of the 2010 and 2011 eruptions in early spring maximized their impact on melt, as the LAPs could enhance radiative forcing for almost the whole melt season, while the tephra deposits in fall 2004 were quickly buried in the winter snow.
4.4 Melt enhancement due to volcanic eruptions and other LAP events
The impacts of the high LAP deposits in 2004, 2010, 2011 and 2019 were assessed to better understand the impacts on melt energy. The effect on SWnet forcing was estimated by comparing the SEB, assuming mean albedo for the study period (the 2000–2021 mean excluding 2010, 2011 and 2019 in the mean) to the energy balance estimated using the observed albedo in 2010, 2011 and 2019 and utilizing the same climatology forcings for both albedo scenarios. The estimated difference (SWnet forcing), from the observed albedo scenario and the study period mean albedo scenario, was denoted as the southwestern radiative forcing from LAPs (SW) and refers to the increased forcing (W m−2) above the study period mean values. The increase in melt potential, due to the additional radiative forcing from LAPs, was defined as the direct conversion of SW into water equivalent using the latent heat of fusion (0.26 mm d−1
,W m−2) and was referred to as SW. This approach does not fully consider all physical processes, e.g., as it did not take into account the effect on the albedo of different snow metamorphosis processes between years or the timing of melt-out of impurity-rich ice, but in this comparison these processes were secondary to the overwhelming impact LAPs had on the albedo, especially in 2010 and 2011. Additionally, the impacts on turbulent fluxes were ignored as they are considered negligible.
Figure 9 shows on monthly timescales how the SW (converted to millimeters) evolved between April and September for these selected years. In 2005 the SW was 4.3 W m−2, here associated with the November 2004 eruption in Grímsvötn, yielding a 211 mm SW for the AMJJAS period. The sharp increase in SW in July was associated with tephra layers melting out of the winter snow in the lower accumulation areas. Other glaciers did not experience a SW increase, with the exception of Drangajökull, where it is unlikely to have been caused by LAPs from the 2004 Grímsvötn eruption. Figure 8 shows the distribution of melt energy, indicating that the southwestern outlets of Vatnajökull experienced limited impact. In a similar manner, the melt potential increase for Mýrdalsjökull, mainly focused on the northeastern outlet, is unlikely to have been linked to LAPs from Vatnajökull.
For Vatnajökull the SW was 18.4 W m−2 in 2010, i.e., the estimated additional radiative forcing due to LAPs compared to the long-term average for AMJJAS. This corresponds to 892 mm of SW for the AMJJAS period. An extensive SW increase was seen for all the major glaciers in 2010, with the exception of Drangajökull. SW from LAPs was 27.3, 27.7, 44.6 and 53.2 W m−2 for Hofsjökull, Langjökull, Mýrdalsjökull and Eyjafjallajökull, respectively. As expected, the impacts were most extensive at Eyjafjallajökull and Mýrdalsjökull due to the proximity of the eruption and LAP source. Drangajökull was the exception to these extremes, with only a slight increase in SW, 2.5 W m−2, meaning that the impact of LAP deposits associated with the 2010 eruption was limited. Further increasing the potential impact of LAPs on melt energy, 2010 had cloud cover well below average.
The Grímsvötn eruption in 2011 had the most impact on Vatnajökull, especially its southwestern outlets. The impact was similar to that in 2010, with an SW of 19.1 W m−2 (925 mm of SW). For the other glaciers the impact was much less than in 2010. For Eyjafjallajökull and Mýrdalsjökull the impact was more likely related to the huge quantities of tephra deposits from the 2010 eruption than additional LAPs from the 2011 Grímsvötn eruption. For Langjökull and Hofsjökull the SW was 8.6 and 8.8 W m−2 (415 and 425 mm of SW), respectively. As previously mentioned, the melt season in 2011 had a different climatology than the previous year, with above-average cloud cover and lower air temperatures, not fully utilizing the melt enhancement potential from the LAPs deposited. The vast quantities of tephra transported in 2010 to glaciated surfaces, as well as those deposited outside glacier-covered areas, likely had a residual effect in 2011. SW was negative for Drangajökull in 2011.
The large observed LAPs in 2019 yielded a significant SW for all the glaciers. The SW was 7.0 W m−2 (341 mm of SW) at Vatnajökull, 12.9 W m−2 (624 mm SW) at Langjökull and 8.4 W m−2 (407 mm of SW) at Hofsjökull. At these glaciers the SW was higher in the early melt season, with less impact in July and August, partly due to frequent snowfall events in mid and late August increasing albedo and reducing SWnet. At Drangajökull the SW was highest for the years studied, resulting in a SW of 5.6 W m−2 yielding 245 mm of SW.
As expected, the results show short-wave radiation as the major melt energy component and reveal variability in melt energy between glaciers and years. Water resources in Iceland rely heavily on glacier melt and are increasingly aware of the potential impacts of radiative forcing by LAPs on snow and ice relative to glacier mass balance as well as the impact on regional hydrology.
This study improves knowledge of the spatiotemporal variations of the surface energy balance of glaciers in Iceland and shows the importance and possibility of incorporating remotely sensed albedo during the melt season. Albedo is often greatly impacted by external processes not generally represented in glacier modeling but can be observed in remotely sensed data. Although less albedo variability is expected during winter, a challenge remains due to polar darkness, as limited albedo data are available during winter to model the surface energy balance for the full hydrological year.
The impacts of tephra deposits from volcanic eruptions and dust and sand transport from pro-glacial areas (dust hotspots) were clearly seen through the radiative forcing by LAPs in snow and glacier surfaces. With future projections of less seasonal snow during winter due to climate warming, earlier melt-out of seasonal snow in spring exposing pro-glacial areas (dust hotspots) will likely become more frequent, enhancing melt (Björnsson et al., 2018). Here, estimates show that melt enhancement due to high LAPs was 10 %–50 % higher than average, depending on the glacier investigated, greatly impacting the glacier summer mass balance. Estimations of future glacier development need to incorporate these processes for improved estimation of the SEB.
Since climate in Iceland is driven by oceanic and atmospheric circulations, annual climate variability is high, reflected in complex processes in large-scale global climate dynamics. For the study period, 2000–2021, all input and output data were checked for monotonic trends using the nonparametric Mann–Kendall test in terms of the total change in a least-square fit. The probability of rejecting the null hypothesis when the null hypothesis is true was estimated at α = 0.05. In most cases the high climate variability, on both monthly and annual timescales, yields non-significant trends in the data over the study period. Trends over longer timescales for glacier runoff and increased mass loss of Icelandic glaciers are obvious and have been confirmed in other studies (Björnsson et al., 2018; Schmidt et al., 2020; Aðalgeirsdóttir et al., 2020; Noël et al., 2022). Gunnarsson et al. (2021) found significant positive trends for surface albedo for the 2000–2019 period in parts of northeastern and northwestern Vatnajökull. Very low albedo values in northeastern and northwestern Vatnajökull in summer 2021 have mostly eradicated the trend if the period is extended to 2021. Since the data only span 20 years, statistical interpretation such as trends should be treated with care.
Figures B6 to B11 show annual anomaly variations (MJJA) for selected climate variables over the study period 2000–2021. SWnet is highly modulated by cloud cover and surface albedo, and the variability was reflected in the cloud cover and surface albedo variability. High cloud cover in 2015 and 2018 coincides with the only years with positive observed surface mass balance during the study period for Vatnajökull (Pálsson et al., 2020). As an example of the complex relations between Iceland climate and oceanic and atmospheric circulations, Keil et al. (2020) suggested that more low-level clouds are being produced due to cooler sea surface temperatures at the North Atlantic warming hole (56 to 50∘ N and 33 to 39∘ W), leading to reductions in incoming solar radiation and further surface cooling.
Uncertainty sources and limitations
Remotely sensed MODIS albedo data availability is impacted by persistent cloud cover. Since gap-filled albedo was based on temporal aggregation, potentially short-lived snowfall events during summer could be missed within extended periods of cloud cover, increasing albedo. This would result in overestimation of melt during the period. On a melt season timescale, these effects were likely limited, although they are more prominent on shorter timescales. Tephra deposits from volcanic eruptions can, in proximity to the eruption source, have enough thickness to isolate the surface from melt energy. The results presented here assume that areas with low albedo values post-eruption in proximity to eruption sources do not have isolating capabilities, which introduces some uncertainty. This is partly due to the remotely sensed albedo workflow, as it cannot identity and discriminate between areas that isolate the surface and those that do not. Future work, e.g., spectral unmixing, might contribute to spatial estimations of isolation capabilities of the tephra layers. Further discussion of the albedo data-processing limitations are found in Gunnarsson et al. (2021).
Currently, no spatiotemporal dataset exists with areal estimates of tephra layer thickness that could have been incorporated into the workflow. In these areas, where the surface becomes isolated, the surface temperature could rise above the 273.15 K constraint of a melting surface covered with ice or snow, impacting the estimation of outgoing long-wave radiation and turbulent heat fluxes. This also influences one of the main assumptions of the SEB model that closes the SEB by iteratively solving for surface temperature, indicating the availability of melt energy with solutions higher than 273.15 K. Since limited data were available to fully estimate where isolation might have occurred and more complex modeling is needed to fully represent the problem, all energy balance components were considered to contribute to melt energy for all areas and times. Since outgoing long-wave radiation was calculated based on the Stefan–Boltzmann law assuming broadband emissivity of snow and ice, isolating tephra layers would influence these assumptions and the resulting LW↑ estimate with changes in surface emissivity.
Volcanic tephra deposits were thick enough to isolate parts of the surface at Eyjafjallajökull and Mýrdalsjökull in 2010 and very probably in the following year or years, causing partial isolation of the surface. In 2011, parts of the glacier surface around Grímsvötn in Vatnajökull were isolated, but as this occurred mostly in the accumulation area, the post-year effect was very likely limited.
Various limitations to turbulent flux estimations using the bulk aerodynamic approach exist as many assumptions and simplifications were utilized to estimate the complex interactions between the atmosphere and the glacier surface. Thick-enough tephra deposits could impact the surface roughness values (z0) that impact the turbulent flux estimation. Our experience suggests that the deposition of airborne LAP (non-volcanic origin) to glacier surfaces does not accumulate to the extent that the surface properties shift from snow or ice to soil, allowing for a surface temperature above 273.15 K. Various studies have estimated the sensitivity of z0 and impacts on the estimated turbulent fluxes; underestimated z0 values will result in underestimation of turbulent fluxes and vice versa (Denby and Greuell, 2000; Schmidt et al., 2017). In this study, z0 was estimated for each pixel with a general usage of single values for ice and snow based on surface albedo values. Surface classification, discriminating between ice and snow, assuming surface albedo higher than 0.45 as snow and lower than 0.45 as ice, has limitations as well. In reality, these values likely had more spatial and temporal variability depending on glaciers and glacier outlets in Iceland, but limited studies exist. This is a research topic for future studies.
The model meteorological forcing data were combined from three different but similar WRF configurations. Although the bulk of the period was from the WRF RAV2 configuration, externally forced with ECMWF ERA-Interim data, the more recent data, ICEB and FCST, were forced with the National Centers for Environmental Prediction Global Forecast System (GFS). This shows that the combined forcing datasets might not be fully consistent. Although the validation results show similar behavior of the variables validated, both for the whole period and individual months during the melt season, there were far fewer data available for ICEB and FCST for thorough validation. Alternative external forcing could also result in different dynamical behaviors, such as storm tracks, moisture transport and other complex climate dynamics represented differently for different forcing data, impacting melt. Quantification of the effects of combining forcing datasets is challenging with no extensive overlapping periods.
In the SEB model the subsurface heat flux (cold content of the snow) was assumed to be zero, as was energy from precipitation. This is a source of uncertainty. Since the snowpack accumulation during winter was not modeled, the cold content was not easily estimated, although Icelandic glaciers are temperate glaciers. In the study the energy contribution from cold content was assumed to be zero; i.e., there was no contribution to the energy balance. Observed temperature in spring surface mass balance data indicates that cold content was not a major energy source or sink, although it provides regulation of the melt energy during the warming and ripening phases of the snowpack (Jennings et al., 2018; Helgason, 2020) (unpublished data). The assumption of zero subsurface heat flux for AWS data has been applied in many recent studies of energy balance and surface melt for Icelandic glaciers (e.g., Guðmundsson et al., 2005, 2009; Wittmann et al., 2017; Schmidt et al., 2017).
The validation between the observations and met forcings incorporates uncertainties that impact the calculated energy balance. Since short-wave radiation forced at the surface SWnet was the major driver of melt energy, both uncertainties in the SWin and estimated surface albedo contribute to overestimation or underestimation of melt energy. Biases in air temperature were generally negative, suggesting a model overestimation of air temperature and resulting in overestimation of turbulent fluxes and thus in melt energy overestimation.
Observed data in complex and often harsh weather conditions can also include errors from instrumentation. When validating modeling results and remotely sensed products with observations, it is important to consider these sources of error, both in time and space. When validating a larger spatial footprint data, such as 500 m downscaled forcing and MODIS albedo, and comparing them to point observations from met stations, this should be considered as high spatial variability and subpixel variability often exists for Icelandic glaciers, especially in the bare-ice areas.
In this study, melt season SEB for Icelandic glaciers was estimated using high-resolution meteorological climate forcing and remotely sensed glacier surface albedo from the MODIS sensor for melt seasons 2000–2021 at 500 m spatial resolution. The calculation framework was applied to all glaciers in Iceland larger than 8 km2, but results are presented for the largest glaciers: Vatnajökull, Langjökull, Hofsjökull, Mýrdalsjökull, Eyjafjallajökull and Drangajökull.
The main results show large seasonal and inter-annual variability in SEB for Icelandic glaciers. The variability was influenced by high climate variability, LAPs from tephra deposits from volcanic eruptions and dust hotspots from sources and pro-glacial areas close to the glaciers. Dust hotspots are subject to wind erosion and production of LAPs that can be transported over long distances.
The high variability meant that no significant trends were found, either in data driving the model or in the model output data. Details of spatiotemporal patterns were obtained as well as relations to the elevation and distribution of melt energy with elevation between years. The main energy melt source was from short-wave radiation modulated by surface albedo and cloud cover, which is in good agreement with previous studies.
The impacts of volcanic eruptions during the period (in 2004, 2010 and 2011) through the effect of dust and tephra deposits on radiative forcing were estimated by modeling the short-wave radiative forcing under observed albedo scenarios during the relevant periods and comparing them to an alternative evolution of albedo. The impacts were assessed by estimating the additional energy forced for surface melting, with up to 55 % additional melt energy forcing being found compared to the study period average. Radiative forcing due to LAPs in 2019 deriving from extensive airborne dust and sand deposits was also estimated, yielding a significant impact on the energy balance, with melt energy increasing significantly compared to the study period average albedo development under the same 2019 climate.
The methodology applied in the study, based on MODIS products and climate forcing data, can be utilized in near real time to assess the impacts of LAPs associated with volcanic eruption and dust storm deposits in ice and snow surfaces, providing insight into melt enhancements. It also allows for short-term as well as long-term monitoring of SEB variations for glaciers in Iceland.
Table A1Summary statistics and location information of meteorological stations. Figure 1 maps the location. The last three columns show the number of daily observations available for validation purposes for each variable used.
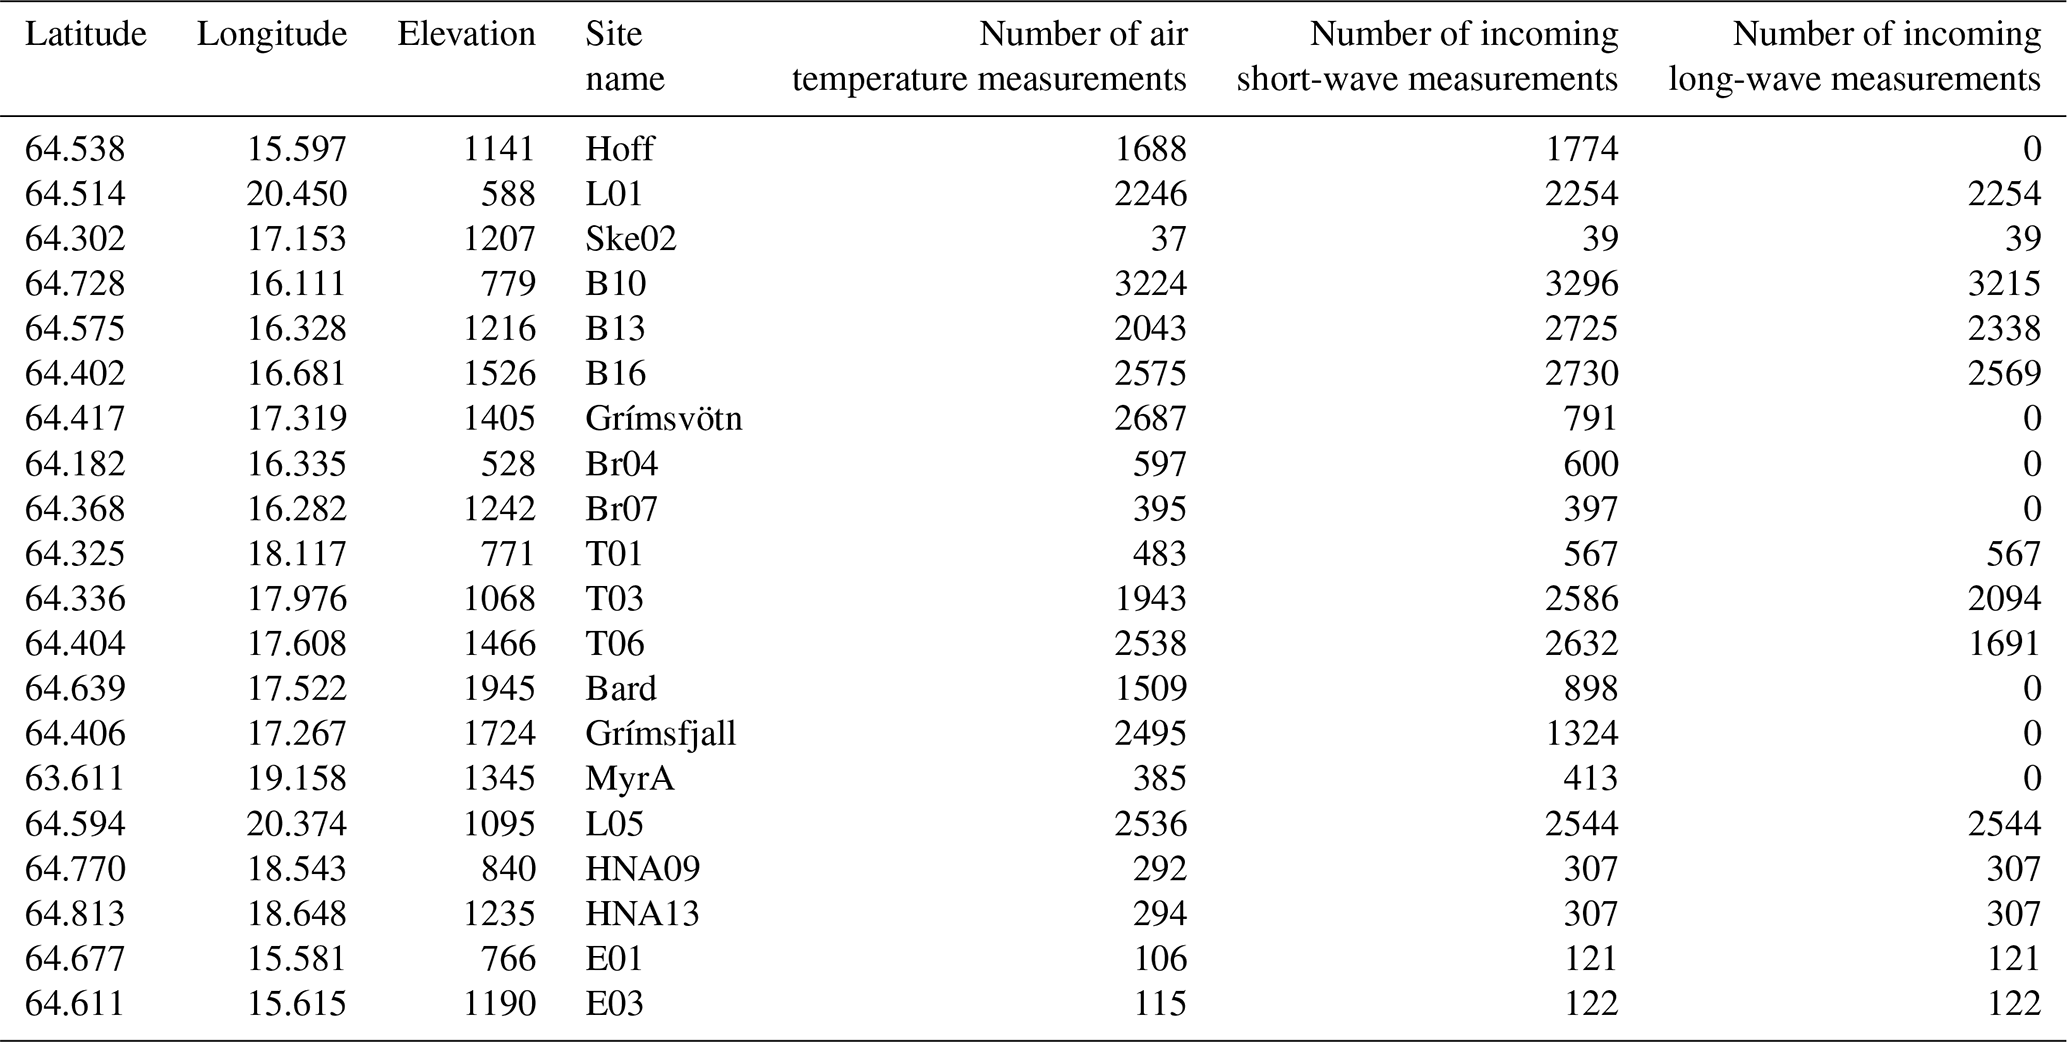
Table A2Summary statistics for daily outgoing solar radiation (SW↑), outgoing long-wave radiation (LW↑) and relative humidity (RH) from different WRF configurations validated with ground observations. “No. of sites” refers to the number of stations that were available for comparison purposes for each period.
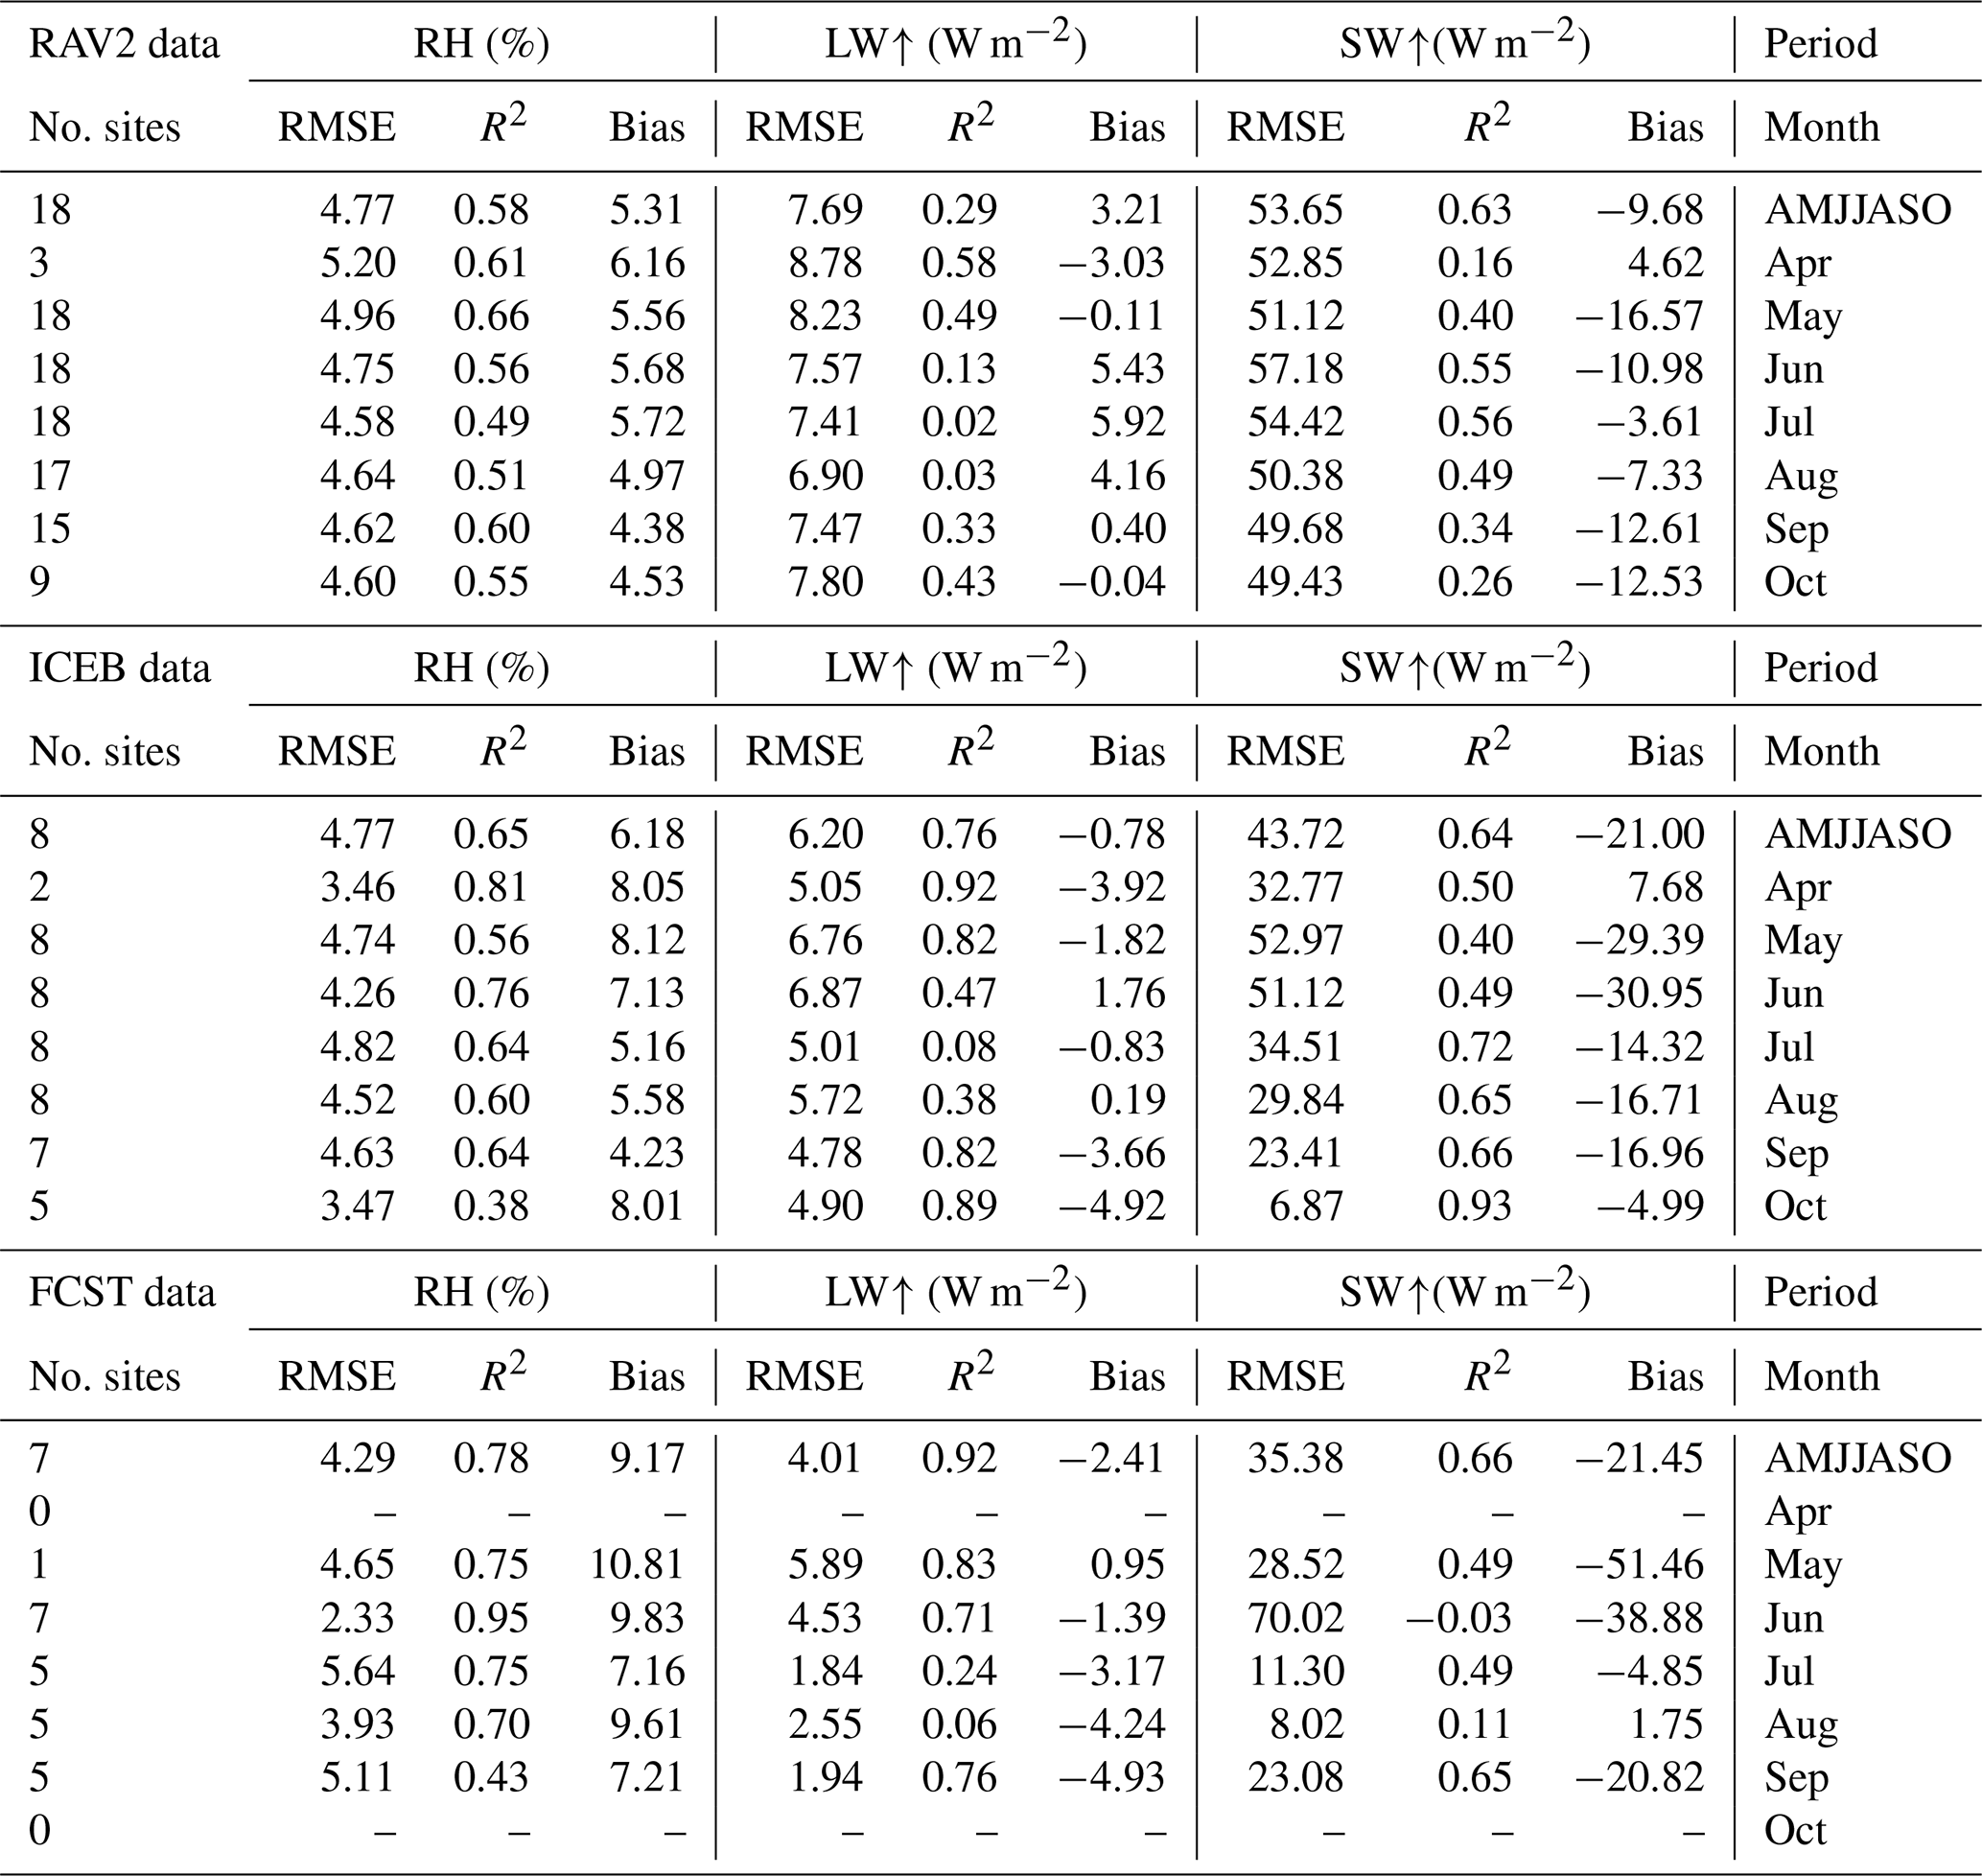
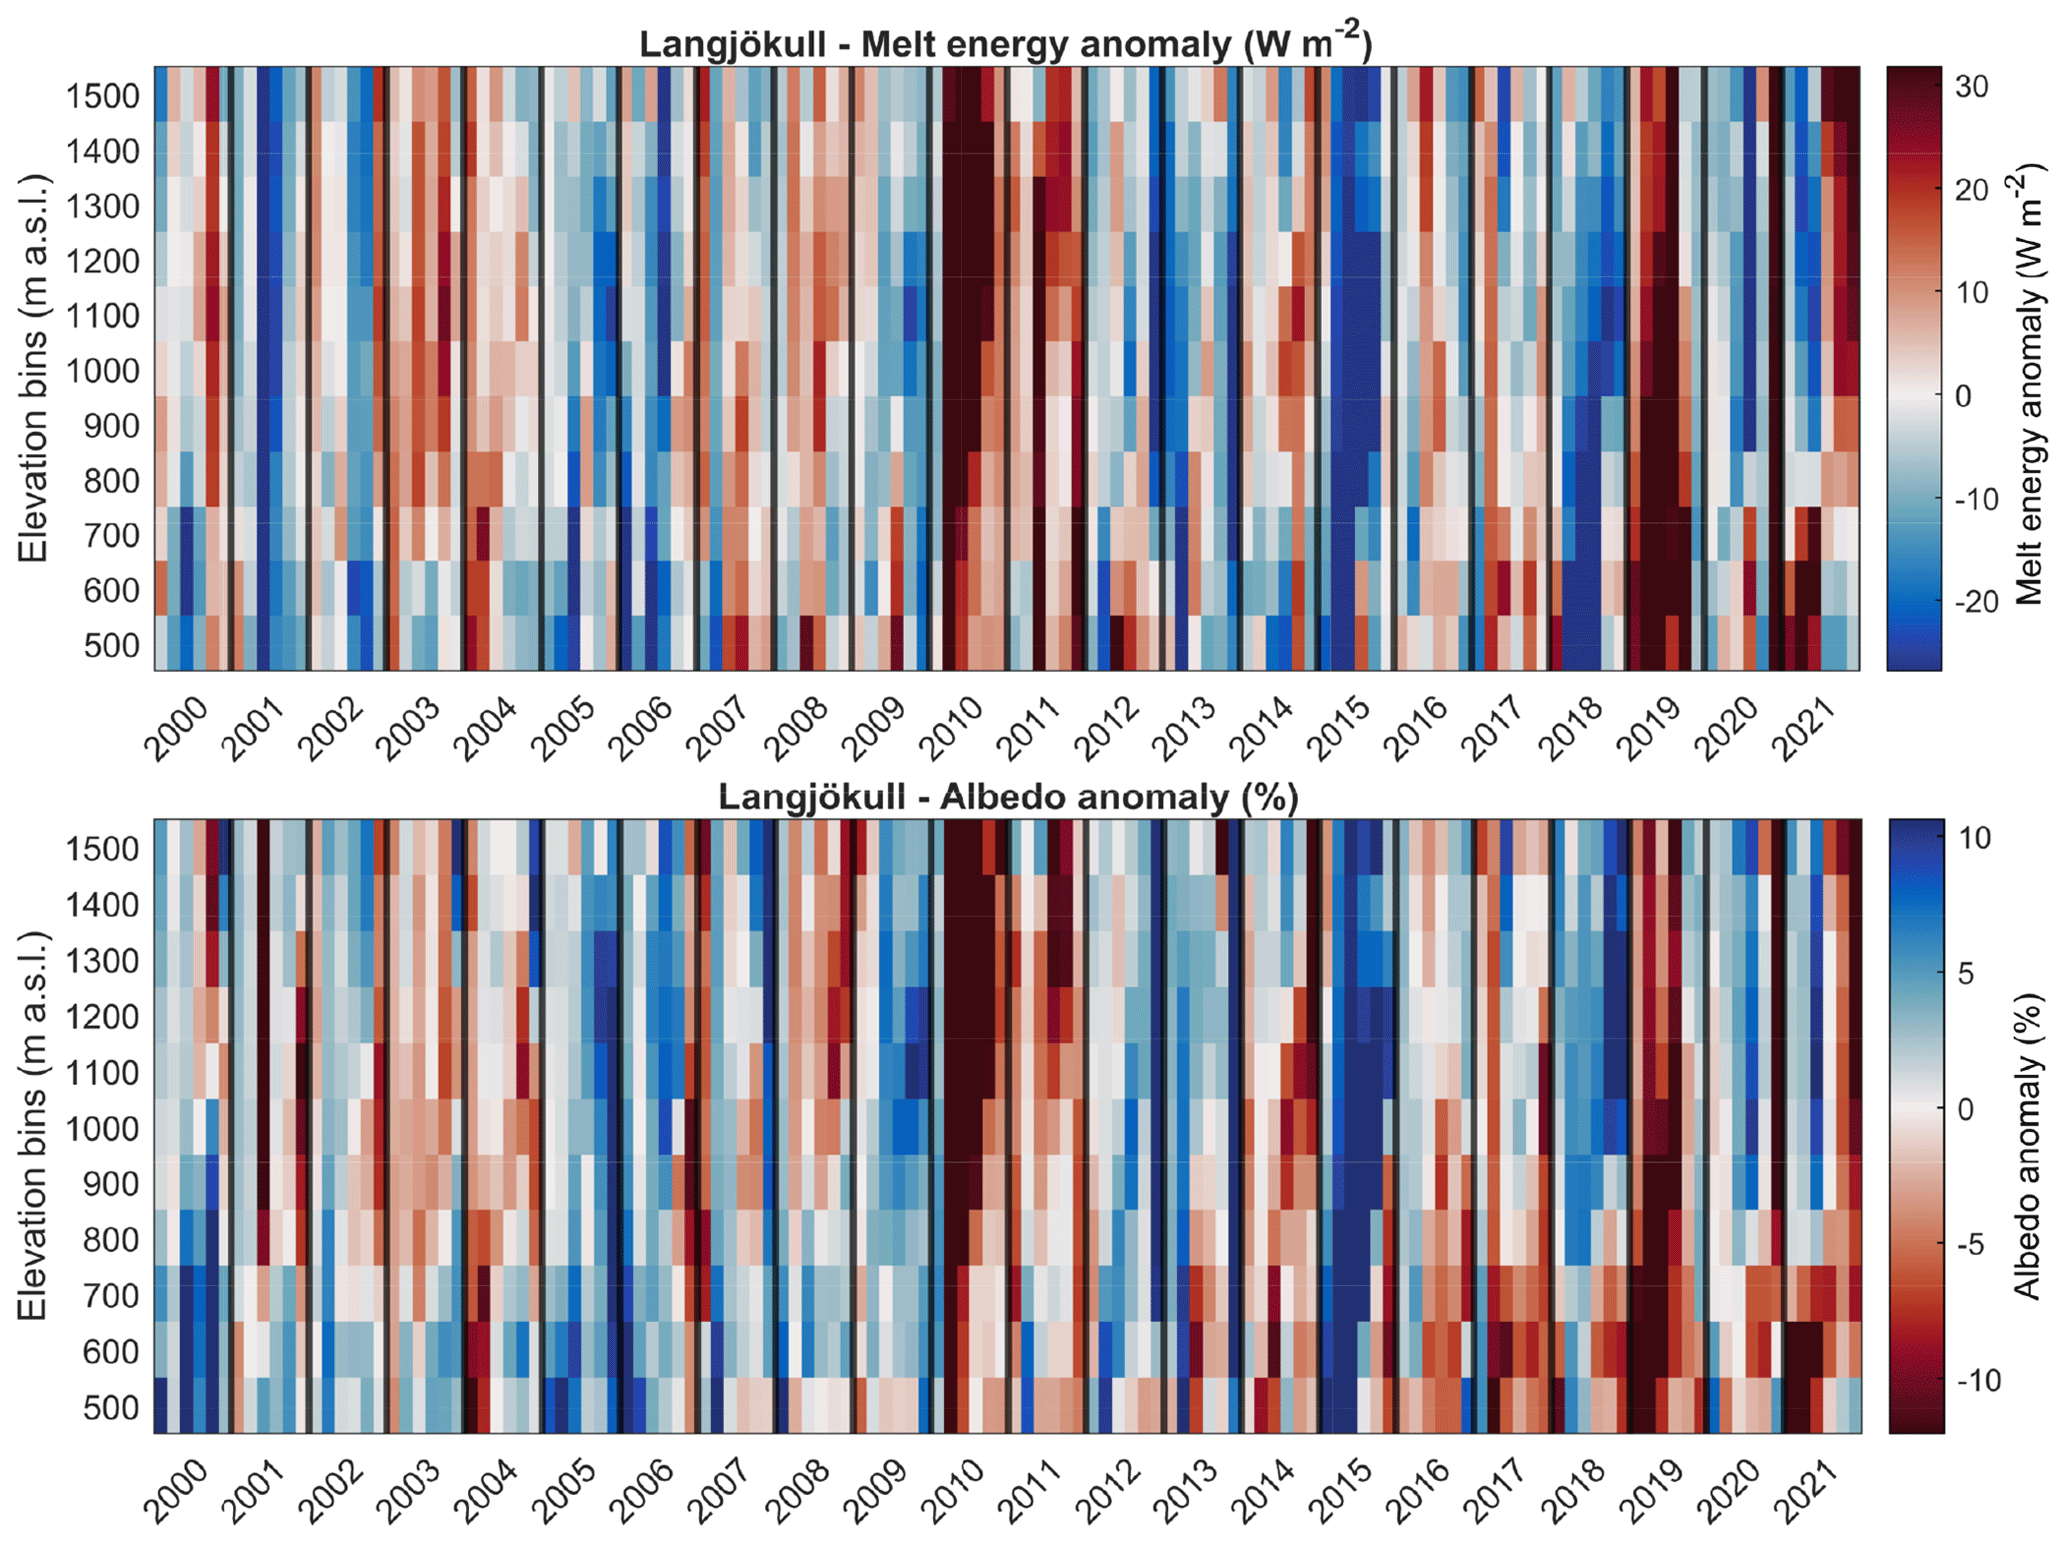
Figure B1Distribution of melt energy and albedo anomalies (W m−2) with elevation for Langjökull. The vertical axis shows elevation bins in 100 m intervals, and the horizontal axis shows monthly data for each year from April to September. Black vertical lines separate.
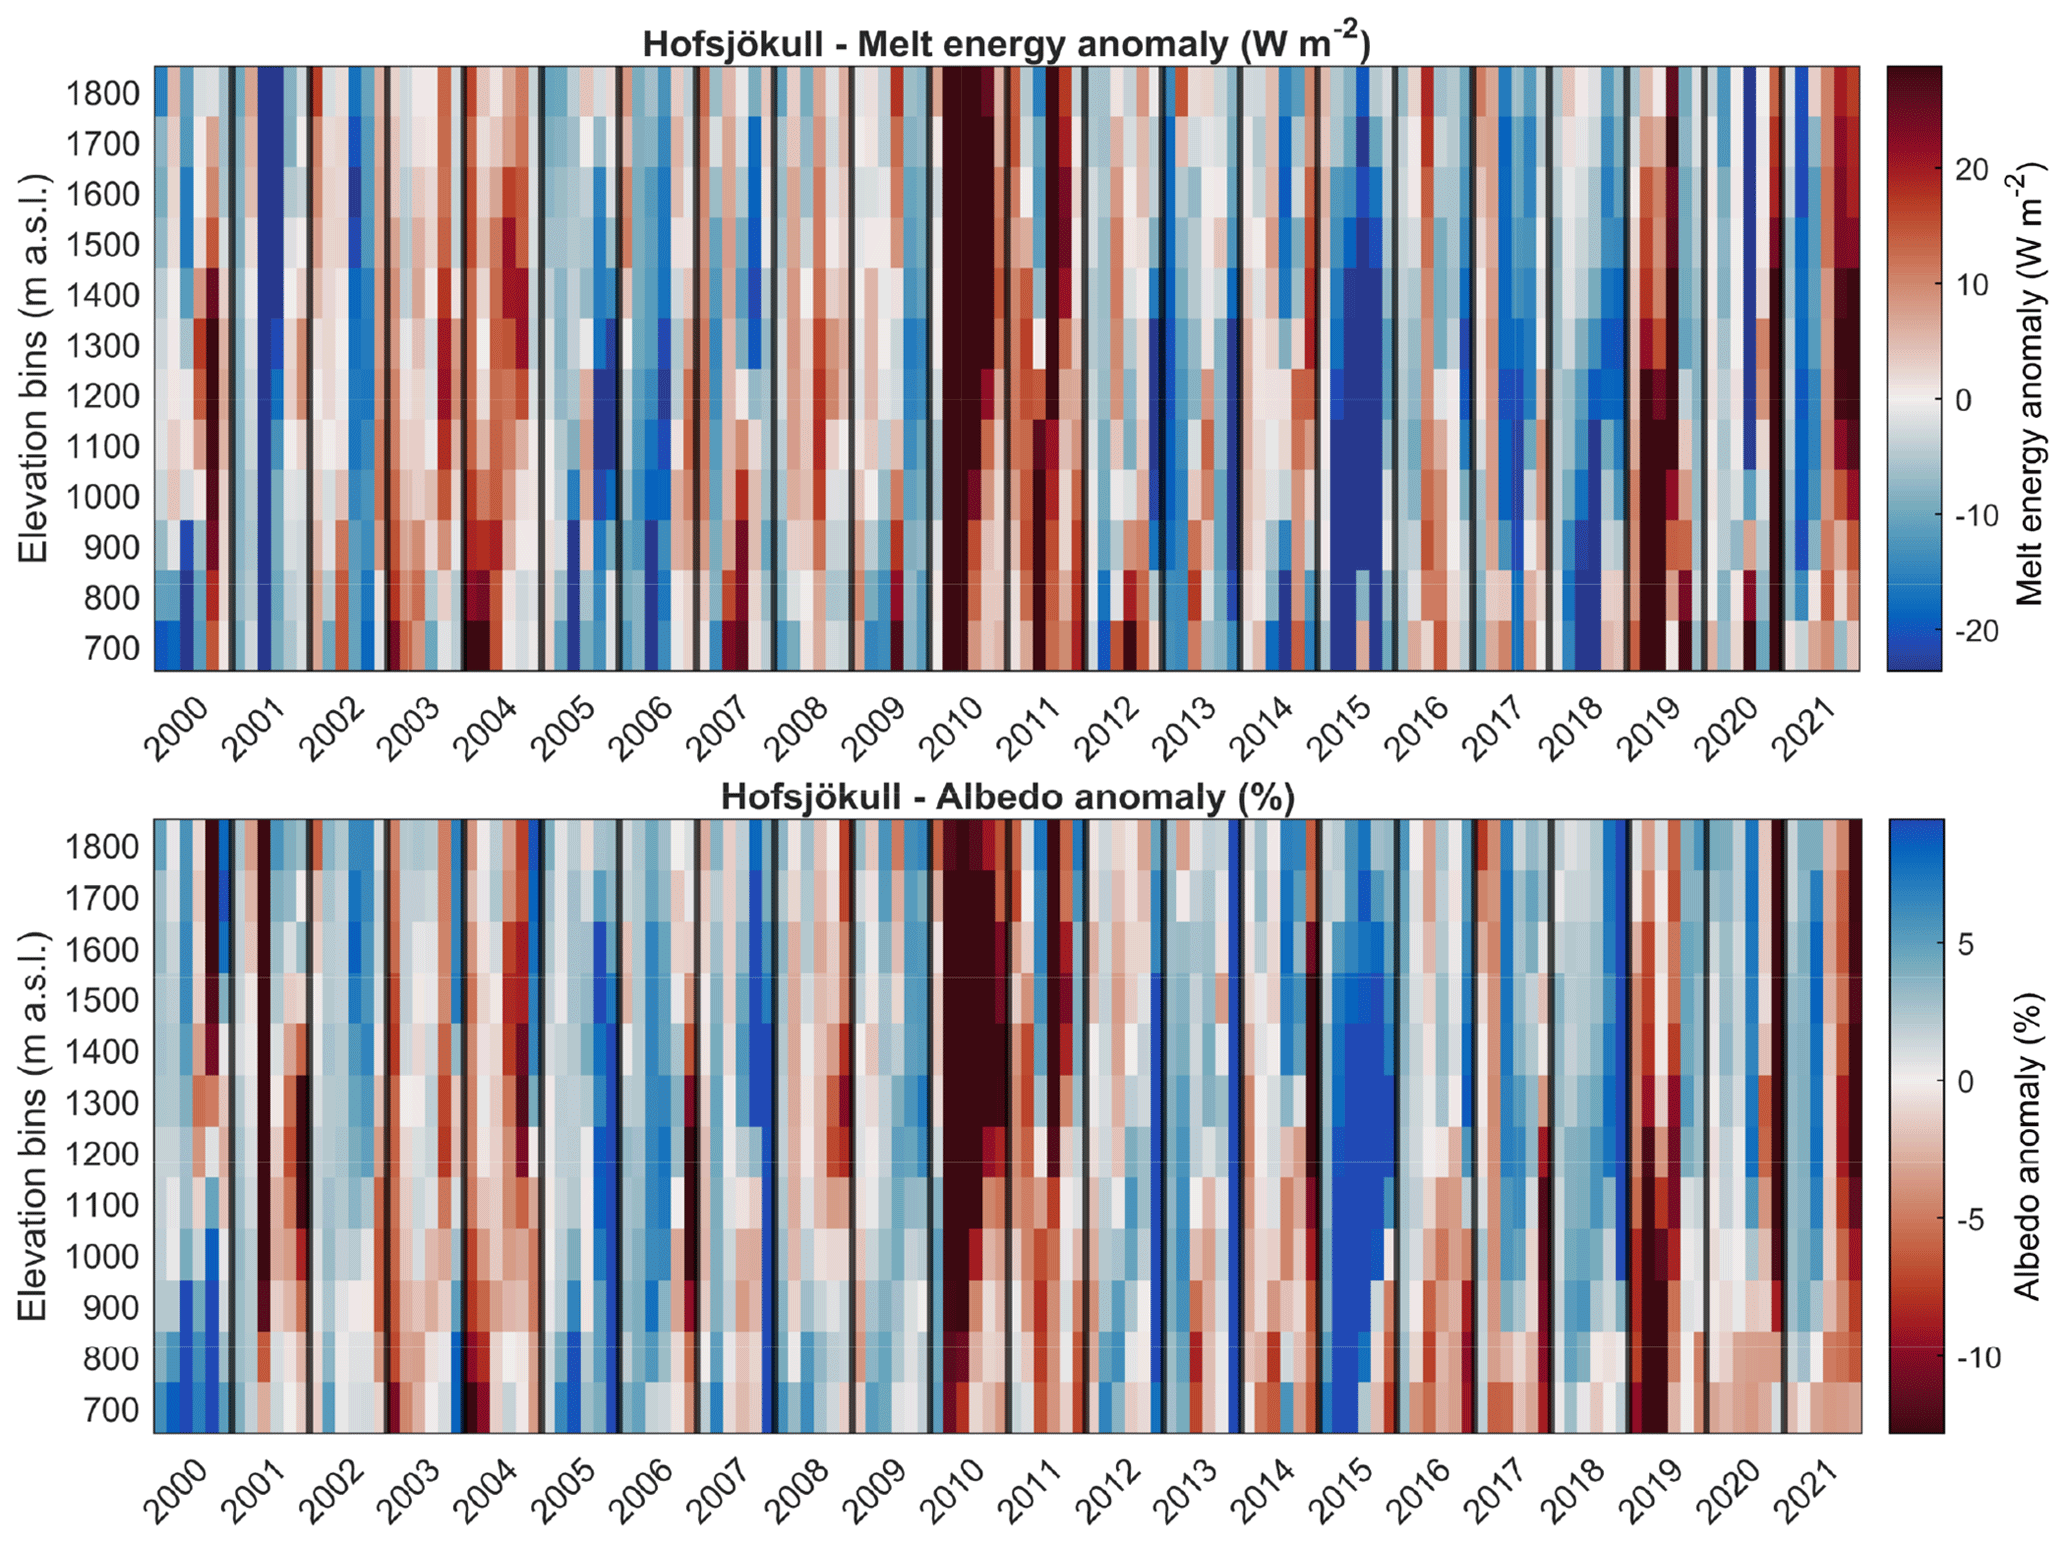
Figure B2Distribution of melt energy and albedo anomalies (W m−2) with elevation for Hofsjökull. The vertical axis shows elevation bins in 100 m intervals, and the horizontal axis shows monthly data for each year from April to September. Black vertical lines separate.
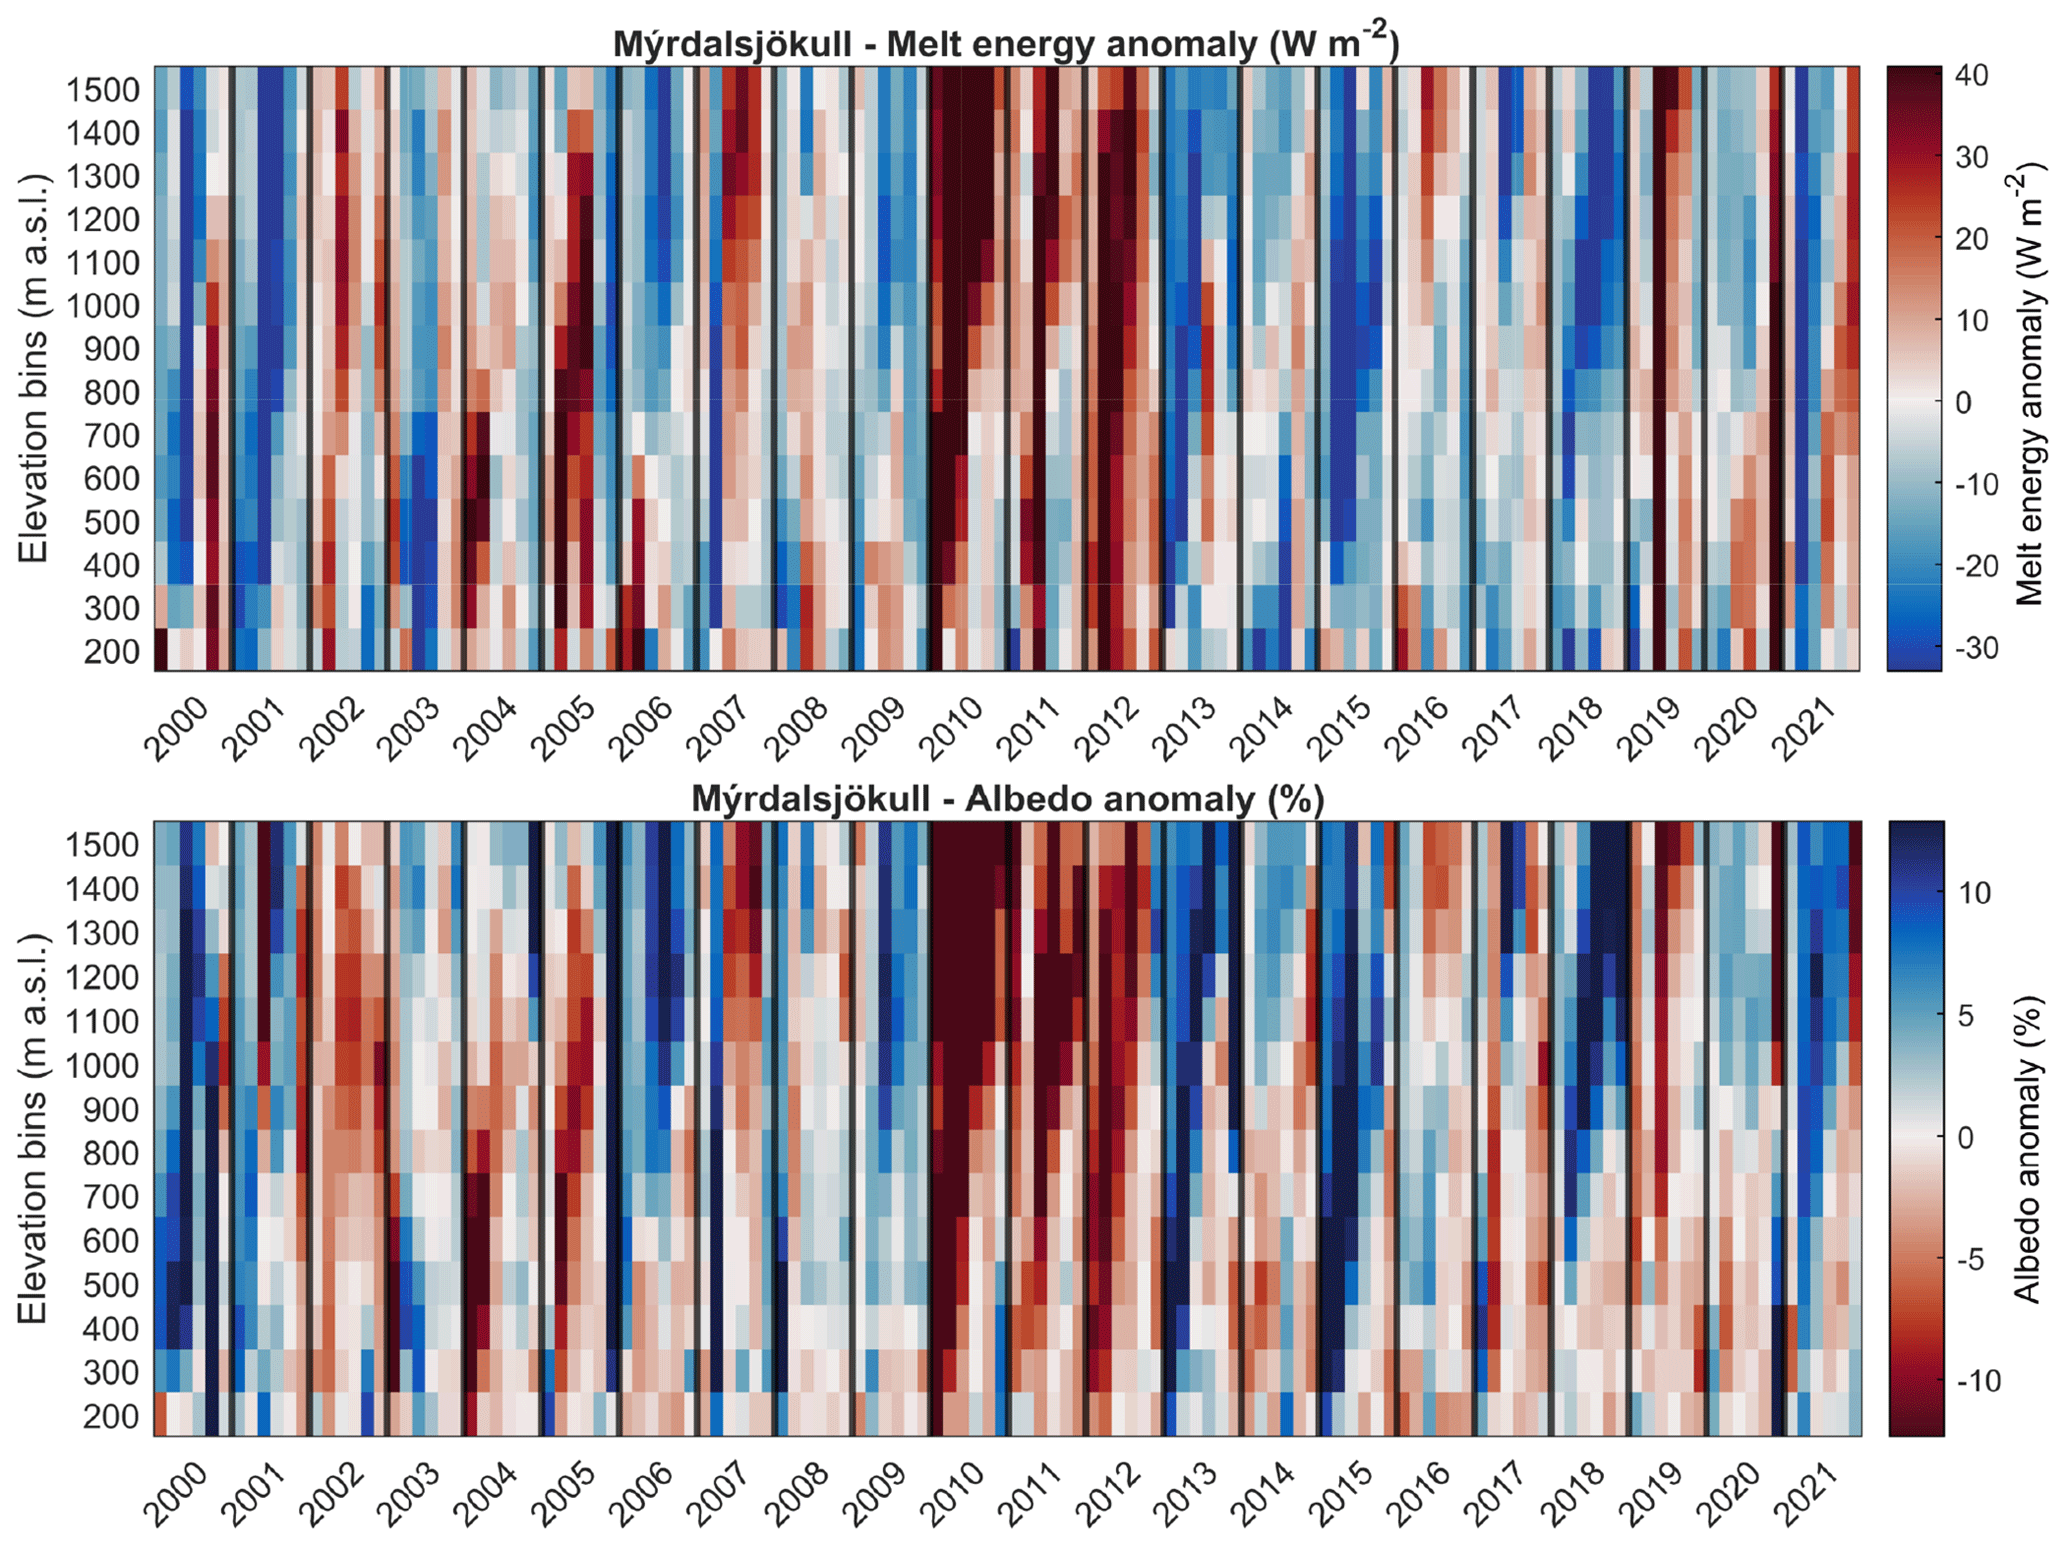
Figure B3Distribution of melt energy and albedo anomalies (W m−2) with elevation for Mýrdalsjökull. The vertical axis show elevation bins in 100 m intervals, and the horizontal axis shows monthly data for each year from April to September. Black vertical lines separate.
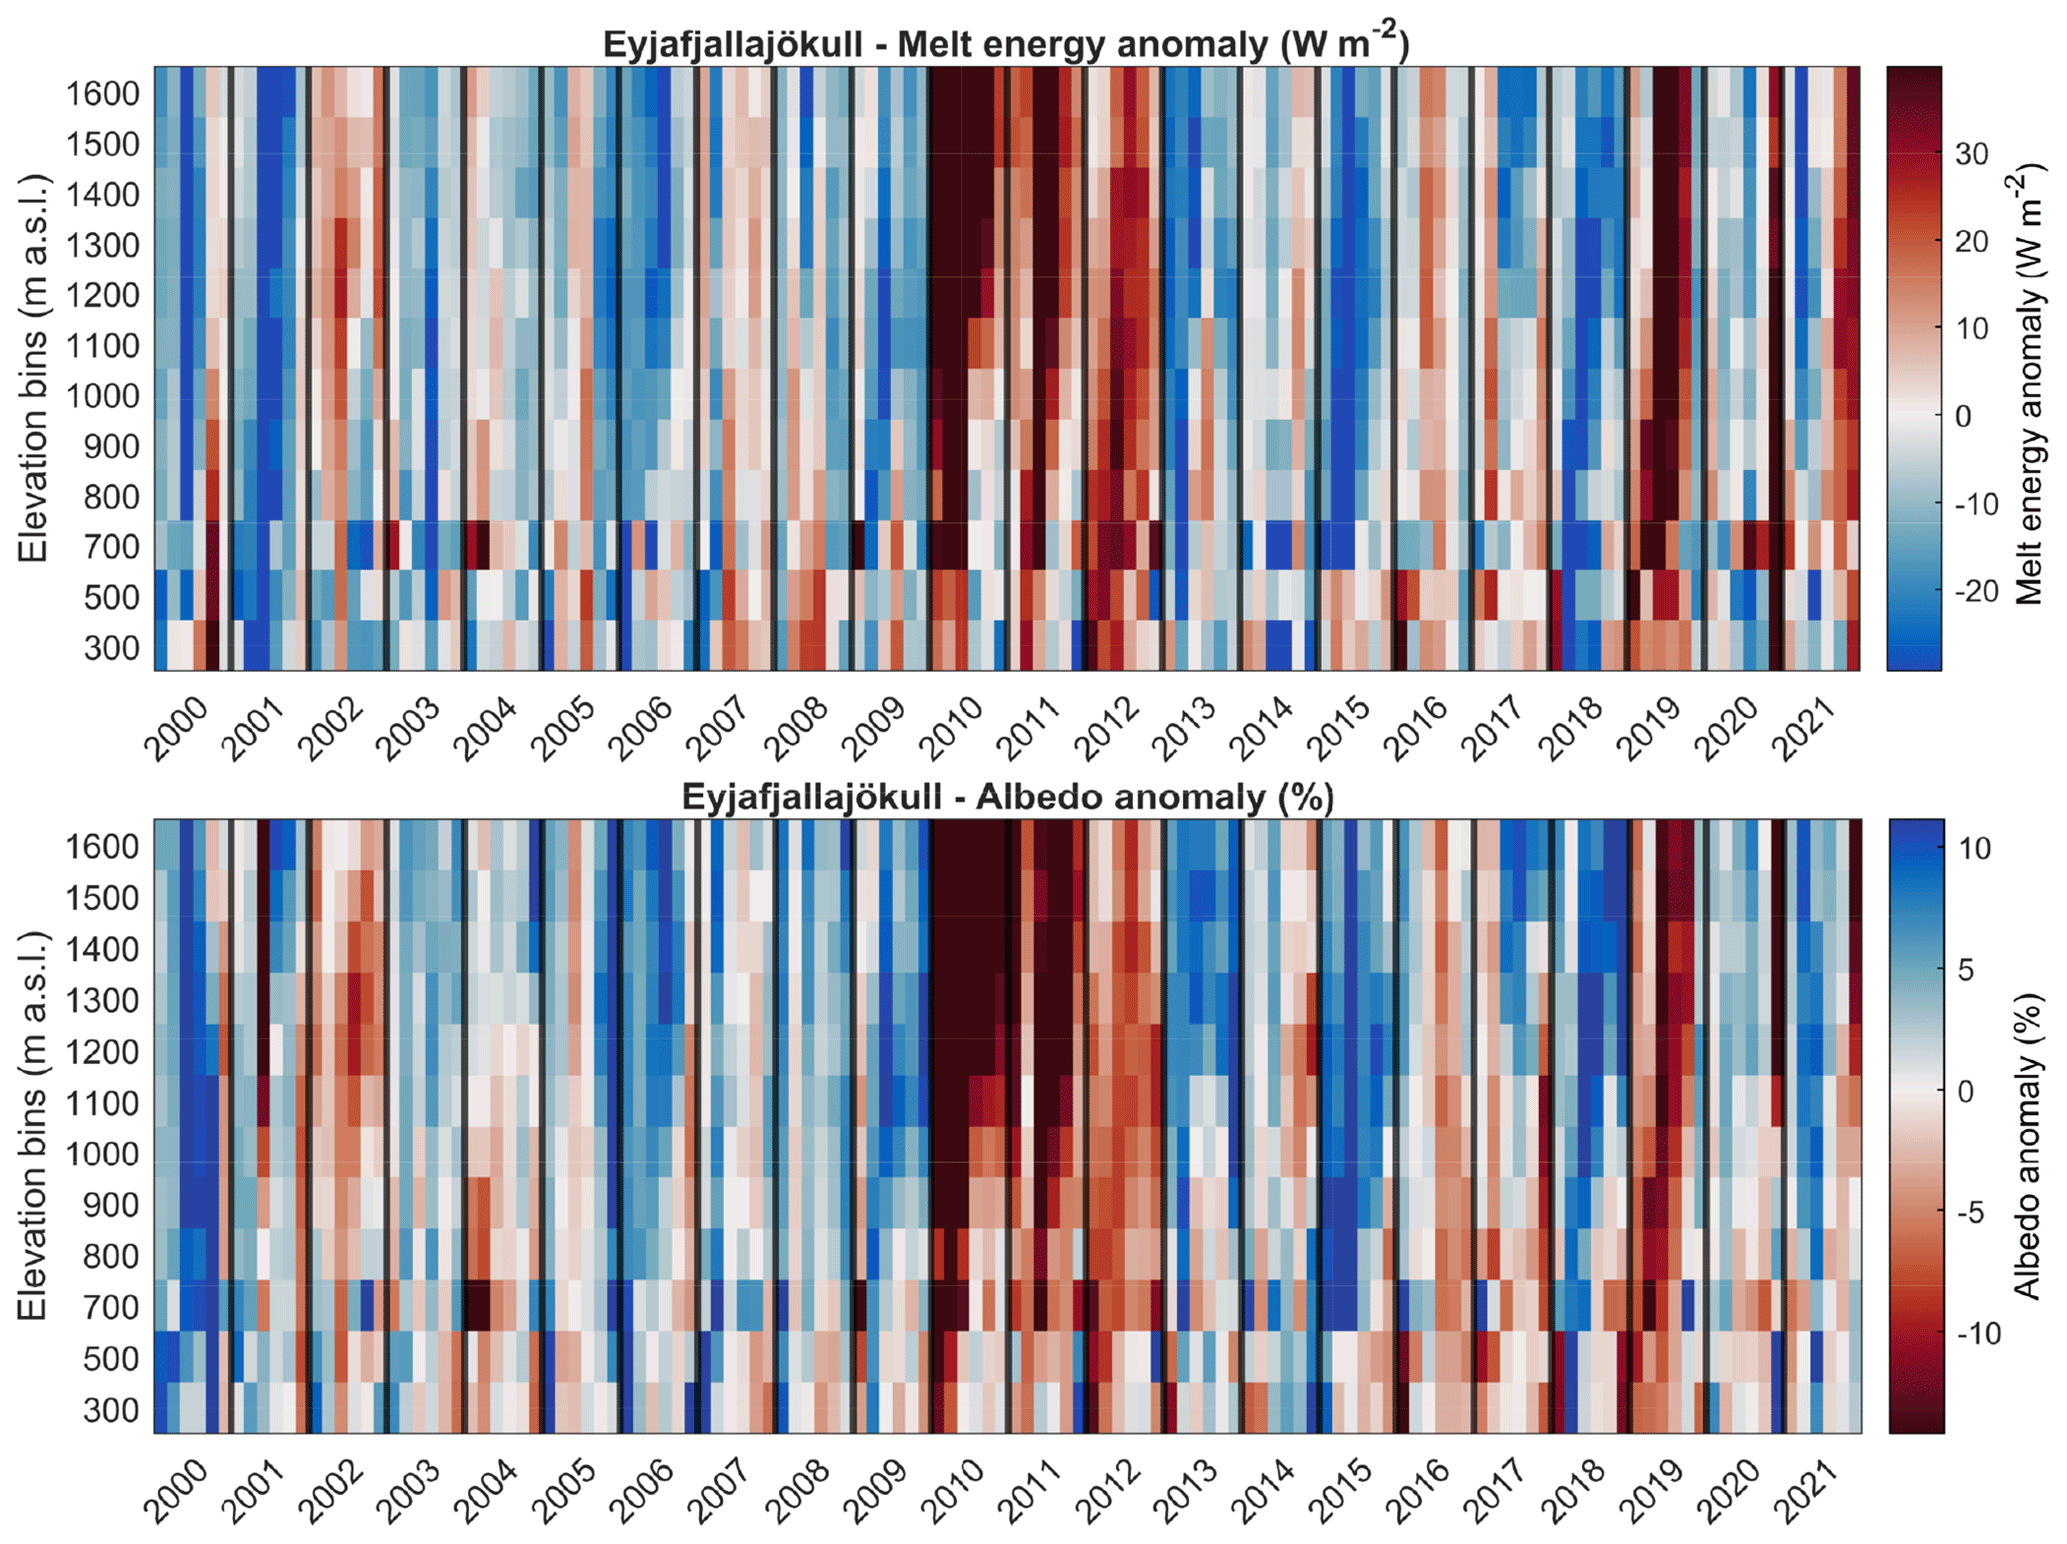
Figure B4Distribution of melt energy and albedo anomalies (W m−2) with elevation for Eyjafjallajökull. The vertical axis shows elevation bins in 100 m intervals, and the horizontal axis shows monthly data for each year from April to September. Black vertical lines separate.
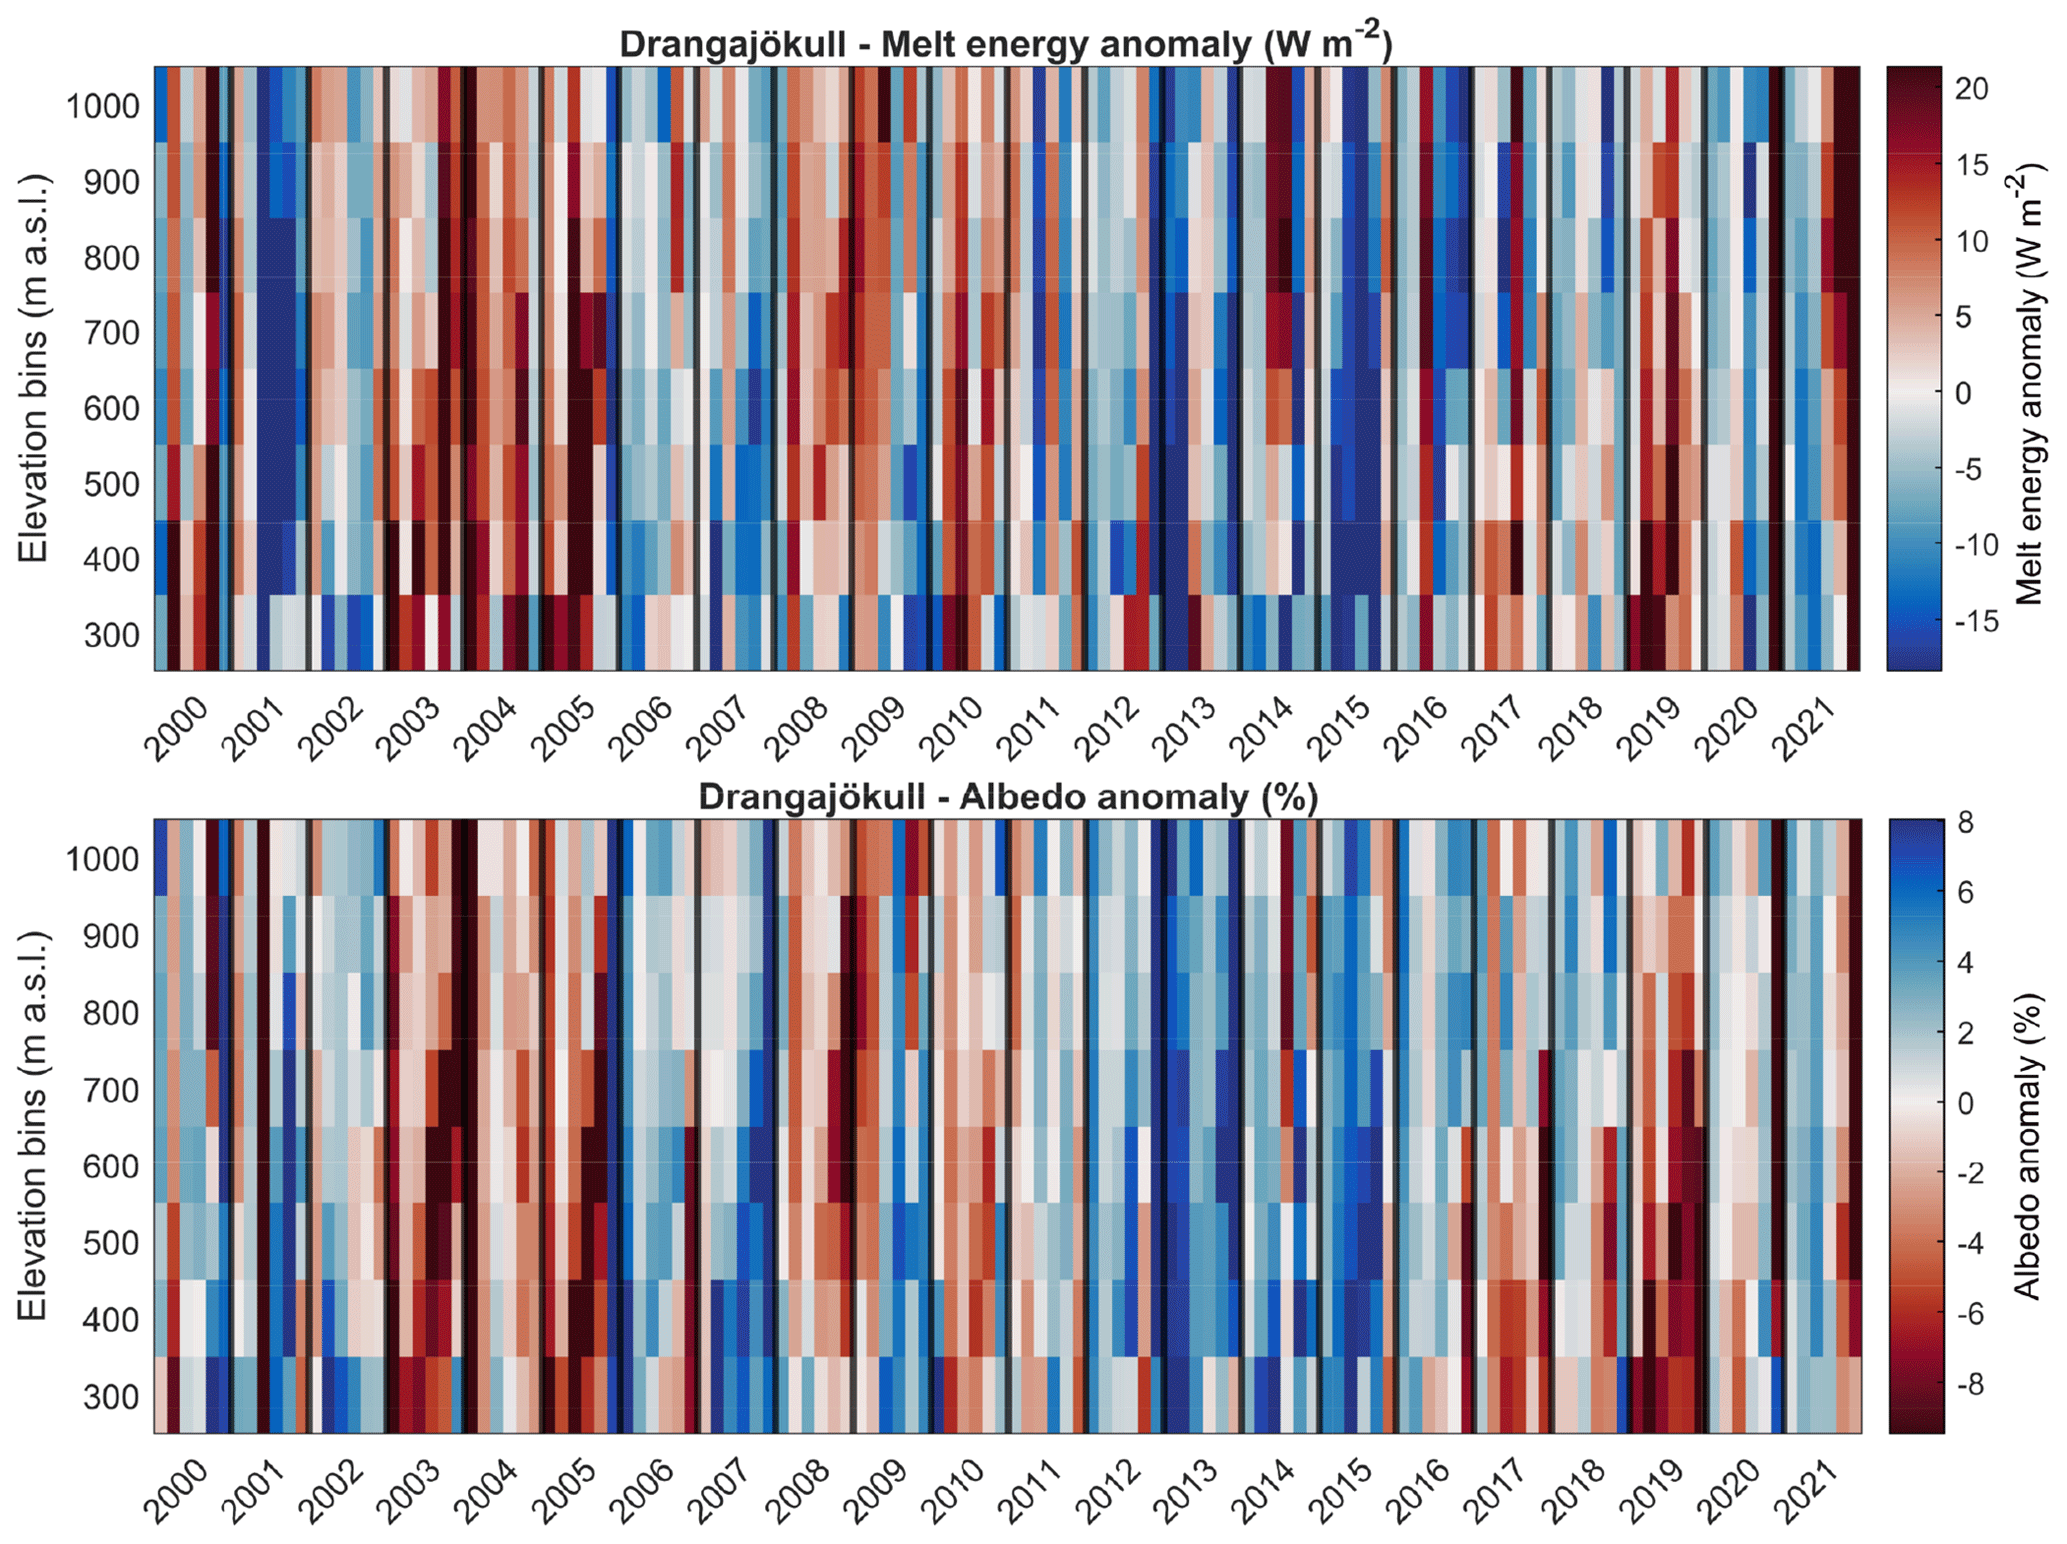
Figure B5Distribution of melt energy and albedo anomalies (W m−2) with elevation for Drangajökull. The vertical axis shows elevation bins in 100 m intervals, and the horizontal axis show monthly data for each year from April to September. Black vertical lines separate.
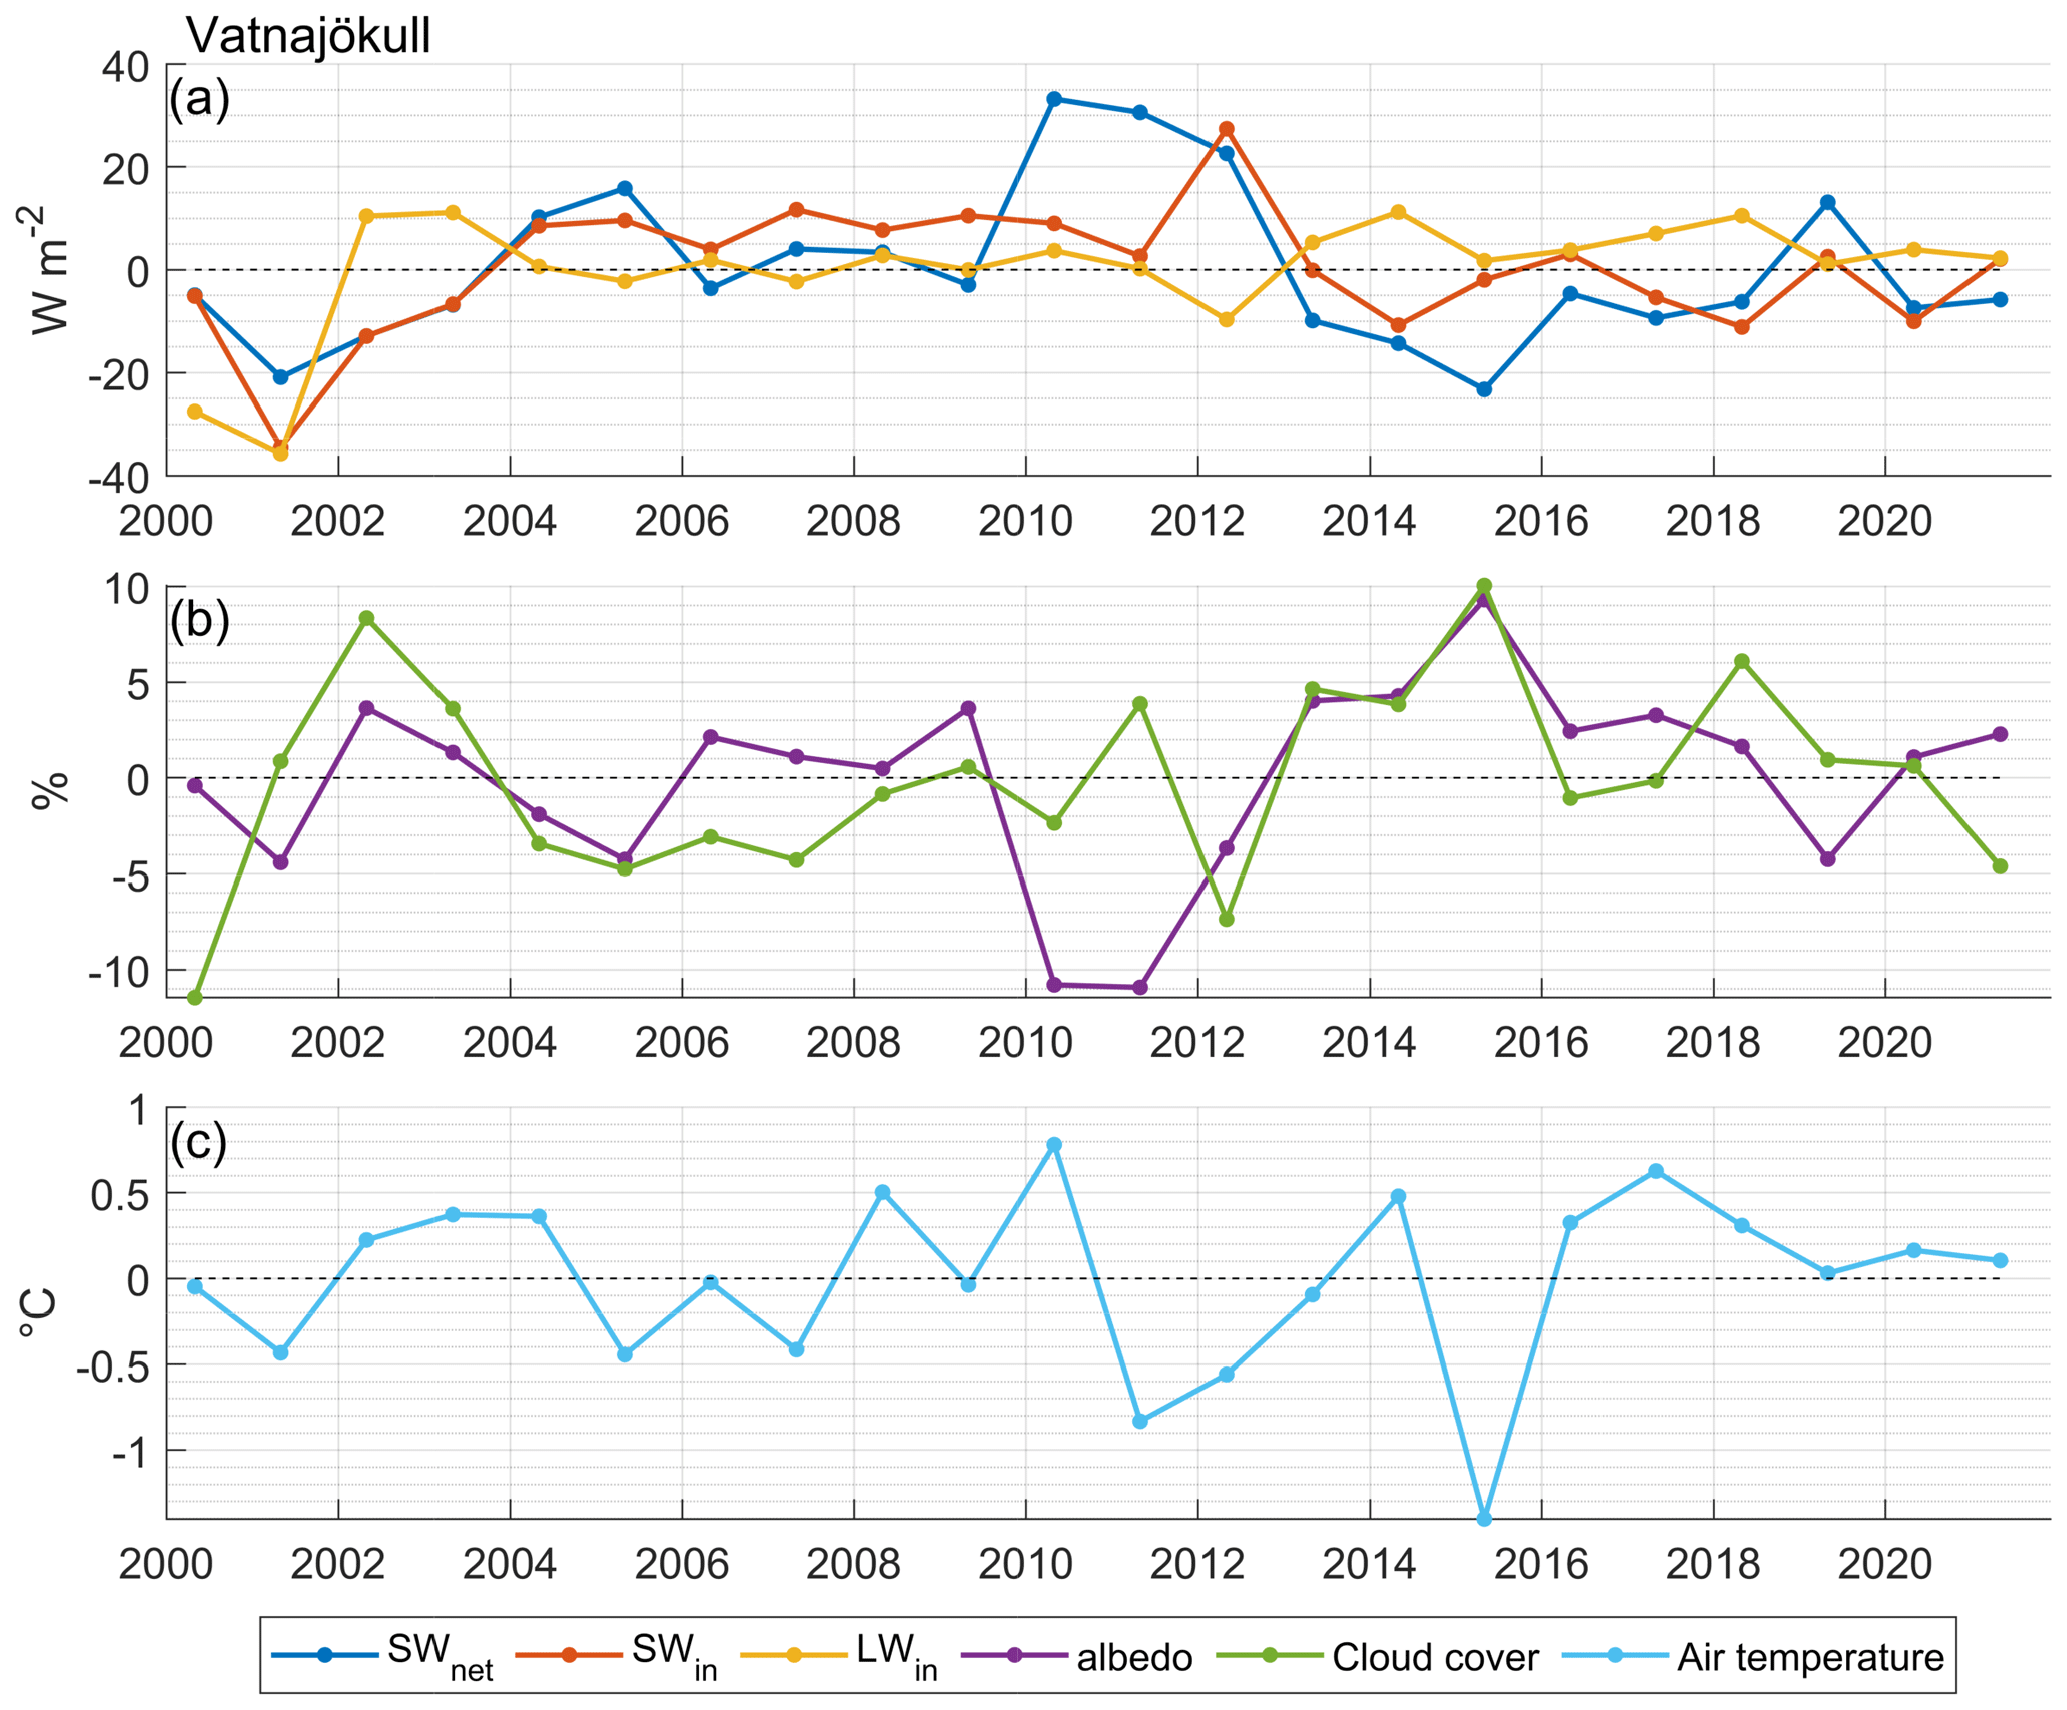
Figure B6Annual anomaly MJJA for selected variables for Vatnajökull. (a) Net, incoming SW↓ and incoming LW↓. (b) Albedo and cloud cover and (c) 2 m air temperature.
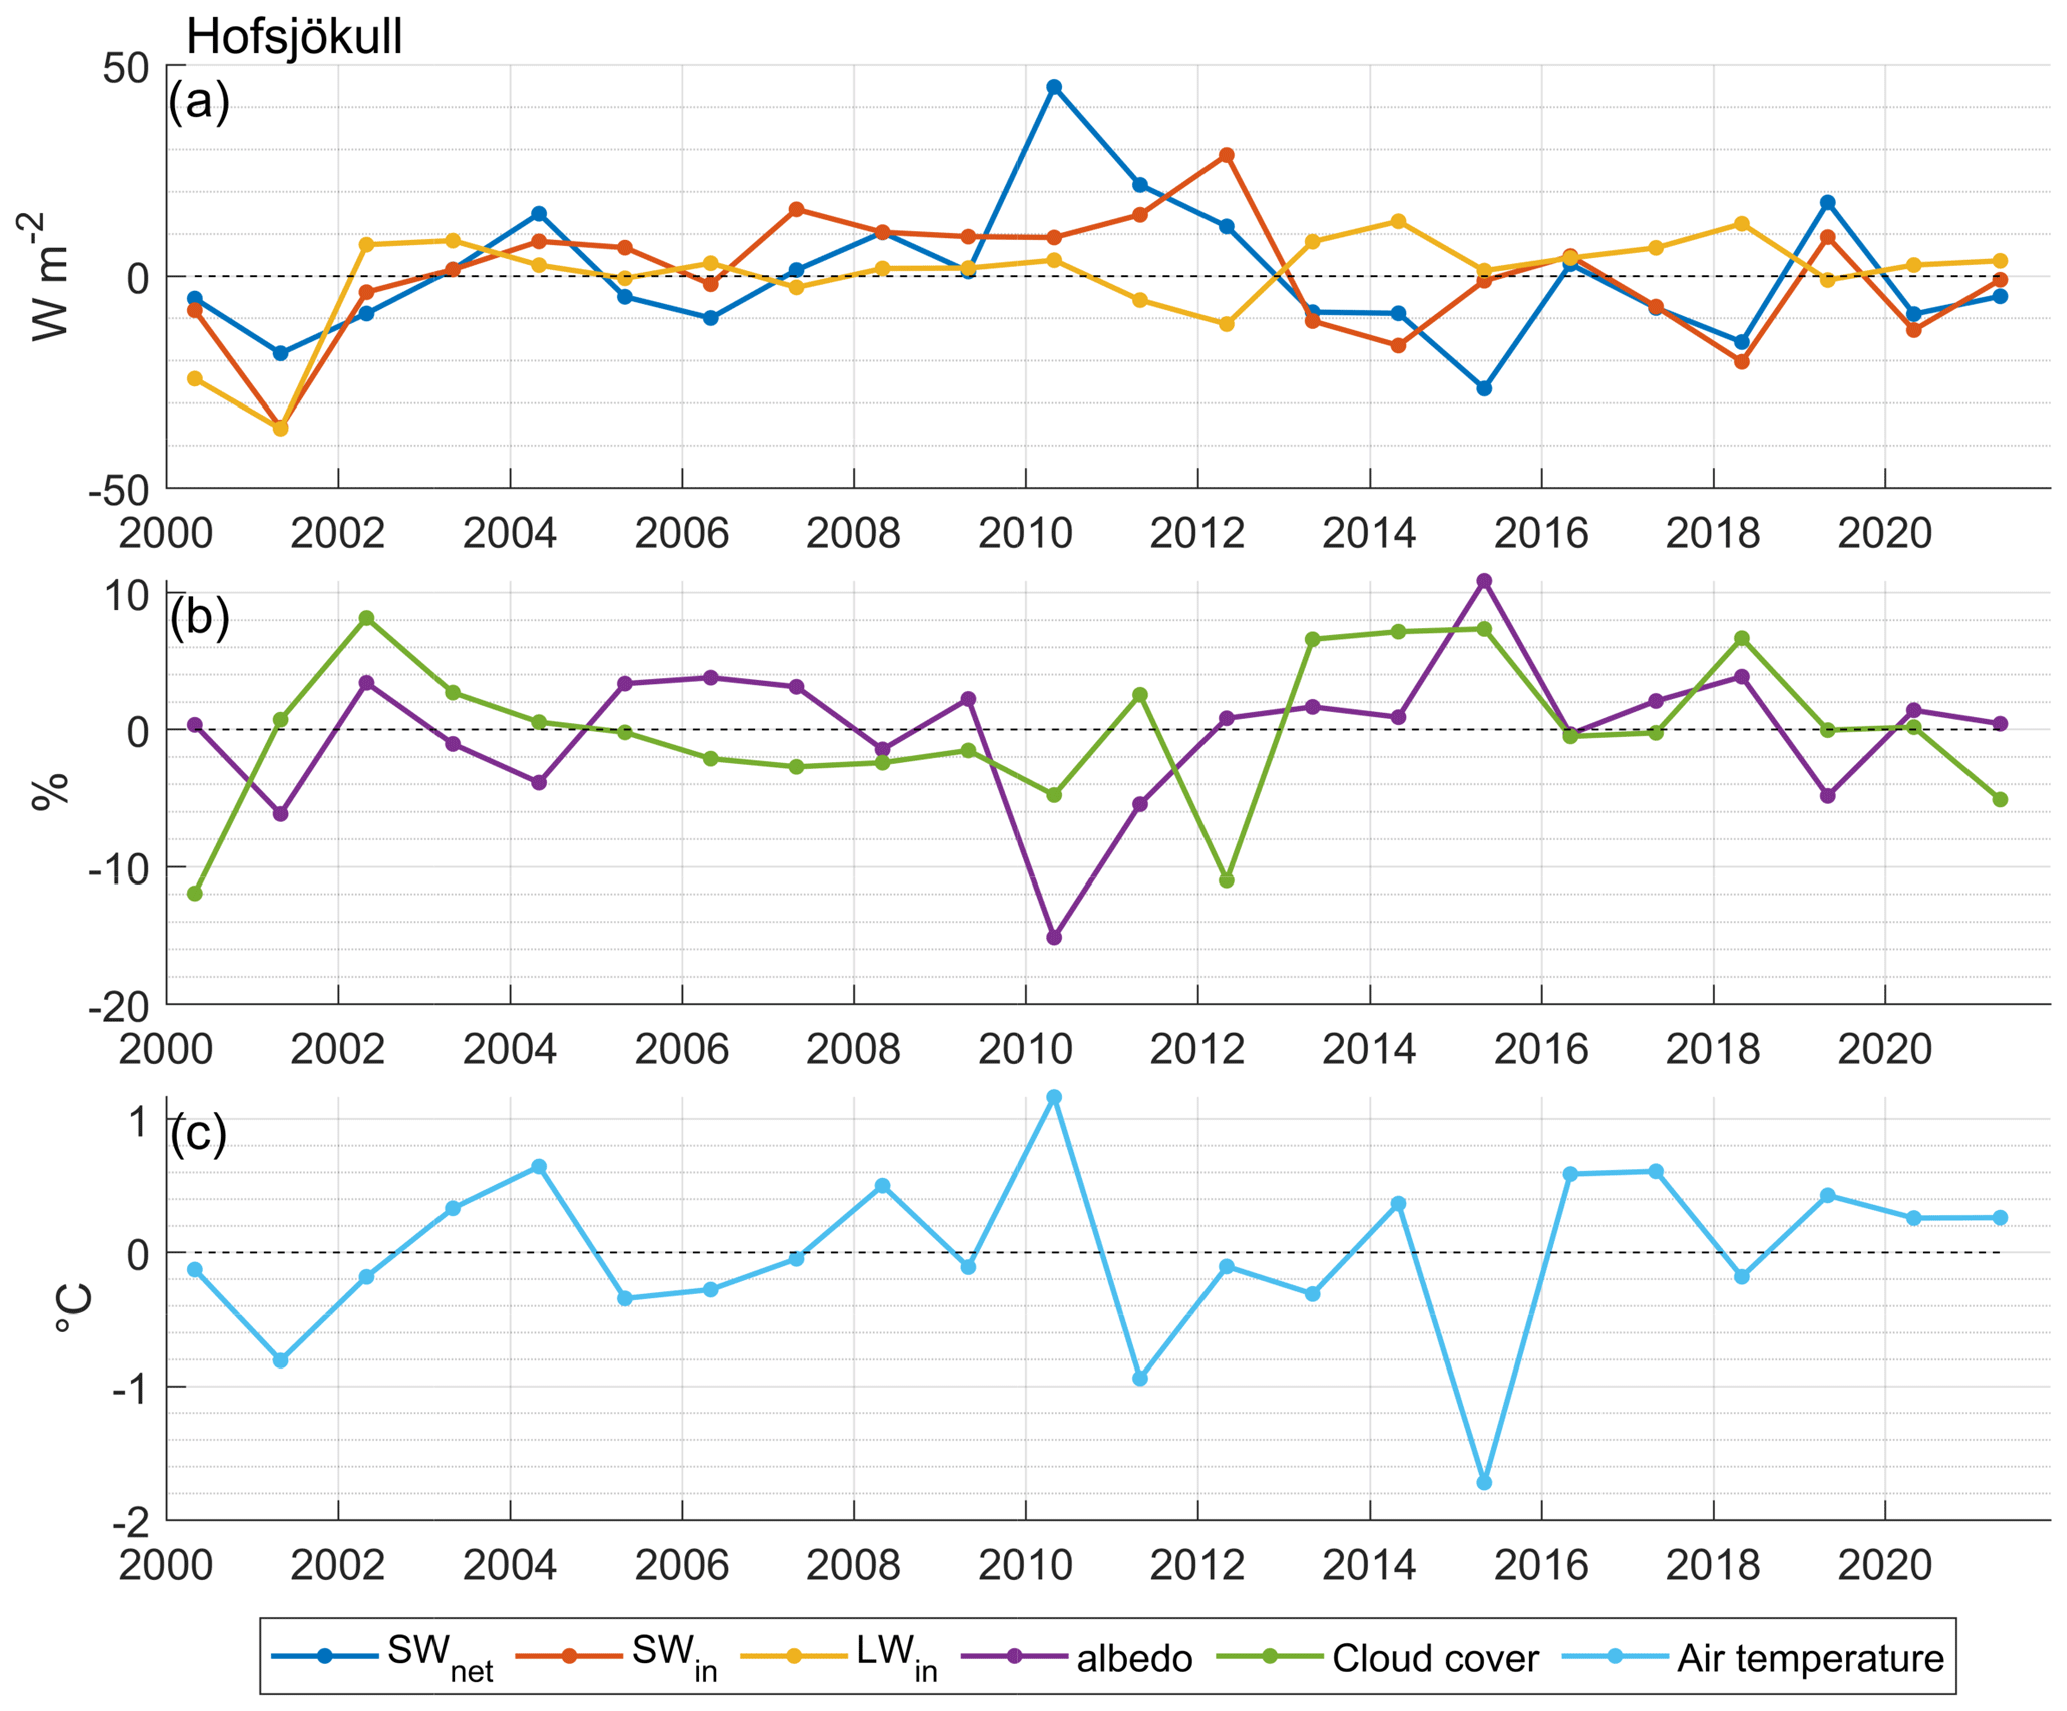
Figure B7MJJA for selected variables for Hofsjökull. (a) Net SWnet, incoming SW↓ and incoming LW↓. (b) Albedo and cloud cover and (c) 2 m air temperature.
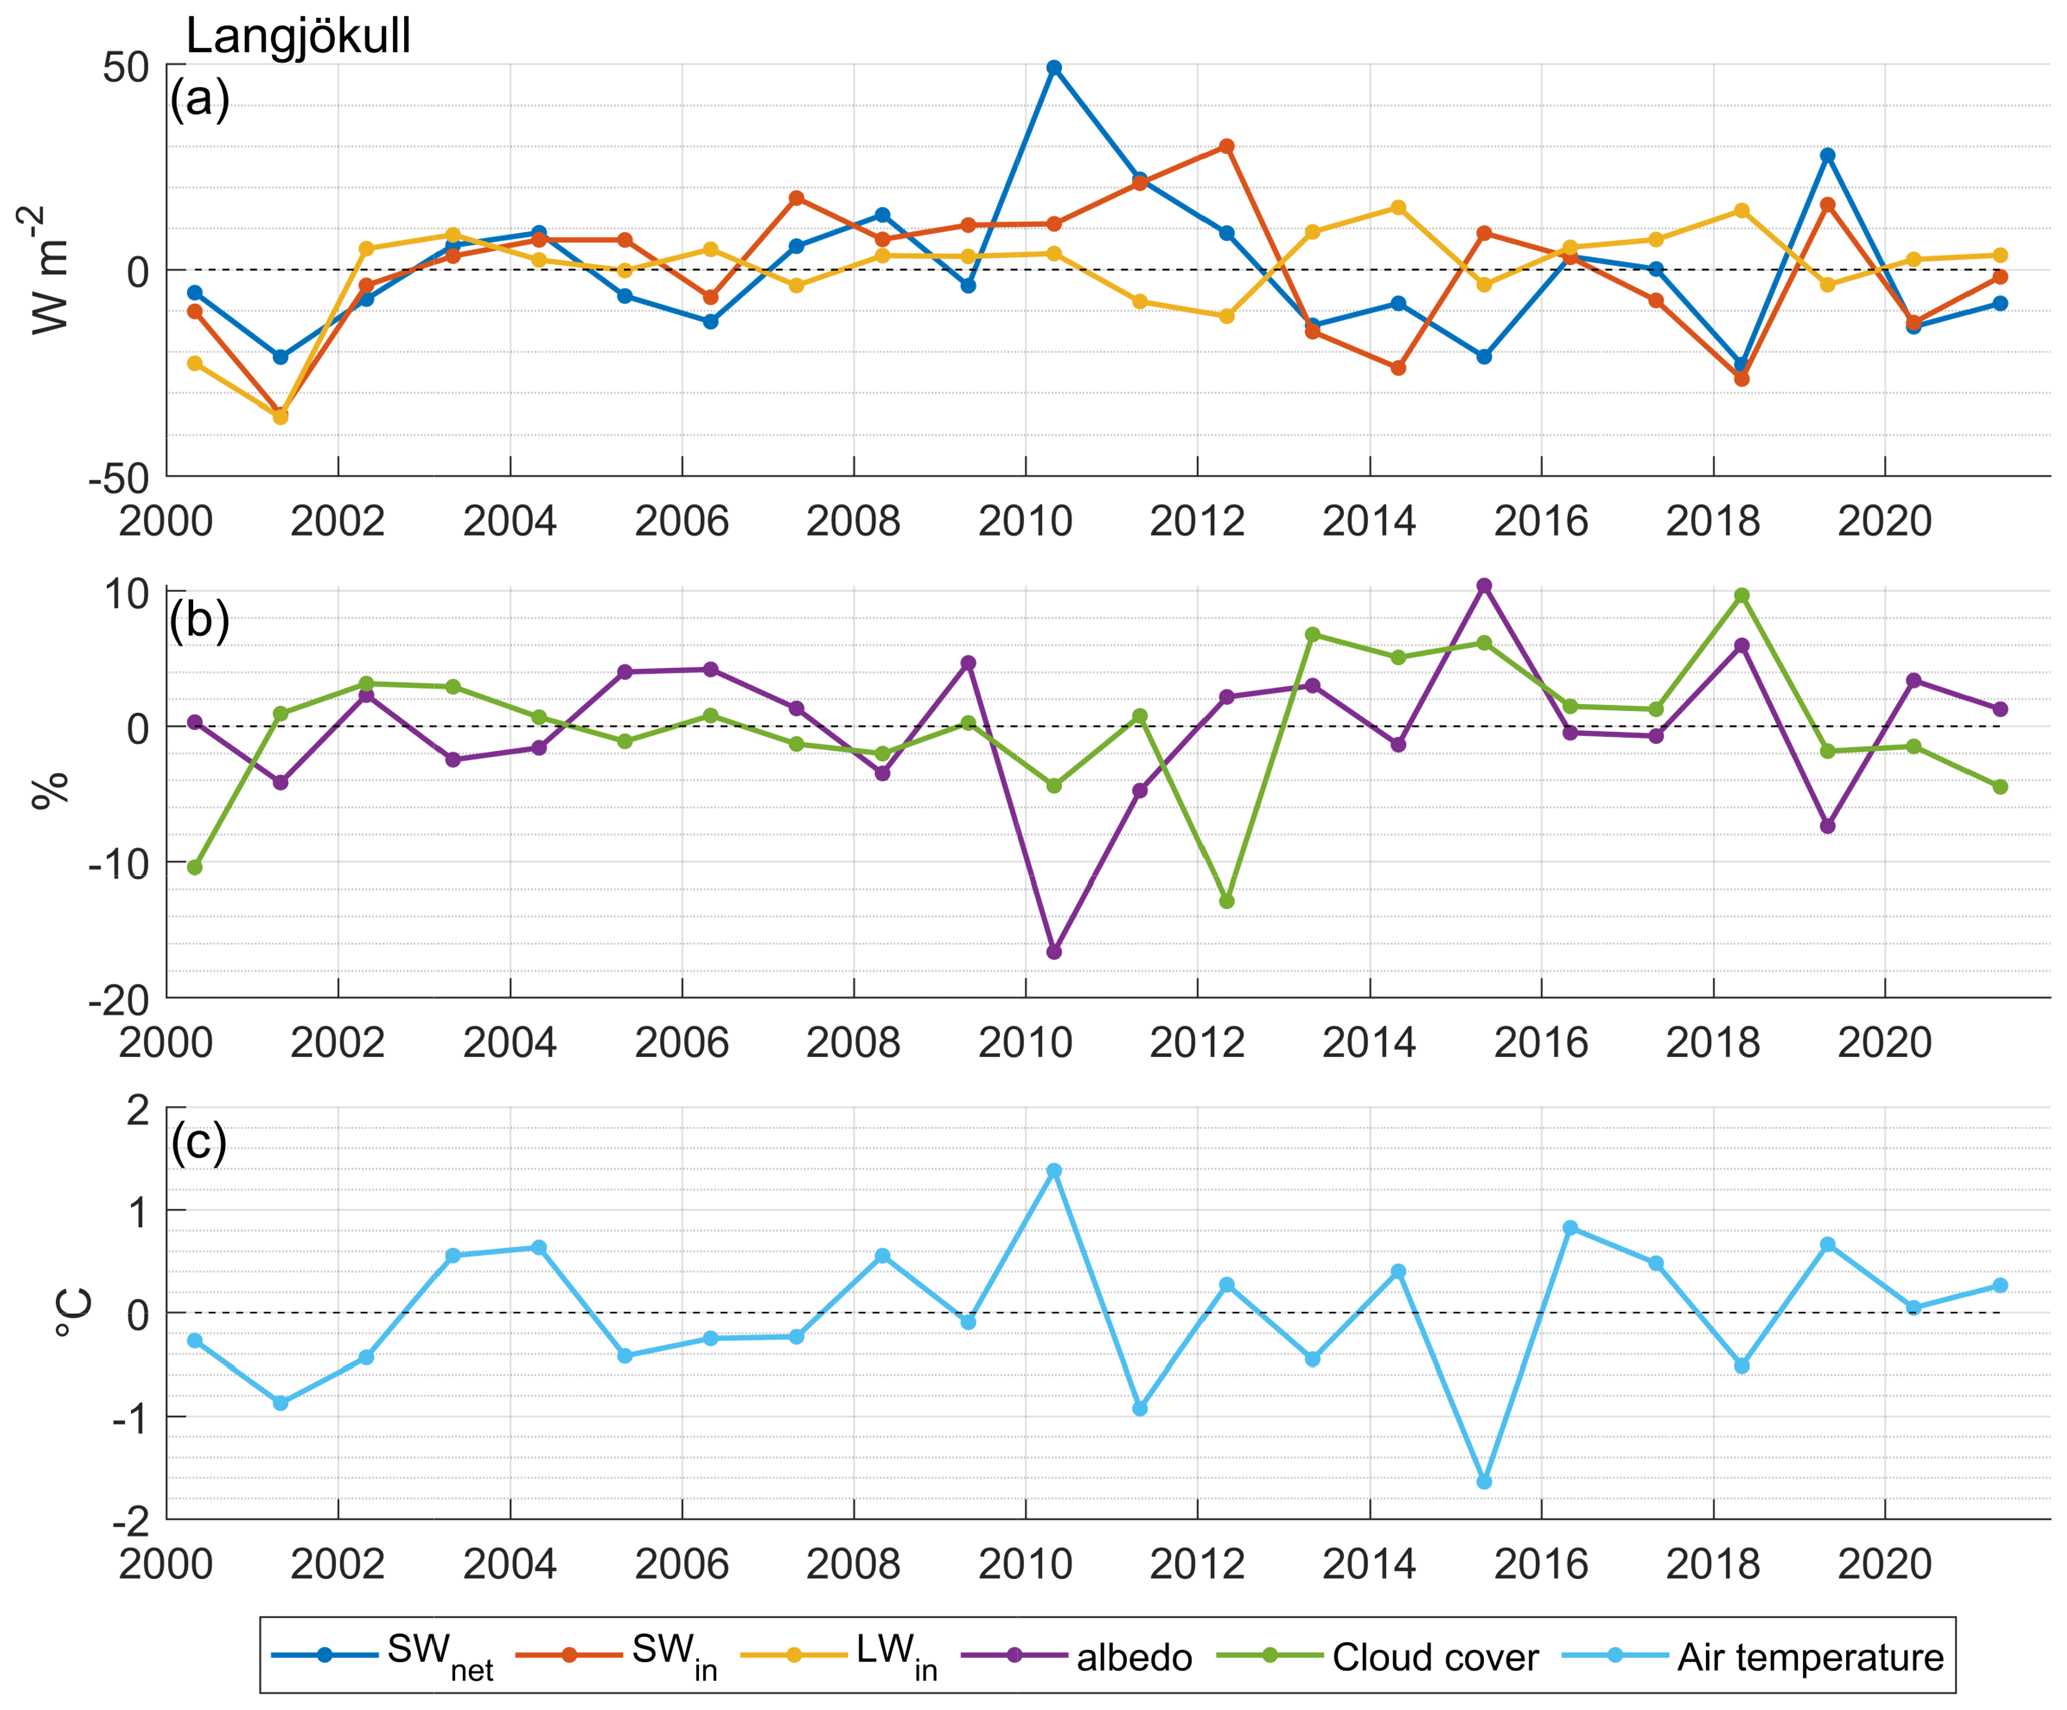
Figure B8MJJA for selected variables for Langjökull. (a) Net SWnet, incoming SW↓ and incoming LW↓. (b) Albedo and cloud cover and (c) 2 m air temperature.
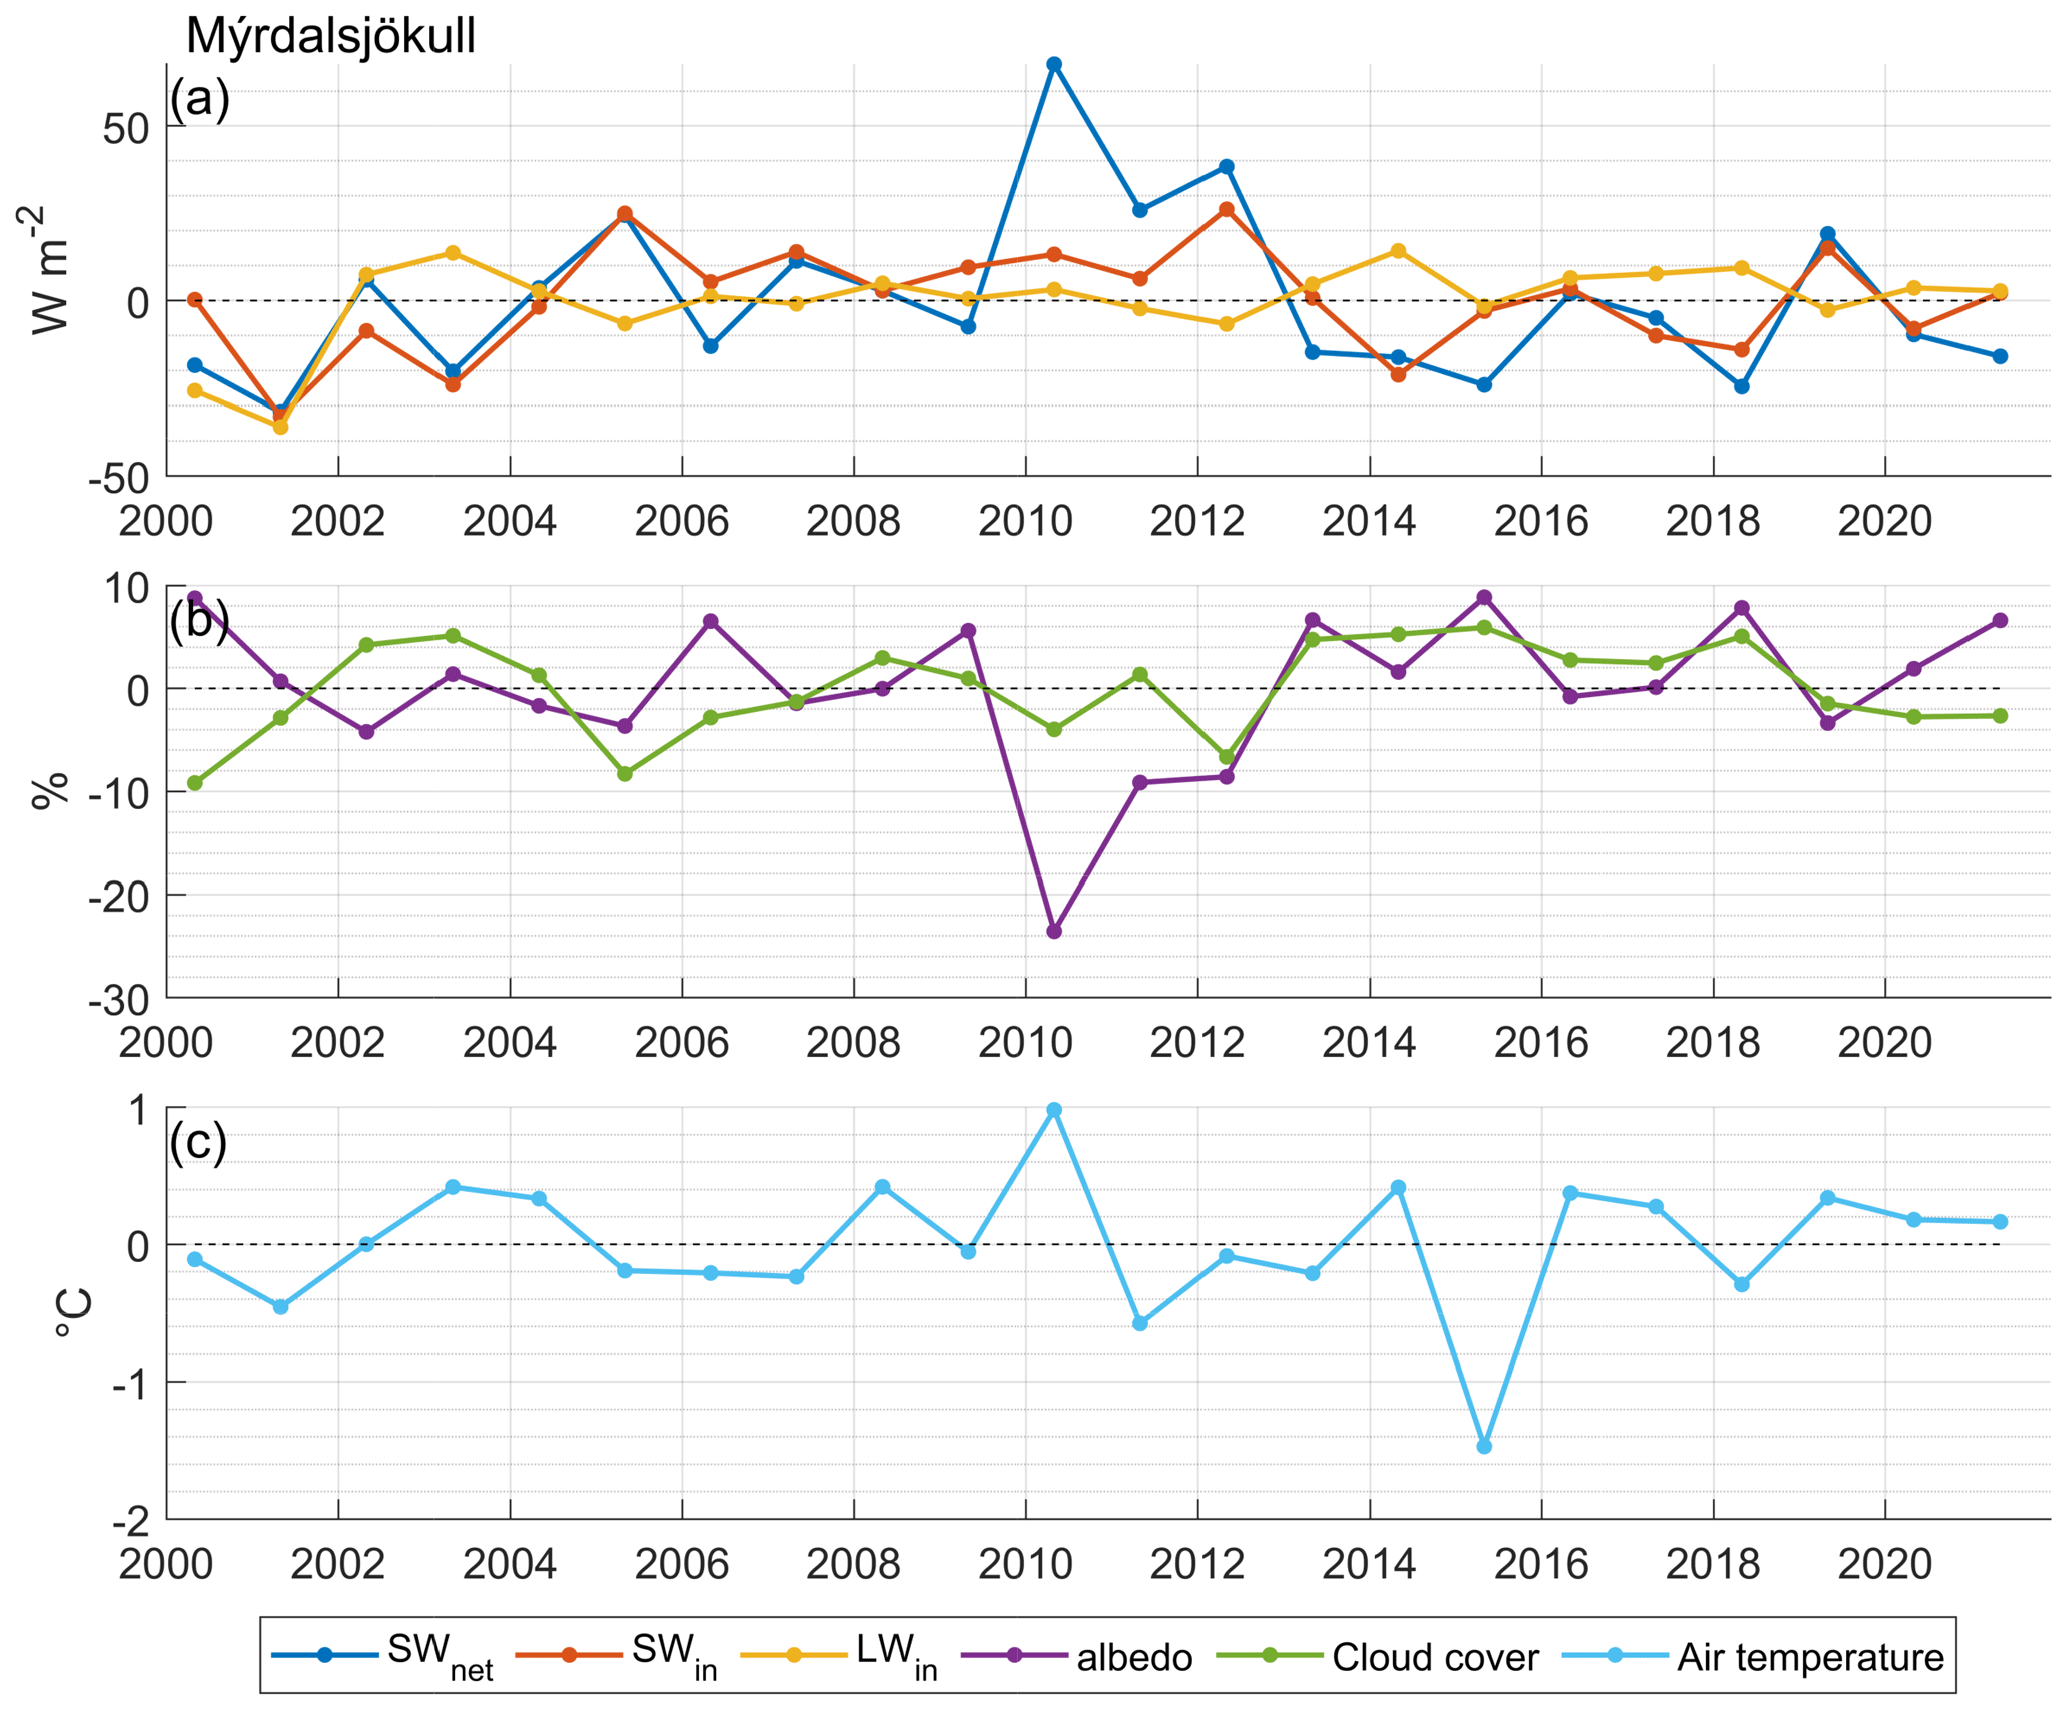
Figure B9MJJA for selected variables for Mýrdalsjökull. (a) Net SWnet=, incoming SW↓ and incoming LW↓. (b) Albedo and cloud cover and (c) 2 m air temperature.
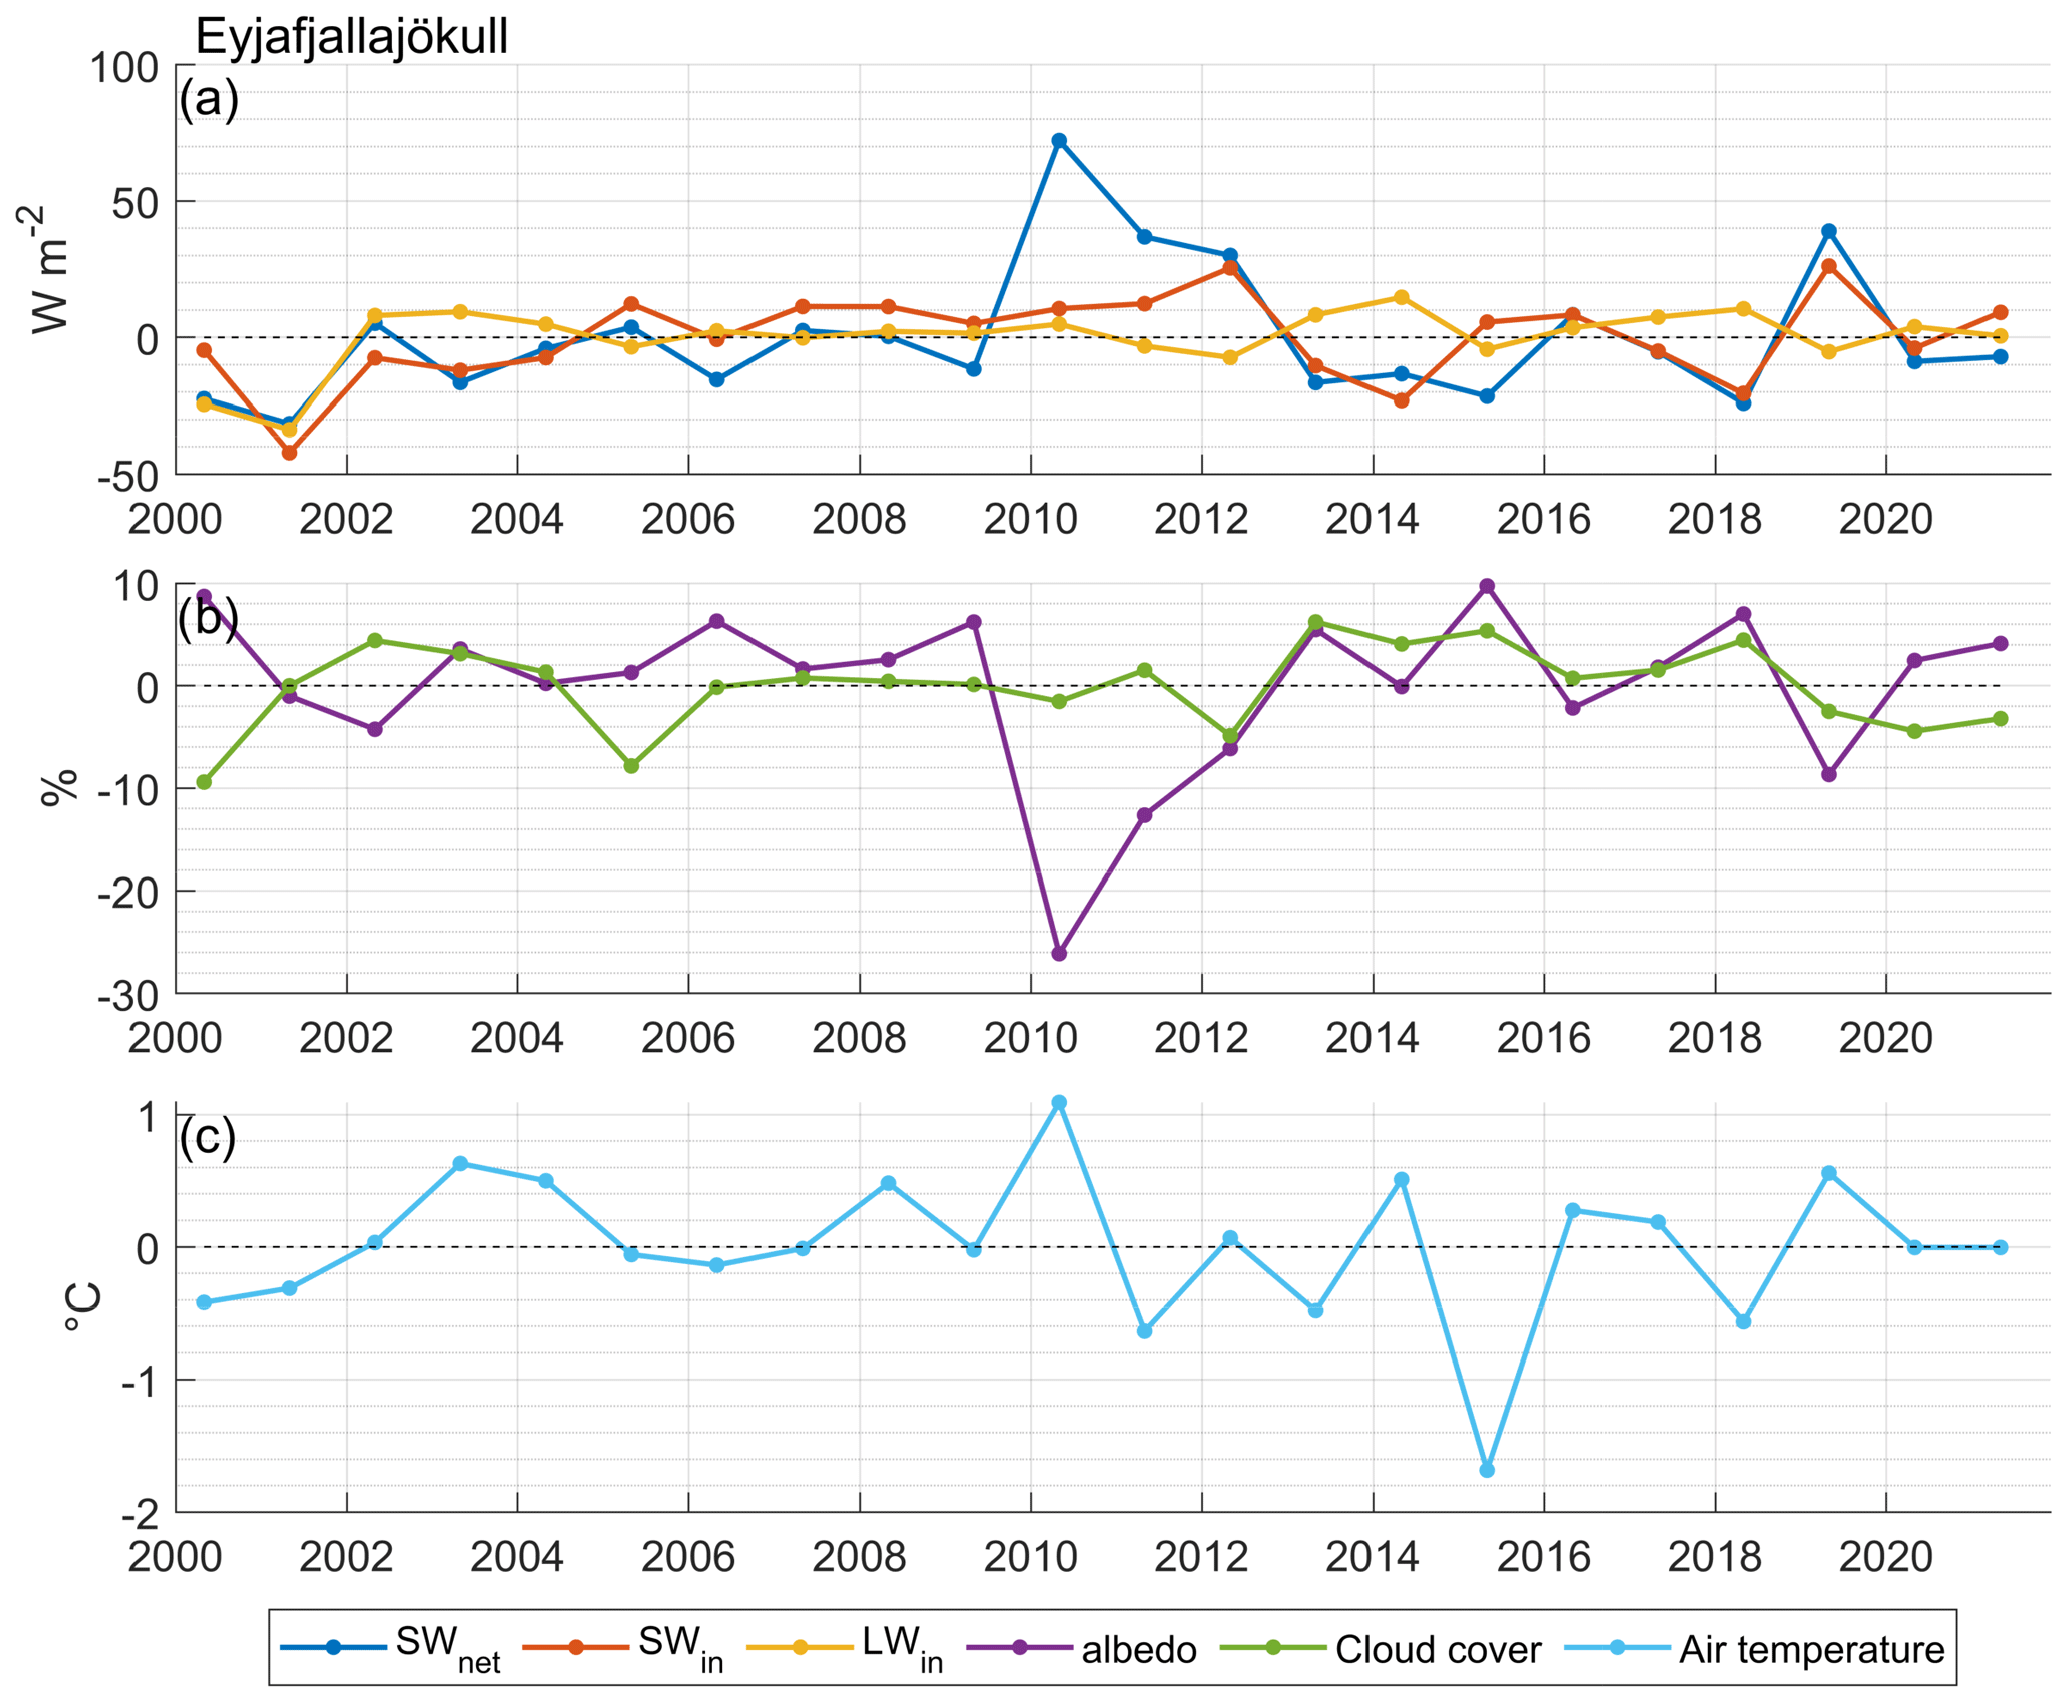
Figure B10MJJA for selected variables for Eyjafjallajökull. (a) Net SWnet, incoming SW↓ and incoming LW↓. (b) Albedo and cloud cover and (c) 2 m air temperature.
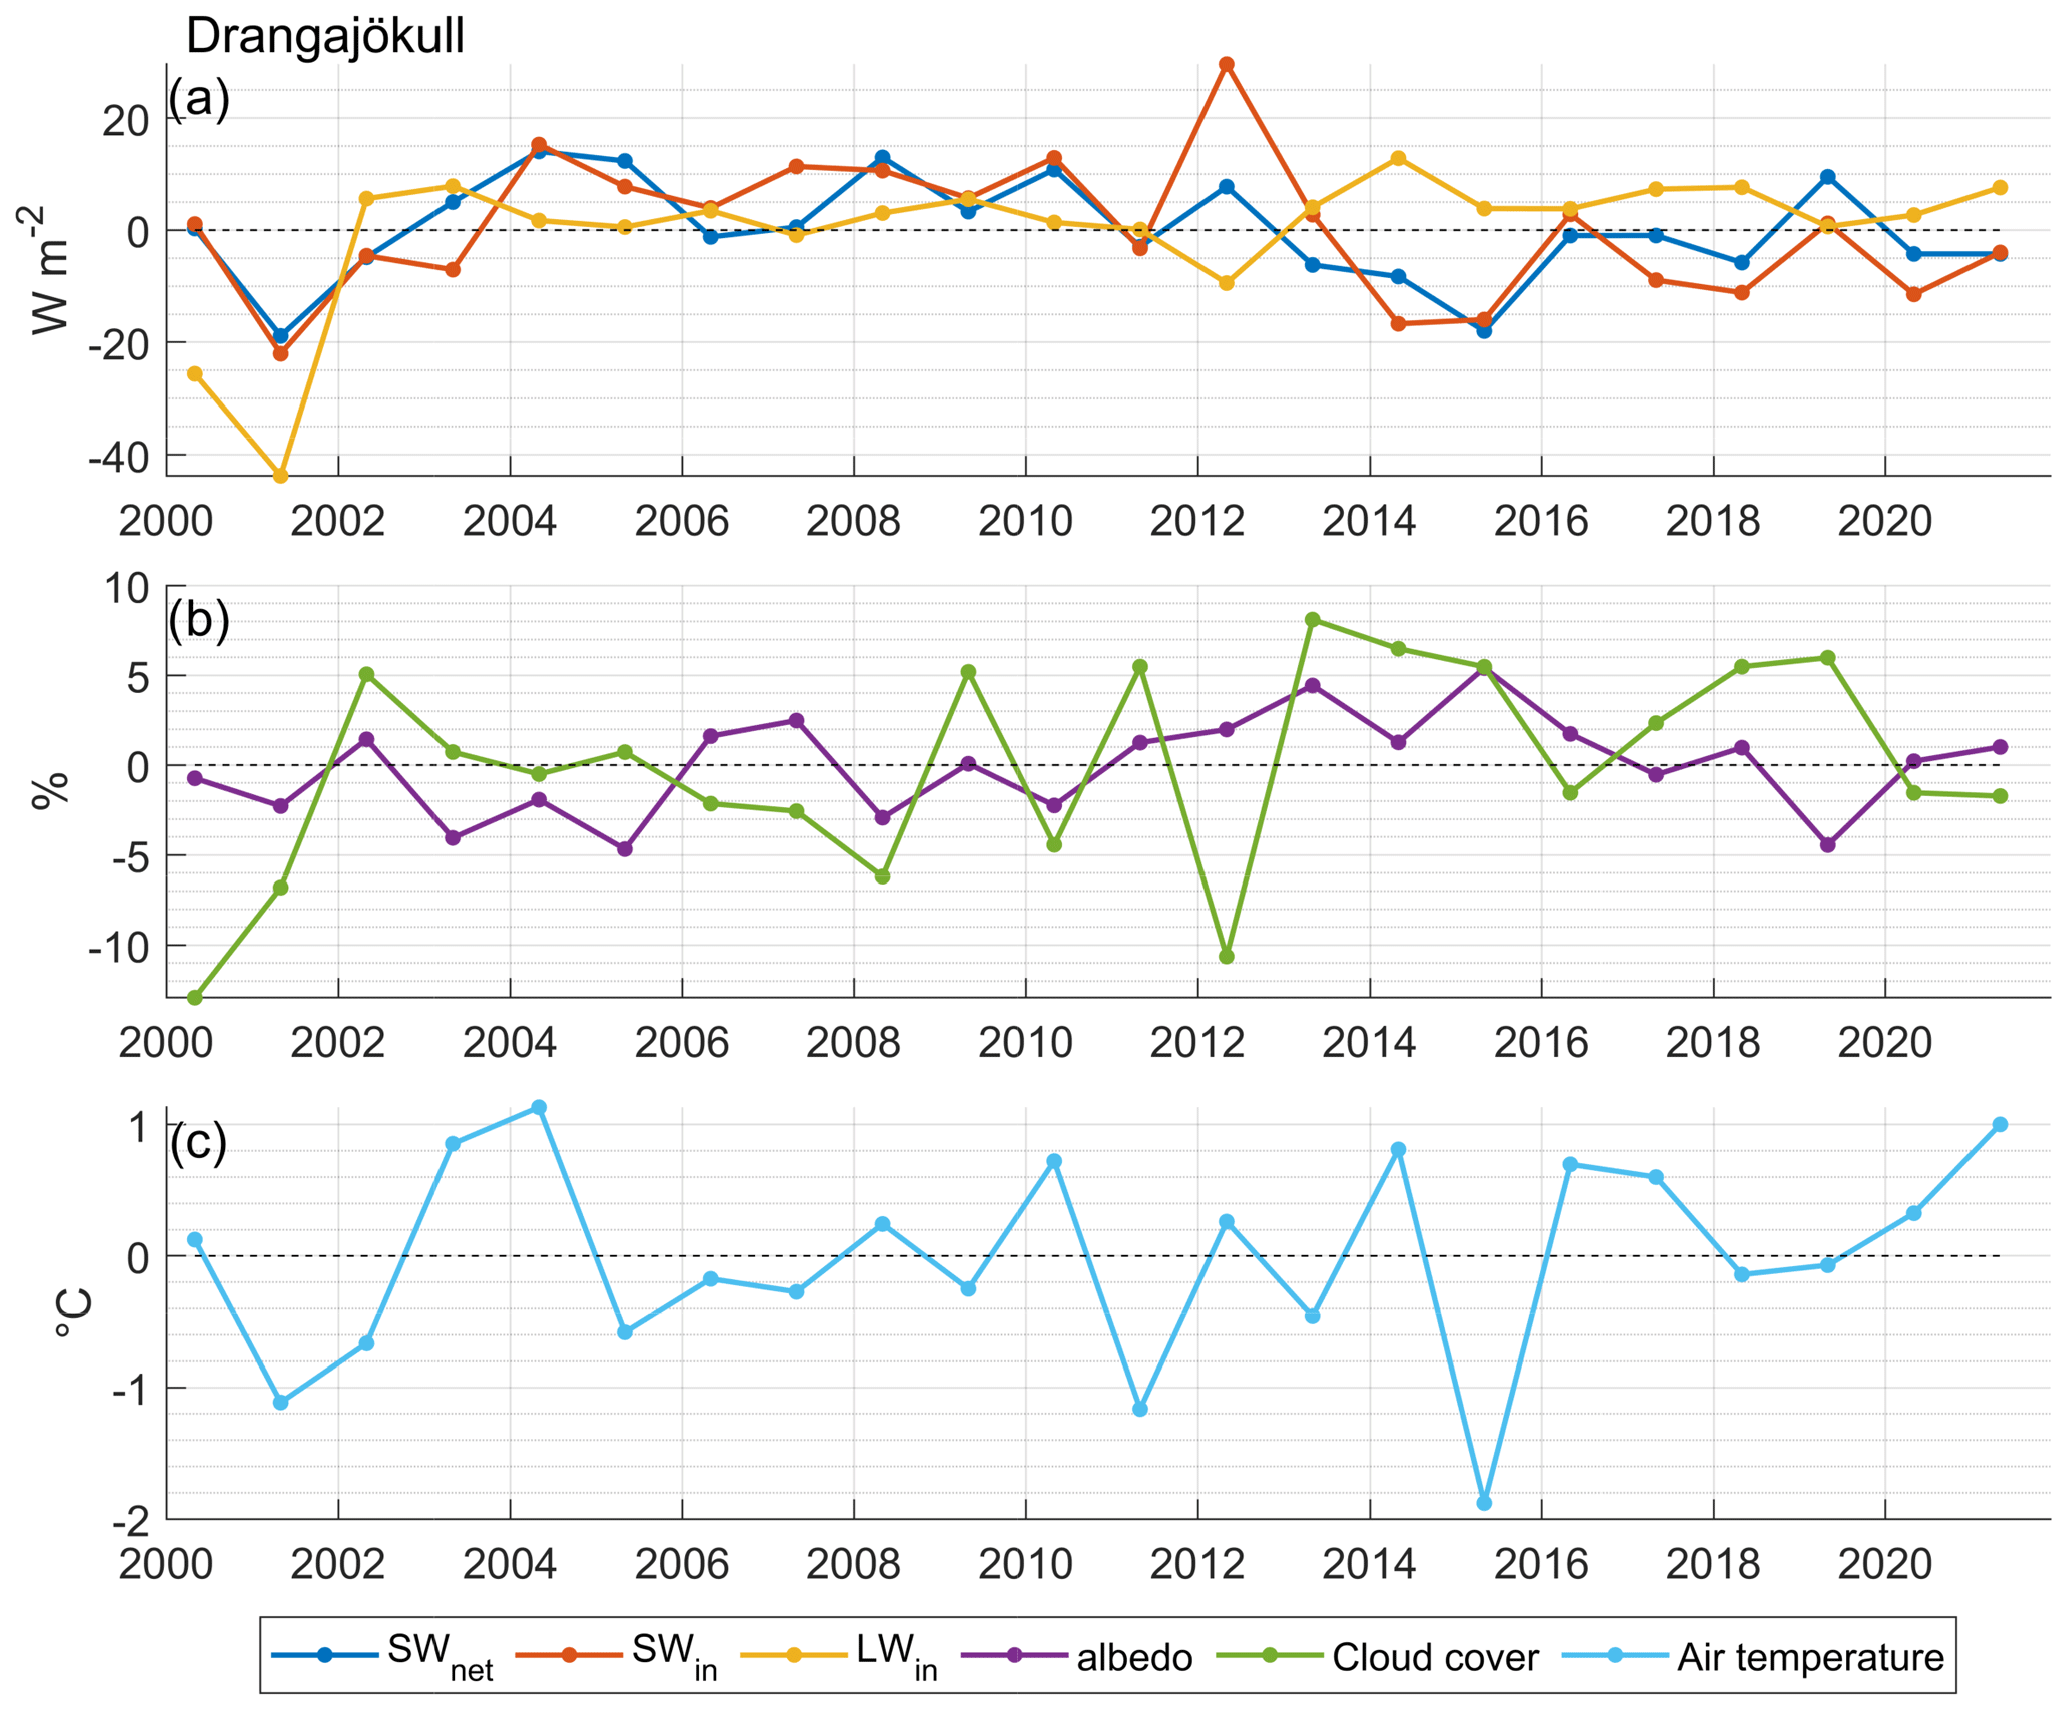
Figure B11MJJA for selected variables for Drangajökull. (a) SWnet, incoming SW↓ and incoming LW↓. (b) Albedo and cloud cover and (c) 2 m air temperature.
MODIS data are available from https://doi.org/10.5067/MODIS/MYD10A1.006 (Hall and Riggs, 2016a) and https://doi.org/10.5067/MODIS/MOD10A1.006 (Hall and Riggs, 2016b). Geospatial data for Iceland are available from the National Land Survey of Iceland at https://gatt.lmi.is/geonetwork/srv/metadata/e6712430-a63c-4ae5-9158-c89d16da6361 (National Land Survey of Iceland, 2022). Glacier automatic weather station data, climate forcings and SEB output are available upon request.
AG conceived and designed the study, performed the analyses and prepared the manuscript. SMG and FP contributed to the study design, interpretation of the results and writing of the manuscript.
The contact author has declared that none of the authors has any competing interests.
Publisher's note: Copernicus Publications remains neutral with regard to jurisdictional claims in published maps and institutional affiliations.
The authors would like to thank the editor and two anonymous reviewers for their review and comments, which improved the manuscript.
This paper was edited by Moritz Langer and reviewed by two anonymous referees.
Aðalgeirsdóttir, G., Magnússon, E., Pálsson, F., Thorsteinsson, T., Belart, J. M. C., Jóhannesson, T., Hannesdóttir, H., Sigurðsson, O., Gunnarsson, A., Einarsson, B., Berthier, E., Schmidt, L. S., Haraldsson, H. H., and Björnsson, H.: Glacier Changes in Iceland from 1890 to 2019, Front. Earth Sci., 8, 520, https://doi.org/10.3389/feart.2020.523646, 2020. a, b, c
Adam, J. C., Hamlet, A. F., and Lettenmaier, D. P.: Implications of Global Climate Change for Snowmelt Hydrology in the Twenty-First Century, Hydrol. Process., 23, 962–972, https://doi.org/10.1002/hyp.7201, 2008. a
Alexander, M. A., Scott, J. D., Friedland, K. D., Mills, K. E., Nye, J. A., Pershing, A. J., and Thomas, A. C.: Projected sea surface temperatures over the 21st century: Changes in the mean, variability and extremes for large marine ecosystem regions of Northern Oceans, Elementa: Science of the Anthropocene, 6, 9, https://doi.org/10.1525/elementa.191, 2018. a
Arnalds, O., Dagsson-Waldhauserova, P., and Ólafsson, H.: The Icelandic volcanic aeolian environment: Processes and impacts — A review, Aeolian Res., 20, 176–195, https://doi.org/10.1016/j.aeolia.2016.01.004, 2016. a
Bair, E. H., Rittger, K., Davis, R. E., Painter, T. H., and Dozier, J.: Validating reconstruction of snow water equivalent in California's Sierra Nevada using measurements from the NASA Airborne Snow Observatory, Water Resour. Res., 52, 8437–8460, https://doi.org/10.1002/2016WR018704, 2016. a
Barnett, T. P., Adam, J. C., and Lettenmaier, D. P.: Potential Impacts of a Warming Climate on Water Availability in Snow-Dominated Regions, Nature, 438, 303–309, https://doi.org/10.1038/nature04141, 2005. a
Berrisford, P., Dee, D., Poli, P., Brugge, R., Fielding, M., Fuentes, M., Kållberg, P., Kobayashi, S., Uppala, S., and Simmons, A.: The ERA-Interim archive Version 2.0, ERA Report Series, p. 23, 2011. a
Björnsson, H.: Hydrology of Ice Caps in Volcanic Regions, vol. 1, in: Hydrology of Ice Caps in Volcanic Regions, Societas Scientarium Islandica, University of Iceland, 1988. a, b
Björnsson, H. and Pálsson, F.: Icelandic glaciers, Jökull, 58, 365–386, 2008. a, b
Björnsson, H. and Pálsson, F.: Radio-echo soundings on Icelandic temperate glaciers: history of techniques and findings, Ann. Glaciol., 61, 25–34, https://doi.org/10.1017/aog.2020.10, 2020. a
Björnsson, H., Sigurðsson, B.D., Davíðsdóttir, B., Ólafsson, J., Ástþórsson, Ó. S., Ólafsdóttir, S., Baldursson, T., and Jónsson, T.: Loftslagsbreytingar og áhrif þeirra á Íslandi: Skýrsla Vísindanefndar um loftslagsbreytingar 2018., Tech. rep., Veðurstofa Íslands, Reykjavík, 2018. a, b
Björnsson, H., Pálsson, F., and Guðmundsson, M. T.: Surface and bedrock topography of the Mýrdalsjökull ice cap, Iceland: The Katla caldera, eruption sites and routes of jökulhlaups, Jökull, 49, 29–46, 2000a. a
Björnsson, H., Pálsson, F., and Guðmundsson, M. T.: Surface and bedrock topography of the Mýrdalsjökull ice cap, Iceland: The Katla caldera, eruption sites and routes of jökulhlaups, Jökull, 49, 29–46, 2000b. a
Björnsson, H., Pálsson, F., and Guðmundsson, S.: Jökulsárlón at Breiðamerkursandur, Vatnajökull, Iceland: 20th century changes and future outlook, Jökull, 50, 1–18, 2001. a
Björnsson, H., Pálsson, F., Gudmundsson, S., Magnússon, E., Adalgeirsdóttir, G., Jóhannesson, T., Berthier, E., Sigurdsson, O., and Thorsteinsson, T.: Contribution of Icelandic ice caps to sea level rise: Trends and variability since the Little Ice Age, Geophys. Res. Lett., 40, 1546–1550, https://doi.org/10.1002/grl.50278, 2013. a
Bojinski, S., Verstraete, M., Peterson, T. C., Richter, C., Simmons, A., and Zemp, M.: The Concept of Essential Climate Variables in Support of Climate Research, Applications, and Policy, B. Am. Meteorol. Soc., 95, 1431–1443, https://doi.org/10.1175/BAMS-D-13-00047.1, 2014. a
Box, J. E., Fettweis, X., Stroeve, J. C., Tedesco, M., Hall, D. K., and Steffen, K.: Greenland ice sheet albedo feedback: thermodynamics and atmospheric drivers, The Cryosphere, 6, 821–839, https://doi.org/10.5194/tc-6-821-2012, 2012. a, b
Brock, B. W., Willis, I. C., and Sharp, M. J.: Measurement and parameterization of aerodynamic roughness length variations at Haut Glacier d'Arolla, Switzerland, J. Glaciol., 52, 281–297, https://doi.org/10.3189/172756506781828746, 2006. a, b
Charalampidis, C., van As, D., Box, J. E., van den Broeke, M. R., Colgan, W. T., Doyle, S. H., Hubbard, A. L., MacFerrin, M., Machguth, H., and Smeets, C. J. P. P.: Changing surface–atmosphere energy exchange and refreezing capacity of the lower accumulation area, West Greenland, The Cryosphere, 9, 2163–2181, https://doi.org/10.5194/tc-9-2163-2015, 2015. a
Chen, X., Liang, S., and Cao, Y.: Satellite Observed Changes in the Northern Hemisphere Snow Cover Phenology and the Associated Radiative Forcing and Feedback between 1982 and 2013, Environ. Res. Lett., 11, 084002, https://doi.org/10.1088/1748-9326/11/8/084002, 2016. a
Choi, G., Robinson, D. A., and Kang, S.: Changing Northern Hemisphere Snow Seasons, J. Climate, 23, 5305–5310, https://doi.org/10.1175/2010jcli3644.1, 2010. a
Crochet, P. and Jóhannesson, T.: A data set of gridded daily temperature in Iceland, 1949–2010, Jökull, 61, 1–17, 2011. a
Dagsson-Waldhauserova, P., Arnalds, O., and Olafsson, H.: Long-term dust aerosol production from natural sources in Iceland, J. Air Waste Manage. A., 67, 173–181, https://doi.org/10.1080/10962247.2013.805703, 2017. a
Denby, B. and Greuell, W.: The use of bulk and profile methods for determining surface heat fluxes in the presence of glacier winds, J. Glaciol., 46, 445–452, https://doi.org/10.3189/172756500781833124, 2000. a
Einarsson, M. A.: Climates of the Oceans, H. Van Loon (Ed.): Vol. 15 of World Survey of Climatology, J. Climatol., 5, 673–697, https://doi.org/10.1002/joc.3370050110, 1984. a
Fausto, R. S., van As, D., Mankoff, K. D., Vandecrux, B., Citterio, M., Ahlstrøm, A. P., Andersen, S. B., Colgan, W., Karlsson, N. B., Kjeldsen, K. K., Korsgaard, N. J., Larsen, S. H., Nielsen, S., Pedersen, A. Ø., Shields, C. L., Solgaard, A. M., and Box, J. E.: Programme for Monitoring of the Greenland Ice Sheet (PROMICE) automatic weather station data, Earth Syst. Sci. Data, 13, 3819–3845, https://doi.org/10.5194/essd-13-3819-2021, 2021. a
Fernandes, R., Zhao, H. X., Wang, X. J., Key, J., Qu, X., and Hall, A.: Controls on Northern Hemisphere Snow Albedo Feedback Quantified Using Satellite Earth Observations, Geophys. Res. Lett., 36, L21702, https://doi.org/10.1029/2009gl040057, 2009. a
Flanner, M. G., Shell, K. M., Barlage, M., Perovich, D. K., and Tschudi, M. A.: Radiative Forcing and Albedo Feedback from the Northern Hemisphere Cryosphere between 1979 and 2008, Nat. Geosci., 4, 151–155, https://doi.org/10.1038/ngeo1062, 2011. a
Franco, B., Fettweis, X., and Erpicum, M.: Future projections of the Greenland ice sheet energy balance driving the surface melt, The Cryosphere, 7, 1–18, https://doi.org/10.5194/tc-7-1-2013, 2013. a
Gardner, A. S., Sharp, M. J., Koerner, R. M., Labine, C., Boon, S., Marshall, S. J., Burgess, D. O., and Lewis, D.: Near-Surface Temperature Lapse Rates over Arctic Glaciers and Their Implications for Temperature Downscaling, J. Climate, 22, 4281–4298, https://doi.org/10.1175/2009JCLI2845.1, 2009. a
Gascoin, S., Guðmundsson, S., Aðalgeirsdóttir, G., Pálsson, F., Schmidt, L., Berthier, E., and Björnsson, H.: Evaluation of MODIS Albedo Product over Ice Caps in Iceland and Impact of Volcanic Eruptions on Their Albedo, Remote Sens., 9, 399, https://doi.org/10.3390/rs9050399, 2017. a, b
Gervais, M., Shaman, J., and Kushnir, Y.: Impacts of the North Atlantic Warming Hole in Future Climate Projections: Mean Atmospheric Circulation and the North Atlantic Jet, J. Climate, 32, 2673–2689, https://doi.org/10.1175/JCLI-D-18-0647.1, 2019. a
Goelzer, H., Nowicki, S., Payne, A., Larour, E., Seroussi, H., Lipscomb, W. H., Gregory, J., Abe-Ouchi, A., Shepherd, A., Simon, E., Agosta, C., Alexander, P., Aschwanden, A., Barthel, A., Calov, R., Chambers, C., Choi, Y., Cuzzone, J., Dumas, C., Edwards, T., Felikson, D., Fettweis, X., Golledge, N. R., Greve, R., Humbert, A., Huybrechts, P., Le clec'h, S., Lee, V., Leguy, G., Little, C., Lowry, D. P., Morlighem, M., Nias, I., Quiquet, A., Rückamp, M., Schlegel, N.-J., Slater, D. A., Smith, R. S., Straneo, F., Tarasov, L., van de Wal, R., and van den Broeke, M.: The future sea-level contribution of the Greenland ice sheet: a multi-model ensemble study of ISMIP6, The Cryosphere, 14, 3071–3096, https://doi.org/10.5194/tc-14-3071-2020, 2020. a
Gregory, J. M. and Oerlemans, J.: Simulated future sea-level rise due to glacier melt based on regionally and seasonally resolved temperature changes, Nature, 391, 474–476, https://doi.org/10.1038/35119, 1998. a
Guðmundsson, S., Björnsson, H., Pálsson, F., and Haraldsson, H. H.: Energy balance of Brúarjökull and circumstances leading to the August 2004 floods in the river Jökla, N-Vatnajökull, Jökull, 55, 121–138, 2005. a
Guðmundsson, S., Björnsson, H., Pálsson, F., and Haraldsson, H. H.: Comparison of energy balance and degree–day models of summer ablation on the Langjökull ice cap, SW-Iceland, Jökull, 59, 1–18, 2009. a, b
Gudmundsson, M. T., Thordarson, T., Höskuldsson, A., Larsen, G., Björnsson, H., Prata, F. J., Oddsson, B., Magnússon, E., Högnadóttir, T., Petersen, G. N., Hayward, C. L., Stevenson, J. A., and Jónsdóttir, I.: Ash generation and distribution from the April-May 2010 eruption of Eyjafjallajökull, Iceland, Sci. Rep.-UK, 2, 572, 2012. a
Gunnarsson, A., Gardarsson, S. M., Pálsson, F., Jóhannesson, T., and Sveinsson, Ó. G. B.: Annual and inter-annual variability and trends of albedo of Icelandic glaciers, The Cryosphere, 15, 547–570, https://doi.org/10.5194/tc-15-547-2021, 2021. a, b, c, d, e, f, g, h, i, j, k, l, m, n, o, p, q
Hall, D. K. and Riggs, G. A.: MODIS/Aqua Snow Cover Daily L3 Global 500m SIN Grid, Version 6, Boulder, Colorado USA, NASA National Snow and Ice Data Center Distributed Active Archive Center [data set], https://doi.org/10.5067/MODIS/MYD10A1.006, 2016a. a, b
Hall, D. K. and Riggs, G. A.: MODIS/Terra Snow Cover Daily L3 Global 500m SIN Grid, Version 6, Boulder, Colorado USA, NASA National Snow and Ice Data Center Distributed Active Archive Center [data set], https://doi.org/10.5067/MODIS/MOD10A1.006, 2016b. a, b
Hannesdóttir, H., Sigurðsson, O., Þrastarson, R. H., Guðmundsson, S., Belart, J. M., Pálsson, F., Magnússon, E., Víkingsson, S., Kaldal, I., and Jóhannesson, T.: A national glacier inventory and variations in glacier extent in Iceland from the Little Ice Age maximum to 2019, Jökull, 12, 1–34, 2020. a, b, c
Helgason, G. B.: Varmaleiðing í einvíðu fjöllaga hjarnlíkani; Heat conduction in a one dimensional multilayer firnmodel, http://hdl.handle.net/1946/35967 (last access: 1 March 2023), Jarðvísindadeild Verkfræðiog náttúruvísindasvið, Háskóli íslands, Reykjavík, 2020. a
Hinkelman, L. M., Lapo, K. E., Cristea, N. C., and Lundquist, J. D.: Using CERES SYN Surface Irradiance Data as Forcing for Snowmelt Simulation in Complex Terrain, J. Hydrometeorol., 16, 2133–2152, https://doi.org/10.1175/JHM-D-14-0179.1, 2015. a
Hjaltason, S., Guðmundsdóttir, M., Haukdal, J. Á., and Guðmundsson, J. R.: Energy Statistics in Iceland 2019, Annual report, Orkustofnun, Reykjavík, Iceland, 2020. a
Hock, R.: Glacier melt: a review of processes and their modelling, Prog. Phys. Geogr.-Earth and Environment, 29, 362–391, https://doi.org/10.1191/0309133305pp453ra, 2005. a
Hodgkins, R., Carr, S., Pálsson, F., Guðmundsson, S., and Björnsson, H.: Modelling variable glacier lapse rates using ERA-Interim reanalysis climatology: an evaluation at Vestari- Hagafellsjökull, Langjökull, Iceland, International J. Climatol., 33, 410–421, https://doi.org/10.1002/joc.3440, 2013. a, b
Hofer, S., Lang, C., Amory, C., Kittel, C., Delhasse, A., Tedstone, A., and Fettweis, X.: Greater Greenland Ice Sheet contribution to global sea level rise in CMIP6, Nat. Commun., 11, 6289, https://doi.org/10.1038/s41467-020-20011-8, 2020. a
Holtslag, A. A. M. and Bruin, H. A. R. D.: Applied Modeling of the Nighttime Surface Energy Balance over Land, J. Appl. Meteorol. Climatol., 27, 689–704, https://doi.org/10.1175/1520-0450(1988)027<0689:AMOTNS>2.0.CO;2, 1988. a
Hreinsdóttir, S., Sigmundsson, F., Roberts, M. J., Björnsson, H., Grapenthin, R., Arason, P., Árnadóttir, T., Hólmjárn, J., Geirsson, H., Bennett, R. A., Gudmundsson, M. T., Oddsson, B., Ófeigsson, B. G., Villemin, T., Jónsson, T., Sturkell, E., Höskuldsson, A., Larsen, G., Thordarson, T., and Óladóttir, B. A.: Volcanic plume height correlated with magma-pressure change at Grímsvötn Volcano, Iceland, Nat. Geosci., 7, 214–218, https://doi.org/10.1038/ngeo2044, 2014. a, b
Huai, B., van den Broeke, M. R., and Reijmer, C. H.: Long-term surface energy balance of the western Greenland Ice Sheet and the role of large-scale circulation variability, The Cryosphere, 14, 4181–4199, https://doi.org/10.5194/tc-14-4181-2020, 2020. a, b
Hudson, S. R.: Estimating the Global Radiative Impact of the Sea Ice-Albedo Feedback in the Arctic, J. Geophys. Res.-Atmos., 116, D16102, https://doi.org/10.1029/2011jd015804, 2011. a, b
Jennings, K. S., Kittel, T. G. F., and Molotch, N. P.: Observations and simulations of the seasonal evolution of snowpack cold content and its relation to snowmelt and the snowpack energy budget, The Cryosphere, 12, 1595–1614, https://doi.org/10.5194/tc-12-1595-2018, 2018. a
Jóhannesson, T.: The Response Time of Glaciers in Iceland to Changes in climate, Ann. Glaciol., 8, 100–101, https://doi.org/10.3189/S0260305500001233, 1986. a
Jóhannesson, T., Raymond, C., and Waddington, E.: Time–Scale for Adjustment of Glaciers to Changes in Mass Balance, J. Glaciol., 35, 355–369, https://doi.org/10.3189/S002214300000928X, 1989. a
Jóhannesson, T., Aðalgeirsdóttir, G., Björnsson, H., Crochet, P., Elíasson, E. B., Guðmundsson, S., Jónsdóttir, J., Ólafsson, H., Pálsson, F., Rögnvaldsson, Ó., Sigurðsson, O., Snorrason, Á., Sveinsson, Ó. G. B., and Þorsteinsson, Þ.: Effect of Climate Change on Hydrology and Hydro-Resources in Iceland., Orkustofnun, Reykjavík, Iceland, ISBN 978-9979-68-224-0, 2007. a, b
Jóhannesson, T., Björnsson, H., Magnússon, E., Guðmundsson, S., Pálsson, F., Sigurðsson, O., Thorsteinsson, T., and Berthier, E.: Ice-volume changes, bias estimation of mass-balance measurements and changes in subglacial lakes derived by lidar mapping of the surface of Icelandic glaciers, Ann. Glaciol., 54, 63–74, https://doi.org/10.3189/2013AoG63A422, 2013. a, b
Jóhannesson, T., Pálmason, B.and Hjartarson, A., Jarosch, A. H., Magnússon, E., Belart, J. M. C., and Gudmundsson, M. T.: Non-surface mass balance of glaciers in Iceland, J. Glaciol., 66, 685–697, https://doi.org/10.1017/jog.2020.37, 2020. a
Jude-Eton, T., Thordarson, T., Gudmundsson, M., and Oddsson, B.: Dynamics, stratigraphy and proximal dispersal of supraglacial tephra during the ice-confined 2004 eruption at Grímsvötn Volcano, Iceland, B. Volcanol., 74, 1057–1082, https://doi.org/10.1007/s00445-012-0583-3, 2012. a
Karner, F., Obleitner, F., Krismer, T., Kohler, J., and Greuell, W.: A decade of energy and mass balance investigations on the glacier Kongsvegen, Svalbard, J. Geophys. Res.-Atmos., 118, 3986–4000, https://doi.org/10.1029/2012JD018342, 2013. a
Keil, P., Mauritsen, T., Jungclaus, J., Hedemann, C., Olonscheck, D., and Ghosh, R.: Multiple drivers of the North Atlantic warming hole, Nat. Clim. Change, 10, 667–671, https://doi.org/10.1038/s41558-020-0819-8, 2020. a, b
Knudsen, K. L., Eiríksson, J., and Bartels-Jónsdóttir, H. B.: Oceanographic changes through the last millennium off North Iceland: Temperature and salinity reconstructions based on foraminifera and stable isotopes, Marine Micropaleontol., 84-85, 54 – 73, https://doi.org/10.1016/j.marmicro.2011.11.002, 2012. a
Lozier, M., Owens, W., and Curry, R. G.: The climatology of the North Atlantic, Prog. Oceanogr., 36, 1–44, https://doi.org/10.1016/0079-6611(95)00013-5, 1995. a
Magnússon, E., Belart, J. M., Pálsson, F., Anderson, L. S., Ágúst Þ. Gunnlaugsson, Berthier, E., Ágústsson, H., and Áslaug Geirsdóttir: The subglacial topography of Drangajökull ice cap, NW-Iceland, deduced from dense RES-profiling, Jökull, 66, 1–26, 2016a. a
Magnússon, E., Belart, J. M. C., Pálsson, F., Anderson, L. S., Gunnlaugsson, A., Berthier, E., Ágústsson, H., and Geirsdóttir, A.: The subglacial topography of Drangajökull ice cap, NW-Iceland, deduced from dense RES-profiling, Jökull, 66, 1–26, 2016b. a
Male, D. H. and Granger, R. J.: Snow surface energy exchange, Water Resour. Res., 17, 609–627, https://doi.org/10.1029/WR017i003p00609, 1981. a
Marty, C., Philipona, R., Fröhlich, C., and Ohmura, A.: Altitude dependence of surface radiation fluxes and cloud forcing in the alps: results from the alpine surface radiation budget network, Theor. Appl. Climatol., 72, 137–155, https://doi.org/10.1007/s007040200019, 2002. a
MathWorks: MATLAB version: 9.13.0 (R2022b), https://www.mathworks.com (last access: 12 September 2023), 2022. a
Möller, R., Möller, M., Björnsson, H., Gudmundsson, S., Pálsson, F., Oddsson, B., Kukla, P., and Schneider, C.: MODIS-derived albedo changes of Vatnajökull (Iceland) due to tephra deposition from the 2004 Grimsvötn eruption, Int. J. Appl. Earth Obs., 26, 256–269, https://doi.org/10.1016/j.jag.2013.08.005, 2014. a
Möller, R., Dagsson-Waldhauserova, P., Möller, M., Kukla, P. A., Schneider, C., and Gudmundsson, M. T.: Persistent albedo reduction on southern Icelandic glaciers due to ashfall from the 2010 Eyjafjallajökull eruption, Remote Sens. Environ., 233, 111396, https://doi.org/10.1016/j.rse.2019.111396, 2019. a
National Centers for Environmental Prediction: NCEP GFS 0.25 Degree Global Forecast Grids Historical Archive [data set], https://doi.org/10.5065/D65D8PWK, 2015. a
National Land Survey of Iceland: IcelandDEM v.1, National Land Survey of Iceland [data set], https://gatt.lmi.is/geonetwork/srv/metadata/e6712430-a63c-4ae5-9158-c89d16da6361, last access: 1 December 2022. a
Nawri, N., Björnsson, H., Petersen, G. N., and Jónasson, K.: Empirical Terrain Models for Surface Wind and Air Temperature over Iceland, VÍ, 2012-009, Veðurstofa Íslands, Reykjavík, Iceland, 2012. a
Noël, B., Aðalgeirsdóttir, G., Pálsson, F., Wouters, B., Lhermitte, S., Haacker, J. M., and van den Broeke, M. R.: North Atlantic Cooling is Slowing Down Mass Loss of Icelandic Glaciers, Geophys. Res. Lett., 49, e2021GL095697, https://doi.org/10.1029/2021GL095697, 2022. a, b, c
Oddsson, B., Gudmundsson, M., Larsen, G., and Karlsdóttir, S.: Monitoring of the plume from the basaltic phreatomagmatic 2004 Grímsvötn eruption–application of weather radar and comparison with plume models, B. Volcanol., 74, 1395–1407, https://doi.org/10.1007/s00445-012-0598-9, 2012. a, b
Oerlemans, J., Giesen, R., and Van Den Broeke, M.: Retreating alpine glaciers: increased melt rates due to accumulation of dust (Vadret da Morteratsch, Switzerland), J. Glaciol., 55, 729–736, https://doi.org/10.3189/002214309789470969, 2009. a
Ohmura, A.: Physical Basis for the Temperature-Based Melt-Index Method, J. Appl. Meteorol., 40, 753–761, https://doi.org/10.1175/1520-0450(2001)040<0753:PBFTTB>2.0.CO;2, 2001. a
Ólafsdóttir, S., Jennings, A. E., Áslaug Geirsdóttir, Andrews, J., and Miller, G. H.: Holocene variability of the North Atlantic Irminger current on the south- and northwest shelf of Iceland, Marine Micropaleontol., 77, 101–118, https://doi.org/10.1016/j.marmicro.2010.08.002, 2010. a
Pálsson, F. and Gunnarsson, A.: Afkomu- og hraðamælingar á Langjökli : jökulárið 2012–2013., Tech. Rep. LV-2015-076, Landsvirkjun, Reykjavík, Iceland, 2015. a
Pálsson, F., Guðmundsson, S., and Björnsson, H.: Afkomu- og hraðamælingar á Langjökli jökulárið 2011–2012., Tech. Rep. LV-2014-076, Landsvirkjun, Reykjavík, Iceland, 2013. a
Pálsson, F., Gunnarsson, A., Pálsson, H. S., and Steinþórsson, S.: Afkomu- og hraðamælingar á Langjökli jökulárið 2012–2013, Landsvirkjun, Reykjavík, Iceland, LV-2015-076, 1–37, 2015. a
Pálsson, F., Gunnarsson, A., Jónsson, G., Pálsson, H. S., and Steinþórsson, S.: Vatnajökull: Mass balance, meltwater drainage and surface velocity of the glacial year 2014–15, Tech. Rep. LV-2016-031, Landsvirkjun, Reykjavík, Iceland, 2016. a
Pálsson, F., Gunnarsson, A., Jónsson, G., Pálsson, H. S., and Steinþórsson, S.: Vatnajökull: Mass balance, meltwater drainage and surface velocity of the glacial year 2018–19, Landsvirkjun, Reykjavík, RH-01-20 – LV-2020-016, 56, 2020. a, b
Pálsson, F., Gunnarsson, A., Magnússon, E., Pálsson, H. S., Hannesdóttir, H., Þórhallsson, R., and Steinþórsson, S.: Vatnajökull: Mass balance, meltwater drainage and surface velocity of the glacial year 2020–21, Landsvirkjun, Reykjavík, LV-2022-009, 62, 2022. a
Paulson, C. A.: The Mathematical Representation of Wind Speed and Temperature Profiles in the Unstable Atmospheric Surface Layer, J. Appl. Meteorol. Climatol., 9, 857–861, https://doi.org/10.1175/1520-0450(1970)009<0857:TMROWS>2.0.CO;2, 1970. a
Perkins, H., Hopkins, T. S., Malmberg, S.-A., Poulain, P.-M., and Warn-Varnas, A.: Oceanographic conditions east of Iceland, J. Geophys. Res.-Oceans, 103, 21531–21542, https://doi.org/10.1029/98JC00890, 1998. a
Plüss, C. and Ohmura, A.: Longwave Radiation on Snow-Covered Mountainous Surfaces, J. Appl. Meteorol., 36, 818–824, https://doi.org/10.1175/1520-0450-36.6.818, 1997. a
Rahmstorf, S., Box, J. E., Feulner, G., Mann, M. E., Robinson, A., Rutherford, S., and Schaffernicht, E. J.: Exceptional twentieth-century slowdown in Atlantic Ocean overturning circulation, Nat. Clim. Change, 5, 475–480, https://doi.org/10.1038/nclimate2554, 2015. a
Renner, A. H. H., Sundfjord, A., Janout, M. A., Ingvaldsen, R. B., Beszczynska-Möller, A., Pickart, R. S., and Pérez-Hernández, M. D.: Variability and Redistribution of Heat in the Atlantic Water Boundary Current North of Svalbard, J. Geophys. Res.-Oceans, 123, 6373–6391, https://doi.org/10.1029/2018JC013814, 2018. a
Rittger, K., Bair, E. H., Kahl, A., and Dozier, J.: Spatial estimates of snow water equivalent from reconstruction, Adv. Water Resour., 94, 345–363, https://doi.org/10.1016/j.advwatres.2016.05.015, 2016. a
Rögnvaldsson, Ó. A.: RÁVII: Tæknileg ú tfærsla á niðurkvörðun á Íslandsveðri, Tech. rep., Belgingur – Reiknistofa í Veðurfræði, Belgingur, Reykjavik, Iceland, 2016. a, b
Rögnvaldsson, Ó. A.: Technical description of two different dynamical downscaling time series for Icelandi, Tech. rep., Belgingur – Reiknistofa í Veðurfræði, Belgingur, Reykjavik, Iceland, 2020. a
Rossby, T.: The North Atlantic Current and surrounding waters: At the crossroads, Rev. Geophys., 34, 463–481, https://doi.org/10.1029/96RG02214, 1996. a
Salisbury, J. W., D'Aria, D. M., and Wald, A.: Measurements of thermal infrared spectral reflectance of frost, snow, and ice, J. Geophys. Res.-Sol. Ea., 99, 24235–24240, https://doi.org/10.1029/94JB00579, 1994. a
Schmidt, L. S., Adalgeirsdóttir, G., Guðmundsson, S., Langen, P. L., Pálsson, F., Mottram, R., Gascoin, S., and Björnsson, H.: The importance of accurate glacier albedo for estimates of surface mass balance on Vatnajökull: evaluating the surface energy budget in a regional climate model with automatic weather station observations, The Cryosphere, 11, 1665–1684, https://doi.org/10.5194/tc-11-1665-2017, 2017. a, b, c, d, e, f
Schmidt, L. S., Adalgeirsdóttir, G., Pálsson, F., Langen, P. L., Gudmundsson, S., and Björnsson, H.: Dynamic simulations of Vatnajökull ice cap from 1980 to 2300, J. Glaciol., 66, 97–112, https://doi.org/10.1017/jog.2019.90, 2020. a, b, c
Sicart, J. E., Pomeroy, J. W., Essery, R. L. H., and Bewley, D.: Incoming longwave radiation to melting snow: observations, sensitivity and estimation in Northern environments, Hydrol. Process., 20, 3697–3708, https://doi.org/10.1002/hyp.6383, 2006. a
Sicart, J. E., Hock, R., and Six, D.: Glacier melt, air temperature, and energy balance in different climates: The Bolivian Tropics, the French Alps, and northern Sweden, J. Geophys. Res.-Atmos., 113, D24113, https://doi.org/10.1029/2008JD010406, 2008. a
Six, D., Wagnon, P., Sicart, J., and Vincent, C.: Meteorological controls on snow and ice ablation for two contrasting months on Glacier de Saint-Sorlin, France, Ann. Glaciol., 50, 66–72, https://doi.org/10.3189/172756409787769537, 2009. a
Slater, T., Lawrence, I. R., Otosaka, I. N., Shepherd, A., Gourmelen, N., Jakob, L., Tepes, P., Gilbert, L., and Nienow, P.: Review article: Earth's ice imbalance, The Cryosphere, 15, 233–246, https://doi.org/10.5194/tc-15-233-2021, 2021. a
Smeets, C. J. P. P. and van den Broeke, M. R.: The Parameterisation of Scalar Transfer over Rough Ice, Bound.-Lay. Meteorol., 128, 339, https://doi.org/10.1007/s10546-008-9292-z, 2008a. a
Smeets, C. J. P. P. and van den Broeke, M. R.: Temporal and Spatial Variations of the Aerodynamic Roughness Length in the Ablation Zone of the Greenland Ice Sheet, Bound.-Lay. Meteorol., 128, 315–338, https://doi.org/10.1007/s10546-008-9291-0, 2008b. a
Smeets, C. J. P. P., Duynkerke, P. G., and Vugts, H. F.: Observed Wind Profiles and Turbulence Fluxes over an ice Surface with Changing Surface Roughness, Bound.-Lay. Meteorol., 92, 99–121, https://doi.org/10.1023/A:1001899015849, 1999. a
Stone, P. H. and Carlson, J. H.: Atmospheric Lapse Rate Regimes and Their Parameterization, J. Atmos. Sci., 36, 415–423, https://doi.org/10.1175/1520-0469(1979)036<0415:ALRRAT>2.0.CO;2, 1979. a
Sveinsson, Ó.: Energy in Iceland: Adaptation to Climate Change, UNU-FLORES Policy Briefs, United Nations University Institute for Integrated Management of Material Fluxes and of Resources (UNU-FLORES), Dresden, 2016. a
Van As, D.: Warming, glacier melt and surface energy budget from weather station observations in the Melville Bay region of northwest Greenland, J. Glaciol., 57, 208–220, https://doi.org/10.3189/002214311796405898, 2011. a, b, c
van As, D., Broeke, M. V. D., Reijmer, C., and Wal, R. V. D.: The Summer Surface Energy Balance of the High Antarctic Plateau, Bound.-Lay. Meteorol., 115, 289–317, https://doi.org/10.1007/s10546-004-4631-1, 2005. a, b
van As, D., Bech Mikkelsen, A., Holtegaard Nielsen, M., Box, J. E., Claesson Liljedahl, L., Lindbäck, K., Pitcher, L., and Hasholt, B.: Hypsometric amplification and routing moderation of Greenland ice sheet meltwater release, The Cryosphere, 11, 1371–1386, https://doi.org/10.5194/tc-11-1371-2017, 2017. a
van den Broeke, M. R., Smeets, C. J. P. P., and van de Wal, R. S. W.: The seasonal cycle and interannual variability of surface energy balance and melt in the ablation zone of the west Greenland ice sheet, The Cryosphere, 5, 377–390, https://doi.org/10.5194/tc-5-377-2011, 2011. a
Vandecrux, B., Fausto, R. S., Langen, P. L., van As, D., MacFerrin, M., Colgan, W. T., Ingeman-Nielsen, T., Steffen, K., Jensen, N. S., Möller, M. T., and Box, J. E.: Drivers of Firn Density on the Greenland Ice Sheet Revealed by Weather Station Observations and Modeling, J. Geophys. Res.-Earth Surf., 123, 2563–2576, https://doi.org/10.1029/2017JF004597, 2018. a
Veðurstofa Íslands: Tíðarfar ársins 2021, https://www.vedur.is/um-vi/frettir/tidarfar-arsins-2021 (last access: 1 September 2022), 2022. a
Warren, S. G. and Wiscombe, W. J.: A Model for the Spectral Albedo of Snow. II: Snow Containing Atmospheric Aerosols, J. Atmos. Sci., 37, 2734–2745, https://doi.org/10.1175/1520-0469(1980)037<2734:AMFTSA>2.0.CO;2, 1980. a
Wildt, M., Oerlemans, J., and Björnsson, H.: A calibrated mass balance model for Vatnajökull, Iceland, Jökull, 52, 1–20, 2004. a, b
Wittmann, M., Groot Zwaaftink, C. D., Steffensen Schmidt, L., Guðmundsson, S., Pálsson, F., Arnalds, O., Björnsson, H., Thorsteinsson, T., and Stohl, A.: Impact of dust deposition on the albedo of Vatnajökull ice cap, Iceland, The Cryosphere, 11, 741–754, https://doi.org/10.5194/tc-11-741-2017, 2017. a, b, c
WMO: Systematic Observation Requirements for Satellite-based Products for Climate Supplemental details to the satellite-based component of the Implementation Plan for the Global Observing System for Climate in Support of the UNFCCC: 2011 update, GCOS- No. 154, p. 138, 2011. a
Zemp, M., Huss, M., Thibert, E., Eckert, N., McNabb, R., Huber, J., Barandun, M., Machguth, H., Nussbaumer, S. U., Gärtner-Roer, I., Thomson, L., Paul, F., Maussion, F., Kutuzov, S., and Cogley, J. G.: Global glacier mass changes and their contributions to sea-level rise from 1961 to 2016, Nature, 568, 382–386, https://doi.org/10.1038/s41586-019-1071-0, 2019. a
Zhao, J., Yang, J., Semper, S., Pickart, R. S., Våge, K., Valdimarsson, H., and Jónsson, S.: A Numerical Study of Interannual Variability in the North Icelandic Irminger Current, J. Geophys. Res.-Oceans, 123, 8994–9009, https://doi.org/10.1029/2018JC013800, 2018. a
- Abstract
- Introduction
- Study area
- Data and methods
- Results and discussion
- Summary and discussion
- Conclusions
- Appendix A: Glacier weather station location
- Appendix B: Melt energy and albedo variability with elevation
- Data availability
- Author contributions
- Competing interests
- Disclaimer
- Acknowledgements
- Review statement
- References