the Creative Commons Attribution 4.0 License.
the Creative Commons Attribution 4.0 License.
 | 12 Sep 2023
Thinning and surface mass balance patterns of two neighbouring debris-covered glaciers in the southeastern Tibetan Plateau
Chuanxi Zhao
Wei Yang
Evan Miles
Matthew Westoby
Marin Kneib
Yongjie Wang
Zhen He
Francesca Pellicciotti
Debris-covered glaciers are a common feature of the mountain cryosphere in the southeastern Tibetan Plateau. A better understanding of these glaciers is necessary to reduce the uncertainties in regional water resource variability and to anticipate potential cryospheric risks. In this study, we quantified the seasonal thinning and surface mass balance patterns of two neighbouring debris-covered glaciers (23K Glacier and 24K Glacier) in the southeastern Tibetan Plateau with four unpiloted aerial vehicle surveys and in situ measurements. We observed that the thinning of 23K Glacier was ∼2–7 times greater than that of the 24K Glacier for annual and cold periods. The surface velocity of the 24K Glacier is higher than that of the 23K Glacier (∼5–6 times) for all periods. In contrast with the thinning patterns, the surface mass balance patterns of the two glaciers closely agree across the different periods. We found that the surface mass balance distribution strongly correlated with the spatial distribution of debris thickness for both glaciers. Ice cliffs and supraglacial ponds are prevalent on the surface of these glaciers (∼4.4–7.2±0.5 %) and enhance melt overall (enhancement factor: ∼2.5) but do not control the surface mass balance pattern of either glacier. This comparison study of two neighbouring glaciers confirms the significance of both glacier dynamics and debris thickness in controlling thinning and melt for the different debris-covered glaciers of the southeastern Tibetan Plateau in the context of climate change.
- Article
(9514 KB) - Full-text XML
-
Supplement
(1923 KB) - BibTeX
- EndNote


Monsoon-influenced glaciers in the southeastern Tibetan Plateau have experienced more significant mass loss than those in most other regions of High Mountain Asia in the past 2 decades (Kääb et al., 2012; Yao et al., 2012; Brun et al., 2017; Shean et al., 2020; Hugonnet et al., 2021a). The percentage of debris-covered area as a proportion of the total glacierized area in the southeastern Tibetan Plateau was estimated at ∼17 %–19 %, which exceeds the percentage of debris-covered glacier area at the global scale (∼4.4 %–7.3 %; Scherler et al., 2018; Herreid and Pellicciotti, 2020). A better understanding of the evolution and mass balance patterns of debris-covered glaciers in the southeastern Tibetan Plateau is essential for constraining changes in regional water resources (Zhang et al., 2011; Neckel et al., 2017). Because proglacial lakes can develop on or in front of debris-covered glaciers (Wang et al., 2011; Allen et al., 2019; Racoviteanu et al., 2022), and because glacier thinning may affect slope stability (Kääb et al., 2021; An et al., 2022; Zhao et al., 2022), expanding this knowledge base may also inform the understanding of mountain geohazards.
The presence of debris can influence the response of glaciers to climate change. If the supraglacial debris is more than a few centimetres in thickness, it will provide a melt-buffering effect (Østrem, 1959; Nakawo et al., 1999; Nicholson and Benn, 2006; Reid and Brock, 2010; Anderson and Anderson, 2016; Yang et al., 2017). However, several satellite remote sensing studies have found similar thinning rates for debris-free and debris-covered glaciers (Kääb et al., 2012; Gardelle et al., 2013; Pellicciotti et al., 2015; Brun et al., 2019). Additionally, a higher thinning rate of debris-covered glaciers than debris-free glaciers was found in the Lahaul and Spiti region of the Indian Himalaya (Vincent et al., 2013), and several studies have also confirmed the strong surface thinning of debris-covered glaciers in the southeastern Tibetan Plateau (−0.52 to −0.83 m a−1; Neckel et al., 2017; Ke et al., 2020). This phenomenon has been referred to as the “debris-cover anomaly” (Pellicciotti et al., 2015; Vincent et al., 2016). Ice cliffs and supraglacial ponds could partly explain this anomaly because they are directly exposed to incoming radiation and therefore act as melt “hotspots” (Sakai et al., 1998, 2002; Reid and Brock, 2014; Juen et al., 2014; Steiner et al., 2015; Buri et al., 2016; Miles et al., 2016, 2018; Buri et al., 2021). The area influenced by cliffs and ponds is characterized by high melt rates relative to the surrounding debris-covered area (not containing ice cliffs and ponds) based on the differencing of high-resolution digital elevation models (DEMs) and energy-balance modelling (Thompson et al., 2016; Buri et al., 2016, 2021; Brun et al., 2018; Miles et al., 2018, 2022; Mishra et al., 2022; Sato et al., 2021; Kneib et al., 2022). However, some studies have found that thicker debris cover has a larger effect on total thinning than enhanced ice ablation from ice cliffs and supraglacial ponds area (e.g. Hambrey et al., 2008; Vincent et al., 2016; Brun et al., 2018; Anderson et al., 2021a). Additionally, glacier dynamics play an essential role in debris-covered glacier elevation changes, and the rapid thinning of debris-covered glaciers is speculated to be partly caused by declining ice flow (Berthier and Vincent, 2012; Nuimura et al., 2017; Brun et al., 2018; Anderson et al., 2021a, b; Rounce et al., 2021). However, this has been evaluated with high accuracy at very few sites, none of which are in the southeast Tibetan Plateau.
These hypotheses (additional melt at areas influenced by cliffs or supraglacial ponds or extra thinning from reduced ice supply) therefore need to be supported with high-resolution data to account for the local effects of these melt hotspots. Since ice cliffs and supraglacial ponds tend to have a relatively small area and have a high interannual and interseasonal variability (Miles et al., 2017; Kneib et al., 2021), it is challenging to accurately track their evolution over time and quantify their contribution to melt (Mishra et al., 2022; Kneib et al., 2022). Because of these challenges, studies that have investigated their spatial distribution, dynamics, and melt contribution have typically utilized unpiloted aerial vehicles (UAVs) or very high-resolution optical satellite data (Immerzeel et al., 2014; Brun et al., 2016, 2018; Mölg et al., 2019; Anderson et al., 2021a; Kneib et al., 2021, 2022; Mishra et al., 2022; Sato et al., 2021), which can infer detailed observations of local processes (e.g. Westoby et al., 2020). Compared with the use of UAVs, in situ observations have the shortcoming of limited spatial representation, while remote sensing data have insufficient spatial and temporal resolution and are vulnerable to cloudy and rainy weather. Therefore, UAV technology is widely applied in glaciological studies, including in debris-covered glacier settings (Hugenholtz et al., 2013; Immerzeel et al., 2014; Kraaijenbrink et al., 2016; Wigmore and Mark, 2017; Fugazza et al., 2018; Rossini et al., 2018; Bash and Moorman, 2020; Westoby et al., 2020; Cao et al., 2021; Mishra et al., 2022; Xu et al., 2022). High-precision DEMs and orthophotos can be obtained relatively easily from UAV images processed using structure from motion (UAV-SfM) with multi-view stereo photogrammetry (Westoby et al., 2012; Benoit et al., 2019). However, few studies have estimated the seasonal or annual surface mass balance of debris-covered glaciers based on repeated UAV data.
Here, we systematically compare the glacier change patterns of two neighbouring debris-covered glaciers, 23K Glacier and 24K Glacier, in the southeastern Tibetan Plateau for the period of 13 August 2019 to 22 October 2020 using change detection applied to high-resolution repeated DEMs and orthoimages acquired via UAV-SfM surveys and in situ measurements. The glaciers are located in the same catchment and climatic setting, but the topography of the glaciers, as well as their dynamic behaviour and supraglacial debris thickness, differs considerably. The objective of this study is to explore the factors that control the interglacier variability in surface thinning and surface mass balance patterns of these two glaciers, with a view to advance the understanding of the key mechanisms that control debris-covered glacier changes in the southeastern Tibetan Plateau and to assess the different hypotheses at the glacier scale that contribute to the anomalous thinning of debris-covered glaciers.
The 23K (∼4 km2) and 24K (∼2 km2) glaciers are located in the southeastern Tibetan Plateau (∼29.77∘ N, 95.70∘ E; Fig. 1) and are mainly affected by two streams of humid air: the Bay of Bengal vortex (in spring) and the Indian summer monsoon system (in summer), respectively (Ye and Gao, 1979; Yang et al., 2013, 2016). Thus, the monthly precipitation distribution exhibits a double-peak pattern occurring in both spring and summer (Yang et al., 2013). This is significantly different from the glacier regime on the Tibetan Plateau, which is the so-called “summer accumulation” type (Fujita and Ageta, 2000; Maussion et al., 2014). Regional geodetic mass balance studies indicate that the magnitude of ice loss in the region has exceeded the average for High Mountain Asia (Kääb et al., 2012; Brun et al., 2017; Shean et al., 2020; Hugonnet et al., 2021a) in the past 20 years, also affecting debris-covered glaciers. The 23K and 24K glaciers are located on the northern slopes of the Gangrigabu mountains, ∼23 and 24 km, respectively, from Bomi City (Yang et al., 2017). The 23K Glacier spans an altitudinal range of 3760 to 5437 m a.s.l. and flows initially towards the southeast before turning to the northeast in the ablation zone (Fig. 1a). In contrast, the 24K Glacier flows to the northwest and spans an altitudinal range of 3900 to 5621 m a.s.l. Both glaciers are partly covered by a layer of rock debris (Fig. 1a and c), and the debris-covered area represents approximately 34 % and 41 % of the total area for the 23K Glacier and 24K Glacier, respectively, based on satellite data (Pléiades-1A false-colour image from 20 September 2021, 2 m resolution). The terminus retreat patterns of the two glaciers are also conspicuously different: the terminus of the 23K Glacier appears largely stagnant and is enclosed by a latero-terminal moraine complex, while the terminus of the 24K Glacier presents a large ice cliff, which is bounded by lateral moraines (Fig. 1c and d). Data from an automatic weather station (AWS, 3900 m a.s.l., running between June and September 2016) on the 24K Glacier indicate a warm and humid climate, with mean temperature and total precipitation reaching ∼9 ∘C and ∼1700 mm, respectively (Yang et al., 2017; Fugger et al., 2022).
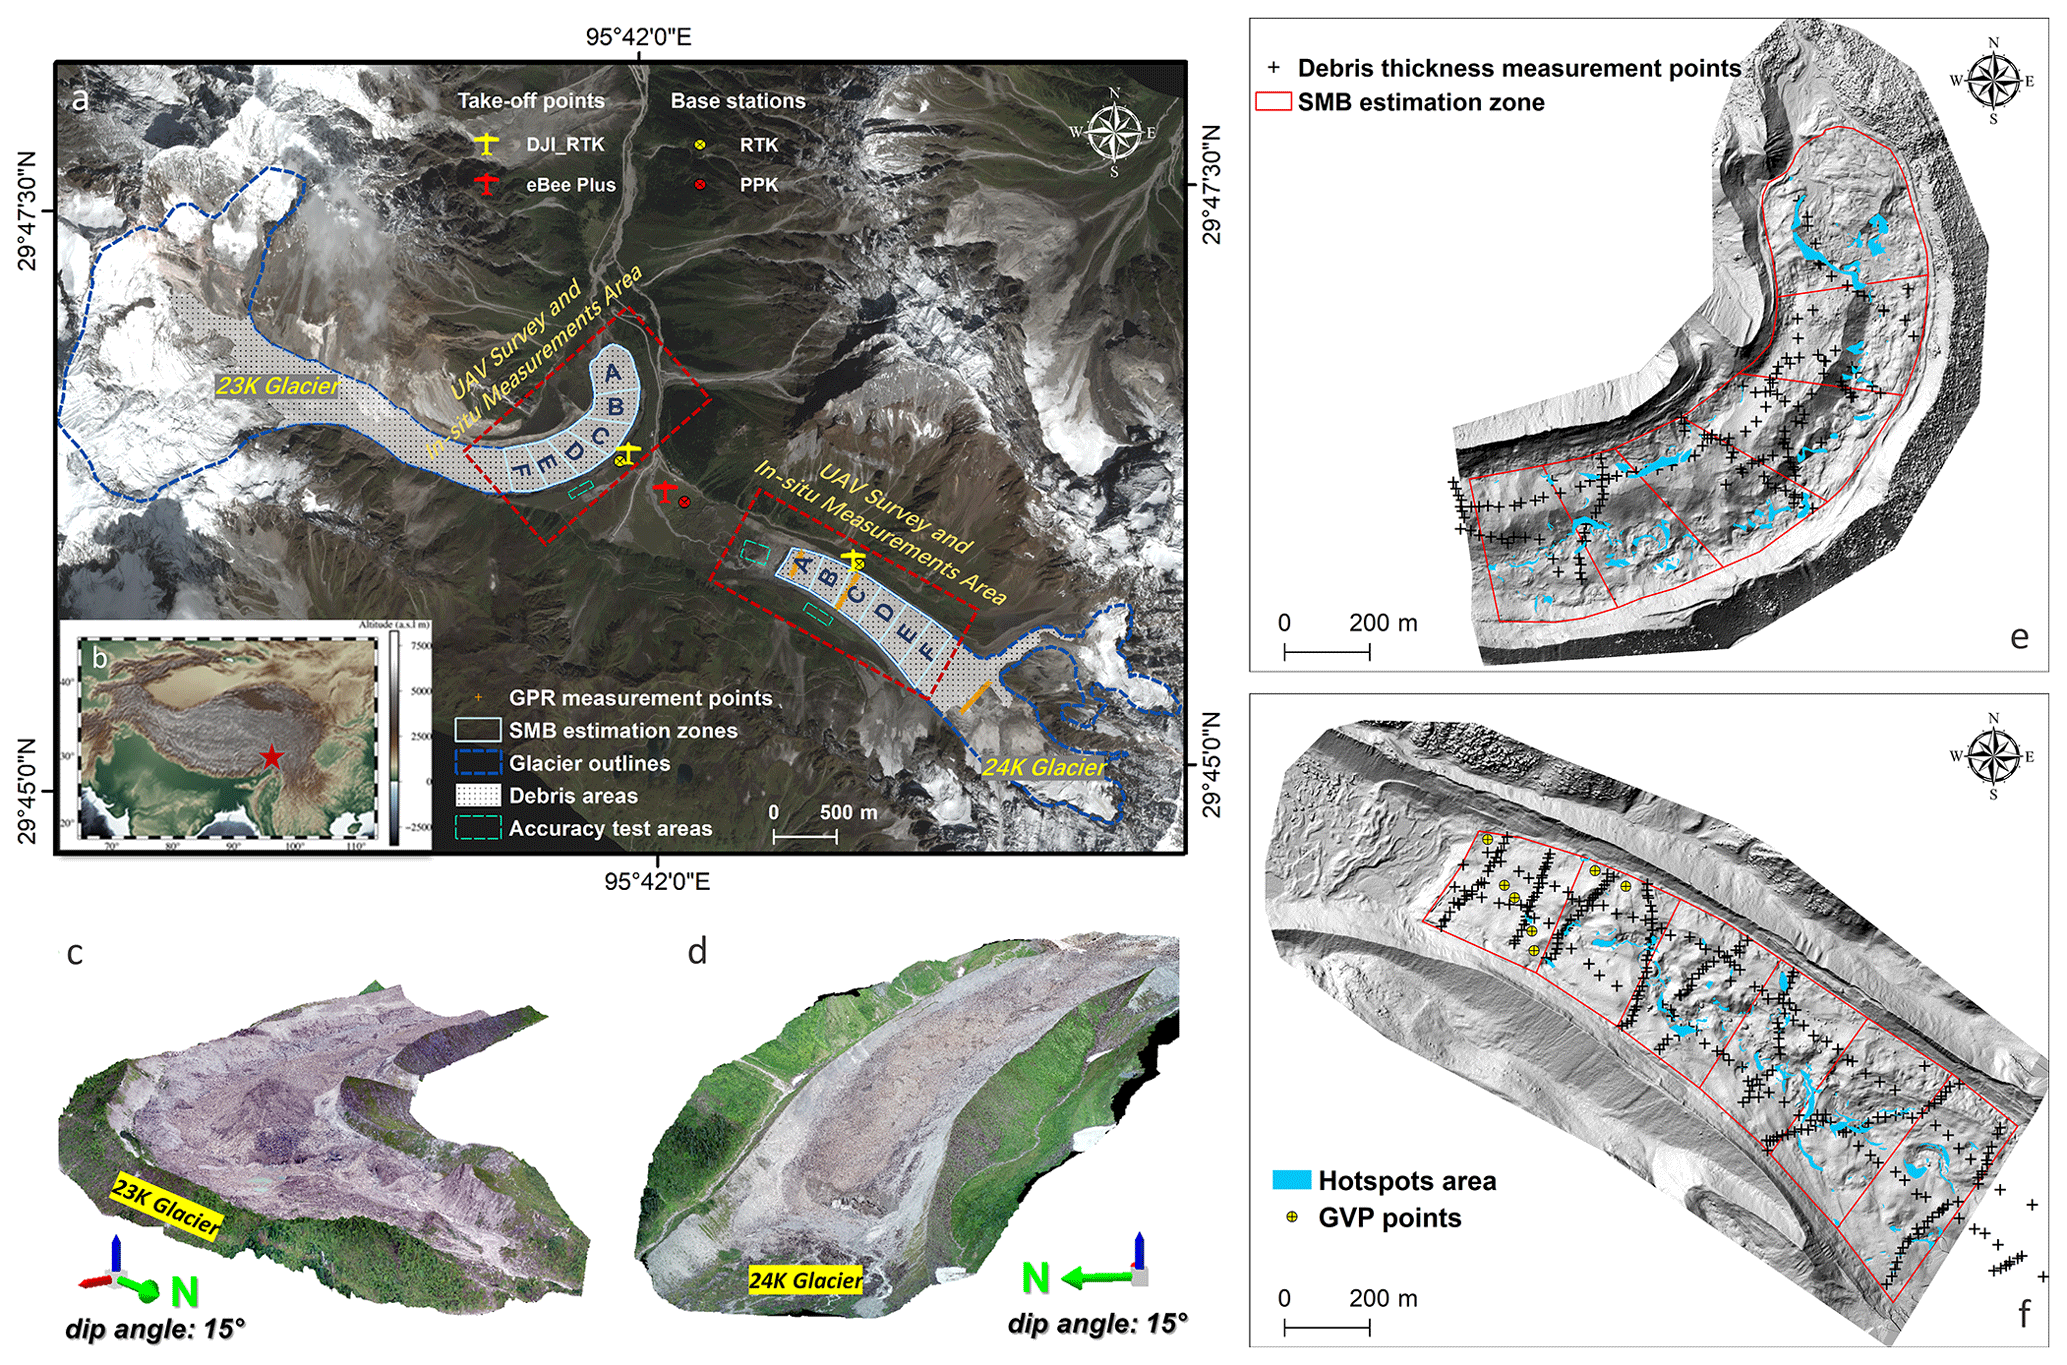
Figure 1(a) Overview of the 23K Glacier and 24K Glacier basins including the UAV survey areas, accuracy test areas, in situ measurement locations (ground validation points, ground penetrating radar,debris thickness measurements), surface mass balance estimation zones (zones A–F), and glacier outlines (background image Pléiades-1A false-colour image from 20 September 2021). © CNES 2021, Distribution Airbus D&S. (b) Geographic location of the study area. (c–d) UAV-derived three-dimensional images of the two glaciers. (e–f) Spatial distribution of the surface mass balance estimation zones of the two glaciers (e: 23K Glacier; f: 24K Glacier), debris thickness measurement points (in June 2019), and distribution of ice cliffs and supraglacial ponds based on 2020 orthomosaics.
3.1 UAV flights and data processing
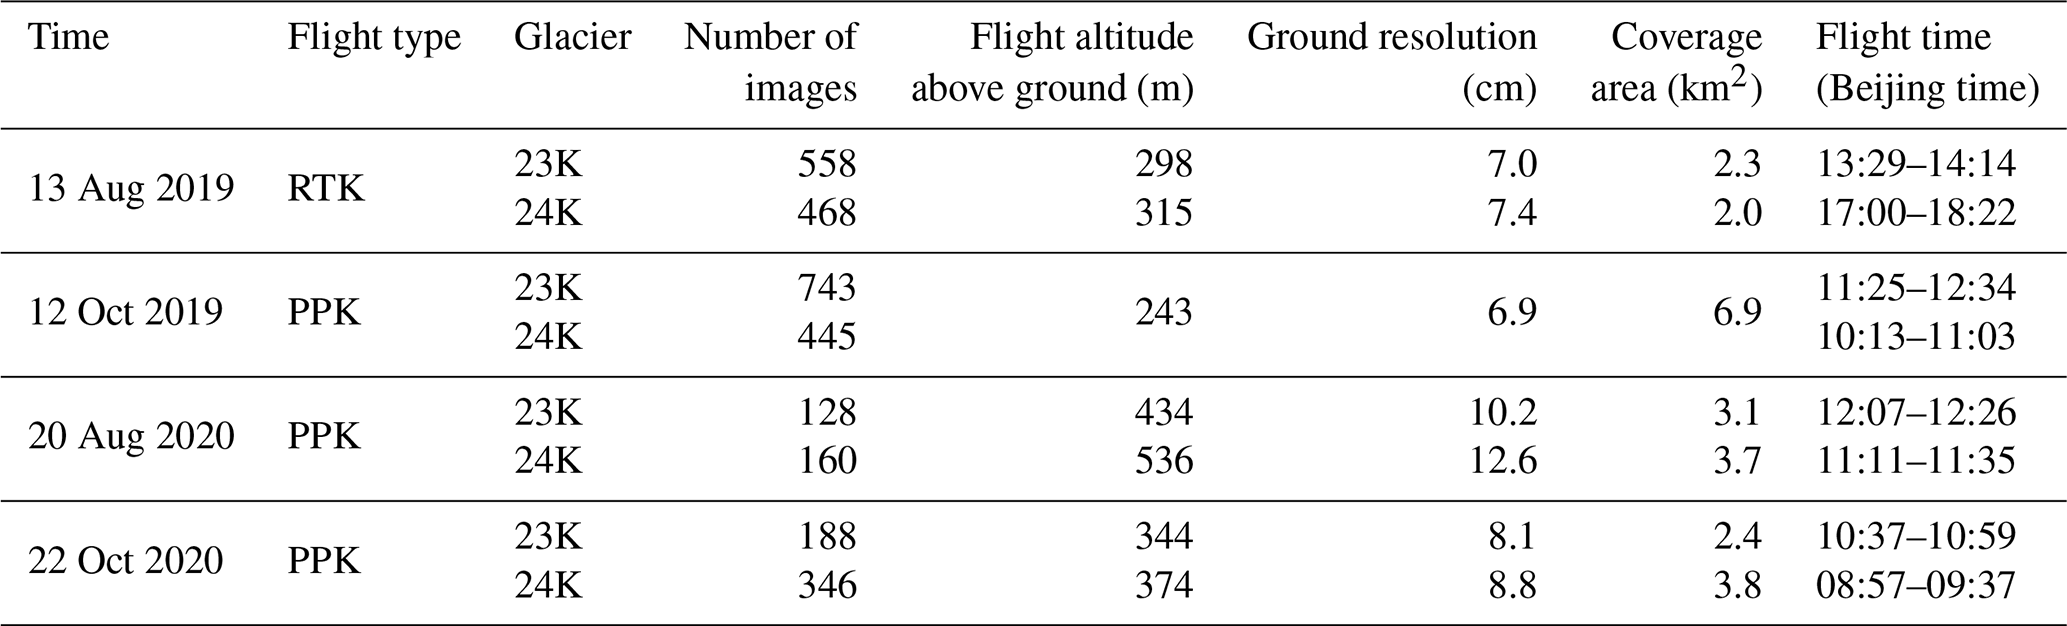
Optical imagery of the glacier surface and its immediate surroundings was acquired using UAVs during four field campaigns conducted between 13 August 2019 and 22 October 2020 (Table 1). We used an eBee Plus aircraft with built-in global navigation satellite system (GNSS) post-processed kinematic (PPK) functionality in October 2019, August 2020, and October 2020 surveys and a DJI Phantom 4 real-time kinematic (RTK) aircraft in an August 2019 survey to capture the high-resolution annual and seasonal patterns of glacier thinning and surface displacement.
The eBee Plus (Fig. S1a in the Supplement) is a fixed-wing UAV that has a 20-megapixel RGB digital compact camera (SenseFly S.O.D.A.). The flight management software eMotion3® was used for flight planning. The DJI Phantom 4 RTK is a rotary-wing UAV (Fig. S1c) equipped with a 2.54 cm (1 in.), 20-megapixel CMOS camera. In this study, all longitudinal and lateral image overlaps were set to 65 % and 80 %, respectively. The flight lines for the eBee Plus and DJI Phantom 4 RTK aircraft maintained a relatively constant survey height above the glacier surface, which resulted in a constant ground resolution for each survey. A Huaxing A10 GNSS GPS was used as a static base station (Fig. S1b; fixed position for different surveys), and these data were attached to exchangeable image file format (EXIF) metadata of every geotagged image (Yang et al., 2020) and thereby integrated into a post-processed kinematic (PPK) correction workflow to improve the accuracy of the UAV-SfM reconstruction. The DJI Phantom 4 RTK aircraft was permanently connected to a GNSS receiver (D-RTK 2, Fig. S1d) so that each survey image already had its high-precision position information embedded (i.e. no post-processing required). The geotagged UAV images were used to create orthomosaics and DEMs using the SfM-based photogrammetric software Pix4Dmapper version 4.3.31.
To assess the final positional accuracy of the UAV-derived outputs, seven ground validation points were laid out in the vicinity of in situ measurements (Fig. 1a) on the surface of the 24K Glacier in October 2020 (synchronized with the October 2020 UAV survey). We used a Huaxing A10 differential Global Positioning System (dGPS) to measure the position (XYZ) of each ground validation point. The horizontal accuracy of the dGPS is ±8 mm, and the vertical accuracy is ±15 mm. By comparing the ground validation point measurements with the UAV-derived orthomosaics and DEMs, we obtain absolute XYZ accuracies for the October 2020 UAV-SfM survey product (Table 2). While ground validation points were not used for the other UAV-SfM surveys, the accuracies of all UAV-SfM products were indirectly assessed by comparing the horizontal (XY) and vertical errors (Z) between all orthomosaics and DEMs (Table 3). The horizontal (XY) error was estimated by measuring the displacements of 25 benchmark boulders located on stable off-glacier terrain. For the vertical (Z) error, we calculated the elevation difference over stable terrain, as outlined in Fig. 1a.
Table 1UAV photogrammetric flights used for the acquisition of glacier images.
3.2 In situ measurements
To evaluate the role of debris on the surface mass balance patterns of both glaciers, debris thickness was manually measured by digging pits at selected sites in June 2019 (Fig. 1d and e). For the 23K Glacier, a total of 157 locations were measured within the elevation range of 3740–3880 m a.s.l. For the 24K Glacier, we measured a total of 349 points from the glacier terminus to 4250 m a.s.l. The uncertainty of the manual measurement of the debris thickness was assumed to be 2 cm.
In October 2019, three ice thickness cross-sections (two in the debris-covered area and one in the debris-free area, Figs. 1a and S2) were measured on the 24K Glacier using a Kentech ground penetrating radar (GPR) monopulse transmitter with 2.5 MHz antennas. The in situ ice thickness measurements were used to correct the 24K Glacier distributed ice thickness from Farinotti et al. (2019) using a linear regression (Fig. S2; Kneib et al., 2022).
3.3 Thinning patterns, glacier dynamics, and glacier driving stress
We compared the thinning and velocity patterns of the 23K and 24K glaciers on annual and seasonal timescales. The period between August 2019 and August 2020 (373 d, mean temperature at AWS: 1.66 ∘C) was selected for the annual timescale analysis. The annual rates were adjusted according to the ratio of days (366 divided by 373) to make this result (13 August 2019–20 October 2020, 373 d) closer to that of the natural year (366 d). For the seasonal analysis, we refer to the period 12 October 2019–20 August 2020 (313 d, mean temperature: 0.42 ∘C) as the “cold period” and the period 20 August 2020–22 October 2020 (63 d, mean temperature: 8.68 ∘C) as the “warm period”. We applied the post-processed kinematic and real-time kinematic GPS correction technologies and ensured that the static base stations were fixed at the same location for different surveys, which led to DEMs with only very small minor offsets in XYZ (Yang et al., 2020). Therefore, we did not perform the co-registration of DEMs for the thinning calculation. For each period the thinning pattern was obtained by DEM differencing in ArcGIS 10.4.
A spatially distributed estimate of XY surface displacements was obtained for each period by applying a normalized cross-correlation algorithm to the multi-directional 0.15 m resolution DEM hillshades using ImGRAFT (Messerli and Grinsted, 2015). A search window of 10×10 pixels (1.5×1.5 m) was used to compute the magnitude and direction of the displacement vectors. Surface displacements greater than 30 m were considered as noise and were filtered out. Due to the high-resolution velocity data and the small number of gaps (<5 %), we interpolated the velocity values in the data gaps using nearest neighbour interpolation.
The glacier driving stress was calculated as (Cuffey and Paterson, 2010)
where Dstress is the glacier driving stress (kPa), ρi is the density of ice (917 kg m−3), g is the gravitational acceleration (9.81 m s−2), h is the ice thickness (in m), and αs is the glacier slope obtained from the AW3D30 (30 m resolution) DEM (Tadono et al., 2014) smoothed with a Gaussian filter (8 pixel window) to remove effects from local variations in surface topography (Brun et al., 2018).
3.4 Surface mass balance of the UAV survey area
To investigate the magnitude and distribution of the surface mass balance, each glacier was divided into six zones (A–F), and each zone was used as a separate section for the surface mass balance estimation. Each surface mass balance estimation zone was outlined manually, perpendicular to the main glacier flow line and with a similar area (Fig. 1a). To extract the melt contribution from the ice cliffs and ponds, we flow-corrected the DEMs following Brun et al. (2018). To perform the flow-correction, we used orthomosaics and DEMs from the August 2020 UAV-SfM surveys as a reference for each glacier, to which the August 2019, October 2019, and October 2020 UAV-derived data were flow-corrected. Corrections in XY were made using the ArcGIS georeferencing tool to manually track the surface flow for each given period by using surface tie points (mainly large boulders). For each correction period, the number of tie points was sufficiently large (>75), and the tie points were well distributed across the glacier surface to ensure a spatially representative correction, using a spline-based transformation. The resulting XY flow-corrected elevation change (dhc, in m) is therefore equal to the sum of the surface lowering (, in m) from the surface mass balance (in m w.e.) by multiplying the conversion factor of 1.09 (the ratio of densities of water to ice) and the mean vertical displacement (ω, in m):
where ωs (in m) corresponds to the elevation change resulting from the horizontal flow-correction of the DEMs, us (in m) is the mean horizontal surface displacement, and αm (in ∘) is the mean surface slope of a given zone. ωe (in m) corresponds to the flux divergence. A (in m2) is the area of the zone, and Δq (in m3) is the ice flux difference at a given period. qn+1 and qn are the ice flux entering and leaving the estimation zone at a given period. q (in m3) is the ice flux through a glacier cross-section. μ is a coefficient to convert the surface velocity into a depth-averaged velocity which we assumed to be equal to 0.9 following Miles et al. (2018), hq (in m) is the ice thickness for the corresponding cross-section, v (in m) is the surface displacement component normal to the cross-sections line, and l (in m) is the width of the cross-section. The following equation was used to evaluate the uncertainty of the surface mass balance () for each zone:
The uncertainties of dhc and us (also for v) were obtained by calculating the mean surface elevation difference and displacement from the non-glacial test areas. They were determined to be 0.09 and 0.25 m, respectively, by averaging the values over all periods.
The equations below were applied in the uncertainty of the vertical component of velocity (σω):
For the uncertainty associated with the slope correction, we assumed a 2∘ uncertainty in the slope (αm). We obtained the uncertainty of the zone area (A) using ±20 m buffers from the original outlines (Bolch et al., 2010; Miles et al., 2018). The uncertainty of the ice flux difference (σΔq) was calculated as
where σq (m3) is the uncertainty of ice flux through a glacier cross-section, given by
where the uncertainty of the ratio μ (column-averaged velocity divided by surface velocity) is assumed to be 0.1 (Cuffey and Paterson, 2010; Miles et al., 2018). The uncertainty in hq is ∼10–35 m (26 %) for the 23K Glacier (Farinotti et al., 2019) and is assumed to be equal to 12 m for the corrected 24K Glacier (Fig. S2a) ice thickness.
3.5 Ice cliffs and supraglacial ponds outlines and melt contribution
In this study, the proportion of ice cliffs and supraglacial ponds area within each surface mass balance estimation zone was calculated to better understand the surface mass balance patterns on both glaciers. We manually extracted ice cliffs and supraglacial ponds outlines from the flow-corrected orthomosaics (August 2020 and October 2020, August 2019 and August 2020, October 2019 and August 2020). The outlines of the ice cliffs and supraglacial ponds area for each zone were combined into one polygon feature by taking the union of the areas of these features (Brun et al., 2018). In this way, we could effectively measure the surface elevation and mass balance changes at these locations, thereby providing us with an upper-bound estimate of the total contribution of ice cliffs and ponds to the surface mass balance (Kneib et al., 2022; Mishra et al., 2022). We conservatively assumed the uncertainty of the area density of ice cliffs and supraglacial ponds to be equal to 0.5 % (Brun et al., 2018; Steiner et al., 2019). We also defined the hotspots area enhancement factor as the ratio of melt rate of the ice cliffs and supraglacial ponds area to the sub-debris area melt rate (Miles et al., 2022).
4.1 UAV product accuracy
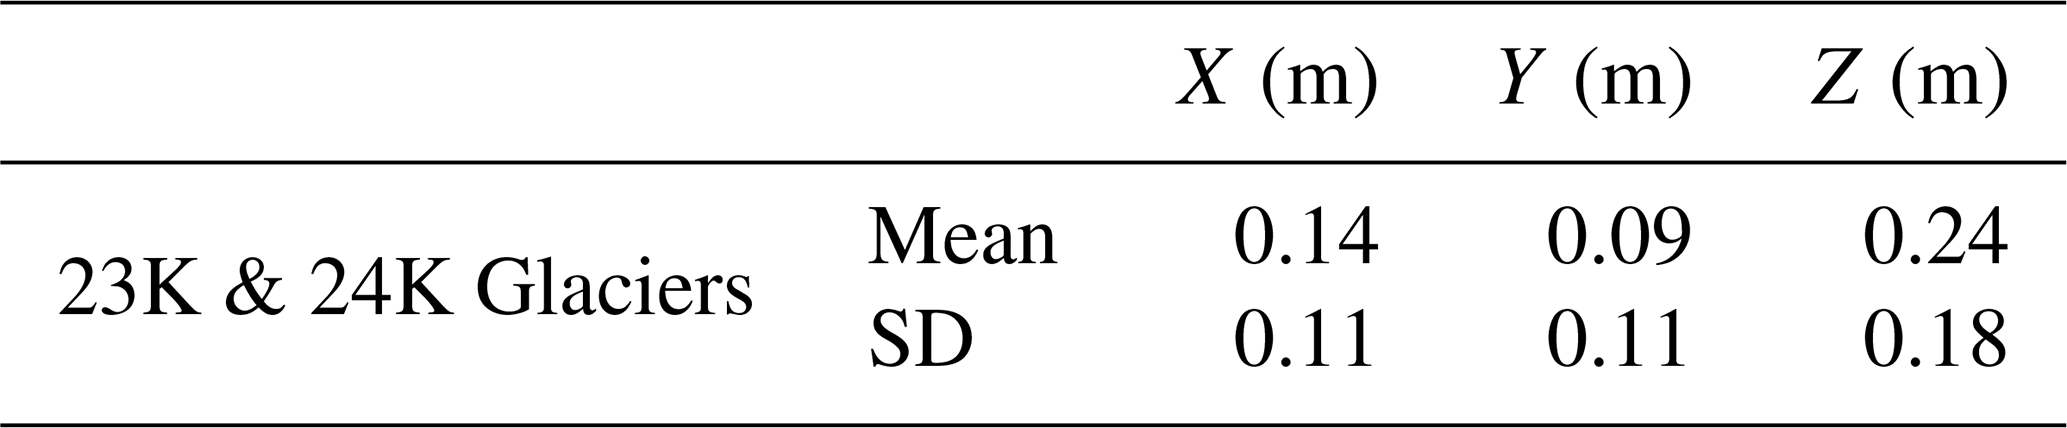
The uncertainties in the UAV measurements (22 October 2020) reported as the mean absolute deviation in the X, Y, and Z directions are 0.14±0.11 m, 0.09±0.11 m, and 0.24±0.18 m, respectively (Table 2). The vertical uncertainty is twice as high as the horizontal uncertainty, which is in agreement with the findings of other studies (James et al., 2017; Li et al., 2019).
Table 2XYZ geolocation accuracy of the UAV-SfM orthomosaic and DEM for the two glaciers based on the dGPS measurements of the seven ground validation points.
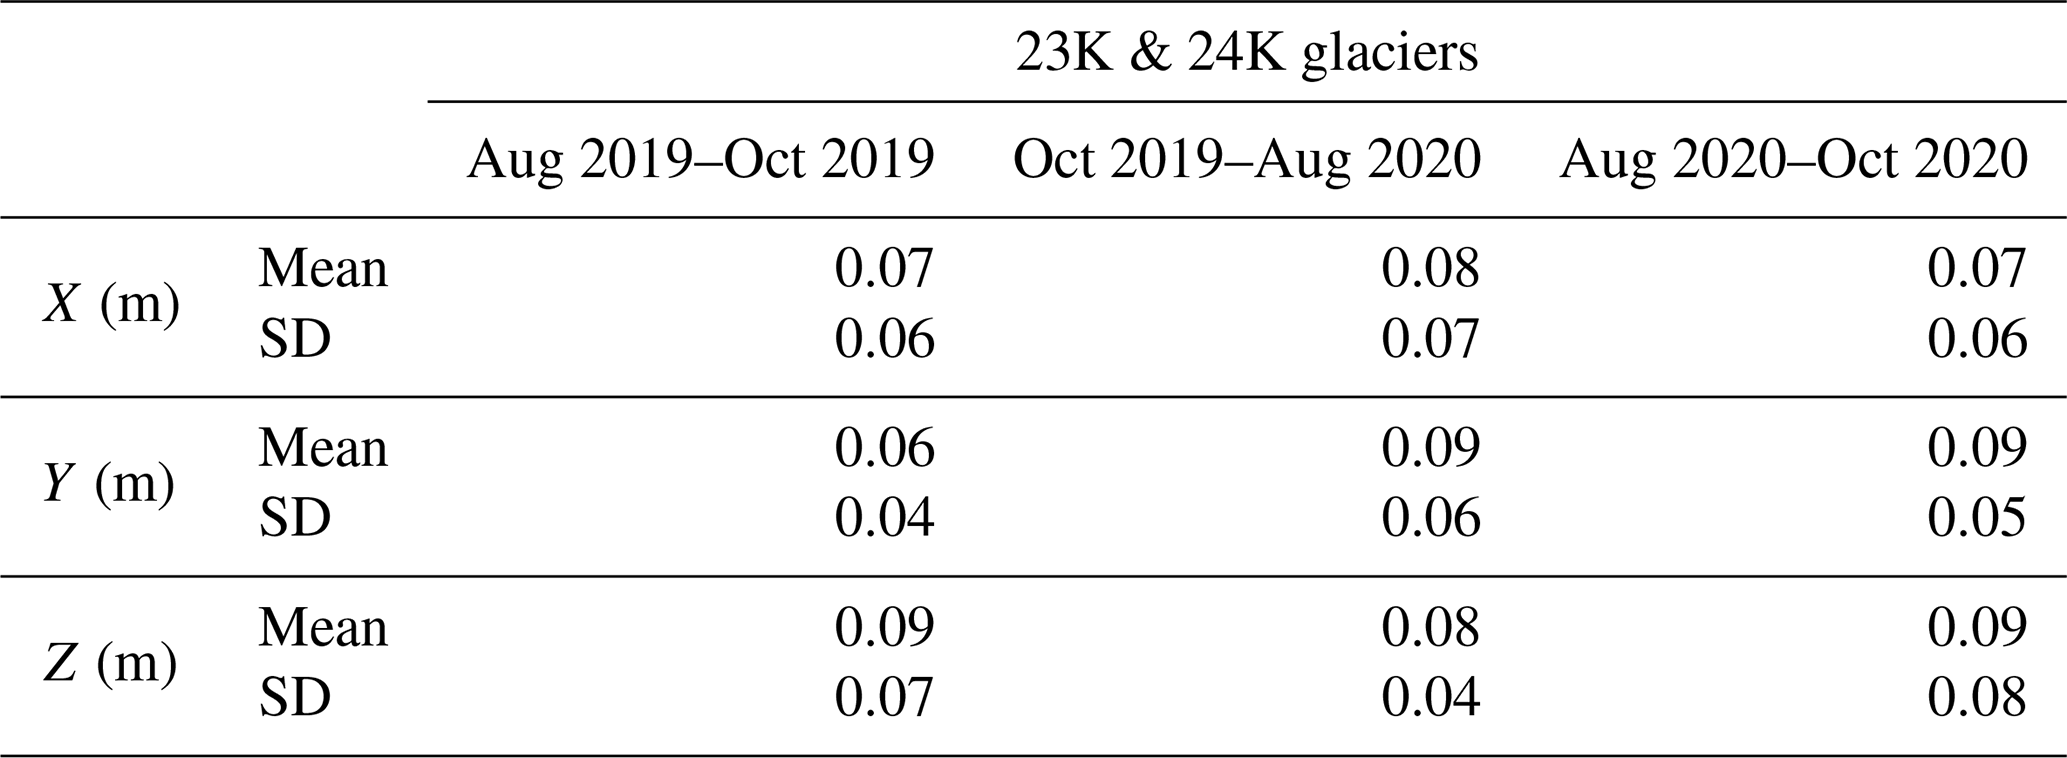
The average XY errors for the three survey pairs (August 2019 vs. October 2019, October 2019 vs. August 2020, and August 2020 vs. October 2020) were 0.07±0.06 and 0.08±0.06 m, respectively (Table 3). The relative vertical (Z) errors between the DEMs were ≤0.09 m for all pairs, which is appropriate for resolving fine-scale surface change for glaciological analysis.
Table 3XYZ errors between different orthomosaics and DEMs for the two glaciers using the fixed benchmark boulders and validation areas.
4.2 Spatio-temporal variability of thinning patterns
The thinning during different periods (annual: August 2019–August 2020, cold: October 2019–August 2020, warm: August 2020–October 2020) for the two glaciers is shown in Fig. 2 and Table 4. The annual thinning rate of the 23K Glacier in the survey area was m a−1, whereas the thinning rate of the 24K Glacier was m a−1 (Fig. 2a and d). During the cold period (October 2019–August 2020), the average surface elevation changes over the 23K and 24K glacier survey areas were and m, with an average daily thinning of and cm d−1, respectively (Fig. 2b and e). During the warm period (August 2020–October 2020), the magnitude of the thinning of both glaciers was very similar: and m, with an average daily thinning of cm d−1 for the 23K Glacier and cm d−1 for the 24K Glacier, respectively (Fig. 2c and f).
Table 4Total thinning and its daily rate for 23K and 24K glaciers during the different periods.
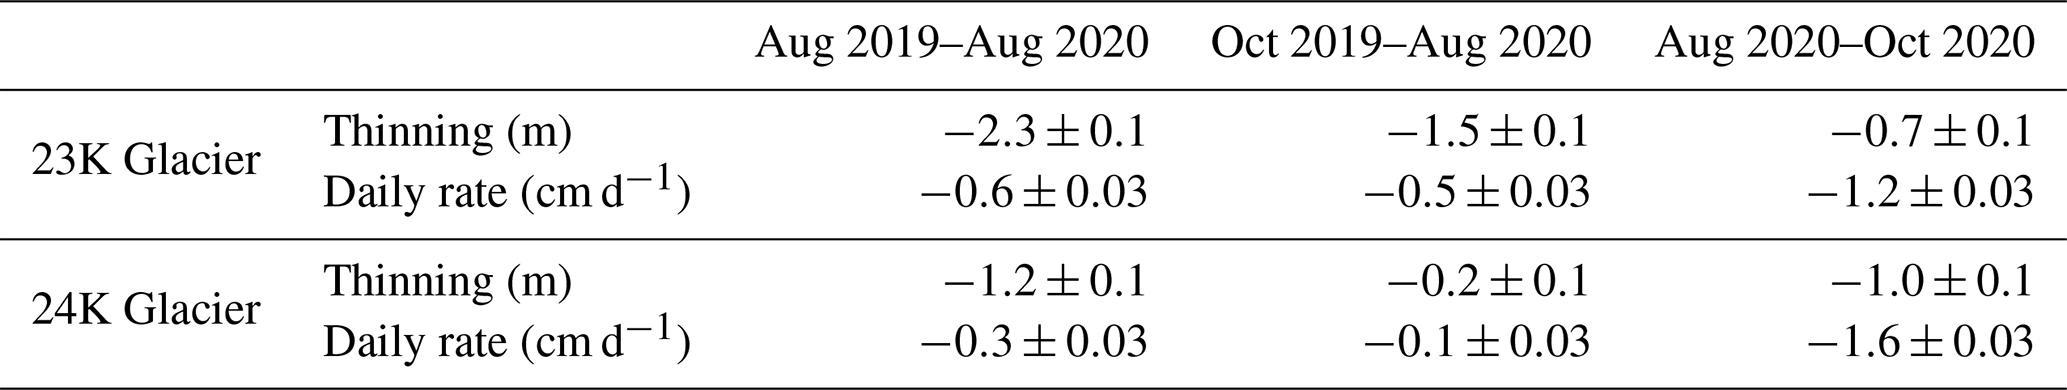
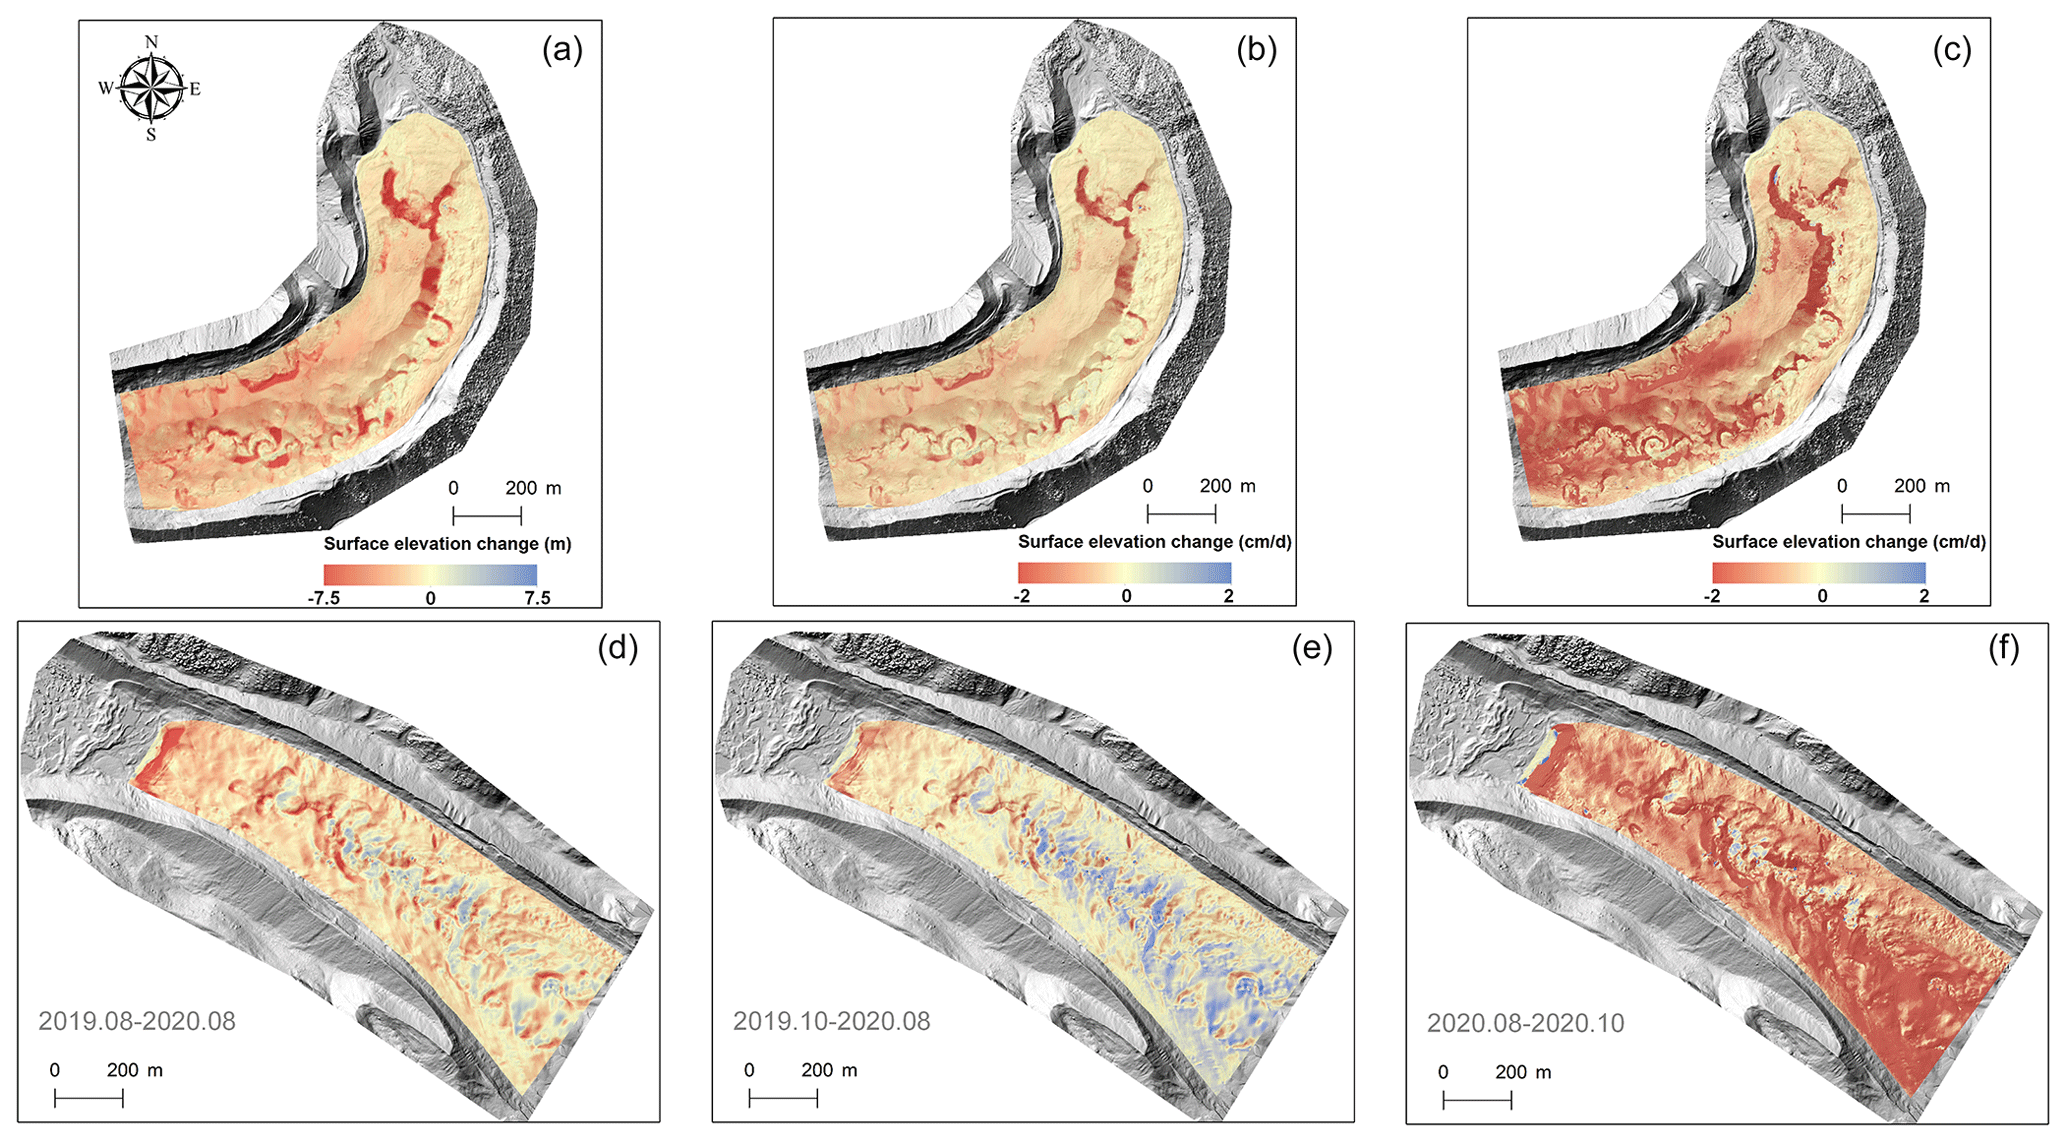
Figure 2Annual surface elevation changes between UAV-derived DEMs for August 2019–August 2020 (a, d) and thinning rates for the cold period (b, e) and the warm period (c, f). Upper panels refer to the 23K Glacier and bottom panels refer to the 24K Glacier.
In Fig. 3, we present the relationships between thinning rates and altitude for each glacier at 5 and 15 m intervals. The absolute thinning of the 23K Glacier increases with altitude based on the Mann–Kendall test (i.e. a negative gradient; Z value: −3.75 to −3.25) for every period of the analysis, while the thinning of the 24K Glacier decreases with altitude at the annual scale and in the cold period (positive gradient; Z value: +3.65 to +3.69). In particular, the thinning of the 24K Glacier in the warm period shows the opposite altitudinal trend to the annual and cold periods (i.e. consistent with the 23K Glacier; Z value: −0.77).
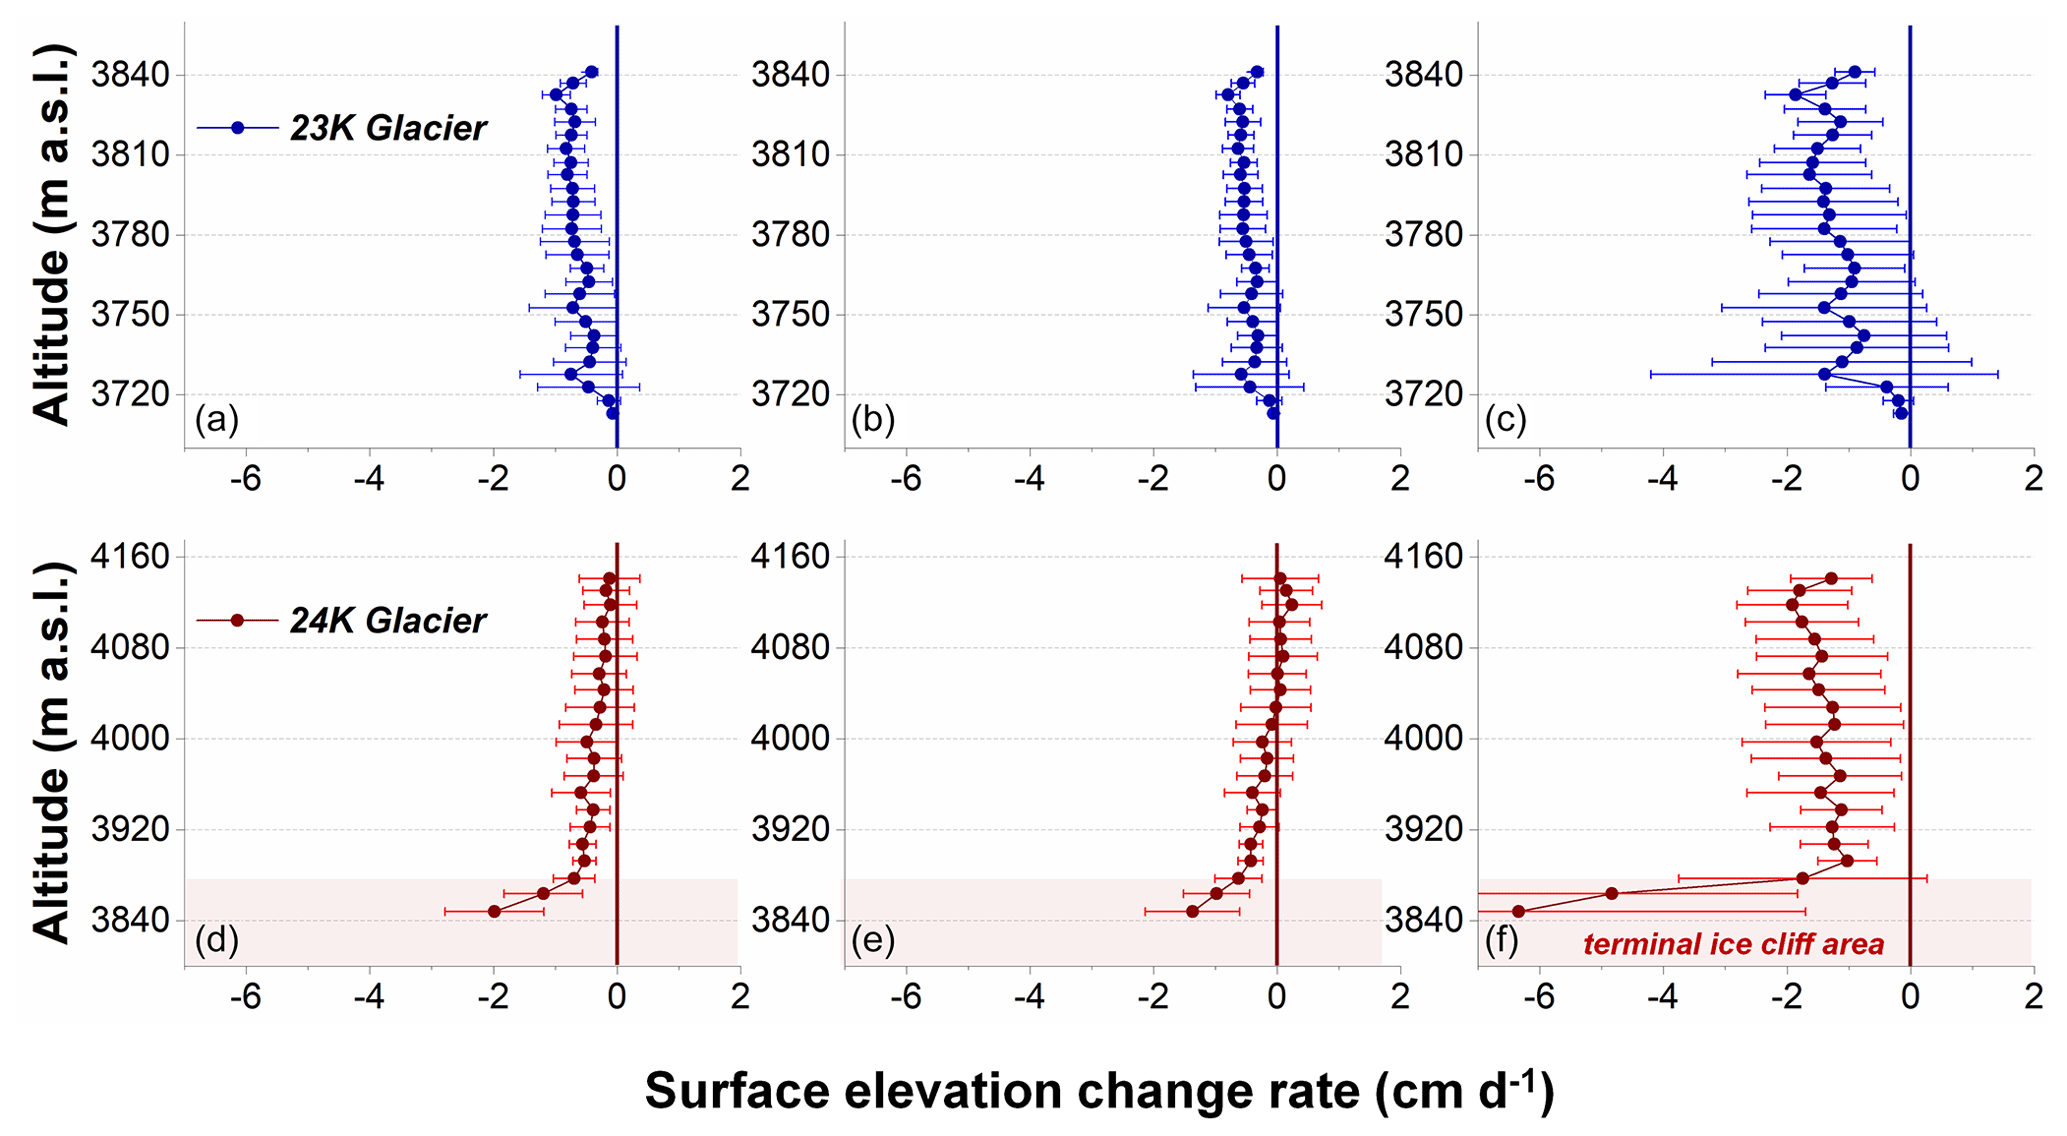
Figure 3Annual average glacier surface elevation change rates within 5 m (23K Glacier) and 15 m (24K Glacier) elevation bands (dots) with the corresponding standard deviations (horizontal error bar) for August 2019–August 2020 (a, d), the cold period (b, e), and the warm period (c, f) across the monitoring area of the two glaciers. The shadowed red sections represent the terminal ice cliff on the 24K Glacier.
4.3 Glacier dynamics
Between August 2019 and August 2020, the mean surface velocity of the UAV survey domain was 1.7±0.2 m a−1 for the 23K Glacier and 9.2±0.2 m a−1 for the 24K Glacier (Fig. 4a and d). There is a zone of stagnation at the terminus of the 23K Glacier where the surface velocity is less than 2 m a−1 (from terminus to 900 m up-glacier, Fig. 4a). During the cold period, the mean surface velocity (UAV survey domain) of the 23K Glacier was 0.4±0.03 cm d−1, while it was 2.4±0.08 cm d−1 for the 24K Glacier (Fig. 4b and e). During the warm period, the mean surface velocities of the UAV survey domains for the 23K Glacier and 24K Glacier were 0.6±0.14 and 3.0±0.40 cm d−1, respectively (Fig. 4c and f). For the UAV survey domain, the mean driving stress of the 23K Glacier was 1.6×10⁵ Pa and that of the 24K Glacier was 2.1×10⁵ Pa, ∼30 % higher than that for the 23K Glacier (Fig. 4g). The estimated emergence velocities agreed with the patterns of surface velocities and driving stress, with the 24K Glacier having significantly higher emergence velocities than the 23K Glacier at any period (Fig. 4h). The annual emergence velocity of the 23K Glacier was 0.18±0.04 m a−1, approximately 7.6 times lower than that of the 24K Glacier (1.36±0.14 m a−1). The mean emergence velocity during the cold period for the 23K (resp. 24K) Glacier was 0.05±0.01 cm d−1 (0.36±0.04 cm d−1), and the emergence velocity during the warm period for the 23K (resp. 24K) Glacier was 0.11±0.05 cm d−1 (0.29±0.06 cm d−1). The 24K Glacier had consistently higher emergence velocity than the 23K Glacier during all periods.
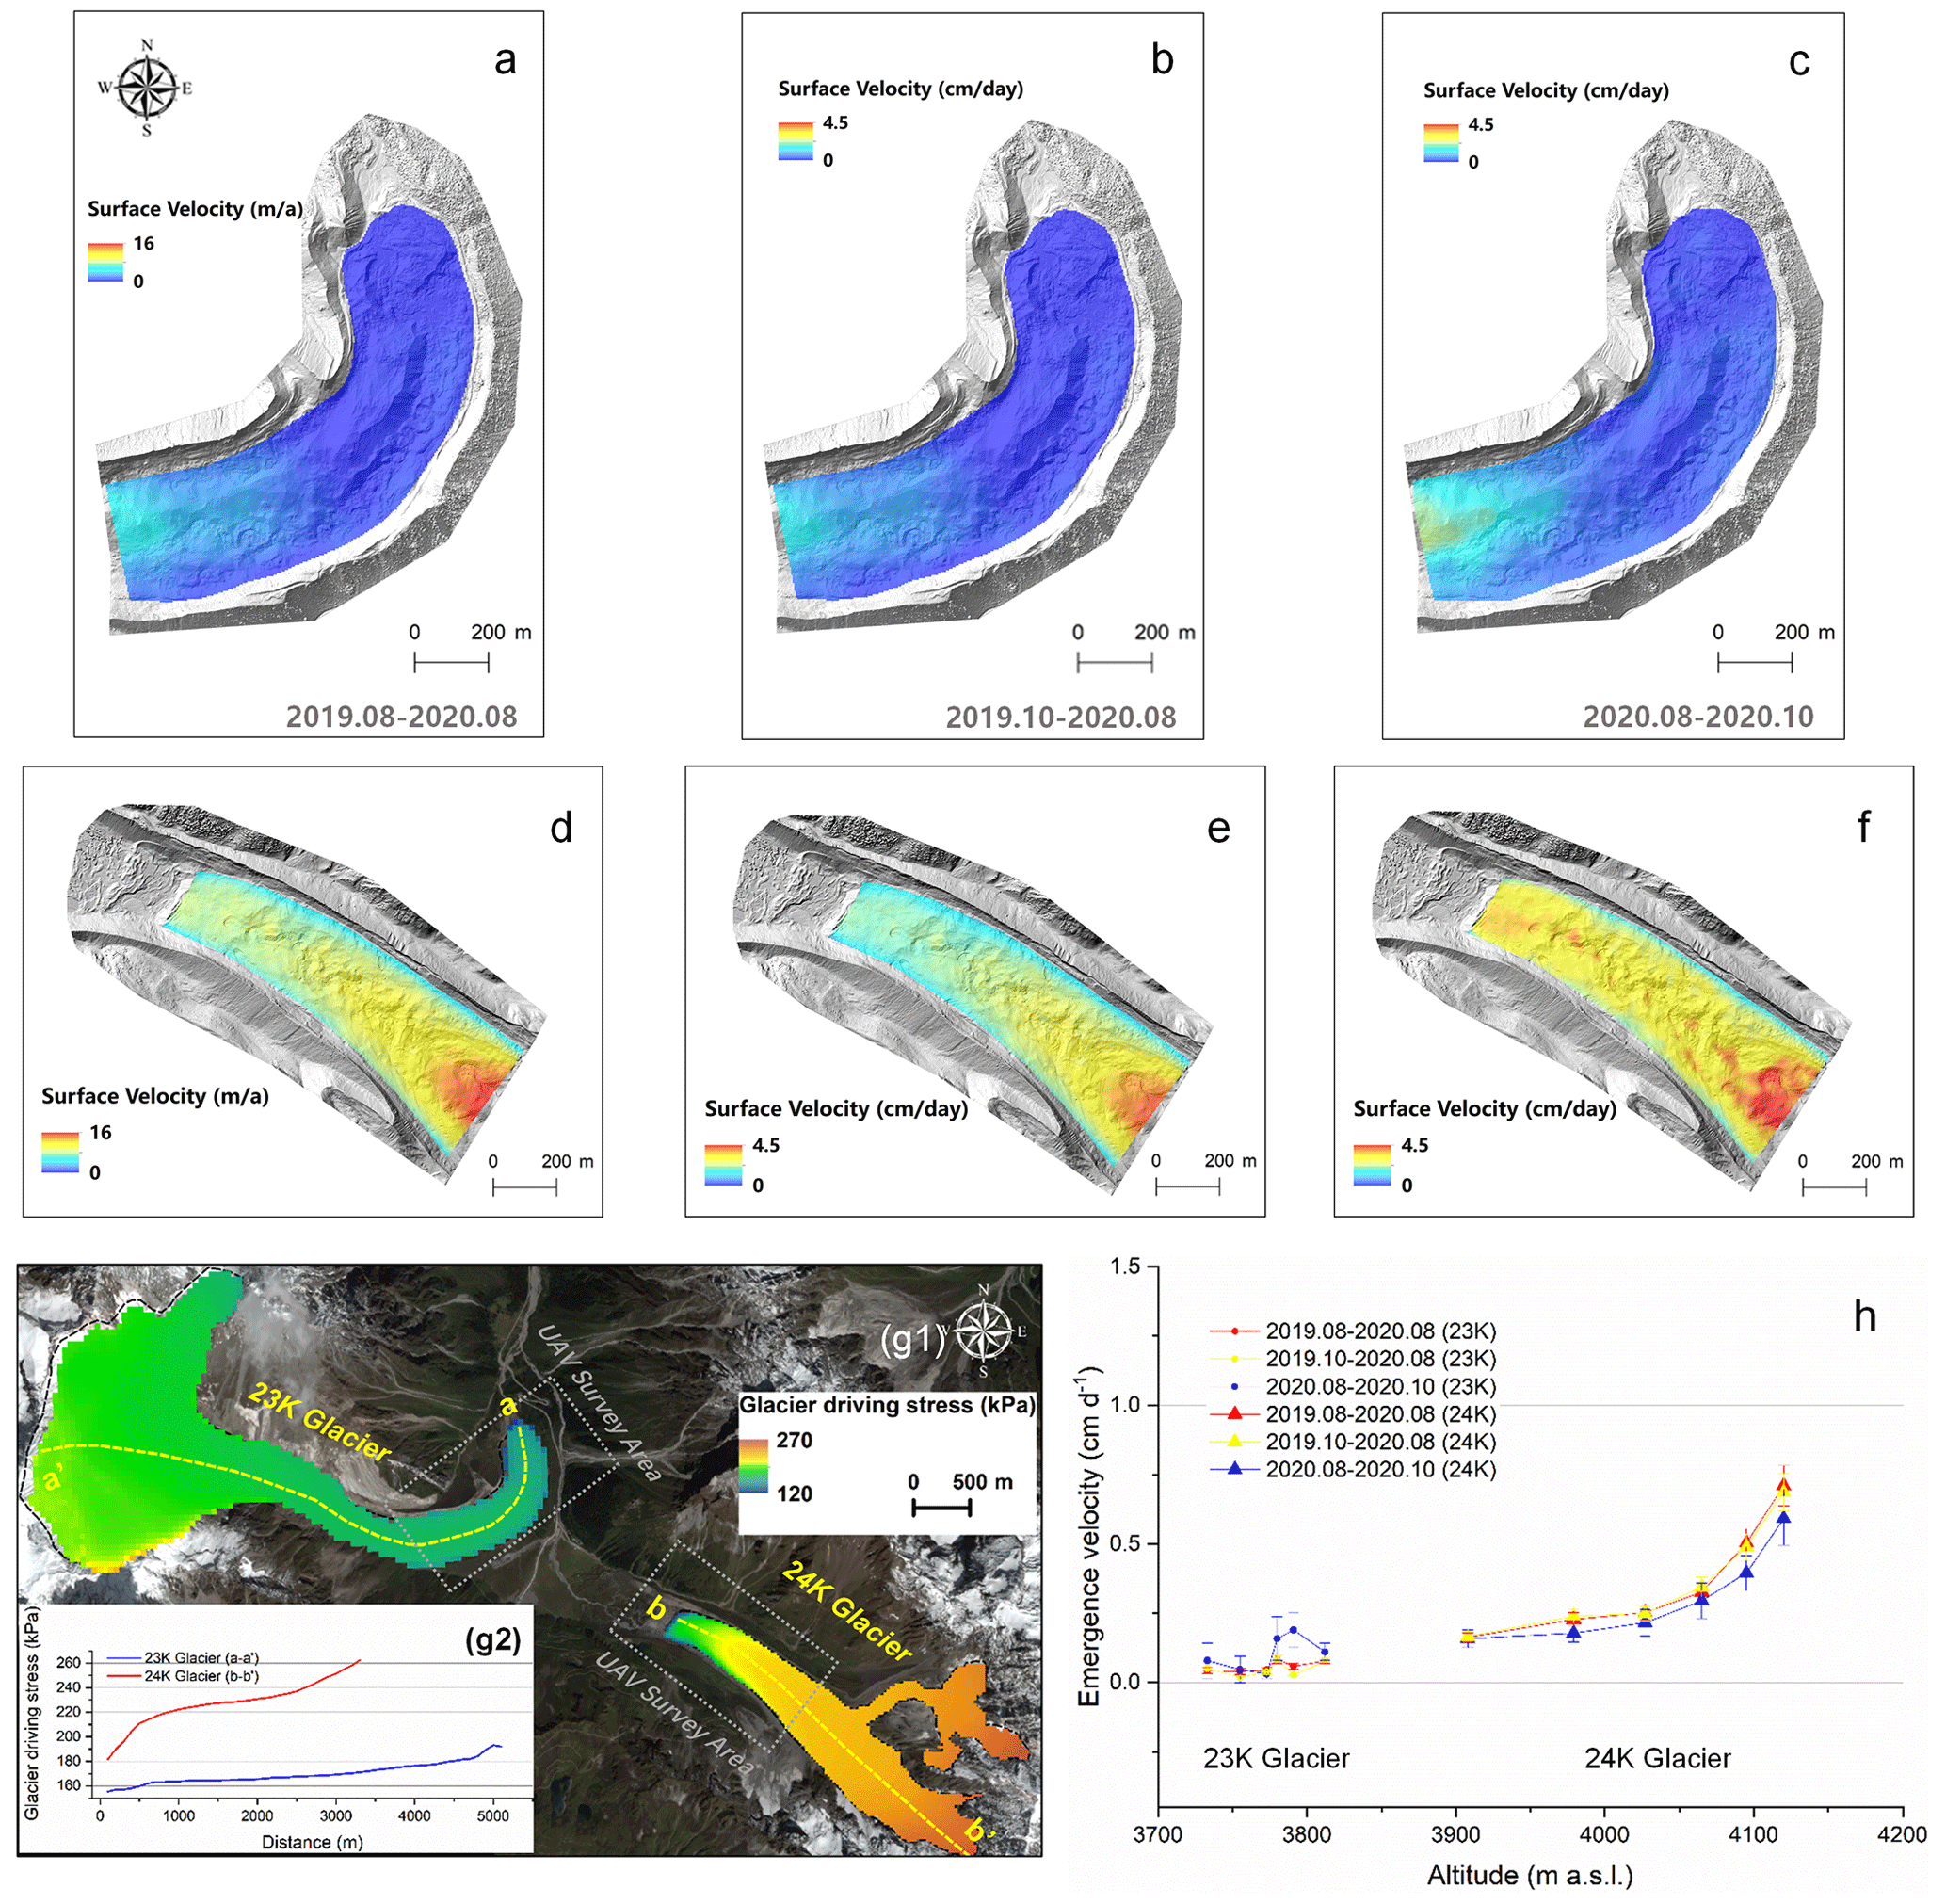
Figure 4Average surface velocity of 23K and 24K glaciers for August 2019–August 2020 (a, d), the cold period (b, e), and the warm period (e, f). Spatial distribution of driving stresses (August 2019–August 2020) of the two glaciers (g1) and central flowlines (a–a′ and b–b′) and the profile of driving stresses (g2). The background is Pléiades-1A false-colour image from 20 September 2021. © CNES 2021, Distribution Airbus D&S. Emergence velocity as a function of altitude for the two glaciers (h).
4.4 Surface mass balance patterns
At the annual scale, the mean surface mass balances for the 23K and 24K glacier survey areas were m w.e. a−1 ( cm w.e. d−1) and m w.e. a−1 ( cm w.e. d−1), respectively, and are therefore not significantly different (Table 5). During the cold period, the glacier mass balance was cm w.e. d−1 for the 23K Glacier and cm w.e. d−1 for the 24K Glacier (Fig. 5). In contrast, during the warm period, the mass balance of the 23K Glacier was cm w.e. d−1, while for the 24K Glacier it was cm w.e. d−1; the surface mass balance during the warm period for the 24K Glacier is thus ∼46 % larger than that for the 23K Glacier (Fig. 5). The surface mass balance values of each mass balance zone (A–F) for both glaciers exhibit a weak decreasing trend with altitude in all periods (Fig. S3).
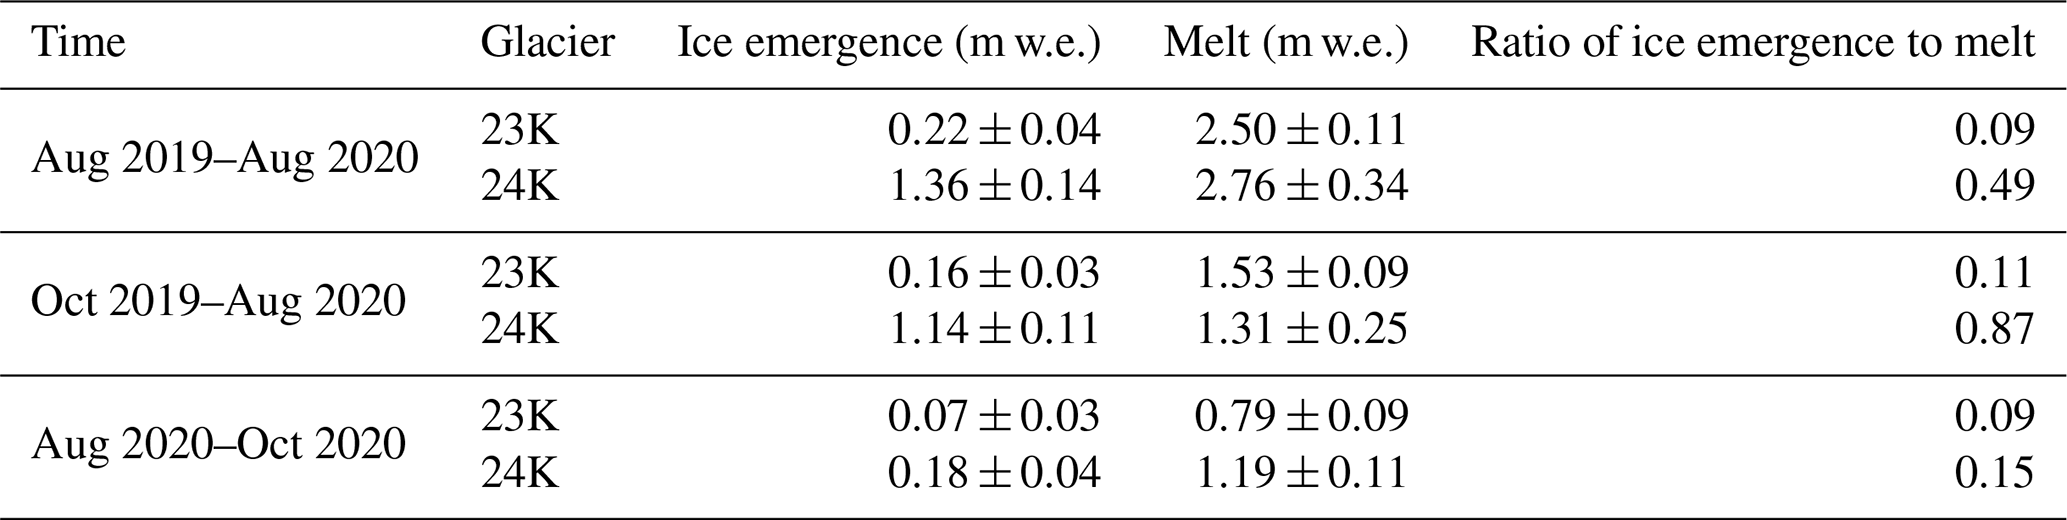
To better evaluate the role of emergence velocity replenishment on thinning, we calculated the ratio of ice emergence to melt (Table 5). A higher value of this ratio indicates a greater influence of emergence velocity replenishment on thinning (a value of 1 indicates perfect compensation of ablation by ice flow). The ratios of annual ice emergence and annual melt for the 23K and 24K glaciers are 0.09 and 0.49, respectively. The ratio values for the 24K Glacier are always higher than those for the 23K Glacier, and this is especially evident in the non-ablation period.
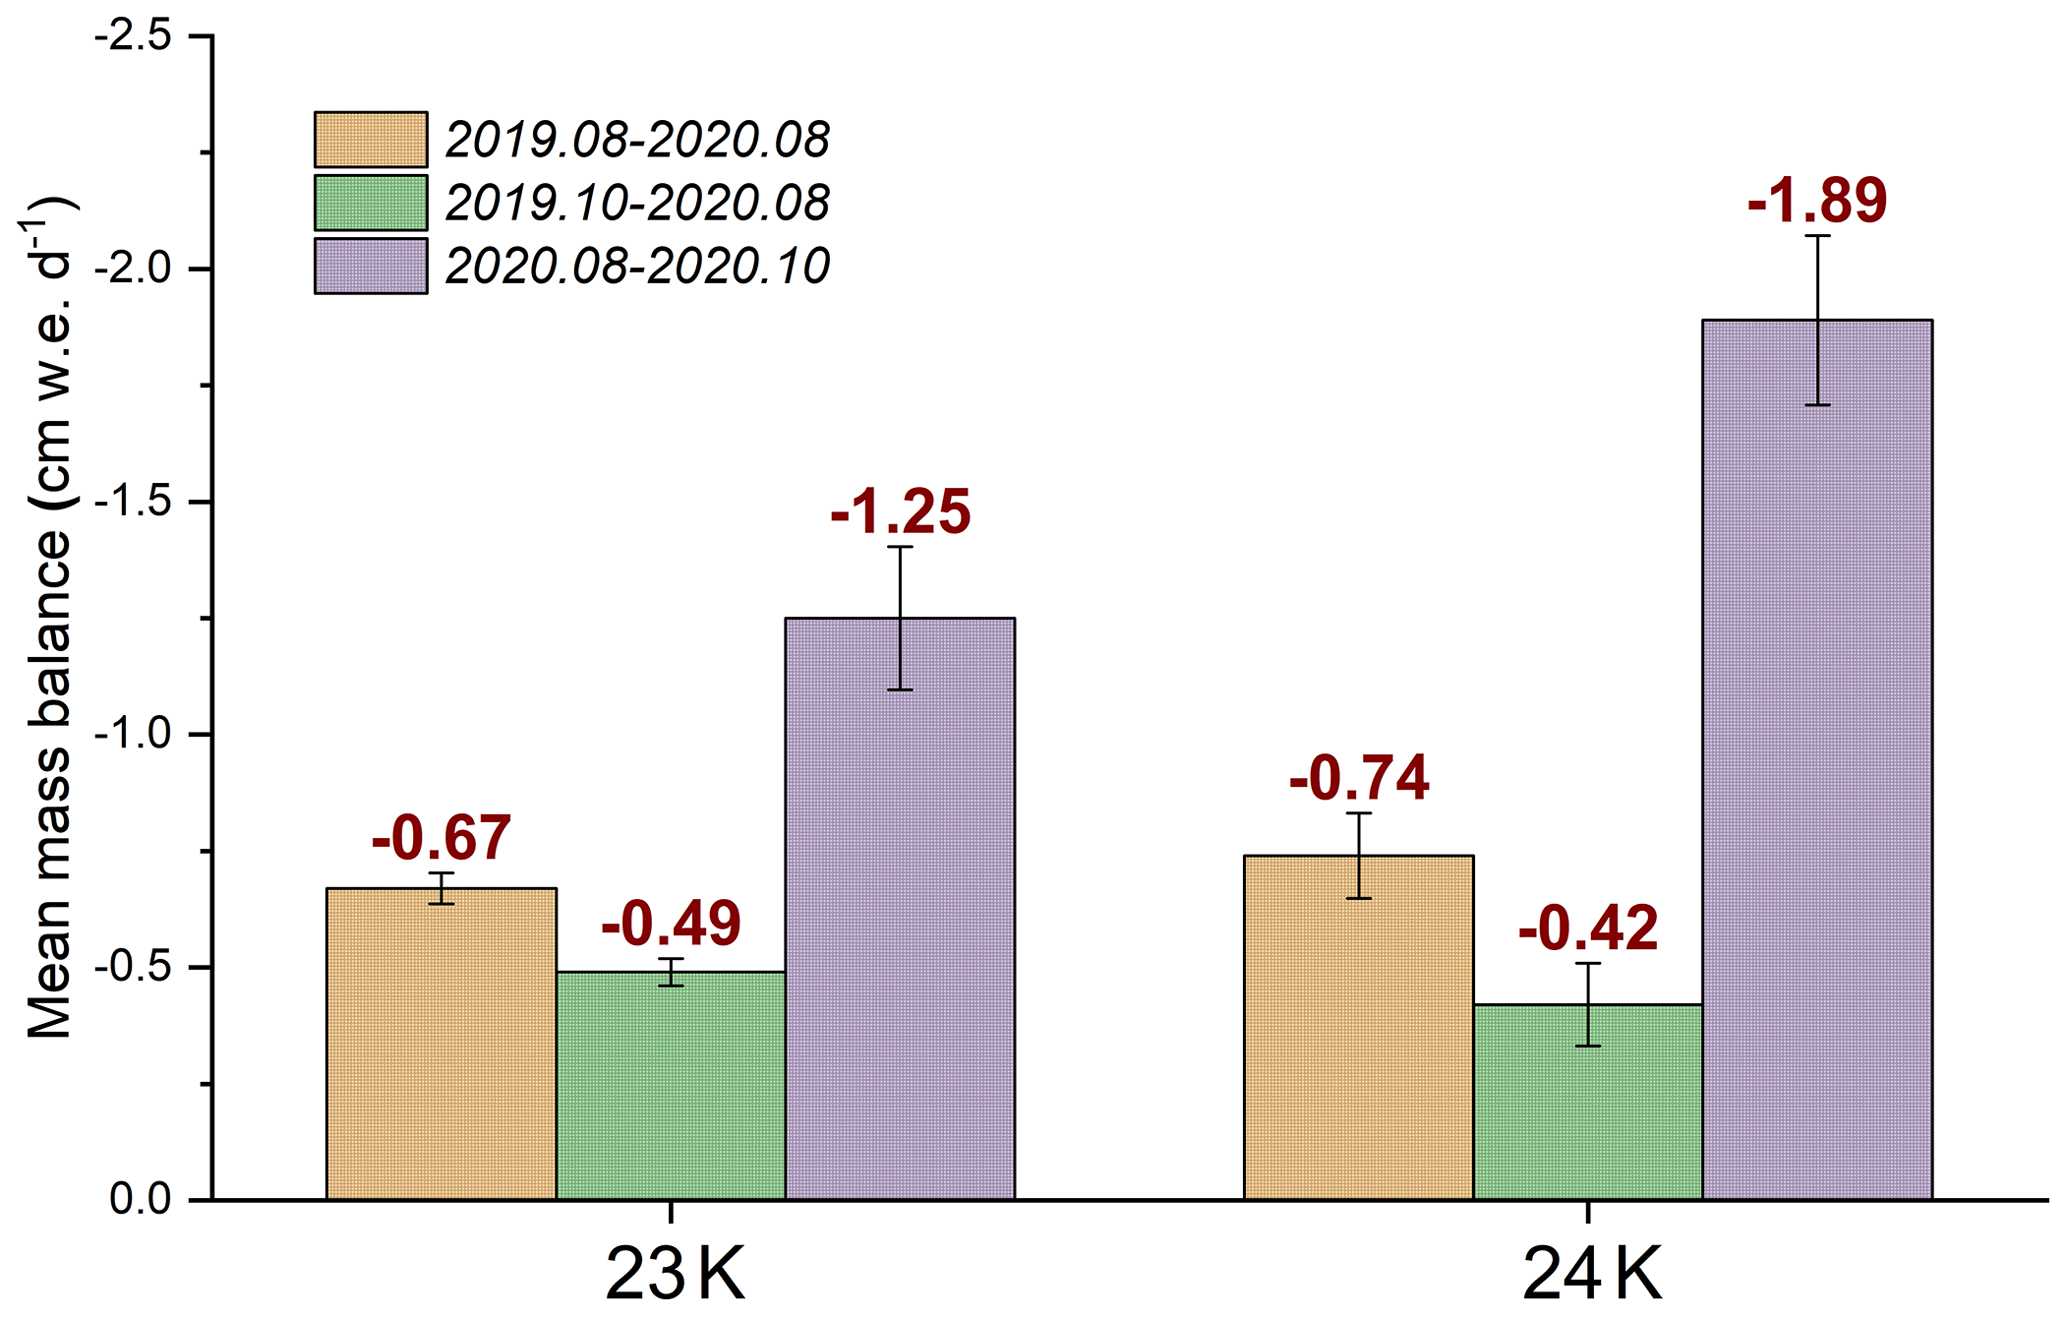
Figure 5Mean surface mass balance rates and their uncertainties for both UAV survey domains during the annual observation period (August 2019–August 2020), the cold period (October 2019–August 2020), and the warm period (August–October 2020).
Table 5Ice emergence, melt, and their ratio in all periods for both glaciers.
The density of ice cliffs and supraglacial ponds for the 23K Glacier is 6.8 %–7.2 % and is 4.4 %–5.1 % for the 24K Glacier (Table 6). There are few ponds (∼5, area >100 m2) on the 23K Glacier, while there is no ponded area on the 24K Glacier. The average debris thicknesses in the UAV survey areas of the 23K Glacier and 24K Glacier are 47.1±2 cm and 24.2±2 cm, respectively. The debris thickness of both glaciers decreases with increasing altitude in the UAV survey area (23K Glacier: cm 100 m−1; 24K Glacier: cm 100 m−1). To disentangle the influence of the sub-debris area and of the ice cliffs and supraglacial ponds area on the surface mass balance pattern, respectively, we extracted the surface mass balance rates of the area of ice cliffs and supraglacial ponds and of the sub-debris area in both glaciers for all periods (Table 6). As shown in Table 6, the surface mass balance rates in the ice cliffs and supraglacial ponds area of both glaciers are higher than those in the sub-debris area during all periods (i.e. the ice cliffs and supraglacial ponds area have a higher melt efficiency). In this study, the enhancement factors for the two glaciers range from 1.6 to 4.4 during all periods. They are significantly higher in the warm period (23K: ∼4.4; 24K: ∼2.6) than at the annual scale (23K: ∼2.2; 24K: ∼1.6) or during the cold period (23K: ∼2.6; 24K: ∼1.7), indicating that the hotspots effect is more pronounced during the ablation period. By extracting the ablation contribution of the ice cliffs and supraglacial ponds (Fig. 6a and b), we found that the total melt from ice cliffs and supraglacial ponds area accounted for 31.5±2.2 % of the total ablation in the UAV survey area of the 23K Glacier (Fig. 6c) and 11.4±1.3 % for the 24K Glacier during the warm period (Fig. 6d).
Table 6Area proportions of ice cliffs and supraglacial ponds, mean surface mass balance for ice cliffs and supraglacial ponds area, and sub-debris area, and their enhancement factors in all periods for both glaciers.
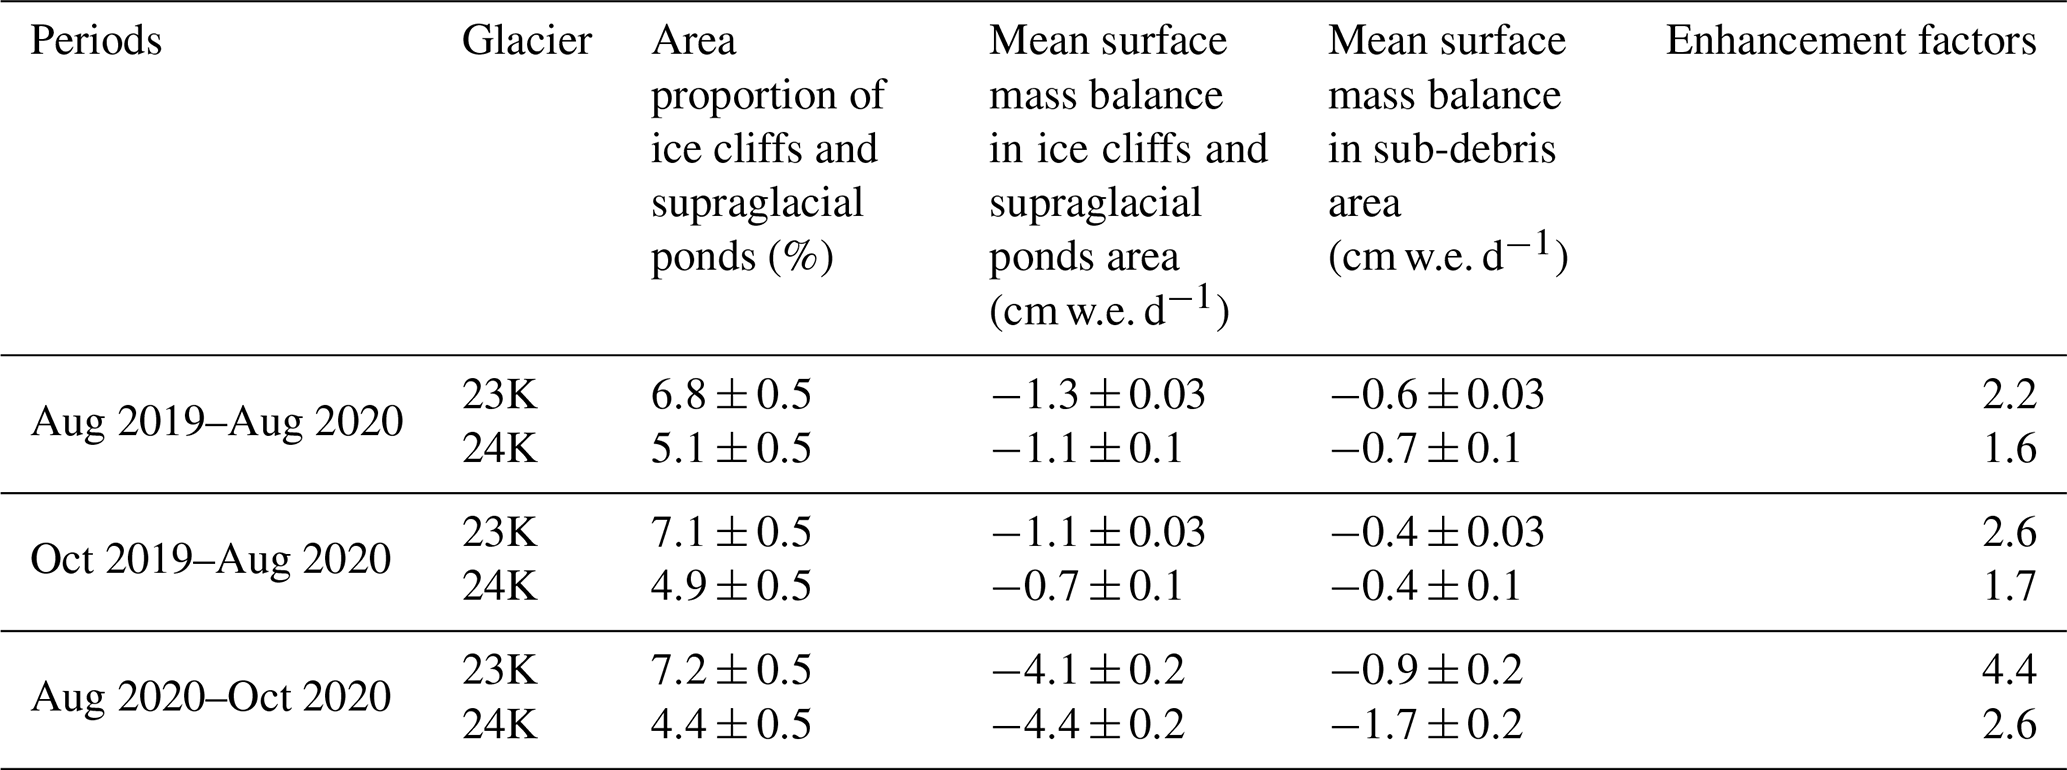
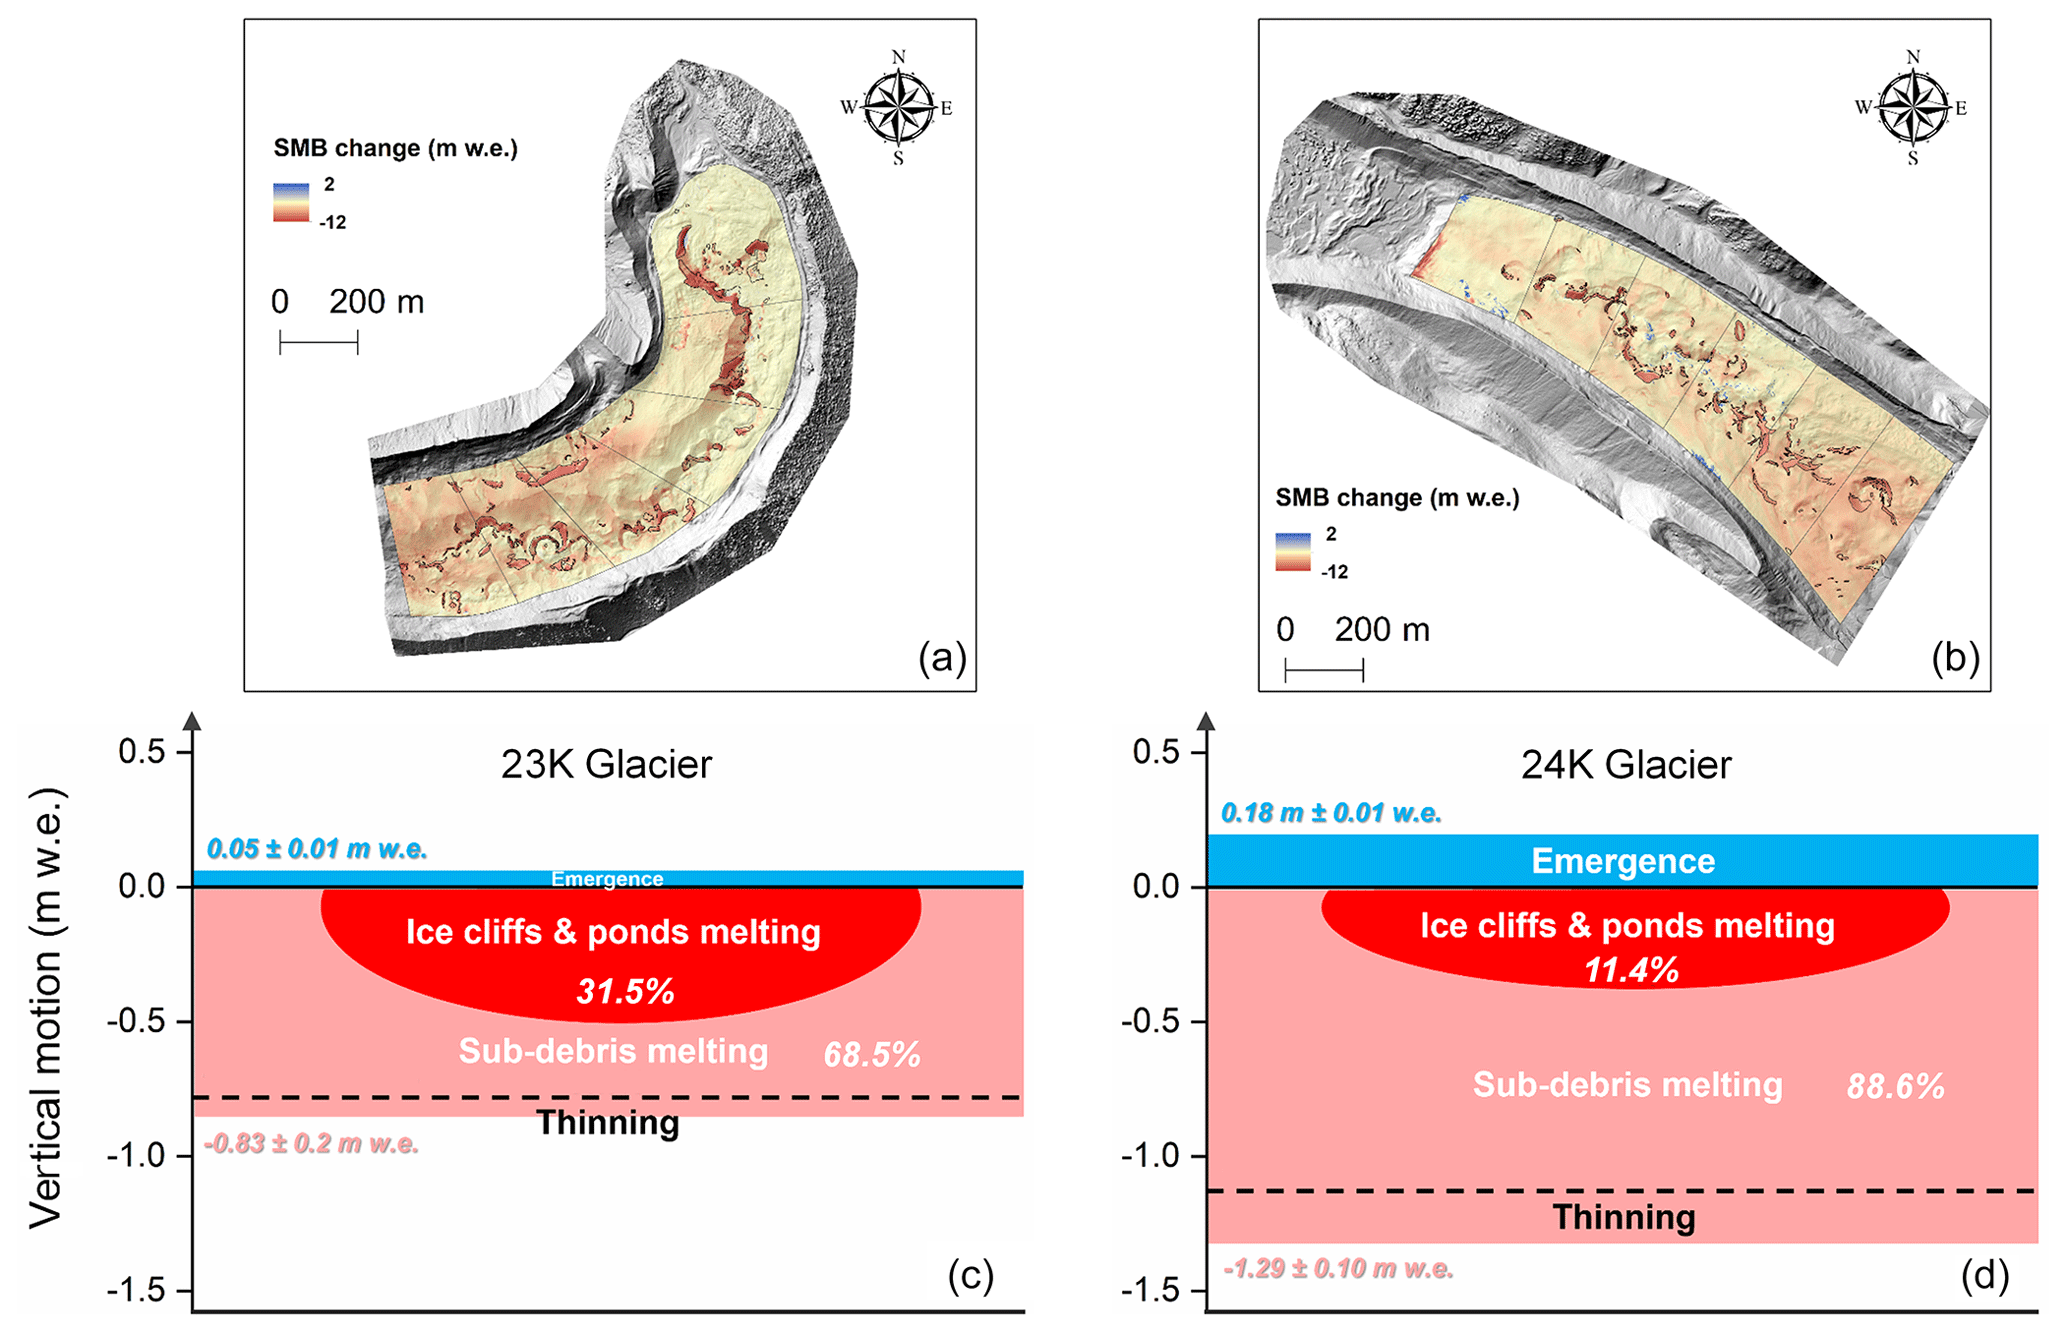
Figure 6Spatial distribution of surface mass balance during the warm period for the UAV survey domains of the 23K Glacier and 24K Glacier (a, b) and the conceptual diagrams of vertical motion components for the 23K Glacier and 24K Glacier (c, d).
To better disentangle the effects of debris thickness, ice cliffs, and supraglacial ponds on glacier melt, we compared the mean debris thickness, the percentage of ice cliffs and supraglacial ponds, and the mean melt rate during the warm period in each of the six zones (A–F) of each glacier (Fig. 7). We assessed the correlations between the zonal surface mass balance in the warm period and the zonal debris thickness as well as the ice cliffs and supraglacial ponds density. For the 23K Glacier, the correlation coefficient r between debris thickness and surface mass balance during the warm period is 0.88 (p value is 0.02 at the 95 % confidence level), indicating that the debris thickness is highly correlated with melt. In contrast, the correlation coefficient between the percentage of ice cliff and supraglacial ponds area and the surface mass balance is −0.29 (p value is 0.58 at the 95 % confidence level), indicating the absence of correlation. During the warm period, the 24K Glacier also exhibits a strong relationship between debris thickness and melt, with an r of 0.82 (p value is 0.05 at the 95 % confidence level). The ice cliffs and supraglacial ponds area is weakly correlated with glacier melt (, p value is 0.36 at the 95 % confidence level).
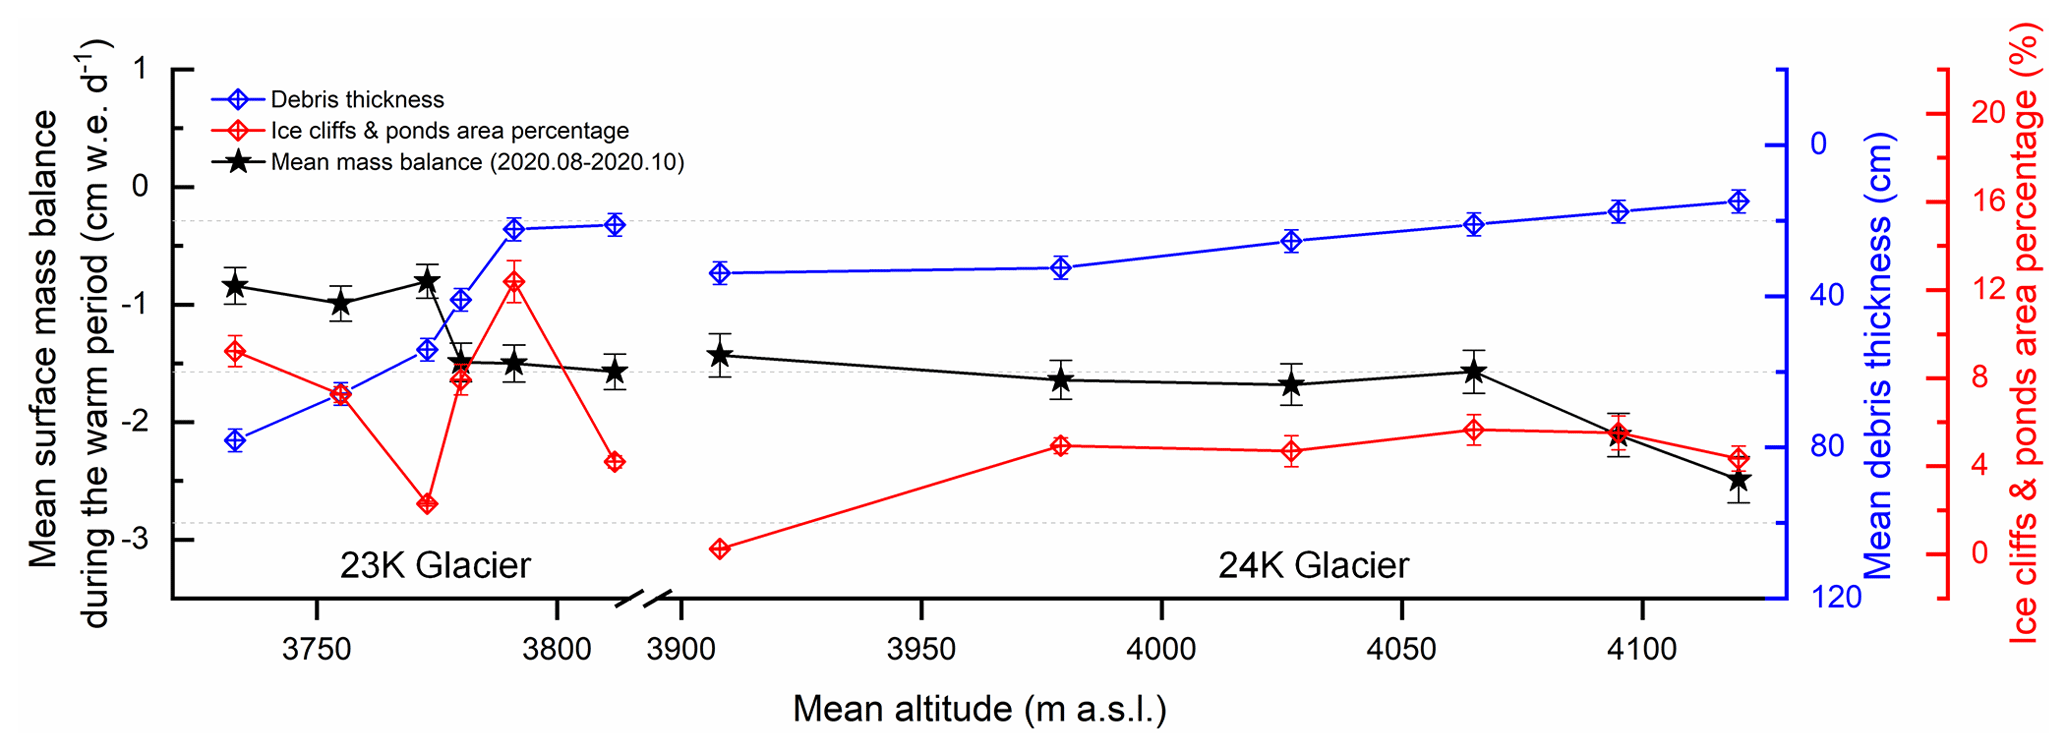
Figure 7Daily surface mass balance during the warm period (solid black line), mean debris thickness (solid blue line), and mean percentage of ice cliffs and supraglacial ponds area (solid red line) for the individual zones of the two glaciers.
4.5 Glacier change in the early twenty-first century
The thinning of the 23K Glacier tongue has been greater than that of the 24K Glacier tongue since 2000 (Hugonnet et al., 2021a; Fig. 8a–d), which is generally in agreement with the thinning patterns we derived from the UAV surveys. Both glaciers (UAV survey domains) show an inverted relationship between thinning and altitude at all periods of the last 2 decades (Fig. 8e). Both glaciers experienced increases in thinning rates between the 2000–2004 and 2015–2019 periods (increase rate for 23K: +77 %; 24K: +100 %), although the increase in thinning rate was slightly lower for the 24K Glacier than for the 23K Glacier over the last decade (23K: +44 %; 24K: +20 %).
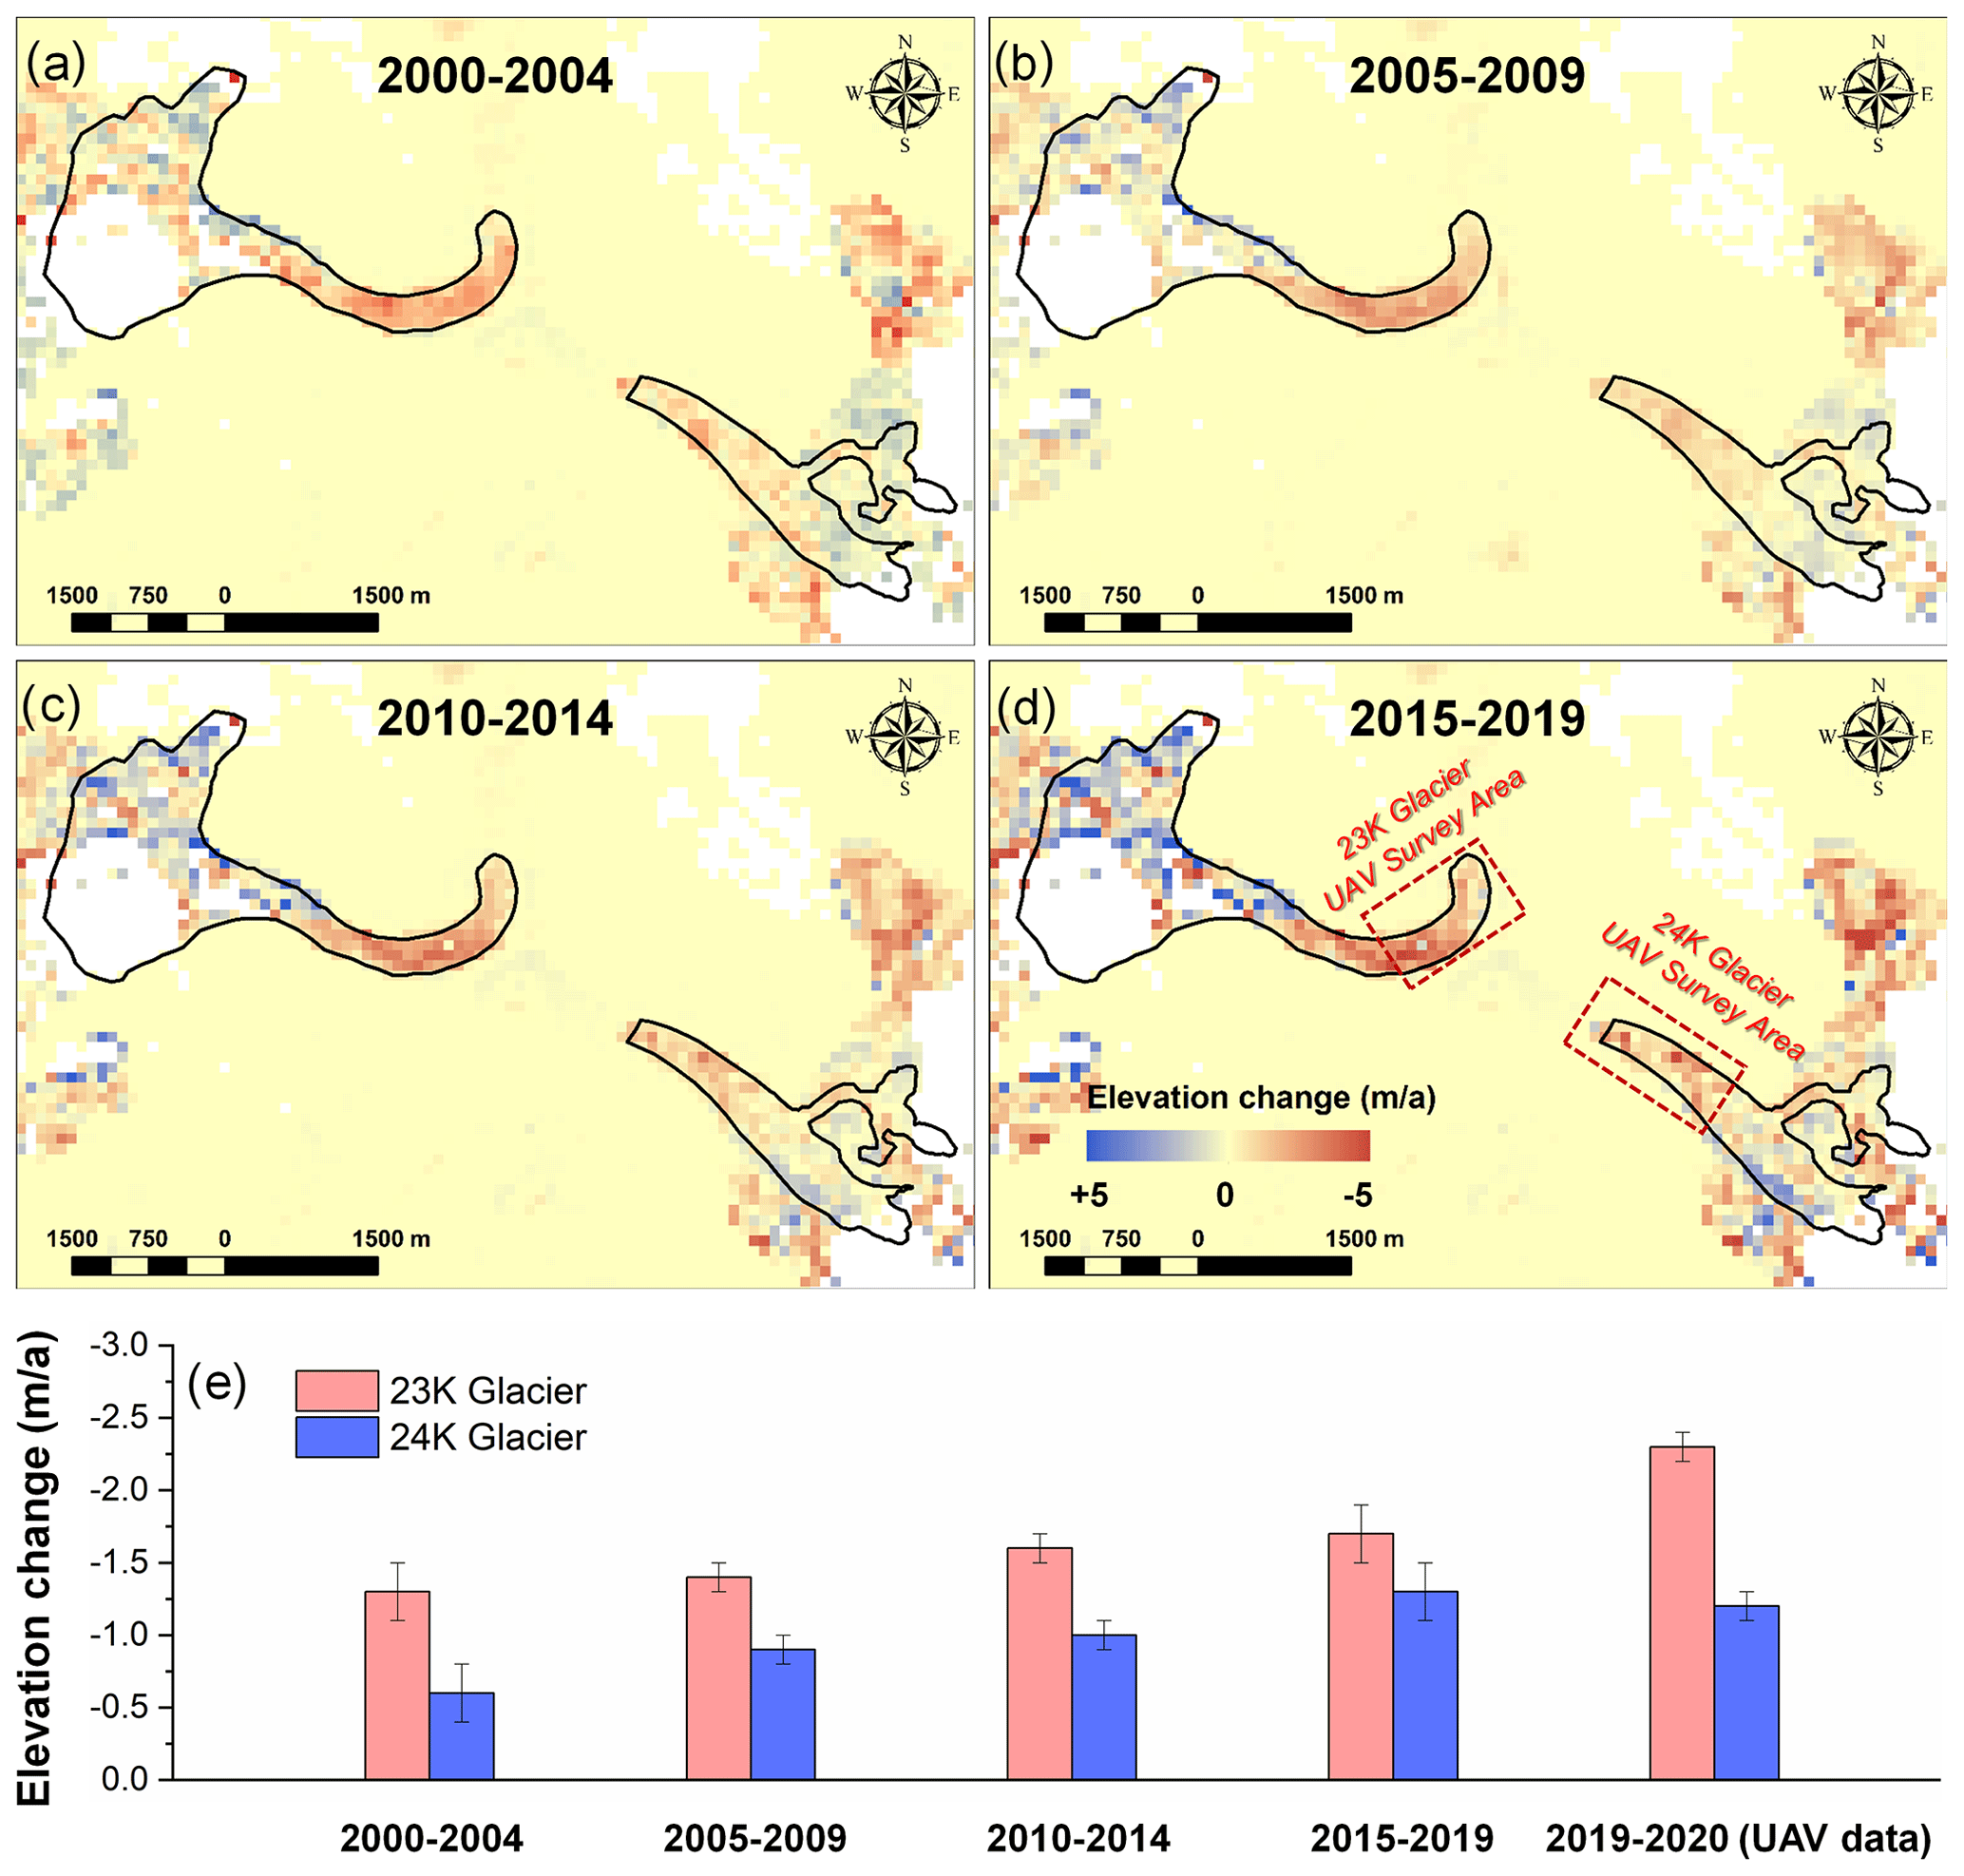
Figure 8Annual surface elevation changes (Hugonnet et al., 2021a) for 2000–2004 (a), 2005–2009 (b), 2010–2014 (c), and 2015–2019 (d) for the 23K Glacier and 24K Glacier (dashed red rectangular box represents the UAV aerial survey area). Annual surface elevation changes and their uncertainties for both UAV survey domains at different periods (e).
Using the velocity data by Dehecq et al. (2015, 2019a, b), we explore changes in the glaciers' dynamic state by analysing the surface velocities over the last 2 decades (Fig. 9). The velocity magnitude and pattern obtained by Dehecq et al. (2015, 2019a, b) for the period 2013–2015 correspond well with our UAV results. The surface velocities of both glaciers (UAV survey domains) decreased significantly between the 1999–2003 and 2013–2015 periods. Between these periods, the surface velocities of the 23K and 24K glaciers decreased on average by 84 % and 54 %, respectively. However, the velocity magnitude and pattern for 2013–2015 correspond to our UAV results. The 24K Glacier tongue is still replenished by ice flux at present, which compensates for its higher melt due to thinner debris.
A prior study analysed the mean surface mass balance from 2000–2016 based on regionally available datasets (Miles et al., 2020, 2021), with values of m w.e. a−1 for the UAV survey domain of the 23K Glacier and m w.e. a−1 for the UAV survey domain of the 24K Glacier. These melt values for the period of 2000–2016 are a little less negative than our results for the period of 2019–2020, which might be attributed to warming or to changes in precipitation phase in the southeast Tibetan Plateau (e.g. Jouberton et al., 2022).
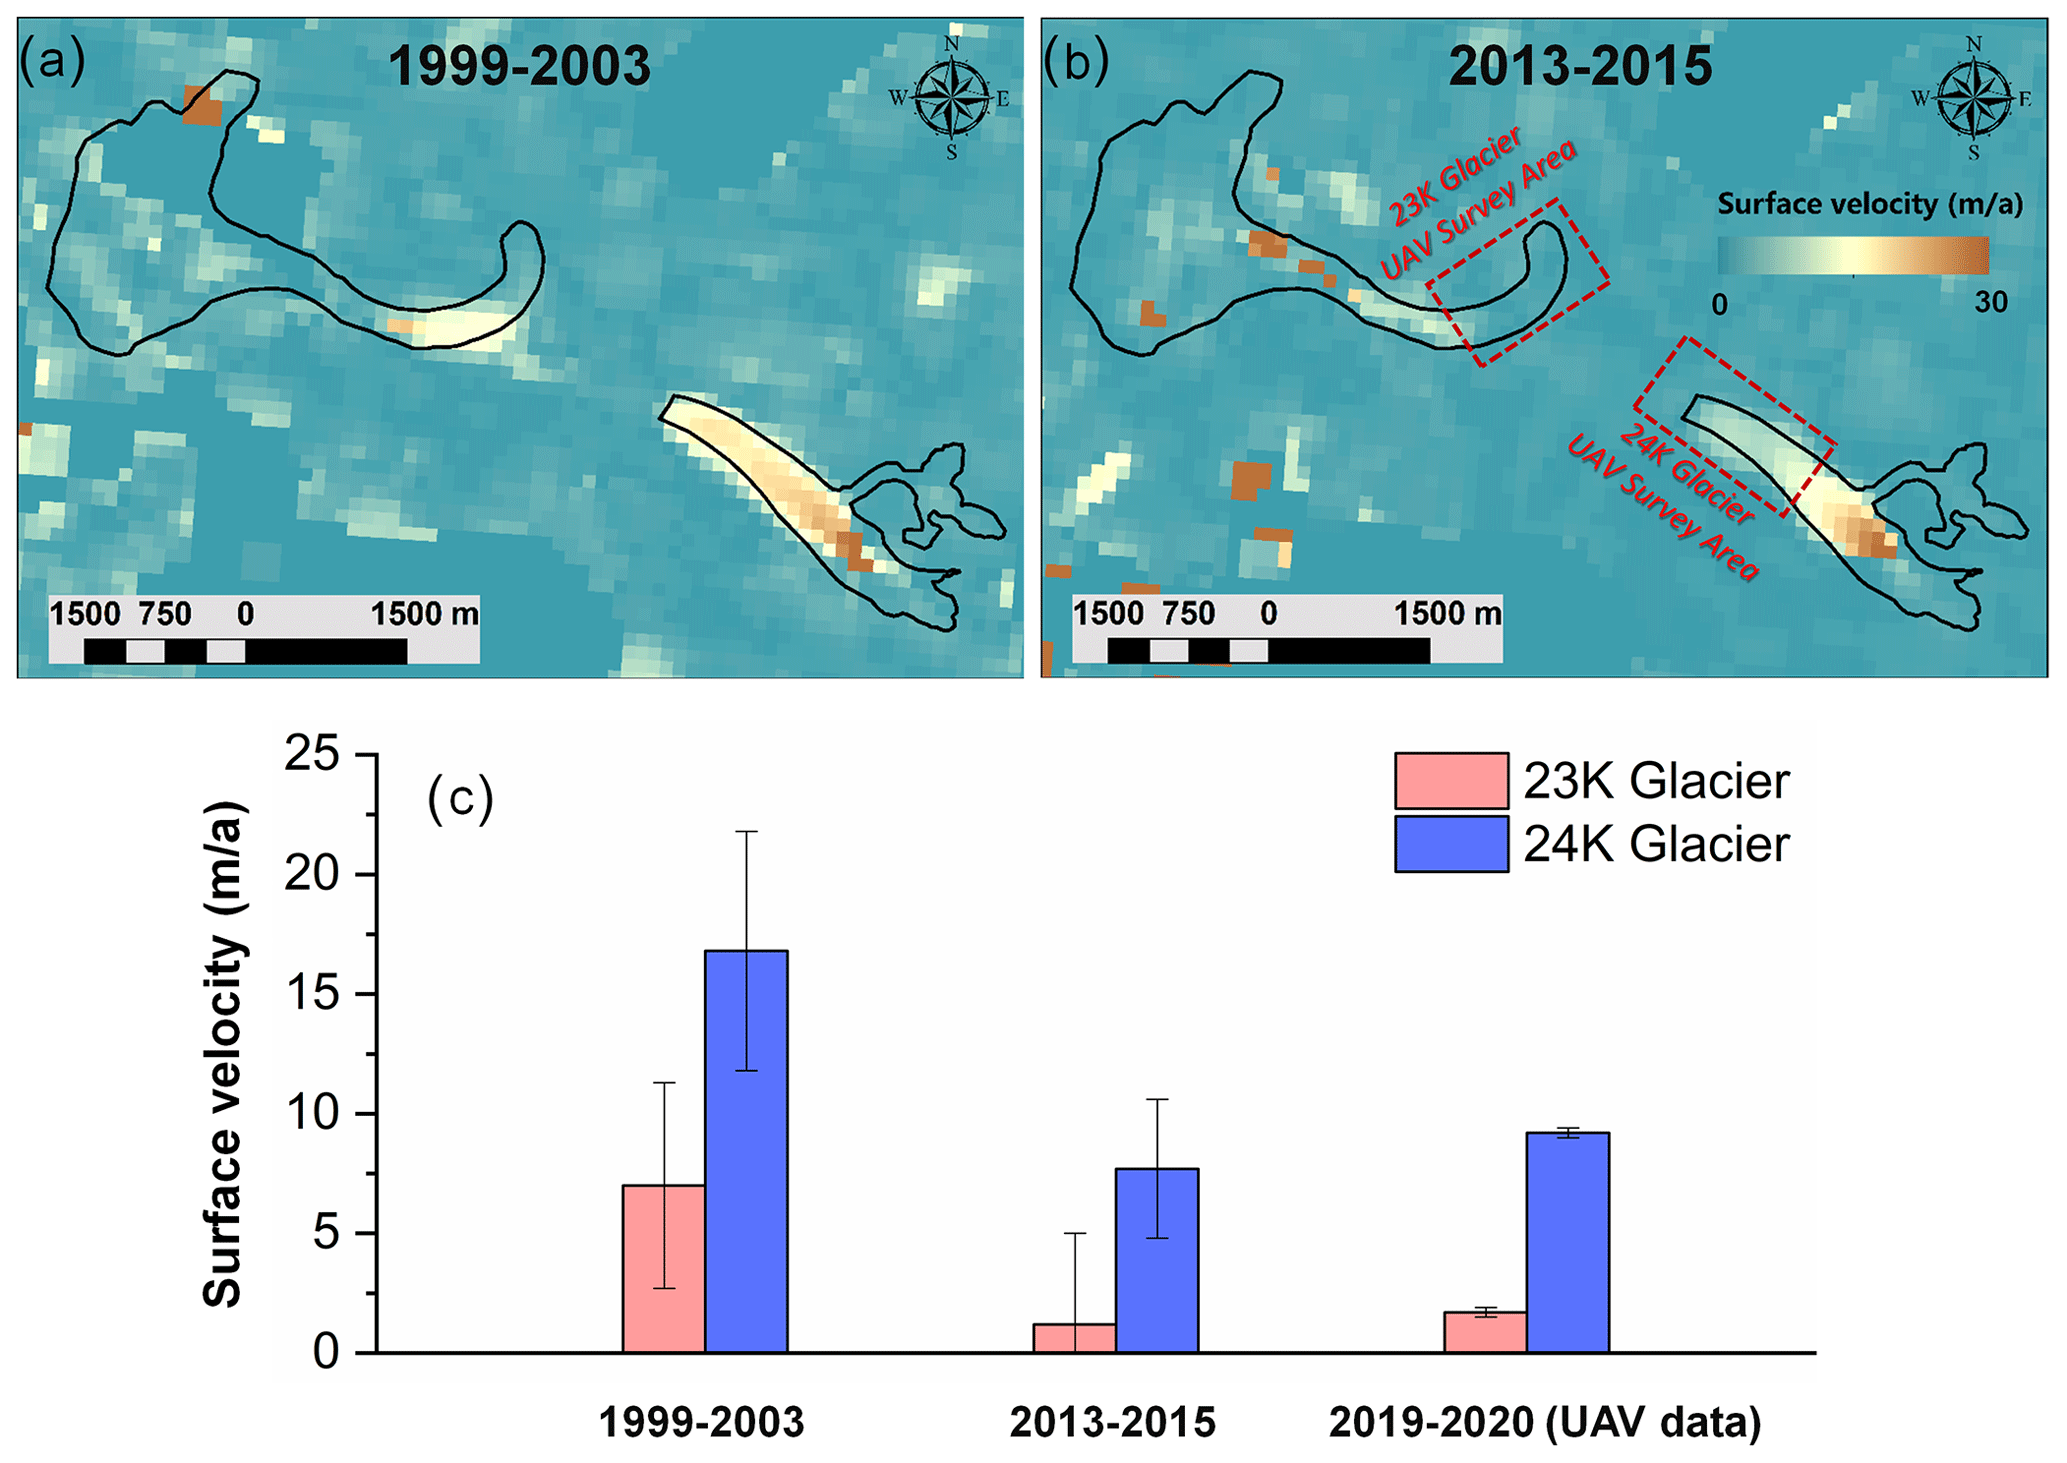
Figure 9Annual surface velocities (Dehecq et al., 2015, 2019a, 2019b) for 1999–2003 (a) and 2013–2015 (b) for the 23K Glacier and 24K Glacier (dashed red rectangular boxes represent the UAV aerial survey areas). Annual surface velocities and their uncertainties for both UAV survey domains at different periods (c).
5.1 Controls on the thinning patterns
The thinning patterns of the two glaciers are different at the annual scale and during the cold period, as indicated by their magnitude and spatial distribution (Fig. 2). Some studies have highlighted that large differences in thinning can be caused by different dynamic states (Fig. 4; Brun et al., 2018; Anderson et al., 2021a, b; Rounce et al., 2021). In this study, the emergence velocity replenishment is consistently higher on the 24K Glacier than on the 23K Glacier for all periods (Fig. 4h). The replenishment of ice into the ablation area by ice flow is crucial to the glaciers' long-term sustainability, and net annual ablation exceeds ice resupply for the study areas of both glaciers. We therefore assessed the ratio of ice emergence to melt as an indicator of the local balance between ablation and ice supply (a direct local metric of glacier health), and this study illustrates that glacier health can vary greatly even over small distances (Table 5). The 23K and 24K glaciers experience the same climatic forcing, but their distinct geometries lead to different expressions of ice dynamics. For instance, the mean slope of the 24K Glacier's UAV survey domain (∼10.2∘) is consistently higher than that of the 23K Glacier (∼4.6∘), which explains its higher driving stress (Fig. S4) and faster surface velocity. In addition, the different glacier geometries may lead to distinct dependence on avalanche and rockfall mass supply, which could also lead to marked differences in mass supply to the glacier terminus. Using the ratio of ice emergence to melt, we can identify, for each season, whether ice resupply or melt is the main factor leading to the thinning rates. In Table 5, we clearly see that at the 23K Glacier the ice supply is considerably smaller than the absolute value of melt for all periods, indicating that the melt is directly responsible for contemporary thinning patterns. The 24K Glacier also exhibits a strong imbalance between ice emergence and melt over the warm period (0.15), but ice emergence nearly compensates for melt during the cold period (0.87). Thus, the 24K Glacier exhibits a relatively healthier cold season and annual balance than the 23K Glacier. In contrast to the annual and cold periods, the thinning patterns of the two glaciers are similar during the warm period (i.e. the magnitude of thinning increases with altitude). In this period, the 24K Glacier ice emergence only represents a small fraction of the melt (Table 5), and the pattern of surface mass balance is clearly driven by the spatial distribution of debris thickness. Therefore, the thinning pattern of the 24K Glacier goes from being controlled primarily by ice dynamics (for the annual and cold period) to being controlled by debris thickness during the warm period.
Fu et al. (2022) also estimated thinning for a debris-covered glacier (Hailuogou) in the southeastern Tibetan Plateau. They revealed that the tongue area showed considerable thinning (−2.81 m) during the ablation period (June 2018–October 2018) and that its ice resupply was very weak, similar to what we observed for the 23K Glacier. He et al. (2023) also observed the debris-covered tongue of Zhuxi Glacier in the southeastern Tibetan Plateau by UAV for the period of 2020–2021. The lower tongue of this glacier is similarly characterized by high rates of thinning (>1 m a−1) and slow movement (<7 m a−1). Other studies concerning the mass balance of Himalayan debris-covered glaciers also report on glaciers that possess a high thinning rate (–1.8 m a−1) and weaker dynamic state (Vincent et al., 2016; Nuimura et al., 2017; Brun et al., 2018; Rowan et al., 2021) and that possess thinning patterns that are consistent with those of the 23K Glacier. In summary, the thinning pattern for the 23K Glacier appears to conform to that of other Himalayan debris-covered glaciers, while that of the 24K Glacier is perhaps more anomalous due to its relatively healthy ice supply all the way to the terminus.
In situ observations show that the terminus type differs between each glacier (Figs. 1c, d and S5), which can have a strong influence on ice dynamics for debris-covered glaciers (Anderson and Anderson, 2016). The terminus of the 23K Glacier appears largely stagnant and is enclosed by a latero-terminal moraine complex, while the terminus of the 24K Glacier exhibits a large ice cliff bounded by lateral moraines. The mass of the 24K Glacier is lost due to progressive melt, and episodic “dry” calving promotes glacier retreat. Such terminal-cliff debris-covered glaciers are less well studied but have been noted in a variety of settings (e.g. Ferguson and Vieli, 2021). Terminus type can have an important influence on debris-covered glacier geometry (King et al., 2019) and thus may influence glacier geometric evolution in a warming climate. Our investigations suggest that the 24K Glacier exhibits a reduced climatic–geometric imbalance compared with the 23K Glacier, possibly because it has responded to climate warming with progressive retreat rather than thinning. In addition, the ablation area of the 23K Glacier is largely stagnant with a low thinning rate, lower mean surface velocities, and reduced driving stress, which favour the presence of supraglacial ponds that enable the persistence of relatively large pond-influenced cliffs (Quincey et al., 2007; Sakai and Fujita, 2010; Miles et al., 2017; Kneib et al., 2023). In contrast, due to a steeper longitudinal slope and stronger ice flux, the 24K Glacier is characterized by thinner debris, which, combined with the steeper gradient, allows for the development of supraglacial streams and corresponding stream-influenced cliffs (Mölg et al., 2020; Kneib et al., 2023).
5.2 Possible reasons for the surface mass balance patterns
The presence of a debris cover and its influence on ablation typically causes surface mass balance patterns for debris-covered glaciers to differ from those of largely debris-free glaciers due to the melt-buffering effect of supraglacial debris cover that exceeds a few centimetres in thickness (Østrem, 1959; Nakawo et al., 1999; Nicholson and Benn, 2006; Reid and Brock, 2010; Anderson and Anderson, 2016; Yang et al., 2017). Our results show inverted melt-season surface mass balance profiles for both the 23K and 24K glaciers. In addition, debris-covered glaciers tend to develop ice cliffs that enhance melt locally, even relative to clean ice (Sakai et al., 1998, 2002; Reid and Brock, 2014; Juen et al., 2014; Steiner et al., 2015; Buri et al., 2016, 2021; Miles et al., 2016, 2018, 2022; Kneib et al., 2022). Overall, the annual surface mass balances of the 23K Glacier and 24K Glacier are similar, but the rate of mass loss is higher for the 24K Glacier during the warm period due to its thinner debris cover. During all periods, the magnitude of ablation increases with elevation for both glaciers, with the same spatial distribution (Figs. 7, S3). We find that the correlation between the melt and the debris thickness distribution is strong for both glaciers (23K: r=0.88; 24K: r=0.82) during the warm period, while there is little correlation between the melt and the ice cliffs and supraglacial ponds area distribution (23K: ; 24K: ). Prior studies have also identified the effect of the debris thickness spatial distribution on the physical mechanisms of ablation (Mihalcea et al., 2008; Zhang et al., 2011; Reid et al., 2012; Juen et al., 2014; Zhang et al., 2016; Gibson et al., 2017; McCarthy et al., 2017).
The role of ice cliffs and supraglacial ponds area is not negligible, as ablation in the survey areas would be underestimated by 24.5±1.7 % (23K Glacier) and 7.0±0.7 % (24K Glacier), respectively, if the ice cliffs and supraglacial ponds area were not taken into account. Other studies have observed and simulated the contributions of ice cliffs to be 17 %–26 % of the total ablation for different glaciers, which is in agreement with our results (Brun et al., 2018; Anderson et al., 2021a; Buri et al., 2021). The combination of ice cliffs and supraglacial ponds densities (23K Glacier: 7.2±0.5 %, 24K Glacier: 4.4±0.5 %; Fig. 6a and b) and their enhancement factors (23K Glacier: 4.4, 24K Glacier: 2.6; Table 6) shapes the ablation contribution patterns of ice cliffs and supraglacial ponds together. Based on UAV and time-lapse camera observations, Kneib et al. (2022) carried out high-precision observations of a single ice cliff on the 24K Glacier and measured the daily cliff melt during the ablation period at 3.9–5.1 cm d−1. In this study, the daily melt rate of the 24K Glacier ice cliffs and supraglacial ponds area during the warm period was estimated to be 4.4±0.2 cm w.e. d−1 (∼4.9 cm d−1), which is similar to the observed value for a single ice cliff. We note that in this study the outlines of ice cliffs and supraglacial ponds area as digitized for warm periods were based on the union of the cliffs and supraglacial ponds' outlines (Brun et al., 2018), which may lead to an overestimation of the extent of the ice cliffs and supraglacial ponds area (Kneib et al., 2022). While the ice cliffs and supraglacial ponds are local controls of melt patterns, debris thickness is the dominant control on the altitudinal surface mass balance pattern for both the 23K and 24K glaciers, similar to Kennicott Glacier in Alaska (Anderson et al., 2021a).
This study provides insight into the controlling role of debris thickness on the ablation patterns of debris-covered glaciers. In future research, it will be beneficial to improve our understanding of the responses of debris-covered glaciers to climate change by focusing on the debris supply and evacuation differences. Based on field photography (Fig. S6), we also found that paraglacial slope failure events have recently occurred in the catchment of the 23K Glacier and may be the result of complex interactions between geologic structure and stress-related slope response to glacier mass loss (Zhong et al., 2022). Such events may become an increasingly important component of the debris supply and transport cascade for these land systems, with implications for the future development of supraglacial debris cover, glacier mass balance, and flow dynamics. Large rock avalanches that emplace in supraglacial environments have led to melt suppression and glacier advance in other locations (e.g. McSaveney, 1975; Shugar and Clague, 2011), and if sufficiently thick, this event could thus temporarily rejuvenate the emergence velocity into the terminus area.
We used multi-temporal high-resolution UAV-SfM surveys combined with in situ observations to quantify the seasonal thinning and surface mass balance of two neighbouring, but contrasting, debris-covered glaciers in the southeastern Tibetan Plateau. The conclusions are summarized as follows.
-
The thinning patterns of the two glaciers display distinct characteristics at an annual scale. The annual thinning of the 23K Glacier UAV survey area is 1.9 times greater than that of the 24K Glacier. The magnitude of 23K Glacier thinning increases with altitude, similar to many other debris-covered glaciers, whereas the 24K Glacier shows the opposite pattern, except during the melt season. These contrasting patterns are mainly driven by the stronger dynamic state of the 24K Glacier, which has a much higher down valley emergence velocity replenishment. However, the thinning pattern of the 24K Glacier is similar to that of the 23K Glacier during the warm period (i.e. the magnitude of thinning increases with altitude). In this period, the thinning of the 24K Glacier is mainly controlled by melt.
-
The surface mass balance patterns of the two glaciers are generally in agreement. The magnitude of the surface mass balance on both glaciers increases with altitude in the ablation period, exhibiting a melt inversion, which is attributable to the debris thickness distribution (which decreases with altitude). Due to the low areal proportion of ice cliffs and supraglacial ponds (melt hotspots), sub-debris ablation accounts for the majority of the total ablation.
-
Both glaciers experience accelerated thinning and reduced flow in their ablation area. The 23K Glacier possesses a higher thinning rate and is in a weaker dynamic state than the 24K Glacier, a pattern that is confirmed in the longer term.
High-resolution and comparative observations provide a rare perspective into the controls of the thinning and melt of two debris-covered glaciers. We provide evidence that the rate of mass loss on such glaciers can be highly dependent on the dynamic state and that the relatively thin debris on these glaciers is the main control of the glacier surface mass balance patterns, with supraglacial cliffs and ponds locally enhancing mass loss.
The UAV-derived orthomosaics and DEMs of this study are openly available in Zenodo at https://doi.org/10.5281/Zenodo.7350479 (Zhao and Yang, 2022).
The supplement related to this article is available online at: https://doi.org/10.5194/tc-17-3895-2023-supplement.
CZ, WY, EM, MW, MK, and FP designed the study and completed the data analysis. WY supervised the study. WY, CZ, EM, MW, MK, YW, and ZH conducted the fieldwork. All authors contributed to the writing and revision of the paper.
At least one of the (co-)authors is a member of the editorial board of The Cryosphere. The peer-review process was guided by an independent editor, and the authors also have no other competing interests to declare.
Publisher's note: Copernicus Publications remains neutral with regard to jurisdictional claims in published maps and institutional affiliations.
We acknowledge the support of CNES (Centre National d'Etudes Spatiales) via the DINAMIS project for facilitating access to Pléiades imagery through an academic agreement. We are grateful to RESTEC for the AW3D DEM. We thank (Hugonnet et al., 2021b) and (Dehecq et al., 2019a, b) for their datasets of glacier surface elevation change and velocity. We would like to thank Martin Truffer for collecting and providing the ice thickness data of the 24K Glacier. We thank Thomas Shaw, Catriona Fyffe, Michael McCarthy, Pascal Buri, Achille Jouberton, Yota Sato, Stefan Fugger, and Rebecca Stewart for their guidance and help.
We would like to sincerely acknowledge and express our deep appreciation to the editor, Etienne Berthier, and to Leif S. Anderson and the one anonymous referee for their thorough review of this work.
The study is supported by the National Natural Science Foundation of China (grant nos. 41988101 and 42271138), the Second Tibetan Plateau Scientific Expedition and Research Program (grant no. 2019QZKK0201), and the Science and Technology Plan Projects of Tibet Autonomous Region (grant nos. XZ202301ZY0028G, XZ202301ZY0022G, and XZ202101ZD0014G).
This paper was edited by Etienne Berthier and reviewed by Leif S. Anderson and one anonymous referee.
Allen, S. K., Zhang, G. Q., Wang, W. C., Yao, T. D., and Bolch, T.: Potentially dangerous glacial lakes across the Tibetan Plateau revealed using a large-scale automated assessment approach, Sci. Bull., 64, 435–445, https://doi.org/10.1016/j.scib.2019.03.011, 2019.
An, B. S., Wang, W. C., Yang, W., Wu, G. J., Guo, Y. H., Zhu, H. F., Gao, Y., Bai, L., Zhang, F., Zeng, C., Wang, L., Zhou, J., Li, X., Li, J., Zhao, Z. J., Chen, Y. Y., Liu, J. S., Li, J. L., Wang, Z. Y., Chen, W. F., and Yao, T. D.: Process, mechanisms, and early warning of glacier collapse-induced river blocking disasters in the Yarlung Tsangpo Grand Canyon, southeastern Tibetan Plateau, Sci. Total Environ., 816, 151652, https://doi.org/10.1016/j.scitotenv.2021.151652, 2022.
Anderson, L. S. and Anderson, R. S.: Modeling debris-covered glaciers: response to steady debris deposition, The Cryosphere, 10, 1105–1124, https://doi.org/10.5194/tc-10-1105-2016, 2016.
Anderson, L. S., Armstrong, W. H., Anderson, R. S., and Buri, P.: Debris cover and the thinning of Kennicott Glacier, Alaska: in situ measurements, automated ice cliff delineation and distributed melt estimates, The Cryosphere, 15, 265–282, https://doi.org/10.5194/tc-15-265-2021, 2021a.
Anderson, L. S., Armstrong, W. H., Anderson, R. S., Scherler, D., and Petersen, E.: The causes of debris-covered glacier thinning: evidence for the importance of ice dynamics from Kennicott Glacier, Alaska, Front. Earth Sci., 9, 680995, https://doi.org/10.3389/feart.2021.680995, 2021b.
Bash, E. A. and Moorman, B. J.: Surface melt and the importance of water flow – an analysis based on high-resolution unmanned aerial vehicle (UAV) data for an Arctic glacier, The Cryosphere, 14, 549–563, https://doi.org/10.5194/tc-14-549-2020, 2020.
Benoit, L., Gourdon, A., Vallat, R., Irarrazaval, I., Gravey, M., Lehmann, B., Prasicek, G., Gräff, D., Herman, F., and Mariethoz, G.: A high-resolution image time series of the Gorner Glacier – Swiss Alps – derived from repeated unmanned aerial vehicle surveys, Earth Syst. Sci. Data, 11, 579–588, https://doi.org/10.5194/essd-11-579-2019, 2019.
Berthier, E. and Vincent, C.: Relative contribution of surface mass-balance and ice-flux changes to the accelerated thinning of Mer de Glace, French Alps, over 1979–2008, J. Glaciol., 58, 501–512, https://doi.org/10.3189/2012JoG11J083, 2012.
Bolch, T., Menounos, B., and Wheate, R.: Landsat-based inventory of glaciers in western Canada, 1985–2005, Remote. Sens. Environ., 114, 127–137, https://doi.org/10.1016/j.rse.2009.08.015, 2010.
Brun, F., Buri, P., Miles, E. S., Wagnon, P., Steiner, J., Berthier, E., Ragettli, S., Kraaijenbrink, P., Immerzeel, W. W., and Pellicciotti, F.: Quantifying volume loss from ice cliffs on debris-covered glaciers using high-resolution terrestrial and aerial photogrammetry, J. Glaciol., 62, 684–695, https://doi.org/10.1017/jog.2016.54, 2016.
Brun, F., Berthier, E., Wagnon, P., Kääb, A., and Treichler, D.: A spatially resolved estimate of High Mountain Asia glacier mass balances from 2000 to 2016, Nat. Geosci., 10, 668, https://doi.org/10.1038/ngeo2999, 2017.
Brun, F., Wagnon, P., Berthier, E., Shea, J. M., Immerzeel, W. W., Kraaijenbrink, P. D. A., Vincent, C., Reverchon, C., Shrestha, D., and Arnaud, Y.: Ice cliff contribution to the tongue-wide ablation of Changri Nup Glacier, Nepal, central Himalaya, The Cryosphere, 12, 3439–3457, https://doi.org/10.5194/tc-12-3439-2018, 2018.
Brun, F., Wagnon, P., Berthier, E., Jomelli, V., Maharjan, S. B., Shrestha, F., and Kraaijenbrink, P. D. A.: Heterogeneous Influence of Glacier Morphology on the Mass Balance Variability in High Mountain Asia, J. Geophys. Res.-Earth. Surf., 124, 1331–1345, https://doi.org/10.1029/2018jf004838, 2019.
Buri, P., Miles, E. S., Steiner, J. F., Immerzeel, W. W., Wagnon, P., and Pellicciotti, F.: A physically based 3-D model of ice cliff evolution over debris-covered glaciers, J. Geophys. Res.-Earth. Surf., 121, 2471–2493, https://doi.org/10.1002/2016jf004039, 2016.
Buri, P., Miles, E. S., Steiner, J. F., Ragettli, S., and Pellicciotti, F.: Supraglacial Ice Cliffs Can Substantially Increase the Mass Loss of Debris-Covered Glaciers, Geophys. Res. Lett., 48, e2020GL092150, https://doi.org/10.1029/2020gl092150, 2021.
Cao, B., Guan, W. J., Li, K. J., Pan, B. T., and Sun, X. D.: High-Resolution Monitoring of Glacier Mass Balance and Dynamics with Unmanned Aerial Vehicles on the Ningchan No. 1 Glacier in the Qilian Mountains, China, Remote Sens., 13, 2735, https://doi.org/10.3390/rs13142735, 2021.
Cuffey, K. M. and Paterson, W. S. B.: The Physics of Glaciers, Fourth Edition, Academic Press, Amsterdam, 704 pp., edited by: Paterson, W. S. B., https://doi.org/10.1016/C2009-0-14802-X, 2010.
Dehecq, A., Gourmelen, N., and Trouve, E.: Deriving large-scale glacier velocities from a complete satellite archive: Application to the Pamir-Karakoram-Himalaya, Remote. Sens. Environ., 162, 55–66, https://doi.org/10.1016/j.rse.2015.01.031, 2015.
Dehecq, A., Gourmelen, N., and Trouve, E.: High Mountain Asia glacier velocities 2013–2015 (Landsat 8), Zenodo [data set], https://doi.org/10.5281/zenodo.2578199, 2019a.
Dehecq, A., Gourmelen, N., and Trouve, E.: High Mountain Asia glacier velocities 1999–2003 (Landsat 7), Zenodo [data set], https://doi.org/10.5281/zenodo.2578187, 2019b.
Farinotti, D., Huss, M., Furst, J. J., Landmann, J., Machguth, H., Maussion, F., and Pandit, A.: A consensus estimate for the ice thickness distribution of all glaciers on Earth, Nat. Geosci., 12, 168, https://doi.org/10.1038/s41561-019-0300-3, 2019.
Ferguson, J. C. and Vieli, A.: Modelling steady states and the transient response of debris-covered glaciers, The Cryosphere, 15, 3377–3399, https://doi.org/10.5194/tc-15-3377-2021, 2021.
Fu, Y., Liu, Q., Liu, G. X., Zhang, B., Zhang, R., Cai, J. L., Wang, X. W., and Xiang, W.: Seasonal ice dynamics in the lower ablation zone of Dagongba Glacier, southeastern Tibetan Plateau, from multitemporal UAV images, J. Glaciol., 68, 636–650, https://doi.org/10.1017/jog.2021.123, 2022.
Fugazza, D., Scaioni, M., Corti, M., D'Agata, C., Azzoni, R. S., Cernuschi, M., Smiraglia, C., and Diolaiuti, G. A.: Combination of UAV and terrestrial photogrammetry to assess rapid glacier evolution and map glacier hazards, Nat. Hazards Earth Syst. Sci., 18, 1055–1071, https://doi.org/10.5194/nhess-18-1055-2018, 2018.
Fugger, S., Fyffe, C. L., Fatichi, S., Miles, E., McCarthy, M., Shaw, T. E., Ding, B., Yang, W., Wagnon, P., Immerzeel, W., Liu, Q., and Pellicciotti, F.: Understanding monsoon controls on the energy and mass balance of glaciers in the Central and Eastern Himalaya, The Cryosphere, 16, 1631–1652, https://doi.org/10.5194/tc-16-1631-2022, 2022.
Fujita, K. and Ageta, Y.: Effect of summer accumulation on glacier mass balance on the Tibetan Plateau revealed by mass-balance model, J. Glaciol., 46, 244–252, https://doi.org/10.3189/172756500781832945, 2000.
Gardelle, J., Berthier, E., Arnaud, Y., and Kääb, A.: Region-wide glacier mass balances over the Pamir-Karakoram-Himalaya during 1999–2011, The Cryosphere, 7, 1263–1286, https://doi.org/10.5194/tc-7-1263-2013, 2013.
Gibson, M. J., Glasser, N. F., Quincey, D. J., Mayer, C., Rowan, A. V., and Irvine-Fynn, T. D. L.: Temporal variations in supraglacial debris distribution on Baltoro Glacier, Karakoram between 2001 and 2012, Geomorphology, 295, 572–585, https://doi.org/10.1016/j.geomorph.2017.08.012, 2017.
Hambrey, M. J., Quincey, D. J., Glasser, N. F., Reynolds, J. M., Richardson, S. J., and Clemmens, S.: Sedimentological, geomorphological and dynamic context of debris-mantled glaciers, Mount Everest (Sagarmatha) region, Nepal, Quat. Sci. Rev.,, 27, 2361–2389, https://doi.org/10.1016/j.quascirev.2008.08.010, 2008.
He, Z., Yang, W., Wang, Y. J., Zhao, C. X., Ren, S. T., and Li, C. H.: Dynamic Changes of a Thick Debris-Covered Glacier in the Southeastern Tibetan Plateau, Remote Sens., 15, 357, https://doi.org/10.3390/rs15020357, 2023.
Herreid, S. and Pellicciotti, F.: The state of rock debris covering Earth's glaciers, Nat. Geosci., 13, 621, https://doi.org/10.1038/s41561-020-0615-0, 2020.
Hugenholtz, C. H., Whitehead, K., Brown, O. W., Barchyn, T. E., Moorman, B. J., LeClair, A., Riddell, K., and Hamilton, T.: Geomorphological mapping with a small unmanned aircraft system (sUAS): Feature detection and accuracy assessment of a photogrammetrically-derived digital terrain model, Geomorphology, 194, 16–24, https://doi.org/10.1016/j.geomorph.2013.03.023, 2013.
Hugonnet, R., McNabb, R., Berthier, E., Menounos, B., Nuth, C., Girod, L., Farinotti, D., Huss, M., Dussaillant, I., Brun, F., and Kääb, A.: Accelerated global glacier mass loss in the early twenty-first century, Nature, 592, 726, https://doi.org/10.1038/s41586-021-03436-z, 2021a.
Hugonnet, R., McNabb, R., Berthier, E., Menounos, B., Nuth, C., Girod, L., Farinotti, D., Huss, M., Dussaillant, I., Brun, F., and Kääb, A.: Accelerated global glacier mass loss in the early twenty-first century, Sedoo [data set], https://doi.org/10.6096/13, 2021b.
Immerzeel, W. W., Kraaijenbrink, P. D. A., Shea, J. M., Shrestha, A. B., Pellicciotti, F., Bierkens, M. F. P., and de Jong, S. M.: High-resolution monitoring of Himalayan glacier dynamics using unmanned aerial vehicles, Remote Sens. Environ., 150, 93–103, https://doi.org/10.1016/j.rse.2014.04.025, 2014.
James, M. R., Robson, S., and Smith, M. W.: 3-D uncertainty-based topographic change detection with structure-ffrom-motion photogrammetry: precision maps for ground control and directly georeferenced surveys, Earth. Surf. Process. Landf., 42, 1769–1788, https://doi.org/10.1002/esp.4125, 2017.
Jouberton, A., Shaw, T. E., Miles, E., McCarthy, M., Fugger, S., Ren, S. T., Dehecq, A., Yang, W., and Pellicciotti, F.: Warming-induced monsoon precipitation phase change intensifies glacier mass loss in the southeastern Tibetan Plateau, P. Natl. Acad. Sci. USA, 119, e2109796119, https://doi.org/10.1073/pnas.2109796119, 2022.
Juen, M., Mayer, C., Lambrecht, A., Han, H., and Liu, S.: Impact of varying debris cover thickness on ablation: a case study for Koxkar Glacier in the Tien Shan, The Cryosphere, 8, 377–386, https://doi.org/10.5194/tc-8-377-2014, 2014.
Kääb, A., Berthier, E., Nuth, C., Gardelle, J., and Arnaud, Y.: Contrasting patterns of early twenty-first-century glacier mass change in the Himalayas, Nature, 488, 495–498, https://doi.org/10.1038/nature11324, 2012.
Kääb, A., Jacquemart, M., Gilbert, A., Leinss, S., Girod, L., Huggel, C., Falaschi, D., Ugalde, F., Petrakov, D., Chernomorets, S., Dokukin, M., Paul, F., Gascoin, S., Berthier, E., and Kargel, J. S.: Sudden large-volume detachments of low-angle mountain glaciers – more frequent than thought?, The Cryosphere, 15, 1751–1785, https://doi.org/10.5194/tc-15-1751-2021, 2021.
Ke, L. H., Song, C. Q., Yong, B., Lei, Y. B., and Ding, X. L.: Which heterogeneous glacier melting patterns can be robustly observed from space? A multi-scale assessment in southeastern Tibetan Plateau, Remote Sens. Environ., 242, 111777, https://doi.org/10.1016/j.rse.2020.111777, 2020.
King, O., Bhattacharya, A., Bhambri, R., and Bolch, T.: Glacial lakes exacerbate Himalayan glacier mass loss, Sci. Rep.-UK, 9, 18145, https://doi.org/10.1038/s41598-019-53733-x, 2019.
Kneib, M., Miles, E. S., Buri, P., Molnar, P., McCarthy, M., Fugger, S., and Pellicciotti, F.: Interannual dynamics of ice cliff populations on debris-covered glaciers from remote sensing observations and stochastic modeling, J. Geophys. Res. Earth. Surf., 126, e2021JF006179, https://doi.org/10.1029/2021jf006179, 2021.
Kneib, M., Miles, E. S., Buri, P., Fugger, S., McCarthy, M., Shaw, T. E., Chuanxi, Z., Truffer, M., Westoby, M. J., Yang, W., and Pellicciotti, F.: Sub-seasonal variability of supraglacial ice cliff melt rates and associated processes from time-lapse photogrammetry, The Cryosphere, 16, 4701–4725, https://doi.org/10.5194/tc-16-4701-2022, 2022.
Kneib, M., Fyffe, C. L., Miles, E. S., Lindemann, S., Shaw, T. E., Buri, P., McCarthy, M., Ouvry, B., Vieli, A., Sato, Y., Kraaijenbrink, P. D. A., Zhao, C. X., Molnar, P., and Pellicciotti, F.: Controls on Ice Cliff Distribution and Characteristics on Debris-Covered Glaciers, Geophys. Res. Lett., 50, e2022GL102444, https://doi.org/10.1029/2022gl102444, 2023.
Kraaijenbrink, P., Meijer, S. W., Shea, J. M., Pellicciotti, F., De Jong, S. M., and Immerzeel, W. W.: Seasonal surface velocities of a Himalayan glacier derived by automated correlation of unmanned aerial vehicle imagery, Ann. Glaciol., 57, 103–113, https://doi.org/10.3189/2016AoG71A072, 2016.
Li, T., Zhang, B. G., Cheng, X., Westoby, M. J., Li, Z. H., Ma, C., Hui, F. M., Shokr, M., Liu, Y., Chen, Z. Q., Zhai, M. X., and Li, X. Q.: Resolving Fine-Scale Surface Features on Polar Sea Ice: A First Assessment of UAS Photogrammetry Without Ground Control, Remote Sens., 11, 784, https://doi.org/10.3390/rs11070784, 2019.
Maussion, F., Scherer, D., Molg, T., Collier, E., Curio, J., and Finkelnburg, R.: Precipitation Seasonality and Variability over the Tibetan Plateau as Resolved by the High Asia Reanalysis, J. Climate, 27, 1910–1927, https://doi.org/10.1175/jcli-d-13-00282.1, 2014.
McCarthy, M., Pritchard, H., Willis, I., and King, E.: Ground-penetrating radar measurements of debris thickness on Lirung Glacier, Nepal, J. Glaciol., 63, 543–555, https://doi.org/10.1017/jog.2017.18, 2017.
McSaveney, M. J.: The Sherman Glacier Rock Avalanche of 1964: its Emplacement and Subsequent Effects on the Glacier beneath it, PhD thesis, Ohio State University, Columbus, OH, p. 403, 1975.
Messerli, A. and Grinsted, A.: Image georectification and feature tracking toolbox: ImGRAFT, Geosci. Instrum. Method. Data Syst., 4, 23–34, https://doi.org/10.5194/gi-4-23-2015, 2015.
Mihalcea, C., Mayer, C., Diolaiuti, G., D'Agata, C., Smiraglia, C., Lambrecht, A., Vuillermoz, E., and Tartari, G.: Spatial distribution of debris thickness and melting from remote-sensing and meteorological data, at debris-covered Baltoro glacier, Karakoram, Pakistan, General Assembly of the International-Association-of-Geodesy/24th General Assembly of the International-Union-of-Geodesy-and-Geophysics, Perugia, Italy, 2–13 July, WOS:000257063000008, 49, https://doi.org/10.3189/172756408784700680, 2008.
Miles, E. S., Pellicciotti, F., Willis, I. C., Steiner, J. F., Buri, P., and Arnold, N. S.: Refined energy-balance modelling of a supraglacial pond, Langtang Khola, Nepal, Ann. Glaciol., 57, 29–40, https://doi.org/10.3189/2016AoG71A421, 2016.
Miles, E. S., Steiner, J., Willis, I., Buri, P., Immerzeel, W. W., Chesnokova, A., and Pellicciotti, F.: Pond Dynamics and Supraglacial-Englacial Connectivity on Debris-Covered Lirung Glacier, Nepal, Front. Earth Sci., 5, 00069, https://doi.org/10.3389/feart.2017.00069, 2017.
Miles, E. S., Willis, I., Buri, P., Steiner, J. F., Arnold, N. S., and Pellicciotti, F.: Surface Pond Energy Absorption Across Four Himalayan Glaciers Accounts for 1/8 of Total Catchment Ice Loss, Geophys. Res. Lett., 45, 10464–10473, https://doi.org/10.1029/2018gl079678, 2018.
Miles, E., McCarthy, M., Dehecq, A., Kneib, M., Fugger, S., and Pellicciotti, F.: Results for “Health and sustainability of glaciers in High Mountain Asia”, Zenodo [data set], https://doi.org/10.5281/zenodo.3843293, 2020.
Miles, E., McCarthy, M., Dehecq, A., Kneib, M., Fugger, S., and Pellicciotti, F.: Health and sustainability of glaciers in High Mountain Asia, Nat. Commun., 12, 2868, https://doi.org/10.1038/s41467-021-23073-4, 2021.
Miles, E. S., Steiner, J. F., Buri, P., Immerzeel, W. W., and Pellicciotti, F.: Controls on the relative melt rates of debris-covered glacier surfaces, Environ. Res. Lett., 17, 064004, https://doi.org/10.1088/1748-9326/ac6966, 2022.
Mishra, N. B., Miles, E. S., Chaudhuri, G., Mainali, K. P., Mal, S., Singh, P. B., and Tiruwa, B.: Quantifying heterogeneous monsoonal melt on a debris-covered glacier in Nepal Himalaya using repeat uncrewed aerial system (UAS) photogrammetry, J. Glaciol., 68, 288–304, https://doi.org/10.1017/jog.2021.96, 2022.
Mölg, N., Bolch, T., Walter, A., and Vieli, A.: Unravelling the evolution of Zmuttgletscher and its debris cover since the end of the Little Ice Age, The Cryosphere, 13, 1889–1909, https://doi.org/10.5194/tc-13-1889-2019, 2019.
Mölg, N., Ferguson, J., Bolch, T., and Vieli, A.: On the influence of debris cover on glacier morphology: How high-relief structures evolve from smooth surfaces, Geomorphology, 357, 107092, https://doi.org/10.1016/j.geomorph.2020.107092, 2020.
Nakawo, M., Yabuki, H., and Sakai, A.: Characteristics of Khumbu Glacier, Nepal Himalaya: recent change in the debris-covered area, Ann. Glaciol., 28, 118–122, https://doi.org/10.3189/172756499781821788, 1999.
Neckel, N., Loibl, D., and Rankl, M.: Recent slowdown and thinning of debris-covered glaciers in south-eastern Tibet, Earth Planet. Sci. Lett., 464, 95–102, https://doi.org/10.1016/j.epsl.2017.02.008, 2017.
Nicholson, L. and Benn, D. I.: Calculating ice melt beneath a debris layer using meteorological data, J. Glaciol., 52, 463–470, https://doi.org/10.3189/172756506781828584, 2006.
Nuimura, T., Fujita, K., and Sakai, A.: Downwasting of the debris-covered area of Lirung Glacier in Langtang Valley, Nepal Himalaya, from 1974 to 2010, Quat. Int., 455, 93–101, https://doi.org/10.1016/j.quaint.2017.06.066, 2017.
Østrem, G.: Ice Melting under a Thin Layer of Moraine, and the Existence of Ice Cores in Moraine Ridges, Geogr. Ann., 41, 228–230, https://doi.org/10.1080/20014422.1959.11907953, 1959.
Pellicciotti, F., Stephan, C., Miles, E., Herreid, S., Immerzeel, W. W., and Bolch, T.: Mass-balance changes of the debris-covered glaciers in the Langtang Himal, Nepal, from 1974 to 1999, J. Glaciol., 61, 373–386, https://doi.org/10.3189/2015JoG13J237, 2015.
Quincey, D. J., Richardson, S. D., Luckman, A., Lucas, R. M., Reynolds, J. M., Hambrey, M. J., and Glasser, N. F.: Early recognition of glacial lake hazards in the Himalaya using remote sensing datasets, Glob. Planet. Change, 56, 137–152, https://doi.org/10.1016/j.gloplacha.2006.07.013, 2007.
Racoviteanu, A. E., Nicholson, L., Glasser, N. F., Miles, E., Harrison, S., and Reynolds, J. M.: Debris-covered glacier systems and associated glacial lake outburst flood hazards: challenges and prospects, J. Geol. Soc. London, 179, jgs2021-084, https://doi.org/10.1144/jgs2021-084, 2022.
Reid, T. D. and Brock, B. W.: An energy-balance model for debris-covered glaciers including heat conduction through the debris layer, J. Glaciol., 56, 903–916, https://doi.org/10.3189/002214310794457218, 2010.
Reid, T. D. and Brock, B. W.: Assessing ice-cliff backwasting and its contribution to total ablation of debris-covered Miage glacier, Mont Blanc massif, Italy, J. Glaciol., 60, 3439–3457, https://doi.org/10.3189/2014JoG13J045, 2014.
Reid, T. D., Carenzo, M., Pellicciotti, F., and Brock, B. W.: Including debris cover effects in a distributed model of glacier ablation, J. Geophys. Res.-Atmos., 117, D18105, https://doi.org/10.1029/2012jd017795, 2012.
Rossini, M., Di Mauro, B., Garzonio, R., Baccolo, G., Cavallini, G., Mattavelli, M., De Amicis, M., and Colombo, R.: Rapid melting dynamics of an alpine glacier with repeated UAV photogrammetry, Geomorphology, 304, 159–172, https://doi.org/10.1016/j.geomorph.2017.12.039, 2018.
Rounce, D. R., Hock, R., McNabb, R. W., Millan, R., Sommer, C., Braun, M. H., Malz, P., Maussion, F., Mouginot, J., Seehaus, T. C., and Shean, D. E.: Distributed Global Debris Thickness Estimates Reveal Debris Significantly Impacts Glacier Mass Balance, Geophys. Res. Lett., 48, e2020GL091311, https://doi.org/10.1029/2020gl091311, 2021.
Rowan, A. V., Egholm, D. L., Quincey, D. J., Hubbard, B., King, O., Miles, E. S., Miles, K. E., and Hornsey, J.: The role of differential ablation and dynamic detachment in driving accelerating mass loss from a debris-covered himalayan glacier, J. Geophys. Res.-Earth. Surf., 126, e2020JF005761, https://doi.org/10.1029/2020jf005761, 2021.
Sakai, A. and Fujita, K.: Formation conditions of supraglacial lakes on debris-covered glaciers in the Himalaya, J. Glaciol., 56, 177–181, https://doi.org/10.3189/002214310791190785, 2010.
Sakai, A., Nakawo, M., and Fujita, K.: Melt rate of ice cliffs on the Lirung Glacier, Nepal Himalayas, 1996, Bull. Glaciol. Res., 810, 57–66, 1998.
Sakai, A., Nakawo, M., and Fujita, K.: Distribution Characteristics and Energy Balance of Ice Cliffs on Debris-covered Glaciers, Nepal Himalaya, Arct. Antarct. Alp. Res., 34, 12–19, https://doi.org/10.1080/15230430.2002.12003463, 2002.
Sato, Y., Fujita, K., Inoue, H., Sunako, S., Sakai, A., Tsushima, A., Podolskiy, E. A., Kayastha, R., and Kayastha, R. B.: Ice Cliff Dynamics of Debris-Covered Trakarding Glacier in the Rolwaling Region, Nepal Himalaya, Front. Earth Sci., 9, 623623, https://doi.org/10.3389/feart.2021.623623, 2021.
Scherler, D., Wulf, H., and Gorelick, N.: Global Assessment of Supraglacial Debris-Cover Extents, Geophys. Res. Lett., 45, 11798–11805, https://doi.org/10.1029/2018gl080158, 2018.
Shean, D. E., Bhushan, S., Montesano, P., Rounce, D. R., Arendt, A., and Osmanoglu, B.: A Systematic, Regional Assessment of High Mountain Asia Glacier Mass Balance, Front. Earth Sci., 7, 00363, https://doi.org/10.3389/feart.2019.00363, 2020.
Shugar, D. H. and Clague, J. J.: The sedimentology and geomorphology of rock avalanche deposits on glaciers, Sedimentology, 58, 1762–1783, https://doi.org/10.1111/j.1365-3091.2011.01238.x, 2011.
Steiner, J. F., Pellicciotti, F., Bur, P., Miles, E. S., Immerzeel, W. W., and Reid, T. D.: Modelling ice-cliff backwasting on a debris-covered glacier in the Nepalese Himalaya, J. Glaciol., 61, 889–907, https://doi.org/10.3189/2015JoG14J194, 2015.
Steiner, J. F., Buri, P., Miles, E. S., Ragettli, S., and Pellicciotti, F.: Supraglacial ice cliffs and ponds on debris-covered glaciers: spatio-temporal distribution and characteristics, J. Glaciol., 65, 617–632, https://doi.org/10.1017/jog.2019.40, 2019.
Tadono, T., Ishida, H., Oda, F., Naito, S., Minakawa, K., and Iwamoto, H.: Precise Global DEM Generation by ALOS PRISM, ISPRS Ann. Photogramm. Remote Sens. Spatial Inf. Sci., II-4, 71–76, https://doi.org/10.5194/isprsannals-II-4-71-2014, 2014.
Thompson, S., Benn, D. I., Mertes, J., and Luckman, A.: Stagnation and mass loss on a Himalayan debris-covered glacier: processes, patterns and rates, J. Glaciol., 62, 467–485, https://doi.org/10.1017/jog.2016.37, 2016.
Vincent, C., Ramanathan, Al., Wagnon, P., Dobhal, D. P., Linda, A., Berthier, E., Sharma, P., Arnaud, Y., Azam, M. F., Jose, P. G., and Gardelle, J.: Balanced conditions or slight mass gain of glaciers in the Lahaul and Spiti region (northern India, Himalaya) during the nineties preceded recent mass loss, The Cryosphere, 7, 569–582, https://doi.org/10.5194/tc-7-569-2013, 2013.
Vincent, C., Wagnon, P., Shea, J. M., Immerzeel, W. W., Kraaijenbrink, P., Shrestha, D., Soruco, A., Arnaud, Y., Brun, F., Berthier, E., and Sherpa, S. F.: Reduced melt on debris-covered glaciers: investigations from Changri Nup Glacier, Nepal, The Cryosphere, 10, 1845–1858, https://doi.org/10.5194/tc-10-1845-2016, 2016.
Wang, W. C., Yao, T. D., and Yang, X. X.: Variations of glacial lakes and glaciers in the Boshula mountain range, southeast Tibet, from the 1970s to 2009, Ann. Glaciol., 52, 9–17, https://doi.org/10.3189/172756411797252347, 2011.
Westoby, M. J., Brasington, J., Glasser, N. F., Hambrey, M. J., and Reynolds, J. M.: “Structure-from-Motion” photogrammetry: A low-cost, effective tool for geoscience applications, Geomorphology, 179, 300–314, https://doi.org/10.1016/j.geomorph.2012.08.021, 2012.
Westoby, M. J., Rounce, D. R., Shaw, T. E., Fyffe, C. L., Moore, P. L., Stewart, R. L., and Brock, B. W.: Geomorphological evolution of a debris-covered glacier surface, Earth. Surf. Process. Landf., 45, 3431–3448, https://doi.org/10.1002/esp.4973, 2020.
Wigmore, O. and Mark, B.: Monitoring tropical debris-covered glacier dynamics from high-resolution unmanned aerial vehicle photogrammetry, Cordillera Blanca, Peru, The Cryosphere, 11, 2463–2480, https://doi.org/10.5194/tc-11-2463-2017, 2017.
Xu, S. Y., Fu, P., Quincey, D., Feng, M. L., Marsh, S., and Liu, Q.: UAV-based geomorphological evolution of the Terminus Area of the Hailuogou Glacier, Southeastern Tibetan Plateau between 2017 and 2020, Geomorphology, 411, 108293, https://doi.org/10.1016/j.geomorph.2022.108293, 2022.
Yang, W., Yao, T. D., Guo, X. F., Zhu, M. L., Li, S. H., and Kattel, D. B.: Mass balance of a maritime glacier on the southeast Tibetan Plateau and its climatic sensitivity, J. Geophys. Res.-Atmos., 118, 9579–9594, https://doi.org/10.1002/jgrd.50760, 2013.
Yang, W., Guo, X. F., Yao, T. D., Zhu, M. L., and Wang, Y. J.: Recent accelerating mass loss of southeast Tibetan glaciers and the relationship with changes in macroscale atmospheric circulations, Clim. Dynam., 47, 805–815, https://doi.org/10.1007/s00382-015-2872-y, 2016.
Yang, W., Yao, T. D., Zhu, M. L., and Wang, Y. J.: Comparison of the meteorology and surface energy fluxes of debris-free and debris-covered glaciers in the southeastern Tibetan Plateau, J. Glaciol., 63, 1090–1104, https://doi.org/10.1017/jog.2017.77, 2017.
Yang, W., Zhao, C. X., Westoby, M., Yao, T. D., Wang, Y. J., Pellicciotti, F., Zhou, J. M., He, Z., and Miles, E.: Seasonal Dynamics of a Temperate Tibetan Glacier Revealed by High-Resolution UAV Photogrammetry and In Situ Measurements, Remote Sens., 12, 2389, https://doi.org/10.3390/rs12152389, 2020.
Yao, T. D., Thompson, L., Yang, W., Yu, W. S., Gao, Y., Guo, X. J., Yang, X. X., Duan, K. Q., Zhao, H. B., Xu, B. Q., Pu, J. C., Lu, A. X., Xiang, Y., Kattel, D. B., and Joswiak, D.: Different glacier status with atmospheric circulations in Tibetan Plateau and surroundings, Nat. Clim. Chang., 2, 663–667, https://doi.org/10.1038/nclimate1580, 2012.
Ye, D. and Gao, Y.: Meteorology of the Tibetan Plateau, Science Press, Beijing, 1979 (in Chinese).
Zhang, Y., Fujita, K., Liu, S. Y., Liu, Q., and Nuimura, T.: Distribution of debris thickness and its effect on ice melt at Hailuogou glacier, southeastern Tibetan Plateau, using in situ surveys and ASTER imagery, J. Glaciol., 57, 1147–1157, https://doi.org/10.3189/002214311798843331, 2011.
Zhang, Y., Hirabayashi, Y., Fujita, K., Liu, S. Y., and Liu, Q.: Heterogeneity in supraglacial debris thickness and its role in glacier mass changes of the Mount Gongga, Sci. China Earth Sci., 59, 170–184, https://doi.org/10.1007/s11430-015-5118-2, 2016.
Zhao, C. and Yang, W.: The UAV-derived orthomosaics and DEMs of 23K Glacier and 24K Glacier in southeastern Tibetan Plateau (2019–2020), Zenodo [data set], https://doi.org/10.5281/zenodo.7350479, 2022.
Zhao, C., Yang, W., Westoby, M., An, B., Wu, G., Wang, W., Wang, Z., Wang, Y., and Dunning, S.: Brief communication: An approximately 50 Mm3 ice-rock avalanche on 22 March 2021 in the Sedongpu valley, southeastern Tibetan Plateau, The Cryosphere, 16, 1333–1340, https://doi.org/10.5194/tc-16-1333-2022, 2022.
Zhong, Y., Liu, Q., Westoby, M., Nie, Y., Pellicciotti, F., Zhang, B., Cai, J., Liu, G., Liao, H., and Lu, X.: Intensified paraglacial slope failures due to accelerating downwasting of a temperate glacier in Mt. Gongga, southeastern Tibetan Plateau, Earth Surf. Dynam., 10, 23–42, https://doi.org/10.5194/esurf-10-23-2022, 2022.