the Creative Commons Attribution 4.0 License.
the Creative Commons Attribution 4.0 License.
 | 21 Aug 2023
Permafrost saline water and Early to mid-Holocene permafrost aggradation in Svalbard
Dotan Rotem
Vladimir Lyakhovsky
Hanne Hvidtfeldt Christiansen
Yehudit Harlavan
Yishai Weinstein
Deglaciation in Svalbard was followed by seawater ingression and deposition of marine (deltaic) sediments in fjord valleys, while elastic rebound resulted in fast land uplift and the exposure of these sediments to the atmosphere, whereby the formation of epigenetic permafrost was initiated. This was then followed by the accumulation of aeolian sediments, with syngenetic permafrost formation. Permafrost was studied in the eastern Adventdalen valley, Svalbard, 3–4 km from the maximum up-valley reach of post-deglaciation seawater ingression, and its ground ice was analysed for its chemistry. While ground ice in the syngenetic part is basically fresh, the epigenetic part has a frozen freshwater–saline water interface (FSI), with chloride concentrations increasing from the top of the epigenetic part (at 5.5 m depth) to about 15 % that of seawater at 11 m depth. We applied a one-dimensional freezing model to examine the rate of top-down permafrost formation, which could be accommodated by the observed frozen FSI. The model examined permafrost development under different scenarios of mean average air temperature, water freezing temperature and degree of pore-water freezing. We found that even at the relatively high air temperatures of the Early to mid-Holocene, permafrost could aggrade quite fast down to 20 to 37 m (the whole sediment fill of 25 m at this location) within 200 years. This, in turn, allowed freezing and preservation of the freshwater–saline water interface despite the relatively fast rebound rate, which apparently resulted in an increase in topographic gradients toward the sea. The permafrost aggradation rate could also be enhanced due to non-complete pore-water freezing. We conclude that freezing must have started immediately after the exposure of the marine sediment to atmospheric conditions.
- Article
(6436 KB) - Full-text XML
- BibTeX
- EndNote


Cycles of global warming and cooling are well documented in geological history (e.g. Imbrie et al., 1993; Benn and Evans, 2014; Arnscheidt and Rothman, 2020). During the Pleistocene, these cycles followed Northern Hemisphere glaciation and deglaciation, which influenced both marine and land temperatures (Park et al., 2019). This also affected the extent of cryotic conditions in the periglacial environment (e.g. Murton, 2021), i.e. the distribution of permafrost, which currently covers 22 % of Northern Hemisphere land areas (Obu et al., 2019). While temperatures during the Holocene were significantly higher than during the Last Glacial Period, the retreat of glaciers and the follow-up elastic rebound and exposure of new land in the Arctic and the sub-Arctic environment allowed freezing and the aggradation of permafrost (e.g. Landvik et al., 1988). Nevertheless, the relatively high temperatures during the Early and the mid-Holocene warm period raise questions about the timing of initiation and the extent of this process (e.g. Landvik et al., 1988; Humlum, 2005).
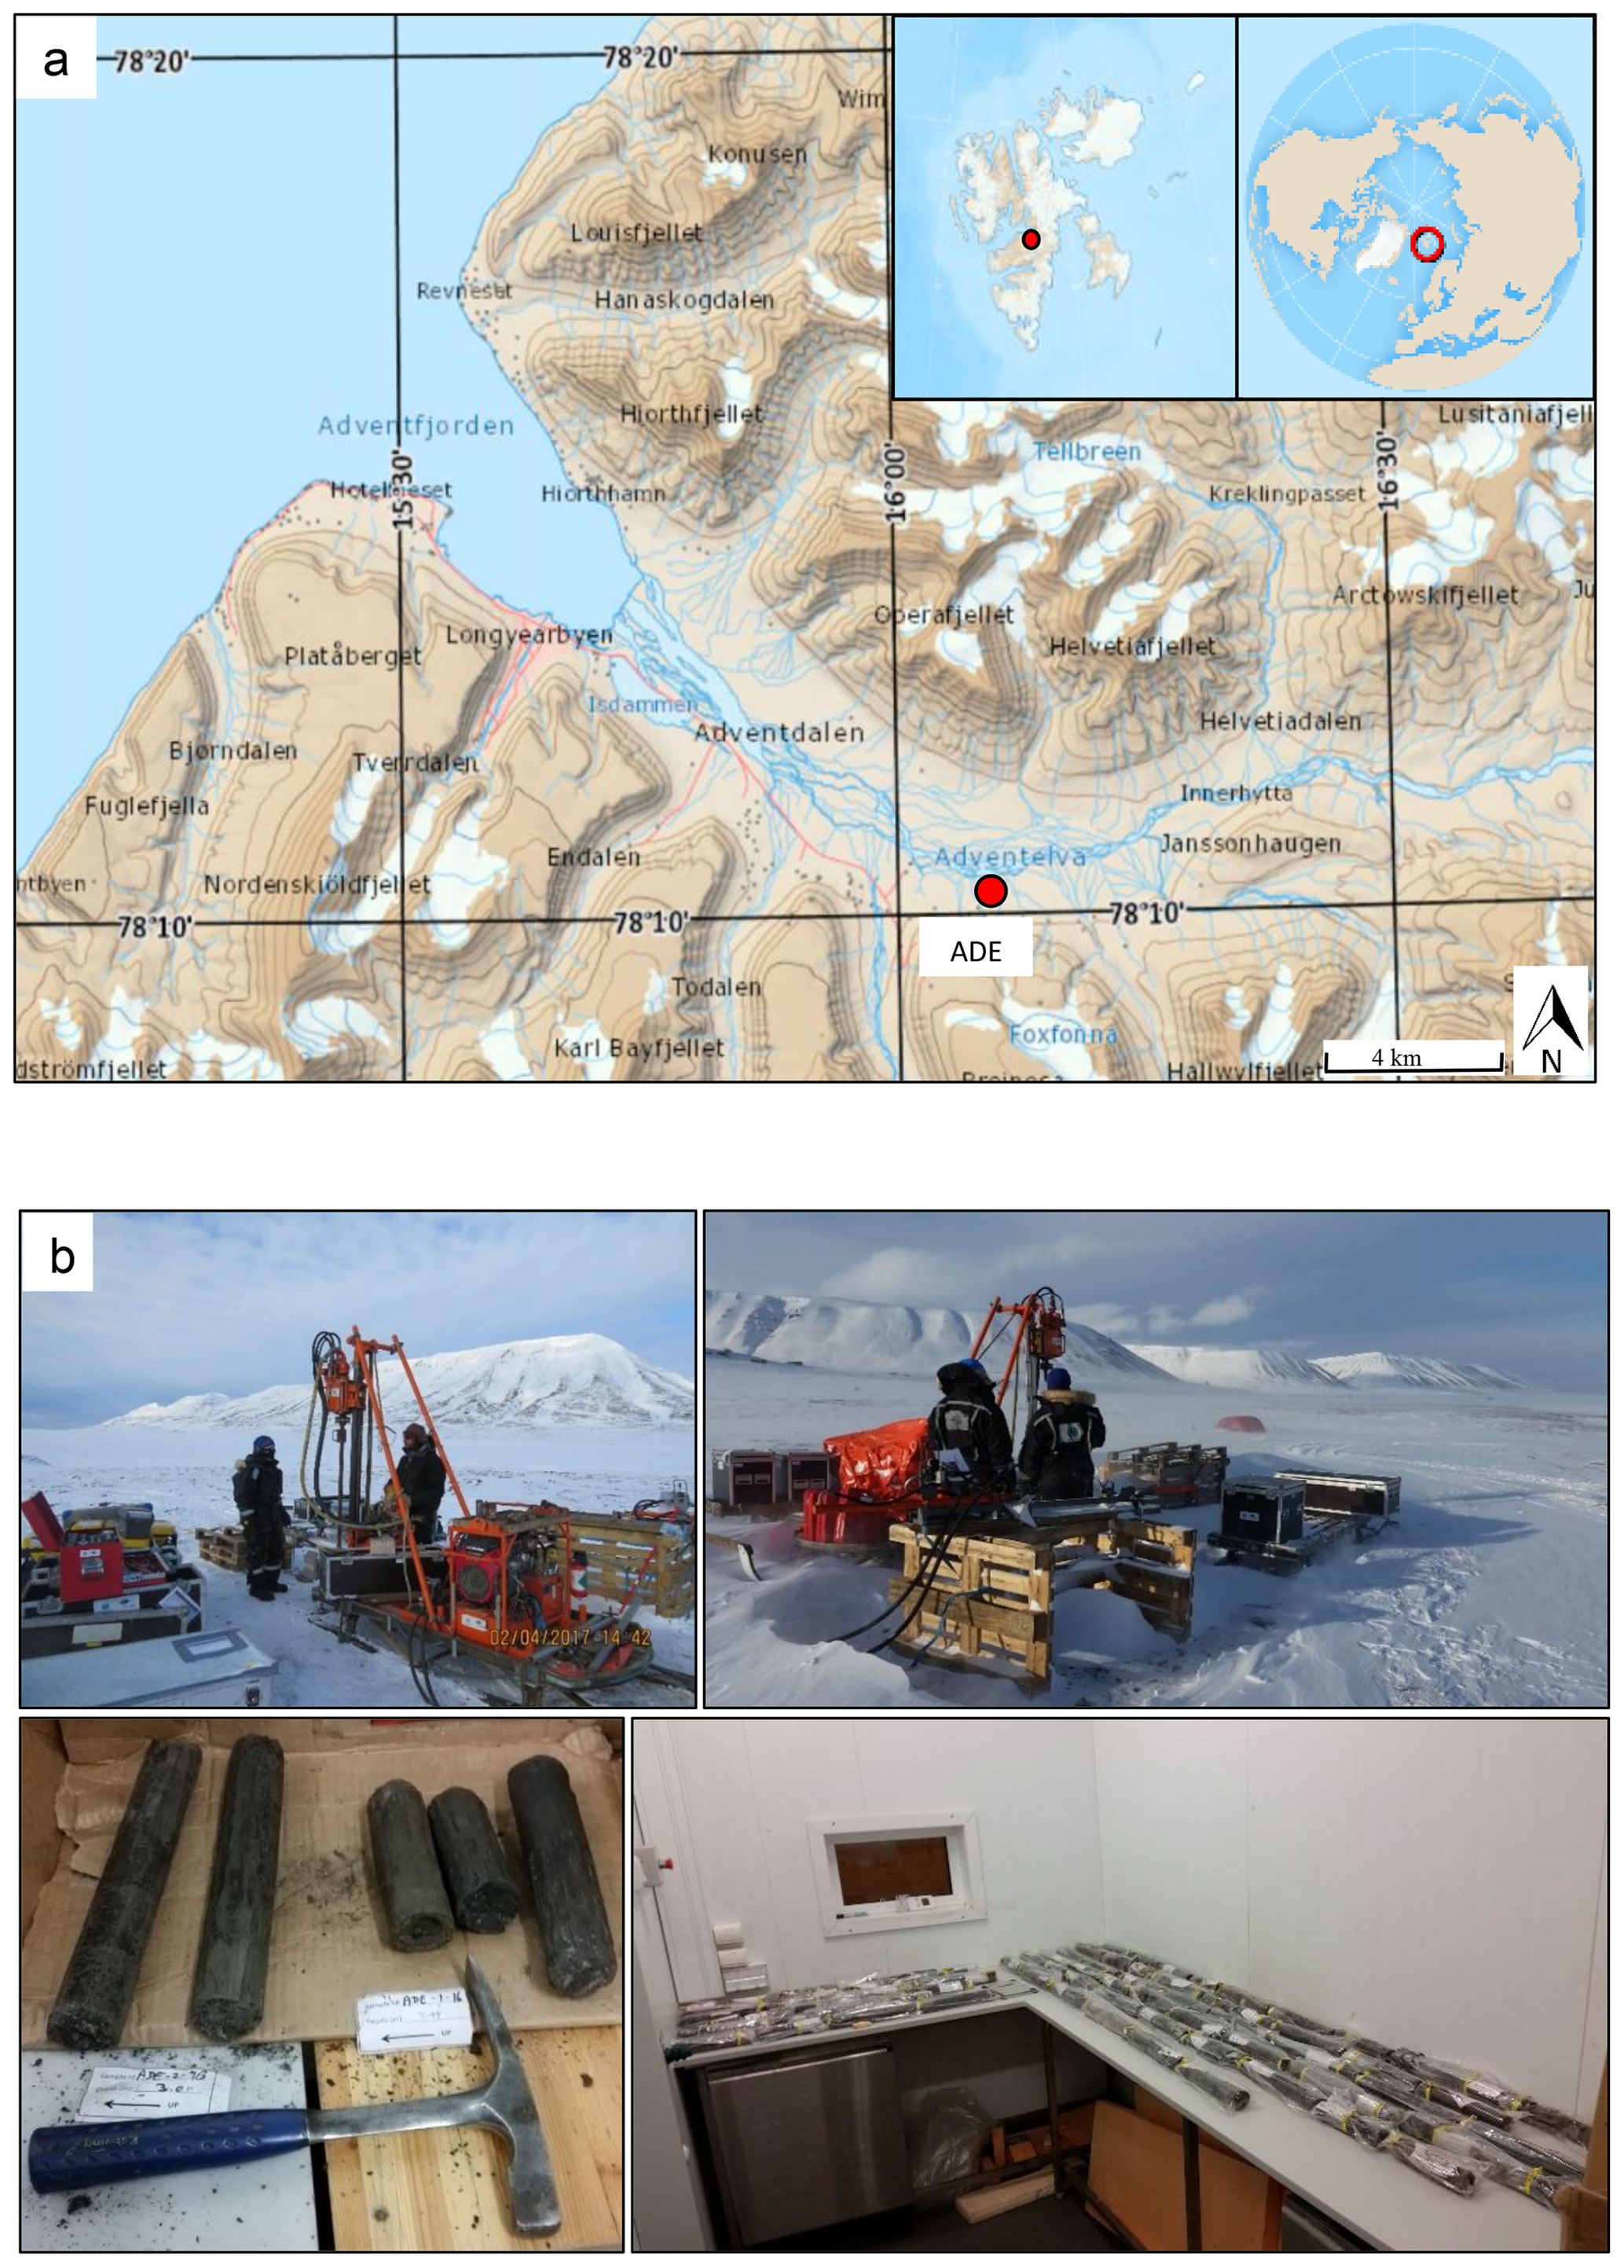
Figure 1(a) The study site, Adventdalen East (ADE), is located at the Adventdalen, Svalbard, on a river terrace. Map provided courtesy of the Norwegian Polar Institute. (b) Drilling at ADE, spring 2017 (top), and core samples before processing at UNIS cold room lab (bottom). Photos: Dotan Rotem and Yishai Weinstein.
In Svalbard (Fig. 1), the fast retreat of glaciers during the end of the Late Pleistocene into the beginning of the Holocene resulted in the ingression of seawater in fjord valleys, which was followed by gradual uplifting and exposure due to elastic rebound. This resulted in epigenetic permafrost aggradation followed by the deposition of fluvial and aeolian sediments and the formation of syngenetic permafrost during the last ca. 4 kyr (Gilbert et al., 2018). In the present study, we use the presence of saline water in the epigenetic permafrost to constrain the timing of freezing.
Permafrost is a soil or rock which has been below 0 ∘C for at least 2 consecutive years (French, 2017). While winter freezing of the ground is common in land areas to a large extent, the existence of permafrost and its aggradation depend on the annual energy balance between the atmosphere and the land (Black, 1954). Accordingly, permafrost develops when the land heat loss during winter exceeds the gain during the summer for a long enough time. This is controlled by both seasonal solar radiation and the soil and rock thermal properties. Heat exchange between soil and the atmosphere is also strongly affected by land cover, whereby permafrost is usually developed neither under the sea nor beneath warm-based glaciers (Waller et al., 2012). Nevertheless, permafrost can occur beneath lagoons in association with taliks, as well as beneath bottom-fast ice in shallow water (Solomon et al., 2008). The extent and depth of permafrost can be significantly reduced by thick vegetation or snow cover (e.g. Grünberg et al., 2020). During the last glacial cycle, the Barents Sea and the Svalbard area (Fig. 1) were covered by one to three ice caps (Mangerud et al., 2002; Patton et al., 2017). Glacier retreat has been followed since by elastic rebound, which is well documented in Svalbard (Bondevik et al., 1995; Lønne and Nemec, 2004; Sessford et al., 2015), with a land rise of up to 130 m in eastern Svalbard and 65 m in the western part of the archipelago (Forman et al., 2004). In western Svalbard, the focus of this study, research indicates a fast land rise from 19 to 15 mm yr−1 during the Early to the mid-Holocene (11.7–8.2 ka), which decreased from 5 to 4 mm yr−1 toward the end of the mid-Holocene (Salvigsen, 1984; Sessford et al., 2015) and ca. 1 mm yr−1 during the Late Holocene (last 4 kyr; e.g. Forman et al., 2004).
Land uplift and exposure are accompanied by the establishment of a surficial drainage system, as well as the development of a groundwater flow network, which strongly depends on the rate of permafrost deepening (Edmunds et al., 2001). The permeability of frozen soils is greatly reduced (Burt and Williams, 1976; Cochand et al., 2019), such that extensive permafrost prevents penetration of surface water and recharging of groundwater (McEwen and de Marsily, 1991). While in sporadic and discontinuous permafrost, groundwater flow is possible through non-frozen sections or taliks, and flow is practically impossible through continuous-permafrost land areas (Lemieux et al., 2008; Walvoord and Kurylyk, 2016), while it may be active in sub-permafrost zones or along faults in relation to pingos (Hornum et al., 2021). Flow may also provide the necessary conditions for the formation of cryopegs, which hold overcooled liquid brines (Ahonen, 2001). Although cryopegs were identified in Adventdalen (Tavakoli et al., 2021), water paths have not yet been described.
According to the Ghyben–Herzberg approximation (Bear and Dagan, 1964; Verruijt, 1968), the distance from the seawater level to the freshwater–saline water interface (FSI) should be about 1 : 40 of the groundwater head above sea level. This ratio increases with decreasing salinity of saline water. With typical Early to mid-Holocene rebound rates from 15 to 4.5 mm yr−1 (Sessford et al., 2015) and assuming that the groundwater table (saturated conditions) followed the topography, the fresh–saline interface is expected to be pushed downwards from as deep as 120 m to 36 m within 200 years of exposure. A groundwater table of 1 m below the surface would result in a delay of 100 to 200 years, but also in this case a sediment section of tens of metres will be completely flushed within several hundred years unless sediment freezing practically halts flow in the sub-surface.
The objective of this paper is to test the presented hypothesis by studying the ground ice geochemistry of a permafrost core from Adventdalen, Svalbard, and by using a 1-D numerical heat transfer model to simulate permafrost aggradation under various surface temperature conditions and degrees of freezing.
Adventdalen is a U-shaped, glacially eroded valley located in western Spitsbergen, Svalbard, centred at 78.110∘ N, 16.180∘ E (Fig. 1a). During the last glacial cycle, the valley was eroded down to the basement, which was then covered by glacial deposits (Elverhøi et al., 1995; Gilbert et al., 2018). This was followed by deglaciation, which was completed ca. 10.5 ka (Mangerud et al., 1992; Svendsen and Mangerud, 1997; Lønne and Lyså, 2005; Farnsworth et al., 2020). Deglaciation was followed by up-valley seawater ingression, up to 13.5 km from the current end of the fjord (Cable et al., 2018; Lønne and Nemec, 2004), and subsequent valley infilling with sediment and a delta front prograding down-valley. Elastic rebound resulted in the exposure of the eastern part of the valley before 9.5 ka, which progressed down-valley, arriving at the current coastline location at about 4 ka (Gilbert et al., 2018). The exposed surface was first covered by fluvial sediments, followed by aeolian deposits between 4–2 ka (Gilbert et al., 2018). Permafrost in Svalbard, both epigenetic and syngenetic, is continuous and is estimated to be > 100 m thick in the valleys (Humlum, 2005). The active-layer thickness is commonly 60–100 cm in the valley bottom sediments (Christiansen and Humlum, 2003; Gilbert et al., 2018; Weinstein et al., 2019; Strand et al., 2021).
Meteorological data have been measured continuously for more than 100 years at the Svalbard Airport (e.g. Nordli et al., 2020), located on the Adventfjorden coast, ca. 12 km north-west of our study site. Mean annual air temperature (hereafter MAAT) was −5.9 ∘C from 1971 to 2000, although in 2018 it was merely −1.8 ∘C. Mean annual precipitation between 1971–2000 was 196 mm, while in 2018 it was 177 mm (Strand et al., 2021). MAAT and sea surface temperature during the Early to the mid-Holocene were 2–4 ∘C higher than today, as suggested by marine molluscs' shells (Mangerud and Svendsen, 2018), lacustrine alkenones (van der Bilt et al., 2018), flora DNA (Alsos et al., 2016) and models incorporating physical and biological considerations (e.g. Park et al., 2019). Since the mid-Holocene, a continuous decline in MAAT has been recorded, which changed into a fast temperature rise during the last several decades (e.g. Christiansen et al., 2013).
The study site, Adventdalen East (ADE), is located on a river terrace (78.1722∘ N, 16.0613∘ E), 9.8 km up-valley from the Adventfjorden at 23 m a.s.l. (Fig. 1a and b). We drilled at the same S1 location as Gilbert et al. (2018). The permafrost section (valley-fill sediments) at the ADE site (ca. 20 m) consists of a syngenetic part from 1.0–5.5 m depth, which includes 1.5 m of shallow, fine-grained aeolian deposits and thick ice bodies of segregation ice that intruded above the fluvial gravel channel fill (Gilbert et al., 2018). Below 5.5 m the epigenetic permafrost consists of 3–4 m of fluvial sediments (mud and pebbles, ice-rich). This is underlain by back-delta, deltaic and fore-delta sediments (5.5–17.5 m), which cover glacial sand deposits (17.5–20 m) (Gilbert et al., 2018). The study site was deglaciated by 11.3 ka and emerged above seawater at 9.2 ka (Gilbert et al., 2018), exposing it to atmospheric conditions then, which allowed the development of a groundwater system on one hand and possibly the aggradation of permafrost on the other hand.
Two cores, 0.5 m apart, one 13 m and the other 9 m long, were retrieved at ADE in March 2017, using the UNIS permafrost drill rig (Gilbert et al., 2015), which has core barrels 43 mm in diameter (i.d.). Core length, borehole depth, core condition and gravel content were recorded in the field. Retrieved core sections were placed in plastic bags and marked with a serial number and an arrow pointing towards the core top. Cores were stored at −18 ∘C in a freezer at UNIS until processing. Cores were sectioned in a cold room (−5 ∘C) at 0.5 m depth intervals (Fig. 1b). Intervals of the same depth in the two cores were combined to gain enough ground ice per section for Ra isotope measurements. Samples were first scraped and then crushed to small chips, which were placed in 250 mL centrifuge tubes. Ra-free water (up to 40 mL) was added to some of the tubes to facilitate the extraction of pore fluid. Samples were then thawed in a microwave set to 600 W for 2 min, followed by centrifuging for 8 min (11 000 rpm, high g) to separate thawed water from the soil. Extracted water was run through 3 µm filters, followed by 0.45 µm filters. Most of the water was used for Ra isotope analysis (see Weinstein et al., 2019), while 30–60 mL was used for chemistry analyses. Water of the added Ra-free water was analysed to correct for element concentrations. Major elements were analysed at the Geological Survey of Israel (GSI) by inductively coupled plasma atomic emission spectroscopy (ICP-AES; Optima 3000), where Sc was added as an internal standard, whereas Cl− and SO was determined by potentiometer titration using a Metrohm 702 SM Titrino titrator connected to a chlorine electrode. The error for all majors is considered less than 5 %.
Major elements of thawed ground ice are presented in Table 1, and concentration profiles of Cl−, Na2+ and SO are shown in Fig. 2a–c. While the salinity of ground ice in the syngenetic permafrost is that of fresh water (e.g. Cl−: 10–74 mg L−1; Na2+: 10–33 mg L−1; and SO: 9–31 mg L−1), epigenetic permafrost ground ice demonstrates a trend of increasing concentrations down to 9–12 m depth: 440–3600, 80–2700 and 150–740 mg L−1 of Cl−, Na2+ and SO, respectively. Between 9–12 m, concentrations are quite scattered, and the increasing pattern is less clear. While the Cl− content (Fig. 2a) of the ground ice is no more than 15 % seawater salinity, and the salinity of a deeper-seated saline water end-member could be significantly higher, the observed increased salinity clearly presents a freshwater–saline water interface.
Table 1Major elements (mg L−1) of ground ice samples from the ADE core.
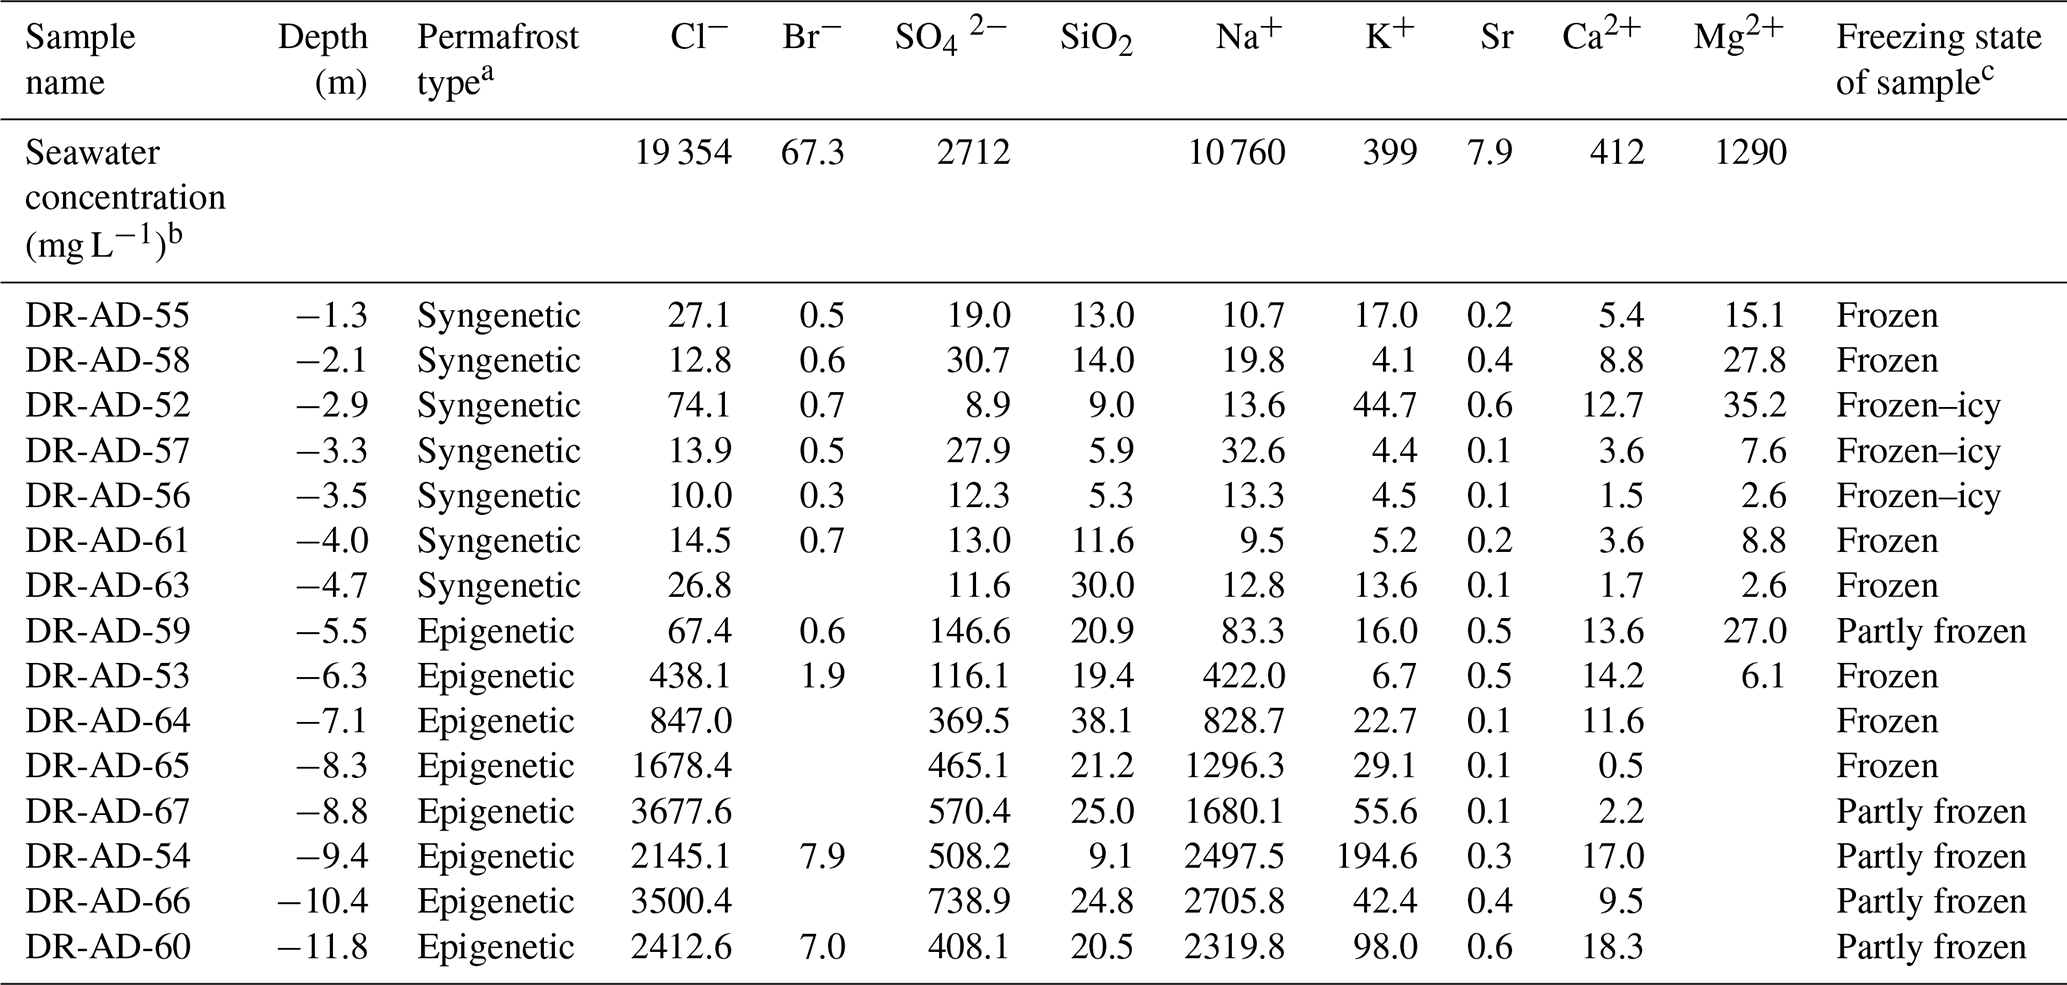
a After Gilbert et al. (2018). b After de Baar et al. (2017), salinity of 35 %. c Freezing state as recorded in the field.
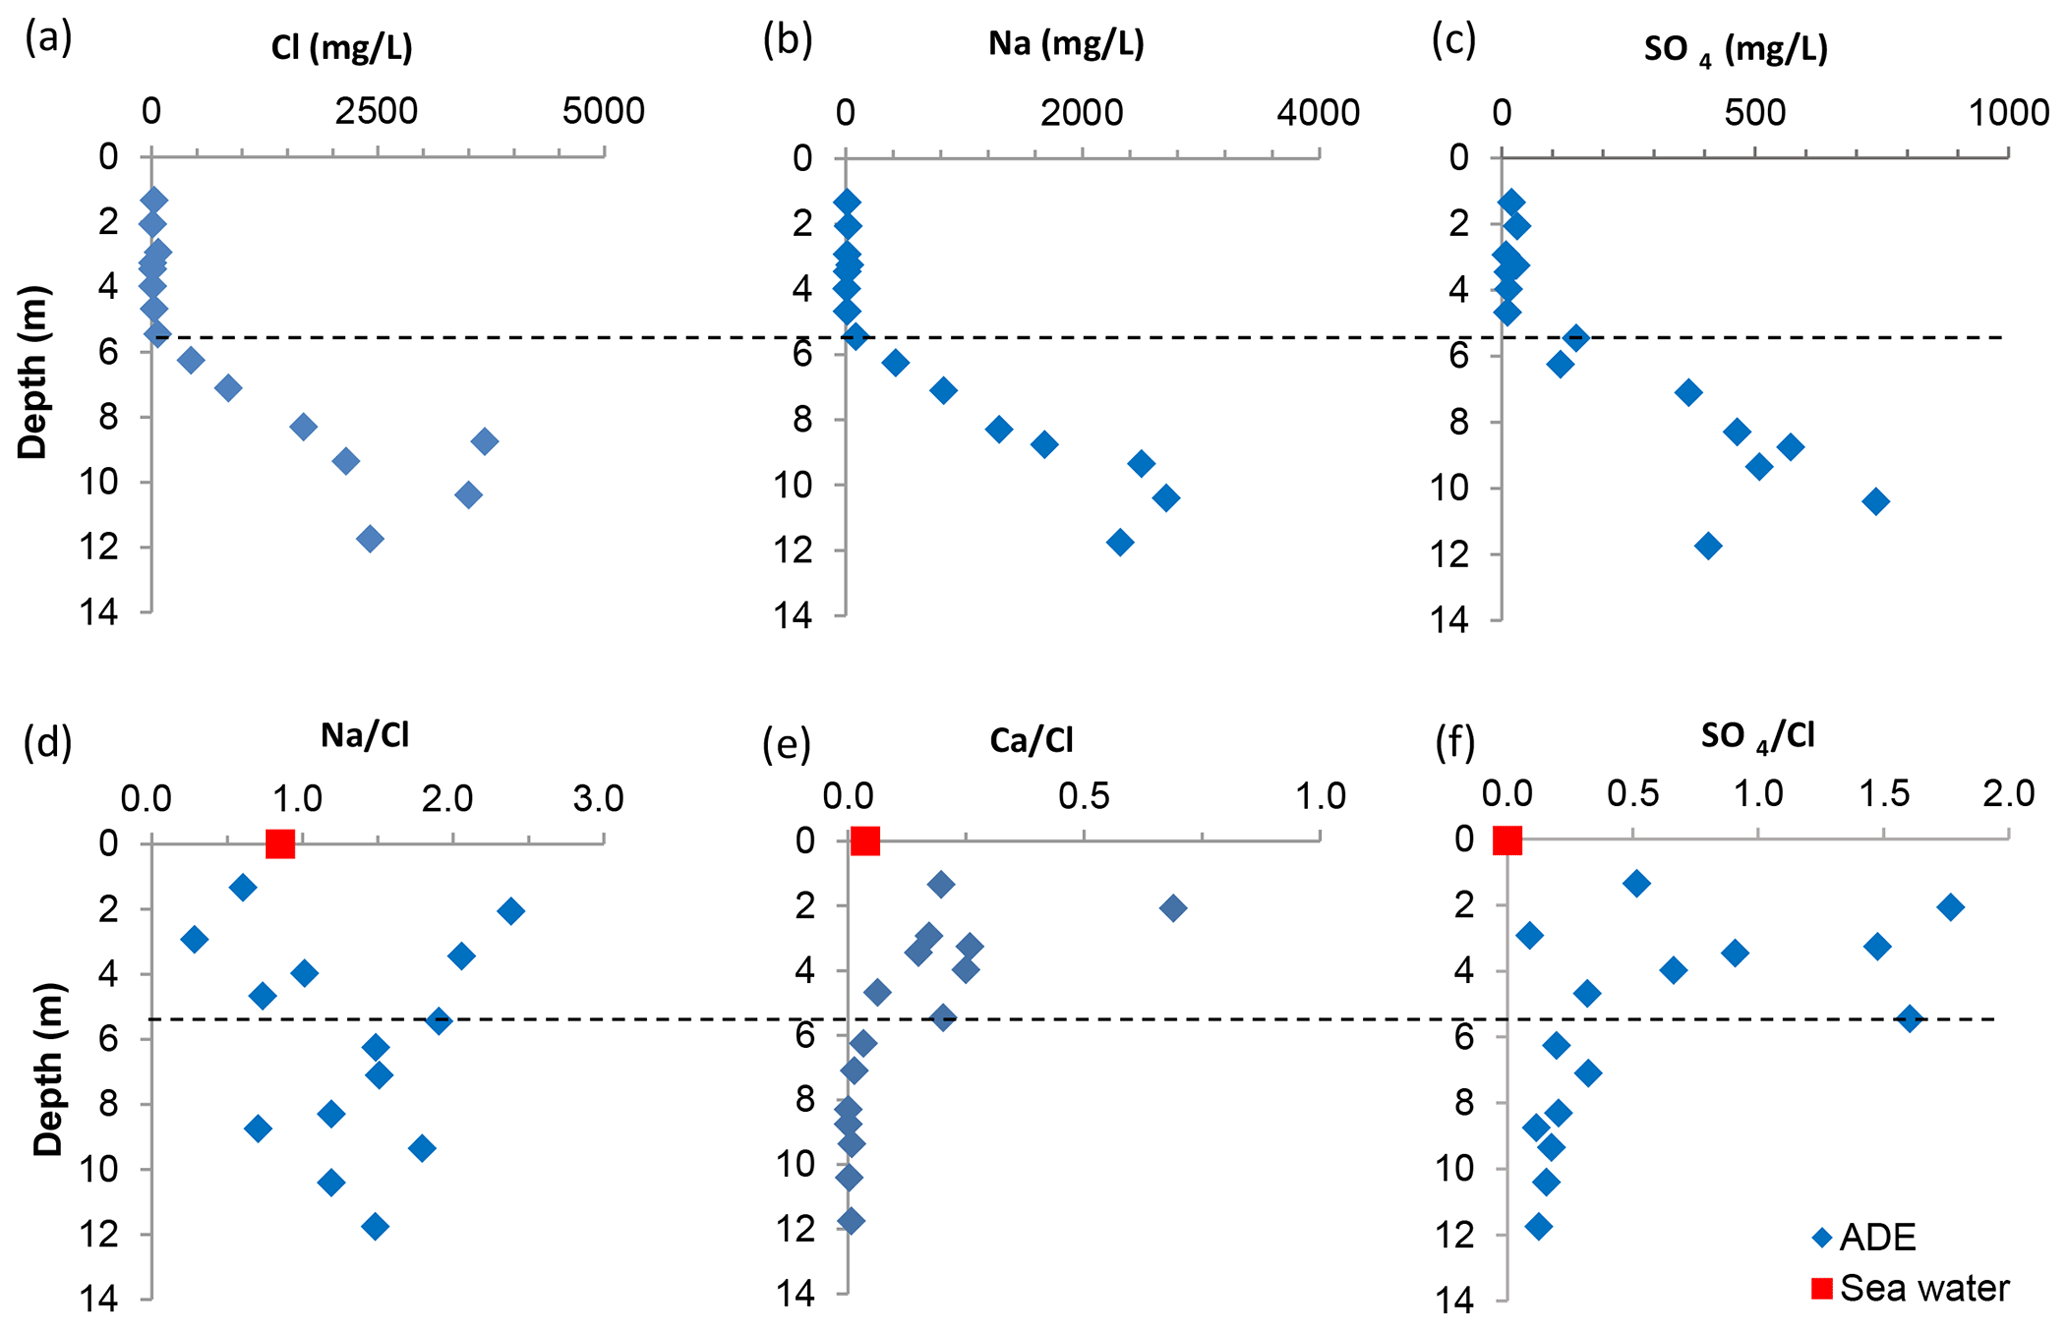
Figure 2Major element concentrations in ground ice from Adventdalen East (ADE) deep drill hole: (a) Cl−, (b) Na+ and (c) SO (in mg L−1). Panels (d)–(f) present selected equivalent ratios along the profile. The dashed line separates the syngenetic and the epigenetic permafrost (Gilbert et al., 2018).
The ionic ratio of Na2+ to Cl− in both the epigenetic and the syngenetic permafrost mostly exceeds 1 (Fig. 2d), significantly higher than in seawater (0.86), which is probably the result of sediment dissolution (e.g. of micas), since ion exchange should result in either a conservative behaviour (during freshening, as is the case in the ADE marine section) or in Na+ depletion (in the case of salinization; e.g. Russak and Sivan, 2010). On the other hand, SO4 Cl in the epigenetic permafrost is close to that of seawater (Fig. 2f), implying a relatively conservative behaviour. Nevertheless, SO4 Cl in the syngenetic part is very variable (Fig. 2f), reaching ratios as high as 2, which could be due to shale dissolution (Hindshaw et al., 2016; Cable et al., 2018). A high concentration of SO4 was also recorded in sub-permafrost (pingo) water, which was attributed to gypsum dissolution (Hodson et al., 2020). Ca Cl decreases with depth in the syngenetic permafrost and is very low (< 0.01) in the epigenetic permafrost (Fig. 2e), which is in agreement with freshening experiments in freshwater–saline water zones (Russak and Sivan, 2010). The high ratio of Ca Cl and SO4 Cl at −5.45 m depth is enigmatic and may present a paleo-active-layer–permafrost table zone where major and minor elements concentrate (e.g. Cary and Mayland, 1972; Kokelj et al., 2002), but this should be further studied.
5.1 Conceptual model
To study the rate of permafrost formation, we developed a numerical model that solves the temperature distribution in space and time and freezing front progression, i.e. the Stefan solution (e.g. Šarler, 1995). Considering low horizontal temperature variations, the problem was reduced to one-dimensional, depth-dependent heat transfer with a moving internal phase-transition boundary. Various analytical and numerical methods have been developed to obtain a stable solution of the Stefan problem (e.g. Crank, 1984). However, unlike the simple and clean single-component systems, many natural systems, including water-saturated porous rocks, change their phases under a specified temperature range rather than isothermally (Lunardini, 1988; Rühaak et al., 2015). In this case, an evolving “mushy zone” emerges, which separates between the solid and liquid regions, where the thawing or freezing begins and proceeds, accompanied by latent-heat absorbance or release (e.g. Crank, 1984; Yang et al., 2020). Following this approach, instead of the mathematical boundary, we use a narrow mushy zone where phase transition occurs (shaded area in Fig. 3), with pore space consisting of a mixture of ice and water (Rubinstein et al., 1982). The local enthalpy in the mushy zone takes values in the range of those between the pure solid and liquid, and the temperature is approximated by a constant value, T=Twft, equal to the phase-change temperature (Crank, 1984).
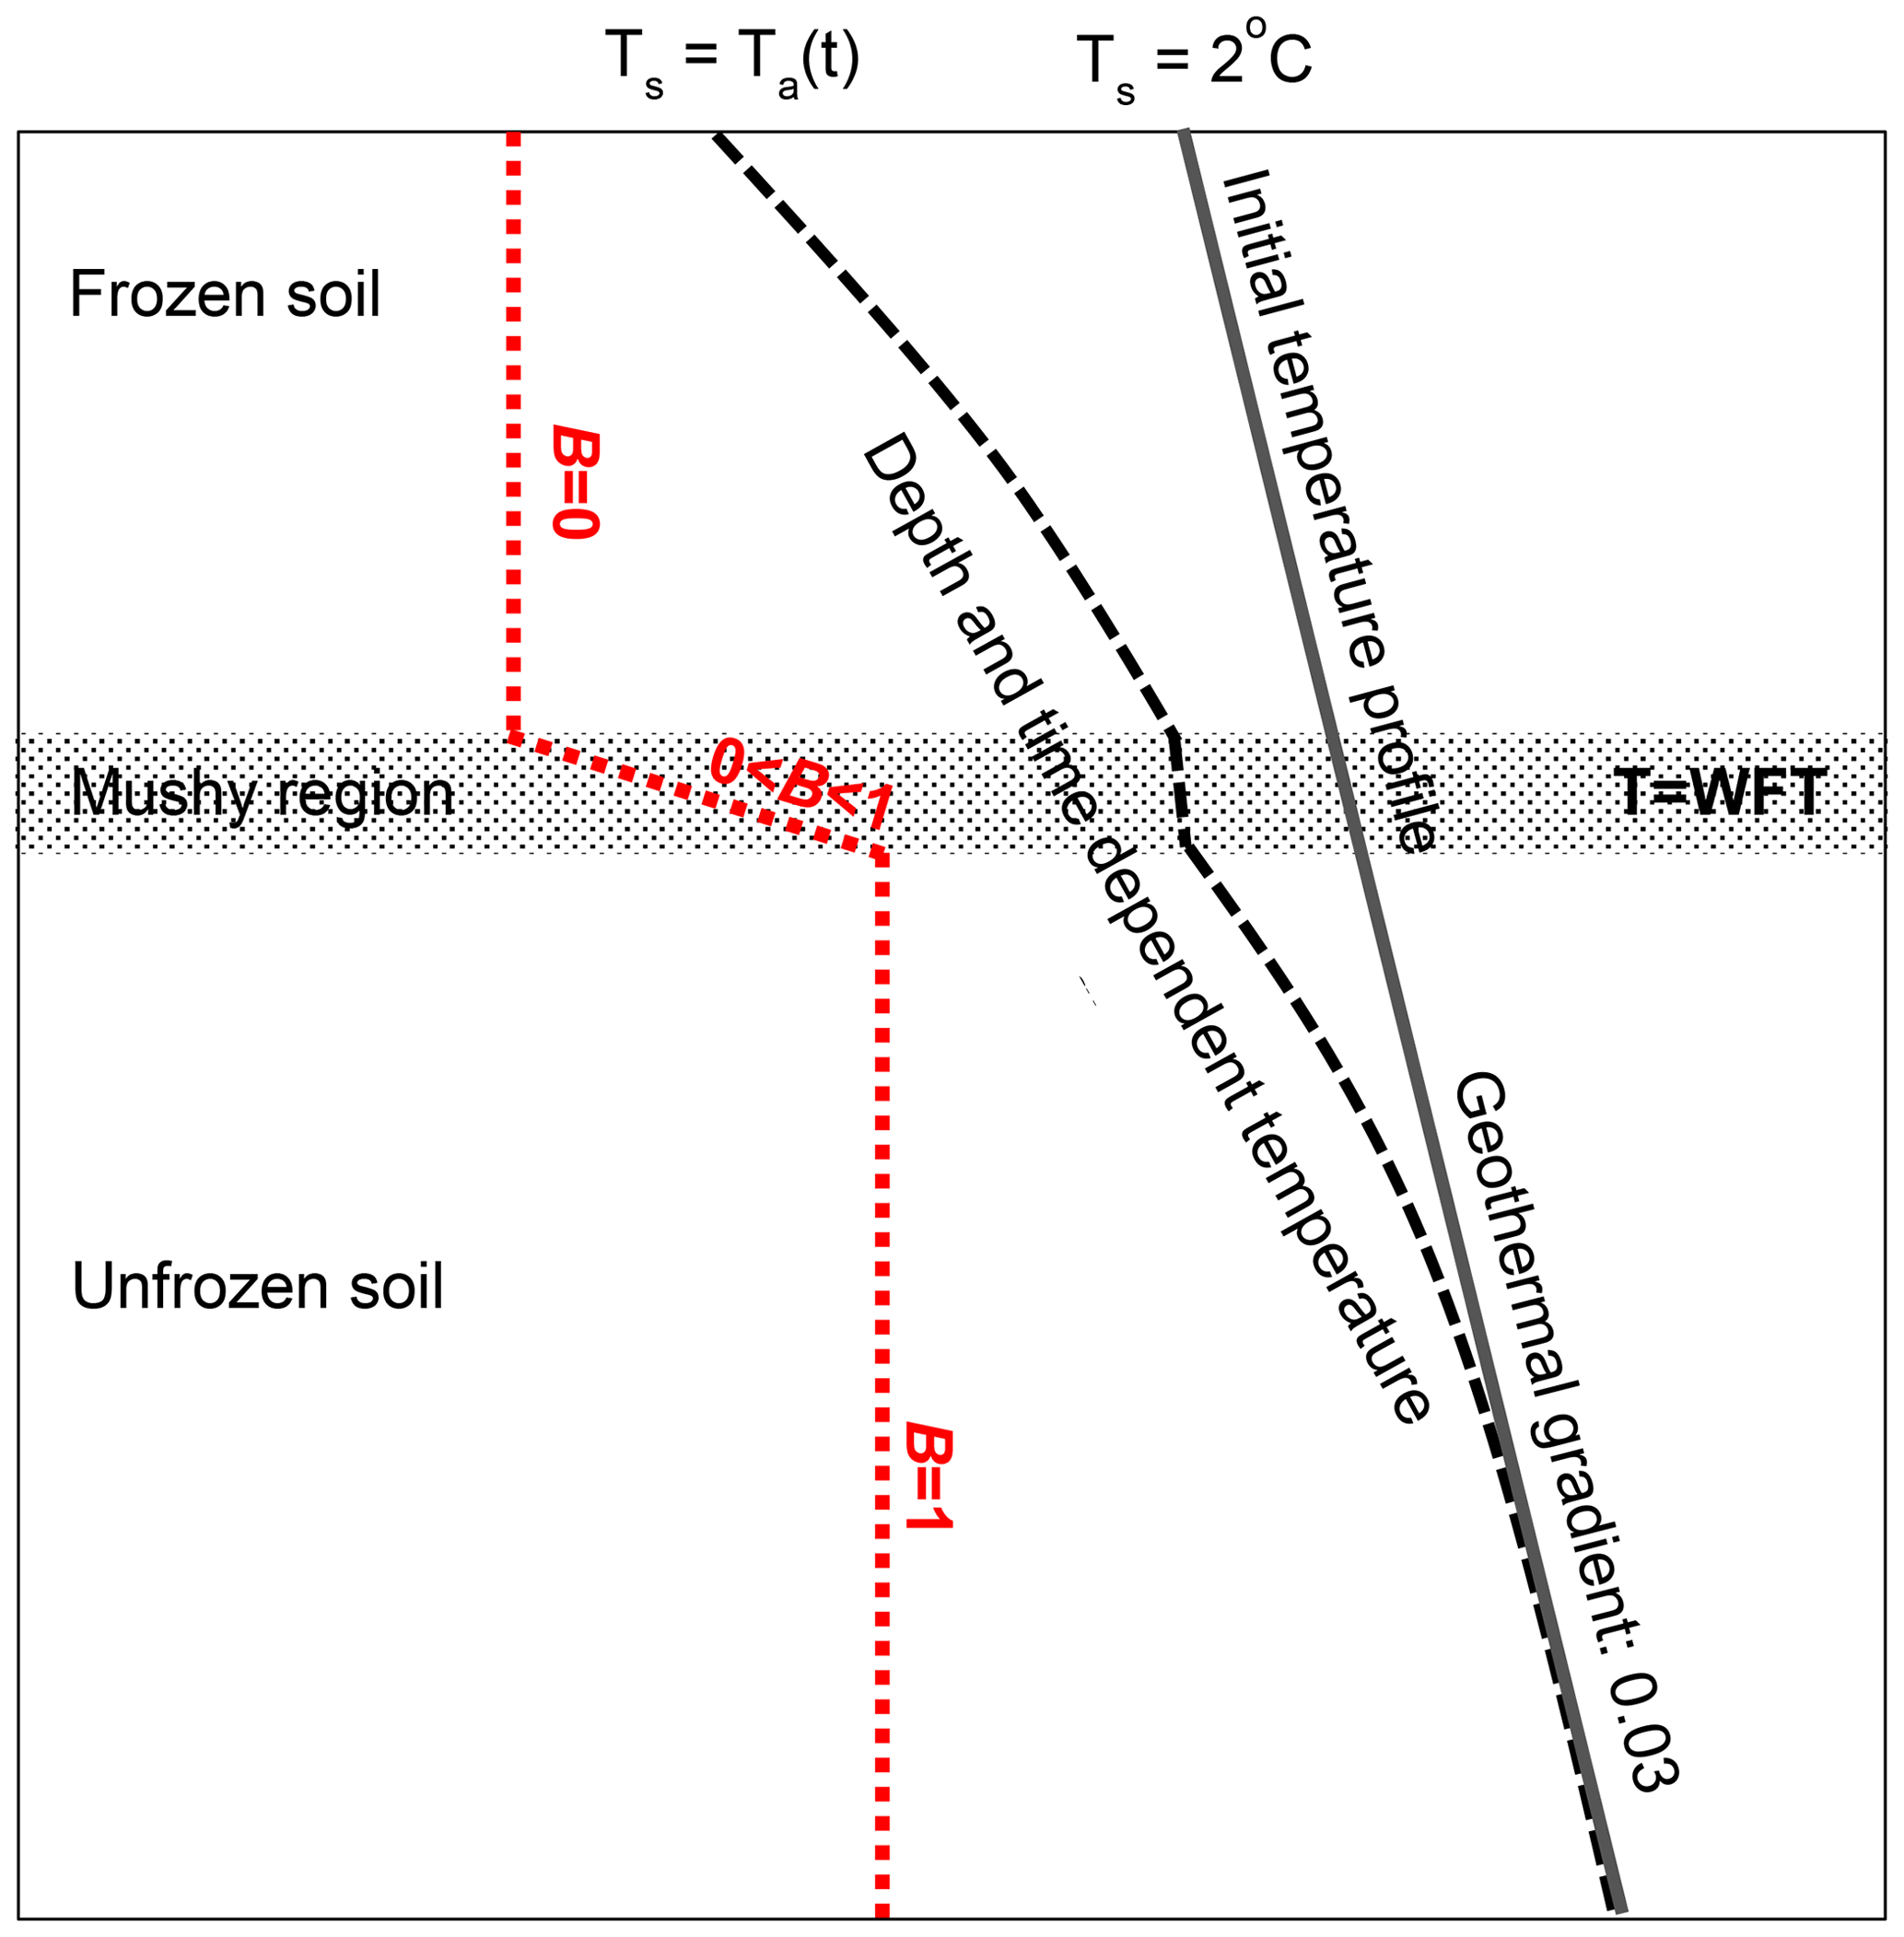
Figure 3Schematic freezing profile during the top-down (epigenetic) freezing process. Initial and developing geothermal gradients are also shown; the mushy region with constant temperature is the depth zone where phase transition occurs. The dotted line schematically represents the freezing condition, where B=0 stands for fully frozen and B=1 for liquid only. Active-layer seasonality is neglected.
Heat exchange in the sub-surface is controlled by the ground temperature gradient, as well as by the soil thermal properties (i.e. thermal conductivity; Burn, 2011). Aboveground, the main factor is the air temperature, which is measured and reported as MAAT (Luo et al., 2018; Szafraniec and Dobiński, 2020) and was taken to represent the MAGST (mean annual ground surface temperature). Initial surface temperature was defined according to the temperature of the shallow seawater during the mid-Holocene (2 ∘C; Rasmussen et al., 2012), while the initial temperature profile (solid black line in Fig. 3) was defined using the regional-average geothermal gradient of 0.033 ∘C m−1, as discussed by Olaussen et al. (2019) and Betlem et al. (2018). The lower boundary of the model was set at 300 m depth, with temperature of 12 ∘C according to the initial temperature distribution. Throughout the simulation, we searched for the depth- and time-dependent temperature distribution T(z,t), schematically shown as a dashed line in Fig. 3.
Several MAAT values were used for the modelling: (1) the current −5.8 ∘C (measured at the Adventdalen “Polygons” site; Christiansen, 2005), 7 km from the fjord; (2) −4 ∘C, which was taken from climate simulation models for the mid-Holocene (Park et al., 2019; see also Mangerud and Svendsen, 2018; van der Bilt et al., 2019); and (3) −3 and 0 ∘C assumed by Humlum (2005) for the mid-Holocene. We present simulations for −4 ∘C and with 0 ∘C as an extreme high value. While snow may cause differences between MAAT and MAGST due to thermal insulation (Zhang, 2005), it was found that in western Svalbard, specifically in the flat landforms at Adventdalen, the differences between MAAT and MAGST are less than 0.5 ∘C (Christiansen, 2005; Lüthi, 2010; Etzelmüller et al., 2011; Farnsworth, 2013). Therefore, MAAT was taken to represent MAGST. The amplitude of seasonal temperature oscillation at the surface was set to 12 ∘C, similar to the current fluctuation (Nordli et al., 2014; Christiansen, 2005; Osuch and Wawrzyniak, 2017).
To distinguish between a frozen and water-saturated cell, we defined a time- and depth-dependent freezing ratio, B(z,t), shown by the dotted line in Fig. 3. B=1 means that the soil is water-saturated, while in the case of B=0 pore space is fully ice-saturated. In the mushy zone (shaded area in Fig. 3), the B value changes between 0 and 1, and the rate of its change defines the amount of energy or latent heat associated with water–ice phase transition. Since it is now well established that permafrost is not necessarily fully frozen (e.g. Keating et al., 2018; Oldenborger and LeBlanc, 2018; see Table 1), we also investigated permafrost aggradation under “partial-freezing” conditions of 25 % and 50 %. Note that our model assumes fully saturated pore-water conditions since freezing starts at sea level soon after exposure; therefore the groundwater level is expected to be at the surface.
Another factor affecting the rate of permafrost formation is the water freezing temperature (hereafter: WFT), which varies with salinity (Morgenstern and Anderson, 1973), as well as due to other environmental factors (Farouki, 1981; Morgenstern and Anderson, 1973). Since salinities at the ADE site down to 12 m do not exceed 15 % that of seawater, freshwater freezing temperature is the most appropriate for our simulations. Nevertheless, we also conducted simulations with a WFT of −2 ∘C, which is close to that of seawater (Tm = −1.9 ∘C; Bodnar, 1993; Marion et al., 1999), as well as with −4, −5 and −6 ∘C, following the reports of Gilbert et al. (2019) and Tavakoli et al. (2021) about high salinities (up to 73 ppt) in cryopegs in Adventdalen.
For simplicity, thermal conductivity was calculated considering three major components, namely water, ice and dry sediments. While the thermal conductivities of water and ice are well defined (0.569 and 2.24 W m−1 K−1, respectively; e.g. Williams and Smith, 1989), the range of conductivity values for dry sediment in the literature is large, from 0.25 for peat to 7.6 W m−1 K−1 for sand, depending mainly on quartz content, water content and other factors (Farouki, 1981; Williams and Smith, 1989; Cosenza et al., 2003; Balland and Arp, 2005; Zhang and Wang, 2017; He et al., 2021). We decided to use the value of 3 W m−1 K−1 for the mineral fraction of the sediment (e.g. Overduin et al., 2019).
Porosity is an important factor in the aggradation or thawing of permafrost (Hornum et al., 2020). It determines both the amount of heat released or required during freezing and thawing and the thermal characteristics of the soil. Porosity of sediments at ADE was mainly set to its average value, 0.3 (Gilbert et al., 2018), although we also tested the effect of other porosity values (Appendix A). Bedrock (≥ 25 m depth) porosity was taken to be 0.1, the value suggested by Hornum et al. (2020), assuming that the bedrock is mainly composed of fractured shales (Benn and Evans, 2014; Grundvåg et al., 2019).
Freezing temperature and degree of freezing were kept uniform in each of the simulations, although as pore water freezes, the remaining fluid becomes saltier, further lowering the freezing temperature of the remaining solute (Herut et al., 1990), such that fully frozen pore space (i.e. 100 % freezing) can only be reached at extremely low temperatures, which are not relevant to our study sites, as well as to most other permafrost areas (Homshaw, 1980; Dobinski, 2011).
The 1-D freezing model provides a good approximation of freezing rate and permafrost aggradation, as shown by many studies (e.g. Harada and Yoshikawa, 1996; Kukkonen and Šafanda, 2001; Farbrot et al., 2007; Etzelmüller et al., 2011; Hornum et al., 2020). Such models actually provide the maximum rates of freezing propagation, as lateral heat transport by groundwater flow is neglected. Neglecting lateral heat transfer is quite justified, considering that (1) upstream shallow groundwater arrives from areas that were exposed earlier and therefore should not be warmer than the ADE groundwater, and (2) experimental data suggest that a temperature drop by a tenth of a degree below 0 ∘C reduces the hydraulic conductivity by several orders of magnitude (Burt and Williams, 1976; Rühaak et al., 2015). Nevertheless, as stressed above, soon after freezing initiates, the hydraulic conductivity dramatically decreases, and the impact of lateral flow can be neglected.
5.2 Mathematical formulation
The heat conduction equation for time- and depth-dependent temperature profile, T(z,t), is (Crank, 1984)
where Q is the energy sink or source, representing the latent heat associated with water–ice phase transition; ρ is the soil density; Cp is the specific heat capacity; and K is heat conductivity. The depth- and time-dependent material properties were calculated assuming linear superposition of the soil, water and ice properties (e.g. Lunardini, 1988). Thus, the depth-dependent density, heat capacity and thermal conductivity were calculated using the porosity, θ, and freezing ratio, B(z,t):
The thermal properties and density used for all system components (soil, ice and water) are listed in Table 2.
Table 2Physical parameters of water, ice and sediment of the 1-D heat transfer model.
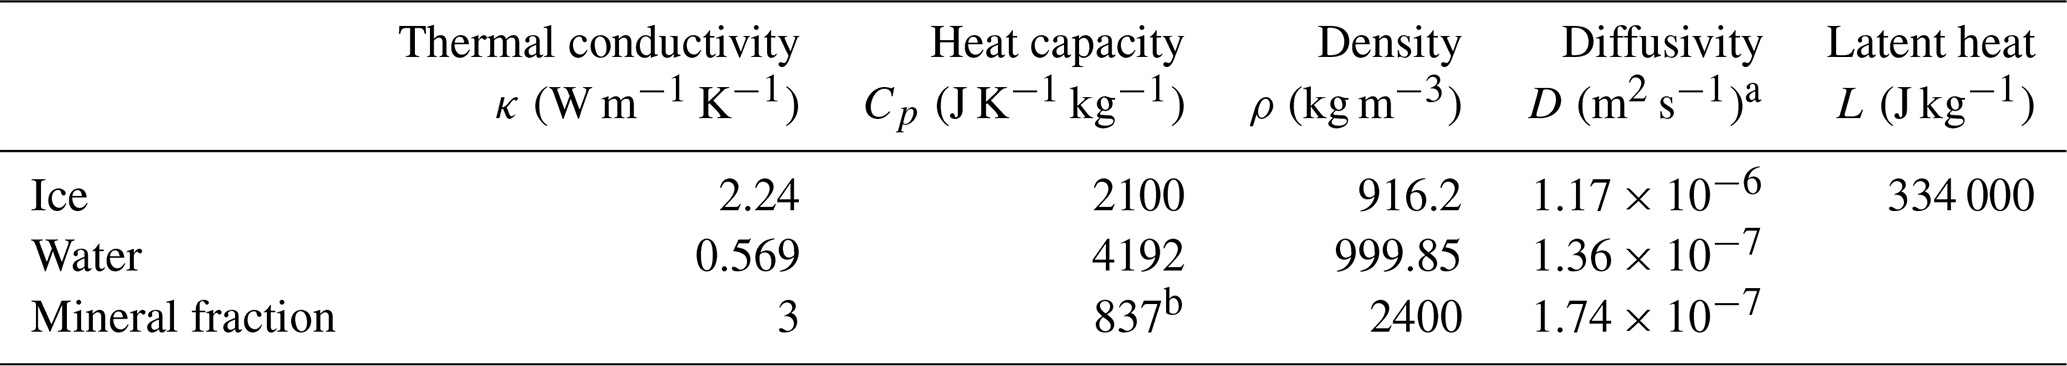
a . b Value refers to saturated pore space without air.
Out of the mushy zone, for either B = 0 or B = 1 (unfrozen sediments), the heat exchange leads to its cooling below or heating above the freezing temperature. When no latent heat is involved, assuming homogeneous heat conductivity, the heat conduction equation (Eq. 1) is reduced to
where D (diffusivity) (m2 s−1) is defined as
In the mushy zone, where the water–ice phase transition occurs, both the B value and the thermal properties (Cp and K) are depth-dependent. Accordingly, the complete heat conduction equation (Eq. 1) is solved, including the latent-heat term. The heat source (sink) is equal to the mass of the freezing (thawing) water per unit time multiplied by the latent heat, L. The water mass is equal to the rate of the B-value change times porosity and density. Finally, the source term is
We neglected the kinetics of the phase transition and assumed that thermodynamic equilibrium is established instantaneously in the mushy zone. This means that the rate of freezing or thawing is defined by the heat flux to and from the mushy zone with 0 < B < 1. Substituting Eq. (4) into Eq. (1) and using leads to
The above equations are solved numerically for two functions, T(z,t) and B(z,t), using the explicit-in-time finite-difference scheme. These functions were approximated using the constant grid steps in depth Δz and in time Δt:
where n is the grid point number (z=nΔz), and m is the time step number (t=mΔt). With this notation, the finite-difference form of the heat conduction equation (Eq. 1) is
where density and the thermal properties are calculated using Eq. (2).
Equation (6) is solved using a time step of Δt = 10 800 s (i.e. 3 h) and a depth spacing of Δz=0.25 m. The solution was obtained for the model size down to 300 m depth, summing up to 1200 grid points. These numerical parameters satisfy the von Neumann stability condition for the explicit-in-time numerical scheme (e.g. Ames, 1977) for the material properties of Table 2. The numerical code was written with Python (McKinney, 2012). It allows simulation of the permafrost dynamics and sub-surface sediments freezing under various scenarios of MAAT, water freezing temperatures (WFTs) and freezing extent of pore-space water.
5.3 Model results
We present the results of model runs with various combinations of surface temperature, water freezing temperature, and sediments porosity and thermal conductivity. Complementary modelling results are presented in the Appendix A (Figs. A1–A4). In all cases, simulations started in the spring (May) and maintained an amplitude of 12 ∘C around the chosen (fixed) MAAT.
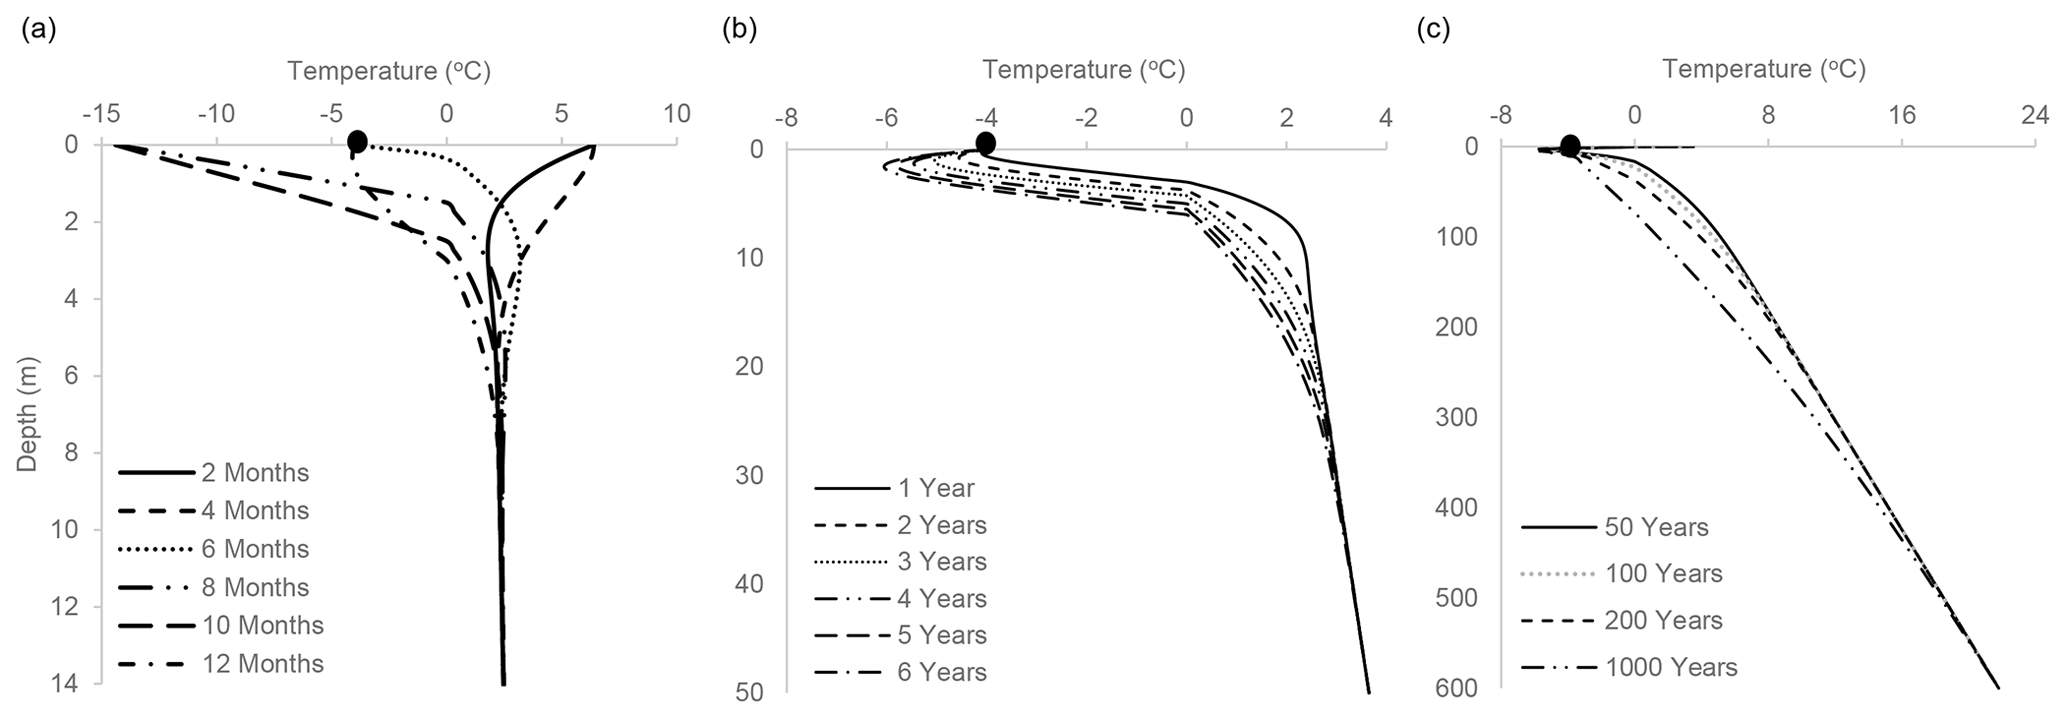
Figure 4One-dimensional freezing model results for (a) 1 year. The model starts (and finishes) in spring (defined as halfway between minimum and maximum surface T; e.g. May), followed by a summertime increase in temperature (solid and dashed lines), cooling and start of freezing during fall (dotted line; e.g. November), and colder winter months (two-point dashed line and wide dashed line). It then concludes in the spring (one-point dashed line). (b) Results for 6 years (starting in spring). (c) Results for 50 to 1000 years. MAAT of −4 ± 12 ∘C, WFT set at 0 ∘C, 100 % freezing. Full black circles denote −4 ∘C. Note the different scale between (a), (b) and (c).
We first present simulations with a MAAT of −4 ± 12 ∘C, WFT of 0 ∘C and complete (100 %) freezing. Figure 4a presents results of a 1-year simulation, with temperature profiles shown every second month. The model suggests that freezing under these conditions can reach down to 3 m within the first year. The freezing depth increases to 6 m within 6 years, with a slight but significant deepening of the inflection point (Fig. 4b). After 50 years, freezing arrives at 16–17 m, and within 1000 years the freezing front is already at 73 m (Fig. 4c), within basement rocks (considering that sediment cover at ADE is ca. 25 m). The depth affected by cooling also progresses with time (< 50 m in 50 years, > 150 m in 1000 years), and the T profile approaches linearity.
Lowering the WFT results in a decrease in the freezing rate. For example, with a WFT of 0 ∘C the freezing front will reach 23 and 37 m after 100 and 200 years, while with a WFT of −2 and −4 ∘C it will reach 15 and 20 m and 5.5 and 6.5 m during the same periods, respectively (Fig. 5). A thin layer of permafrost may aggrade even under a WFT of −5 ∘C, which is lower than the MAAT of −4 ∘C. The freezing front will reach 2.5 m, resulting in 0.5 m of permafrost, considering a hypothetical, conservative, 2 m thick active layer for the high temperatures of the mid-Holocene, which is deeper than present (Humlum et al., 2003; Weinstein et al., 2019). This is because the thermal conductivity of ice is higher than that of water (Farouki, 1981), which results in a deeper advance of the winter freezing front (through ice) than the advance of summer thawing (through water). Last, with a WFT of −6 ∘C (i.e. significantly lower than the MAAT), there is no apparent permafrost aggradation (not shown).
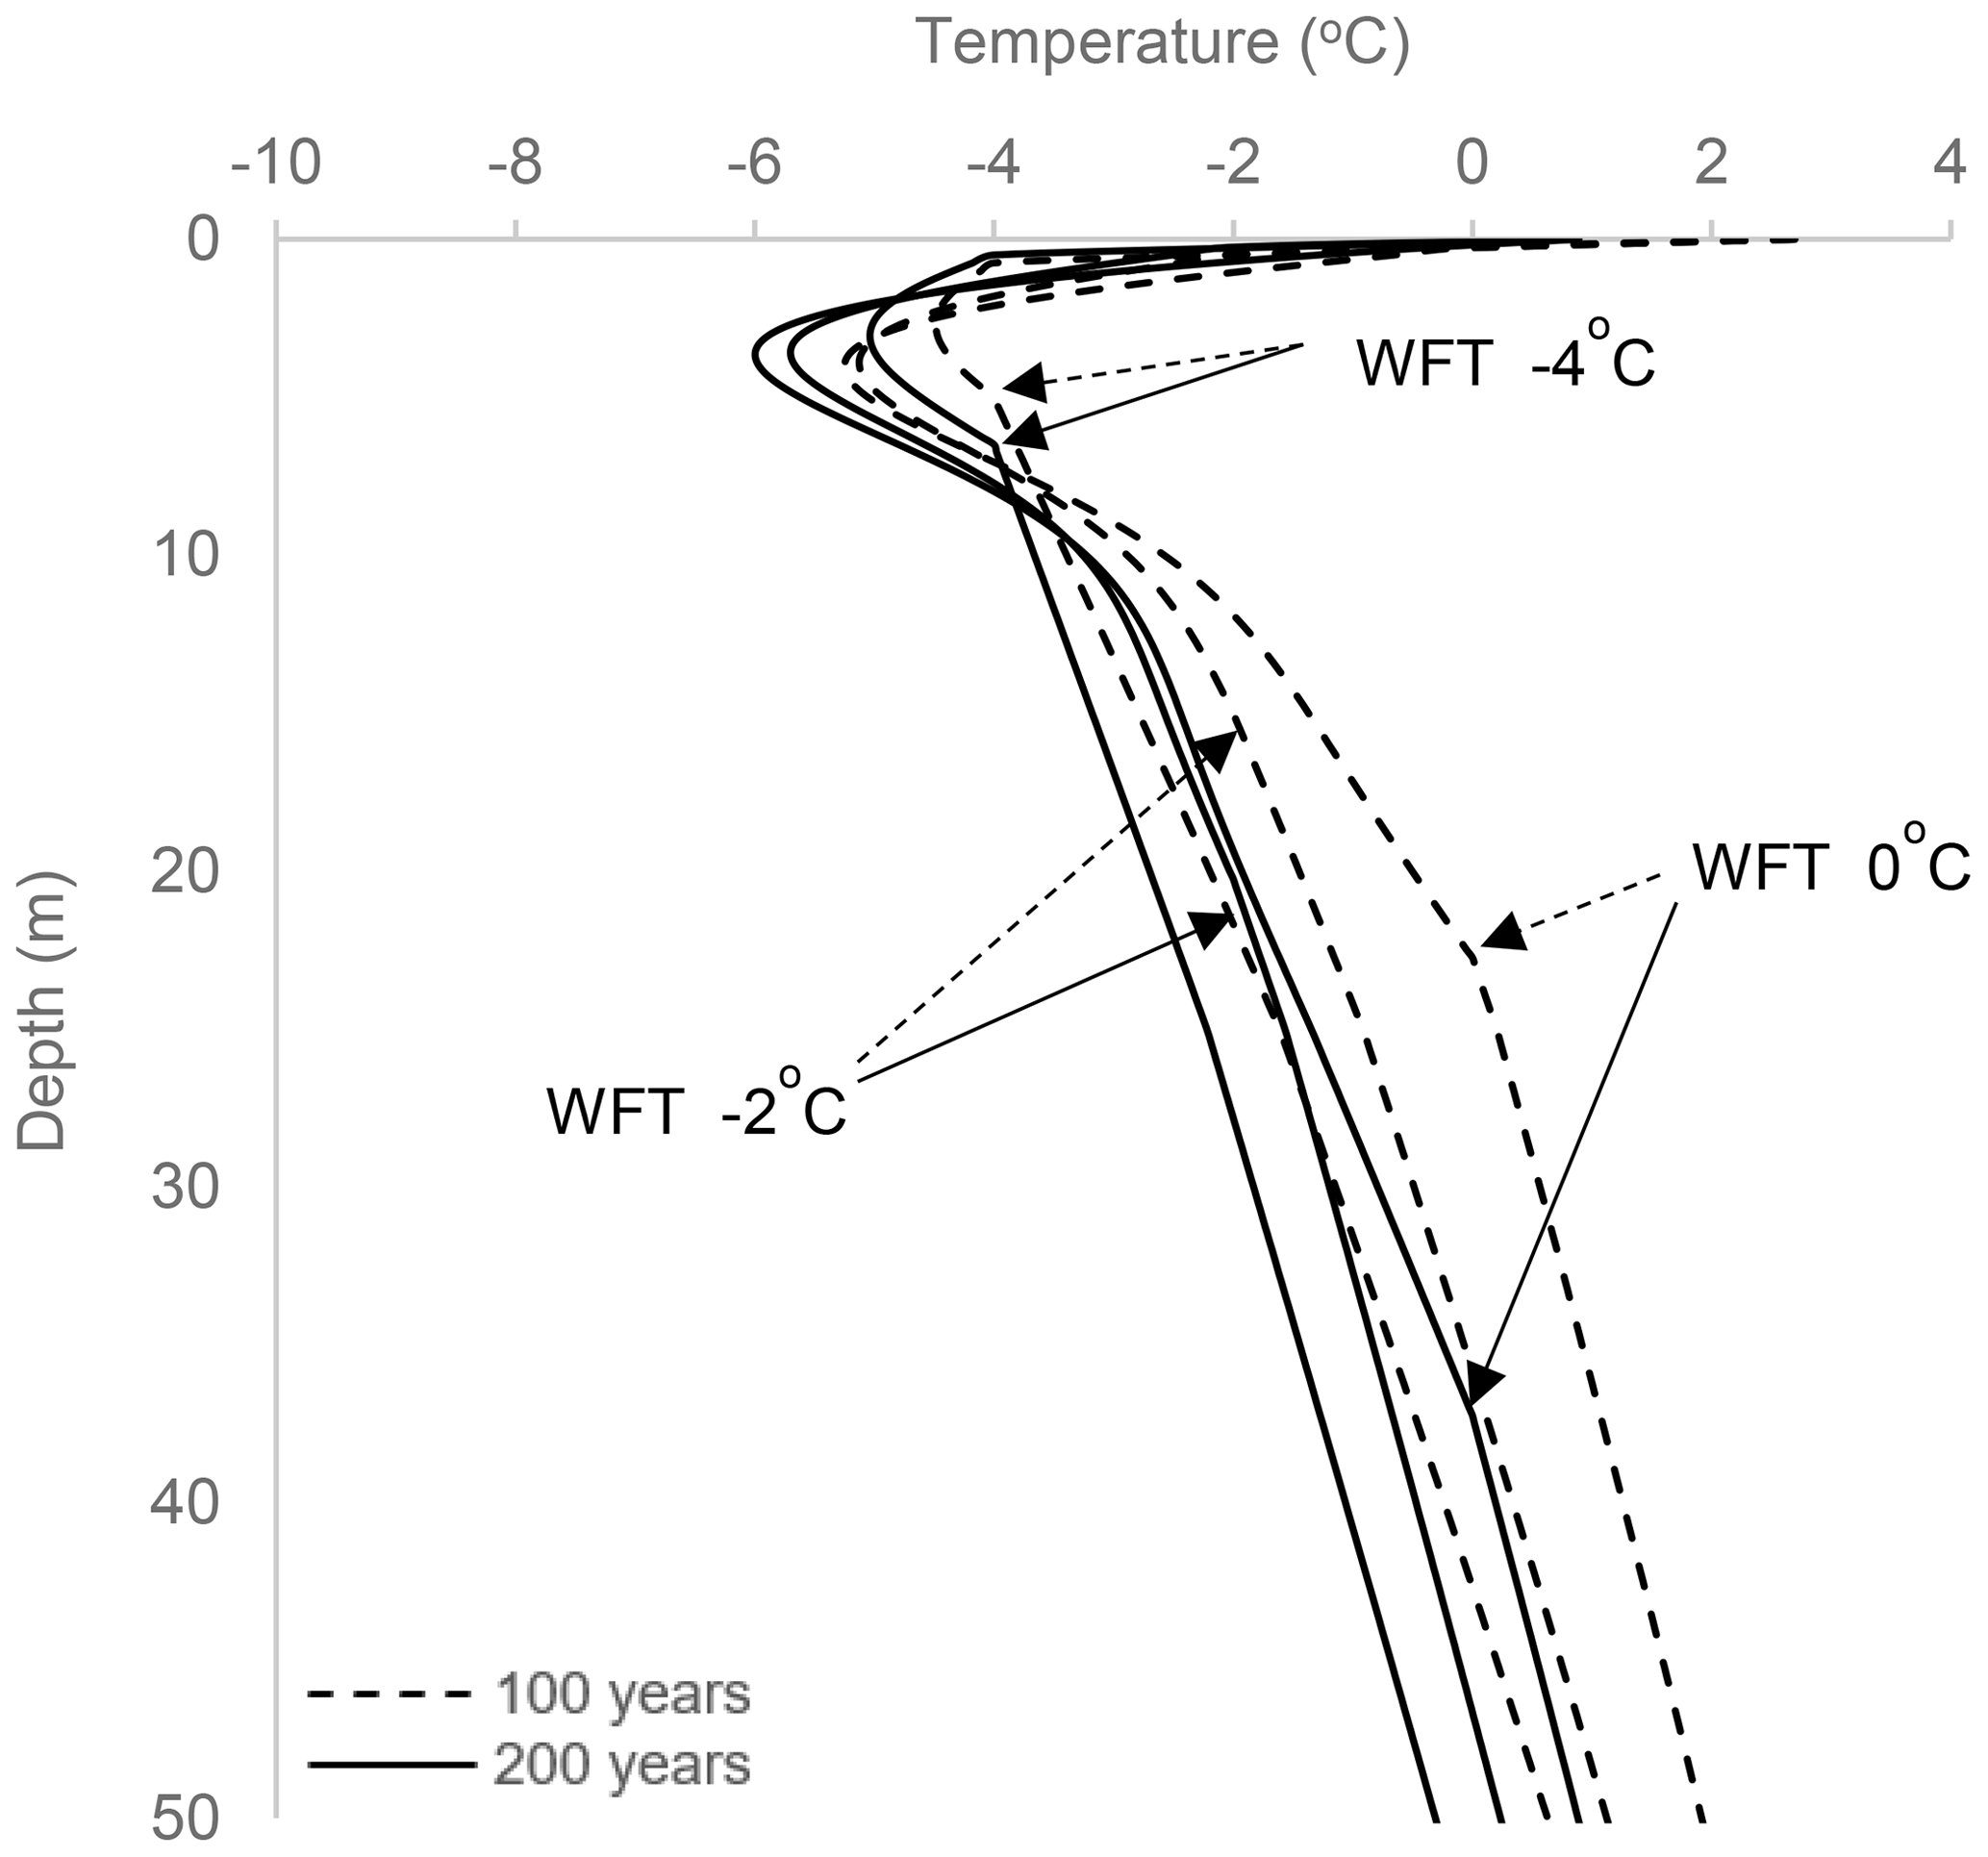
Figure 5Results of 1-D freezing simulations with mid-Holocene MAAT of −4 ± 12 ∘C (Park et al., 2019). Pore-water freezing temperature (WFT) taken to be 0, −2 and −4 ∘C. Simulations were run for 100 and 200 years.
In Fig. 6, we examine the effect of partial freezing. Partial freezing (25 % and 50 % in our scenarios) results in deepening of the freezing depth, but differences are relatively small for a WFT lower than 0 ∘C. With a MAAT of −4 ∘C and WFT of 0 ∘C, after 200 years freezing depth will reach 37, 42 and 45 m with 100 %, 50 % and 25 % freezing, respectively. Lowering the WFT to −2 ∘C, freezing depth is indifferent to the freezing degree (Fig. 6). This is because of the trade-off between reducing latent heat and the lower thermal conductivity of the partially frozen pore space. With a WFT of −4 ∘C, under 100 % freezing 6.5 m of permafrost will aggrade after 200 years, while with partial-freezing scenarios it will aggrade to 3.25 and 4.25 m for 50 % and 25 %, respectively (Fig. 6). With a WFT of −5 ∘C a thin layer of permafrost may aggrade under the 100 % freezing scenario (0.5 m, not shown), while with partial freezing of 25 %–50 %, it will not aggrade (i.e. no permafrost will develop, assuming an active-layer depth of 1–2 m), which further suggests that when WFT is lower than the average MAAT (−4 ∘C), aggradation is controlled by the ice thermal conductivity rather than by latent heat.
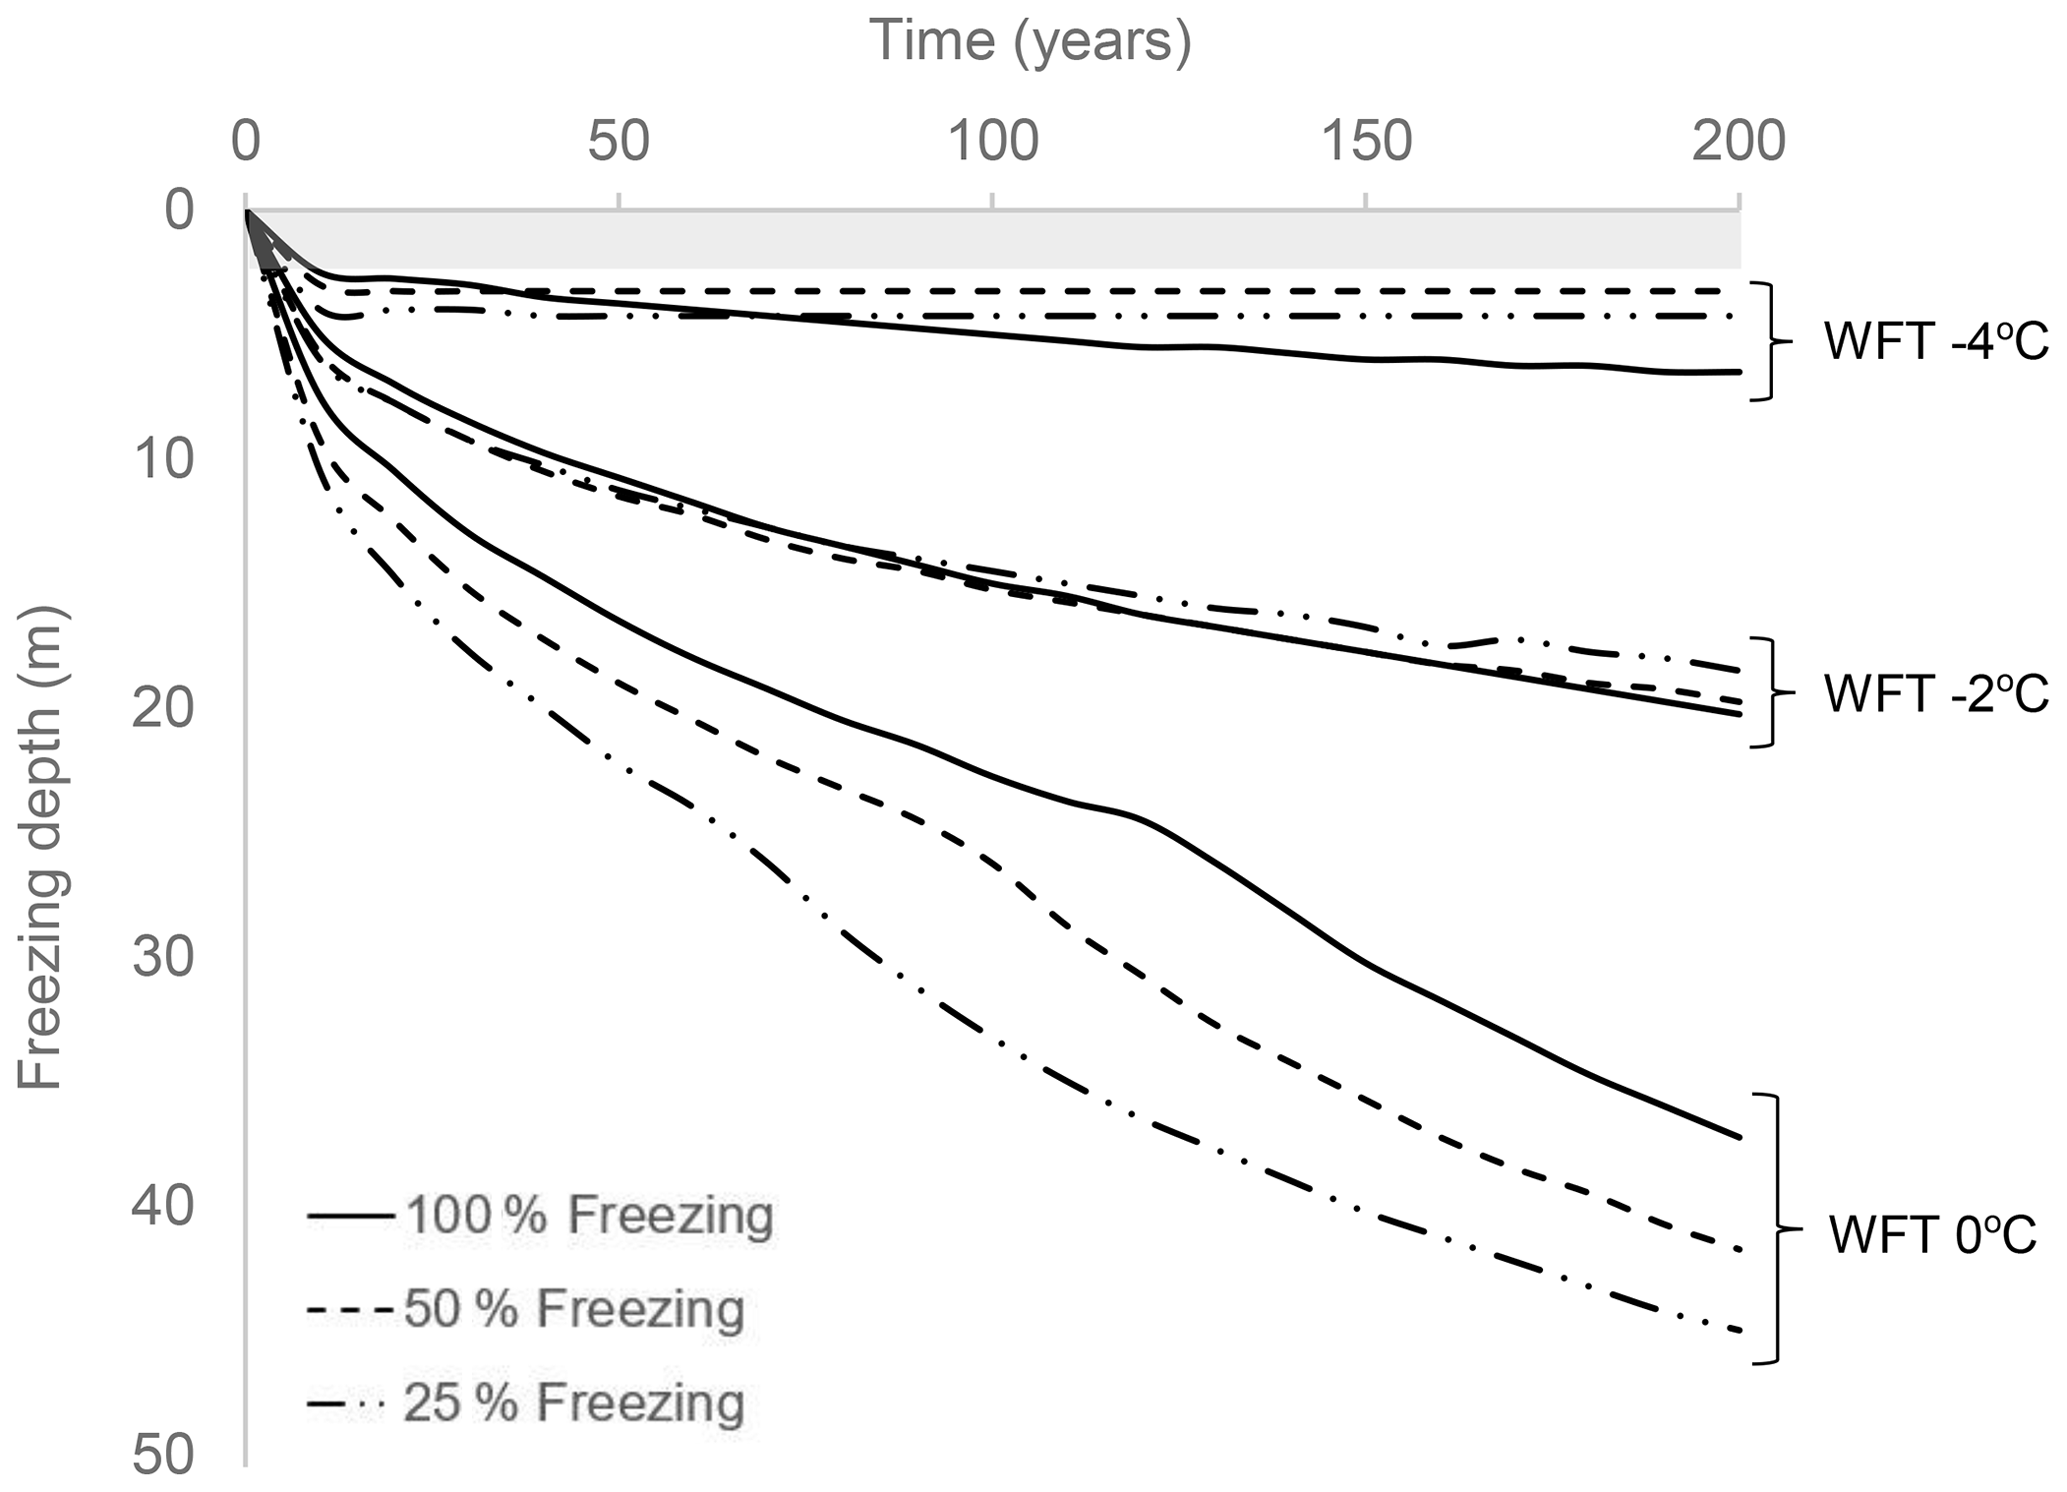
Figure 6Mid-Holocene permafrost aggradation with variable freezing degrees. MAAT was set to −4 ∘C (Park et al., 2019), and freezing proportions were taken to be 100 %, 50 % and 25 %. The shaded greyish zone represents a hypothetical, conservative active layer, which is taken to be 2 m thick. We note that the active layer in Adventdalen is usually ≤ 1 m, and 2 m was chosen due to the higher temperature during the mid-Holocene.
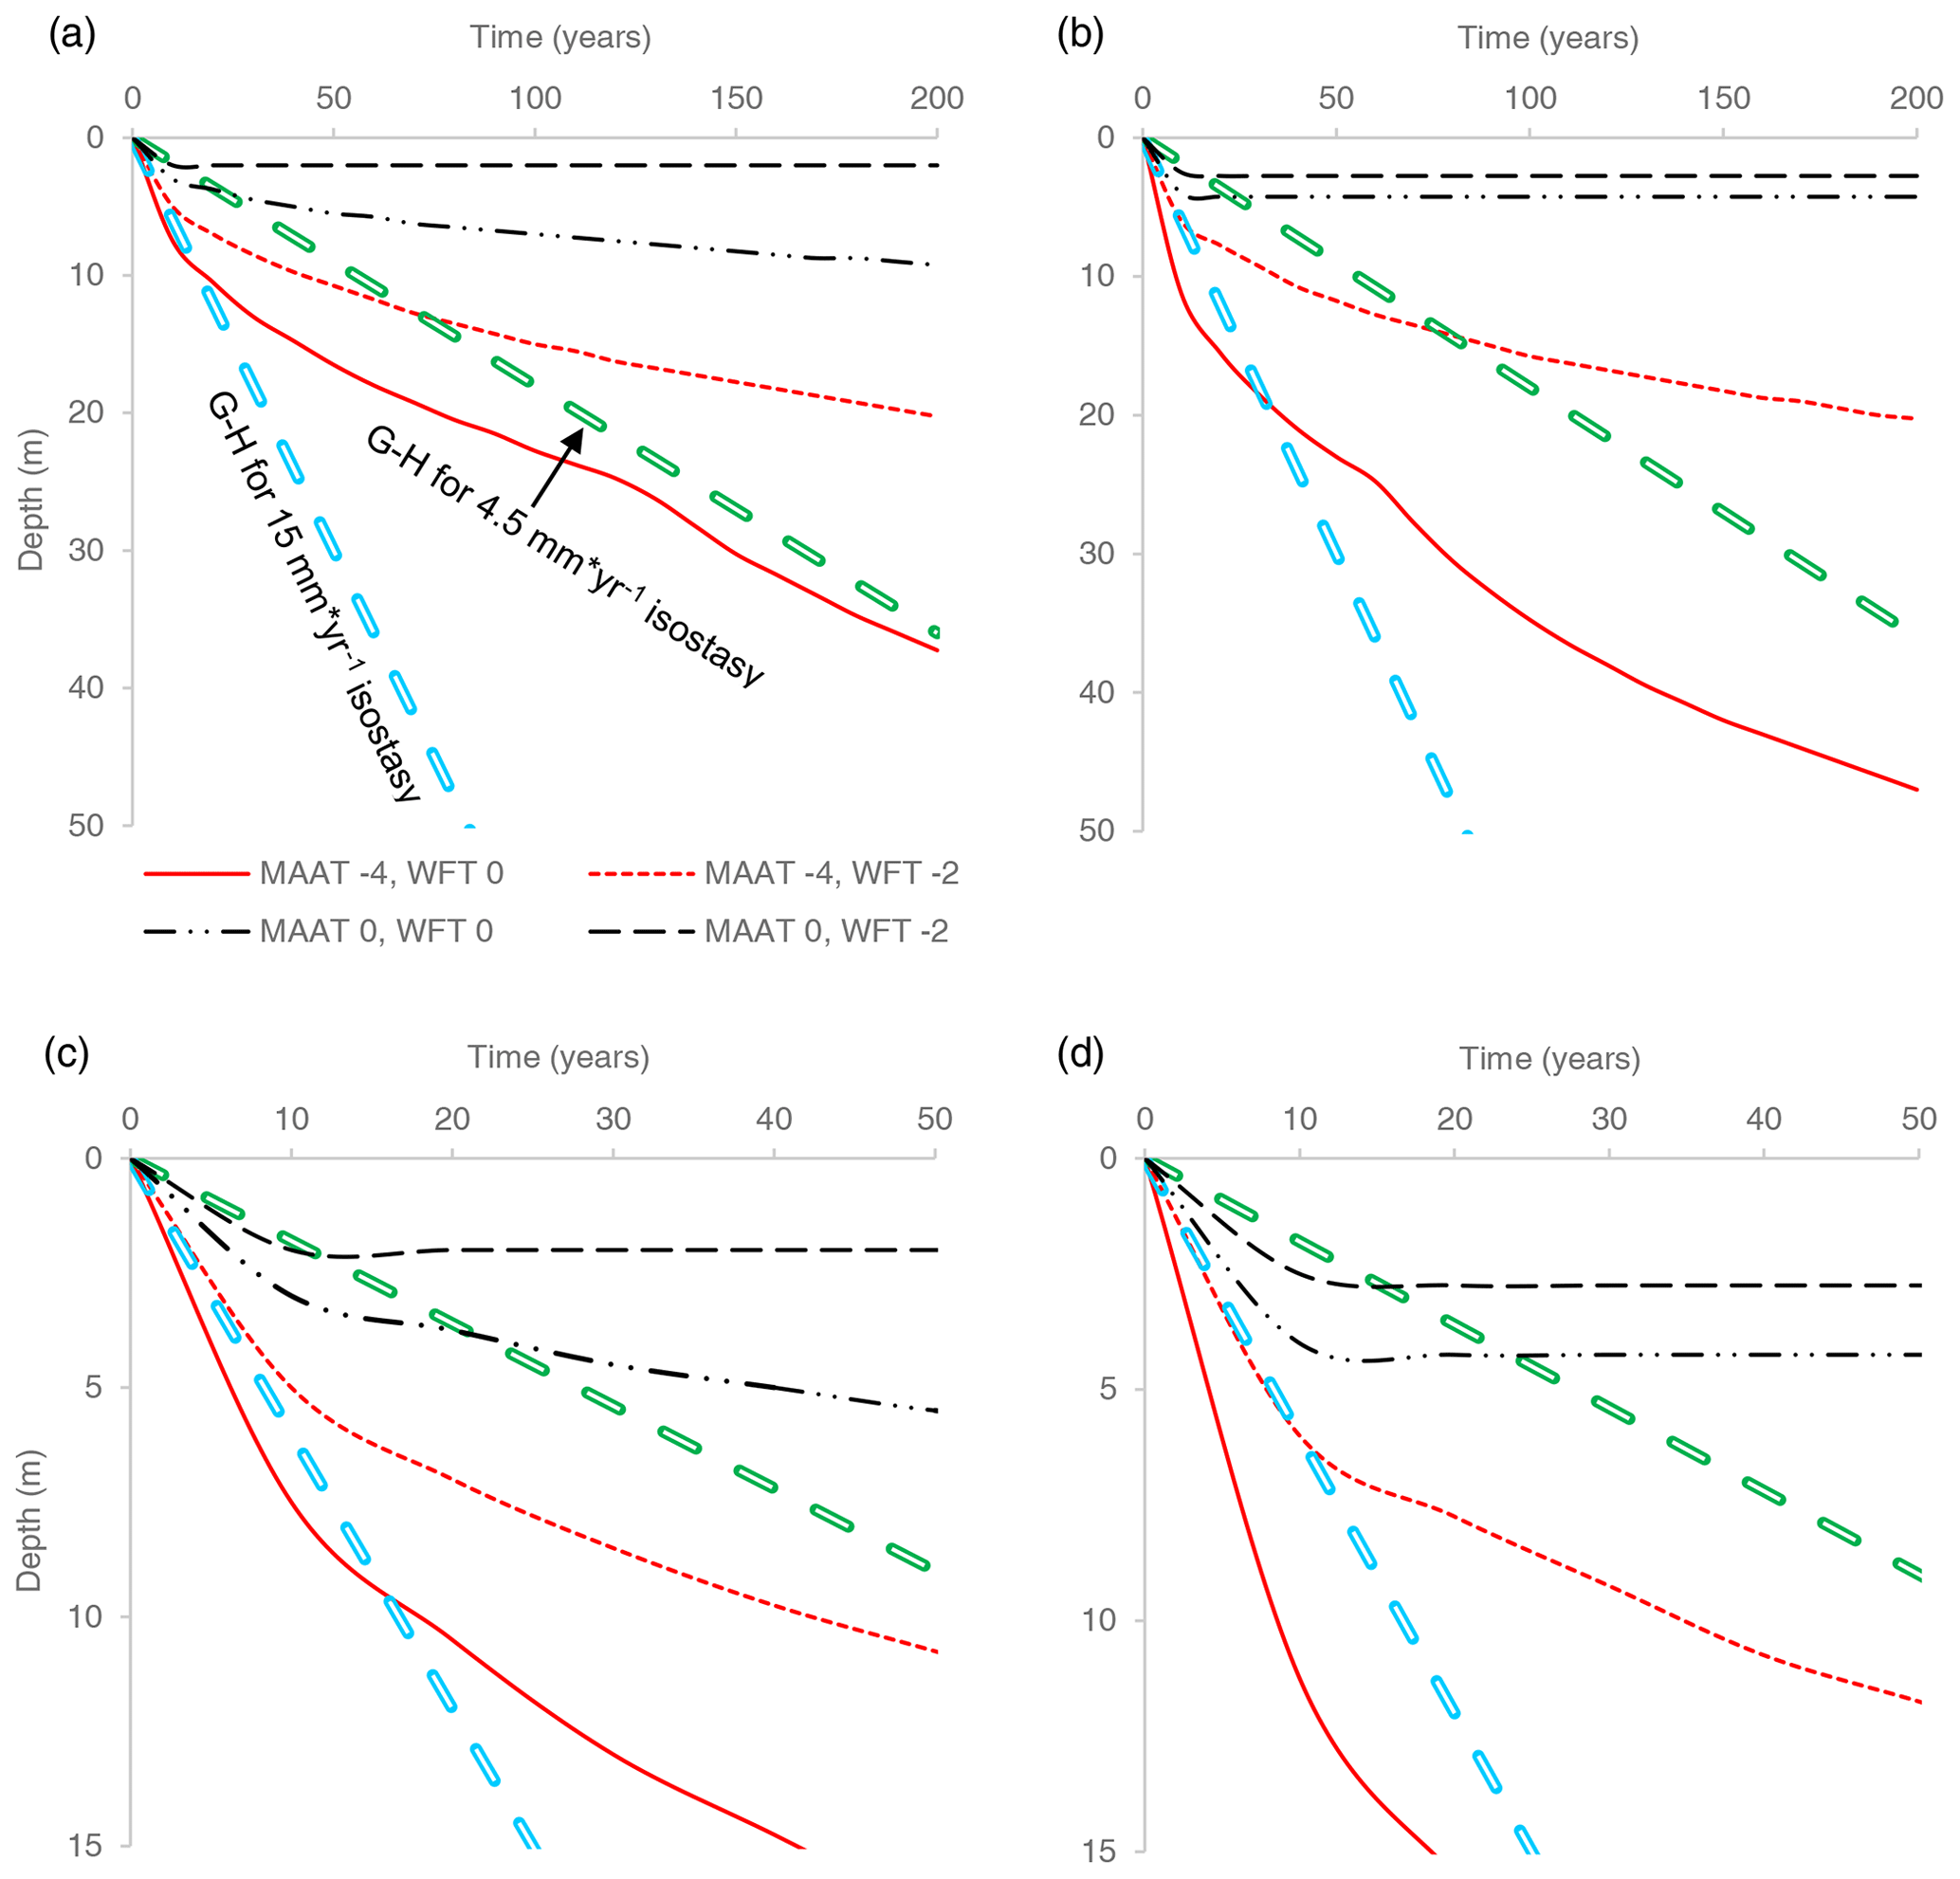
Figure 7Early and mid-Holocene freezing depth in the first 50 and 200 years with a MAAT of −4 and 0 ∘C and WFT of 0 and −2 ∘C: (a) 100 % freezing, (b) 25 % freezing. Also shown are curves of two scenarios of corresponding depths of the freshwater–saline water interface, using a 1 : 40 Ghyben–Herzberg (G–H) approximation for isostasy of 4.5 and 15 mm yr−1. See text for more details. Panels (c) and (d) are close-ups of (a) and (b) for the first 50 years. The fast deepening in (a) and (b) is due to the change in porosity as the freezing front reaches the bedrock (25 m). The legend is the same for all panels.
In general, higher MAAT results in a lower aggradation rate; e.g. with a MAAT of 0 ∘C, a WFT of 0 ∘C and 100 % freezing, freezing depth will reach 9.5 m within 200 years. For the same setting, but with a MAAT of −4 ∘C, the freezing front will result in significant deepening and will reach 37 m (Fig. 7a). Setting the system to 25 % freezing, a MAAT of −4 ∘C, and a WFT of 0 and −2 ∘C, freezing depth will reach 47 and 20 m, respectively (Fig. 7b). By using a MAAT of 0 ∘C, freezing depth will reach 4.25 m for a WFT of 0 ∘C and 2.75 m for a WFT of −2 ∘C; in both scenarios freezing depth is constant for 200 years (Fig. 7b). Moreover, we show that even with MAAT > WFT (e.g. 0 and −2 ∘C, respectively) freezing will arrive at 2.75 m after 10 years and may create a thin layer of permafrost for at least 200 years. As mentioned above, this is due to the asymmetry in the seasonal freezing–thawing process. Higher conductivity during winter (frozen pore space) enhances the loss of heat, while the lower conductivity during summer (warming front goes through thawed pore space) slows the thawing process (Kukkonen and Šafanda, 2001). We note that lower proportions of freezing (e.g. 25 %) will have the effect of reducing this asymmetry due to the higher proportions of liquid water in the cryotic pore space and therefore lower thermal conductivity during freezing. Accordingly, permafrost deepening is hardly observed in the scenario of MAAT = 0 ∘C (in particular with WFT = −2 ∘C).
6.1 Ground ice salinity and the frozen interface
When the freezing front propagates downwards in recently emerged land, and epigenetic permafrost is formed, it might freeze old sub-surface brines (Cascoyne, 2000). As the freezing process proceeds, solute concentrations in the non-frozen residual water commonly increase (e.g. Cocks and Brower, 1974; Herut et al., 1990; El Kadi and Janajreh, 2017). This results in a pore space with high salt concentrations. These brines may then migrate away from the freezing surface, driven by density and capillary forces, and coalesce to form separate saline water lenses (“cryopegs”; Cascoyne, 2000). The level of salinity and water composition will depend on the initial water composition and the extent of freezing.
Complete permafrost freezing can hardly be obtained, since the eutectic point of seawater freezing is at −36 to −54 ∘C (Gitterman, 1937; Ringer, 1928; Nelson and Thompson, 1954; Marion et al., 1999), while in Adventdalen permafrost temperatures do not usually drop below −6 ∘C below the depth of zero annual amplitude (ZAA) (Christiansen et al., 2010) and are never lower than −12 ∘C, even in the shallow permafrost (Christiansen et al., 2020; Isaksen et al., 2007). Although the eutectic point is well below the expected temperature values, the freezing–salt expulsion process still prevails. Under these conditions, the permafrost pore space should hold a small fraction of residual brine solution, which contains most of the solutes originally dissolved in the bulk pore-space water. Partly frozen permafrost has been often observed in the study area during drilling, in particular deeper than a few metres. This was also found in both geophysical and geochemical observations (e.g. Keating et al., 2018; Weinstein et al., 2019). Nevertheless, when ground ice is thawed, the extracted fluid from the relatively large segments used in this study should roughly indicate the salinity of the original in situ pore fluid, assuming no major brine migration had occurred. Pore-water composition may be significantly altered from the original fluid that circulated in the sediments (e.g. seawater) due to ion exchange or dissolution prior to when or even after cryotic conditions occurred, which is reflected in the Na Cl and SO4 Cl ratios in the thawed ground ice (Fig. 2). Nevertheless, Cl− concentration is probably close to and represents the salinity of the original pore fluid. The relatively low salinity (Fig. 2) and the evident mixing profile (Fig. 2a, b and c) suggest that this is not the case at the ADE site and that the observed freshwater–seawater interface is an in situ observation. We refer to the chemistry of the extracted fluid as “ground ice chemistry”, although it could also be that some of it was not actually frozen.
Cable et al. (2018) presented ground ice chemistry of cores from the Adventdalen, albeit closer to the current fjord (< 4 km), west of the ADE site. In these cores, chloride, sodium and sulfate concentrations at depths of 3–11 m were up to 50 % that of seawater. At ADE, farther away from the sea, ground ice in the epigenetic permafrost, 5.5 m from the surface and deeper, shows a gradual increase in salinity (i.e. fresh–saline interface), with Cl− concentrations reaching 15 % that of seawater at 9 m below the surface. Although salinities do not change much between 9–12 m, it is likely that more saline water, close to seawater salinity, either exists today or existed in the past (prior to freezing) at deeper permafrost levels. The existence of a fresh–saline interface in the very shallow permafrost, in the top of the epigenetic permafrost, suggests that freezing at ADE occurred immediately after emergence above seawater. This is further discussed below.
6.2 Rebound, exposure and fresh–saline interface deepening
Assuming that Early Holocene (11–8 ka) precipitation was slightly higher than present (200 mm yr−1; McFarlin et al., 2018; Kjellman et al., 2020) and using a conservative infiltration factor of 0.2 (whether thawing snow or direct rain) and the porosity used in our simulations (0.3), this amounts to an effective annual infiltration of ca. 130 mm yr−1. This could easily keep up with the Early Holocene rebound rates of 15 mm yr−1 (established for the nearby Sassendalen valley; Salvigsen, 1984; Sessford et al., 2015), therefore preserving the groundwater table close to the surface of the emerging land. Using a Ghyben–Herzberg approximation (Bear and Dagan 1964), this would result in an Early Holocene fresh–saline interface deepening of ca. 60 m in 100 years (Fig. 7), assuming the saline waterbody had a common seawater density of 1025 kg m−3. FSI deepening could even be faster if the deep waterbody is less saline than seawater. Even if sub-aerial exposure occurred later, during the mid-Holocene, when the rebound rate decreased to 4.5 mm yr−1 (Forman et al., 2004), the fresh–saline interface would still deepen at a rate of 180 mm yr−1, i.e. 18 m in 100 years (Fig. 7).
The existence of a mixing zone at the top of the epigenetic permafrost (from 5.5 m below the current terrain surface), with Cl− content 15 % that of seawater 3.5 m below the Early Holocene surface, suggests that the marine sediment section at ADE was hardly flushed with meteoric water. This further suggests that permafrost aggradation commenced shortly after emergence above the sea (e.g. Kasprzak et al., 2020). Indeed, some of the simulated freezing scenarios can clearly cope with the above fresh–saline interface deepening rates (e.g. MAAT of −4 ∘C and WFT of 0 ∘C; Fig. 7). Moreover, assuming that partial freezing (e.g. 25 % or 50 %) can also block flushing, this results in even faster permafrost aggradation (Fig. 7b). However, as permafrost deepens, the freezing rate slows down (e.g. Fig. 7), and none of the scenarios can cope with the assumed deepening of the fresh–saline interface, which should result in flushing of deeper zones.
It seems likely that the key factor in fresh–saline interface fossilization in a continuous-permafrost landscape is the permanent freezing of the very shallow permafrost, which hydraulically disconnects the sub-permafrost zone from the surface and prevents recharge of this zone with meteoric water. As shown (Figs. 6 and 7), freezing of the top 3–5 m can occur within several years even with the relatively high temperatures of the Early to mid-Holocene; e.g. a MAAT of −4 ∘C or even warmer and a WFT of 0 or −2 ∘C will result in 5 m of frozen sediments within 5 to 35 years (Fig. 7). Therefore, the fresh–saline interface could effectively be preserved.
We did not include salt diffusion in our model (e.g. Angelopoulos et al., 2019), a process that will reduce the WFT as freezing progresses. This can explain the reason for partially frozen samples extracted from the epigenetic section (Table 1). Including salt diffusion, we assume the freezing front may have advanced somewhat more slowly than suggested by our model.
6.3 Permafrost aggradation during the Holocene
Gilbert et al. (2018) suggested that our drilling site at ADE emerged from the sea at 10 to 9 ka and that the delta front advanced westwards at a rate of 4.4 m yr−1 prior to 9.2 ka, which decreased to 0.9 m yr−1 during the rest of the Holocene. Considering the relatively high rebound rates between 9 and 8 ka (e.g. 15–19 mm yr−1), this suggests that the land surface at ADE reached 3–4 m above sea level and a topographic gradient of 1 %–2 % towards the sea within 200 years. Assuming the groundwater table was close to the surface, this should further result in a good flushing of the sub-surface, unless freezing took control (Fig. 8). The observed mixing zone, which reaches the very top of the pre-Late Holocene surface, suggests that freezing started within just a few years after exposure.
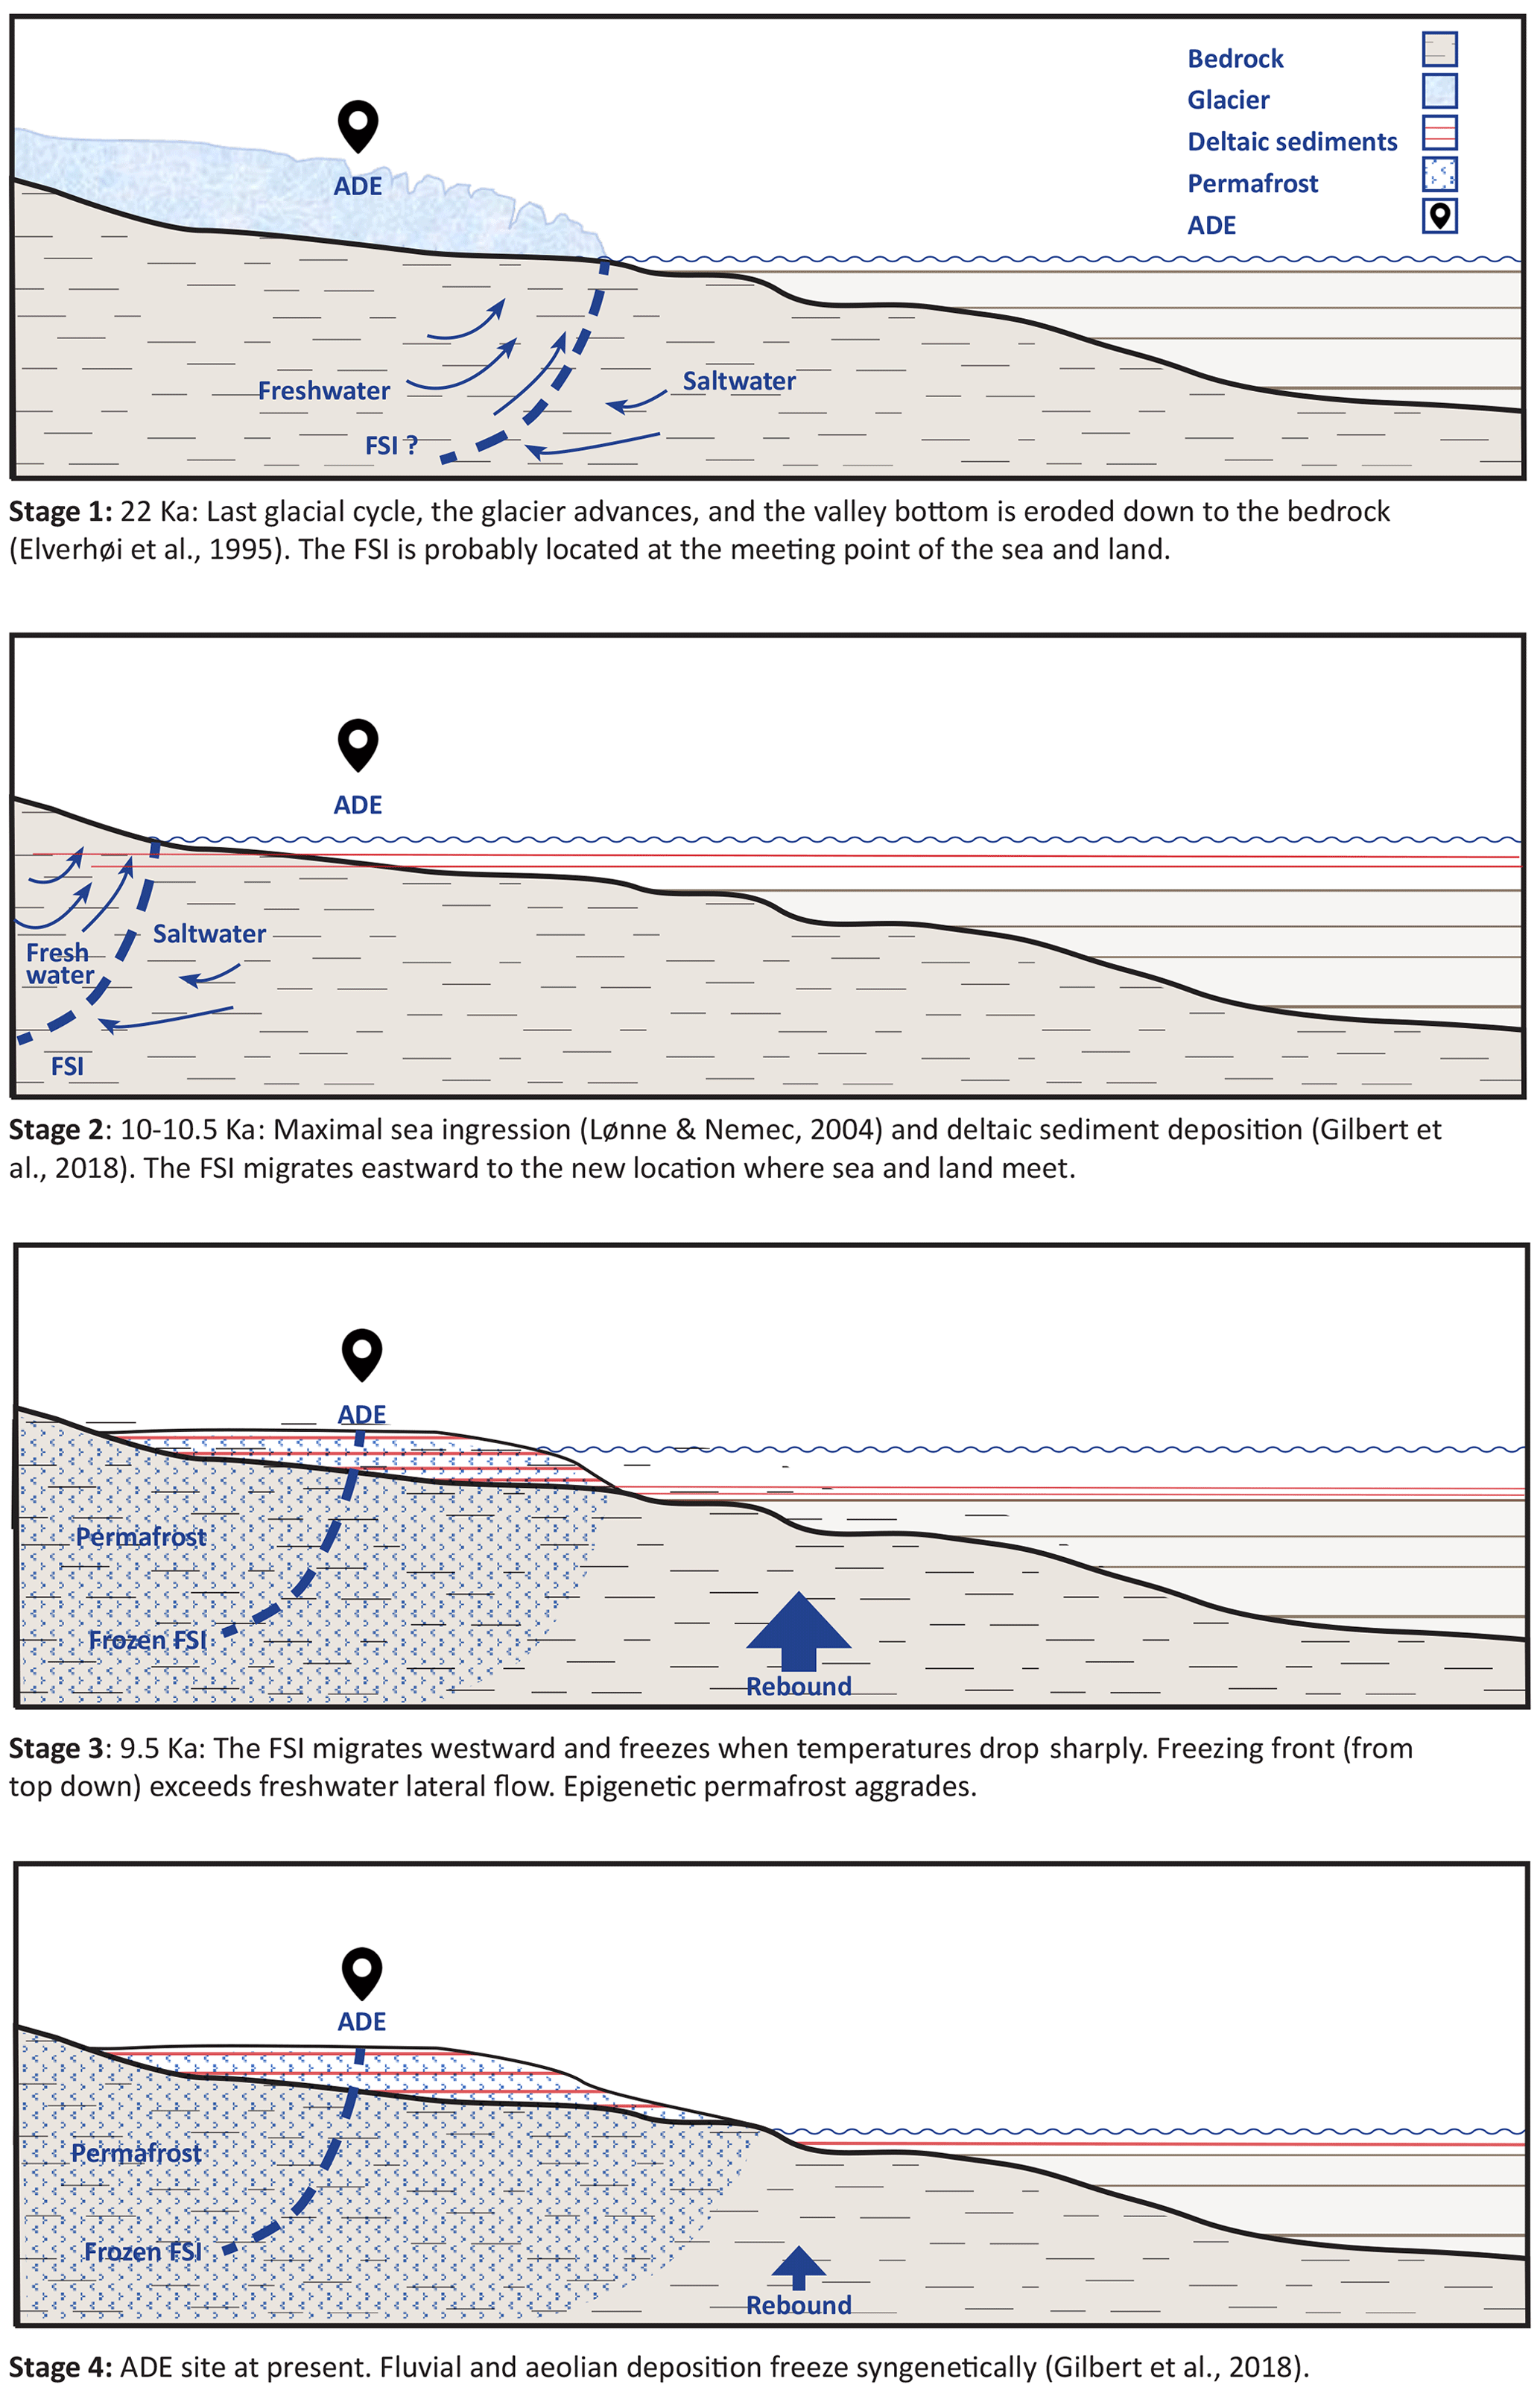
Figure 8Conceptual presentation of the type of groundwater freezing processes in Adventdalen since the last glacial cycle with a focus on the freshwater–saline water interface (FSI) at the ADE site.
Our simulations suggest that both cryotic conditions (i.e. < 0 ∘C) and actual ground ice formation started very soon after exposure to the atmosphere (Figs. 5, 6 and 7) and that significant freezing depths of 20–37 m could be achieved in 200 years (Figs. 6 and 7). This is true for both the warmer Early to mid-Holocene period (Kutzbach and Guetter, 1986; McFarlin et al., 2018; Mangerud and Svendsen, 2018; Park et al., 2019; Kjellman et al., 2020) and for any sub-zero MAAT, regardless of the size of the annual fluctuations. We even tested a MAAT of +1 ∘C and found that some freezing could occur (not shown), which is a seasonal effect derived from the different thermal conductivities of ice and water. We also tested our model with a lower thermal conductivity by an order of magnitude, following recently published research in Adventdalen (Hornum et al., 2020), and found that permafrost aggradation, although shallower, will result in freezing of the FSI under mid-Holocene conditions. Our simulations are in good agreement with Harada and Yoshikawa (1996), who used a 1-D model with a MAGST of −5.7 ∘C but not completely saturated sediments and found that 533 years is needed to freeze 31.7 m of sediment in Moskuslagoon, slightly to the west of our site, on the Adventfjorden shore.
The ADE site was free of seawater in the Early Holocene prior to 9.2 ka (Gilbert et al., 2018). At that time, an abrupt cooling has been described in Svalbard (Mangerud and Svendsen, 2018; van der Bilt et al., 2018, 2019). The presented model results show that the initiation of permafrost and its gradual aggradation are possible under relatively high temperatures (though a MAAT of ≤ 0 ∘C) of the mid-Holocene. Christiansen et al. (2013) pointed out that local topographic conditions and winds in Adventdalen can induce lower temperatures in low-altitude depressions, which could enhance the permafrost aggradation during the mid-Holocene.
Our simulations also show that a lower percentage of freezing (e.g. 25 %) may enhance the permafrost aggradation rate (e.g. Fig. 7b); however, this is not true for a lower WFT (e.g. −2 ∘C) or for a relatively high MAAT (e.g. 0 ∘C), which as mentioned above is due to the trade-off between latent-heat and thermal-conductivity differences between ice and liquid water. Nevertheless, a MAAT of 0 ∘C seems unlikely (e.g. van der Bilt et al., 2019).
In summary, the simulations suggest that permafrost aggradation could and did occur immediately following exposure also during the relatively warm period of the Early to mid-Holocene (10–8 ka). This is in disagreement with Hornum et al. (2020), who suggested that while freezing did occur during the Early Holocene, the ground thawed during the mid-Holocene and refroze at about 6.5 ka.
Late Pleistocene to mid-Holocene permafrost dynamics were studied in other permafrost regions. While in some areas there are already records of permafrost degradation and peatland expansion in the Early Holocene (post-deglaciation; e.g. Lenz et al., 2015; Kaufman et al., 2015; Grinter et al., 2018), cumulated evidence indicates that air temperature during this period was highly variable, sometimes higher and sometimes lower than at present (Kaufman et al., 2015). Nevertheless, it is a common observation that during the Holocene thermal maximum (mid-Holocene, 8.2–4.2 ka) permafrost degraded, and thermokarst peaked (e.g. Lenz et al., 2015; Ulrich et al., 2017; Anderson et al., 2019). Permafrost aggradation resumed post-6 ka and mainly during the past 3–4 kyr (e.g. Grinter et al., 2018; Treat and Jones, 2018). As shown above, we believe that this was not the case in Svalbard, and exposed lands continued to freeze throughout the Holocene.
Arctic landscapes, including western Svalbard, were rising relatively fast in the Early to mid-Holocene due to glacial isostatic rebound. Accordingly, the preservation of frozen saline water (mixing zone) at a very shallow depth of 5.5 to 12 m is taken to be evidence for fast permafrost aggradation, which could halt the infiltration of fresh meteoric water and the flushing of saline water toward the sea. This is despite the prevailing relatively high temperatures during this period.
Our modelling confirms that freezing could progress relatively fast down the exposed Adventdalen sediments, i.e. to 20–35 m within 200 years, even under the reconstructed relatively high mid-Holocene air temperature of −4 ∘C used in the 1-D model.
The modelling further suggests that permafrost may aggrade even when water freezing temperature (WFT) is slightly lower than mean annual air temperature (MAAT). This is attributed to the differences in thermal properties between ice and liquid water, where the higher conductivity of ice allows a faster propagation of the freezing front during winter than the propagation of thawing during the summer.
Non-complete freezing of the cryogenic pore space (which is often the case) could result in faster deepening of the freezing front when MAAT is smaller than WFT or even when it is higher, but in the latter case the difference is not large (e.g. MAAT < 0 ∘C and 0 < WFT > −2 ∘C). However, when MAAT ≫ WFT (e.g. MAAT = 0 ∘C and WFT ≤ −2 ∘C), the presence of liquid water in the pore space and its lower thermal conductivity would result in a halt of permafrost aggradation.
This concept of fast freezing under relatively high air temperatures may suggest that recently exposed areas may still go through permafrost aggradation even under the current global warming. Also, it could imply that a short (years to decades) cooling period could significantly slow down permafrost thawing.
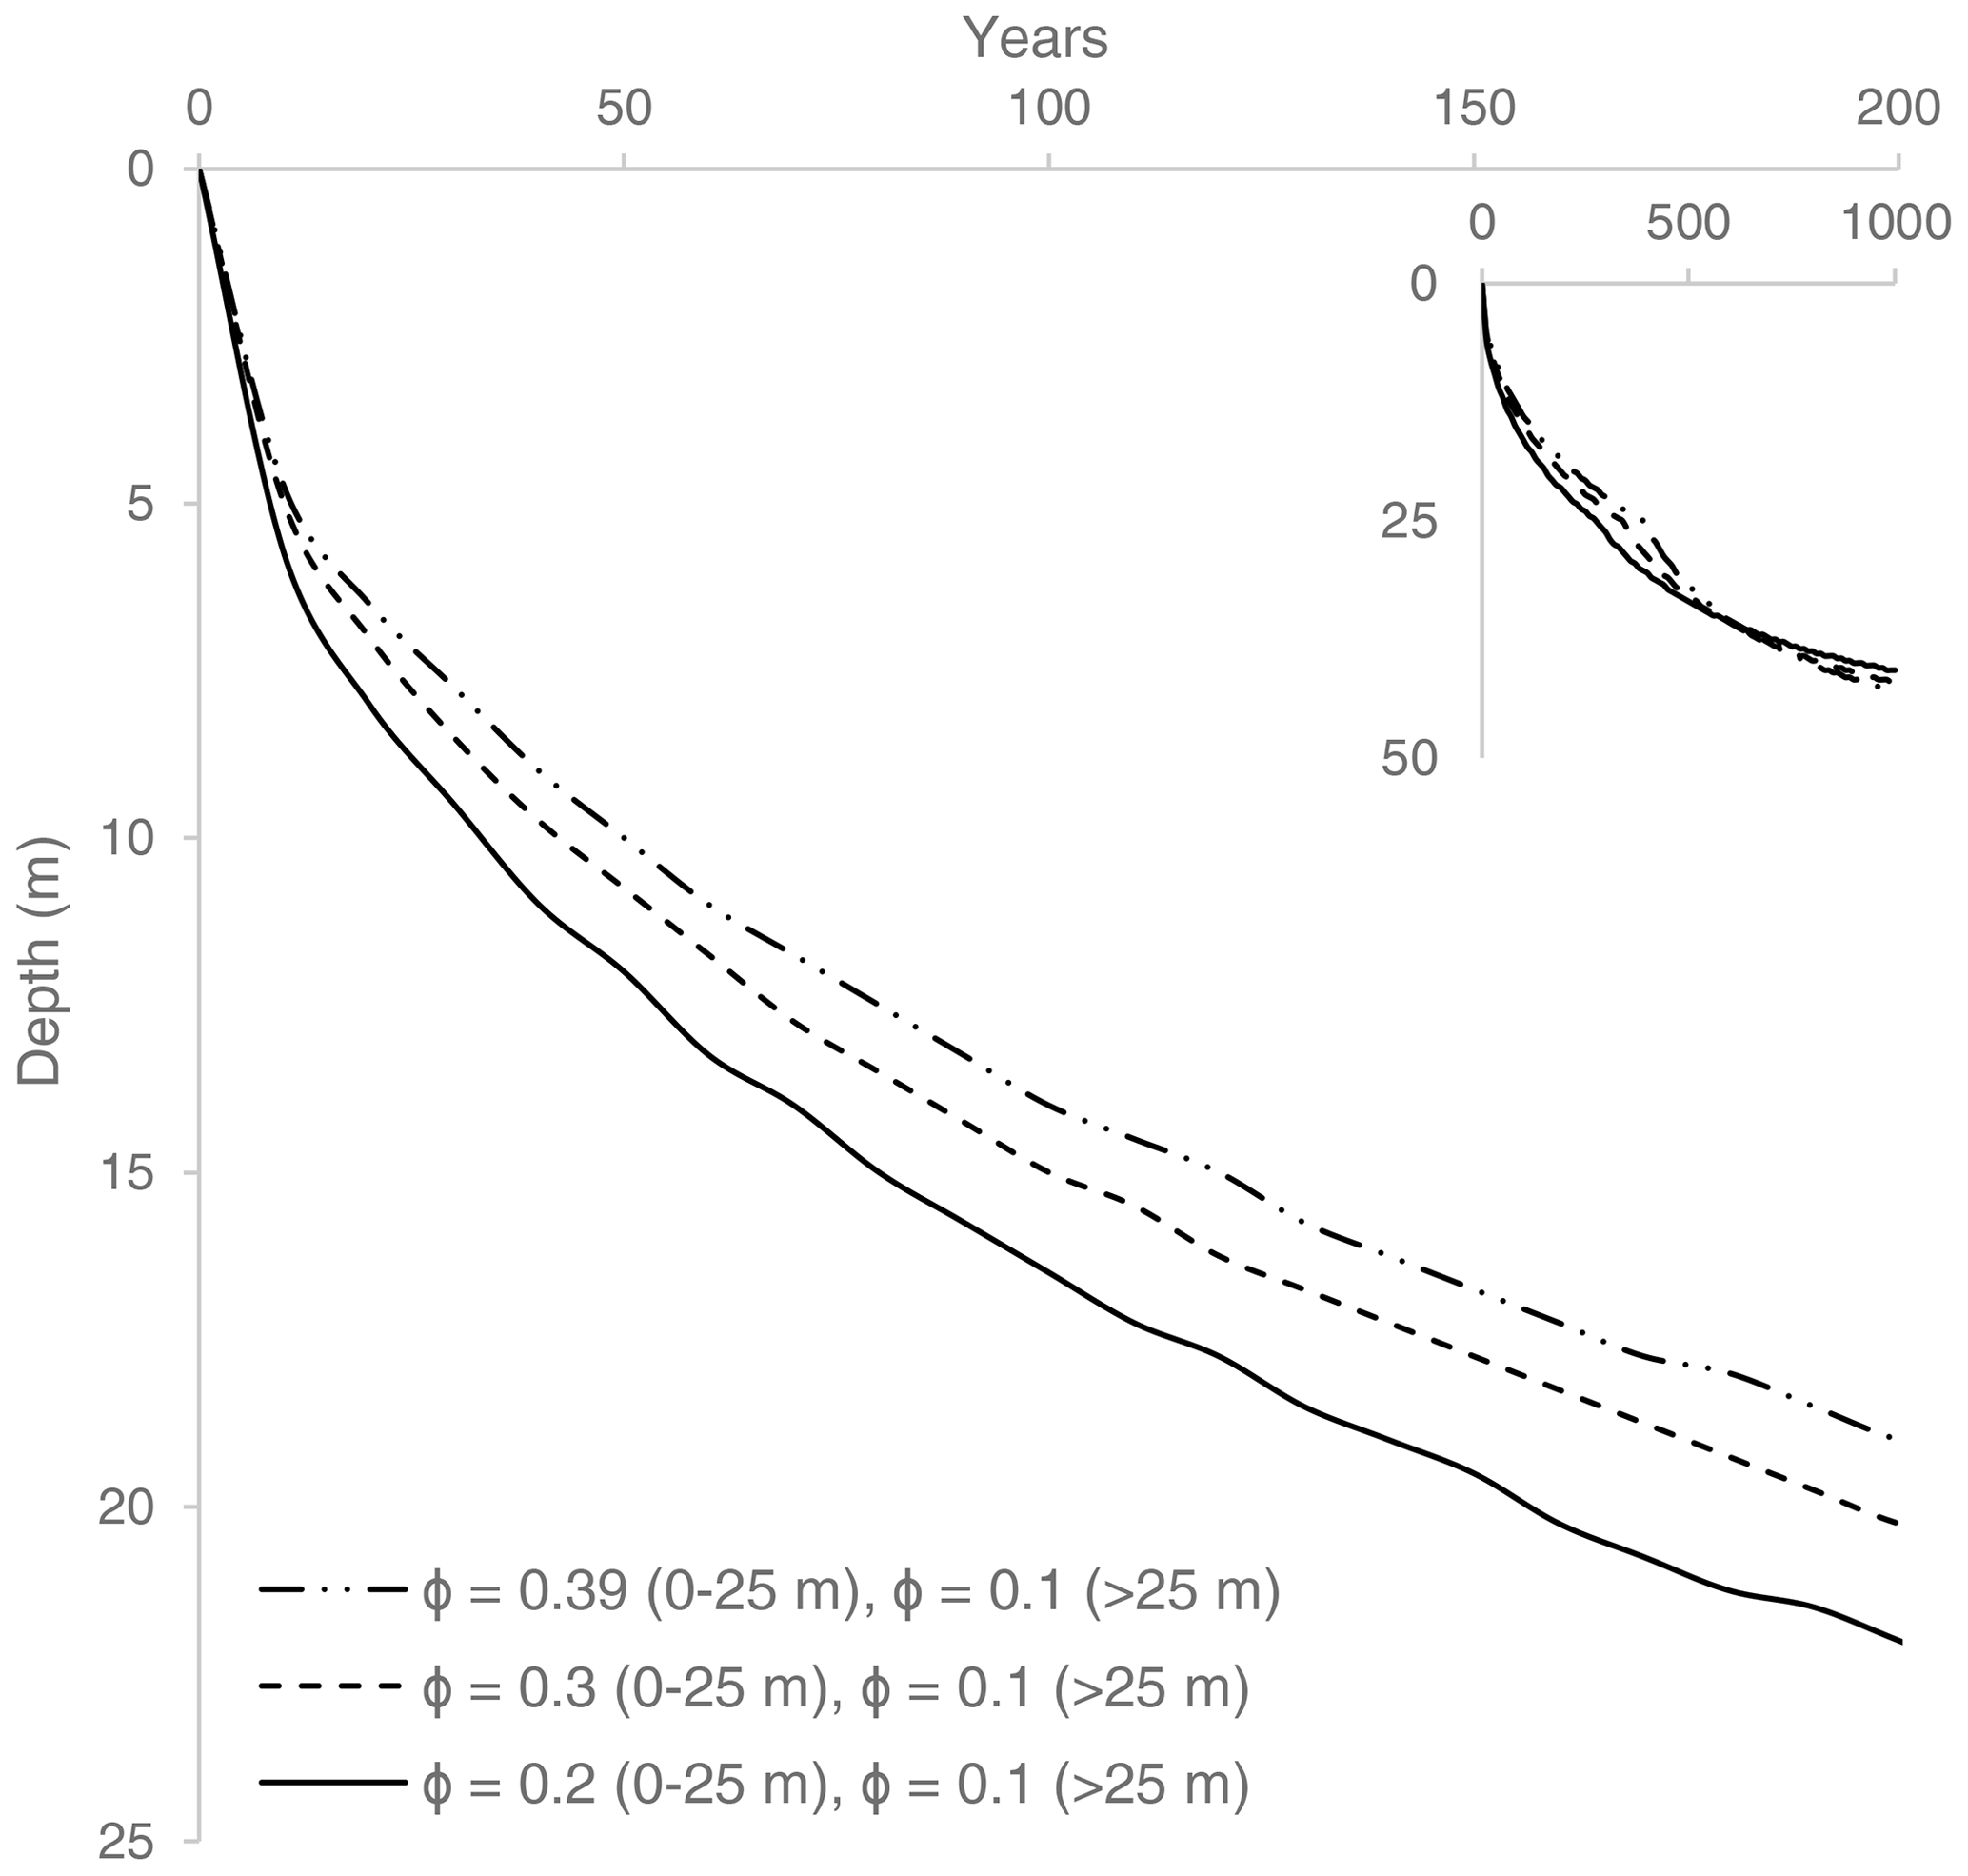
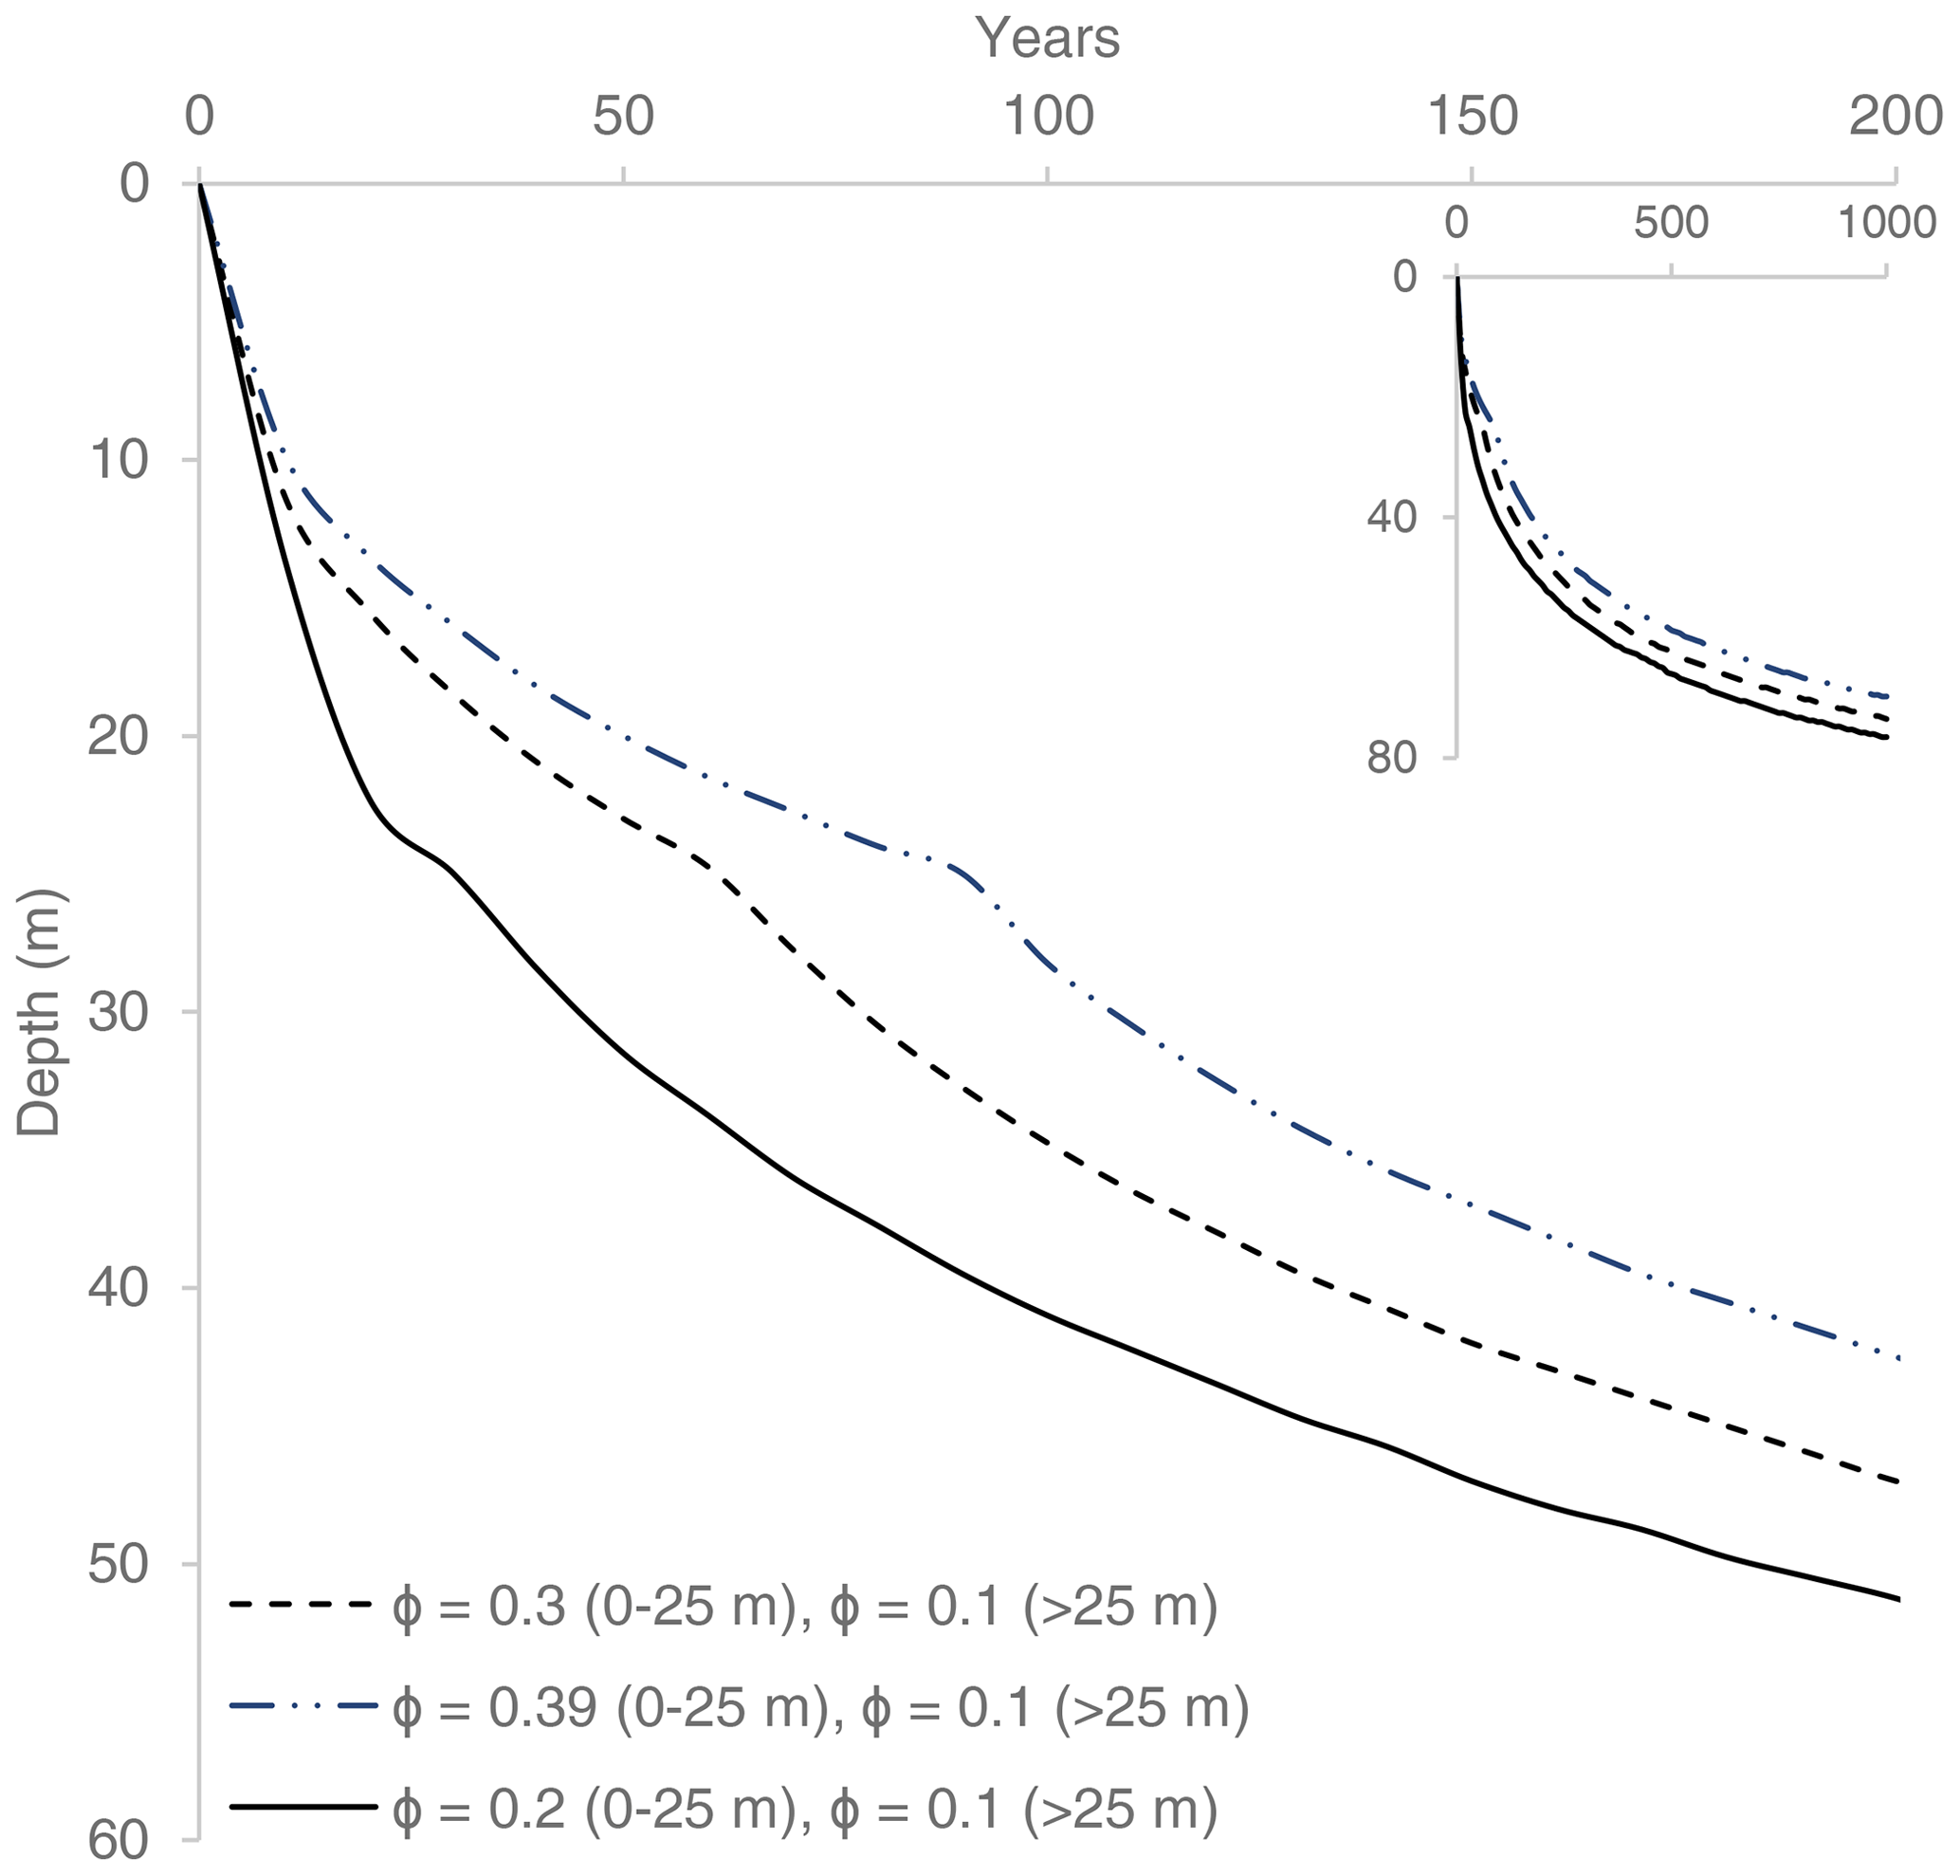
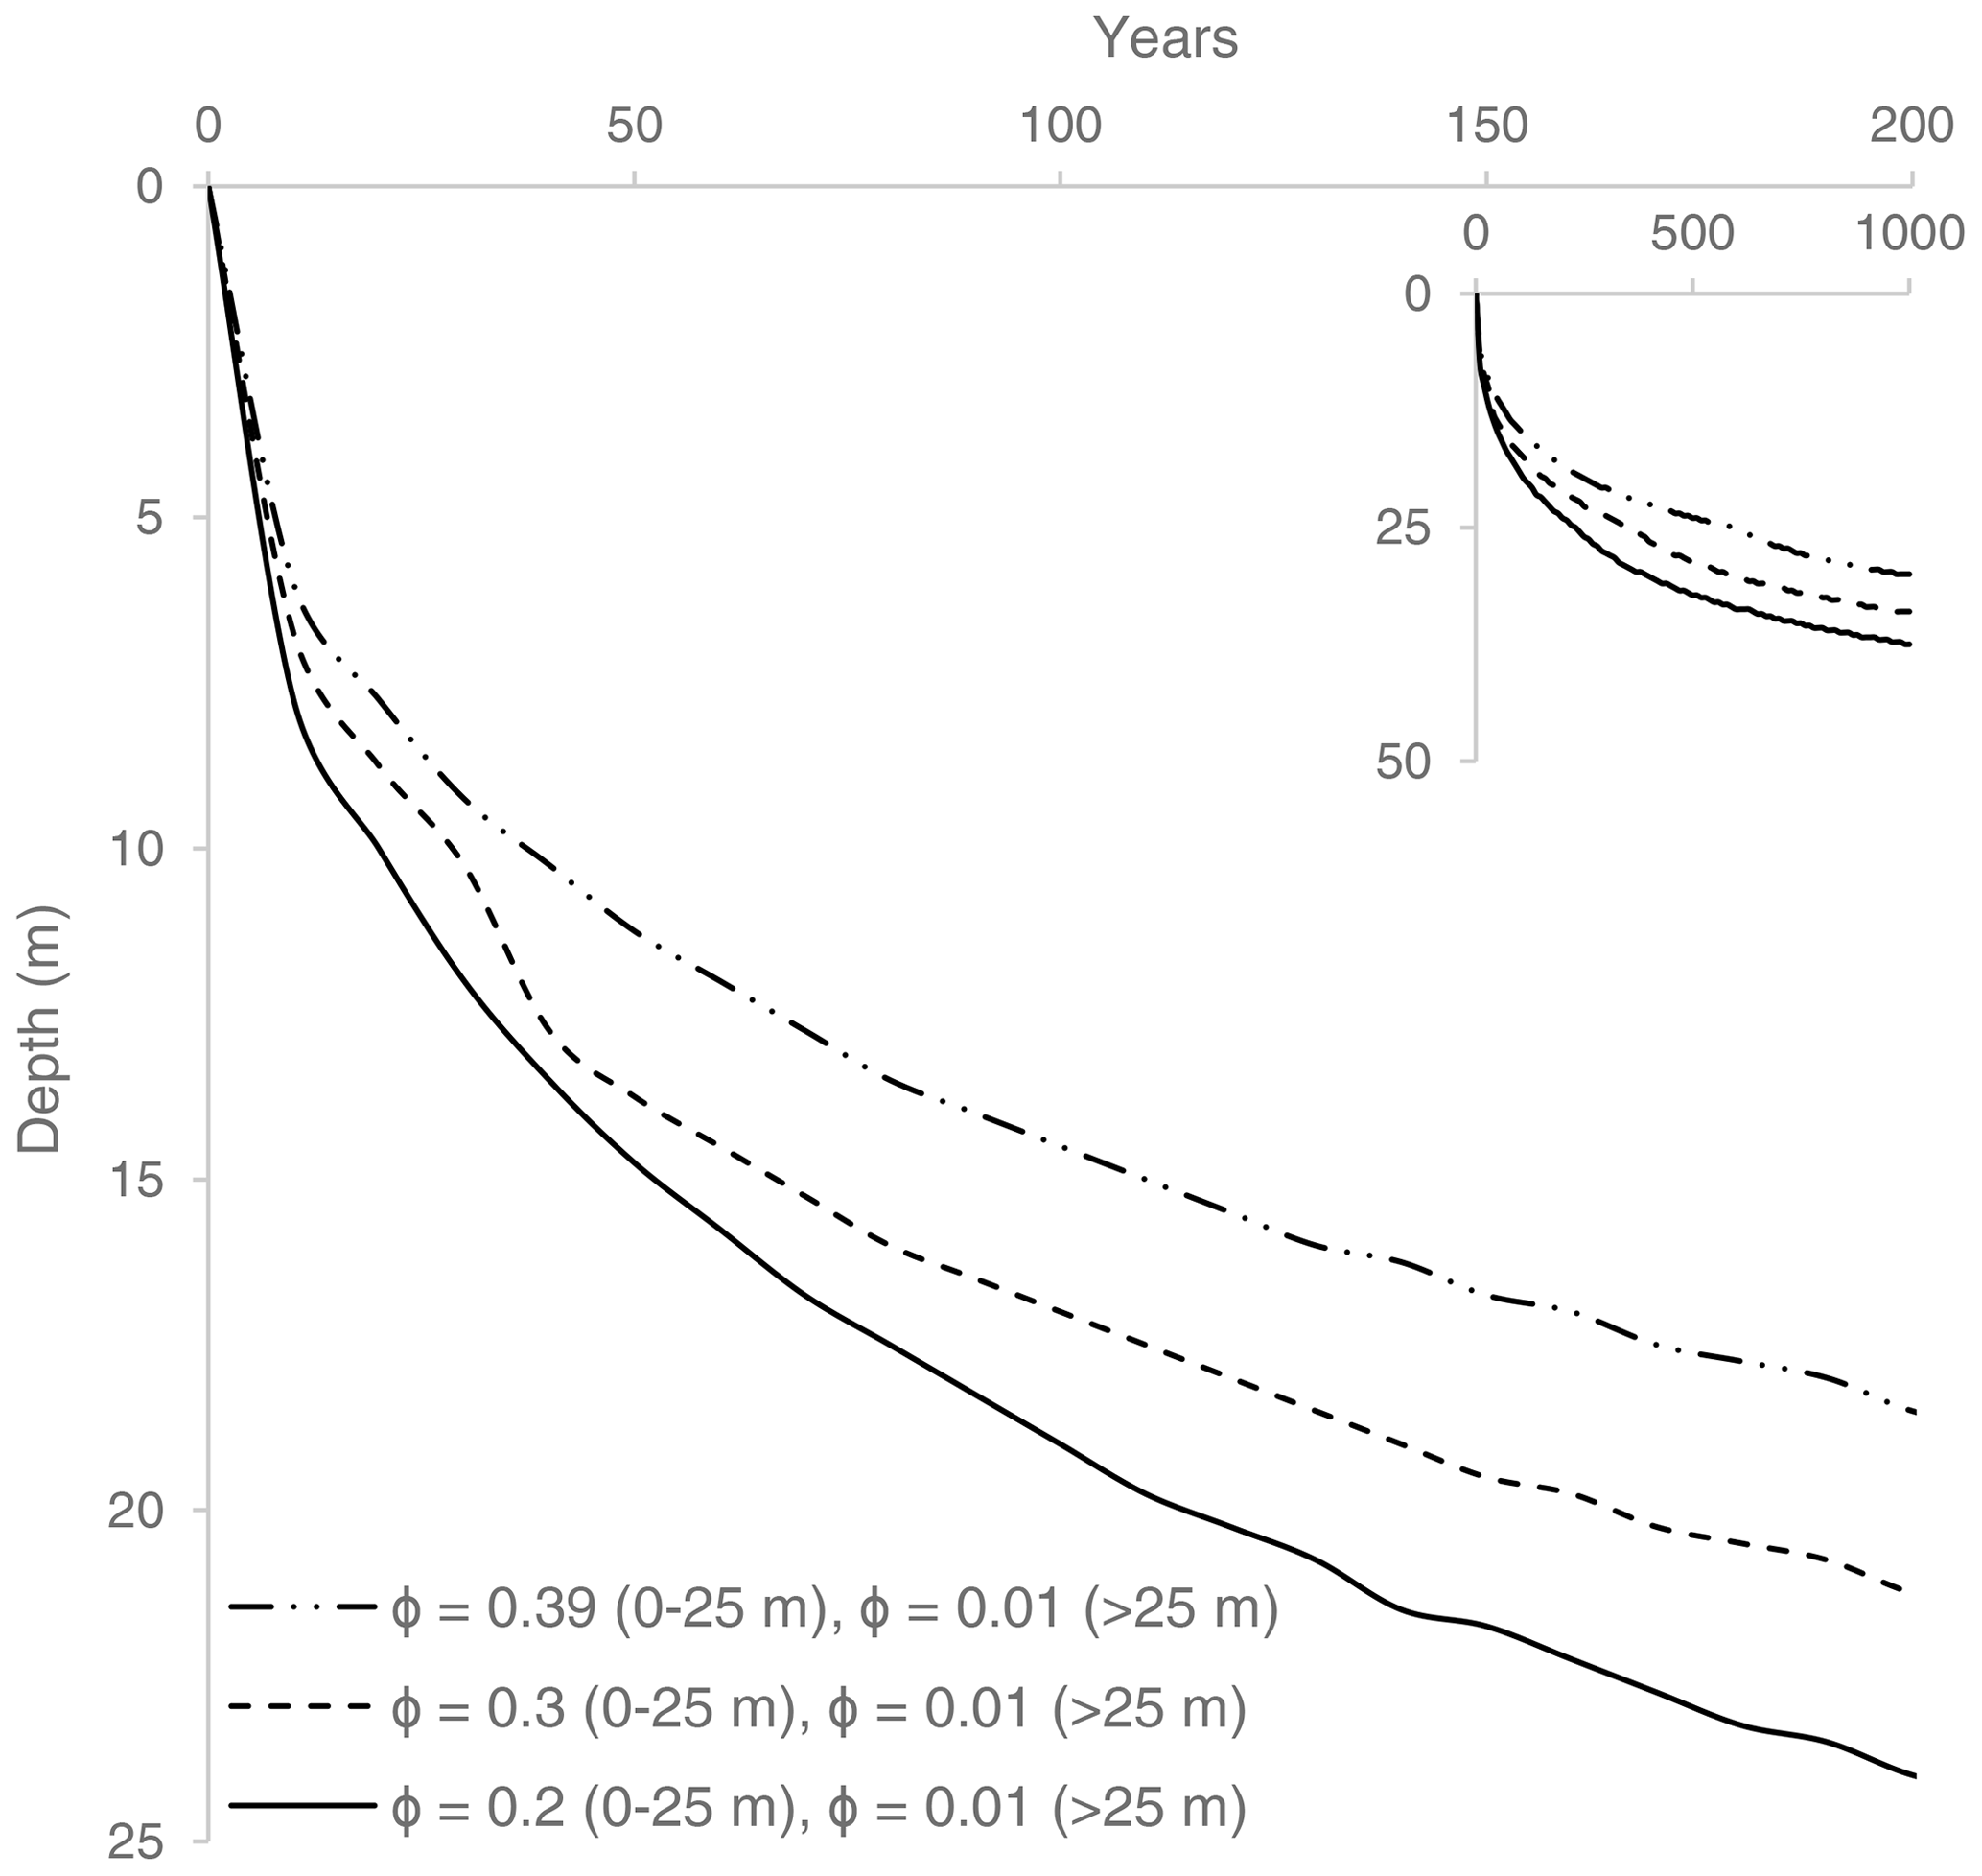
Selected simulation results demonstrating the effects of the porosity values on the rate of permafrost formation are presented in Figs. A1–A4. In general, higher porosity (i.e. more pore water to freeze) will result in slower permafrost aggradation due to the higher latent heat involved.
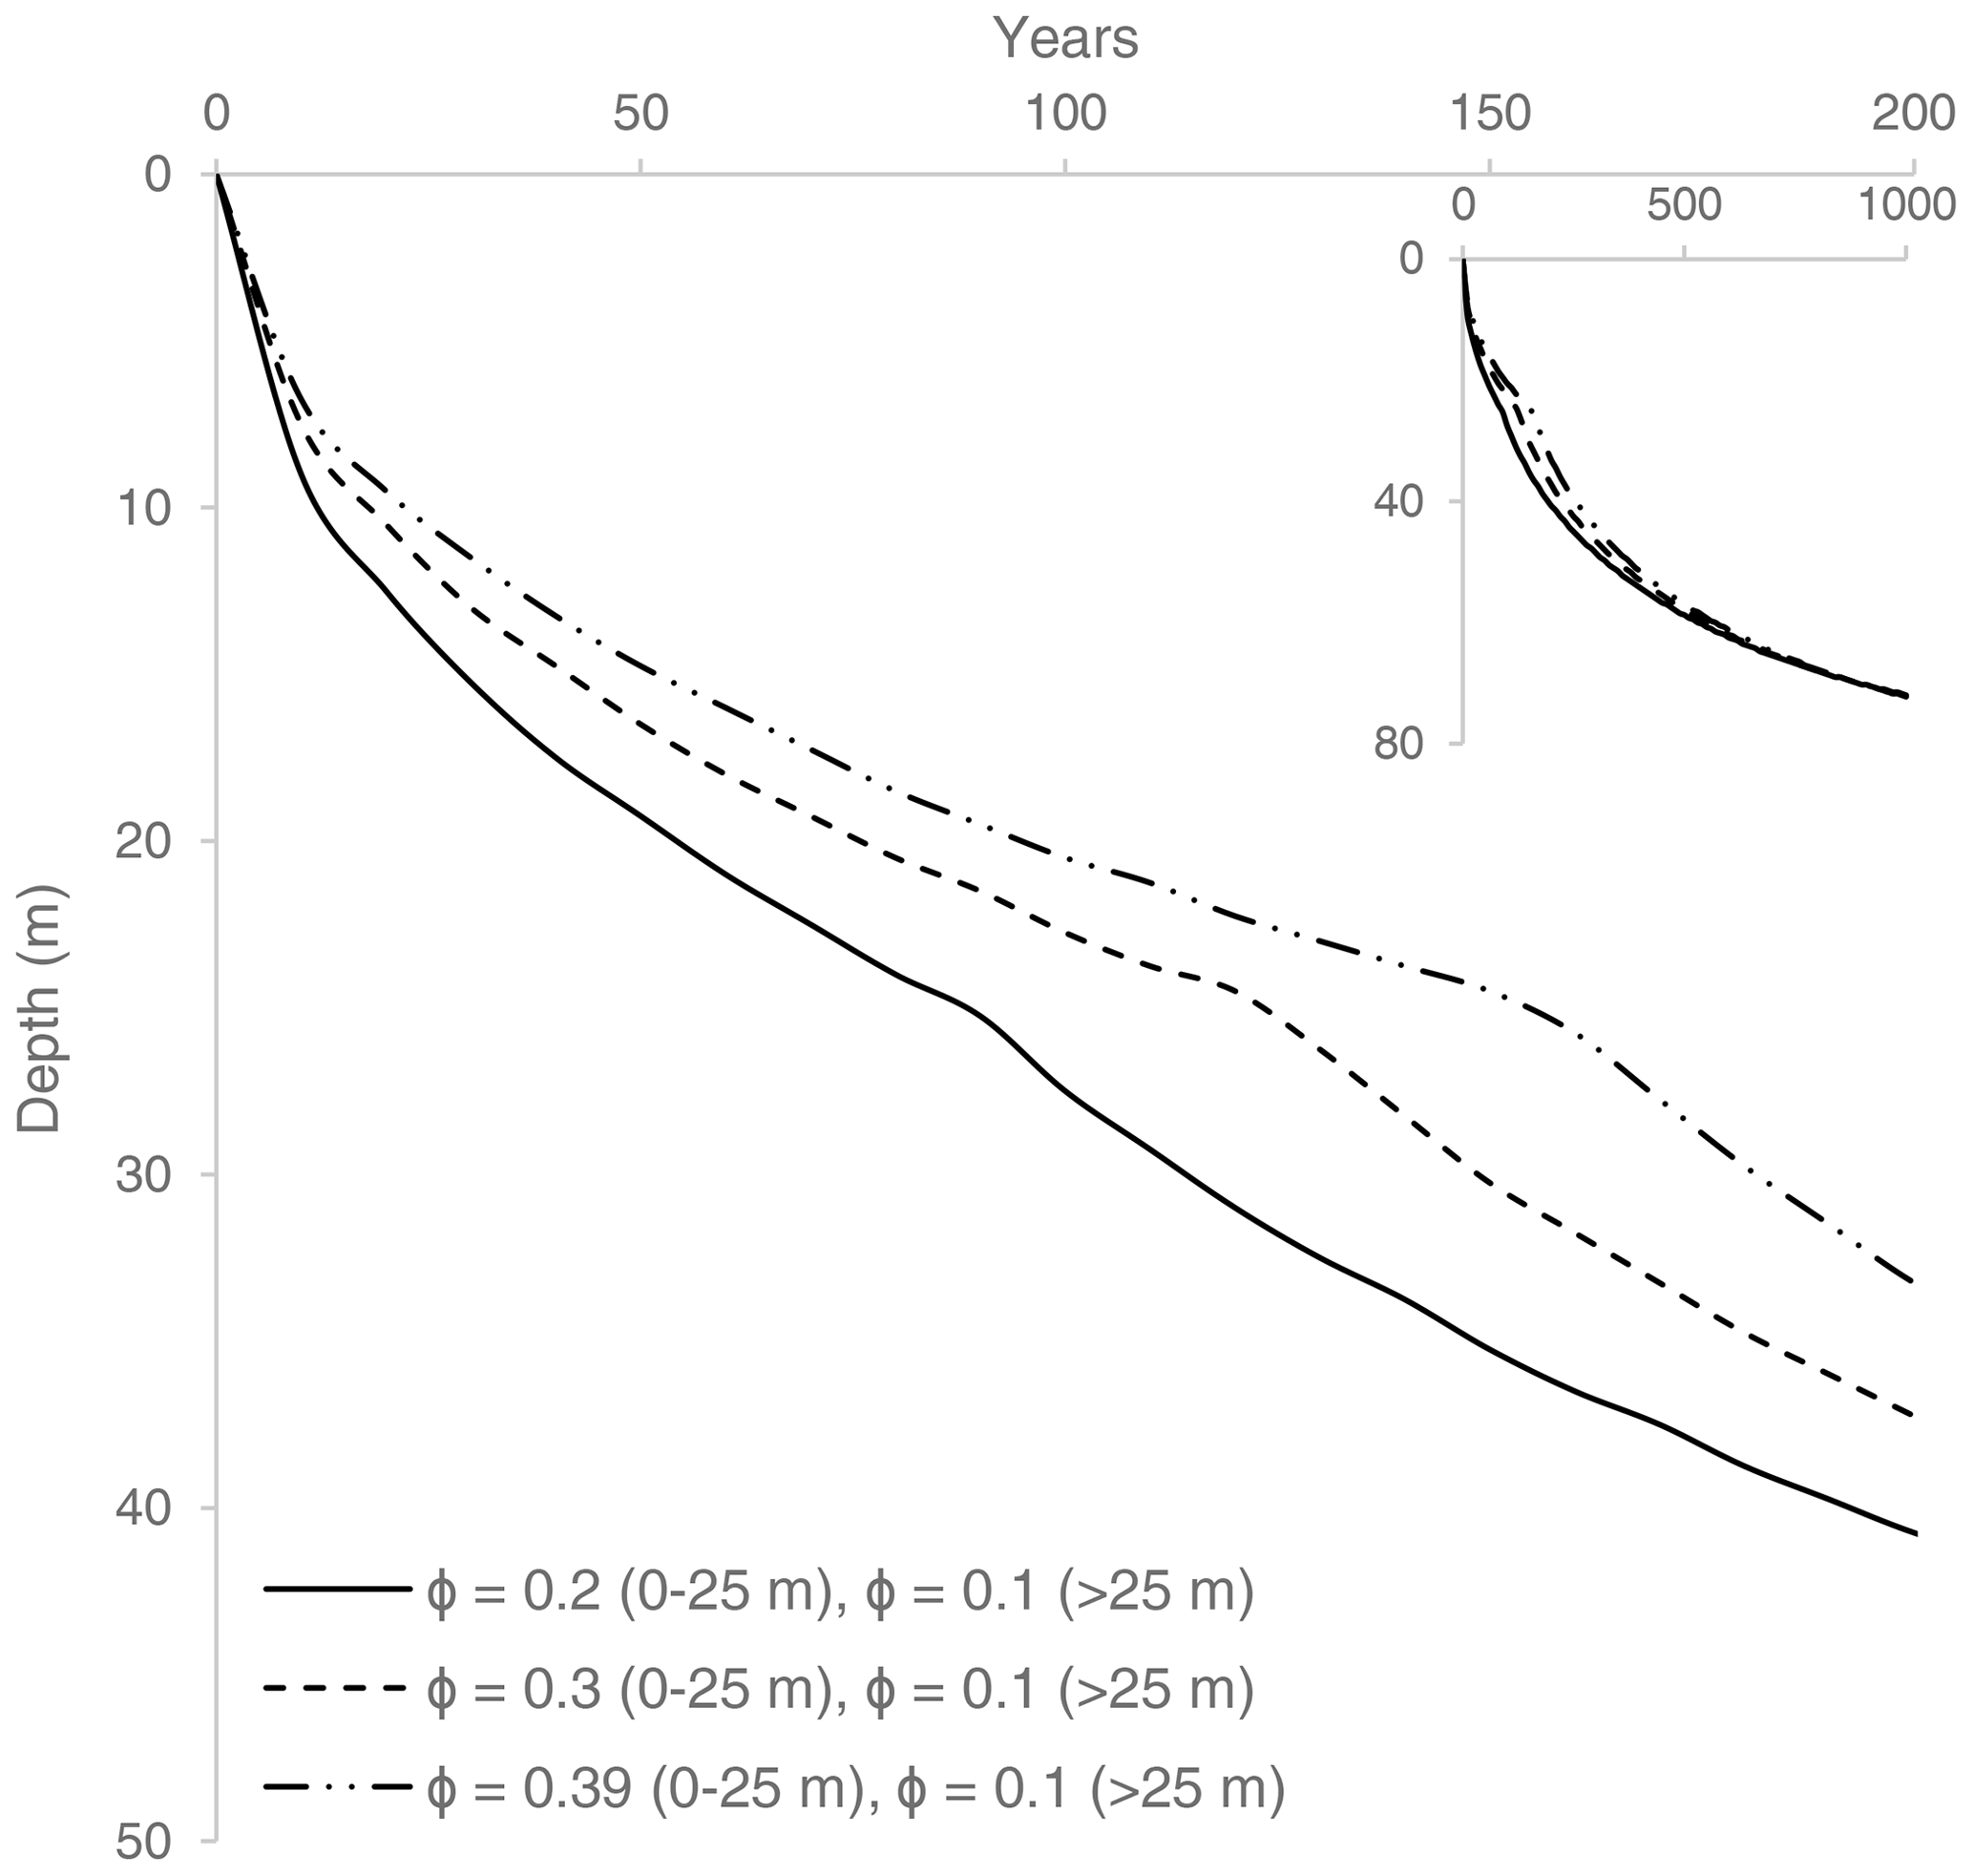
Figure A1Simulations of freezing front progress with different porosities for a MAAT of −4 ∘C, a WFT of 0 ∘C and 100 % freezing. The inset presents results for 1000 years. The fast deepening at a depth of > 25 m is due to the change in porosity as the freezing front reaches the bedrock.
The 1-D freezing (thawing) model code is publicly available at https://doi.org/10.6084/m9.figshare.23684493 (Rotem, 2023).
All raw data can be provided by the corresponding authors upon request.
DR, YW and HHC planned the drilling campaign; DR and YW processed the cores and performed lab work at UNIS Svalbard; DR and YH performed the water chemistry analysis at GSI; VL and DR developed the 1-D model; and DR, YW and VL wrote the manuscript. All authors commented on the manuscript.
The contact author has declared that none of the authors has any competing interests.
Publisher’s note: Copernicus Publications remains neutral with regard to jurisdictional claims in published maps and institutional affiliations.
We would like acknowledge Ullrich (Ulli) Neuman for leading the 2017 drilling campaign in Adventdalen; Andreas Alexander and Graham L. Gilbert for field assistance; Danni Rohdent for lab assistance; Gerd-Irena and the UNIS logistics team for their assistance with field and laboratory gear; GSI geochemical lab members Olga Berlin, Galit Sharabi and Dina Siber for their assistance with chemistry analysis; and Yosi Yechieli for consulting about various issues of the article. The drilling campaign was supported by an Arctic Field Grant from the Norwegian Research Council (project no. 269988, RiS ID 10664).
This research has been supported by the Israel Science Foundation (grant nos. ISF 1487/2014 and ISF 163/2019) and an Arctic Field Grant from the Norwegian Research Council (project no. 269988, RiS ID 10664).
This paper was edited by Christian Hauck and reviewed by two anonymous referees.
Ahonen, L.: Permafrost: occurrence and physiochemical processes (POSIVA–01-05), Geological Survey of Finland, Finland, ISBN 951-652-106-1, 2001.
Alsos, I. G., Sjögren, P., Edwards, M. E., Landvik, J. Y., Gielly, L., Forwick, M., Coissac E., Brown A. G., Jakobsen L. V., Føreid M. K., and Pedersen, M. W.: Sedimentary ancient DNA from Lake Skartjørna, Svalbard: Assessing the resilience of arctic flora to Holocene climate change, Holocene, 26, 627–642, https://doi.org/10.1177/0959683615612563, 2016.
Ames, W. F.: Numerical methods for partial differential equations, 2nd edition, Academic press INC, ISBN 0-12-056761-X, 1977.
Anderson, L., Edwards,, M., Shapley,, M. D., Finney, B. P., and Langdon, C.: Holocene Thermokarst Lake Dynamics in Northern Interior Alaska: The Interplay of Climate, Fire, and Subsurface Hydrology, Front. Earth Sci., 7, 53, https://doi.org/10.3389/feart.2019.00053, 2019.
Angelopoulos, M., Westermann, S., Overduin, P., Faguet, A., Olenchenko, V., Grosse, G., and Grigoriev, M. N.: Heat and salt flow in subsea permafrost modeled with CryoGRID2, J. Geophys. Res.-Earth Surf., 124, 920–937, https://doi.org/10.1029/2018JF004823, 2019.
Arnscheidt, C. W. and Rothman, D. H.: Routes to global glaciation, P. Roy. Soc. A, 476, 2239, https://doi.org/10.1098/rspa.2020.0303, 2020.
Balland, V. and Arp, P. A.: Modeling soil thermal conductivities over a wide range of conditions, J. Environ. Eng. Sci., 4, 549–558, https://doi.org/10.1139/s05-007, 2005.
Bear, J. and Dagan, G.: Some exact solutions of interface problems by means of the hodograph method, J. Geophys. Res., 69, 1563–1572, https://doi.org/10.1029/JZ069i008p01563, 1964.
Benn, D. and Evans, D. J.: Glaciers and glaciation, 2nd edition, Routledge, 707 pp., ISBN 9780340905791, 2014.
Betlem, P., Midttømme, K., Jochmann, M., Senger, K., and Olaussen, S.: Geothermal Gradients on Svalbard, Arctic Norway, in:First EAGE/IGA/DGMK Joint Workshop on Deep Geothermal Energy, 8–9 November 2018, Strasbourg, France, European Association of Geoscientists and Engineers, cp-577, https://doi.org/10.3997/2214-4609.201802945, 2018.
Black, R. F.: Permafrost: a review, GSA Bulletin, 65, 839–856, https://doi.org/10.1130/0016-7606(1954)65[839:PR]2.0.CO;2, 1954.
Bodnar, R. J.: Revised equation and table for determining the freezing point depression of H2O-NaCl solutions, Geochim. Cosmochim. Acta, 57, 683–684, https://doi.org/10.1016/0016-7037(93)90378-A, 1993.
Bondevik, S., Mangerud, J., Ronnert, L., and Salvigsen, O.: Postglacial sea-level history of Edgeøya and Barentsøya, eastern Svalbard, Polar Res., 14, 153–180, https://doi.org/10.3402/polar.v14i2.6661, 1995.
Burn, C. R.: Permafrost distribution and stability, edited by: French, H., and Slaymaker, O., Changing Cold Environments: A Canadian Perspective, John Wiley and Sons, Ltd, 126–143, https://doi.org/10.1002/9781119950172.ch7, 2011.
Burt, T. P., and Williams, P. J.: Hydraulic conductivity in frozen soils, Earth Surf. Processes, 1, 349–360, https://doi.org/10.1002/esp.3290010404, 1976.
Cable, S., Elberling, B., and Kroon, A.: Holocene permafrost history and cryostratigraphy in the High-Arctic Adventdalen Valley, central Svalbard, Boreas, 47, 423–442, https://doi.org/10.1111/bor.12286, 2018.
Cary, J. W., and Mayland, H. F.: Salt and water movement in unsaturated frozen soil, Soil Sci. Soc. Am. J., 36, 549–555, https://doi.org/10.2136/sssaj1972.03615995003600040019x, 1972.
Cascoyne, M.: A review of published literature on the effects of permafrost on the hydrogeochemistry of bedrock, Technical Report, Posiva Oy, Helsinki Finland, ISBN 951-652-095-2, 2000.
Christiansen, H. H.: Thermal regime of ice-wedge cracking in Adventdalen, Svalbard, Permafrost Periglac., 16, 87–98, https://doi.org/10.1002/ppp.523, 2005.
Christiansen, H. H. and Humlum, O.: Active layer monitoring in Ny Ålesund and in Adventdalen in the CALM Network, in: Permafrost, Periglacial Features and Glaciers in Svalbard, Excursion Guide, VIII International Conference on Permafrost, 21–25 July 2003, Zurich, Switzerland, Rapport−serie i naturgeografi, Universitetet i Oslo, vol. 14, 97–100, https://www.permafrost.org/event/icop8/ (last access: 16 August 2023), 2003.
Christiansen, H. H., Etzelmüller, B., Isaksen, K., Juliussen, H., Farbrot, H., Humlum, O., Johansson, M., Ingeman-Nielsen, T., Kristensen, L., Hjort, J., Holmlund, P. Sannel, A. B. K. Sigsgaard, C. Åkerman, H. J. Foged, N. Blikra, L. H. Pernosky, M. A., and Ødegård, R. S.: The thermal state of permafrost in the Nordic area during the International Polar Year 2007–2009, Permafrost Periglac., 21, 156–181, https://doi.org/10.1002/ppp.687, 2010.
Christiansen, H. H., Humlum, O., and Eckerstorfer, M.: Central Svalbard 2000–2011 meteorological dynamics and periglacial landscape response, Arct. Antarct. Alp. Res., 45, 6–18, https://doi.org/10.1657/1938-4246-45.16, 2013.
Christiansen, H. H., Gilbert, G. L., Demidov, N., Guglielmin, M., Isaksen, K., Osuch, M., and Boike, J.: Permafrost temperatures and active layer thickness in Svalbard 2017–2018. State of Environmental Science in Svalbard, SESS report 2019, edited by: Van den Heuvel, F., Hübner, C., Błaszczyk, M., Heimann, M., and Lihavainen, H., Longyearbyen, Svalbard Integrated Arctic Earth Observing System, Report card, 236–249, https://epic.awi.de/id/eprint/50889/ (last access: 16 August 2023), 2020.
Cochand, M., Molson, J., and Lemieux, J. M.: Groundwater hydrogeochemistry in permafrost regions, Permafrost Periglac., 30, 90–103, https://doi.org/10.1002/ppp.1998, 2019.
Cocks, F. H. and Brower, W. E.: Phase diagram relationships in cryobiology, Cryobiology, 11, 340–358, https://doi.org/10.1016/0011-2240(74)90011-X, 1974.
Cosenza, P., Guerin, R., and Tabbagh, A.: Relationship between thermal conductivity and water content of soils using numerical modelling, Eur. J. Soil Sci., 54, 581–588, https://doi.org/10.1046/j.1365-2389.2003.00539.x, 2003.
Crank, J.: Free and moving boundary problems, Oxford University Press, USA, ISBN 0-19-853370-5, 1984.
de Baar, H. J. W., van Heuven, S. M. A. C., and Middag, R.: Ocean Salinity, Major Elements, and Thermohaline Circulation, in: Encyclopedia of Geochemistry, edited by: White, W., Encyclopedia of Earth Sciences Series, Springer, Cham, https://doi.org/10.1007/978-3-319-39193-9_120-1, 2017.
Dobinski, W.: Permafrost, Earth-Sci. Rev., 108, 158–169, https://doi.org/10.1016/j.earscirev.2011.06.007, 2011.
Edmunds, W. M., Hinsby, K., Marlin, C., de Melo, M. C., Manzano, M., Vaikmae, R., and Travi, Y.: Evolution of groundwater systems at the European coastline, Geol. Soc. Sp. London, 189, 289–311, https://doi.org/10.1144/GSL.SP.2001.189.01.17, 2001.
El Kadi, K. and Janajreh, I.: Desalination by freeze crystallization: an overview, Int. J. Therm. Environ. Eng, 15, 103–110, https://doi.org/10.5383/ijtee.15.02.004, 2017.
Elverhøi, A., Svendsen, J. I., Solheim, A., Andersen, E. S., Milliman, J., Mangerud, J., and Hooke, R. L.: Late Quaternary sediment yield from the high Arctic Svalbard area, J. Geol., 103, 1–17, https://doi.org/10.1086/629718, 1995.
Etzelmüller, B., Schuler, T. V., Isaksen, K., Christiansen, H. H., Farbrot, H., and Benestad, R.: Modeling the temperature evolution of Svalbard permafrost during the 20th and 21st century, The Cryosphere, 5, 67–79, https://doi.org/10.5194/tc-5-67-2011, 2011.
Farbrot, H., Etzelmüller, B., Schuler, T. V., Guðmundsson, Á., Eiken, T., Humlum, O., and Björnsson, H.: Thermal characteristics and impact of climate change on mountain permafrost in Iceland, J. Geophys. Res.-Earth, 112, F03S90, https://doi.org/10.1029/2006JF000541, 2007.
Farnsworth, W. R.: The Topographical and Meteorological Influence on Snow Distribution in Central Spitsbergen: How the spatial variability of snow influences slope-scale stability, permafrost landform dynamics and regional distribution trends The Topographical and Meteorological Influence on Snow Distribution in Central Svalbard, Master Thesis, Department of geosciences faculty of mathematics and natural sciences, University of Oslo, https://www.duo.uio.no/ (last access: 16 August 2023), 2013.
Farnsworth, W. R., Ingólfsson, Ó., Alexanderson, H., Allaart, L., Forwick, M., Noormets, R., Retelle, M., and Schomacker, A.: Holocene glacial history of Svalbard: Status, perspectives and challenges, Earth-Sci. Rev., 208, 103249, https://doi.org/10.1016/j.earscirev.2020.103249, 2020.
Farouki, O. T.: Thermal properties of soils, Cold Regions Research and Engineering Lab, Hanover NH, 1981.
Forman, S. L., Lubinski, D. J., Ingólfsson, Ó., Zeeberg, J. J., Snyder, J. A., Siegert, M. J., and Matishov, G. G.: A review of postglacial emergence on Svalbard, Franz Josef Land and Novaya Zemlya, northern Eurasia, Quaternary Sci. Rev., 23, 1391–1434, https://doi.org/10.1016/j.quascirev.2003.12.007, 2004.
French, H. M.: The periglacial environment, 4th edition, John Wiley and Sons LTD, ISBN 9781119132790, 2017.
Gilbert, G. L., Christiansen, H. H., and Neumann, U.: Coring of unconsolidated permafrost deposits: methodological successes and challenges, in: Proceedings GeoQuébec 2015 – 68th Canadian Geotechnical Conference and 7th Canadian Permafrost Conference, 20–23 September 2015, Québec, Canada, Canadian Geotechnical Society, 20–23, Paper, 6 pp., https://hdl.handle.net/1956/17626 (last access: 16 August 2023), 2015.
Gilbert, G. L., O'Neill, H. B., Nemec, W., Thiel, C., Christiansen, H. H., and Buylaert, J. P.: Late Quaternary sedimentation and permafrost development in a Svalbard fjord-valley, Norwegian high Arctic, Sedimentology, 65, 2531–2558, https://doi.org/10.1111/sed.12476, 2018.
Gilbert, G., Instanes, A., Sinitsyn, A., and Aalberg, A.: Characterization of two sites for geotechnical testing in permafrost: Longyearbyen, Svalbard, Norges Geotekniske Institutt, http://hdl.handle.net/11250/2632119 (last access: 16 August 2023), 2019.
Gitterman, K. E.: Thermal analysis of sea water, CRREL TL 287, USA Cold Regions Res. and Eng. Lab., Hanover, N.H., 1937.
Grinter, M., Lacelle, D., Baranova, N., Murseli, S., and Clark, I. D.: Late Pleistocene and Holocene ice-wedge activity on the Blackstone Plateau, central Yukon, Canada, Quaternary Res., 91, 1–15, https://doi.org/10.1017/qua.2018.65, 2018.
Grünberg, I., Wilcox, E. J., Zwieback, S., Marsh, P., and Boike, J.: Linking tundra vegetation, snow, soil temperature, and permafrost, Biogeosciences, 17, 4261–4279, https://doi.org/10.5194/bg-17-4261-2020, 2020.
Grundvåg, S. A., Jelby, M. E., Śliwińska, K. K., Nøhr-Hansen, H., Aadland, T., Sandvik, S. E., Tennvassås, I., Engen, T., and Olaussen, S.: Sedimentology and palynology of the Lower Cretaceous succession of central Spitsbergen: integration of subsurface and outcrop data, Norw. J. Geol., 99, 253–284, https://doi.org/10.17850/njg006, 2019.
Harada, K. and Yoshikawa, K.: Permafrost age and thickness near Adventfjorden, Spitsbergen, Polar Geography, 20, 267–281, https://doi.org/10.1080/10889379609377607, 1996.
He, H., Flerchinger, G. N., Kojima, Y., Dyck, M., and Lv, J.: A review and evaluation of 39 thermal conductivity models for frozen soils, Geoderma, 382, 114694, https://doi.org/10.1016/j.geoderma.2020.114694, 2021.
Herut, B., Starinsky, A., Katz, A., and Bein, A.: The role of seawater freezing in the formation of subsurface brines, Geochim. Cosmochim. Acta, 54, 13–21, https://doi.org/10.1016/0016-7037(90)90190-V, 1990.
Hindshaw, R. S., Heaton, T. H., Boyd, E. S., Lindsay, M. R., and Tipper, E. T.: Influence of glaciation on mechanisms of mineral weathering in two high Arctic catchments, Chem. Geol., 420, 37–50, https://doi.org/10.1016/j.chemgeo.2015.11.004, 2016.
Hodson, A. J., Nowak, A., Hornum, M. T., Senger, K., Redeker, K., Christiansen, H. H., Jessen, S., Betlem, P., Thornton, S. F., Turchyn, A. V., Olaussen, S., and Marca, A.: Sub-permafrost methane seepage from open-system pingos in Svalbard, The Cryosphere, 14, 3829–3842, https://doi.org/10.5194/tc-14-3829-2020, 2020.
Homshaw, L. G.: Freezing and melting temperature hysteresis of water in porous materials: Application to the study of pore form, J. Soil Sci., 31, 399–414, https://doi.org/10.1111/j.1365-2389.1980.tb02090.x, 1980.
Hornum, M. T., Hodson, A. J., Jessen, S., Bense, V., and Senger, K.: Numerical modelling of permafrost spring discharge and open-system pingo formation induced by basal permafrost aggradation, The Cryosphere, 14, 4627–4651, https://doi.org/10.5194/tc-14-4627-2020, 2020.
Hornum, M. T., Betlem, P., and Hodson, A.: Groundwater flow through continuous permafrost along geological boundary revealed by electrical resistivity tomography, Geophys. Res. Lett., 48, e2021GL092757, https://doi.org/10.1029/2021GL092757, 2021.
Humlum, O.: Holocene permafrost aggradation in Svalbard, Geol. Soc. Spec. Publ. London, 242, 119–129, https://doi.org/10.1144/GSL.SP.2005.242.01.11, 2005.
Humlum, O., Instanes, A., and Sollid, J. L.: Permafrost in Svalbard: a review of research history, climatic background and engineering challenges, Polar Res., 22, 191–215, 2003.
Imbrie, J., Berger, A., Boyle, E., Clemens, S. C., Duffy, A., Howard, W. R., Kukla,, G., Kutzbach, J. Martinson, D. G., McIntyre, A., Mix, A. C., Molfino, B., Morley, J. J., Peterson, L. C., Pisias, N. G., Prell, M. E., Raymo, W. L., Shackleton, N. J., and Toggweiler, J. R.: On the structure and origin of major glaciation cycles 2. The 100 000-year cycle, Paleoceanography, 8, 699–735, https://doi.org/10.1029/93PA02751, 1993.
Isaksen, K., Benestad, R. E., Harris, C., and Sollid, J. L.: Recent extreme near-surface permafrost temperatures on Svalbard in relation to future climate scenarios, Geophys. Res. Lett., 34, L17502, https://doi.org/10.1029/2007GL031002, 2007.
Kasprzak, M., Łopuch, M., Głowacki, T., and Milczarek, W., Evolution of near-shore outwash fans and permafrost spreading under their surface: A case study from Svalbard, Remote Sens.-Basel, 12, 482, https://doi.org/10.3390/rs12030482, 2020.
Kaufman, D. S., Axford, Y. L., Henderson, A. C., McKay, N. P., Oswald, W. W., Saenger, C., Anderson, R. S., Bailey, H. L., Clegg, B., Gajewski, K., Hu, F. S., Jones, M. C., Massa, C., Routson, C. C., Werner, A., Wooller, M. J., and Yu, Z.: Holocene climate changes in eastern Beringia (NW North America) – A systematic review of multi-proxy evidence, Quaternary Sci. Rev., 147, 312–339, https://doi.org/10.1016/j.quascirev.2015.10.021, 2015.
Keating, K., Binley, A., Bense, V., Van Dam, R. L., and Christiansen, H. H.: Combined geophysical measurements provide evidence for unfrozen water in permafrost in the Adventdalen valley in Svalbard, Geophys. Res. Lett., 45, 7606–7614, https://doi.org/10.1029/2017GL076508, 2018.
Kjellman, S. E., Schomacker, A., Thomas, E. K., Håkansson, L., Duboscq, S., Cluett, A. A., Farnsworth, W. R., Allaart L., Cowling, O. C., McKay, N. P., Brynjólfsson, S., and Ingólfsson, Ó.: Holocene precipitation seasonality in northern Svalbard: influence of sea ice and regional ocean surface conditions, Quaternary Sci. Rev., 240, 106388, https://doi.org/10.1016/j.quascirev.2020.106388, 2020.
Kokelj, S. V., Smith, C. A. S., and Burn, C. R.: Physical and chemical characteristics of the active layer and permafrost, Herschel Island, western Arctic Coast, Canada, Permafrost Periglac., 13, 171–185, https://doi.org/10.1002/ppp.417, 2002.
Kukkonen, I. T. and Šafanda, J.: Numerical modelling of permafrost in bedrock in northern Fennoscandia during the Holocene, Global Planet. Change, 29, 259–273, https://doi.org/10.1016/S0921-8181(01)00094-7, 2001.
Kutzbach, J. E. and Guetter, P. J.: The influence of changing orbital parameters and surface boundary conditions on climate simulations for the past 18 000 years, J. Atmos. Sci., 43, 1726–1759, https://doi.org/10.1175/1520-0469(1986)043<1726:TIOCOP>2.0.CO;2, 1986.
Landvik, J. Y., Mangerud, J., and Salvigsen, O.: Glacial history and permafrost in the Svalbard area, in: Proceedings of the 5th International Conference on Permafrost, 2–5 August 1988, Trondheim, Norway, Tapir Publishers, vol. 1, 194–198, ISBN 82-519-08639, 1988.
Lemieux, J. M., Sudicky, E. A., Peltier, W. R., and Tarasov, L.: Simulating the impact of glaciations on continental groundwater flow systems: 1. Relevant processes and model formulation, J. Geophys. Res.-Earth, 113, F03017, https://doi.org/10.1029/2007JF000928, 2008.
Lenz, J., Grosse, G., Jones, B. M., Walter Anthony, K. M., Bobrov, A., Wulf, S., and Wetterich, S.: Mid-Wisconsin to Holocene Permafrost and Landscape Dynamics based on a Drained Lake Basin Core from the Northern Seward Peninsula, Northwest Alaska, Permafrost Periglac., 27, 56–75, https://doi.org/10.1002/ppp.1848, 2015.
Lønne, I. and Lyså, A.: Deglaciation dynamics following the Little Ice Age on Svalbard: implications for shaping of landscapes at high latitudes, Geomorphology, 72, 300–319, https://doi.org/10.1016/j.geomorph.2005.06.003, 2005.
Lønne, I. and Nemec, W.: High-arctic fan delta recording deglaciation and environment disequilibrium, Sedimentology, 51, 553–589, https://doi.org/10.1111/j.1365-3091.2004.00636.x, 2004.
Lunardini, V. J.: Freezing of soil with an unfrozen water content and variable thermal properties, US Army Corps of Engineers, Cold Regions Research and Engineering Laboratory, vol. 88, No. 2, http://hdl.handle.net/11681/9076 (last access: 16 August 2023), 1988.
Luo, D., Jin, H., Marchenko, S. S., and Romanovsky, V. E.: Difference between near-surface air, land surface and ground surface temperatures and their influences on the frozen ground on the Qinghai-Tibet Plateau, Geoderma, 312, 74–85, https://doi.org/10.1016/j.geoderma.2017.09.037, 2018.
Lüthi, Z. L.: Thermal State of Permafrost in Central and Western Spitsbergen 2008–2009, Master's Thesis, Faculty of Science University of Bern, 2010.
Mangerud, J. and Svendsen, J. I.: The Holocene thermal maximum around Svalbard, Arctic North Atlantic; molluscs show early and exceptional warmth, Holocene, 28, 65–83, https://doi.org/10.1177/0959683617715701, 2018.
Mangerud, J., Bolstad, M., Elgersma, A., Helliksen, D., Landvik, J. Y., Lønne, I., Lycke, A. K., Salvigsen, O., Sandahl, T., and Svendsen, J. I.: The last glacial maximum on Spitsbergen, Svalbard, Quaternary Res., 38, 1–31, https://doi.org/10.1016/0033-5894(92)90027-G, 1992.
Mangerud, J., Astakhov, V., and Svendsen, J. I.: The extent of the Barents–Kara ice sheet during the Last Glacial Maximum, Quaternary Sci. Rev., 21, 111–119, https://doi.org/10.1016/S0277-3791(01)00088-9, 2002.
Marion, G. M., Farren, R. E., and Komrowski, A. J.: Alternative pathways for seawater freezing, Cold Reg. Sci. Technol., 29, 259–266, https://doi.org/10.1016/S0165-232X(99)00033-6, 1999.
McEwen, T. and de Marsily, G.: The potential significance of permafrost to the behaviour of a deep radioactive waste repository, Sweden, SKI-TR–91-8, http://inis.iaea.org/search/search.aspx?orig_q=RN:24007818 (last access: 16 August 2023), 1991.
McFarlin, J. M., Axford, Y., Osburn, M. R., Kelly, M. A., Osterberg, E. C., and Farnsworth, L. B.: Pronounced summer warming in northwest Greenland during the Holocene and Last Interglacial, P. Natl. Acad. Sci. USA, 115, 6357–6362, https://doi.org/10.1073/pnas.1720420115, 2018.
McKinney W.: Python for data analysis: Data wrangling with Pandas Numpy and Ipython, O'Reilly Media Inc, ISBN 9781449319793, 2012.
Morgenstern, N. R. and Anderson, D. M.: Physics, chemistry, and mechanics of frozen ground: a review, in: Permafrost: North American Contribution [to The] Second International Conference, 13–28 July 1973, Yakutsk, Siberia, National Academies, vol. 2, p. 257, https://doi.org/10.17226/20223, 1973.
Murton, J. B.: What and where are periglacial landscapes?, Permafrost Periglac., 32, 186–212, https://doi.org/10.1002/ppp.2102, 2021.
Nelson, K. H. and Thompson, T. G.: Deposition of salts from sea water by frigid concentration, Technical Report No. 29, Office of Naval Research, Contract N8onr-520/III, Project NR 083 012, 1954.
Nordli, Ø., Przybylak, R., Ogilvie, A. E., and Isaksen, K.: Long-term temperature trends and variability on Spitsbergen: the extended Svalbard Airport temperature series, 1898–2012, Polar Res., 33, 21349, https://doi.org/10.3402/polar.v33.21349, 2014.
Nordli, Ø., Wyszyński, P., Gjelten, H., Isaksen, K., Łupikasza, E., Niedźwiedź, T., and Przybylak, R.: Revisiting the extended Svalbard Airport monthly temperature series, and the compiled corresponding daily series 1898–2018, Co-Action Publishing, https://doi.org/10.33265/polar.v39.3614, 2020.
Obu, J., Westermann, S., Bartsch, A., Berdnikov, N., Christiansen, H. H., Dashtseren, A., Delaloye, R., Elberling, B., Etzelmüller, B., Kholodov, A., Khomutov, A., Kääb, A., Leibman, M. O., Lewkowicz, A. G., Panda, S. K., Romanovsky, V., Way, R. G., Westergaard-Nielsen, A., Wu, T., Yamkhin, J., and Zou, D.: Northern Hemisphere permafrost map based on TTOP modelling for 2000–2016 at 1 km2 scale, Earth-Sci. Rev., 193, 299–316, https://doi.org/10.1016/j.earscirev.2019.04.023, 2019.
Olaussen, S., Senger, K., Braathen, A., Grundvåg, S. A., and Mørk, A.: You learn as long as you drill; research synthesis from the Longyearbyen CO2 Laboratory, Svalbard, Norway, Norw. J. Geol., 99, 157–187, https://doi.org/10.17850/njg008, 2019.
Oldenborger, G. A. and LeBlanc, A. M.: Monitoring changes in unfrozen water content with electrical resistivity surveys in cold continuous permafrost, Geophys. J. Int., 215, 965–977, https://doi.org/10.1093/gji/ggy321, 2018.
Osuch, M. and Wawrzyniak, T.: Inter-and intra-annual changes in air temperature and precipitation in western Spitsbergen, Int. J. Climatol., 37, 3082–3097, https://doi.org/10.1002/joc.4901, 2017.
Overduin, P. P., Miesner, F., Grigoriev, M. N., Ruppel, C., Vasiliev, A., Lantuit, H., Juhls, B., and Westermann, S.: Submarine permafrost map in the Arctic modeled using 1-D transient heat flux (SuPerMAP), J. Geophys. Res.-Oceans, 124, 3490–3507, https://doi.org/10.1029/2018JC014675, 2019.
Park, H. S., Kim, S. J., Stewart, A. L., Son, S. W., and Seo, K. H.: Mid-Holocene Northern Hemisphere warming driven by Arctic amplification, Science Advances, 5, eaax8203, https://doi.org/10.1126/sciadv.aax8203, 2019.
Patton, H., Hubbard, A., Andreassen, K., Auriac, A., Whitehouse, P. L., Stroeven, A. P., Shackleton, C., Winsborrow, M., Heyman, J., and Hall, A. M.: Deglaciation of the Eurasian ice sheet complex, Quaternary Sci. Rev., 169, 148–172, https://doi.org/10.1016/j.quascirev.2017.05.019, 2017.
Rasmussen, T. L., Forwick, M., and Mackensen, A.: Reconstruction of inflow of Atlantic Water to Isfjorden, Svalbard during the Holocene: Correlation to climate and seasonality, Mar. Micropaleontol., 94, 80–90, https://doi.org/10.1016/j.marmicro.2012.06.008, 2012.
Ringer, W. E.: Über die Veranderungen in der Zusammensetzung des Meereswassersalzes beim Ausfrieres, Conseil Permanent International pour l'Exploration de la Mer, November 1928, France, Rapport 47, 226–232, 1928.
Rotem, D.: 1-D freeze-thaw model code, Rotem et al., 2023, figshare [code], https://doi.org/10.6084/m9.figshare.23684493, 2023.
Rubinstein, L., Geiman, H., and Shachaf, M.: Heat transfer with a free boundary moving within a concentrated thermal capacity, IMA J. Appl. Math., 28, 131–147, https://doi.org/10.1093/imamat/28.2.131, 1982.
Rühaak, W., Anbergen, H., Grenier, C., McKenzie, J., Kurylyk, B. L., Molson, J., Roux, N., and Sass, I.: Benchmarking numerical freeze thaw models, Enrgy. Proced., 76, 301–310, https://doi.org/10.1016/j.egypro.2015.07.866, 2015.
Russak, A. and Sivan, O.: Hydrogeochemical tool to identify salinization or freshening of coastal aquifers determined from combined field work, experiments, and modeling, Environ. Sci. Technol., 44, 4096–4102, https://doi.org/10.1021/es1003439, 2010.
Salvigsen, O.: Occurrence of pumice on raised beaches and Holocene shoreline displacement in the inner Isfjorden area, Svalbard, Polar Res., 2, 107–113, https://doi.org/10.1111/j.1751-8369.1984.tb00488.x, 1984.
Šarler, B.: Stefan's work on solid-liquid phase changes, Eng. Anal. Bound. Elem., 16, 83–92, https://doi.org/10.1016/0955-7997(95)00047-X, 1995.
Sessford, E. G., Strzelecki, M. C., and Hormes, A.: Reconstruction of Holocene patterns of change in a High Arctic coastal landscape, Southern Sassenfjorden, Svalbard, Geomorphology, 234, 98–107, https://doi.org/10.1016/j.geomorph.2014.12.046, 2015.
Solomon, S. M., Taylor, A. E., and Stevens, C. W.: Nearshore ground temperatures, seasonal ice bonding, and permafrost formation within the bottom-fast ice zone, Mackenzie Delta, NWT, in: Proceedings of the Ninth International Conference on Permafrost, 28 June–3 July 2008, Fairbanks, Alaska, USA, Institute of Northern Engineering, University of Alaska Fairbanks, Fairbanks, vol. 29, 1675–1680, ISBN 978-0-9800179-3-9 (v.2), 2008.
Strand, S. M., Christiansen, H. H., Johansson, M., Åkerman, J., and Humlum, O.: Active layer thickening and controls on interannual variability in the Nordic Arctic compared to the circum-Arctic, Permafrost Periglac., 32, 47–58, https://doi.org/10.1002/ppp.2088, 2021.
Svendsen, J. I. and Mangerud, J.: Holocene glacial and climatic variations on Spitsbergen, Svalbard, Holocene, 7, 45–57, https://doi.org/10.1177/095968369700700105, 1997.
Szafraniec, J. E. and Dobiński, W.: Deglaciation rate of selected Nunataks in Spitsbergen, Svalbard – Potential for permafrost expansion above the glacial environment, Geosciences, 10, 202, https://doi.org/10.3390/geosciences10050202, 2020.
Tavakoli, S., Gilbert, G., Lysdahl, A. O. K., Frauenfelder, R., and Forsberg, C. S.: Geoelectrical properties of saline permafrost soil in the Adventdalen valley of Svalbard (Norway), constrained with in-situ well data, J. Appl. Geophys., 195, 104497, https://doi.org/10.1016/j.jappgeo.2021.104497, 2021.
Treat, C. C. and Jones, M. C.: Near-surface permafrost aggradation in Northern Hemisphere peatlands shows regional and global trends during the past 6000 years, Holocene, 28, 998–1010, https://doi.org/10.1177/0959683617752858, 2018.
Ulrich, M., Wetterich, S., Rudaya, N., Frolova, L., Schmidt, J., Siegert, C., Fedorov A. N., and Zielhofer, C.: Rapid thermokarst evolution during the mid-Holocene in Central Yakutia, Russia, Holocene, 27, 1899–1913, https://doi.org/10.1177/0959683617708454, 2017.
van der Bilt, W. G., D'Andrea, W. J., Bakke, J., Balascio, N. L., Werner, J. P., Gjerde, M., and Bradley, R. S.: Alkenone-based reconstructions reveal four-phase Holocene temperature evolution for High Arctic Svalbard, Quaternary Sci. Rev., 183, 204–213, https://doi.org/10.1016/j.quascirev.2016.10.006, 2018.
van der Bilt, W. G., D'Andrea, W. J., Werner, J. P., and Bakke, J.: Early Holocene temperature oscillations exceed amplitude of observed and projected warming in Svalbard lakes, Geophys. Res. Lett., 46, 14732–14741, https://doi.org/10.1029/2019GL084384, 2019.
Verruijt, A.: A note on the Ghyben–Herzberg formula, Hydrolog. Sci. J., 13, 43–46, https://doi.org/10.1080/02626666809493624, 1968.
Waller, R. I., Murton, J. B., and Kristensen, L.: Glacier–permafrost interactions: Processes, products and glaciological implications, Sediment Geol., 255, 1–28, https://doi.org/10.1016/j.sedgeo.2012.02.005, 2012.
Walvoord, M. A. and Kurylyk, B. L.: Hydrologic impacts of thawing permafrost – A review, Vadose Zone J., 15, 1–20, https://doi.org/10.2136/vzj2016.01.0010, 2016.
Weinstein, Y., Rotem, D., Kooi, H., Yechieli, Y., Sültenfuß, J., Kiro, Y., Harlavan, Y., Feldman, M., and Christiansen, H. H.: Radium isotope fingerprinting of permafrost-applications to thawing and intra-permafrost processes, Permafrost Periglac., 30, 104–112, https://doi.org/10.1002/ppp.1999, 2019.
Williams, P. J. and Smith, M. W.: The frozen earth: fundamentals of geocryology, Cambridge University Press, Cambridge, vol. 306, https://doi.org/10.1017/CBO9780511564437, 1989.
Yang, B., Bai, F., Wang, Y., and Wang, Z.: How mushy zone evolves and affects the thermal behaviours in latent heat storage and recovery: A numerical study, Int. J. Energ. Res., 44, 4279–4297, https://doi.org/10.1002/er.5191, 2020.
Zhang, N. and Wang, Z.: Review of soil thermal conductivity and predictive models, Int. J. Therm. Sci., 117, 172–183, https://doi.org/10.1016/j.ijthermalsci.2017.03.013, 2017.
Zhang, T.: Influence of the seasonal snow cover on the ground thermal regime: An overview, Rev. Geophys., 43, RG4002, https://doi.org/10.1029/2004RG000157, 2005.
- Abstract
- Introduction
- Study site
- Methods
- Ground ice chemistry
- Model of permafrost formation
- Discussion
- Summary and conclusions
- Appendix A: Porosity analyses
- Code availability
- Data availability
- Author contributions
- Competing interests
- Disclaimer
- Acknowledgements
- Financial support
- Review statement
- References