the Creative Commons Attribution 4.0 License.
the Creative Commons Attribution 4.0 License.
 | 18 Jul 2023
Black carbon concentrations and modeled smoke deposition fluxes to the bare-ice dark zone of the Greenland Ice Sheet
Peng Xian
Joshua P. Schwarz
Ice–albedo feedbacks in the ablation region of the Greenland Ice Sheet (GrIS) are difficult to constrain and model due, in part, to our limited understanding of the seasonal evolution of the bare-ice region. To help fill observational gaps, 13 surface samples were collected on the GrIS across the 2014 summer melt season from patches of snow and ice that were visibly light, medium, and dark colored. These samples were analyzed for their refractory black carbon (rBC) concentrations and size distributions with a single-particle soot photometer coupled to a characterized nebulizer. We present a size distribution of rBC in fresh snow on the GrIS and from the weathering crust in the bare-ice dark zone of the GrIS. The size distributions from the weathering crust samples appear unimodal and were overall smaller than the fresh snow sample, with a peak around 0.3 µm. The fresh snow sample contained very large rBC particles that had a pronounced bimodality in the peak size distributions, with peaks around 0.2 and 2 µm. rBC concentrations ranged from a minimum of 3 in light-colored patches at the beginning and end of the melt season to a maximum of 32 in a dark patch in early August. On average, the rBC concentrations were higher (20 ± 10 ) in patches that were visibly dark, compared to medium patches (7 ± 2 ) and light patches (4 ± 1 ), suggesting that BC aggregation contributed to snow aging on the GrIS, and vice versa. Additionally, concentrations peaked in light and dark patches in early August, which is likely due to smoke transport from wildfires in northern Canada and Alaska, as supported by the Navy Aerosol Analysis and Prediction System (NAAPS) reanalysis model. According to the model output, 26 mg m−3 of biomass-burning-derived smoke was deposited between 1 April and 30 August, of which 85 % came from wet deposition, and 67 % was deposited during our sample collection time frame. The increase in the rBC concentration and size distributions immediately after the modeled smoke deposition fluxes suggest that biomass burning smoke is a source of BC to the dark zone of the GrIS. Thus, the role of BC in the seasonal evolution of the ice–albedo feedbacks should continue to be investigated in the weathering crust of the bare-ice zone of the GrIS.
- Article
(3859 KB) - Full-text XML
- BibTeX
- EndNote


The bare-ice dark zone of the southwestern Greenland Ice Sheet (GrIS) is characterized by low albedo due, in part, to the presence of light-absorbing impurities (LAIs) that create a positive ice–albedo feedback through increased surface melting, ice grain growth, and darkening (Tedesco et al., 2016). LAIs in this region are a mixture of cryoconite, ice algae (Stibal et al., 2017; Ryan et al., 2018), dust (Wientjes et al., 2011), and black carbon (BC), such as from Northern Hemisphere fires (Khan et al., 2017a), yet the relative contribution of each light-absorbing particle is still uncertain. The radiative forcing of these LAIs, along with warming summer surface temperatures (Hanna et al., 2008), leads to large volumes of supraglacial melt (Greuell, 2000). Furthermore, retreat of the snowline is amplifying the surface melt of the GrIS due to increased bare-ice exposure (Ryan et al., 2019) and the LAI–ice–albedo feedback described above.
BC in and on snow and ice is known to warm the Arctic and contribute to snow and ice melting; however, the magnitude of its influence is still highly uncertain (e.g., Flanner et al., 2007; Bond et al., 2013). BC concentration in the air is typically operationally defined, depending on the analytical technique used (Petzold et al., 2013). Many in situ measurements of BC concentration in snow in the Arctic have been reported by the integrating plate and integrating sandwich (IS) technique, which provides an analysis of the light absorption of particulate impurities through a spectrophotometric analysis of a filter loaded with particulates collected from melted samples (e.g., Clarke and Noone, 1985; Doherty et al., 2010, 2013). Doherty et al. (2010) reported a median concentration of 3 ng g−1 in surface snow, with higher concentration layers up to ∼20 ng g−1 in snow profiles at Dye 2. Snow samples from snow pits in the northwestern sector of the GrIS were also collected in 2013 and 2014 from two traverses and analyzed for elemental/organic carbon (EC/OC). The mean concentration of the samples collected was 2.6 ng g−1, and the mean peak was 15 ng g−1. Based on these results, it was determined that EC/OC do not influence the snow albedo in the NW sector of the GrIS dry zone (Polashenski et al., 2015). Observations of refractory black carbon (rBC) analyzed by the single-particle soot photometer (SP2) have been published from snow profiles and ice cores in the accumulation region closer to the Summit research station (McConnell et al., 2007; Keegan et al., 2014; Lim et al., 2014). McConnell et al. (2007) presented BC concentrations from a 215-year ice core, termed “D4”, in west central Greenland, with average concentrations of 1.7 ng g−1 in preindustrial times, 2.3 ng g−1 over the period 1950–2002, and around 5 ng g−1 in the peak period of the early 1900s. The maximum monthly concentration observed was 58.8 ng g−1 in 1854; however, monthly concentrations only exceeded 5 ng g−1 ∼2–3 times each decade after 1950. Polashenski et al. (2015) provide a comprehensive review of previous BC concentrations in their supplemental info, showing that the BC average ranges between 1.5 and 3 ng g−1 over an annual cycle, with peak deposition occurring during summer episodic events, with concentrations of 5–10+ ng g−1 only occurring a few times at a given site per decade. Similarly, rBC concentrations from the percolation zone of the GrIS have been shown to be relatively low, at less than 1.5 ng g−1 (Lewis et al., 2021).
rBC measured by SP2 has been shown to provide more reliable measurements of concentration than the IS or EC/OC (from liquid and air samples, respectively) techniques because it is largely free from the interference of materials other than rBC (Kondo et al., 2011; Schwarz et al., 2012), such as pyrolyzed organic carbon artifacts (Lim et al., 2014). It also provides a lower detection limit and increased sensitivity at low concentrations (Lim et al., 2014). The SP2 coupled with a nebulizer also provides a measurement of the rBC particle size distribution from liquid samples.
rBC particle size has been observed in some snow samples to be larger than expected from atmospheric measurements, reflecting, to some degree, the size-dependent removal processes from the atmosphere (Schwarz et al., 2013). The rBC size distribution in snow, which at this point is constrained by direct observations not supported by detailed modeling, is a significant source of uncertainty for calculating the overall radiative forcing of BC-in-snow on the Arctic climate in addition to the global climate (e.g., Bond et al., 2013). Very few rBC size distributions in snow have been reported globally, with most measurements coming from the Arctic (Lim et al., 2014; Khan et al., 2017b; Mori et al., 2019).
Although observations of BC in snow have been previously observed in the percolation zone (Dye 2) and accumulation zone (Summit Station) by the IS technique (Doherty et al., 2010, 2013) and rBC–SP2 at Summit Station (McConnell et al., 2007; Keegan et al., 2014; Lim et al., 2014), to the authors' knowledge, no reports of rBC concentrations with size distributions in snow and weathering crust have been reported from the GrIS that provide new insight, particularly into the dynamic bare-ice region.
Here we present rBC concentrations with size distributions from the bare-ice region of the GrIS before and after being influenced by a major wildfire event, along with Navy Aerosol Analysis and Prediction System (NAAPS)-modeled wet and dry deposition. Our findings suggest that rBC weathering crust concentrations in the bare-ice zone reflect atmospheric conditions momentarily, before being reset, possibly by supraglacial melt. Additionally, the NAAPS model output suggests that most of the biomass-burning-derived smoke deposition comes in the form of wet removal (i.e., removal by precipitation). These rBC concentrations and size distributions provide insight into the seasonal evolution of impurities, which are needed to constrain ice–albedo feedbacks in the bare-ice zone of the GrIS.
2.1 Site description and snow sampling
The field site (Fig. 1) was in the southwestern region of the GrIS near the S6 automated weather station (67 04.779′ N, 49 24.077′ W; 1011 m a.s.l. – above sea level). More information on the study site can be found in Stibal et al. (2017). A fresh snow surface sample (2–3 cm) was collected just after a snow event on 27 June 2014. In total, three weathering crust samples (2–3 cm) were collected in 150 mL precleaned and combusted amber glass bottles four times between 28 June 2014 and 11 August 2014 across the 2014 summer melt season from visually identified light, medium, and dark patches of weathering crust, for a total of 13 samples, including the fresh snow. While all sample sites could include a mixture of ice algae, dust, and black carbon (i.e., cryoconite), the dark patches in particular could represent refrozen melt that is enhanced in LAIs, including rBC. A mixture of light, medium, and dark 1–3 m2 patches were sampled within the ∼0.5 km2 study area to characterize the breadth of surface types and the heterogenous distribution of impurities. Samples were stored frozen in a “field cooler” dug into the ice and then transported frozen on ice to Kangerlussuaq, shipped on dry ice to the Denver International Airport, and then transported immediately to a freezer at the Institute of Arctic and Alpine Research (INSTAAR) at the University of Colorado Boulder.
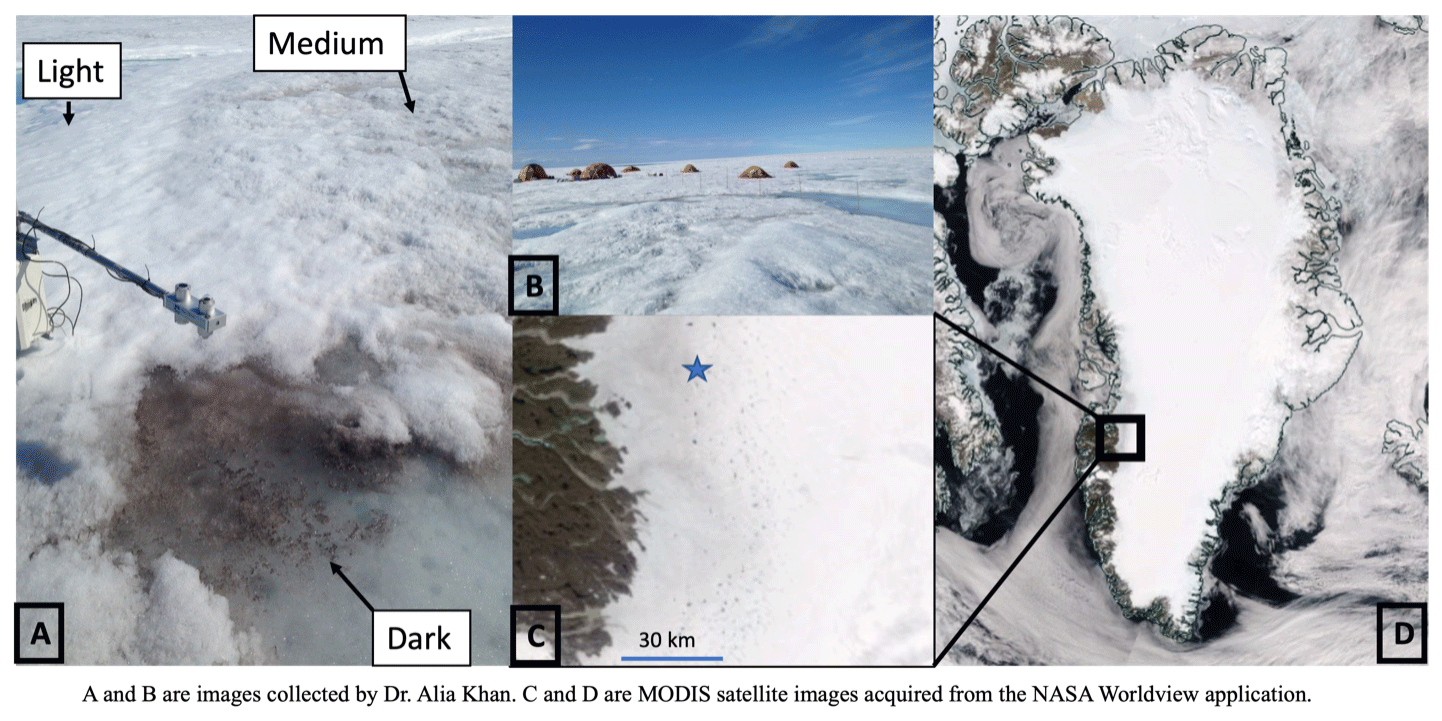
Figure 1(a) Example light, medium, and dark patches of the weathering crust. (b) The Dark Snow Field Camp. (c) The southwestern GrIS dark zone, with the field sampling location (indicated by a blue star) and (d) the GrIS from MODIS on 2 July 2014.
2.2 Processing for refractory black carbon
The samples were transported frozen from INSTAAR to the Earth System Research Laboratory (ESRL) at the National Oceanic and Atmospheric Administration (NOAA), where they were analyzed for rBC mass mixing ratios (MMRs) by SP2 coupled to a nebulizer, as per the methods described in Katich et al. (2017) and Khan et al. (2018). Briefly, the samples were melted for the first time just prior to analysis with the SP2 and aerosolized with a carefully calibrated concentric pneumatic nebulizer, based on a customized U5000AT+ nebulizer (Teledyne CETAC Technologies) in which the ultrasonic piezo was replaced with a concentric pneumatic nebulizer. The SP2 was calibrated with fullerene soot (lot no. F12S011; Alfa Aesar, Wood Hill, MA, USA) with the community calibration approach (Baumgardner et al., 2012) over masses of 1–20 fg. Using a power law calibration dependence, following Schwarz et al. (2012), the resulting linear calibration of the SP2 signal to rBC mass applied to a mass of 80 fg was extended further to 4000 fg. The SP2 was operated with a widely staggered gain for two incandescent channels, allowing the sizing of rBC mass in the range ∼1–4000 fg.
Melted snow samples were interspersed with deionized water blanks to confirm a low background, especially relative to the MMRs, indicating no appreciable contamination to concentrations and size distributions. Little size dependence in the nebulization efficiency was confirmed with the concentration standards of polystyrene latex spheres (PSLs) over 220–1500 nm diameter, which is consistent with recent results from concentric pneumatic nebulizers (Wendl et al., 2014; Katich et al., 2017). Therefore, size-dependent corrections were not necessary. During data acquisition with the SP2, its lower mass detection limit was 1.2 fg, which corresponds to about a 110 nm volume equivalent diameter (VED) size detection limit, assuming 1.8 g cm−3 void-free density. A 510 nm diameter PSL concentration standard was sampled between melted snow analyses to track possible changes in nebulization efficiency during each day of sampling. This revealed effectively constant efficiency varying with a standard deviation of less than 5 %. A gravimetric mass concentration standard (Schwarz et al., 2012) was also used to evaluate the nebulization efficiency. The results of the PSL and gravimetric calibrations of the nebulizer efficiency were consistent to within uncertainties of 20 % and were averaged to provide a best estimate nebulization efficiency that was then used to produce the BC MMR values as in Schwarz et al. (2012).
2.3 Global aerosol modeling
The NAAPS model is a global aerosol transport model which provides, every 6 h, biomass burning smoke, anthropogenic and biogenic fine aerosols, dust, and sea salt aerosol forecasts and analyses below 100 hPa at 13∘ latitude/longitude spatial resolution and contains 42 vertical atmospheric levels. The NAAPS reanalysis (NAAPS-RA) is available from 2003–present with a coarser spatial resolution (1∘ latitude/longitude horizontal and 25 vertical levels; Lynch et al., 2016). Total column aerosol optical thickness (AOT) is constrained through the assimilation of quality-controlled satellite AOT retrievals from the Moderate Resolution Imaging Spectroradiometer (MODIS) and Multi-angle Imaging SpectroRadiometer (MISR). Near-real time satellite-based thermal anomaly data enable the detection of wildfires and the construction of biomass burning smoke emissions (Reid et al., 2009). Orbital corrections for MODIS-based fire detections and regional factors were applied on emissions so that the reanalysis AOT verifies well with ground-based measurements (Lynch et al., 2016). The NAAPS-RA has been applied to a broad range of science applications, specifically the life cycle, climatology, radiative forcing, and aerosol–atmosphere–ice–ocean interactions of biomass burning smoke aerosols (e.g., Reid et al., 2012; Xian et al., 2013; Markowicz et al., 2021; Ross et al., 2018; Khan et al., 2019; Carson-Marquis et al., 2021), as well as previously to corroborate wildfire smoke transport to the GrIS (Khan et al., 2017a), Arctic Canada (Ranjbar et al., 2019), Svalbard (Markowicz et al., 2016, 2017), the pan-Arctic region (Xian et al., 2022a, b), the Nepal Himalayas (Khan et al., 2020), and the Antarctic (Khan et al., 2018, 2019). Speciated AOT, surface aerosol concentration, and deposition flux are used in this study. Here the deposition is calculated as 24 h flux to the surface of the ice sheet (in ). Estimating atmospheric properties related to biomass burning is highly complex and is influenced by wide variety of factors such as the type of fuel, combustion temperature, and atmospheric conditions. Also, the chemical, optical, and physical properties of biomass burning aerosols can change during atmospheric transport and dispersion. The mass ratio of rBC to total mass in biomass burning smoke particles is estimated to be 5 %–10 % black carbon in the NAAPS-RA model, based on field studies (see a summary in Reid et al., 2005), and here we chose 7 % as a median value.
3.1 rBC concentrations
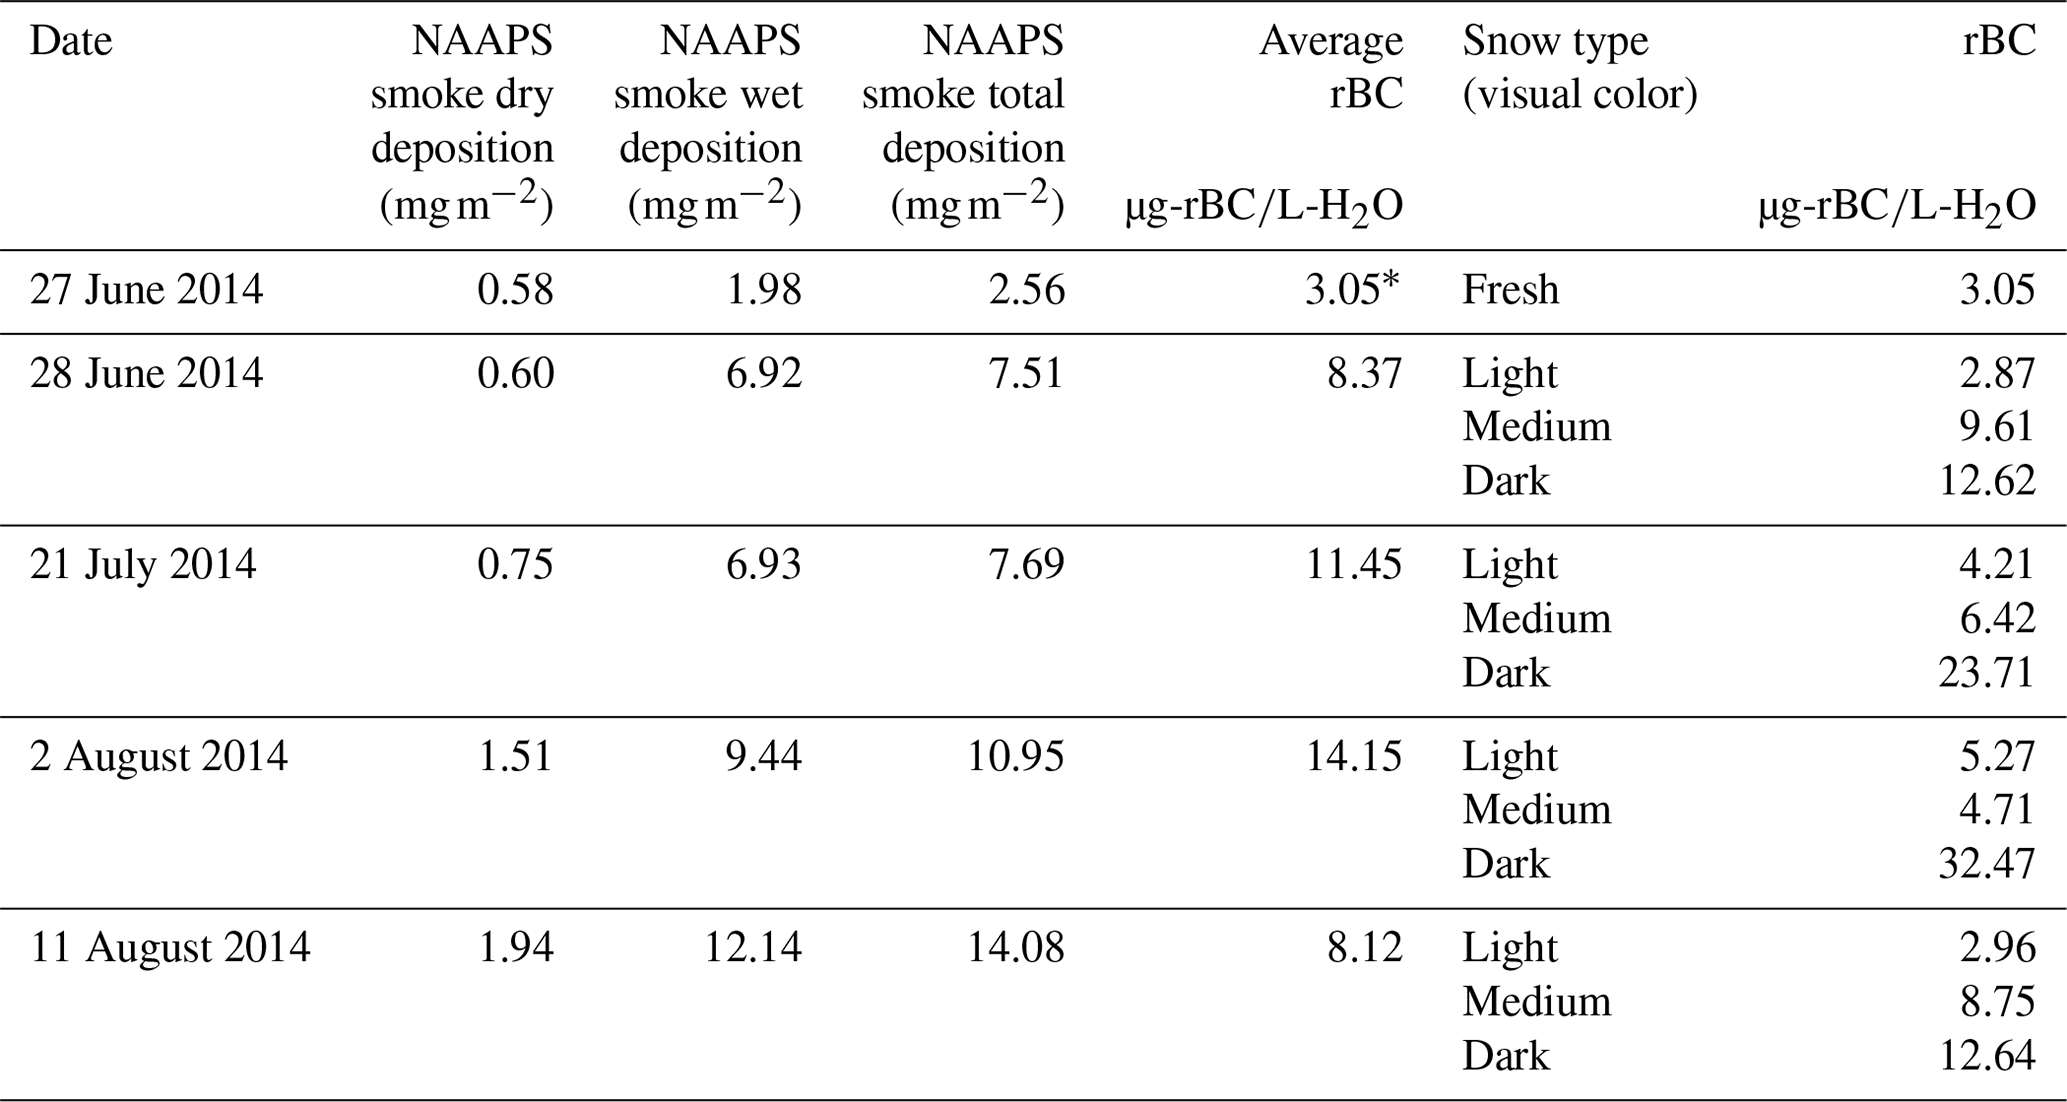
rBC concentrations in the weathering crust ranged from a minimum of 3 in light patches at the beginning and end of the melt season to a peak of 32 in a dark patch in early August (Table 1). rBC concentrations were higher in patches that were visibly darker (20 ) compared to medium patches (7 ) and light patches (4 ), suggesting that BC aggregates with dust and biological material on the GrIS. Light and dark patch concentrations peaked in early August. Our minimum concentrations are in the range of rBC concentrations found elsewhere on the GrIS, but our peaks are higher than previously reported concentrations from snow on the GrIS (Doherty et al., 2010; Polashenski et al., 2015; Lewis et al., 2021). Our maximum concentrations are higher than the highest concentrations observed in vertical snow with the IS (Doherty et al., 2010) and EC/OC techniques (Polashenski et al., 2015) but lower than the highest monthly average concentration of the year of 1854, as reported in an ice core by McConnell et al. (2007). The concentration of rBC in the fresh snow (3 ) sample was roughly the same as the light weathering crust patches on 28 June 2014 and 11 August 2014.
Table 1Cumulative NAAPS smoke dry, smoke wet, and smoke total deposition (mg m−2) from 1 April prior to the sample collection. The average rBC concentrations from visually light, medium, and dark patches of weathering crust. All samples were collected (67.07979701∘ N, −49.40116603∘ W; 1005 m a.s.l.) in the dark zone ablation region of the SW Greenland Ice Sheet. The asterisk∗ indicates that the fresh snow sample is a single sample.
3.2 rBC size distributions
We found that very large rBC are present (Fig. 2a–c), especially in the fresh snow sample. The large size distribution in fresh snow follows previous findings in the Rocky Mountains that rBC size distributions can be larger in surface snow than expected in aerosol in the atmosphere (Schwarz et al., 2013). Furthermore, the fresh event is associated with a more pronounced bimodality at ∼0.2 and 2 µm (Fig. 2a), whereas the rBC in weathering crust samples appears more unimodal (Fig. 2b and c). The average weathering crust rBC sizes, which have not been previously reported in the literature, are smaller than the single fresh snow sample, with a peak around 0.3 µm. This is still larger than typical modal sizes for rBC observed in the atmosphere (typically in the range ∼0.11–0.2 µm). Furthermore, no apparent patterns emerge in the size distributions across the light, medium, and dark patches over the duration of the season. However, the weathering crust rBC size distributions likely evolve, just as the seasonal snow cover evolves into weathering crust and bare ice, but we are unable to assess to what extent this happens from this relatively small data set. This conjecture is supported by observations that repeated freeze/thaw cycles tend to cause rBC coagulation in liquid (Schwarz et al., 2013). Regardless, these initial results of rBC size distributions from fresh snow and weathering crust in the bare-ice region of the GrIS are important for informing ice–albedo models, which are still being developed and refined, especially for bare-ice regions of the ice sheet (e.g., Whicker et al., 2022).
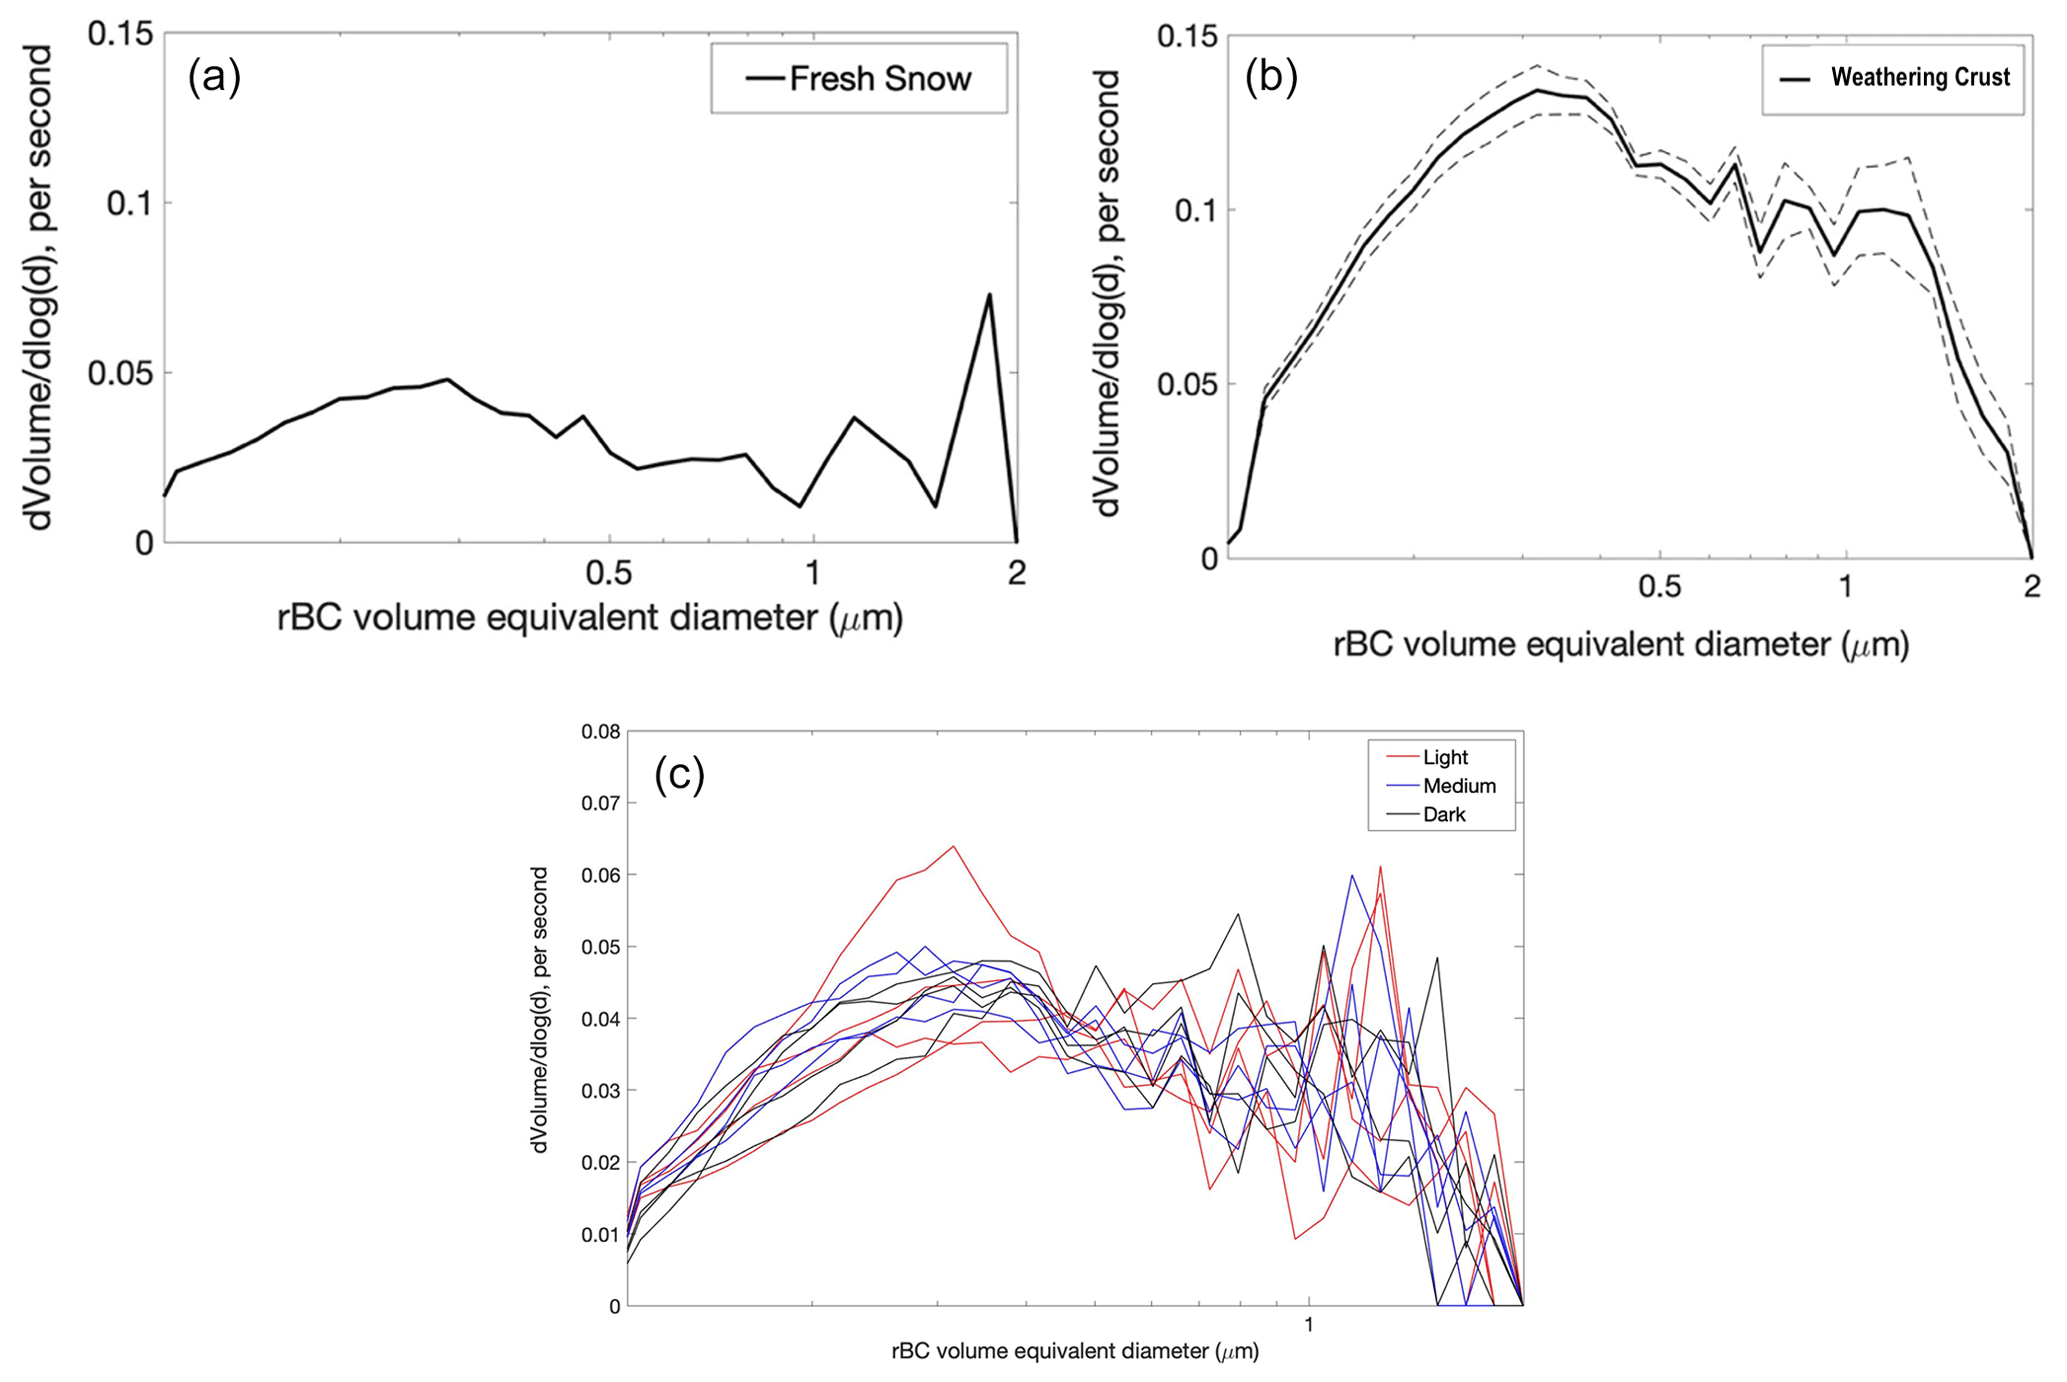
Figure 2(a) The rBC size distribution of fresh snow (n=1), (b) all weathering crust samples over the duration of the season (n=12), and (c) the size distribution of each weathering crust sample categorized as light, medium, and dark. The dashed lines in panel (b) represent the maximum and minimum size distributions, and the solid black line is the average.
3.3 NAAPS aerosol model comparison and evaluation
The ground observations were then compared to cumulative aggregates of smoke deposition fluxes modeled with the Navy Aerosol Analysis Prediction System reanalysis model. AOT derived from MODIS and modeled by NAAPS demonstrates that a large wildfire smoke event was observed just before the third sample was collected and during the time the fourth sample was collected (Fig. 3). Concomitant AOT and surface concentration predictions from the NAAPS model confirm that our peak concentrations are likely due to the presence of Northern Hemisphere wildfire smoke (Fig. 4a–d).
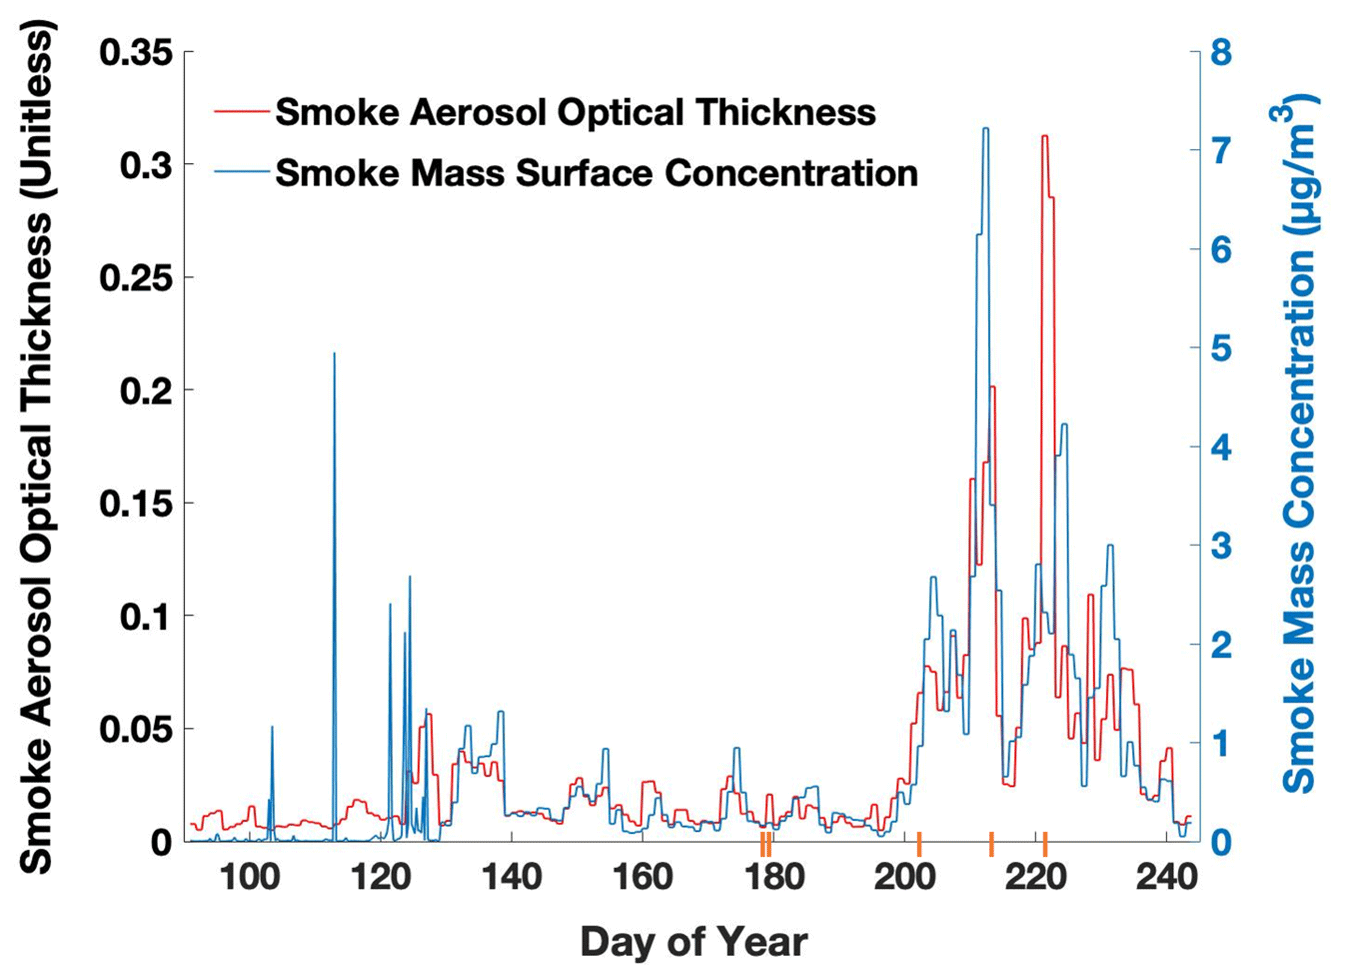
Figure 3Aerosol optical thickness (AOT) derived from NAAPS reanalysis over the sampling season from smoke and dust and smoke mass concentration (µg m−3) in the surface layer of the model (centered around 16 m) are shown. The five sampling dates are marked with orange lines on the x axis.
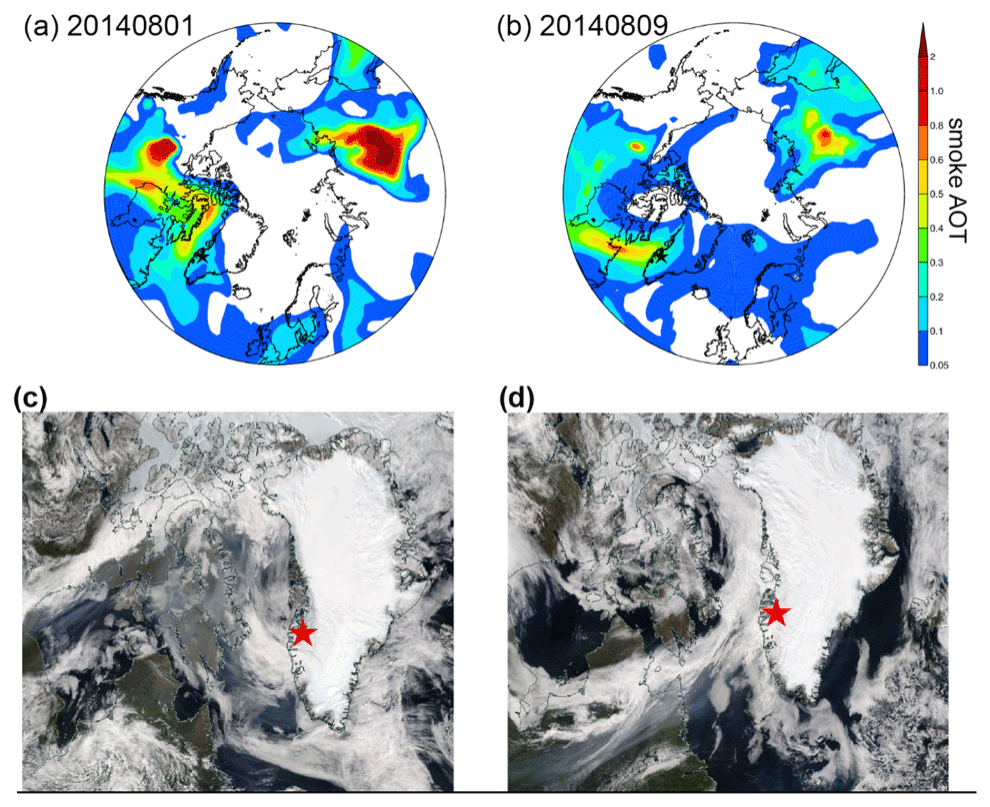
Figure 4Biomass burning smoke transport reaching the GrIS from the west, based on NAAPS-RA daily mean smoke AOT and MODIS TERRA true color images for (panels a and c) 1 August 2014 and (panels b and d) 9 August 2014. The sampling location is marked with black stars in the NAAPS-RA plots (a, b) and red stars in the MODIS images (c, d).
According to the NAAPS model output, the deposition flux of smoke (Table 1 and Fig. 5) onto the ice surface of the dark zone during our model study period, 1 April–30 August, was 19.9 mg m−2, and 85 % came from wet deposition. The period from 1 April to 30 August was chosen based on the primary Northern Hemisphere wildfire season and smoke transport to the Arctic (Xian et al., 2022b). In total, 58 % of this smoke (11.5 mg m−2) was deposited during our sample collection period from 27 June to 11 August. Prior to the first sample collected on 27 June, 13 % of the total smoke flux (2.6 mg m−2) was deposited from 1 April to 26 June. After the last sample was collected on 11 August, 5.8 mg m−2 of smoke was deposited between 12 and 30 August.
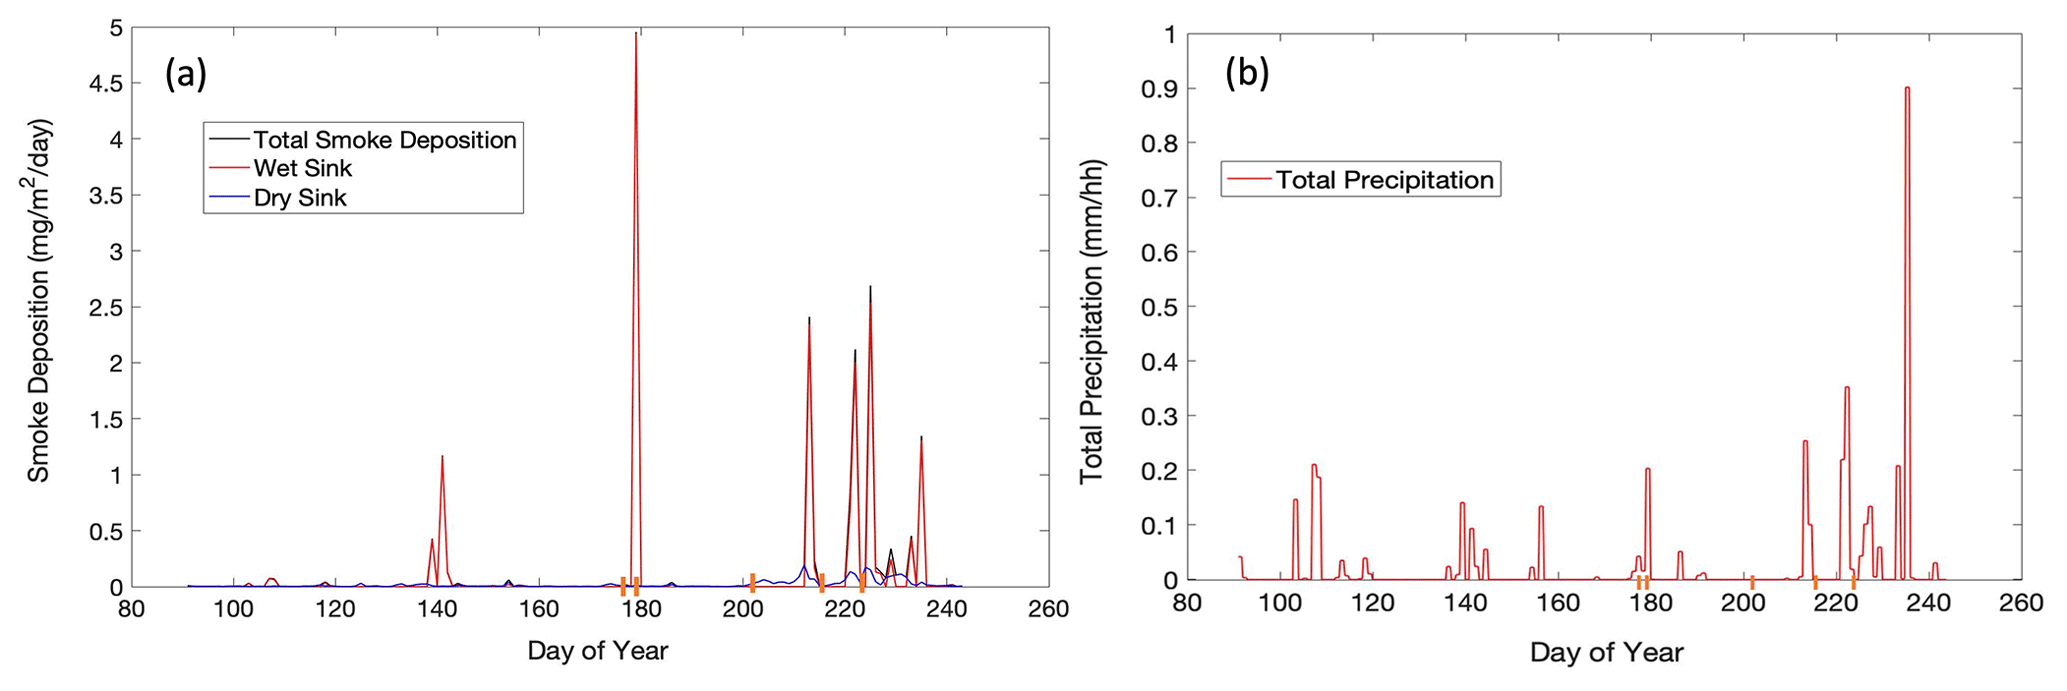
Figure 5(a) Biomass-burning-derived smoke deposition flux separated as wet and dry deposition and (b) total precipitation produced by the NAAPS model. The total smoke deposition closely follows the wet deposition line. The five sampling dates are marked with orange lines on the x axes.
We evaluate the NAAPS-RA deposition flux based on the rBC concentration observed in snow against two modeled deposition accumulation scenarios. In the first scenario, we compare fresh snow on 27 June (day of year 178), which was 3 µg-rBC/L-H2O, to the modeled smoke deposited on the same day. The NAAPS model assumes that 7 % of smoke is BC. Precipitation fell as snow for 3 d (24–26 June; day of year 175–177) and on the date of sample collection, 27 June, at around 12:00 Western Greenland Summer Time (WGST). The cumulative snow that fell between day of year 175 and 12:00 WGST on day of year 178 was 1.63 mm. The modeled smoke deposition flux over the corresponding period was 0.04 µg m−2, resulting in 0.026 mg m−2 mm−1 or 26 µg L−1. With 7 % BC of the total smoke, we are left with 1.8 µg-BC/L-H2O. Therefore, in this scenario, the model appears to be within the order of magnitude for this one snow sample, which was measured to be 3 µg-rBC/L-H2O on 27 June (day of year 178). In the second scenario, we compare the model to the sample collected on 28 June around 12:00 WGST. Here we include an aggregation of all precipitation that fell as snow for 4 d (24–27 June; day of year 175–178), including the date of sample collection, 28 June, at around 12:00 WGST. The cumulative snow that fell between the day of year 175 and at 12:00 WGST on the day of year 179 was 2.44 mm. The modeled smoke deposition flux over the corresponding period was 4.99 µg m−2, resulting in 0.43 mg m−2 mm−1 or 432 µg L−1. With 7 % BC of total smoke, we are left with 30 µg-BC/L-H2O. Samples were collected on 28 June (day of year 179) from light (3 µg-BC/L-H2O), medium (10 µg-BC/L-H2O), and dark patches (13 µg-BC/L-H2O). Therefore, in this scenario, the model is overestimating the concentration of rBC deposited. However, there are multiple physical processes that play a role in the redistribution of the deposited smoke within the surface of the ice, such as melting and flushing with supraglacial melt and freeze–thaw processes. Here we show that there is a high level of uncertainty and a potentially large bias, depending on how we calculate accumulation in the model and compare that to what is sampled in the snow. The timing of when the sample is collected also creates uncertainty, along with the volume and surface area. Continued work is in progress to evaluate the model with a larger sample size of rBC ground observations across the Arctic.
Two case studies of interest arise in the modeled total NAAPS smoke flux when comparing wet and dry deposition. The first one is a large wet deposition flux, and the second is a considerable dry deposition flux. The first wet deposition flux occurred between 27 and 28 June (day of year 178 and 179), during a snow event (Fig. 5a and b). Here we see the largest increase in the total deposition flux of smoke over the study period at 5.0 mg m−2 in just over 24 h. In total, 99.8 % of this comes from wet deposition. When we compare these model findings to the observational rBC data in the weathering crust and snow, we see that the rBC concentration in fresh snow, 3 , is high compared to pristine fresh snow previously found in Svalbard, 1 (Khan et al., 2017b). The average rBC concentration across the light, medium, and dark patches is also relatively high for a non-human-impacted site in the polar regions (Cordero et al., 2022). A previous study of black carbon in supraglacial melt from the same GrIS site confirmed that the dissolved BC molecular signature was indicative of wildfire smoke that likely came from northern Canada and Alaska (Khan et al., 2017a). Between 22 July and 2 August, the model again shows a large proportion of the total deposition flux coming from wet deposition, with 77 % of the 3.3 mg m−2. Similarly, from 3 to 11 August, 86 % of the 3.1 mg m−2 smoke deposition flux was from wet deposition (Fig. 5a). Again, this follows an increase in the total precipitation (Fig. 5b).
However, a dry deposition case arises on 21 July 2014 (day of year or DOY 202). Here the NAAPS model does not produce a large total smoke deposition flux, but the rBC concentrations are still relatively high. Since the previous sampling event on 28 June (DOY 179), the model has produced 0.14 mg m−2 total deposition flux, where only 13 % comes from wet deposition. The majority, 87 %, is from dry smoke deposition. This finding is also supported by the fact that there was little precipitation during this time, based on the NAAPS-modeled meteorology (Fig. 5b), but it is also important to note that snow aging could play a role in the aggregation of BC particles. The decrease observed in the weathering crust rBC concentrations in the 11 August samples may suggest there was a process that removed the particles from the weathering crust, such as flushing or redistribution by supraglacial melt, or uncontaminated fresh snow deposition, which could dilute the concentrations. Further investigation into this process is warranted.
Here we present (to the authors' knowledge) the first rBC size distributions from fresh snow and weathering crust in the bare-ice region of the GrIS, coupled with their concentrations. An initial rBC size distribution in a fresh snow sample from the GrIS shows pronounced bimodality and very large particles, with the second peak almost 2 µm. These initial rBC size distributions from weathering crust in the bare-ice dark zone of the Greenland Ice Sheet are smaller than the fresh snow but still much larger than the observations of atmospheric rBC. There appears to be a shift in the modal peak of rBC particle size in light patches over the duration of the season, from ∼0.3 to ∼1.4 µm, further suggesting the aggregation of particles in the bare-ice region. NAAPS-AOT and surface concentration data suggest that rBC weathering crust concentrations in the bare-ice zone reflect atmospheric conditions momentarily, before possibly being reset by supraglacial melt.
Additionally, we demonstrate preliminary verification of BC deposition from the NAAPS-RA with in situ observations. rBC measurements in dark patches from late June to early August 2014 reveal an increase just after the smoke event. These elevated concentrations are closer to previously reported values in vertical snow and ice-core layers (e.g., Doherty et al., 2010, and Polashenski et al., 2015). The overall higher concentrations of rBC in visibly darker patches, where higher concentrations of ice algae were observed (Stibal et al., 2017), suggest potential bio-flocculation with ice algae and mineral dust. However, NAAPS model results also indicate the increase is likely related to the accumulation of episodically deposited, wildfire-derived smoke; for example, the smoke event in early August, which brought smoke from the western Northern Hemisphere. Based on the NAAPS deposition model and corroborated by rBC observations, wet deposition appears to be the largest source of rBC to the surface. For example, our fresh snow in situ sample was measured at 3 µg-rBC/L-H2O, and the NAAPS-RA modeled smoke deposition, 1.8 µg-BC/L-H2O, was within the order of magnitude of the ground observation. However, on the next day, the NAAPS-RA-modeled smoke deposition was 30 µg-BC/L-H2O, which is about 3 times higher than the highest concentration measured in a dark patch, 13 µg-BC/L-H2O. In this scenario, the model is overestimating the concentration of rBC deposited. These preliminary results suggest that there is still a high level of uncertainty between global-aerosol-modeled deposition and in situ measurements, which is likely due to the complexity of matching the snow accumulation period with the sampling time period, in addition to the multiple physical properties occurring on the surface of the ice once the smoke is deposited. Further investigation is warranted. These data are useful for understanding the seasonal evolution of impurities of the weathering crust, which are needed to constrain modeling of ice–albedo feedbacks in the bare ice zone of the GRIS.
The rBC- and NAAPS-modeled deposition data are included in Table 1.
ALK and JS analyzed the rBC samples. PX ran the NAAPS model and provided the output data. ALK wrote the paper, and PX and JS edited and contributed text. The samples were collected by ALK and the Dark Snow Project.
The contact author has declared that none of the authors has any competing interests.
Publisher's note: Copernicus Publications remains neutral with regard to jurisdictional claims in published maps and institutional affiliations.
The authors thank the Dark Snow Project for field support and additional sample collection, specifically, Marek Stibal, Jason Box, Karen Cameron, and Noah Molotch.
This research has been supported by the National Aeronautics and Space Administration (grant no. 80NSSC20K1261).
This paper was edited by Caroline Clason and reviewed by two anonymous referees.
Baumgardner, D., Popovicheva, O., Allan, J., Bernardoni, V., Cao, J., Cavalli, F., Cozic, J., Diapouli, E., Eleftheriadis, K., Genberg, P. J., Gonzalez, C., Gysel, M., John, A., Kirchstetter, T. W., Kuhlbusch, T. A. J., Laborde, M., Lack, D., Müller, T., Niessner, R., Petzold, A., Piazzalunga, A., Putaud, J. P., Schwarz, J., Sheridan, P., Subramanian, R., Swietlicki, E., Valli, G., Vecchi, R., and Viana, M.: Soot reference materials for instrument calibration and intercomparisons: a workshop summary with recommendations, Atmos. Meas. Tech., 5, 1869–1887, https://doi.org/10.5194/amt-5-1869-2012, 2012.
Bond, T. C., Doherty, S. J., Fahey, D. W., Forster, P. M., Berntsen, T., DeAngelo, B. J., Flanner, M. G., Ghan, S., Kärcher, B., Koch, D., Kinne, S., Kondo, Y., Quinn, P. K., Sarofim, M. C., Schultz, M. G., Schulz, M., Venkataraman, C., Zhang, H., Zhang, S., Bellouin, N., Guttikunda, S. K., Hopke, P. K., Jacobson, M. Z., Kaiser, J. W., Klimont, Z., Lohmann, U., Schwarz, J. P., Shindell, D., Storelvmo, T., Warren, S. G., and Zender, C. S.: Bounding the role of black carbon in the climate system: A scientific assessment, J. Geophys. Res.-Atmos., 118, 5380–5552, https://doi.org/10.1002/jgrd.50171, 2013.
Carson-Marquis, B. N., Zhang, J., Xian, P., Reid, J. S., and Marquis, J. W.: Improving WRF-Chem meteorological analyses and forecasts over aerosol-polluted regions by incorporating NAAPS aerosol analyses, J. Appl. Meteorol. Clim., 60, 839–855, 2021.
Clark, A. D. and Noone, K. J.: Soot in the Arctic Snowpack: A cause for perturbations in radiative transfer, Atmos. Environ., 19, 2045–2053, 1985.
Cordero, R. R., Sepúlveda, E., Feron, S., Damiani, A., Fernandoy, F., Neshyba, S., Rowe, P. M., Asencio, V., Carrasco, J., Alfonso, J. A., Llanillo, P., Wachter, P., Seckmeyer, G., Stepanova, M., Carrera, J. M., Jorquera, J., Wang, C., Malhotra, A., Dana, J., Khan, A. L., and Casassa, G.: Black carbon footprint of human presence in Antarctica, Nat. Commun., 13, 984, https://doi.org/10.1038/s41467-022-28560-w, 2022.
Doherty, S. J., Warren, S. G., Grenfell, T. C., Clarke, A. D., and Brandt, R. E.: Light-absorbing impurities in Arctic snow, Atmos. Chem. Phys., 10, 11647–11680, https://doi.org/10.5194/acp-10-11647-2010, 2010.
Doherty, S. J., Grenfell, T. C., Forsström, S., Hegg, D. L., Brandt, R. E., and Warren, S. G.: Observed vertical redistribution of black carbon and other insoluble light-absorbing particles in melting snow, J. Geophys. Res.-Atmos., 118, 5553–5569, https://doi.org/10.1002/jgrd.50235, 2013.
Flanner, M. G., Zender, C. S., Randerson, J. T., and Rasch, P. J.: Present-day climate forcing and response from black carbon in snow, J. Geophys. Res., 112, D11202, https://doi.org/10.1029/2006JD008003, 2007.
Greuell, W.: Melt-water accumulation on the surface of the Greenland ice sheet: Effect on albedo and mass balance, Geogr. Ann. A, 82, 489–498, https://doi.org/10.1111/j.0435-3676.2000.00136.x, 2000.
Hanna, E., Huybrechts, P., Steffen, K., Cappelen, J., Huff, R., Shuman, C., Irvine-Fynn, T., Wise, S., and Griffiths, M.: Increased runoff from melt from the Greenland Ice Sheet: A response to global warming, J. Climate, 21, 331–341, https://doi.org/10.1175/2007JCLI1964.1, 2008.
Katich, J. M., Perring, A. E., and Schwarz, J. P.: Optimized detection of particulates from liquid samples in the aerosol phase: focus on black carbon, Aerosol Sci. Tech., 51, 543–553, https://doi.org/10.1080/02786826.2017.1280597, 2017.
Keegan, K. M., Albert, M. R., McConnell, J. R., and Baker, I.: Climate change and forest fires synergistically drive widespread melt events of the Greenland Ice Sheet, P. Natl. Acad. Sci. USA, 111, 7964–7967, https://doi.org/10.1073/pnas.1405397111, 2014.
Khan, A. L., Wagner, S., Jaffe, R., Xian, P., Williams, M., Armstrong, R., and McKnight, D.: Impacts of coal dust on the spectral reflectance of Arctic surface snow in Svalbard, Norway, J. Geophys. Res.-Atmos., 122, 1767–1778, https://doi.org/10.1002/2016JD025757, 2017a.
Khan, A. L., Wagner, S., Jaffe, R., Xian, P., Williams, M., Armstrong, R., and McKnight, D.: Dissolved black carbon in the global cryosphere: Concentrations and chemical signatures, Geophys. Res. Lett., 44, 6226–6234, https://doi.org/10.1002/2017GL073485, 2017b.
Khan, A. L., McMeeking, G. R., Schwarz, J. P., Xian, P., Welch, K. A., Berry Lyons, W., and McKnight, D. M.: Near-surface refractory black carbon observations in the atmosphere and snow in the McMurdo dry valleys, Antarctica, and potential impacts of Foehn winds, J. Geophys. Res.-Atmos., 123, 2877–2887, 2018.
Khan, A. L., Klein, A. G., Katich, J. M., and Xian, P.: Local emissions and regional wildfires influence refractory black carbon observations near Palmer Station, Antarctica, Front. Earth Sci., 7, 49, https://doi.org/10.3389/feart.2019.00049, 2019.
Khan, A. L., Rittger, K., Xian, P., Katich, J. M., Armstrong, R. L., Kayastha, R. B., Dana, J. L., and McKnight, D. M.: Biofuel burning influences refractory black carbon concentrations in seasonal snow at lower elevations of the Dudh Koshi River Basin of Nepal, Front. Earth Sci., 8, 371, https://doi.org/10.3389/feart.2020.00371, 2020.
Kondo, Y., Matsui, H., Moteki, N., Sahu, L., Takegawa, N., Kajino, M., Zhao, Y., Cubison, M. J., Jimenez, J. L., Vay, S., Diskin, G. S., Anderson, B., Wisthaler, A., Mikoviny, T., Fuelberg, H. E., Blake, D. R., Huey, G., Weinheimer, A. J., Knapp, D. J., and Brune, W. H.: Emissions of black carbon, organic, and inorganic aerosols from biomass burning in North America and Asia in 2008, J. Geophys. Res., 116, D08204, https://doi.org/10.1029/2010JD015152, 2011.
Lewis, G., Osterberg, E., Hawley, R., Marshall, H. P., Meehan, T., Graeter, K., McCarthy, F., Overly, T., Thundercloud, Z., Ferris, D., Koffman, B. G., and Dibb, J.: Atmospheric blocking drives recent albedo change across the western Greenland ice sheet percolation zone, Geophys. Res. Lett., 48, e2021GL092814, https://doi.org/10.1029/2021GL092814, 2021.
Lim, S., Faïn, X., Zanatta, M., Cozic, J., Jaffrezo, J.-L., Ginot, P., and Laj, P.: Refractory black carbon mass concentrations in snow and ice: method evaluation and inter-comparison with elemental carbon measurement, Atmos. Meas. Tech., 7, 3307–3324, https://doi.org/10.5194/amt-7-3307-2014, 2014.
Lynch, P., Reid, J. S., Westphal, D. L., Zhang, J., Hogan, T. F., Hyer, E. J., Curtis, C. A., Hegg, D. A., Shi, Y., Campbell, J. R., Rubin, J. I., Sessions, W. R., Turk, F. J., and Walker, A. L.: An 11 year global gridded aerosol optical thickness reanalysis (v1.0) for atmospheric and climate sciences, Geosci. Model Dev., 9, 1489–1522, https://doi.org/10.5194/gmd-9-1489-2016, 2016.
Markowicz, K. M., Pakszys, R., Ritter, C., Zielensi, T., Udisti, R., Cappelletti, D., Mazzola, M., Shobara, M., Xian, P., Zawadzka, O., Lisok, J., Petelski, T., Makuch, P., and Karasinksi, G.: Impact of North American intense fires on aerosol optical properties measured over the European Arctic in July 2015, J. Geophys. Res.-Atmos., 121, 14487–14512, https://doi.org/10.1002/2016JD025310, 2016.
Markowicz, K. M., Lisok, L., and Xian, P.: Simulations of the effect of intensive biomass burning in July 2015 on Arctic radiative forcing, Atmos. Environ., 171, 248–260, https://doi.org/10.1016/j.atmosenv.2017.10.015, 2017.
Markowicz, K. M., Lisok, J., and Xian, P.: Simulation of long-term direct aerosol radiative forcing over the arctic within the framework of the iAREA project, Atmos. Environ., 244, 117882, https://doi.org/10.1016/j.atmosenv.2020.117882, 2021.
McConnell, J. R., Edwards, R., Kok, G. L., Flanner, M. G., Zender, C. S., Saltzman, E. S., Banta, J. R., Pasteris, D. R., Carter, M. M., and Kahl, J. D. W.: 20th-century industrial black carbon emissions altered arctic climate forcing, Science, 317, 1381–1384, 2007.
Mori, T., Goto-Azuma, K., Kondo, Y., Ogawa-Tsukagawa, Y., Miura, K., Hirabayashi, M., Oshima, N., Koike, M., Kupiainen, K., Moteki, N., Ohata, S., Sinha, P. R., Sugiura, K., Aoki, T., Schneebeli, M., Steffen, K., Sato, A., Tsushima, A., Makarov, V., and Nagatsuka, N.: Black Carbon and Inorganic Aerosols in Arctic Snowpack, J. Geophys. Res.-Atmos., 124, 13325–13356, https://doi.org/10.1029/2019JD030623, 2019.
Petzold, A., Ogren, J. A., Fiebig, M., Laj, P., Li, S.-M., Baltensperger, U., Holzer-Popp, T., Kinne, S., Pappalardo, G., Sugimoto, N., Wehrli, C., Wiedensohler, A., and Zhang, X.-Y.: Recommendations for reporting “black carbon” measurements, Atmos. Chem. Phys., 13, 8365–8379, https://doi.org/10.5194/acp-13-8365-2013, 2013.
Polashenski, C. M., Dibb, J. E., Flanner, M. G., Chen, J. Y., Courville, Z. R., Lai, A. M. Schauer, J. J., Shafer, M. M., and Bergin, M.: Neither dust nor black carbon causing apparent albedo decline in Greenland's dry snow zone: Implications for MODIS C5 surface reflectance, Geophys. Res. Lett., 42, 9319–9327, https://doi.org/10.1002/2015GL065912, 2015.
Ranjbar, K., O'Neill, N. T., Lutsch, E., McCullough, E. M., AboEl-Fetouh, Y., Xian, P., and Abboud, I.: Extreme smoke event over the high Arctic, Atmos. Environ., 218, 117002, https://doi.org/10.1016/j.atmosenv.2019.117002, 2019.
Reid, J. S., Koppmann, R., Eck, T. F., and Eleuterio, D. P.: A review of biomass burning emissions part II: intensive physical properties of biomass burning particles, Atmos. Chem. Phys., 5, 799–825, https://doi.org/10.5194/acp-5-799-2005, 2005.
Reid, J. S., Hyer, E. J., Prins, E. M., Westphal, D. L., Zhang, J., Wang, J., Christopher, S. A., Curtis, C. A., Schmidt, C. C., Eleuterio, D. P., Richardson, K. A., and Hoffman, J. P.: Global Monitoring and Forecasting of Biomass-Burning Smoke: Description of and Lessons from the Fire Locating and Modeling of Burning Emissions (FLAMBE) Program, IEEE J. Sel. Top. Appl., 2, 144–162, 2009.
Reid, J. S., Xian, P., Hyer, E. J., Flatau, M. K., Ramirez, E. M., Turk, F. J., Sampson, C. R., Zhang, C., Fukada, E. M., and Maloney, E. D.: Multi-scale meteorological conceptual analysis of observed active fire hotspot activity and smoke optical depth in the Maritime Continent, Atmos. Chem. Phys., 12, 2117–2147, https://doi.org/10.5194/acp-12-2117-2012, 2012.
Ross, A. D., Holz, R. E., Quinn, G., Reid, J. S., Xian, P., Turk, F. J., and Posselt, D. J.: Exploring the first aerosol indirect effect over Southeast Asia using a 10-year collocated MODIS, CALIOP, and model dataset, Atmos. Chem. Phys., 18, 12747–12764, https://doi.org/10.5194/acp-18-12747-2018, 2018.
Ryan, J. C., Hubbard, A., Stibal, M., Irvine-Fynn, T. D., Cook, J., and Smith, L. C.: Dark zone of the Greenland Ice Sheet controlled by distributed biologically-active impurities, Nat. Commun., 9, 1065, https://doi.org/10.1038/s41467-018-03353-2, 2018.
Ryan, J. C., Smith, L. C., van As, D., Cooley, S. W., Cooper, M. G., Pitcher, L. H., and Hubbard, A.: Greenland Ice Sheet surface melt amplified by snowline migration and bare ice exposure, Sci. Adv., 5, eaav3738, https://doi.org/10.1126/sciadv.aav3738, 2019.
Schwarz, J. P., Doherty, S. J., Li, F., Ruggiero, S. T., Tanner, C. E., Perring, A. E., Gao, R. S., and Fahey, D. W.: Assessing Single Particle Soot Photometer and Integrating Sphere/Integrating Sandwich Spectrophotometer measurement techniques for quantifying black carbon concentration in snow, Atmos. Meas. Tech., 5, 2581–2592, https://doi.org/10.5194/amt-5-2581-2012, 2012.
Schwarz, J. P., Gao, R. S., Perring, A. E., Spackman, J. R., and Fahey, D. W.: Black carbon aerosol size in snow, Sci. Rep.-UK, 3, 1356, https://doi.org/10.1038/srep01356, 2013.
Stibal, M., Box, J. E., Cameron, K. A., Langen, P. L., Yallop, M. L., Mottram, R. H., Khan, A. L., Molotch, N. P., Chrismas, N. A. M., Calì Quaglia, F., Remias, D., Smeets, C. J. P. P., van den Broeke, M. R., Ryan, J. C., Hubbard, A., Tranter, M., van As, D., and Ahlström, A. P.: Algae Drive Enhanced Darkening of Bare Ice on the Greenland Ice Sheet, Geophys. Res. Lett., 44, 463–471, https://doi.org/10.1002/2017GL075958, 2017.
Tedesco, M., Doherty, S., Fettweis, X., Alexander, P., Jeyaratnam, J., and Stroeve, J.: The darkening of the Greenland ice sheet: trends, drivers, and projections (1981–2100), The Cryosphere, 10, 477–496, https://doi.org/10.5194/tc-10-477-2016, 2016.
Wendl, I. A., Menking, J. A., Färber, R., Gysel, M., Kaspari, S. D., Laborde, M. J. G., and Schwikowski, M.: Optimized method for black carbon analysis in ice and snow using the Single Particle Soot Photometer, Atmos. Meas. Tech., 7, 2667–2681, https://doi.org/10.5194/amt-7-2667-2014, 2014.
Whicker, C. A., Flanner, M. G., Dang, C., Zender, C. S., Cook, J. M., and Gardner, A. S.: SNICAR-ADv4: a physically based radiative transfer model to represent the spectral albedo of glacier ice, The Cryosphere, 16, 1197–1220, https://doi.org/10.5194/tc-16-1197-2022, 2022.
Wientjes, I. G. M., Van de Wal, R. S. W., Reichart, G. J., Sluijs, A., and Oerlemans, J.: Dust from the dark region in the western ablation zone of the Greenland ice sheet, The Cryosphere, 5, 589–601, https://doi.org/10.5194/tc-5-589-2011, 2011.
Xian, P., Reid, J. S., Atwood, S. A., Johnson, R. S., Hyer, E. J., Westphal, D. L., and Sessions, W.: Smoke aerosol transport patterns over the Maritime Continent, Atmos. Res., 122, 469–485, https://doi.org/10.1016/j.atmosres.2012.05.006, 2013.
Xian, P., Zhang, J., O'Neill, N. T., Reid, J. S., Toth, T. D., Sorenson, B., Hyer, E. J., Campbell, J. R., and Ranjbar, K.: Arctic spring and summertime aerosol optical depth baseline from long-term observations and model reanalyses – Part 2: Statistics of extreme AOD events, and implications for the impact of regional biomass burning processes, Atmos. Chem. Phys., 22, 9949–9967, https://doi.org/10.5194/acp-22-9949-2022, 2022a.
Xian, P., Zhang, J., O'Neill, N. T., Toth, T. D., Sorenson, B., Colarco, P. R., Kipling, Z., Hyer, E. J., Campbell, J. R., Reid, J. S., and Ranjbar, K.: Arctic spring and summertime aerosol optical depth baseline from long-term observations and model reanalyses – Part 1: Climatology and trend, Atmos. Chem. Phys., 22, 9915–9947, https://doi.org/10.5194/acp-22-9915-2022, 2022b.