the Creative Commons Attribution 4.0 License.
the Creative Commons Attribution 4.0 License.
 | 21 Jun 2023
Asynchronous glacial dynamics of Last Glacial Maximum mountain glaciers in the Ikh Bogd Massif, Gobi Altai mountain range, southwestern Mongolia: aspect control on glacier mass balance
Purevmaa Khandsuren
Hyun Hee Rhee
Cho-Hee Lee
Mehmet Akif Sarikaya
Jeong-Sik Oh
Khadbaatar Sandag
Byung Yong Yu
Mountain glacier mass balance is affected by factors other than climate, such as topography, slope, and aspect. In midlatitude high-mountain regions, the north–south aspect contrast can cause significant changes in insolation and melt, resulting in local asynchrony in glacial dynamics. This study documents the asynchronous response of two paleoglaciers in southwestern Mongolia to the local topoclimatic factors using 10Be exposure age dating and 2D ice surface modeling. 10Be surface exposure age dating revealed that the Ikh Artsan south-facing valley glacier culminated (MIA1) at 20.1 ± 0.7 ka, coinciding with the global Last Glacial Maximum (gLGM). In contrast, the north-facing Jargalant paleoglacier (MJ1) culminated at 17.2 ± 1.5 ka, around Heinrich Stadial 1 and during the post-gLGM Northern Hemisphere warming. Our temperature-index melt model predicts that ablation will be substantially lower on the north-facing slope, as it is exposed to less solar radiation and cooler temperatures than the south-facing slope. The 2D ice surface modeling also revealed that the south-facing Ikh Artsan Glacier abruptly retreated from its maximum extent at 20 ka, but the Jargalant Glacier on the shaded slope consistently advanced and thickened due to reduced melt until 17 ka. The timing of the modeled glacier culmination is consistent within ± 1σ of the 10Be exposure age results. Extremely old ages ranging from 636.2 to 35.9 ka were measured for the inner moraines in the Jargalant cirque (MJ2–MJ4), suggesting a problem with inheritance from boulders eroded from the summit plateau.
- Article
(15035 KB) - Full-text XML
-
Supplement
(1520 KB) - BibTeX
- EndNote


Massive ice sheets or mountain glaciers respond to various climatic forcings that operate on wide geographic scales from local to global. Winter precipitation and summer air temperature are generally considered the most critical factors in controlling glacial mass balance and extent. Understanding the impact of climate on past glacial cycles necessitates a thorough understanding of the timing and amplitude of glacial dynamics. The most recent planet-wide glacial expansion occurred during the global Last Glacial Maximum (gLGM) as a result of changes in major climate forcings, e.g., reduced summer insolation, lower tropical sea surface temperatures, and low atmospheric CO2 content. The remnants of paleoglacial deposits of the gLGM are the best preserved among all of the ice ages. The gLGM has been extensively studied to ascertain the Late Pleistocene changes in ice volume, sea level fluctuations, feedback on climate, etc. The timing of the gLGM has been established using both the marine (e.g., Shackleton, 1967, 2000; Thompson et al., 2003; Skinner and Shackleton, 2005) and terrestrial (e.g., An et al., 1991; Wang et al., 2001; Jouzel et al., 2007; Clark et al., 2009; Fletcher et al., 2010) paleoclimatic proxies. Based on proxy records, the timing of the gLGM is constrained between 26.5 and 19 ka, during which the ice sheets and mountain glaciers reached their maximum and the global sea level was at its minimum (Clark et al., 2009).
The timing and extent of the maximum glaciation in many regions worldwide are poorly understood, as distinct ice masses respond differently to local and regional climatic conditions. New geochronological techniques, such as in situ cosmogenic surface exposure dating (e.g., Hughes et al., 2013; Heyman, 2014), permit reliable temporal comparisons between the maximum advances of different mountain glaciers.
Evidence from midlatitude glaciers reveals more complex behavior than that of synchronized “global” glaciations. In some parts of Asia, for example, the largest glacial extent occurred before Marine Isotope Stage (MIS) 2, > 100 ka, in the northeastern Tibetan Plateau (Heyman et al., 2011a) and during late-MIS 5–MIS 4 in Kanas Lake in the Chinese Altai Mountains (Gribenski et al., 2018). In the Tian Shan Mountains (Koppes et al., 2008; Li et al., 2014; Blomdin et al., 2016), the Altai Mountains (Blomdin et al., 2018), Khangai (Rother et al., 2014; Smith et al., 2016; Batbaatar et al., 2018; Pötsch, 2017), and the Eastern Sayan Mountains in Khovsgol (also known as Khuvsgul) (Gillespie et al., 2008; Batbaatar and Gillespie, 2016), the largest glaciers dated back to MIS 3, whereas the MIS 2 glaciers appeared to be smaller (Fig. 1). It is noteworthy that most of the MIS 3 advances are based on a few and/or widely scattered ages of morainal boulders (Blomdin et al., 2016; Gribenski et al., 2018). On the other hand, due to arid climate conditions, the significant cirque glacier advanced during MIS 1 in the Gichgeniyn Nuruu mountain range (Batbaatar et al., 2018). These studies suggest that glaciers in continental interior Asia respond to regional-scale climate fluctuation in different ways; hence, the last glacial maxima differed from place to place. The equilibrium line altitude (ELA) depression of the MIS 2 maximum varied from ∼ 100 to 1100 m between arid and humid continental environments. The ELA depression was estimated to be 800–1100 m in subhumid regions (the Russian Altai, Khangai, and Eastern Sayan mountains as well as the southeastern Tibetan Plateau), 500–600 m in the semiarid Gobi Altai Mountains, and 100–600 m in the arid northern Tibetan Plateau and Tian Shan Mountains (Batbaatar, 2018); see Fig. 1 for the locations.
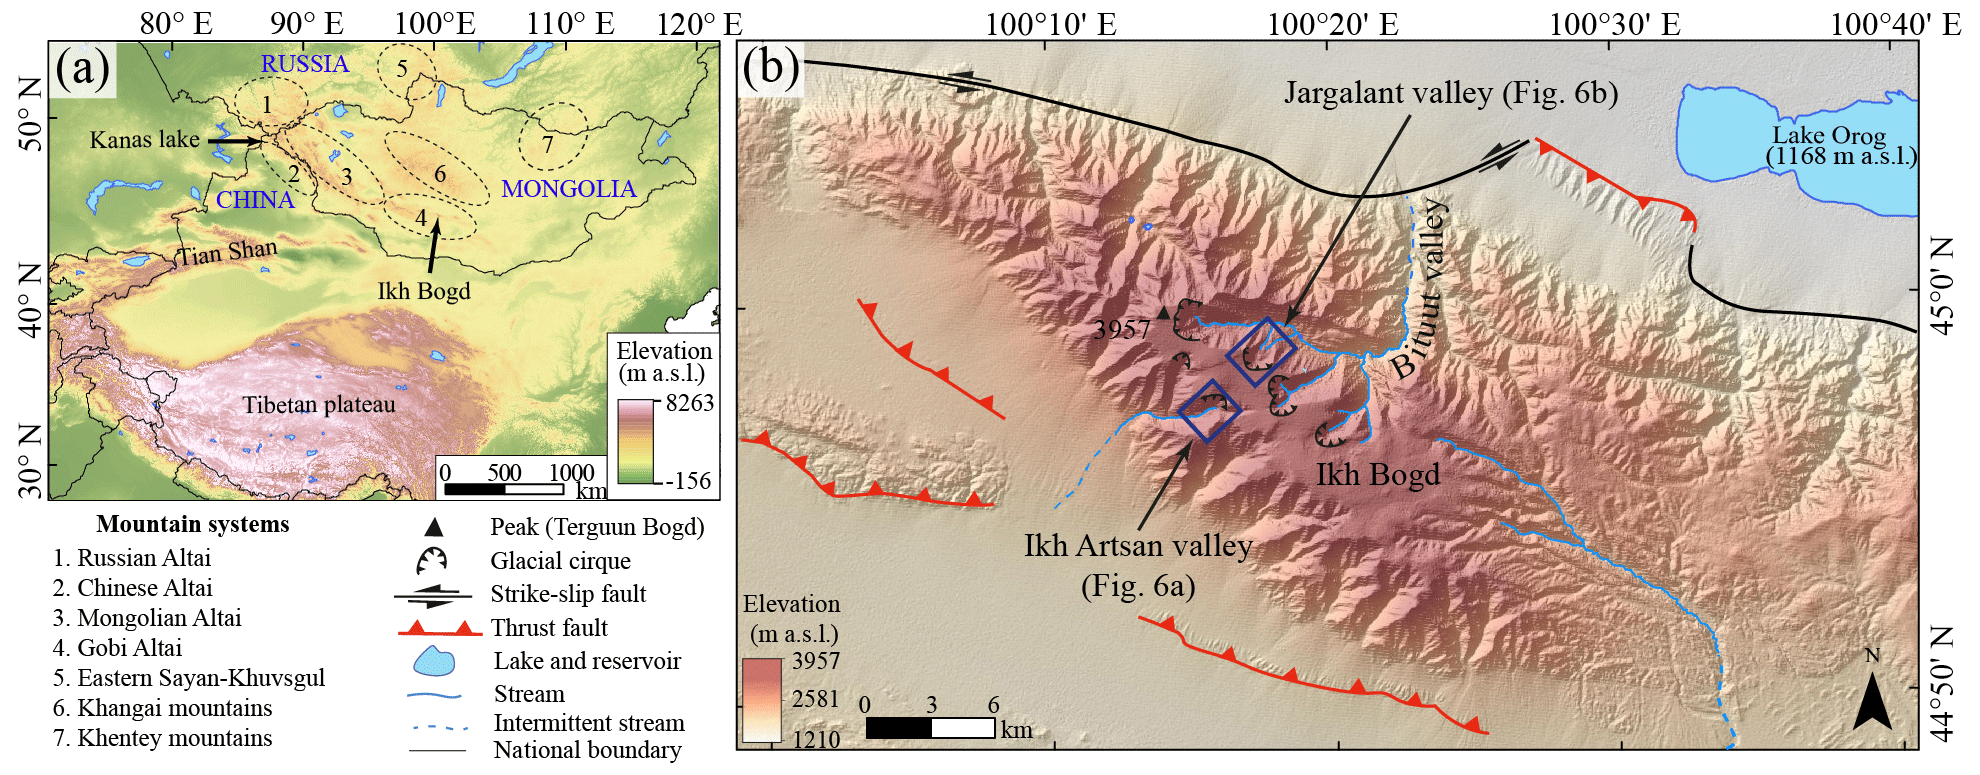
Figure 1Maps of the study area. Panel (a) shows the central Asian glaciated mountain ranges during the late Quaternary. The boxed areas in panel (b) indicate the respective Ikh Artsan and Jargalant valleys. The reader is referred to the detailed photographs and maps of both valleys in Figs. 4–6 for more information. The background image is shaded using Shuttle Radar Topographic Mission (SRTM) digital elevation model (DEM) data at a 30 m resolution.
In addition to regional climate conditions, non-climatic factors may also control the local extent and dynamics of glaciation. Topographic factors, such as catchment morphology, valley width and length, slope, and aspect, can influence glacier dynamics and affect the style of glaciation (Kirkbride and Winkler, 2012; Barr and Lovell, 2014). Glacier mass balance varies with slope aspect, snow avalanche, and wind drifting snow. The north–south aspect contrast in midlatitude regions with steeper slopes as well as higher relief can generate substantial differences in insolation and melt. This difference may be more significant for cirque, small mountain glaciers, or niche glaciers than for large valley glaciers or ice caps (Evans and Cox, 2005).
Although spatiotemporal variations in the glacial extent in response to regional climate change have been mentioned in numerous studies, the influence of topoclimatic factors has not been adequately explored. Using a 2D ice surface model, the present study aims to evaluate how topographic shading affects fluctuations in the glacier surface mass balance and consequent changes in glacier thickness and length (advance and retreat). The spatial and temporal responses of inversely oriented paleoglaciers to the aspect-driven microclimate are of particular interest to us. We evaluated the response of two mountain glaciers, the south-facing Ikh Artsan Glacier and the north-facing Jargalant Glacier in southwest Mongolia (Fig. 1), to topoclimatic factors. Reliable temporal comparisons between the maximum advances of the two mountain glaciers were made using in situ cosmogenic surface exposure dating (e.g., Heyman, 2014; Hughes et al., 2013). This research will improve our understanding of how midlatitude glaciers respond to topographic changes.
2.1 General settings of the study area
The Gobi Altai mountain range, a ∼ 800 km long northwest–southeast-trending isolated arc of mountains, is bordered in the northwest by the Mongolian Altai mountain range and separated from the Khangai mountain range by the Valley of the Lakes (hereafter Gobi Lakes Valley). Ikh Bogd Massif (Ikh Bogd means “great saint” or “great sacred mountain” in Mongolian) is located in the central Gobi Altai mountain range. Ikh Bogd is one of the key sites for paleoglaciological and paleoenvironmental research in landlocked arid and semiarid central Asia.
This massif is over 50 km long, 25 km wide, and rises ∼ 2 km above the surrounding arid piedmont. Terguun Bogd (3957 m a.s.l.), the massif's highest peak, is also the highest point in the Gobi Altai mountain range (Fig. 1b). Ikh Bogd's current stress regime is dominated by a network of thrust faults and sinistral strike-slip faults that combine to form transpressional pop-up structures (Cunningham et al., 1996; Bayasgalan et al., 1999; Vassallo et al., 2007, 2011). The highest part (> 3000 m) of the flat summit plateau consists mainly of granite, whereas the lower parts are mostly occupied by gneiss (EIC, 1981; Jolivet et al., 2007; Vassallo et al., 2011). The flat summit plateau is thought to be a remnant of a formerly extensive Mesozoic erosion surface (Berkey and Morris, 1924; Devyatkin, 1974; Jolivet et al., 2007), surviving most of the Cenozoic due to its rapid and recent uplift after long-term quiescence (Jolivet et al., 2007). Accordingly, erosion in Ikh Bogd is limited to several deep gorges. The summit plateau is well preserved in unincised areas because of the young age of the massif and the arid regional climate (Vassallo et al., 2011).
Headwater systems of intermittent streams merge and turn into main streams that later flow out of the mountain front and transport abundant sediments into large alluvial fans. Alluvial fans from adjacent valleys coalesce (forming bajadas) and stretch to huge endorheic intermontane basins like the Gobi Lakes Valley (Fig. 2). Numerous prior investigations suggest that the summit plateau of the Ikh Bogd Massif lacks Quaternary glacial landforms (e.g., Jolivet et al., 2007; Vasallo et al., 2011). However, some well-preserved moraine ridges have been identified and mapped in some cirques of the neighboring massifs including Ikh Artsan and Jargalant (Batbaatar et al., 2018).
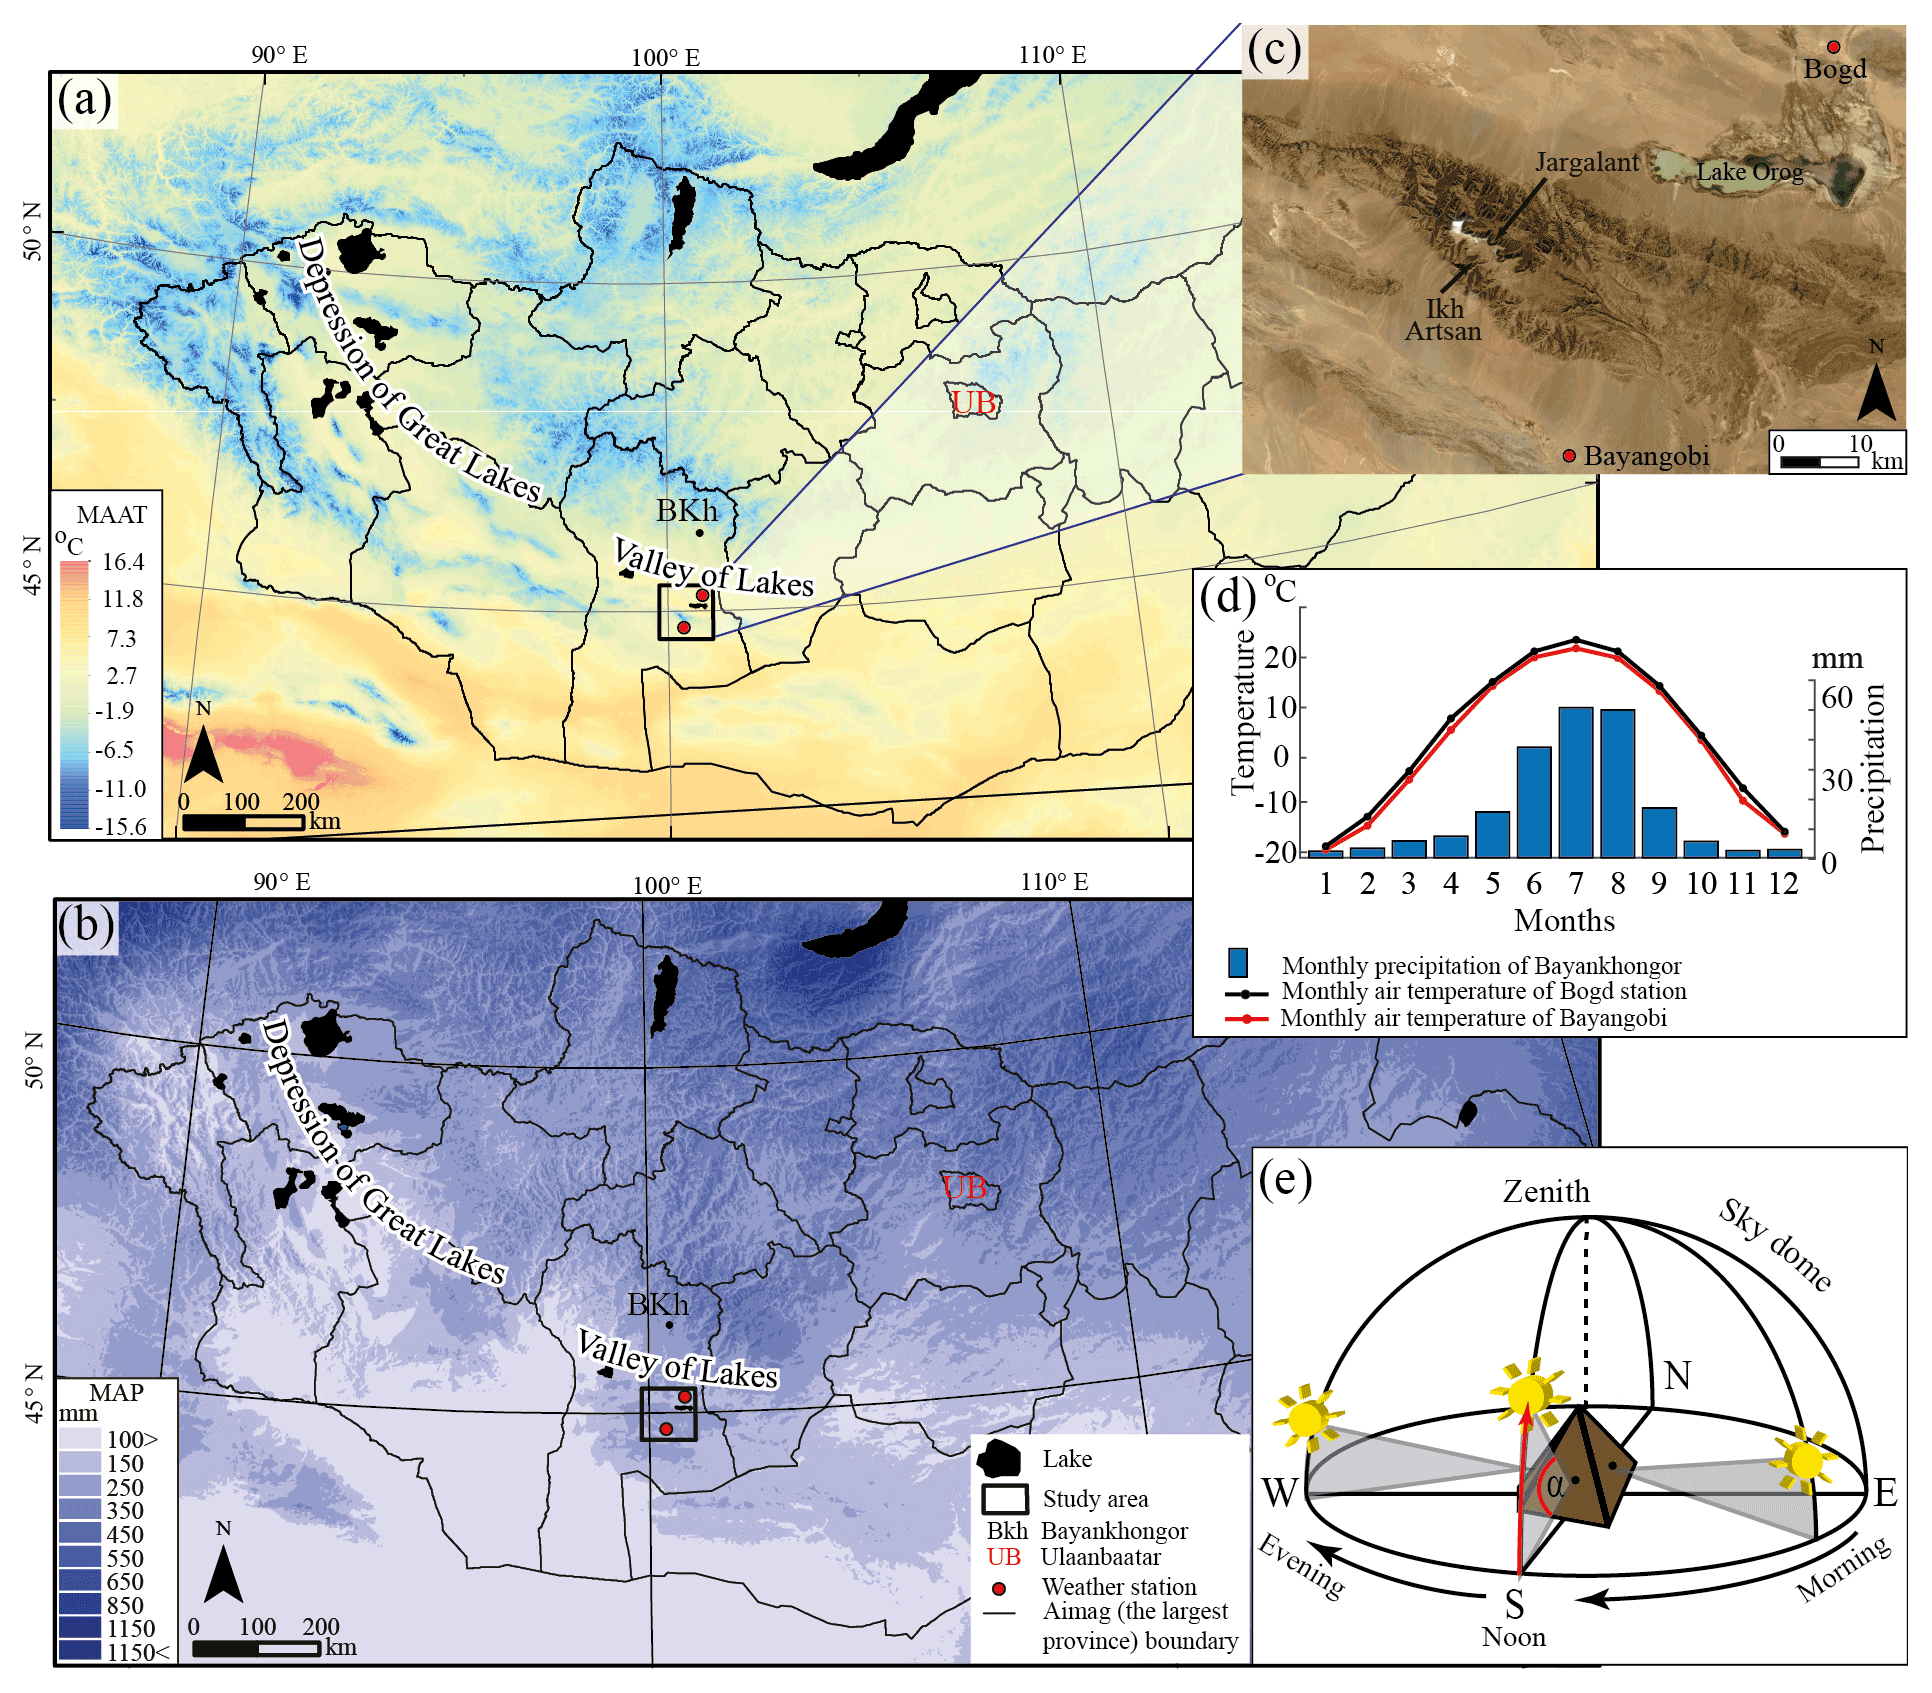
Figure 2The present-day climate of Mongolia. Panel (a) presents the mean annual air temperature across Mongolia. Panel (b) shows the Mongolian mean annual precipitation. BKh (black dot) represents the Bayankhongor Aimag (the largest unit of province) center; UB is Ulaanbaatar, the capital of Mongolia; and the red dots mark the nearest weather stations to the study area. Temperature data (CHELSA_io10_01, at 30 arcsec) and precipitation data (CHELSA_Bio10_12, at 30 arcsec) are long-term (1973–2013) annual means sourced from Bioclim bio1 data, CHELSA V 1.2 (Karger et al., 2017). Panel (c) presents the exact locations of the nearest weather stations to the massif, Bayangobi (1540 m a.s.l.) and Bogd (1240 m a.s.l.); Esri (2015) base map imagery is used as a background. Panel (d) shows the long-term (1989–2019) monthly mean temperature from Bogd station (black graph) and Bayangobi station (red graph); the monthly mean precipitation (2005–2019) of Bayankhongor is given in the inset blue bar chart (NAMHEM, 2020). Panel (e) presents the solar altitude angles on the mountain slopes with different aspects and the solar altitude angles (α) at different hour angles (morning to evening). The solar altitude angle is 0∘ at sunrise and reaches its maximum value at noon. In the mountainous area of the Northern Hemisphere, south-facing slopes receive the highest energy at noon, whereas north-facing slopes receive less or no energy due to the topographic shading effect.
2.2 Climate
Ikh Bogd Massif is in the cold Gobi Desert, which experiences a high amplitude in diurnal and annual temperatures. The climate of the study area is characterized by a dry, cold winters with limited snowfall and hot summers, with more than 65 % of yearly precipitation occurring in summer (Batbaatar et al., 2018). Bayankhongor (Fig. 2), the nearest aimag center to the study area (the largest Mongolian province unit), is 140 km away and receives 190 mm of precipitation per year (2005–2019 average; NAMHEM, 2020); this value drops to 100 mm (Fig. 2b, c, d; Yu et al., 2017) near Orog Lake (1168 m a.s.l.; Zhang et al., 2022). The closest weather stations to Ikh Bogd are Bayangobi (1540 m a.s.l.) in the south and Bogd (1240 m a.s.l.) in the north. The measured long-term mean annual temperature was 3.2 ∘C in Bayangobi and 4.4 ∘C in Bogd (Fig. 2c, d). The average January temperature was approximately −18 ∘C in both stations (NAMHEM, 2020).
Ikh Bogd experiences long winters, a lower mean annual temperature (−10 ∘C), and higher precipitation (200 mm) than its surrounding regions (Fig. 2a, b). Even in summer, the temperature is mostly below 0 ∘C at altitudes above 3800 m a.s.l. (Long-term monthly temperatures are calculated using a dry lapse rate of 9.8 ∘C km−1 from the nearby Bayangobi weather station; see Supplement file 1 in the Supplement.) It begins to snow in the nearby Gobi Lakes Valley around the end of September, although it melts quickly. Nonetheless, due to the relatively cold temperature, a thin snow cover persists on the summit plateau of Ikh Bogd between the end of September and the middle of April. Occasionally, precipitation in the form of snow occurs during the summer (Landsat imagery; Farr et al., 2007). Compared with the cool summer of Ikh Bogd, surrounding areas have warm summers. The July temperature rises to about 21.8 ∘C in Bayangobi and to 23.0 ∘C in Bogd (Fig. 2d; NAMHEM, 2020).
In the study area, strong Siberian high pressure prohibits the entrance of westerlies during winter, while westerlies and southwesterlies are still effective during summer. The orientation and shape of mobile dunes northwest of Orog Lake record the direction of prevailing winds from the northwest (Yu et al., 2019; Mischke et al., 2020; NAMHEM, 2020). Winters and summers that were much colder than present-day Mongolia are consistent with the strengthening of winter high pressure over northern Eurasia. LGM summers were 1–7 ∘C colder than today in Mongolia. The southward shift in the westerly storm tracks should, therefore, contribute to the lower-than-present precipitation values (Tarasov et al., 1999). Multi-proxy records indicate that the local LGM climate of the study area was very dry and harsh (Yu et al., 2019).
3.1 Field investigation and geomorphologic mapping
We conducted the fieldwork around the Mongolian Altai in July 2018. Prior to fieldwork, we identified glacial erosional and depositional landforms from the Advanced Land Observing Satellite (ALOS) Phased Array type L-band Synthetic Aperture Radar (PALSAR) digital elevation model (DEM) with a 12.5 m resolution (JAXA/METI, 2007) and using oblique imagery from © ArcGIS Earth and © Google Earth. Only two categories of glacial landforms could be identified and mapped from the satellite imagery and DEM analysis: glacial cirques and hummocky moraines. Glacial cirques, with amphitheater-like glacial erosional landforms, were easily recognized around the highest mountain areas. Identification of hummocky moraine was carried out using previous studies (Batbaatar et al., 2018) and oblique imagery from © ArcGIS Earth and © Google Earth imagery, as the DEM is of insufficient resolution to show the hummocky topography clearly. Mapping was performed in a GIS environment and mapped on 30 m Shuttle Radar Topographic Mission (SRTM) satellite imagery from © Bing Maps and © ArcGIS Earth. Pre-identified moraines were confirmed during fieldwork. They were then categorized based on their stratigraphic position and separation between moraine ridges. The naming of landforms (e.g., valleys) in the research area was based on locality names from a 1:100 000 scale topographic map of Mongolia (ALAMGCM, 1970) and a conversation with local herders.
3.2 Equilibrium line altitude
Ikh Bogd Massif is unglaciated today. Furthermore, the nearest modern glaciers to the study area are in Otgontenger (Khangai) and Sutai (Mongolian Altai), which are approximately 350–550 km north and west of the Ikh Bogd Massif, respectively. Thus, we could not calculate present ELAs nor ELA depression; hence, only ELAs for former glaciers (Ikh Artsan and Jargalant paleoglaciers) were estimated.
The toe-to-headwall altitude ratio (THAR) method may include a large error when glacier geometry is complex (Benn and Lehmkuhl, 2000). However, it is more suitable for our study area because it has simple glacier morphology. A relatively lower THAR value (Meierding, 1982) has commonly been used in previous studies of midlatitude glaciers; however, a higher value is applicable according to glacier type or location. We also used a higher THAR value of 0.58, as the Ikh Bogd Massif must have a higher ratio due to its arid environment during the last glaciation (Gillespie et al., 2008; Felauer et al., 2012; Lehmkuhl et al., 2018).
where Ah and At are the headwall and toe altitudes, respectively.
A major problem exists in defining the headwall limit of a former glacier, which is very subjective and arbitrary (Porter, 2001). The glacial headwall altitude was considered to be one-third of the altitude difference between the cirque floor and the top of the rock cliff, which was a similar ratio for schrund line estimation in the White Mountains, New Hampshire, USA (Goldthwait, 1970). Headwall altitude is extracted from the ALOS PALSAR DEM with a 12.5 m resolution (JAXA/METI, 2007). The altimetric error (vertical uncertainty) of the DEM is ∼ 5–7 m (Chai et al., 2022; Ferreira and Cabral, 2022). The glacial toe altitude was measured in the field using GPS and confirmed with the altitude from the DEM.
3.3 Cosmogenic 10Be surface exposure dating
We used cosmogenic 10Be surface exposure dating, based on the specific sampling procedure described below, to determine the timing of the last glacial advances in the Ikh Bogd Massif (Gosse and Phillips, 2001; Khandsuren et al., 2019). We sampled quartz-rich granitic boulders on the moraine crests, which were not reworked and represented single, distinguishable ice-marginal positions. We sampled boulders that are rooted in the upper flat surface of the moraine crest and away from steep slopes to avoid post-depositional movement, such as rolling and sliding downslope. We excluded boulders smaller than 50 cm above ground level that are likely to have been buried, exhumed, or heavily eroded. Samples were obtained by chisel and hammer from the top surfaces of boulders (less than 5 cm thick) to avoid the edging effect. We sampled at least five boulders from each single morainal crest to statistically screen any outliers, such as inheritance or post-glaciation reworking.
We followed the laboratory works of Korea University's Geochronology Laboratory (Seong et al., 2016), using the revised procedure of Kohl and Nishiizumi (1992). Rock samples were crushed and sieved to obtain monomineralic quartz and avoid grain size dependency. Meteoric 10Be and other contamination were removed by successive HF HNO3 leaching. Purified quartz grains (250–500 µm) were first spiked with ∼ 1047.8 ppm of concentrated 9Be carrier and then dissolved with HF HNO3. Fluorides were removed by perchloric (HClO4) acid, and Be was separated from other ions (cations/anions) using ion exchange chromatography columns. Beryllium hydroxide was recovered using ammonium hydroxides. Consequently, Be(OH)2 gels were dried on high-temperature hotplates. They were then calcinated to oxide forms in a furnace at higher temperatures (800 ∘C). BeO samples were mixed with niobium powder to induce conductivity and filled into an aluminum target to be loaded into a 6 MV tandem accelerator mass spectrometer (AMS) for 10Be 9Be ratio measurement at the Korea Institute of Science and Technology. 10Be 9Be ratios for each sample were measured relative to the 07KNSTD standard sample 5-1 (Nishiizumi et al., 2007), which has a 10Be 9Be ratio of 2.71 × 10⁻¹¹ ± 4.71 × 10⁻¹³ (calibrated error). The measured average 10Be 9Be ratio of the processing blank was 4.53 × 10⁻¹⁵ ± 1.6 × 10⁻¹⁵ (n=2). The exposure ages were calculated using the CRONUS-Earth online calculator version 3 (Balco et al., 2008). 10Be production rate scaling was based on the time-dependent and nuclide-specific LSDn scaling (Lifton et al., 2014). Several studies on the last glacial history in continental central Asia (e.g., Rother et al., 2014; Batbaatar et al., 2018) have presented 10Be exposure ages referenced to other scaling methods. For a simple comparison, we recalculated their exposure ages using the LSDn scaling model. The exposure age errors were represented by external uncertainty (1σ confidence level).
We tested the boulder populations to find outliers using the Chauvenet and Pierce criterion and normalized deviation methods (Ross, 2003; Chauvenet, 1960; Batbaatar et al., 2018) before we assigned the deglaciation ages of moraine sequences. The idea behind using Chauvenet's criterion is to find a probability band centered on the mean of a normal distribution containing all samples. Any data points that lie outside this probability band can be considered to be outliers. In contrast, Peirce's criterion is based on a Gaussian distribution, and the data point is rejected if its deviation from the mean exceeds the maximum allowed deviation (calculated from the standard deviation of the group and Peirce's criterion table). For the normalized deviation, a sample in a group was rejected if its normalized deviation from the group mean (excluding the tested sample) was greater than 2 (Batbaatar et al., 2018). The sample was excluded from the group if its exposure age was recognized as an outlier using any of these three methods. We also calculated the reduced chi-square value and the relative uncertainty of the group (Balco, 2011) after rejecting outliers. The arithmetic mean and group standard deviation were considered to be a representation of the group age. However, we also calculated the total uncertainty, including the group standard deviation and external uncertainty (systematic uncertainty), of each sample within the group (Batbaatar et al., 2018). We presented minimum exposure ages assuming zero erosion, as erosion has been negligible (at least for the sampled surface) since the boulders were deposited based on field observations and considering almost negligible erosion in arid regions. We also performed boulder erosion sensitivity tests on our exposure ages using erosion rates of 1–4 mm kyr−1 (Blomdin et al., 2018). We omitted corrections for snow cover and vegetation change due to the ephemeral winter snow cover at the elevations of the sampled boulders (e.g., Gosse and Phillips, 2001), as modern winter snow cover (October–April) is very thin and no tree cover exists due to aridity.
After rejecting the outliers, Welch's t test statistics were also used to compare the exposure ages of distal moraines of two groups (MIA1 and MJ1). Welch's t test assumes that the sample means being compared for two groups are normally distributed and that the groups have unequal variances. The null hypothesis (H0) states that the means of the two groups are same, whereas the alternative hypothesis (H1) states that the means of two groups are unequal. We also performed the t test with the total uncertainty of the groups instead of group variances at a 0.05 significance level.
As our study area is considered to be a well-preserved paleo-peneplanation surface, the 10Be concentration of the flat summit plateau must be very high. If our sampled boulders have an “inherited” component from the summit plateau, the apparent exposure age should significantly exceed the moraine deposition age. We assumed that the 10Be concentration from extremely old boulders could represent the concentration of the summit plateau itself. Hence, we tried to calculate exposure age and the lowest erosion rate of the summit plateau using the highest measured 10Be concentration from the oldest moraine boulder. Therefore, we selected the highest point (3625 m; 44.6∘ N, 100.2∘ E) between the Jargalant and Ikh Artsan cirques that is representative of the summit plateau. The minimum erosion rate was calculated with the “Erosion rate calculator” of CRONUS-Earth version 3.0.2 using the elevation and geographical coordinates of the selected point, the sampling thickness, and the 10Be concentration of the oldest boulder, considering the shielding factor as 1 (unshielded).
3.4 The 2D ice surface modeling
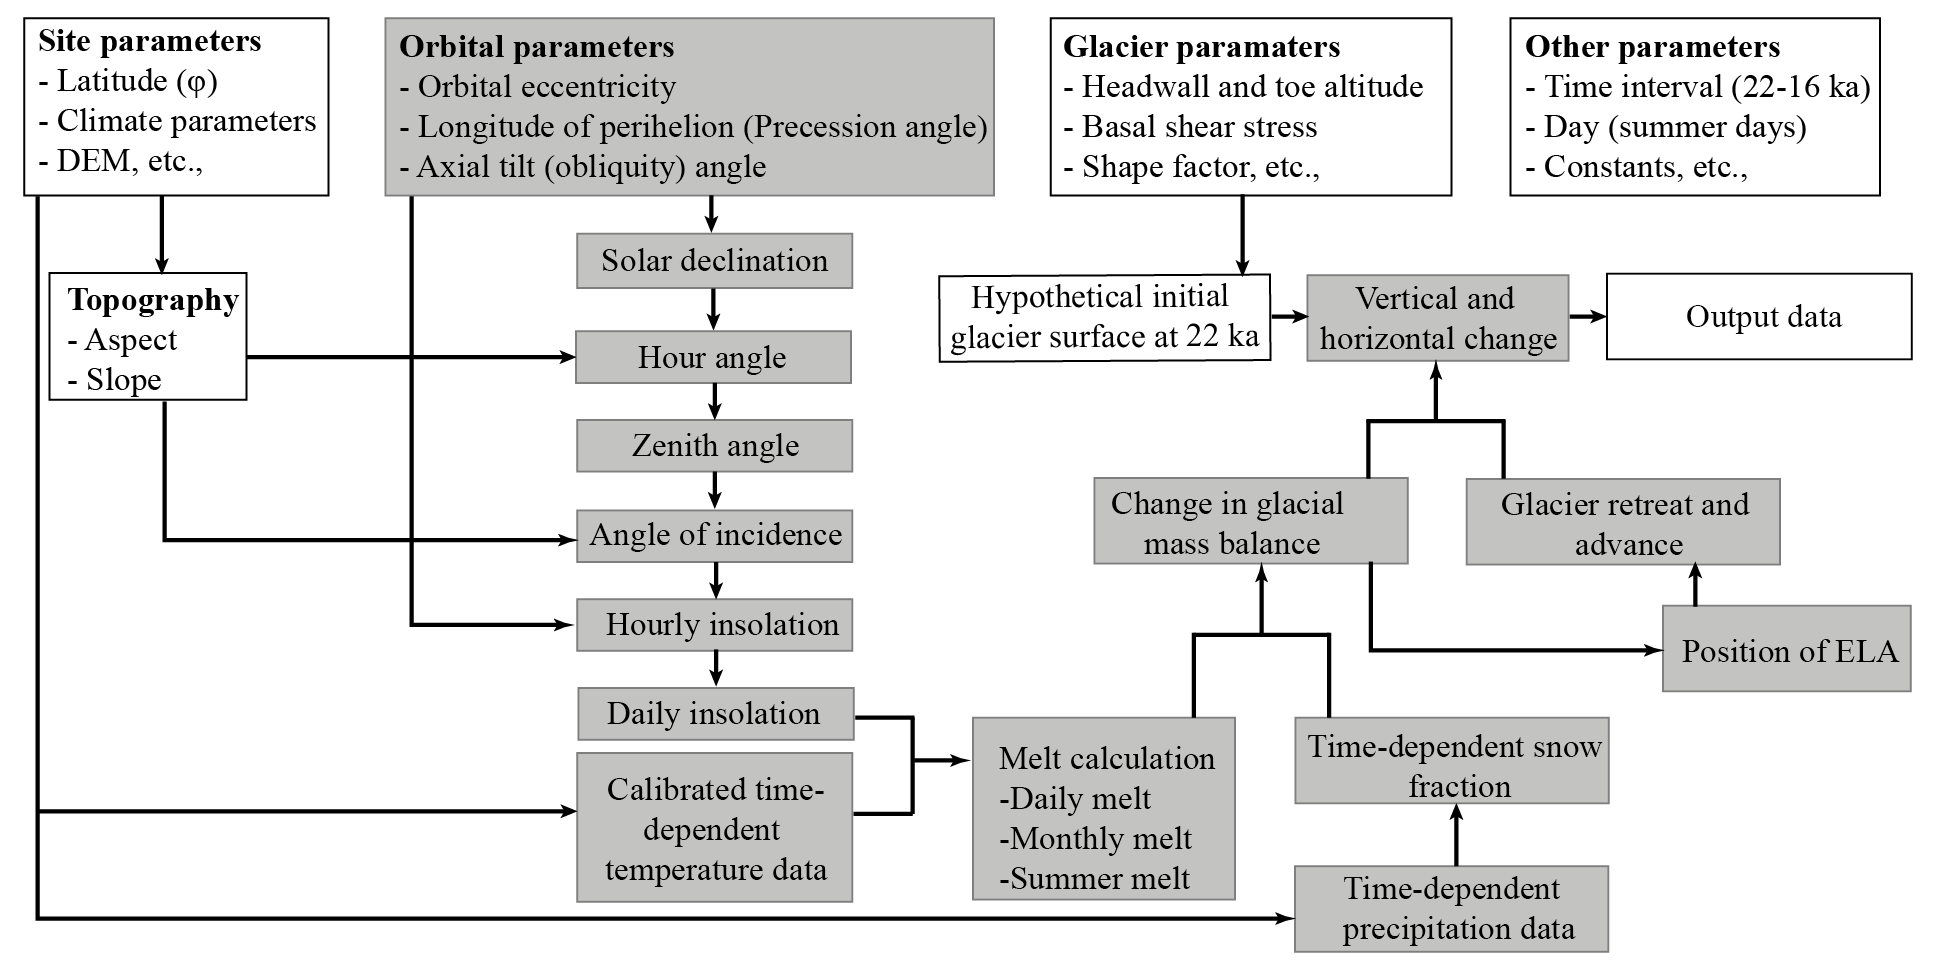
A 2D ice surface model covering 22–16 ka was used to examine the influence of aspect on glacier mass balance and dynamics and to explain the empirical dating results. The model calculates glacier mass balance variation and corresponding vertical changes in the glacial ice surface (Sect. 3.4.1). Furthermore, it defines the glacier toe location (Sect. 3.4.2) relative to the changing ELA via ice thickening or thinning. Our simulation cannot model actual glaciers; rather, it examines the possibility that variable melt rates could cause a significant difference in mass balance (Fig. 3).
3.4.1 Glacial surface mass balance model: glacial thinning and thickening
Glacier mass balance (m) is determined by the summation of net ablation (a; see the following “Glacier ablation: temperature-index glacier melt model” section) and accumulation (c; see the following “Glacier accumulation and snow data” section) over a stated period (t):
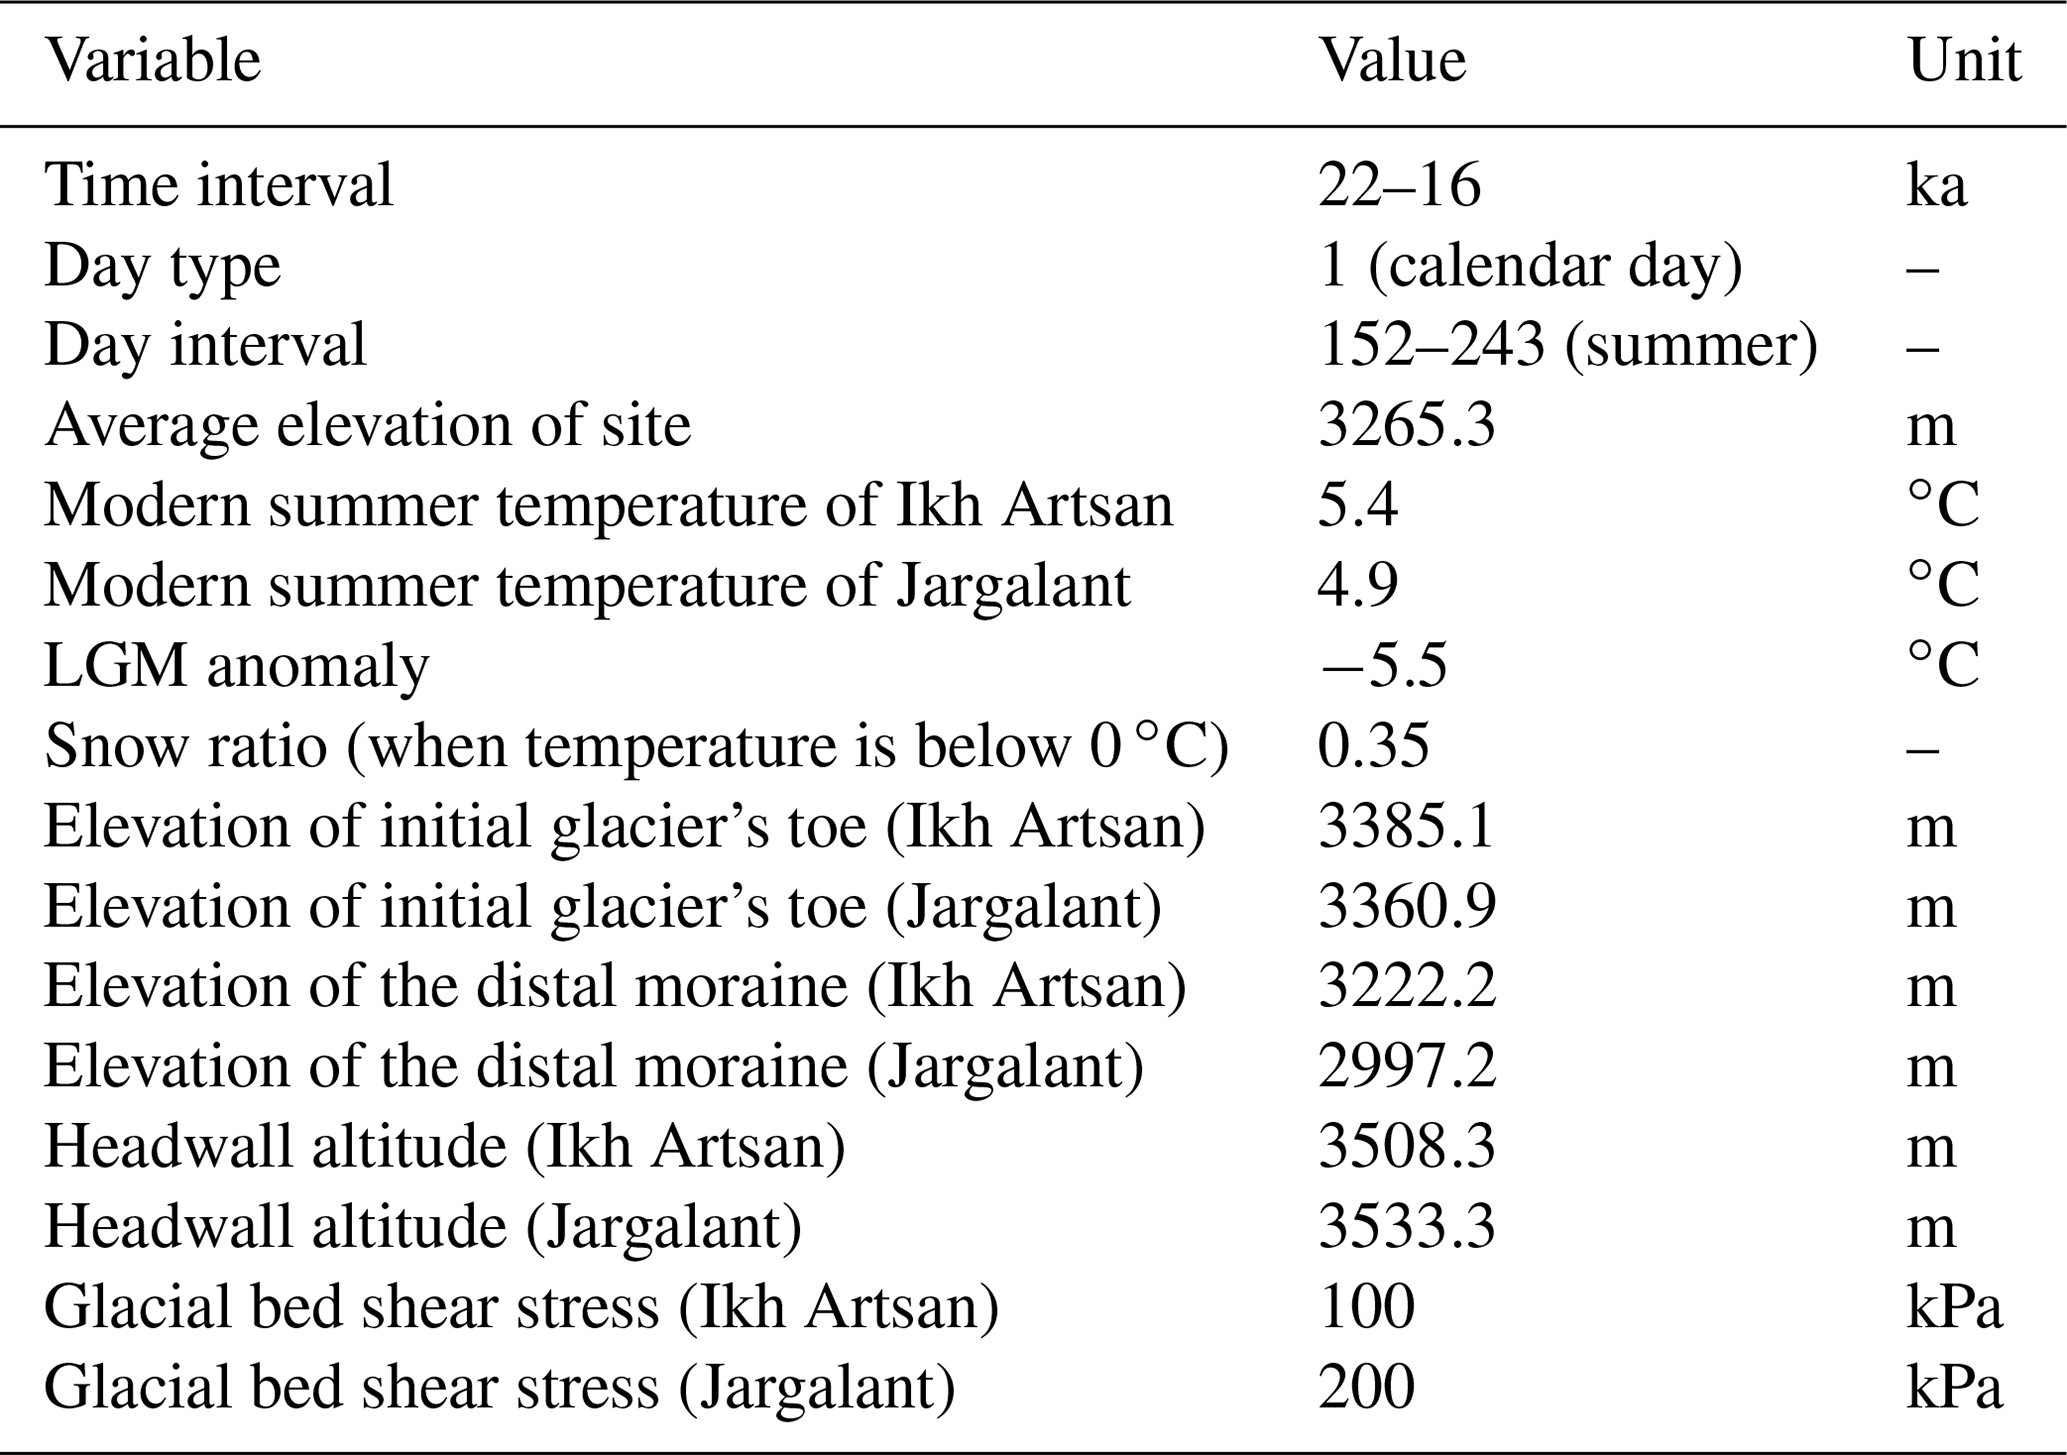
To infer the net gain and loss of glacier mass along the longitudinal profile for both catchments, we calculated and plotted the variations in June–July–August (JJA; see the following“Glacier ablation: temperature-index glacier melt model” section) melt and winter precipitation (i.e., snow through the whole year; see the following “Glacier accumulation and snow data” section) during 22–16 ka. The elevation of the profile was taken from a DEM with a 12.5 m spatial resolution in 5 m spatial intervals. The site parameters and input parameters of this model are described in Tables 1 and 2.
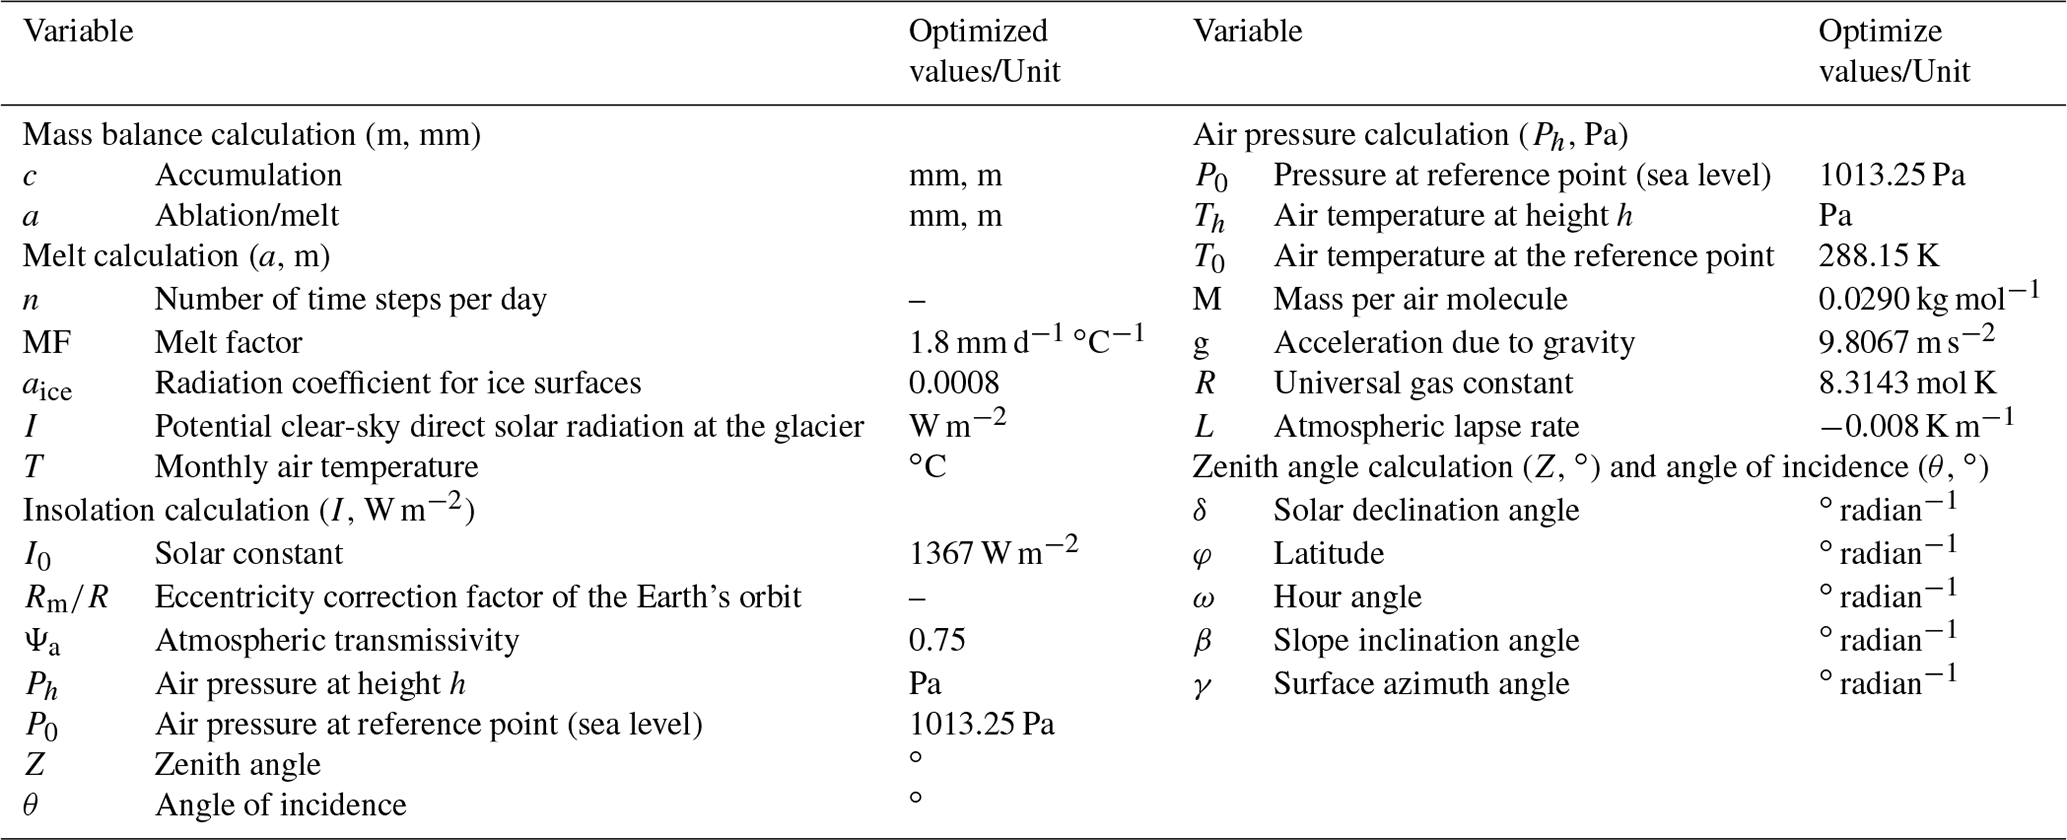
Table 1Site parameters and glacier parameters used for the 2D ice surface model.
Glacier ablation: temperature-index glacier melt model
We assumed that the topography (aspect and slope) is the main factor producing a difference in daily incoming solar radiation on the south- and north-facing slopes. The Earth's surface receives more energy when the solar altitude angle (α) is high (zenith angle and angle of incidence are low). The diurnal changes in solar altitude angle are caused by the Earth's rotation around its axis, which varies from morning to evening. At sunrise and sunset, the solar altitude angle is 0∘, and it reaches its maximum value at noon. Accordingly, in mountainous areas of the Northern Hemisphere, the south-facing slopes receive the highest energy at noon. The north-facing slopes, on the other hand, receive little or no energy due to the topographic shading effect (Fig. 2e). Such a diurnal cycle of insolation would result in a major variation in the yearly or long-term mass balance of mountain glaciers (by surface melt) flowing on south- and north-facing slopes over a long timescale.
Calculating the orbital parameters
The combined influence of the slow changes in axial tilt (obliquity), the shape of the Earth's orbit (eccentricity), and axial precession results in long-term cyclical changes in daily incoming solar radiation. First, we computed long-term variations in orbital parameters, such as obliquity, eccentricity, and longitude of the perihelion (Berger and Loutre, 1991). These main orbital elements cause the long-term variation in the solar declination (δ) that produces seasonal variation in the solar altitude at the given latitude. The long-term variation in solar declination was then used to calculate the hour angle (ω), zenith angle (Z), and angle of incidence (θ) (Eqs. 3–11). We calculated all of the abovementioned values related to the orbital parameters in a time-dependent manner (Fig. 3).
Calculating the hour angle
To define aspect-driven contrast in potential direct solar radiation between south-facing and north-facing valleys, we calculated hourly insolation (Eq. 12) with the same input parameters, except for the topography (aspect and slope; Fig. 3). We calculated cell-by-cell sunrise and sunset hour angles of given topography for each valley (Eqs. 3–9) and used a 15∘ increment for every 1 h to calculate the hourly insolation, starting from the sunrise hour angle and continuing until it exceeded the sunset hour angle. Sunrise and sunset hour angles on an inclined surface were calculated as a function of latitude, solar declination, slope, and azimuth (Iqbal, 1983). The sunrise hour angle for a horizontal surface was calculated as follows:
The following equations give the respective sunrise and sunset hour angles on a surface oriented toward the east:
The following equations give the respective sunrise and sunset hour angles on a surface oriented toward the west:
Here, x and y are kinds of coefficients to make the equations above simpler (Eq. 1.6.7 of Iqbal, 1983):
Equations (3)–(9) are for calculating hour angles for arbitrary surfaces, where ωs is the sunrise hour angle for horizontal surfaces, ωsr and ωss are the respective sunrise and the sunset hour angles for an inclined surface, φ is the latitude, δ is the solar declination angle, β is the slope inclination angle, and γ is the surface azimuth angle.
Calculating the zenith angle and angle of incidence
The local zenith angle (Z) and the angle of incidence (θ) were then calculated using hour angles at 1 h intervals (ω). The zenith angle is the angle between sunrays and the normal plane to the surface (); it is approximated as a function of latitude, solar declination angle, and hour angle (Iqbal, 1983):
The angle of incidence on arbitrarily oriented surfaces is expressed as follows:
where β is the slope inclination angle and γ is the surface azimuth angle.
Calculating the daily insolation and daily melt
Hourly potential clear-sky direct solar radiation (I) was calculated as follows (Hock, 1999):
Here, I0 is solar constant (1368 W m−2) (Rm R−1)2 is the eccentricity correction factor of the Earth's orbit for the time considered, where R is the instantaneous Sun–Earth distance and Rm is the mean Sun–Earth distance; Ψa is the mean atmospheric clear-sky transmissivity (Ψa=0.75; Hock, 19989); Ph is the atmospheric pressure (NOAA, 1976); P0 is the mean atmospheric pressure at sea level; Z is the local zenith angle; and θ is the angle of incidence between the normal to the grid slope and the solar beam. Therefore, hourly insolation was summed into daily insolation for the corresponding day length (not for 24 h; Fig. 3).
We calculated daily melt with the following equation using the daily insolation value (Eq. 12):
Here, MF is a melt factor (mm d−1 ∘C−1), aice is a radiation coefficient for ice surfaces, I is potential clear-sky direct solar radiation at the ice surface (W m−2), and T is the time-dependent monthly mean temperature (∘C). Furthermore, we integrated (summed) the daily melt into monthly and summer melt, which is the same as the total ablation in this model (Fig. 3).
Calculating the time-dependent temperature
We calculated the time-dependent temperature of the study area in the following order:
-
Present-day monthly air temperatures (T) for both cirque headwall altitudes (3533.3 m for Jargalant and 3508.3 m for Ikh Artsan) were calculated from the two nearest national weather stations using a summer adiabatic lapse rate of 8 ∘C km−1 (Batbaatar et al., 2018). Bayangobi weather station (1540 m a.s.l.) is 27 km southeast of the study region, and Bogd (Horiult) weather station (1240 m a.s.l.) is 45 km northwest (Fig. 2c).
-
We use only summer temperature because, even today, monthly mean temperatures between August and May are less than 0 ∘C, at which point no melt occurs (NAMHEM, 2020). The long-term average of the extreme minimum temperature at the mean glacial toe altitude (Ikh Artsan and Jargalant) is −5.2 ∘C (calculated from Bayankhongor at 1874 m a.s.l using a lapse rate of 8 ∘C km−1). The JJA mean temperature at the cirque headwall altitude was measured as 5.4 ∘C in the Ikh Artsan Valley and as 3.5 ∘C in the Jargalant Valley. We chose the value of 5.4 ∘C for the summer temperature of the study area and carried out further calculations (see Supplement file 1).
-
We obtained a time-dependent summer temperature since 22 ka. The LGM summer temperature was easily calculated by subtracting the known LGM summer temperature anomaly (1–7 ∘C by Tarasov et al., 1999) from the present-day temperature of the study area. The modern and LGM summer temperature of the study area (5.4 ∘C) was calibrated to Greenland temperature data from the North Greenland Ice Core Project (NGRIP) ice core (Buizert et al., 2018) since 22 ka to obtain time-dependent temperature variation (see Supplement file 2).
-
The LGM summer temperature anomalies ranging from −5.0 to −6 ∘C were applied to calculate glacial melt since 22 ka (see Supplement file 2).
Glacier accumulation and snow data
Climatologies at high resolution for the Earth's land surface areas (CHELSA) provides high-resolution, downscaled centennial climate model data since 20 ka. We used CHELSA-TraCE21k 1 km monthly precipitation time series (Karger et al., 2017). Precipitation data between 22 and 20 ka were considered to be the same as 20 ka data. Only snowfall at the mean altitude of each valley was considered to be glacial accumulation, which occurs when the monthly average temperature is below 0∘C.
3.4.2 Glacial advance and retreat model based on glacier thickness change
Finally, a simple 2D ice surface model reconstructed paleoglacier behavior for 22–16 ka in the study area. First, we created small initial glacial surface profiles for both valleys using the 2D ice surface model developed by Benn and Hulton (2010). We computed the ice surface elevation (ice thickness) along the profiles in both valleys with this model. The model requires (1) assumed yield stress describing a glacier's basal shear stress and (2) a shape factor accounting for the valley-drag effects. We plotted the ice profile with 5 m spacing along the midline of each valley (Fig. 8d, e), assuming constant basal shear stress of 50, 100, 150, 200, and 300 kPa. Shape factors were calculated perpendicular to the profile with the same spacing as the profile. Subsequently, we calculated the glacier mass balance for 22–16 ka using our temperature-index melt model results and paleo-snow-accumulation data. Therefore, we applied corresponding paleo-mass-balance values on the initial ice thickness profiles. Ikh Artsan and Jargalant glaciers mostly developed within a cirque. The maximum erosion related to the rotational movement beneath a cirque is closely linked to the ELA for cirque glaciers (Dahl et al., 2003). Hence, in our model, the thickest ice surface related to the maximum erosion was considered to be ELA. Accordingly, variations in paleo-ELAs were calculated with respect to the ice thickness change. Eventually, we used the simple quadratic function formula () to determine the location of the glacial toe based on the ELA and headwall altitude values (Benn and Hulton, 2010). Using the glacial toe location, we could evaluate the paleoglacier advance and retreat at any time of interest.
4.1 Field observations and moraine stratigraphy
In Ikh Bogd, late-Quaternary glaciation was mostly confined within the cirque, and extensive valley glacier networks were absent. Glaciers in the Ikh Artsan and Jargalant valleys were also restricted to the cirques and underwent limited flow down to elevations of ∼ 3000 m a.s.l. The Jargalant Valley merges with the largest valley on the northern flank, Bituut River valley (Fig. 1b). This large drainage area only experienced glaciations in the form of short cirque-valley glaciers, as in Jargalant Valley. The fact that the massif was limited to small single (no networking) cirque-valley glaciers is best explained by the arid climate of the interior of the Gobi Desert.
Ikh Artsan cirque is smaller, and its glacial valley is shorter (∼ 1 km) than Jargalant. The best-preserved moraines, with at least seven to eight moraine crests, occur in the Ikh Artsan cirque (Figs. 4, 6a; Batbaatar et al., 2018). The farthest moraine sequence (MIA1) was distinguished by its down-valley stratigraphic position and long, flat ridge along the valley side (Fig. 4a). The MIA1 moraine is composed of thick, unsorted glacial debris of different particle sizes (from silt to boulder) with huge granitic boulders at the top. Towards the left, the moraine is cut by an intermittent stream, forming a deep valley (Fig. 4).
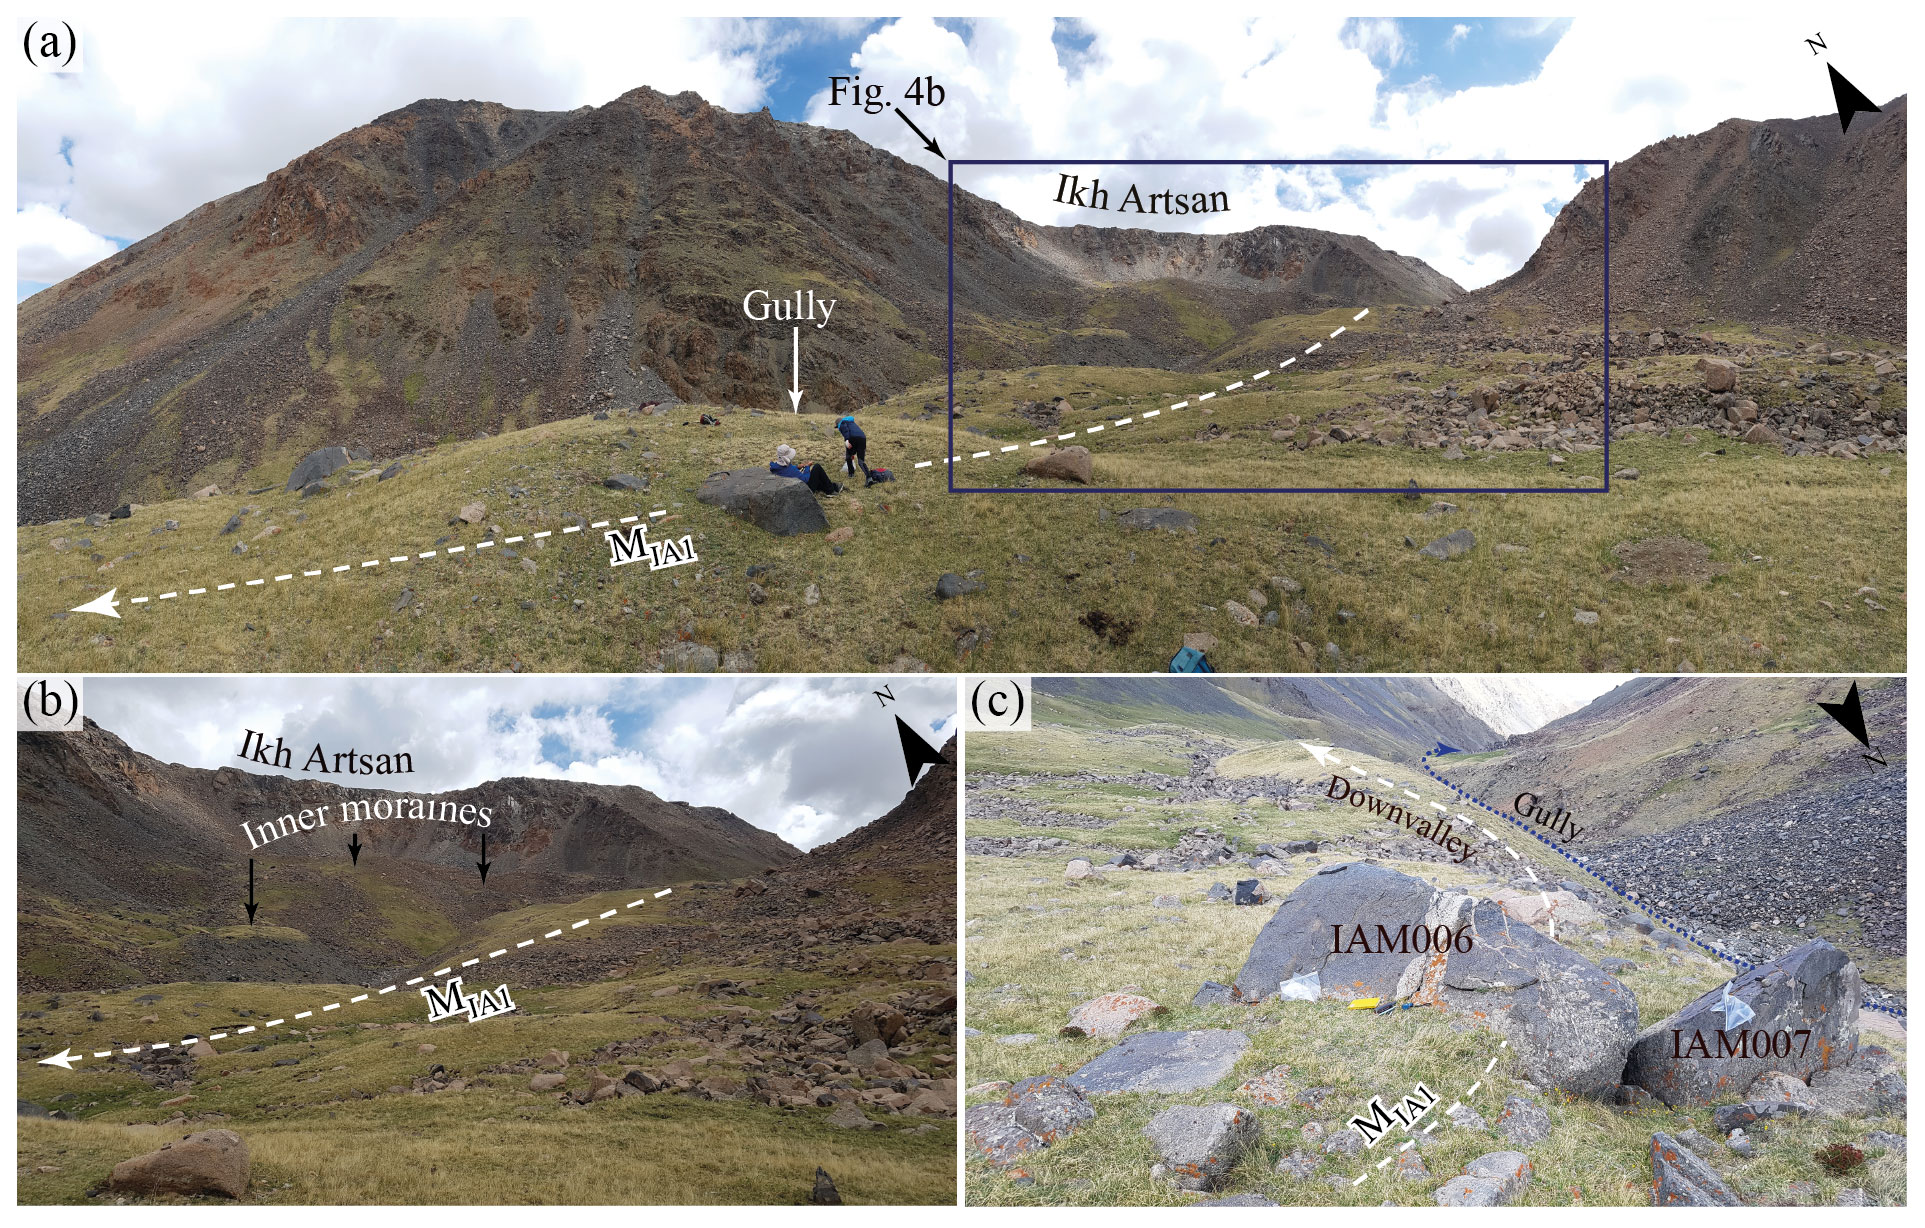
Figure 4Photo composites of the Ikh Artsan Valley and paleoglacial evidence. Panel (a) shows the Ikh Artsan glacial cirque and distal moraine ridge. The dashed white arrow represents the MIA1 moraine ridge, which marks the farthest extent of late-Quaternary glaciation. Panel (b) outlines the distal and inner moraine sequences (Batbaatar et al., 2018). Panel (c) presents the boulders from which the IAM006 and IAM007 samples were taken on the MIA1 moraine ridge.
The Jargalant paleoglacier has a larger accumulation area and length than Ikh Artsan Glacier, advancing 1.5 km down-valley. The moraine stratigraphy of the Jargalant hummocky moraine was quite complicated. The original moraine surface of the inner moraines has been dissected by a longitudinal stream, forming the parallel moraine mounds or elongated moraine ridges along the valley. In the field, we matched such uneroded surfaces (or ridges) with a similar elevation and assumed them to be an individual sequence. Stratigraphically, we identified four different moraine sequences in the Jargalant complex (MJ4, MJ3, MJ2, and MJ1, from youngest to oldest; Figs. 5, 6). The MJ4, MJ3, and MJ2 moraines are distinctively separated on the left side of the valley. An elongated moraine feature (MJ3 and MJ2) on the right side of the valley looks like a single-flow feature. However, we assumed that the original form of the moraine (separation) had been removed or reworked by stream erosion (Fig. 6c). According to these findings, some moraine boundaries are still uncertain; hence, we marked the boundaries with dashed lines in Fig. 5 and Fig. 6b and c. The MJ4 moraine lies between 3365 and 3410 m a.s.l. and contains angular to subangular, clast-supported pebble to boulders. Down-valley from the MJ4 moraine, the MJ3 and MJ2 moraines have been longitudinally dissected by stream channels, and an uneroded moraine surface forms elongated, parallel moraine ridges with smooth, matrix-supported flat tops and steep, clast-supported sides. These streams are filled with till and angular water-lain sediments. The oldest moraine (MJ1) was deposited further down-valley and consists of a single moraine ridge with large granitic boulders lying on the finer matrix-supported deposit. We mapped the extent of the most distal moraine ridge from the lower end of the MJ2 moraine to the point where the slope changes abruptly. We speculate that this oldest moraine may have extended far enough to reach the Bituut Valley; however, beyond this point, the moraine would have been reworked by post-glacial processes and the lateral erosion of Bituut River (Figs. 5 and 6b, c).
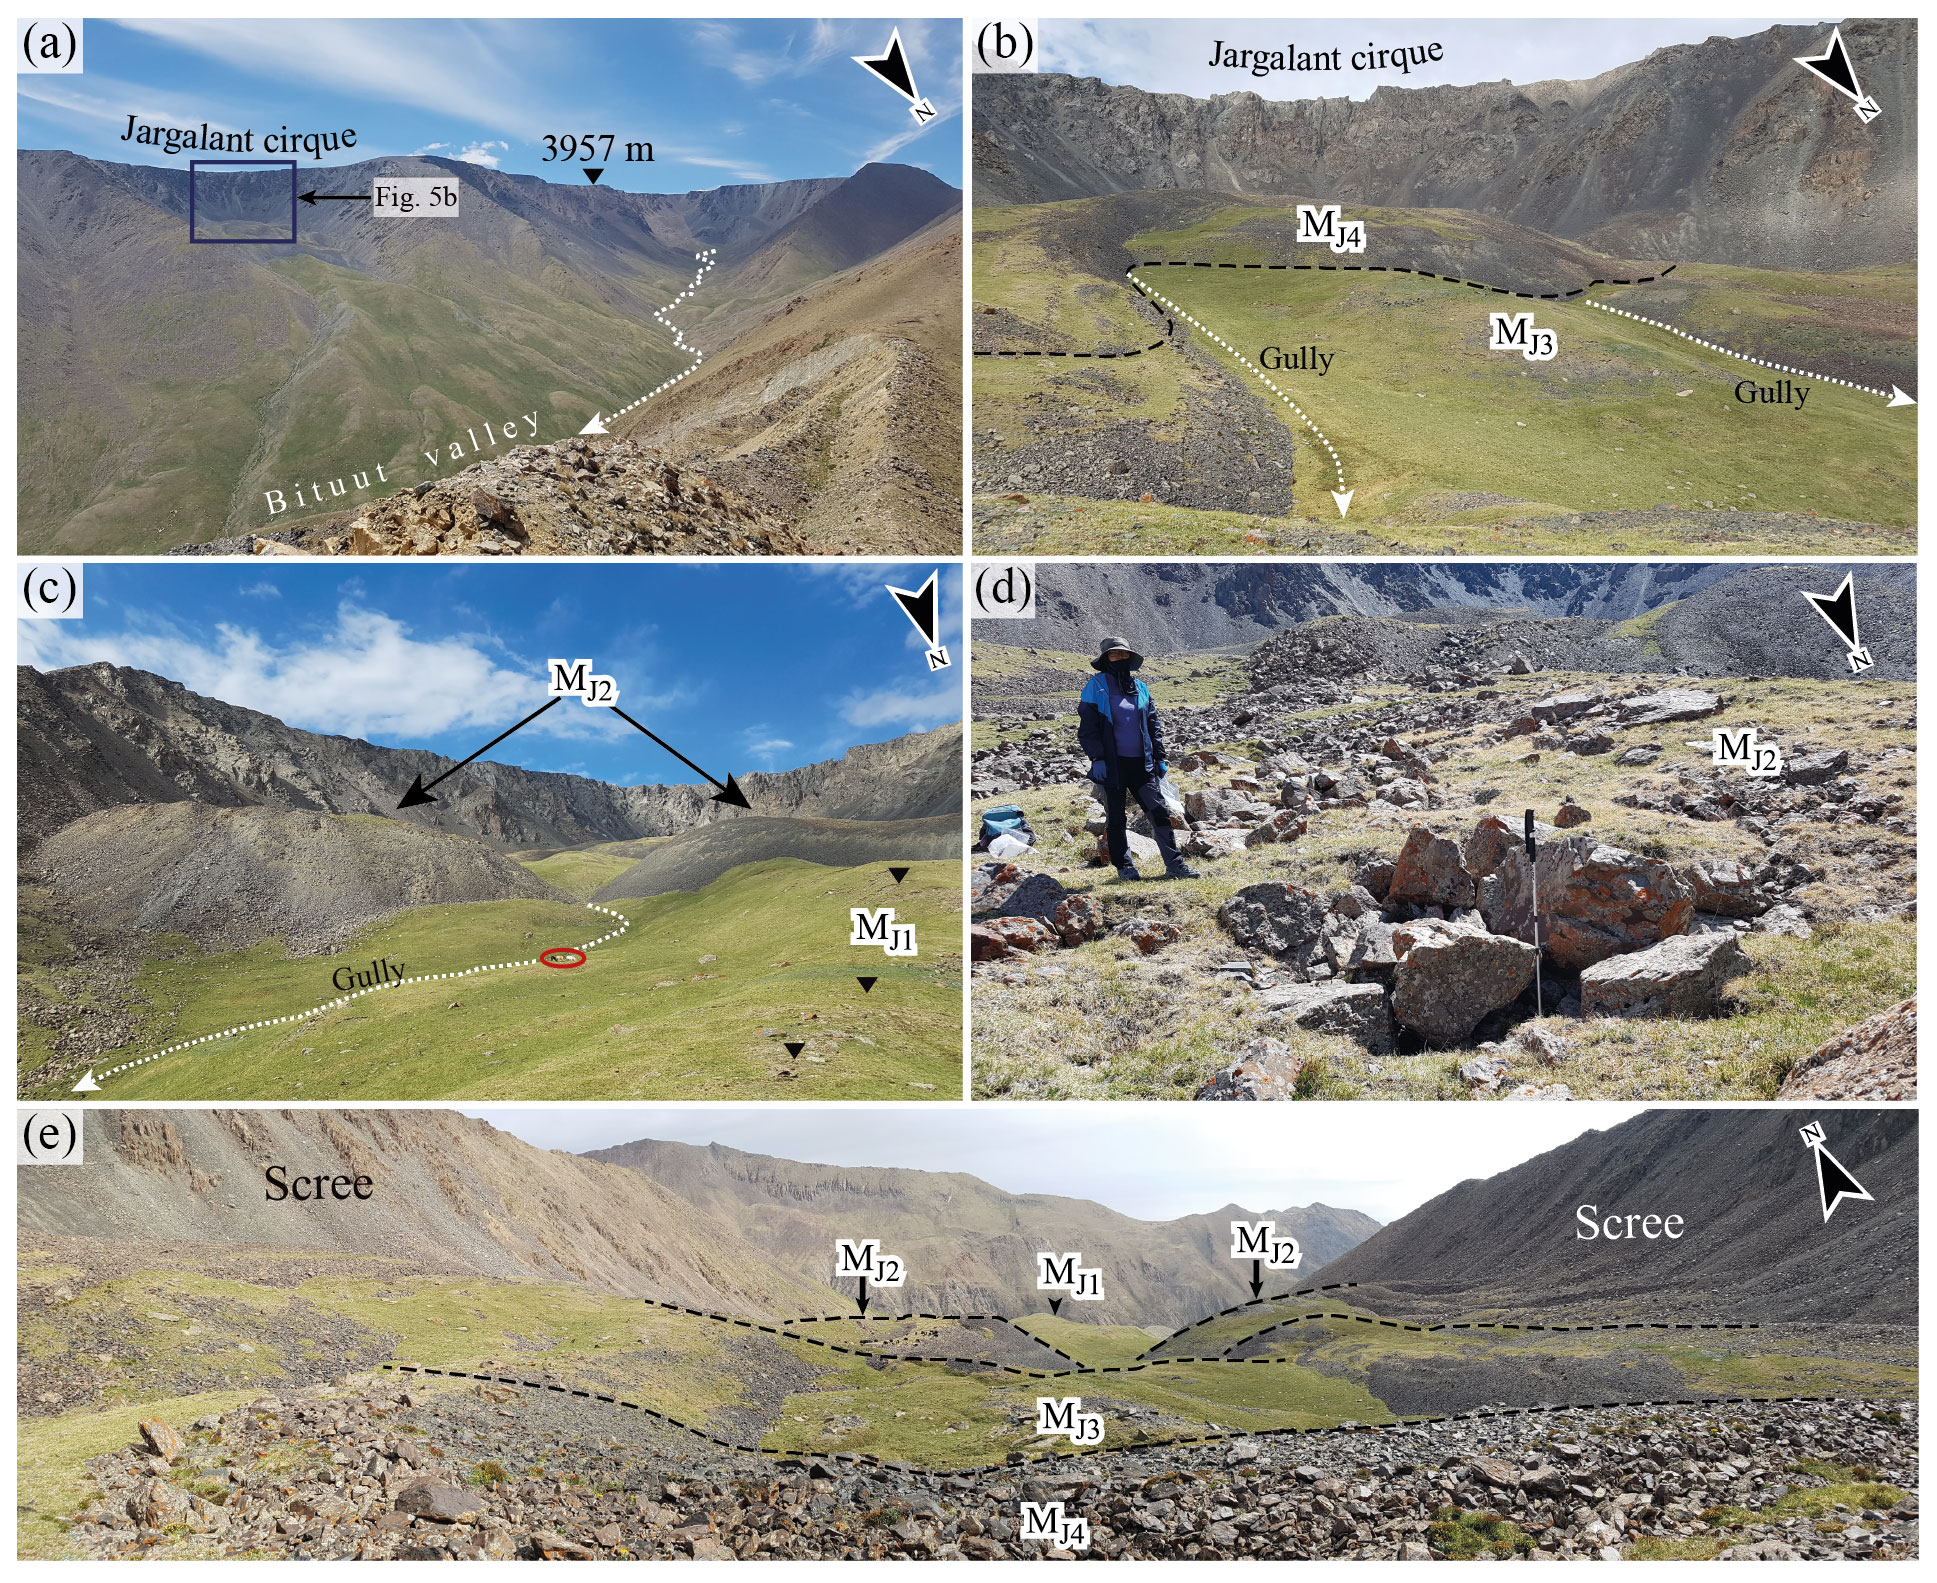
Figure 5The geomorphologic setting and moraine stratigraphy in Jargalant Valley. Panel (a) shows the Jargalant Valley and Bituut trunk valley that extends from the cirque near the highest peak (3957 m a.s.l.). Jargalant Valley is one of the large tributaries of Bituut Valley and is covered by a large amount of late-Quaternary moraine complex. Panel (b) presents the stratigraphic boundary between the MJ4 and MJ3 moraines in the Jargalant cirque. Moraines are dissected by longitudinal gullies. Panel (c) shows a pair of MJ2 moraines and the oldest MJ1 moraine ridge; horses (red circle) are for scale. Panel (d) gives an indication of boulder sizes on the MJ2 moraine range from the sub-meter scale to a scale of several meters. Panel (e) is a down-valley view of the moraine sequences from the uppermost moraine sequence.
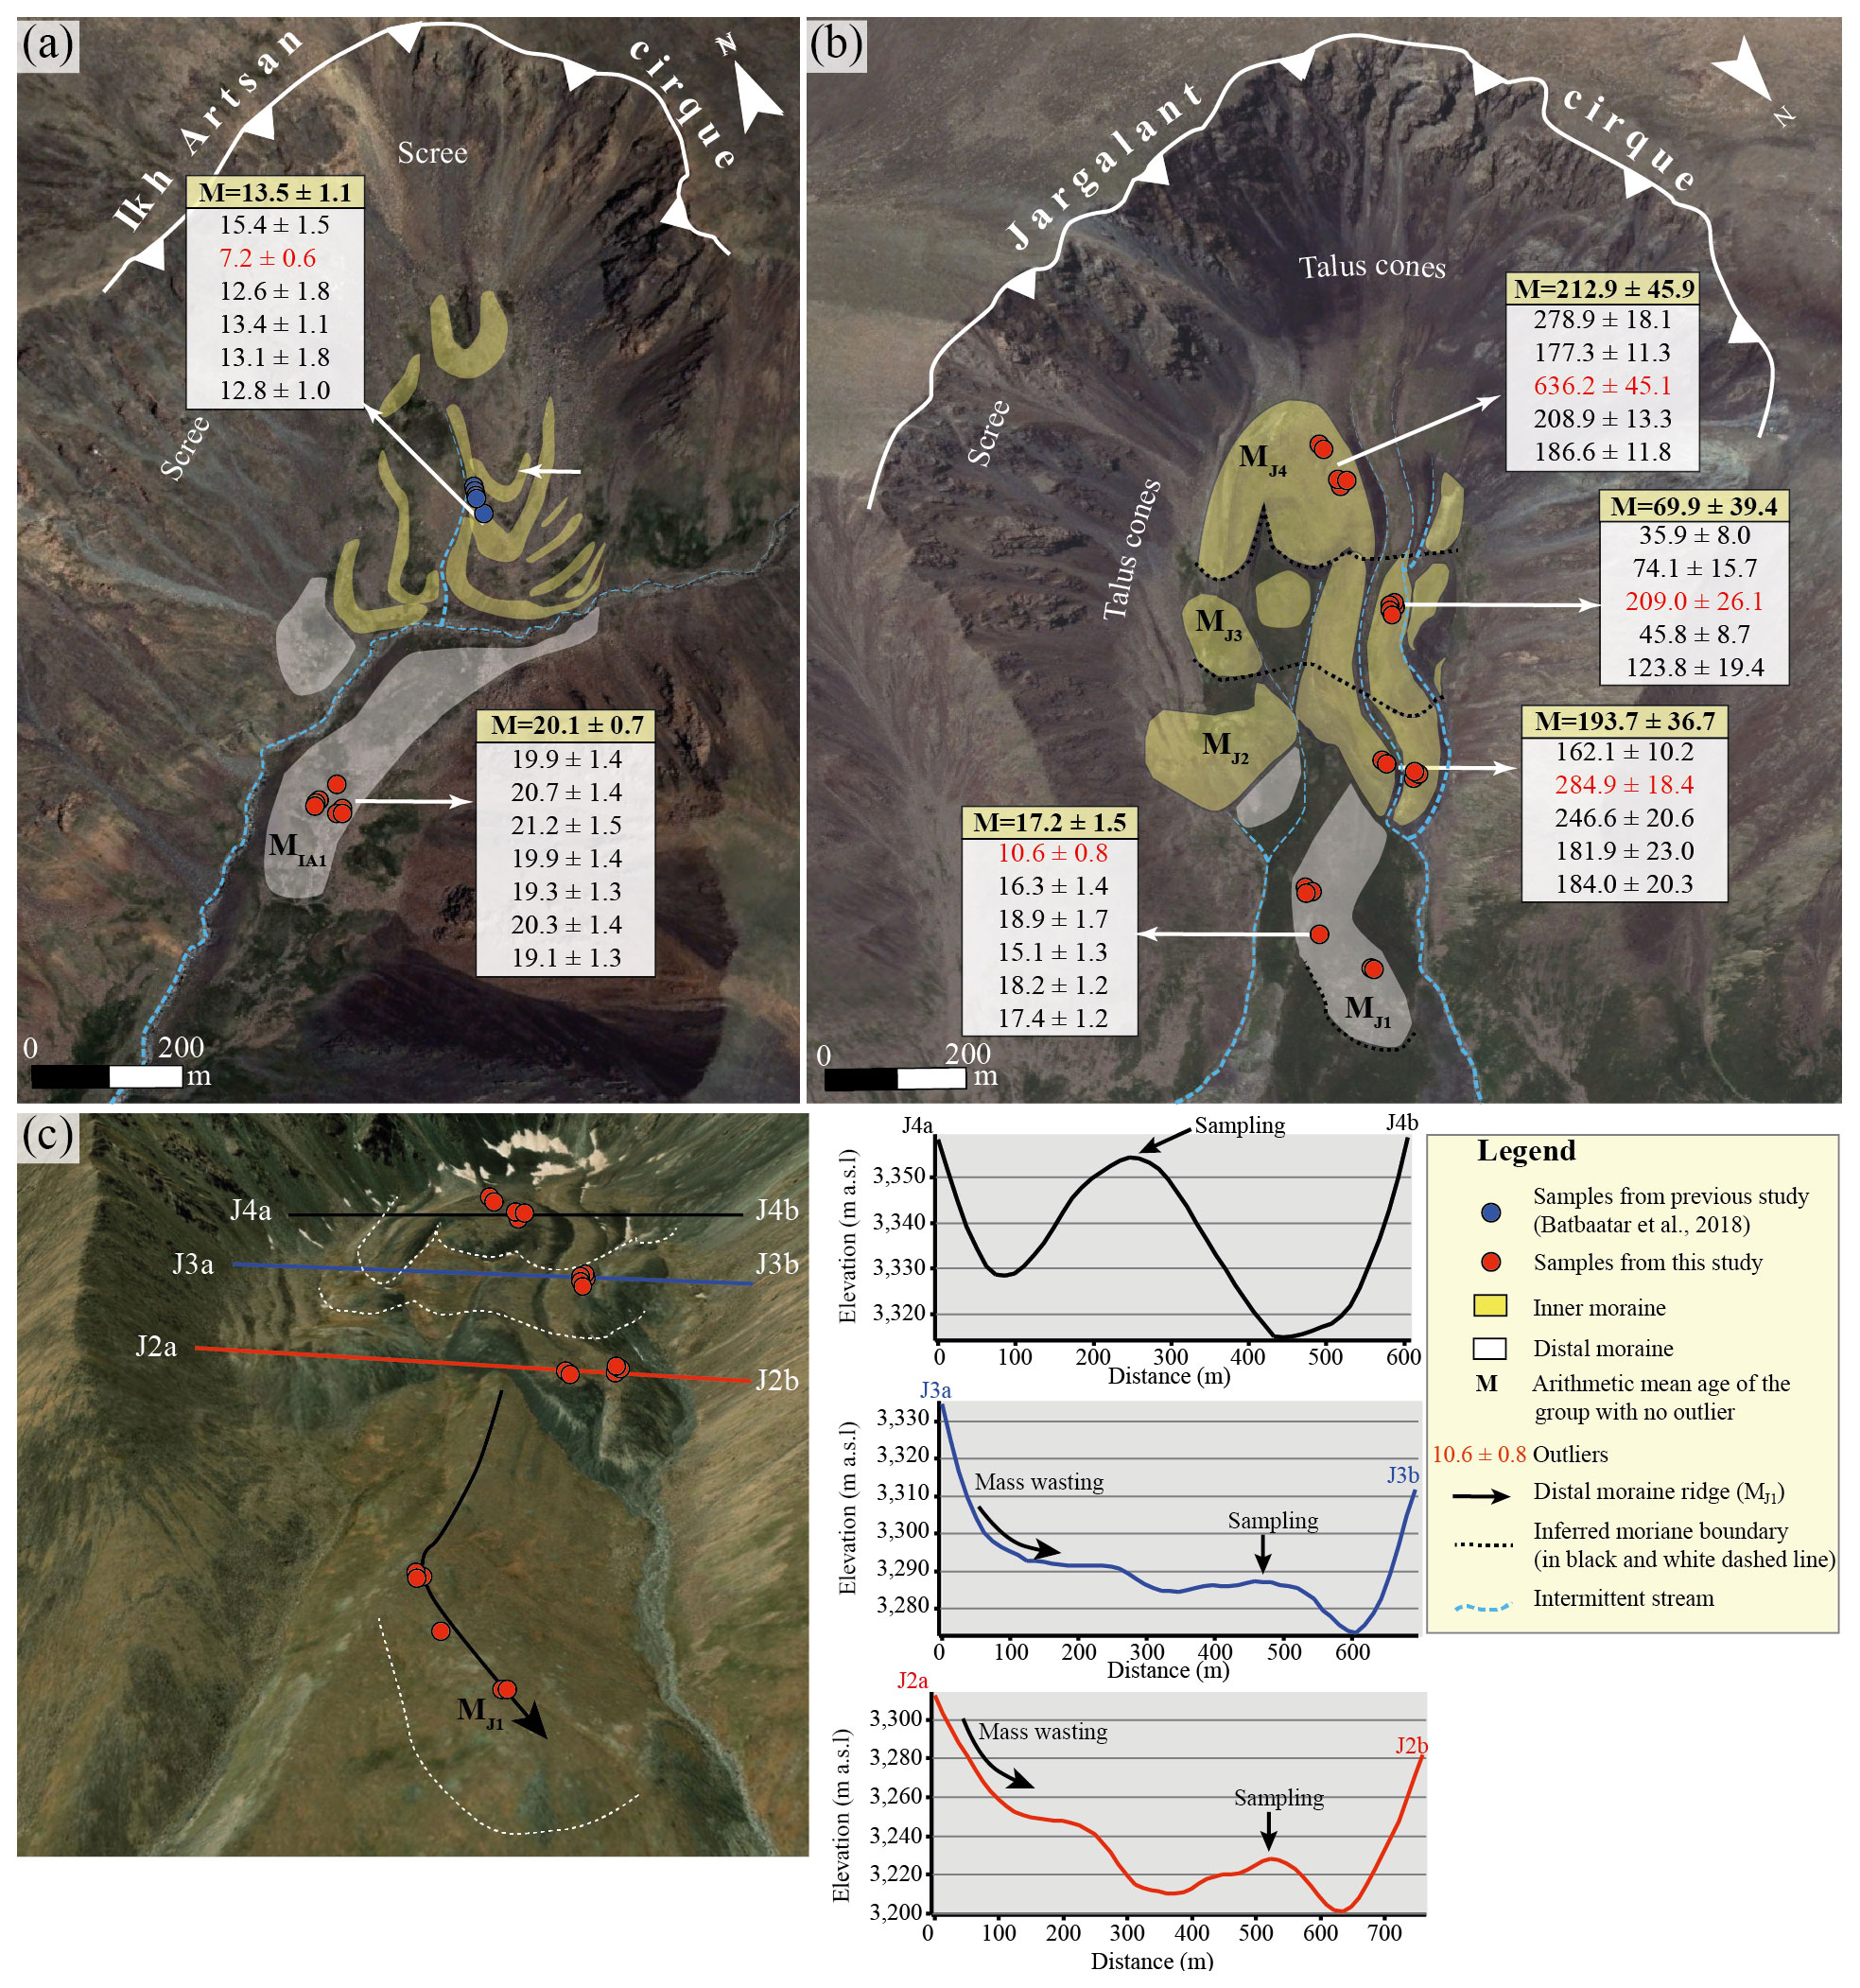
Figure 610Be Exposure ages (ka) for outer (white) and inner (yellow) moraine sequences. Panel (a) presents exposure ages from the Ikh Artsan moraine sequences. Panel (b) shows the age dating result for the Jargalant hummocky moraine complex. The background images in panels (a) and (b) are from Bing Maps (© Microsoft, 2023, aerial imagery). Panel (c) presents a cross-section view of the inner moraine sequences (MJ4–MJ2) in Jargalant Valley; the background image is oblique imagery from © ArcGIS Earth (2023; V1.16.0.3547). Mass-wasting deposits on the moraine surface and intermittent stream incision have altered the original moraine morphologies. Samples were taken from the highest intact point of the longitudinally elongated moraine ridge; this ridge was thought to be unaffected by reworking processes, as the exposure age dating result from the inferred inner moraine sequences (MJ4–MJ2) shows high inheritance that could not have contributed to the inferred moraine sequences.
4.2 Late Pleistocene ELA reconstruction
The LGM ELA was calculated for the MIA1 and MJ1 moraines (Table 3). We estimated the former ELA using a headwall altitude of 3508–3532 m. The terminal moraine was also identified at an elevation of 3222 m a.s.l. in the Ikh Artsan Valley. Accordingly, the ELA for the MIA1 moraine was 3388 m a.s.l. In contrast, a large terminal moraine was deposited at 2998 m a.s.l. in the Jargalant Valley. The ELA associated with the MJ1 moraine was 3308 m a.s.l., which was about 80 m lower than the MIA1 moraine.
Table 3The LGM ELA reconstruction.
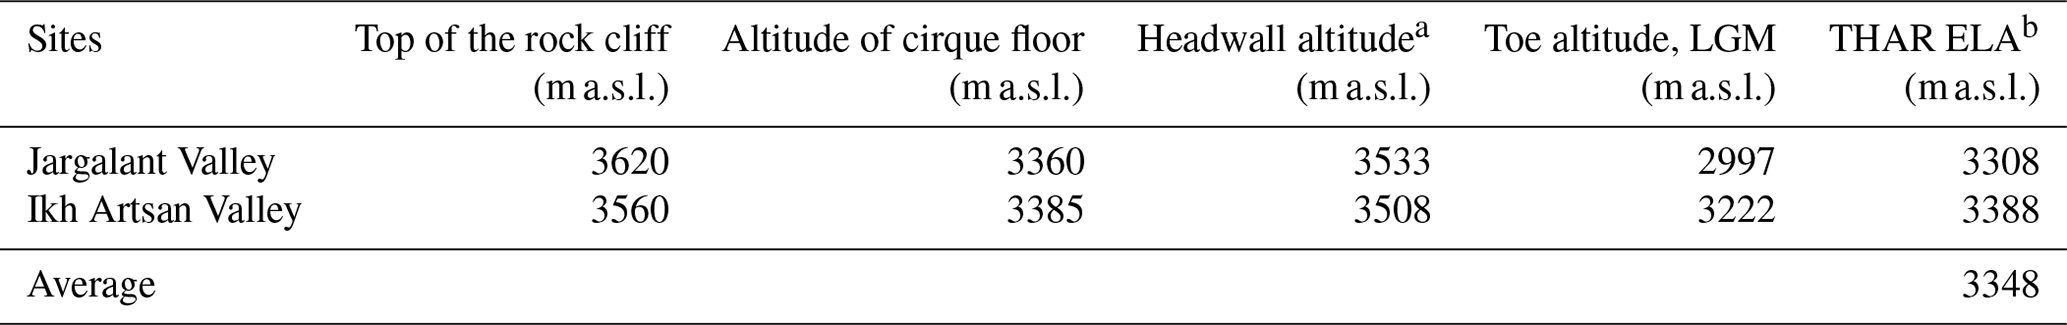
a The headwall altitude for LGM glaciers was selected at one-third of the altitude difference between the top of the rock cliff and the cirque floor (Goldthwait, 1970). b A THAR of 0.58 was used to calculate the LGM ELA (Batbaatar et al., 2018), the ALOS PALSAR DEM with a spatial resolution of 12.5 m was used to extract corresponding elevations, and the altimetric error (vertical uncertainty) was ∼ 5–7 m (Chai et al., 2022; Ferreira and Cabral, 2022).
4.3 10Be surface exposure age dating
We present 28 new 10Be exposure ages obtained from the boulders associated with five different moraine sequences: MIA1 in Ikh Artsan Valley and MJ1, MJ2, MJ3, and MJ4 in Jargalant Valley (Table 4; Fig. 6). A brief outline of the sampling undertaken at the two locations is given in the following:
-
In the Ikh Artsan Valley, seven granitic boulders (IAM001–IAM007) sampled from the most distal moraine ridge ranged in age between 21.2 ± 1.5 and 19.1 ± 1.3 ka. 10Be exposure ages from this moraine sequence were well clustered, and none of the three methods (Chauvenet, Pierce, or standardized deviation) detected outliers. The moraine formation age was found to be 20.1 ± 0.7 ka (20.1 ± 1.6 ka with total uncertainty), Rχ2 was 0.29, and the group relative uncertainty was calculated as 4 % (Fig. 7).
-
In Jargalant Valley, 21 granitic moraine boulders on the four moraine sequences were targeted. Five to seven boulders from each moraine crest were sampled. Outliers were detected and rejected using the Pierce and normalized deviation criteria. Although the results from the Pierce and normalized deviation methods were consistent, the Chauvenet method could not recognize some outliers that were recognized by the Pierce and normalized deviation criteria. Exposure ages from the innermost MJ4 moraine ranged from 636.2 ± 45.1 to 177.3 ± 11.3 ka. The oldest age (636.2 ± 45.1 ka for JAM003) was excluded, and the four remaining 10Be exposure ages provided a mean age of 212.9 ± 45.9 ka (212.9 ± 47.9 ka with total uncertainty). Five boulders from the MJ3 moraine ranged in age between 209.0 ± 26.1 and 35.9 ± 8.0 ka. The group mean age was calculated as 69.9 ± 39.4 ka (69.9 ± 41.5 ka with total uncertainty) after rejecting an outlier of 209.0 ± 26.1 ka (JAM008). Boulders from the MJ2 moraine yielded ages from 284.9 ± 18.4 to 162.1 ± 10.2 ka with a mean exposure age of 193.7 ± 36.7 ka (193.7 ± 41.1 ka with total uncertainty) after rejecting the oldest age of 284.9 ± 18.4 ka (JAM012). Samples from the distal moraine of Jargalant Valley (MJ1) ranged in age from 18.9 ± 1.7 to 10.6 ± 0.8 ka. The arithmetic mean age for this moraine sequence was 17.2 ± 1.5 ka (17.2 ± 2.1 ka with total uncertainty) without the youngest age of 10.8 ± 0.5 ka (JAM016). The group was relatively well clustered, its relative uncertainty was 9 %, and Rχ2=1.18 (Fig. 7). For erosion rates of 1–4 mm kyr−1, an exposure age of 10 ka, calculated assuming zero erosion, would underestimate the true age by 1 %–4 % and an age of 20 ka would underestimate the true age by 2 %–7 %. Samples with longer exposures (boulders with inheritance), older than 100 ka, were increasingly sensitive to erosion; for example, JAM10 (123.8 ka) had an impact, increasing ages by 12 %–125 % for 1–4 mm kyr−1, and JAM03 (636.2 ka) was even saturated for a 1 mm kyr−1 boulder erosion rate.
Our age dating results from the most distal moraines of Ikh Artsan (20.1 ± 1.6 ka) and Jargalant (17.2 ± 2.1) coincide within a narrow range (19.2–18.5 ka), as we apply total uncertainties to the group mean. However, a t test reveals (T=3.928, P=0.001) that the exposure ages from the distal moraine of Ikh Artsan presented a statistically significant difference compared with the Jargalant distal moraine based on the standard deviations (variance) of the two groups. Likewise, the exposure ages of the two groups were different at the 0.05 significance level (T=2.665, P=0.044) using the total uncertainties instead of the variance.
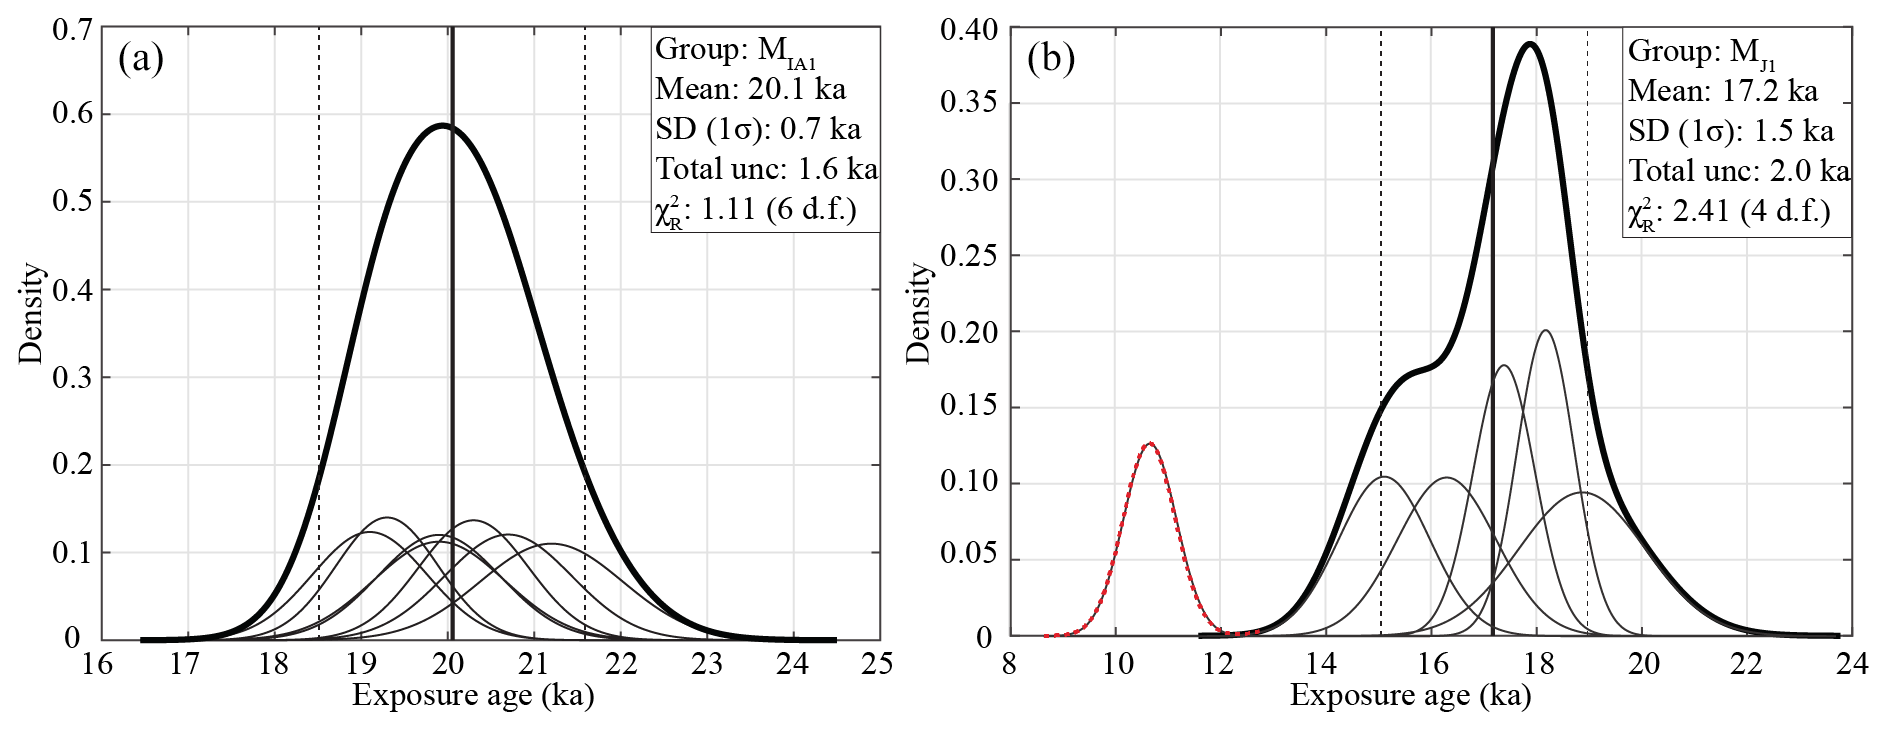
Figure 7Kernel density plots (KDPs) of estimated 10Be exposure ages from distal moraine crests in the Jargalant and Ikh Artsan valleys. Plots were created using the iceTEA MATLAB code by Jones et al. (2019). Panel (a) presents a KDP of the exposure ages of the most extensive moraine sequence (MIA1) in the Ikh Artsan Valley. No outliers were detected. The arithmetic mean was calculated and is marked using a bold solid vertical line. Panel (b) shows a KDP of the exposure ages from the oldest (MJ1) moraine sequence in the Jargalant Valley. An outlier was excluded using the Chauvenet criterion, the Pierce criterion, and the standardized deviation method in the 1σ range. The thick solid lines represent the cumulative density curve; the dashed red line shows the excluded outlier; and the solid, narrow black lines show individual density curves for each sample. The range of the total uncertainty of the group is marked as two vertical dashed lines. The sample statistics were calculated after rejecting outliers, and internal errors were used to create the KDP and calculate sample statistics.
Table 4Result of 10Be exposure age dating.
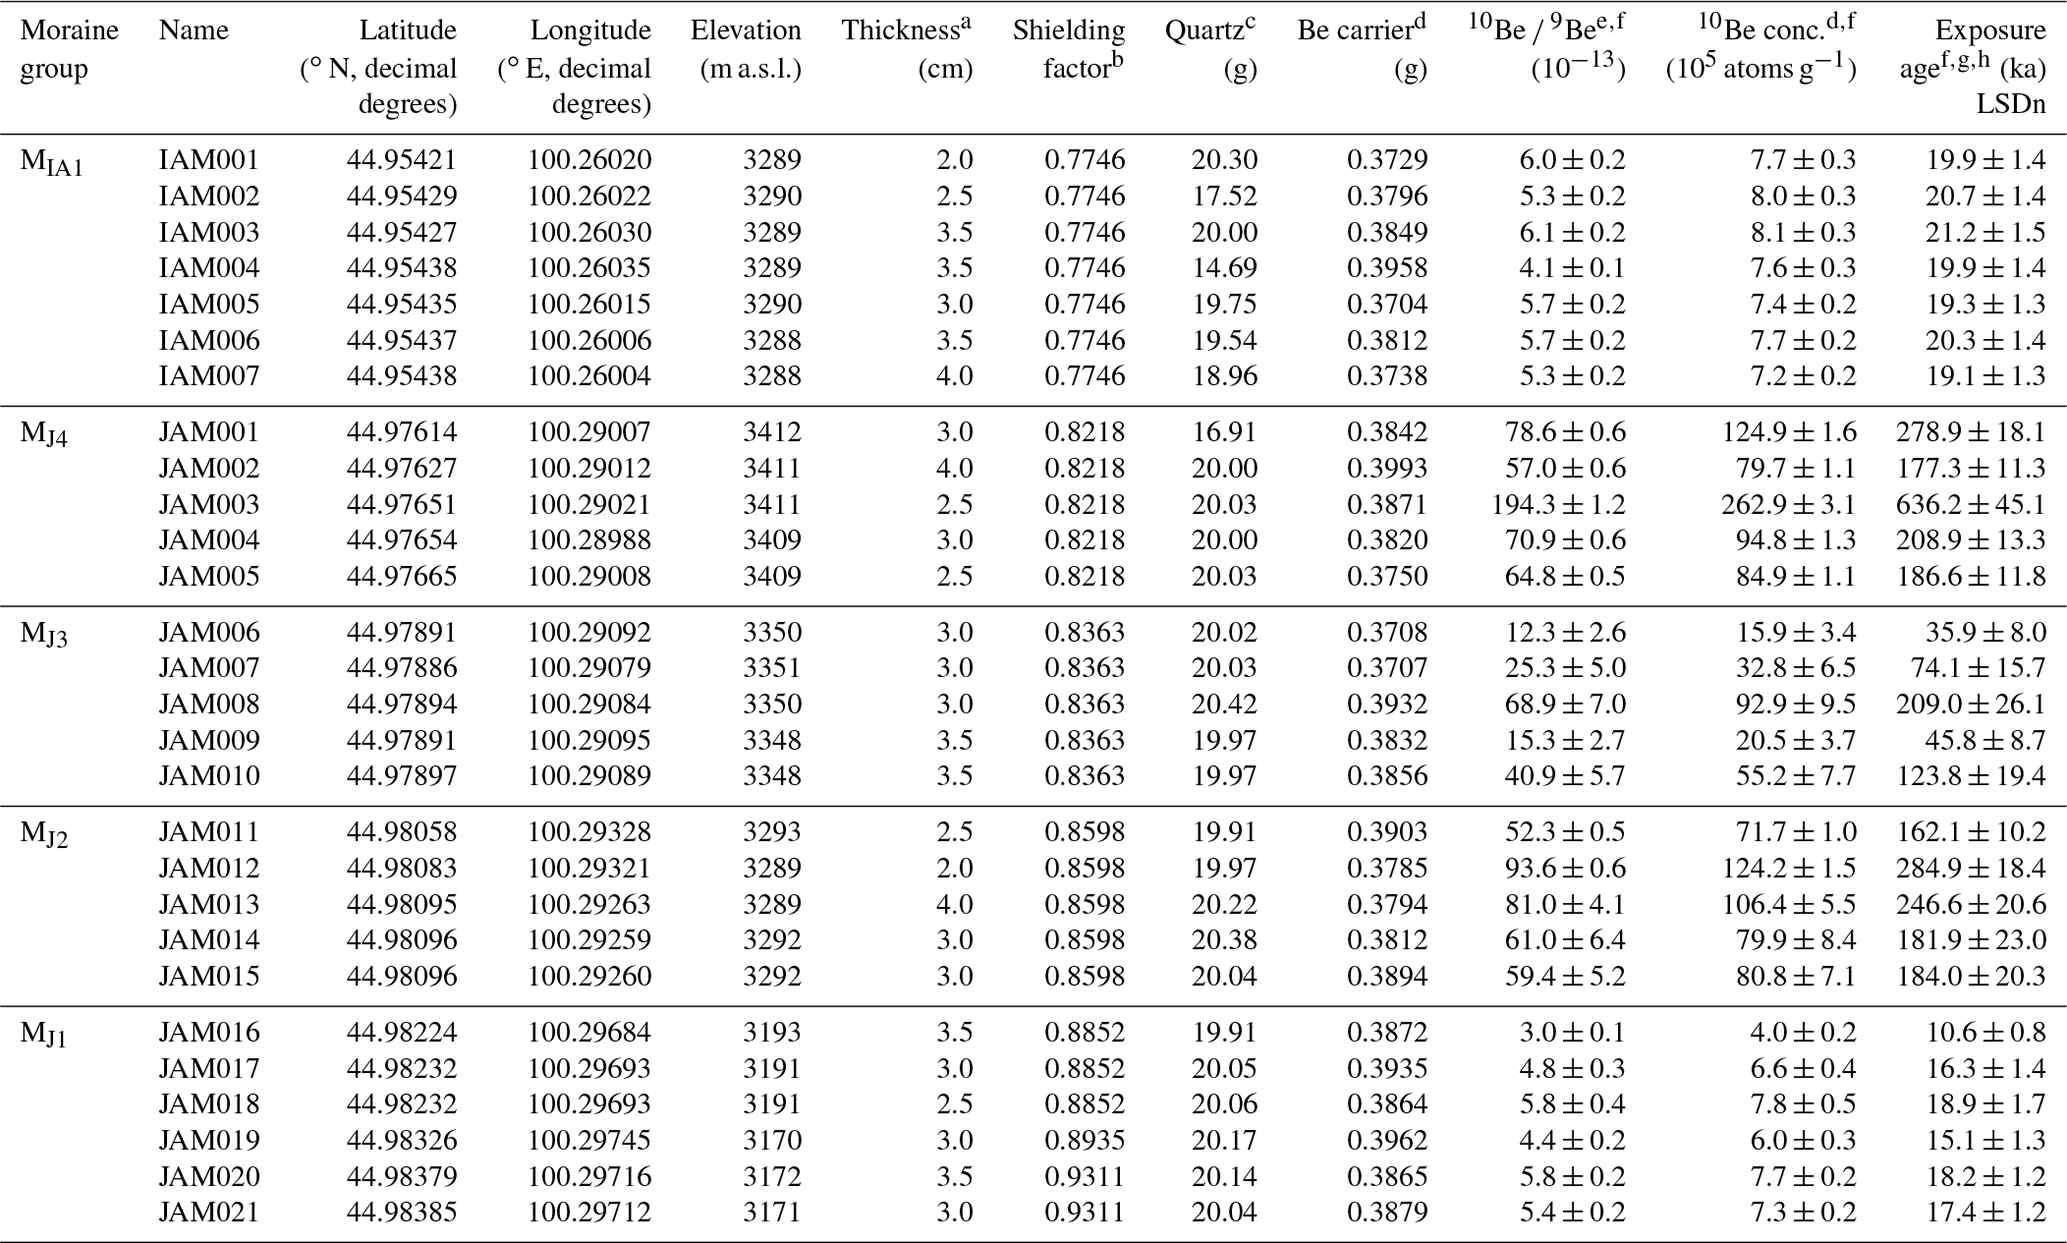
a Sampling thickness of the boulders' outermost exposed surfaces. b Topographic shielding factors for each sampling site were measured at intervals of 30∘. c Weight of the pure quartz. The density of granite (2.7 g cm−3) was used to calculate exposure age. d A mean value of process blank samples (4.53 × 10⁻¹⁵ ± 1.62 × 10⁻¹⁵) was used for correction. e 10Be 9Be ratios were normalized with 07KNSTD reference sample 5-1 prepared by Nishiizumi et al. (2007) with a 10Be 9Be ratio of (calibrated error) and using a 10Be half-life of 1.36×10⁶ years. f Uncertainties were calculated at the 1σ confidence level. g Exposure ages, assuming zero erosion, were calculated using the CRONUS-Earth online calculator version 3.0.2 (Balco et al., 2008). h The constant production rate of the 10Be model of Lifton et al. (2014) was used.
Boulders from inner moraines (MJ4, MJ3, and MJ2) presented older (∼ 636.2–35.9 ka) exposure ages than the timing of the maximum extent; unlike morphostratigraphy, the inner moraines should be younger than the distal moraine (MJ1). This unexpected, significant inheritance has been widely recognized around the globe in previous studies (Ciner et al., 2017, references therein), possibly overestimating the real deposition age of moraines. We interpret that the unexpected older exposure ages (∼ 636.2–35.9 ka) from the MJ4, MJ3, and MJ2 moraines of the Jargalant Valley strongly imply inheritance from the summit plateau. These unusually old boulders are pieces of the summit plateau that were transported onto the glacier surface by rockfall, which seems to have also happened in recent times. For temperate glaciers, rock fracturing occurs not only on the headwall above the glacier but also within the bergschrund (bottom of the headwall) due to ice segregation. This kind of undermining (sapping) process and/or glacial debuttressing would drive consequent upper headwall collapse and supply a large amount of rock to the glacier (Table 4, Fig. 6b; Sanders et al., 2012). The 10Be concentration of the oldest sample (JAM003 with a 10Be concentration of ∼ 262.9 × 10⁵) likely represents the nuclide concentration at the surface of the summit plateau. The production rate for the summit plateau (60.49 atoms g−1 yr−1) must be higher than the moraine samples (38.45 atoms g−1 yr−1) due to its higher elevation (3625 m), compared with sampling sites, and 100 % exposure (topographic shielding is 1) to cosmic-ray bombardment. Based on the high 10Be concentration of JAM003 and the summit plateau (3625 m a.s.l.) production rate, the assumed exposure age of the flat summit plateau was calculated as 442.3 ± 29.8 ka, and the corresponding erosion rate was calculated as 1.23 ± 0.10 mm kyr−1.
4.4 Results from 2D ice surface modeling
We ran a potential direct solar radiation model, applying it to a 12.5 m resolution DEM for a more realistic comparison. The model suggests that the aspect largely affects the incoming potential clear-sky solar radiation. The result supported the fact that the south-facing slopes in mountainous regions receive more solar radiation than the north-facing slope in our study area. At solar noon, the Sun is always directly south in the Northern Hemisphere; hence, southern slopes of the mountainous area receive their maximum insolation. However, the orientations of the two valleys are not true north or south: the azimuth of the Ikh Artsan is 247∘ (south-southwest) and the azimuth of Jargalant is 40∘ (north-northeast). According to the exact orientation, the peak of the daily insolation contrast between the two valleys is calculated between 15:00 and 16:00 LT (local time), not at noon. The current June solstice incoming daily solar radiation was 8527.34 in Ikh Artsan Valley and 7714.35 W h m−2 in Jargalant Valley, whereas solar radiation was lower during 22 ka: 8460.07 W h m−2 in Ikh Artsan and 7604.54 W h m−2 in Jargalant. Although both valleys received maximum insolation in the first to the middle half of June, the maximum difference in incoming daily solar radiation occurred at the end of August. The main difference in the daily incoming solar radiation ranges from 10 % to 24 % on summer days over the period from 22 to 16 ka. The spatial distribution of potential direct solar radiation in the study area is given in Fig. 8. Typically, the total daily insolation anomaly of the summer solstice in 20 ka compared with the present day and the integrated total daily insolation for 22–16 ka were described on the 12.5 m grid cells (Fig. 8d, e). In the same way, a 14 % excess of total summer insolation was observed on the southern slope during the modeling time interval of 22–16 ka (Fig. 8f; see also Supplement file 2).
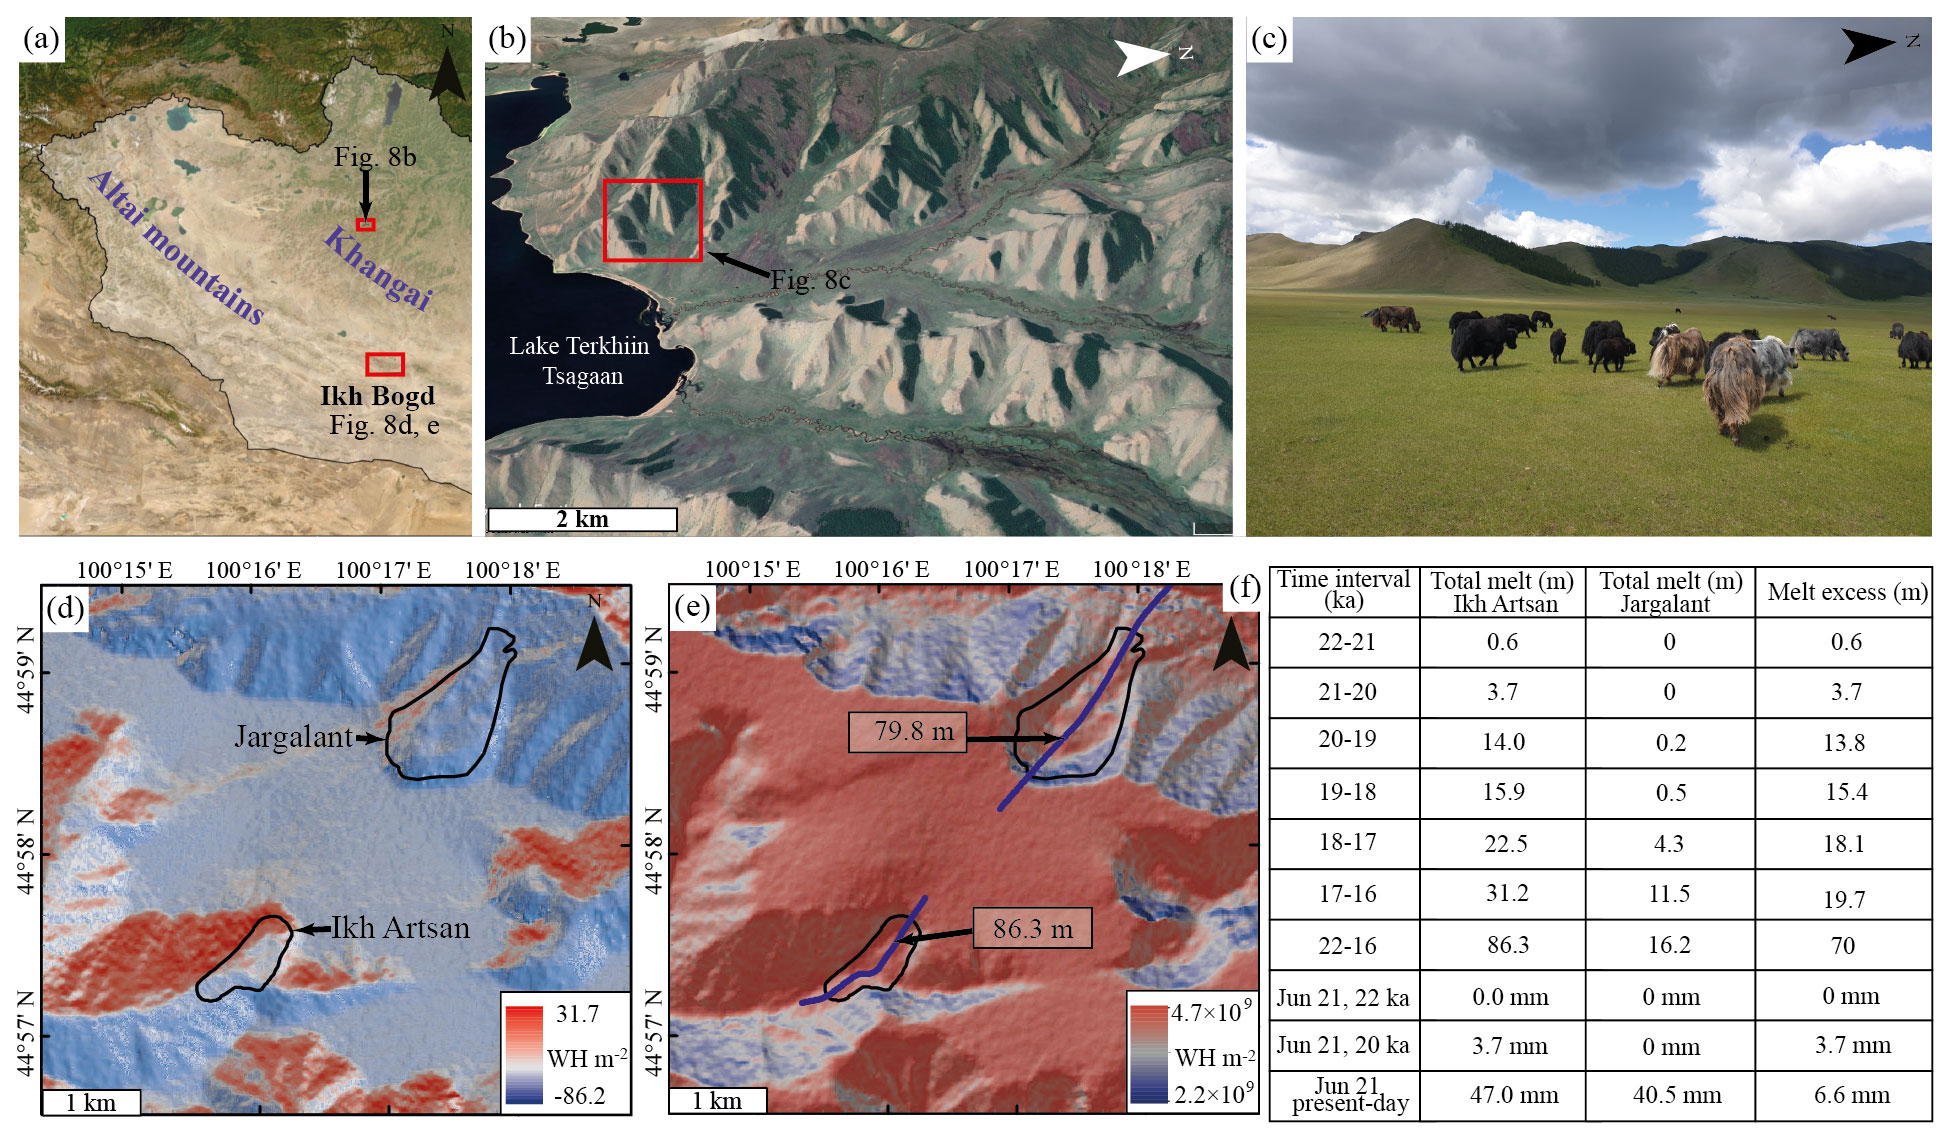
Figure 8Asymmetric distribution of potential clear-sky direct solar radiation, glacial melt, and vegetation on the south- and north-facing slopes. Panel (a) provides a location map of Ikh Bogd and Terkhiin Tsagaan Lake. Panels (b) and (c) show the tree distribution on the north-facing slope, north of Terkhiin Tsagaan Lake (© Google Earth 2022; photo taken by authors). Panel (d) provides the anomaly of total clear-sky direct solar radiation at the June solstice in 20 ka compared with the modern value. Panel (e) shows the integrated total summer insolation for 22–16 ka. The purple line represents a profile along the midline in the Ikh Artsan and Jargalant valleys. Calculated integrated total melt was 86.3 m in Ikh Artsan and 79.8 m in the Ikh Artsan Valley for 22–26 ka at the same temperature. Panel (f) presents the integrated total melt calculation for the Ikh Artsan and Jargalant valleys considering that the average summer temperature in Jargalant is 0.5 ∘C lower than that in Ikh Artsan.
For simplicity, the melt was calculated (Eq. 12) along specific profiles within the Ikh Artsan and Jargalant valleys (Fig. 8e, f). In accordance with the incoming solar radiation contrast, melt rates on south-facing slopes exceed those on north-facing slopes, as would be expected. If modern glaciers existed in Ikh Bogd, the present-day summer melt would be calculated as 4.0 m in Ikh Artsan and 3.7 m in Jargalant, respectively. This was a substantially high melt rate in the arid, cool climate of the study area. The temperature-index melt model discovered that a 5 % melt excess in the June solstice of any year between 22 and 16 ka was observed on the south-facing slope. Approximately 8 % of the difference in summer melt in any year was observed for 22–16 ka (Fig. 8f; see also Supplement file 2).
We run our 2D ice surface model for many time periods using different values of basal shear stress, LGM summer temperature anomalies, and site temperature (Supplement file 2). The cirque and valley dimensions reflect the glacier size (including thickness) and the intensity of former glacial erosion (Barr and Spagnolo, 2015). The normal stress acting on the glacier bed is mainly a result of the weight (thickness) of a glacier. Jargalant Glacier is 2.7 times larger in area than Ikh Artsan and twice as long in glacier length, forming a large, deep, and well-developed cirque. According to the glacial valley size, we chose the higher basal shear stress for Jargalant Valley (200 kPa) and the lower value for Ikh Artsan Valley (100 kPa). The LGM summer temperature anomalies ranging from −6 to −5 ∘C with 0.1 ∘C intervals were applied in the same manner for both glaciers. Some previous studies have suggested that the temperature is lower on the north-facing slopes at the same altitude. On the north-facing slope of Mount Taibai, Qinling, the JJA monthly mean temperature is measured to be 0.5–1 ∘C lower than on the south-facing slope within the altitude range from 1250 to 3750 m (Tang and Fang, 2006). Therefore, we applied two different temperature values for north-facing Jargalant Glacier: (1) using the same present-day temperature as for Ikh Artsan Valley and (2) using a lower present-day temperature for Jargalant Valley than for Ikh Artsan. More information on these two cases is given in the following:
-
Case 1 – applying the same present-day temperature. When we used the same present-day temperature and the same LGM anomaly of −5.5 ∘C, the modeled chronology of the maximum extents (20.2 ka) of the two glaciers were similar and were also consistent with the Ikh Artsan terminal moraine age dating result (20.1 ka). According to this model (case), Jargalant moraine advanced maximally until 20.1 ka and probably reached Bituut Valley.
-
Case 2 – applying a different present-day temperature. For Jargalant Glacier, we applied a lower present-day temperature, by −1 to −0 ∘C (at a 0.1 ∘C interval), than for Ikh Artsan. The run yielded different chronologies of maximum ice expansions. Only a small temperature change between the south- and north-facing slope forced the two glaciers to behave asynchronously, as the north-facing glacier had a 2.70–3.46 kyr lag in the timing of the maximum extent. When we applied a −5.5 ∘C LGM summer temperature anomaly and present-day summer temperature in Jargalant (0.5 ∘C lower than in Ikh Artsan), Ikh Artsan Glacier reached its maximum extent near 20.2 ka. In contrast, Jargalant Glacier underwent a maximal advance at approximately 17.1 ka. This result perfectly fits our 10Be moraine age dating results (20.1 and 17.2 ka).
5.1 Asynchronous glaciation in midlatitude ranges
Recent glacial chronologies from midlatitude mountain ranges in the North Atlantic region document that the Laurentide and Scandinavian ice sheets and number of valley glaciers behaved synchronously, advancing to their maximum extent at roughly the same time as the gLGM (26.5–19 ka). However, some experienced pre-LGM glacial maxima, whereas others stagnated, readvanced, or continuously advanced even farther during the subsequent Heinrich Stadial 1 (HS-1, 17.5–14.5 ka), displaying both inter-range and intra-range asynchrony (Laabs et al., 2009; Young et al., 2011; Licciardi and Pierce, 2018; Palacio et al., 2020).
In Europe, large-scale inter-range asynchrony (several tens of kiloyears) of the last glacial termination was common. Cosmogenic surface dating from the Alps and Türkiye provides nearly synchronous last glacial maxima with the gLGM (26.5–19 ka, MIS 2). Whereas other numerical dating techniques, including radiocarbon, U-series, and optically stimulated luminescence, indicate earlier local glacial maxima (80–30 ka, MIS 4–MIS 3) in the Cantabrian, Pyrenees, Italian Apennines, and Pindus mountains (e.g., Jiménez-Sanchez et al., 2013; Oliva et al., 2019). Another inter-range asynchrony was observed in mountain glaciers of North America. They reached their maximum extent from as old as 25–24 ka (for some moraines and outwash in the Sierra Nevada) to as young as 17–15 ka (for some terminal moraines in the Rocky Mountains), but a clear central tendency exists with a mean of ∼ 19.5 ka (Young et al., 2011; Laabs et al., 2020; Palacios et al., 2020). Relatively younger ages (HS-1) across the mountains located at higher latitude were interpreted as a sign of glacial post-LGM culmination in response to the increased delivery of westerly derived moisture which reached the northern continental interior of the western US after the large ice sheets started to retreat (Licciardi et al., 2001, 2004; Thackray, 2008). For instance, younger exposure ages of the last glacial maxima in the western Uinta Mountains, compared with mountain ranges farther east and north, reflected the influence of pluvial Lake Bonneville after the recession of the Laurentide ice sheet to the north (Laabs et al., 2009).
Medium-scale inter-range asynchrony (several thousand years) was observed in the Yellowstone Plateau. Terminal moraines dated to ∼ 17 ka are common in valleys along the northeastern mountains (e.g., Eightmile, Chico, Pine Creek, South Fork Deep Creek, Cascade Canyon, and Gallatin) of the Greater Yellowstone Plateau. Glaciers in the Teton Range (southwestern part of the plateau) have terminal moraines with an age of ∼ 15 ka. Local LGM maxima dated to ∼ 19.8–18.2 ka in the western part of the plateau (Beartooth Uplift). Licciardi and Pierce (2018) suggested that shifting orographic precipitation patterns due to the formation of an ice dome and change in the ice flow direction caused asynchrony in the Greater Yellowstone region.
Very few glacial chronologies, if any at all, record intra-range asynchrony during the most recent glacial termination. Age dating results from some relatively well-studied mountain ranges (the Wasatch, Uinta, and Bighorn mountain ranges in North America) present intra-range asynchrony in glacial maxima with respect to their various aspects (Laabs et al., 2020). Some of them had LGM ages ranging from hundreds to thousands of years from valley to valley. In the Wasatch Range, terminal moraines dated to ∼ 21.9 ka (Laabs and Munroe, 2016), ∼ 20.8, and 17.3 ka (Laabs et al., 2011) in three western valleys; 19.6 ka in the southwestern valley; and 17.6 and 17.3 ka in the southeastern valleys (Quirk et al., 2020). Similarly, a last glacial terminal moraine age difference of ∼ 1 kyr was observed between the north-facing and south-facing slopes in the Eastern Pyrenees (Delmas et al., 2011, 2008). Even glaciers with the same slope orientation contain some chronology difference. The LGM moraine chronology from the three valleys on the eastern side of the central Sawatch Range varies from 22.3 to 19.9 ka (Young et al., 2011).
Nevertheless, we suggest that some internal and external analytical uncertainties associated with the sampling approach, measurements, and/or statistical approach can cause the low magnitude of small intra-range or massif asynchrony. Some studies have attributed intra-range asynchrony in terminal moraine ages to contrasting valley glacier response times related to topography, ice dynamics, and/or differences in glacier shape and hypsometry (Young et al., 2011; Licciardi and Pierce, 2018). As mentioned above, large- and medium-scale asynchrony in the mountain glaciers across the North Atlantic region is mostly explained by the precipitation distribution due to the relative location of the moisture source area and atmospheric circulation contributed by topography. However, further research is needed to fully understand the intra-range or intra-massif scale of asynchrony during the last glacial period.
5.2 Inter-range asynchrony in the ice expansion of the last glacial cycle across Western Mongolia
Some 10Be exposure ages of the glacial erratic from the mountain ranges near Ikh Bogd show significant glacial advances between the LGM and the Holocene (Fig. 9). The largest ice extent was dated as ∼ 22.0 ka on the western flank of the Sutai (Batbaatar et al., 2018). On the other hand, the farthest ice expansion corresponds to MIS 3 in the Khangai mountain range (Rother et al., 2014; Smith et al., 2016; Pötsch, 2017; Batbaatar et al., 2018). In the Gichgeniyn Nuruu mountain range, Holocene (8–7 ka) glaciers advanced with a similar magnitude to their local LGM position. Generally, two main glacial stages, the LGM and post-LGM (∼ 17–16 ka), were observed within MIS 2 in Mongolia (Rother et al., 2014; Batbaatar and Gillespie, 2016; Smith et al., 2016; Pötsch, 2017; Batbaatar et al., 2018).
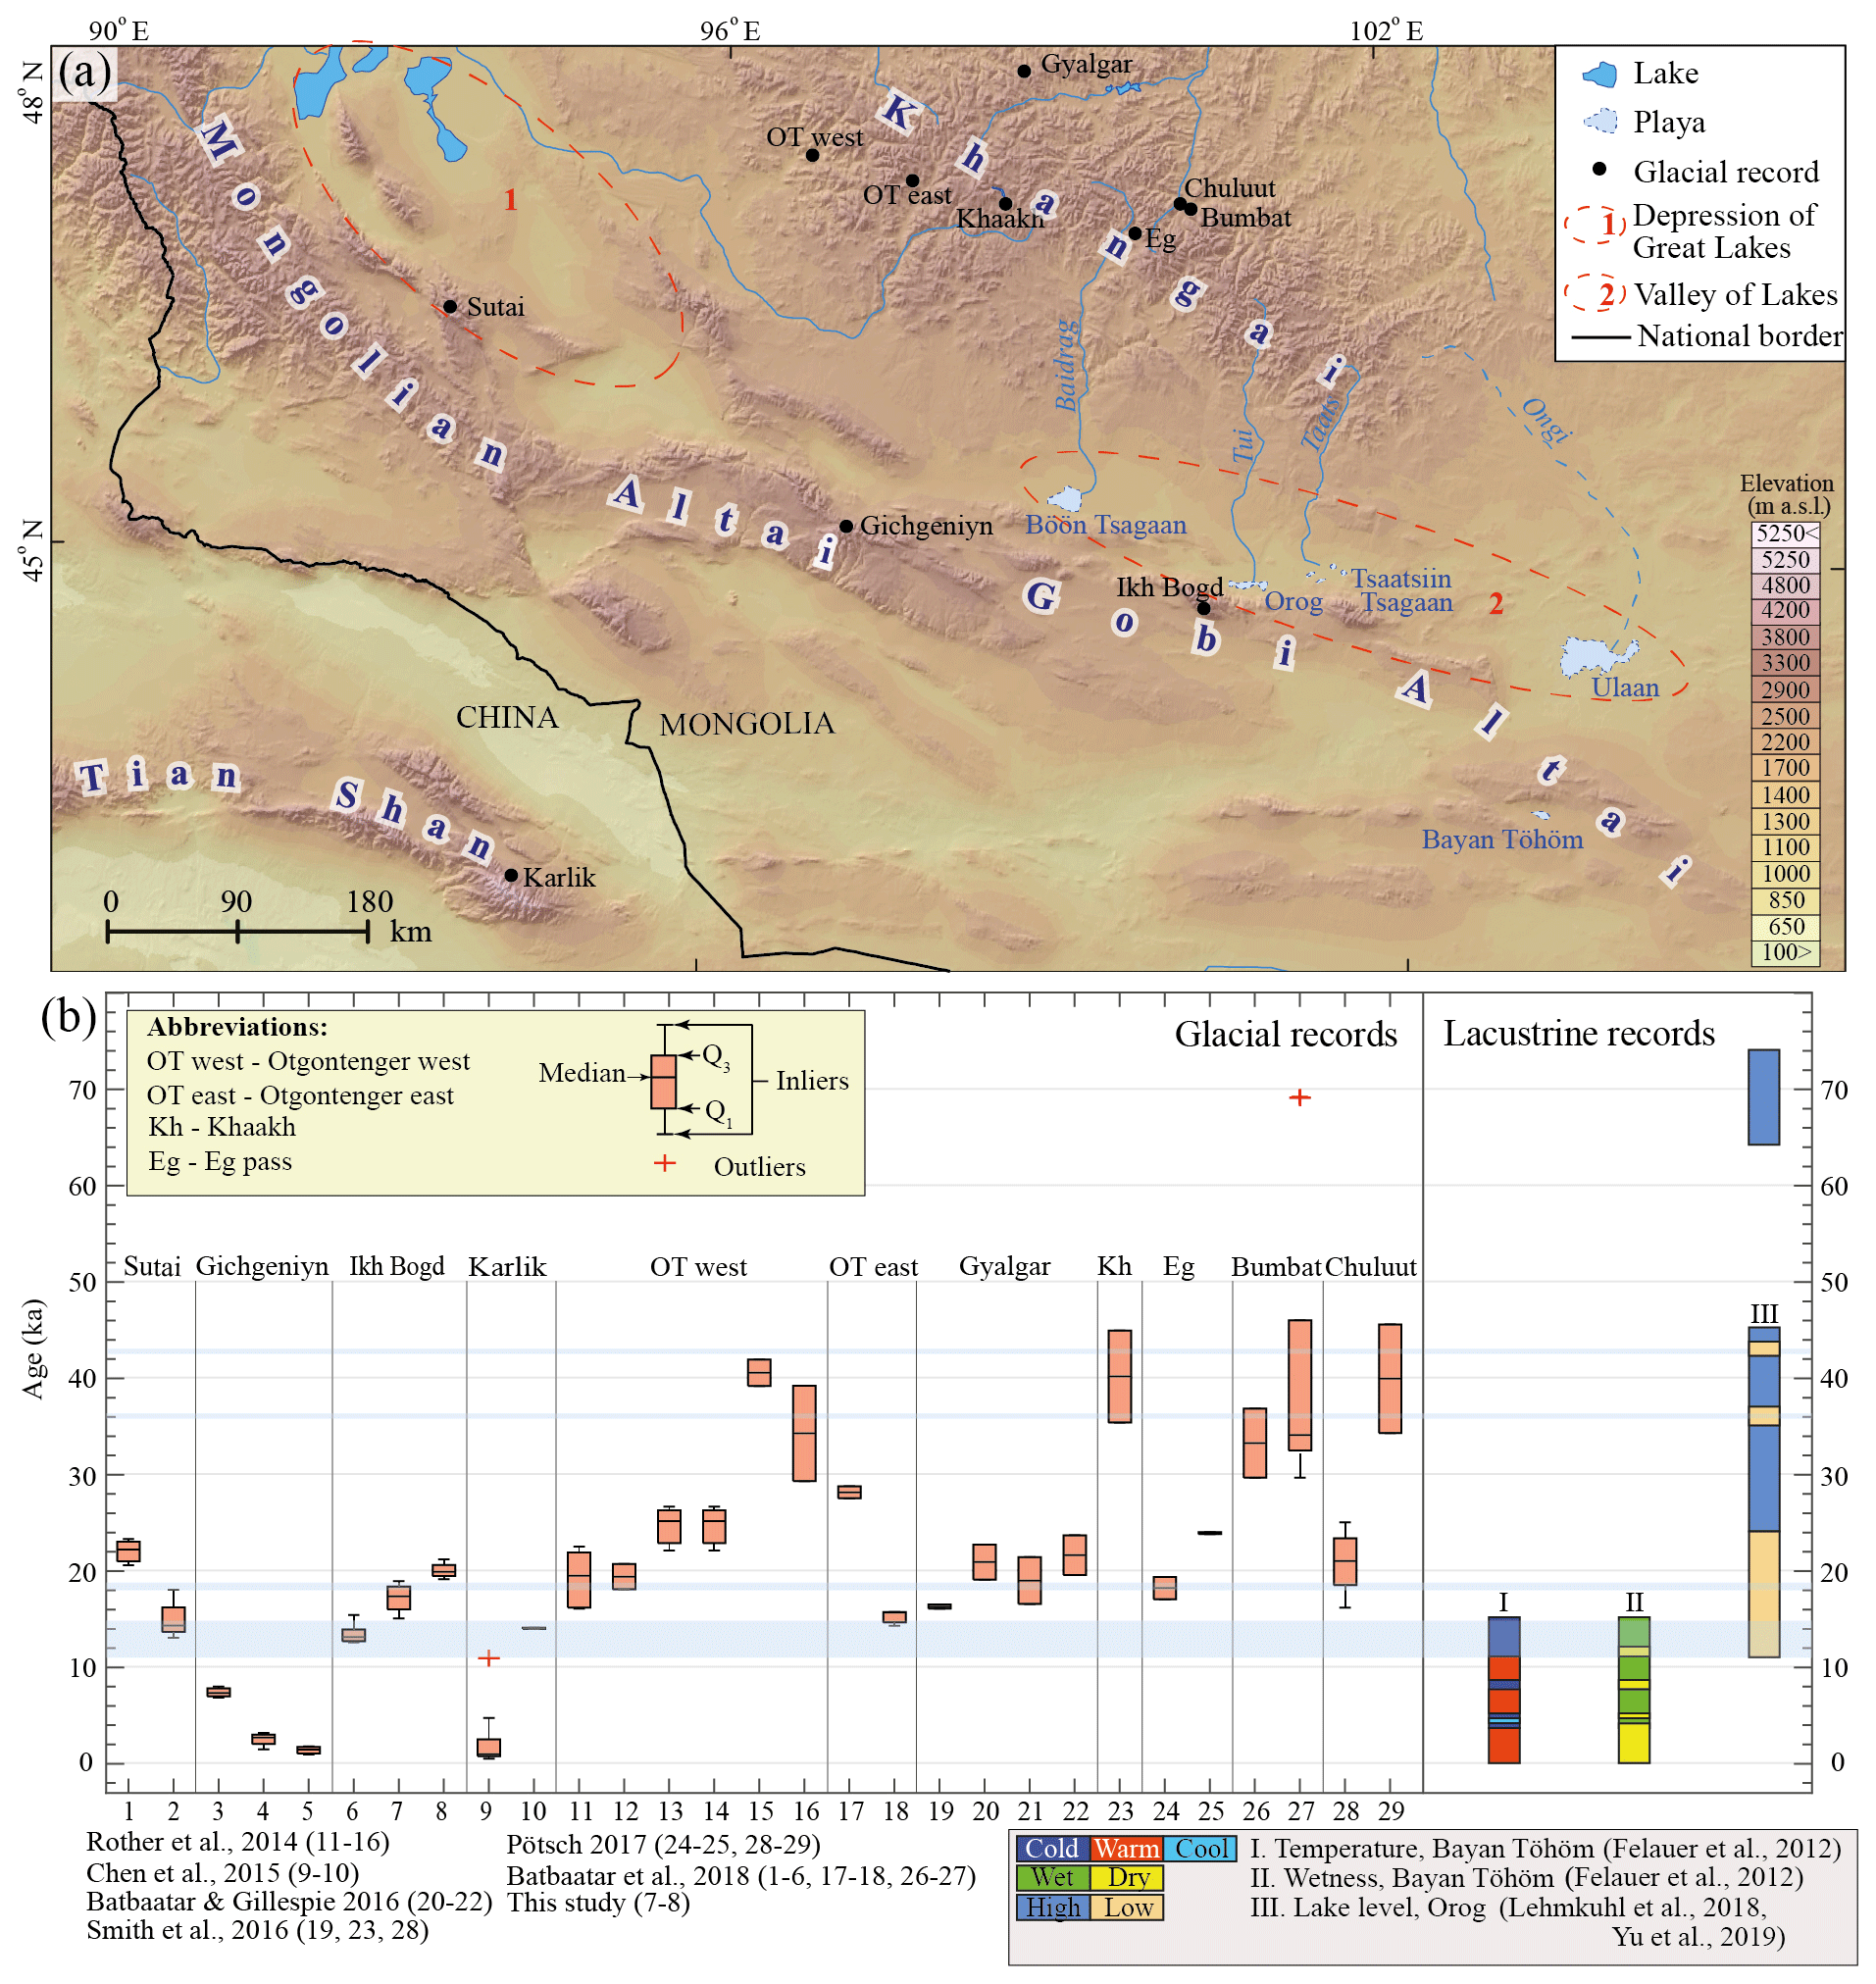
Figure 9Temporal and spatial distributions of glacial and paleo-lacustrine records in the neighboring regions of Ikh Bogd Massif. Panel (a) presents the locations of the 10Be age dating sites for paleoglaciers and paleo-lacustrine proxies. Panel (b) provides the age dating results from glaciers and lacustrine proxies. Glacial records on the left are the 10Be exposure age dating results representing 29 individual moraine groups. Exposure ages were recalculated with CRONUS-Earth version 3 using the LSDn scaling factor (Lifton et al., 2014). Only effective ages were plotted after outlier rejection using the Chauvenet criterion, the Peirce criterion, and the normalized deviation method. On each box, a central mark indicates the median, and the bottom and top edges of the box indicate the 25th (Q1) and 75th (Q3) percentiles, respectively. The whiskers extend only to the data points considered inliers, and additional outliers were detected from the effective ages and plotted individually using the “+” marker symbol. The shaded light blue sections on the age interval present the major harsh periods (playa phase of Orog; Yu et al., 2019). Lacustrine records on the right present (I) temperature and (II) wetness data in Lake Bayan Töhöm as well as (III) the lake level record of Orog Lake.
Previous studies using granulometric, palynological, ostracod, and geochemical proxies from the Gobi Lakes Valley reveal the occurrence of cold and dry climates during the local LGM (19–18 ka) and Younger Dryas (Fig. 9; Felauer et al., 2012; Lee et al., 2013; Yu et al., 2017; Lehmkuhl et al., 2018; Yu et al., 2019; Mischke et al., 2020). These results are consistent with our exposure ages from the two valleys. The warming trend was also present in the Gobi Lakes Valley, where lakes were once desiccated during the local LGM and experienced a water level increase after the local LGM (e.g., Yu et al., 2017; Mischke et al., 2020).
5.3 Aspect effect on the asynchronous glacial dynamic in Ikh Bogd
Our age dating result reveals that abrupt deglaciation has occurred since ∼ 20 ka in the Ikh Artsan Glacier. Exposure ages from the MJl moraine (17 ka) should represent one of the following: glacier culmination, survival, or temporary glacial stagnation of the LGM glacier or glacier readvance (Fig. 10). In either case, the culmination of the Jargalant Glacier near 17 ka implies a major difference in glacier mass balance between south- and north-facing glaciers. Changes in glacier mass balance in a small massif or mountain (intra-range) could show large spatial variation due to local topography-induced factors, such as (i) snow avalanching, (ii) preferential deposition of wind-drifted snow (Florentine et al., 2020), (iii) solar radiation, and (iv) temperature. These factors affect the glacier mass balance as follows:
- i.
Periodically occurring snow avalanches support glacial accumulation. Most avalanches have steep slopes between 25 and 50∘ to slide down (Luckman, 1977). The Ikh Artsan and Jargalant valleys are connected to the flat summit plateau and are less steep than the threshold slope of 25∘. The average slope was measured as 23∘ for Jargalant and 18.2∘ for Ikh Artsan. Very wet snow lubricated with water can cause an avalanche on a slope of only 10–25∘ (Luckman, 1977). However, this is not significantly relevant to our study area, as Ikh Bogd and its neighboring area experienced very cold and conditions during MIS 2 (e.g., Yu et al., 2019).
- ii.
Wind-drifted snow accumulation occurs either with or without snowfall. Wind removes the snow from the windward slope and redistributes it onto the leeward slope. However, the prevailing wind direction in the study area is northwest to southeast, which is almost perpendicular to the orientations of the two valleys. We assume that the wind direction during MIS 2 was similar to the present and that the region experienced strong winds. Therefore, wind-drifted snow may not significantly affect glacier accumulation. For that reason, we used the same precipitation value in both valleys.
- iii.
North-facing slopes in the Northern Hemisphere receive less solar radiation because of the aspect effect. Ikh Bogd experiences a midlatitude high-sunlight climate; furthermore, it has steeper relief which can enhance the aspect effect. (Evans and Cox, 2005). Topographic shading can also influence glacier response and mass balance in mountainous areas (Olson and Rupper, 2019). As expected, our modeling results demonstrate that the north-facing slope receives less summer insolation than the south-facing slope, resulting in reduced glacial melt (5 %–10 %) under the same temperature conditions.
- iv.
The vegetation, discontinuous permafrost, and modern and paleoglacier distribution and their magnitude in semiarid midlatitude regions are affected by contrasting temperatures and soil moisture on sunny and shady slopes (Evans, 2006; Barr and Spagnolo, 2015; Klinge et al., 2021). As a result of topographically induced differences in the solar radiation and evapotranspiration, forests (consisting of Siberian larch) and discontinuous permafrost are limited to north-facing slopes, whereas mountain steppe covers south-facing slopes in the Mongolian forest steppe zone (Fig. 8b, c; Klinge et al., 2021). Klinge et al. (2021) determined that the annual incoming solar radiation, permafrost table depth, and soil moisture (topographic wetness index) are significantly correlated. Aspect-driven solar radiation and temperature contrast also cause more glacier, lower (altitude) glacier, and larger glacier on the poleward slope (e.g., Evans, 2006; Barr and Spagnolo, 2015). For instance, Sutai Mountain (closest modern glacier to Ikh Bogd) has large, well-developed valley glaciers that flow northward into low altitude regions from the ice dome. Still, the glaciers on the south-facing slope terminate near the summit margin without developing into valley glaciers (Fig. 8c). According to these facts, a small temperature difference is likely to be real and needs to be considered. Our temperature-index melt model revealed that applying lower temperature to the north-facing glacier than to the south-facing glacier results in a large melt difference between the two valleys
Among the four topography aspect-induced factors, two are applicable to our study area; incoming solar radiation and the temperature difference between north- and south-facing slopes. Our temperature-index melt model suggests that an aspect-driven insolation change affects the amount of melt, although by a very small amount. This small reduction in the melt due to the shading effect could not cause a significant difference in glacial mass balance nor long-term glacier stagnation or advance. Under the same temperature and different insolation, glaciers on the north- and south-facing slopes across small regions behave almost synchronously. Both Ikh Artsan and Jargalant glaciers culminated near 20.2 ka and abruptly retreated to the cirque headwall. Moreover, their changes in glacial dynamic were almost the same (see Supplement file 2). However, no glacier stagnation was observed in the Jargalant Valley around 17 ka (i.e., this result does not match our exposure age dating). We sampled from the most distal moraine possible in Jargalant Valley in order to avoid sampling from reworked boulders on the steep slope. Likewise, we could not find any other evidence that the Jargalant Glacier reached the trunk valley of the Bituut River. If we consider that both glaciers moved synchronously, the most distal moraine must be located further down-valley of the ∼ 17 ka culmination. In this case, the geological evidence (terminal moraine) near 20 ka must have been degraded by the Bituut mainstream or/and reworked with the mass movement.
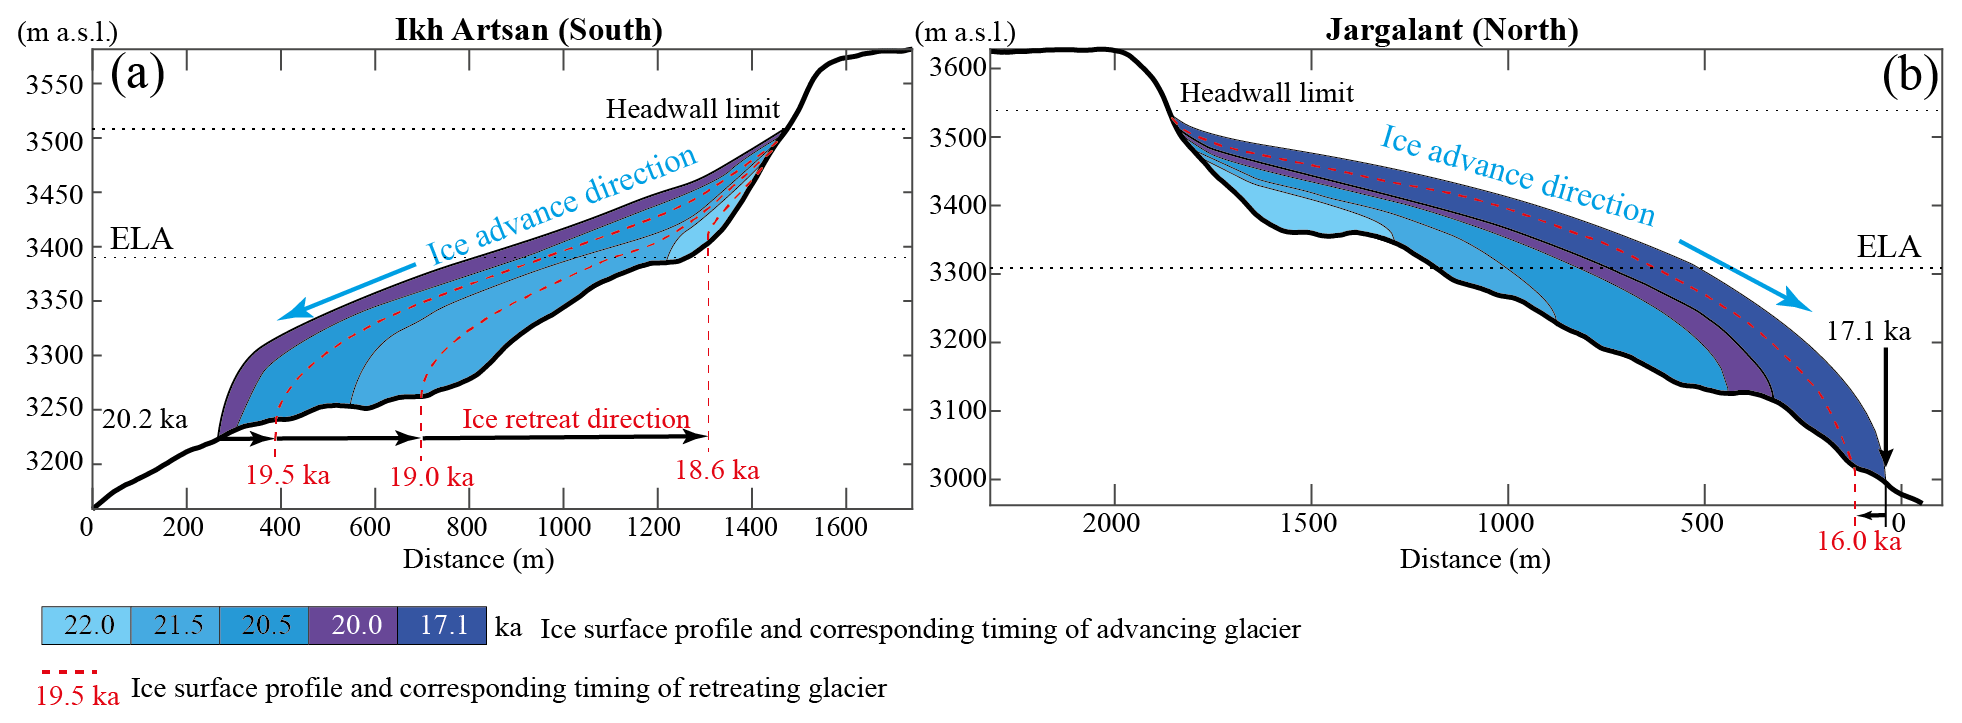
Figure 10Asynchronous advance and retreat pattern of the Ikh Bogd paleoglacier during 22–16 ka. Panel (a) shows that the paleoglacier in Ikh Artsan Valley advanced between 22.0 and 20.2 ka and retreated from 20.2 to 18.6 ka. Panel (b) shows that the paleoglacier in Jargalant Valley mostly expanded down-valley between 22.0 and 17.1 ka. A small retreat is observed during 17.1–16.0 ka. The present-day summer temperature in the north-facing valley was considered to be 0.5 ∘C lower than in the south-facing valley. The present-day temperature is calibrated to North Greenland Ice Core Project (NGRIP) paleotemperature data (Buizert et al., 2018) using an LGM summer temperature anomaly of −5.5 ∘C. Headwall altitudes of the LGM paleoglaciers were used to mark the maximum thickness of the glacier.
When we set the site temperature of Jargalant slightly colder (−0.1 to −1 ∘C) than that of Ikh Artsan, glaciers start to behave differently, i.e., they asynchronously retreat from their distal location. When we apply a 0.5 ∘C colder temperature to Jargalant than to Ikh Artsan, 2D ice surface modeling results are consistent with age dating results. The Ikh Artsan Glacier abruptly retreated from its maximum extent near 20.2 ka (age dating result was 20.1 ka). In contrast, the Jargalant Glacier advanced almost continuously until 17.8 ka and then began to retreat from its maximum extent by 17.1 ka (age dating result was 17.2 ka) with a brief stagnation around its maximum extent. This result suggests that the exposure age of ∼ 17 ka corresponds to the most extensive glaciation in Jargalant Valley. We also assume that the exposure age (17.2 ± 1.5 ka) of the distal moraine (MJ1) is the age of the maximum extent for the Jargalant Valley (Fig. 6b, c), as this moraine was not like the small ridge left as a glacier stagnates during its retreat. The MJ1 moraine was larger than the other moraine sequences and, thus, large enough to mark the maximum advance of the glacier.
Based on the age dating and 2D ice surface modeling, we propose that the glaciers on the north- and south-facing slopes of Ikh Bogd may have behaved asynchronously. Glacier volume and area changes are likely to be sensitive to temperature changes in semiarid and arid regions, such as Ikh Bogd. The glaciers of Ikh Artsan and Jargalant behaved asynchronously due to aspect-induced temperature differences, rather than differences in solar insolation.
5.4 Morphostratigraphic mismatch in exposure age dating from erratic boulders in the Jargalant Valley
5.4.1 Inheritance from the summit plateau
The massif has a steep slope; in particular, the slope reaches 32–70∘ along cirque walls and incised valleys. Colluvial materials covering hillslopes and long boulder corridors were mainly the result of the active mass-wasting process. Particularly, rockfall deposits forming a scree and talus apron must be the product of steep slope failure of the summit plateau (Fig. 11). We expected that inner moraine crests would present Holocene or HS-1 exposure in light of morphostratigraphy. The MJ2, MJ3, and MJ4 moraine crests have exposure ages ranging from 636.2 to 35.9 ka (Table 4, Fig. 6). According to moraine stratigraphy, exposure ages of inner moraines cannot be older than the age of the distal moraine. The apparent ages show antiquity and scatter in their distribution, which cannot be a single geologic event; associating the mean age with the specific timing of glacial termination is not appropriate (Heyman et al., 2011b). It is more likely that the exposure ages from the MJ2, MJ3, and MJ4 moraines were due to the inherited 10Be concentration produced during prior exposure in the boulders recycled from the cirque wall or paleo summit plateau by rockfall or toppling during glaciation and/or a paraglacial period. During termination of the farthest moraine, the glacier was long enough to pluck the fresh rocks out along its bed. Moreover, thick glacier would not allow inherited rockfall onto the glacier ice (Fig. 12d). After glacier retreat to the cirque, glacier thinning allowed rockfalls with inheritance to the ice surface. An increase in inherited boulders would be contributed by enhanced rock-slope failure (debuttressing) right after rapid deglaciation (Cossart et al., 2008; Ballantyne and Stone, 2012; Hashemi et al., 2022) and ice segregation along the bergschrund. Boulders with inheritance were transported to the glacier toe as supraglacial debris. Plucking out by the shortened glacier was not sufficient to supply fresh rocks relative to the rock supply with summit plateau inheritance (Fig. 12e).
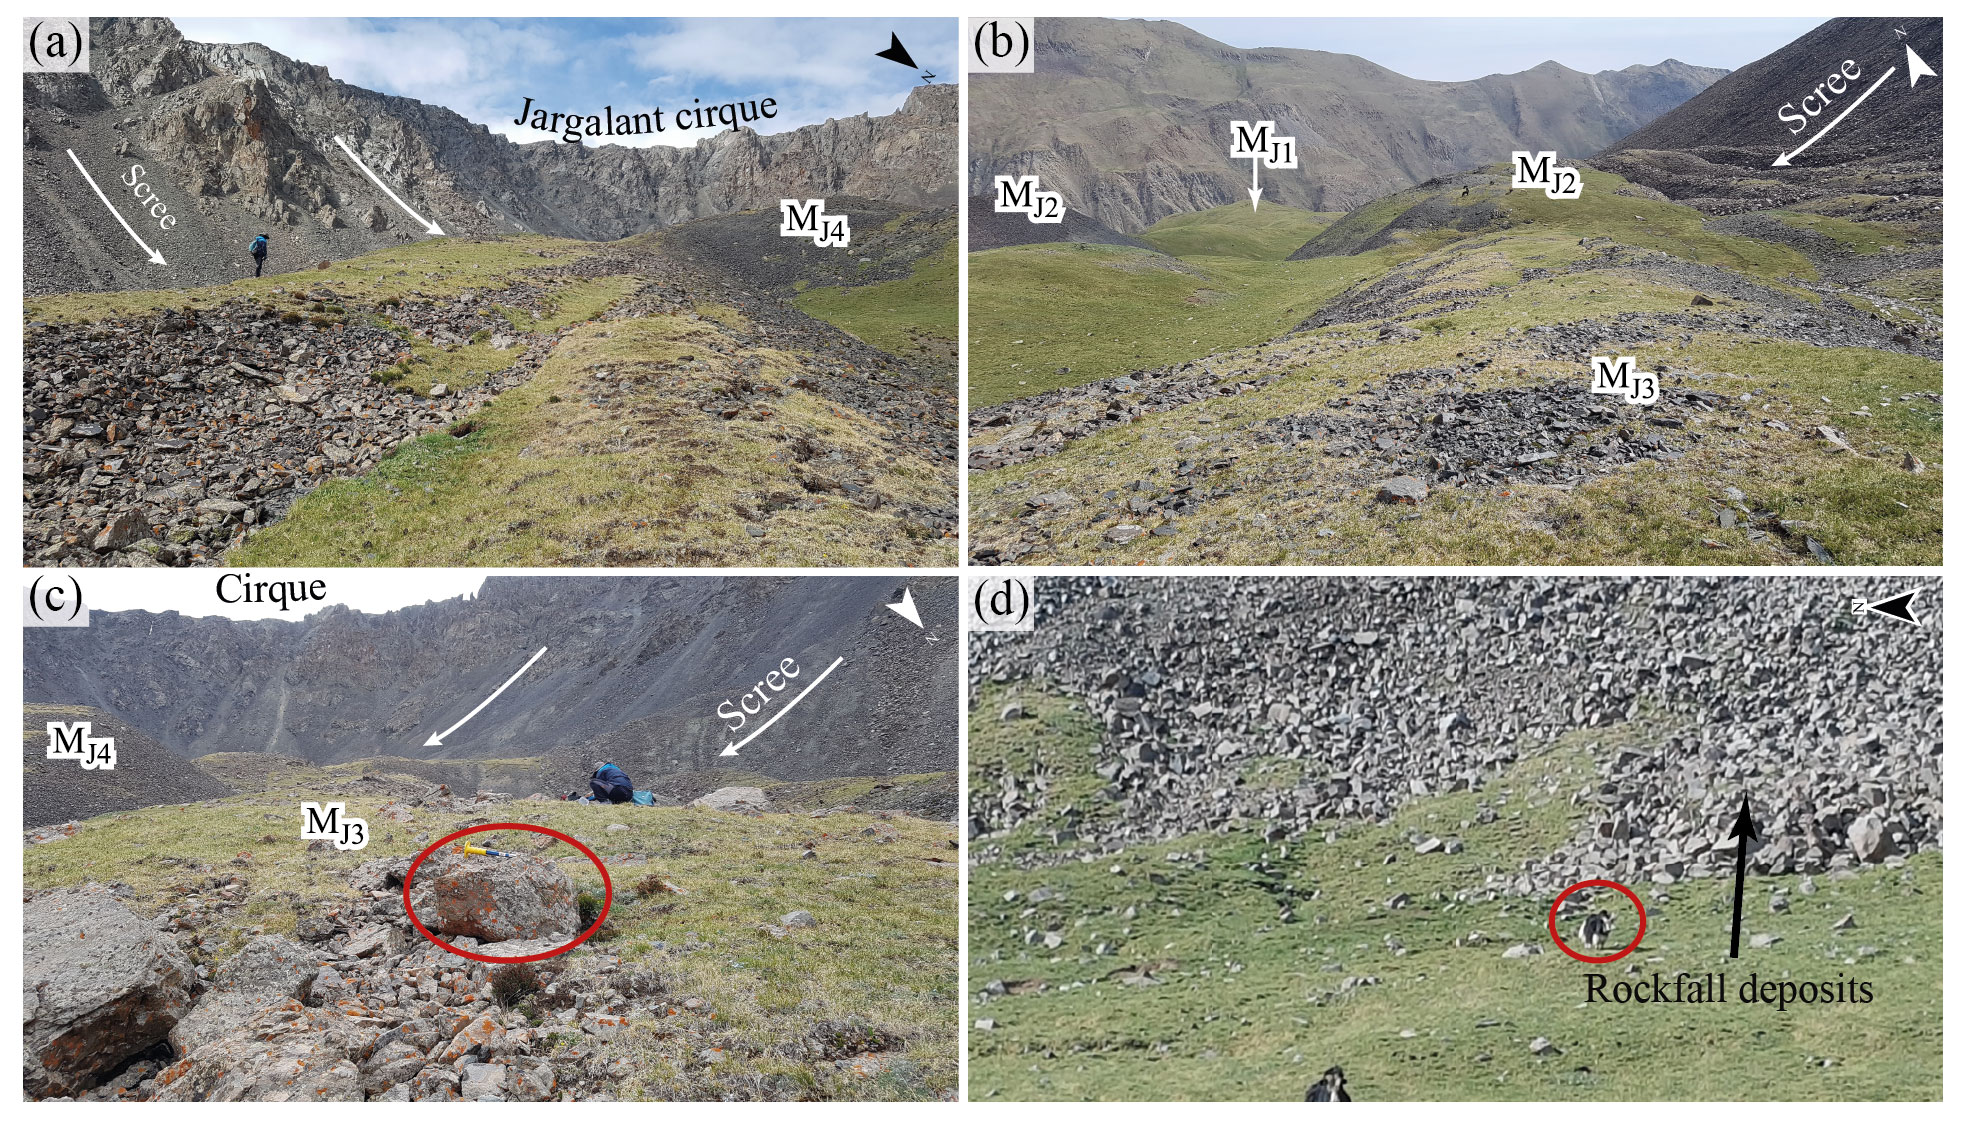
Figure 11Rockfall deposits in Jargalant Valley. The scree or talus cone was on the cirque wall. The MJ4, MJ3, and MJ2 moraines formed within a Jargalant cirque, and outer edges of moraine ridges near the cirque wall were consequently covered with talus deposit. Panel (a) shows rockfall deposit on the southeastern cirque wall, near the MJ4 moraine. Panel (b) presents a scree covering on the MJ2 moraine that is dissected by an intermittent stream. Panel (c) outlines the sampling site of the MJ3 moraine and scree on the southern and southwestern wall of the cirque, near the MJ4 and MJ3 moraines. JAM010 was taken from the circled boulder. The chisel on the boulder is for scale. Panel (d) presents a rockfall deposit on the eastern slope of the cirque. The yak (circled) is for scale.
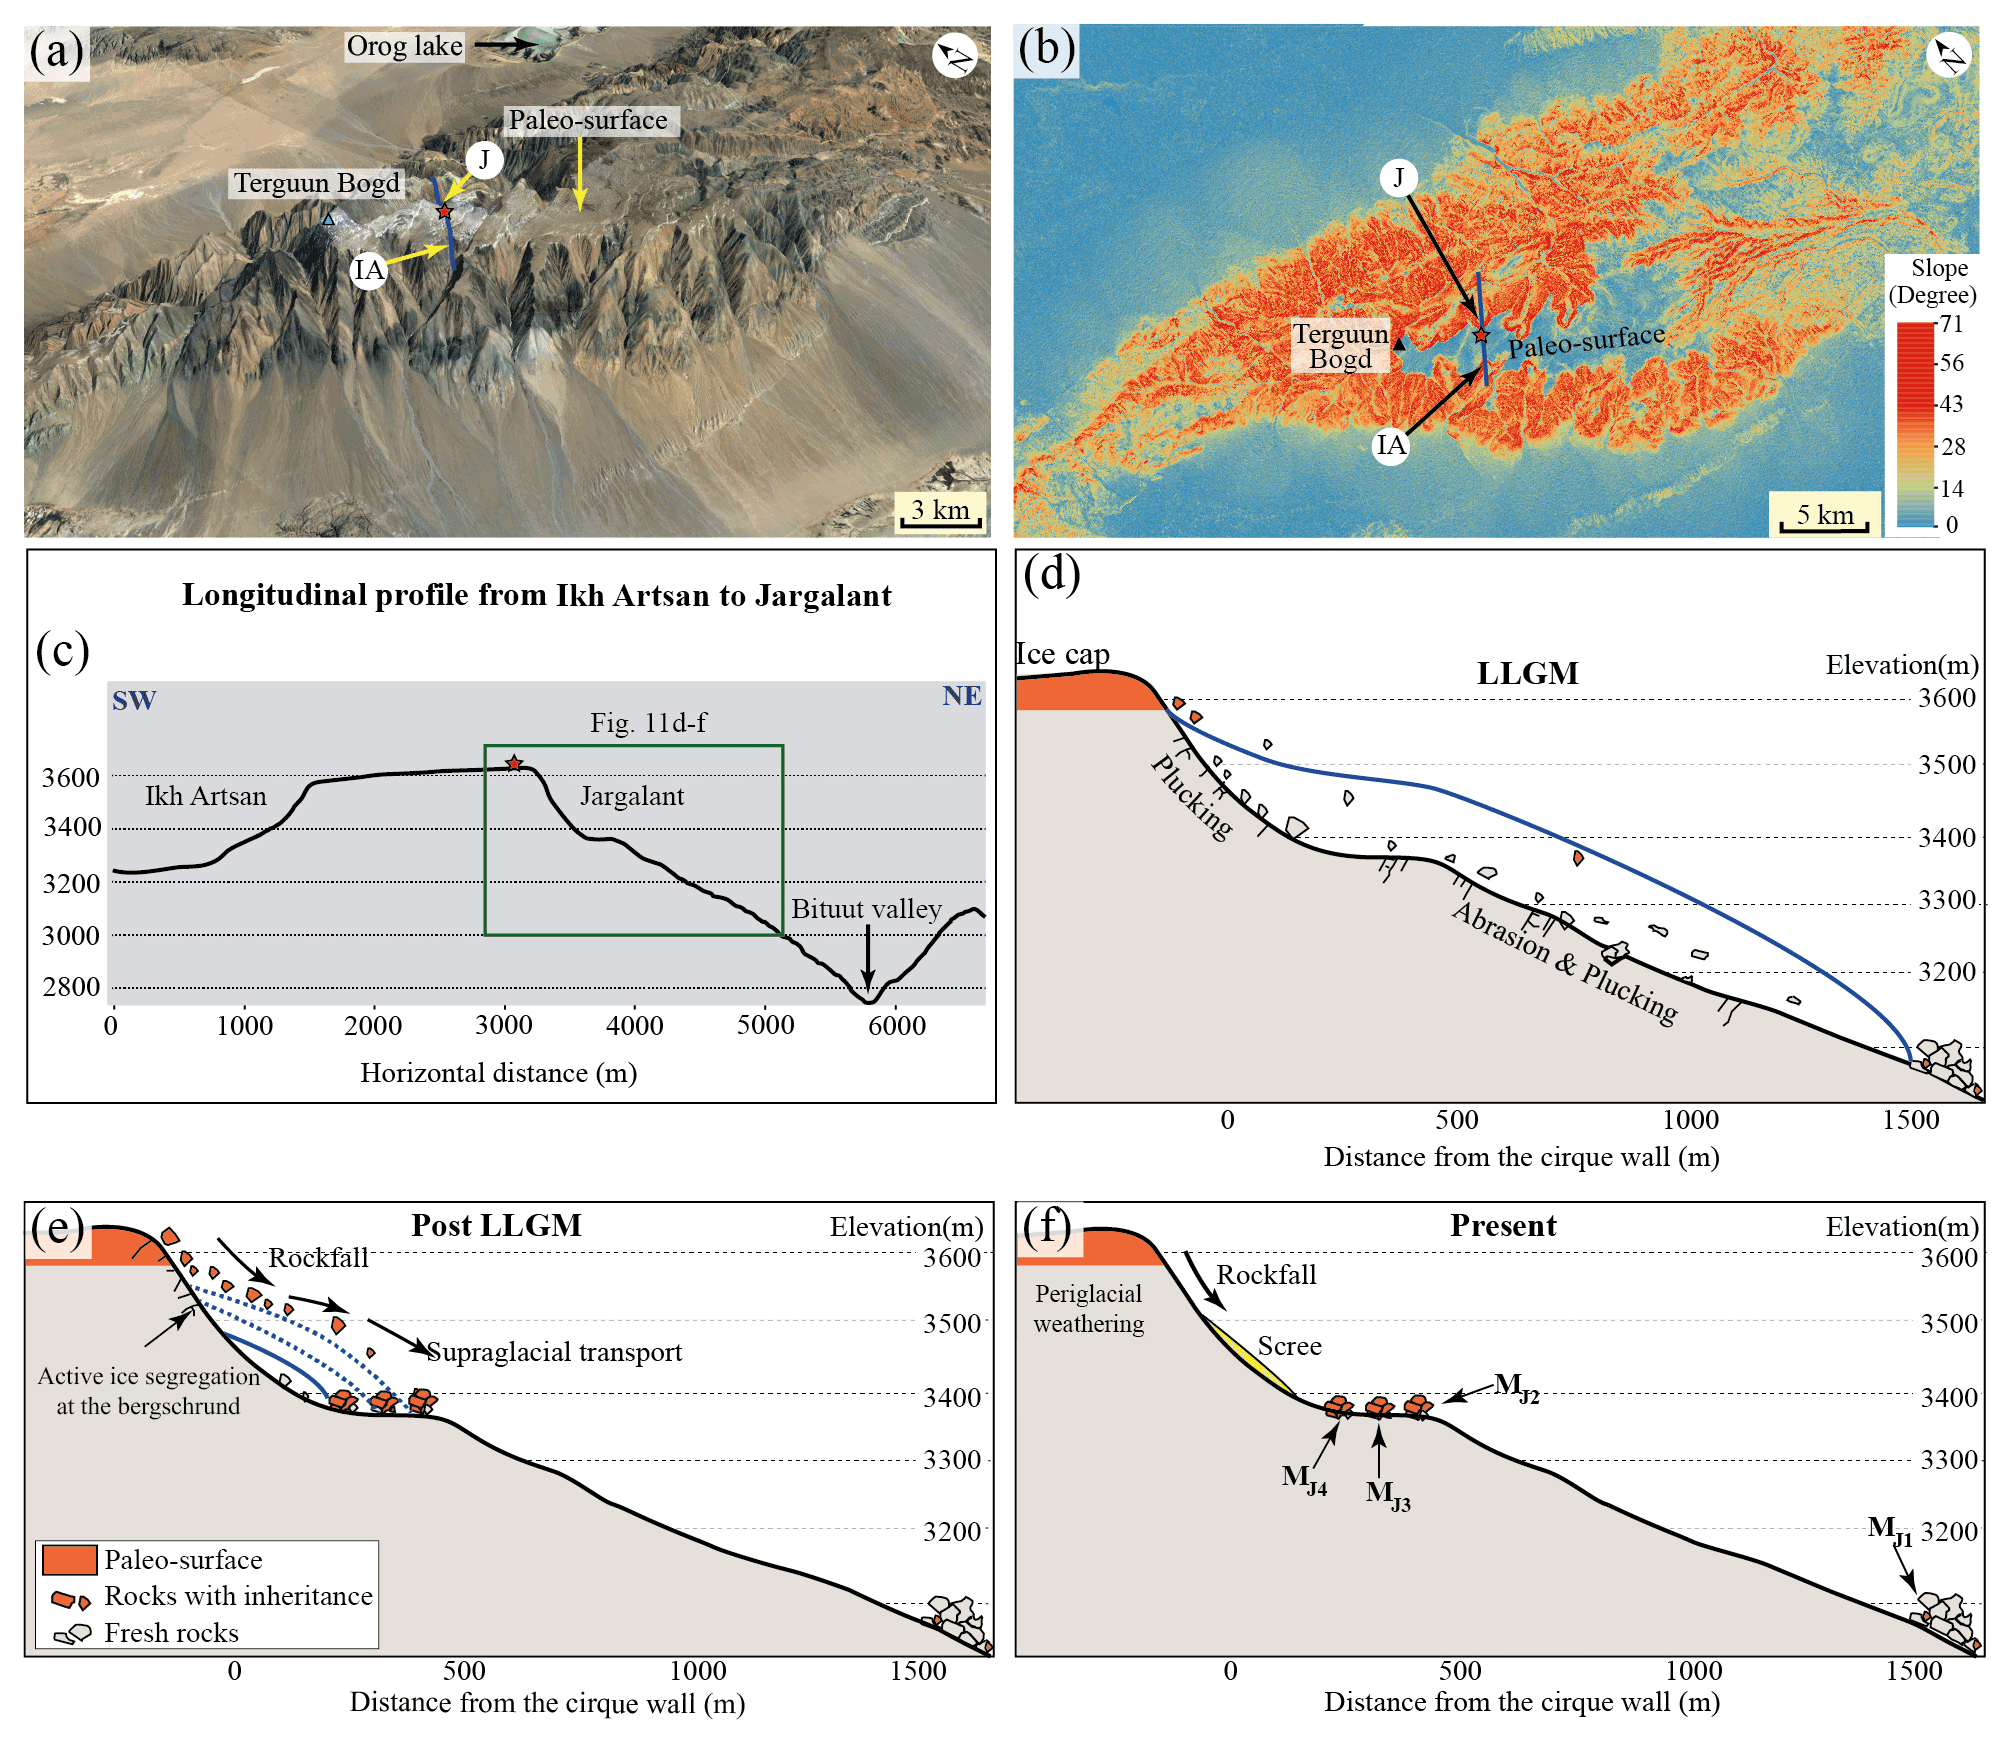
Figure 12Inheritance from the uplifted paleo-surface of Ikh Bogd Massif. Panel (a) provides a 3D view of the paleo-planation surface (© Google Earth, 2022). Panel (b) presents a slope map of Ikh Bogd, the location of the Ikh Artsan (IA) and Jargalant (J) valleys. The green triangle represents the highest peak of the massif, Terguun Bogd. The exposure age and erosion rate (Table 2) were calculated using the highest concentration of the boulder from MJ4 to MJ2 (Fig. 11a) for the point location marked using the red star (3625 m; see Fig. 11b). Panel (c) is a longitudinal profile along a dark blue line (see Fig. 11b) connecting the Ikh Artsan and Jargalant valleys from southwest to northeast. Panel (d) shows the LLGM (local LGM ∼ 17 ka) glacial extent. Plucking of fresh rocks was intensive due to the glacial length and thickness. Panel (e) presets an enhanced supply of highly inherited rocks into the MJ4, MJ3, and MJ2 moraine series which are formed by successive glacial advances and/or stagnation. Due to a shortage of glacier length, a low number of fresh rocks are plucked out. A thinned glacier allows for intensive ice segregation along the bergschrund and more inherited rockfalls onto the ice surface. Hence, the boulder supply with paleo-surface inheritance would increase. Panel (f) is a present-day rockfall deposit without supraglacial transport.
5.4.2 Cenozoic evolution of the low-lying, high-elevation summit plateau
The flat summit plateau of the Ikh Bogd Massif is considered an uplifted paleo-peneplanation surface. The basement structure of Ikh Bogd was formed by the collision of the amalgamated terranes, oriented in a west-northwest–east-southeast to east-northeast–west-southwest direction, throughout the Precambrian and Paleozoic (Şengör et al., 1993). 40Ar 39Ar ages from extrusive volcanic features on the Ikh Bogd summit and apatite fission-track data show two significant uplifts that occurred in the Gobi Altai mountain range and Ikh Bogd history (Jolivet et al., 2007; Vassallo et al., 2007). During the first uplift, related to the Early to Middle Jurassic, the region experienced crustal shortening events greater than 2 km. The Gobi Altai has been observed elsewhere in central Asia through this event, possibly due to a collision between Mongol-Okhotsk and Siberia or the Lhasa and Qiangtang block to the far south in Tibet (Traynor and Sladen, 1995; Dewey et al., 1988; Cunningham, 2010). The present erosional surface of the summit plateau formed just after this Jurassic exhumation and was preserved under a negligible erosion rate. Preservation of this flat summit plateau and its fission-track age indicate that quiescence without significant vertical crustal motions continued until the last uplift began (Jolivet et al., 2007; Vassallo et al., 2007; Cunningham, 2010).
The Gobi Altai mountain range is one of the northernmost far-field regions affected by the Cenozoic tectonic collision of India into Asia, which initiated the late-Cenozoic reactivation and present-day stress regime (Cunningham et al., 1996; Vassallo et al., 2007). According to the apatite fission-track data of Vassallo et al. (2007), the onset of the last and ongoing uplift corresponds to the late Cenozoic (5 ± 3 Ma). This tectonic reactivation is responsible for creating the high topography (∼ 4000 m a.s.l.) seen today, in the response to which faster exhumation is initiated as well (Vassallo et al., 2007).
The paleo-erosion surfaces at high altitudes experienced rapid uplift after a long period of quiescence with low erosion. Cosmogenic-nuclide-based denudation rates from global paleo-erosion surfaces in diverse climatic, tectonic, and lithologic environments do not exceed ∼ 20 m Myr−1 (Byun et al., 2015). We obtained the erosion rate for the flat summit plateau using the production rate at the summit plateau and 10Be concentrations of reworked boulders from the MJ4, MJ3, and MJ2 moraines. The calculated bedrock erosion rate for the last ∼ 600 kyr for the summit plateau ranged from 1.23 ± 0.10 mm kyr−1 to 25.8 ± 5.75 m Myr−1. The erosion rate of 25.8 ± 5.75 m Myr−1 was thought to be a maximum value, as erosion probably increases with the increasing elevation of the uplifting massif. This result was harmonious with the long-term (since the last uplift) exhumation rate of 23.6 ± 3 m Myr−1 (Vassallo et al., 2011) and the Holocene erosion rate of 28 m Myr−1 (Jolivet et al., 2007) for the massif. Although the flatness and the lowest erosion rate of 1.23 ± 0.10 mm Myr−1 reveal negligible erosion and notable preservation of the paleo-surface for several hundred thousand years, if this erosion rate reflects an average rate that can be applied to the entire flat surface and has been maintained for the total uplift period of the massif (Vassallo et al., 2007), it would account for only 2–7.6 m of erosion.
Central Asian valley glaciers, including the Ikh Bogd Massif, expanded and shrank, presenting more complex behavior relative to large ice sheets in the Northern Hemisphere. Regional climate and local non-climatic factors have been playing an essential role in this complexity. Our 10Be dating documents that glacier culmination on the southern slope of Ikh Artsan Valley occurred at 20.1 ka (MIA1), generally falling within the gLGM, whereas a large terminal moraine formed around 17.2 ka (MJ1) on the northern slope of the Jargalant Valley.
Asynchrony in glacier expansion has been reported from some areas around the globe, but it has not been clearly studied using a combination of geochronological and numerical modeling approaches. Due to aspect-driven solar insolation change, the paleoglacier in the north-facing Jargalant Valley melted slower (5 %–10 %) than the glacier in Ikh Artsan Valley. However, this amount of melt difference could not produce glacier advance nor stagnation for a long period. Asynchronous glaciation was observed across the study area if the LGM summer temperature in Jargalant Valley was considered to be colder than Ikh Artsan, and the age dating result and the modeling result were consistent when we applied a 0.5 ∘C lower temperature to Jargalant to than to Ikh Artsan. According to the lower-temperature case, Jargalant Glacier retreated from its maximum extent 3000 years later than Ikh Artsan Glacier. In the other words, our modeling reveals that the temperature difference driven by aspect on both slopes significantly affected the glaciers' lifespan compared with the effect of aspect-driven insolation alone.
Glacial retreat began soon after the peak of the local glacial maximum in both valleys, and it left several sequences of inner moraines in their heads (cirques). The inner moraine in the south-facing cirque dated to ∼ 13.5 ka (Batbaatar et al., 2018); however, transported boulders on the north-facing cirque show a significantly old exposure age (636.2–35.9 ka) for inner moraines (MJ2–MJ4). The summit plateau of the Ikh Bogd Massif is one of the oldest known tectonically uplifted surfaces on Earth. It is more likely that extremely old exposure ages are the result of inheritance recycled from rockfalls from the paleo-erosional surface of the summit plateau.
The data that support the findings of this study are available within the article and its Supplement.
The supplement related to this article is available online at: https://doi.org/10.5194/tc-17-2409-2023-supplement.
YBS planned the study and carried out a field investigation with JSO, PK, KS, and CHL. YBS was responsible for funding acquisition. JSO designed the 10Be lab experiments with RHH and BYY. CHL and MKS developed the MATLAB code for the 2D ice surface modeling and performed the simulation. PK and YBS prepared the manuscript with contributions from all co-authors.
The contact author has declared that none of the authors has any competing interests.
Publisher's note: Copernicus Publications remains neutral with regard to jurisdictional claims in published maps and institutional affiliations.
We thank Chinmay Dash for his sincere and productive comments on an earlier version of the paper.
This research was supported by the College of Education, Korea University Grant, in 2023 (grant no. K2314591 to Yeong Bae Seong).
This paper was edited by Arjen Stroeven and reviewed by Jigjidsurengiin Batbaatar and Robin Blomdin.
ALAMGCM: Topographic map of Mongolia, Geodesy and Cartography division of Agency for Land Administration and Management, Geodesy and Cartography of Mongolia, Ulaanbaatar, Mongolia, https://en.gazar.gov.mn/p/p-999-123 (last access: 5 January 2023), 1970.
An, Z., Kukla, G., Porter, S. C., and Xiao, J.: Late Quaternary dust flow on the Chinese loess plateau, Catena, 18, 125–132, https://doi.org/10.1016/0341-8162(91)90012-M, 1991.
Balco, G.: Contributions and unrealized potential contributions of cosmogenic nuclide exposure dating to glacier chronology, 1990–2010, Quaternary Sci. Rev., 30, 3–27, https://doi.org/10.1016/j.quascirev.2010.11.003, 2011.
Balco, G., Stone, J. O., Lifton, N. A., and Dunai, T. J.: A complete and easily accessible means of calculating surface exposure ages or erosion rates from 10Be and 26Al measurements, Quat. Geochronol., 3, 174–195, https://doi.org/10.1016/j.quageo.2007.12.001, 2008.
Ballantyne, C. K. and Stone, J. O.: Timing and periodicity of paraglacial rock-slope failures in the Scottish Highlands, Geomorphology, 186, 150–161, https://doi.org/10.1016/j.geomorph.2012.12.030, 2012.
Barr, I. D. and Lovell, H.: A review of topographic controls on moraine distribution, Geomorphology, 226, 44–64, https://doi.org/10.1016/j.geomorph.2014.07.030, 2014.
Barr, I. D. and Spagnolo, M.: Glacial cirques as palaeoenvironmental indicators: Their potential and limitations, Earth-Sci. Rev., 151, 48–78, https://doi.org/10.1016/j.earscirev.2015.10.004, 2015.
Batbaatar, J.: Quaternary Glaciation in Central Asia, Doctoral dissertation, https://digital.lib.washington.edu/researchworks/handle/1773/42867 (last access: 5 January 2023), 2018.
Batbaatar, J. and Gillespie, A. R.: Outburst floods of the Maly Yenisei. Part II–new age constraints from Darhad basin, Int. Geol. Rev., 58, 1753–1779, https://doi.org/10.1080/00206814.2016.1193452, 2016.
Batbaatar, J., Gillespie, A. R., Fink, D., Matmon, A., and Fujioka, T.: Asynchronous glaciations in arid continental climate, Quaternary Sci. Rev., 182, 1–19, https://doi.org/10.1016/j.quascirev.2017.12.001, 2018.
Bayasgalan, A., Jackson, J., Ritz, J. F., and Carretier, S. J. T.: Field examples of strike-slip fault terminations in Mongolia and their tectonic significance, Tectonics, 18, 394–411, https://doi.org/10.1029/1999TC900007, 1999.
Benn, D. I. and Hulton, N. R.: An ExcelTM spreadsheet program for reconstructing the surface profile of former mountain glaciers and ice caps, Comput. Geosci, 36, 605–610, https://doi.org/10.1016/j.cageo.2009.09.016, 2010.
Benn, D. I. and Lehmkuhl, F.: Mass balance and equilibrium-line altitudes of glaciers in high-mountain environments, Quatern. Int., 65, 15–29, https://doi.org/10.1016/S1040-6182(99)00034-8, 2000.
Berger, A. and Loutre, M.-F.: Insolation values for the climate of the last 10 million years, Quaternary Sci. Rev., 10, 297–317, https://doi.org/10.1016/0277-3791(91)90033-Q, 1991.
Berkey, C. P. and Morris, F. K.: The peneplanes of Mongolia, Am. Mus. Novit., 136, 1–11, 1924.
Blomdin, R., Stroeven, A. P., Harbor, J. M., Lifton, N. A., Heyman, J., Gribenski, N., Petrakov, D. A., Caffee, M. W., Ivanov, M. N., Hättestrand, C., Rogozhina, I., and Usubaliev, R.: Evaluating the timing of former glacier expansions in the Tian Shan: A key step towards robust spatial correlations, Quaternary Sci. Rev., 153, 78–96, https://doi.org/10.1016/j.quascirev.2016.07.029, 2016.
Blomdin, R., Stroeven, A. P., Harbor, J. M., Gribenski, N., Caffee, M. W., Heyman, J., Rogozhina, I., Ivanov, M. N., Petrakov, D. A., and Walther, M.: Timing and dynamics of glaciation in the Ikh Turgen Mountains, Altai region, High Asia, Quat. Geochronol., 47, 54–71, https://doi.org/10.1016/j.quageo.2018.05.008, 2018.
Buizert, C., Keisling, B., Box, J., He, F., Carlson, A., Sinclair, G., and DeConto, R.: Greenland-wide seasonal temperatures during the last deglaciation, Geophys. Res. Lett., 45, 1905–1914, https://doi.org/10.1002/2017GL075601, 2018.
Byun, J., Heimsath, A. M., Seong, Y. B., and Lee, S. Y.: Erosion of a high-altitude, low-relief area on the Korean Peninsula: implications for its development processes and evolution, Earth Surf. Proc. Land., 40, 1730–1745, https://doi.org/10.1002/esp.3749, 2015.
Chai, L. T., Wong, C. J., James, D., Loh, H. Y., Liew, J. J. F., Wong, W. V. C., and Phua, M. H.: Vertical accuracy comparison of multi-source Digital Elevation Model (DEM) with Airborne Light Detection and Ranging (LiDAR), in: IOP Conference Series, Earth. Environ. Sci., 1053, 012025, https://doi.org/10.1088/1755-1315/1053/1/012025, 2022.
Chauvenet, W.: A Manual of spherical and practical astronomy – Vol. 1: Spherical astronomy; Vol. 2: Theory and use of astronomical instruments. Method of least squares, 5th Edn., revised and corrected, Dover Publication, New York, 1960.
Ciner, A., Sarikaya, M. A., and Yildirim, C.: Misleading old age on a young landform? The dilemma of cosmogenic inheritance in surface exposure dating: Moraines vs. rock glaciers, Quat. Geochronol., 42, 76–88, https://doi.org/10.1016/j.quageo.2017.07.003, 2017.
Clark, P. U., Dyke, A. S., Shakun, J. D., Carlson, A. E., Clark, J., Wohlfarth, B., Mitrovica, J. X., Hostetler, S. W., and McCabe, A. M.: The last glacial maximum, Science, 325, 710–714, https://doi.org/10.1126/science.1172873, 2009.
Cossart, E., Braucher, R., Fort, M., Bourlès, D., and Carcaillet, J.: Slope instability in relation to glacial debuttressing in alpine areas (Upper Durance catchment, southeastern France): evidence from field data and 10Be cosmic ray exposure ages, Geomorphology, 95, 3–26, https://doi.org/10.1016/j.geomorph.2006.12.022, 2008.
Cunningham, D.: Tectonic setting and structural evolution of the Late Cenozoic Gobi-Altai orogen, J. Geol. Soc. Lond., 338, 361–387, https://doi.org/10.1144/SP338.17, 2010.
Cunningham, W. D., Windley, B. F., Dorjnamjaa, D., Badamgarov, J., and Saandar, M.: Late Cenozoic transpression in southwestern Mongolia and the Gobi-Altai-Tien Shan connection, Earth Planet. Sc. Lett., 140, 67–81, https://doi.org/10.1016/0012-821X(96)00048-9, 1996.
Dahl, S. O., Bakke, J., Lie, Ø., and Nesje, A.: Reconstruction of former glacier equilibrium-line altitudes based on proglacial sites: an evaluation of approaches and selection of sites, Quaternary Sci. Rev., 22, 275–287, https://doi.org/10.1016/S0277-3791(02)00135-X, 2003.
Delmas, M., Gunnell, Y., Braucher, R., Calvet, M., and Bourlès, D.: Exposure age chronology of the last glaciation in the eastern Pyrenees, Quaternary Res., 69, 231–241, https://doi.org/10.1016/j.yqres.2007.11.004, 2008.
Delmas, M., Calvet, M., Gunnell, Y., Braucher, R., and Bourlès, D.: Palaeogeography and 10Be exposure-age chronology of Middle and Late Pleistocene glacier systems in the northern Pyrenees: implications for reconstructing regional palaeoclimates, Palaeogeogr. Palaeocl., 305, 109–122, https://doi.org/10.1016/j.palaeo.2011.02.025, 2011.
Devyatkin, E.: Structures and formational complexes of the Cenozoic activated stage, Tectonics of the Mongolian People's Republic, Nauka, 41, 182–195, 1974.
Dewey, J. F., Shackleton, R. M., Chengfa, C., and Yiyin, S.: The tectonic evolution of the Tibetan Plateau, Philos. T. Roy. Soc. A, 327, 379–413, https://doi.org/10.1098/rsta.1988.0135, 1988.
EIC: Geologic map of Mongolia 1:1000000, Environment Information Center of National Agency for Meteorology, Hydrology and Environmental Monitoring, Ulaanbaatar, Mongolia, 1981.
Evans, I. S.: Local aspect asymmetry of mountain glaciation: a global survey of consistency of favoured directions for glacier numbers and altitudes, Geomorphology, 73, 166–184, https://doi.org/10.1016/j.geomorph.2005.07.009, 2006.
Evans, I. S. and Cox, N. J.: Global variations of local asymmetry in glacier altitude: separation of north–south and east–west components, J. Glaciol., 51, 469–482, https://doi.org/10.3189/172756505781829205, 2005.
Farr, T. G., Rosen, P. A., Caro, E., Crippen, R., Duren, Rl, Hensley, S., Kobrick, M., Paller, M., Rodrigue, E., Roth, L., Seal, D., Shaffer, S., Shimada, J., Umland, J., Werner, M., Oskin, M., Burbank, D., and Alsdorf, D.: The Shuttle Radar Topography Mission, Rev. Geophys., 45, RG2004, https://doi.org/10.1029/2005RG000183, 2007.
Felauer, T., Schlütz, F., Murad, W., Mischke, S., and Lehmkuhl, F.: Late Quaternary climate and landscape evolution in arid Central Asia: A multiproxy study of lake archive Bayan Tohomin Nuur, Gobi desert, southern Mongolia, J. Asian. Earth. Sci., 48, 125–135, https://doi.org/10.1016/j.jseaes.2011.12.002, 2012.
Ferreira, Z. A. and Cabral, P.: A Comparative study about vertical accuracy of four freely available digital elevation models: a case study in the Balsas river watershed, Brazil, ISPRS Int. J. Geo-Inf., 11, 106, https://doi.org/10.3390/ijgi11020106, 2022.
Fletcher, W. J., Goni, M. F. S., Allen, J. R., Cheddadi, R., Combourieu-Nebout, N., Huntley, B., Lawson, I., Londeix, L., Magri, D., and Margari, V.: Millennial-scale variability during the last glacial in vegetation records from Europe, Quaternary Sci. Rev., 29, 2839–2864, https://doi.org/10.1016/j.quascirev.2009.11.015, 2010.
Florentine, C., Harper, J., Fagre, D.: Parsing complex terrain controls on mountain glacier response to climate forcing, Global Planet. Change, 191, 103209, https://doi.org/10.1016/j.gloplacha.2020.103209, 2020.
Gillespie, A. R., Burke, R. M., Komatsu, G., and Bayasgalan, A.: Late Pleistocene glaciers in Darhad basin, northern Mongolia, Quaternary Res., 69, 169–187, https://doi.org/10.1016/j.yqres.2008.01.001, 2008.
Goldthwait, R. P.: Mountain glaciers of the Presidential Range in New Hampshire, Arct. Alp. Res., 2, 85–102, https://doi.org/10.1080/00040851.1970.12003566, 1970.
Gosse, J. C. and Phillips, F. M.: Terrestrial in situ cosmogenic nuclides: theory and application, Quaternary Sci. Rev., 20, 1475–1560, https://doi.org/10.1016/S0277-3791(00)00171-2, 2001.
Gribenski, N., Jansson, K. N., Preusser, F., Harbor, J. M., Stroeven, A. P., Trauerstein, M., and Zhang, W.: Re-evaluation of MIS 3 glaciation using cosmogenic radionuclide and single grain luminescence ages, Kanas Valley, Chinese Altai, J. Quaternary Sci., 33, 55–67, https://doi.org/10.1002/jqs.2998, 2018.
Hashemi, K., Sarıkaya, M. A., Görüm, T., Wilcken, K. M., Çiner, A., Žebre, M., Stepišnik, U., and Yıldırım, C.: The Namaras rock avalanche: Evidence of mid-to-late Holocene paraglacial activity in the Central Taurus Mountains, SW Turkey, Geomorphology, 408, 108261, https://doi.org/10.1016/j.geomorph.2022.108261, 2022.
Heyman, J.: Paleoglaciation of the Tibetan Plateau and surrounding mountains based on exposure ages and ELA depression estimates, Quaternary Sci. Rev., 91, 30–41, https://doi.org/10.1016/j.quascirev.2014.03.018, 2014.
Heyman, J., Stroeven, A. P., Caffee, M. W., Hättestrand, C., Harbor, J. M., Li, Y., Alexanderson, H., Zhou, L., and Hubbard, A.: Palaeoglaciology of Bayan Har Shan, NE Tibetan Plateau: exposure ages reveal a missing LGM expansion, Quaternary Sci. Rev., 30, 1988–2001, https://doi.org/10.1016/j.quascirev.2011.05.002, 2011a.
Heyman, J., Stroeven, A. P., Harbor, J. M., and Caffee, M. W.: Too young or too old: evaluating cosmogenic exposure dating based on an analysis of compiled boulder exposure ages, Earth Planet. Sc. Lett., 302, 71–80, https://doi.org/10.1016/j.epsl.2010.11.040, 2011b.
Hock, R.: A distributed temperature-index ice-and snowmelt model including potential direct solar radiation, J. Glaciol., 45, 101–111, https://doi.org/10.3189/S0022143000003087, 1999.
Hughes, P. D., Gibbard, P. L., and Ehlers, J.: Timing of glaciation during the last glacial cycle: evaluating the concept of a global “Last Glacial Maximum” (LGM), Earth-Sci. Rev., 125, 171–198, https://doi.org/10.1016/j.earscirev.2013.07.003, 2013.
Iqbal, M.: An Introduction to Solar Radiation, New York, Academic Press, ISBN 9780323151818, 1983.
JAXA/METI: ALOS PALSAR L1.0 High-resolution terrain corrected datase, ASF DAAC [data set], https://doi.org/10.5067/J4JVCFDDPEW, 2007.
Jiménez-Sánchez, M., Rodríguez-Rodríguez, L., García-Ruiz, J. M., Domínguez-Cuesta, M. J., Farias, P., Valero-Garcés, B. L., Moreno, A., and Valcárcel, M.: A review of glacial geomorphology and chronology in northern Spain: timing and regional variability during the last glacial cycle, Geomorphology, 196, 50–64, https://doi.org/10.1016/j.geomorph.2012.06.009, 2013.
Jolivet, M., Ritz, J.-F., Vassallo, R., Larroque, C., Braucher, R., Todbileg, M., Chauvet, A., Sue, C., Arnaud, N., and DeVicente, R.: Mongolian summits: an uplifted, flat, old but still preserved erosion surface, Geology, 35, 871–874, https://doi.org/10.1130/G23758A.1, 2007.
Jones, R., Small, D., Cahill, N., Bentley, M., and Whitehouse, P.: iceTEA: tools for plotting and analysing cosmogenic-nuclide surface-exposure data from former ice margins, Quat. Geochronol., 51, 72–86, https://doi.org/10.1016/j.quageo.2019.01.001, 2019.
Jouzel, J., Stievenard, M., Johnsen, S. J., Landais, A., Masson-Delmotte, V., Sveinbjornsdottir, A., Vimeux, F., Von Grafenstein, U., and White, J. W.: The GRIP deuterium-excess record, Quaternary Sci. Rev., 26, 1–17, https://doi.org/10.1016/j.quascirev.2006.07.015, 2007.
Karger, D. N., Conrad, O., Böhner, J., Kawohl, T., Kreft, H., Soria-Auza, R. W., Zimmermann, N. E., Linder, H. P., and Kessler, M.: Climatologies at high resolution for the earth's land surface areas, Sci. Data., 4, 170122, https://doi.org/10.1038/sdata.2017.122, 2017.
Khandsuren, P., Seong, Y. B., Oh, J. S., Rhee, H. H., Sandag, K., and Yu, B. Y.: Late Quaternary glacial history of Khentey Mountains, Central Mongolia, Boreas, 48, 779–799, https://doi.org/10.1111/bor.12386, 2019.
Kirkbride, M. and Winkler, S.: Correlation of Late Quaternary moraines: impact of climate variability, glacier response, and chronological resolution, Quaternary Sci. Rev., 46, 1–29, https://doi.org/10.1016/j.quascirev.2012.04.002, 2012.
Klinge, M., Schneider, F., Dulamsuren, C., Arndt, K., Bayarsaikhan, U., and Sauer, D.: Interrelations between relief, vegetation, disturbances, and permafrost in the forest-steppe of central Mongolia, Earth Surf. Proc. Land., 46, 1766–1782, https://doi.org/10.1002/esp.5116, 2021.
Kohl, C. P. and Nishiizumi, K.: Chemical isolation of quartz for measurement of in situ -produced cosmogenic nuclides, Geochim. Cosmochim. Ac., 56, 3583–3587, https://doi.org/10.1016/0016-7037(92)90401-4, 1992.
Koppes, M., Gillespie, A. R., Burke, R. M., Thompson, S. C., and Stone, J.: Late quaternary glaciation in the Kyrgyz Tien Shan, Quaternary. Sci. Rev., 27, 846–866, https://doi.org/10.1016/j.quascirev.2008.01.009, 2008.
Laabs, B. J., Refsnider, K. A., Munroe, J. S., Mickelson, D. M., Applegate, P. J., Singer, B. S., and Caffee, M. W.: Latest Pleistocene glacial chronology of the Uinta Mountains: support for moisture-driven asynchrony of the last deglaciation, Quaternary Sci. Rev., 28, 1171–1187, https://doi.org/10.1016/j.quascirev.2008.12.012, 2009.
Laabs, B. J., Licciardi, J. M., Leonard, E. M., Munroe, J. S., and Marchetti, D. W.: Updated cosmogenic chronologies of Pleistocene mountain glaciation in the western United States and associated paleoclimate inferences, Quaternary Sci. Rev., 242, 106427, https://doi.org/10.1016/j.quascirev.2020.106427, 2020.
Laabs, B. J., Marchetti, D. W., Munroe, J. S., Refsnider, K. A., Gosse, J. C., Lips, E. W., and Singer, B. S.: Chronology of latest Pleistocene mountain glaciation in the western Wasatch Mountains, Utah, USA, Quaternary Res., 76, 272–284, https://doi.org/10.1016/j.yqres.2011.06.016, 2011.
Laabs, B. J. C. and Munroe, J. S.: Late Pleistocene mountain glaciation in the Lake Bonneville basin, in: Developments in Earth. Surf. Process., 20, 462–503, https://doi.org/10.1016/B978-0-444-63590-7.00017-2, 2016.
Lee, M. K., Lee, Y. I., Lim, H. S., Lee, J. I., and Yoon, H. I.: Late Pleistocene–Holocene records from Lake Ulaan, southern Mongolia: implications for east Asian palaeomonsoonal climate changes, J. Quaternary Sci., 28, 370–378, https://doi.org/10.1002/jqs.2626, 2013.
Lehmkuhl, F., Grunert, J., Hülle, D., Batkhishig, O., Stauch, G.: Paleolakes in the Gobi region of southern Mongolia, Quaternary Sci. Rev., 179, 1–23, https://doi.org/10.1016/j.quascirev.2017.10.035, 2018.
Li, Y., Liu, G., Chen, Y., Li, Y., Harbor, J., Stroeven, A. P., Caffee, M., Zhang, M., Li, C., and Cui, Z.: Timing and extent of Quaternary glaciations in the Tianger Range, eastern Tian Shan, China, investigated using 10Be surface exposure dating, Quaternary Sci. Rev., 98, 7–23, https://doi.org/10.1016/j.quascirev.2014.05.009, 2014.
Licciardi, J. M., Clark, P. U., Brook, E. J., Pierce, K. L., Kurz, M. D., Elmore, D., and Sharma, P.: Cosmogenic 3He and 10Be chronologies of the late Pinedale northern Yellowstone ice cap, Montana, USA, Geology, 29, 1095–1098, https://doi.org/10.1130/0091-7613(2001)029<1095:CHABCO>2.0.CO;2, 2001.
Licciardi, J. M., Clark, P. U., Brook, E. J., Elmore, D., and Sharma, P.: Variable responses of western US glaciers during the last deglaciation, Geology, 32, 81–84, https://doi.org/10.1130/G19868.1, 2004.
Licciardi, J. M. and Pierce, K. L.: History and dynamics of the Greater Yellowstone Glacial System during the last two glaciations, Quaternary Sci. Rev., 200, 1–33, https://doi.org/10.1016/j.quascirev.2018.08.027, 2018.
Lifton, N., Sato, T., and Dunai, T. J.: Scaling in situ cosmogenic nuclide production rates using analytical approximations to atmospheric cosmic-ray fluxes, Earth Planet. Sc. Lett., 386, 149–160, https://doi.org/10.1016/j.epsl.2013.10.052, 2014.
Luckman, B. H.: The Geomorphic Activity of Snow Avalanches, Geogr. Ann. A, 59, 31–48, https://doi.org/10.1080/04353676.1977.11879945, 1977.
Meierding, T. C.: Late Pleistocene glacial equilibrium-line altitudes in the Colorado Front Range: a comparison of methods, Quaternary Res., 18, 289–310, https://doi.org/10.1016/0033-5894(82)90076-X, 1982.
Mischke, S., Lee, M. K., and Lee, Y. I.: Climate history of southern Mongolia since 17 ka: The ostracod, gastropod and charophyte record from Lake Ulaan, Front, Earth Sci., 8, 221, https://doi.org/10.3389/feart.2020.00221, 2020.
NAMHEM: Climate data, Institute for Hydrology and Aviation Meteorological Center of National Agency for Meteorology, Hydrology and Environmental Monitoring, Ulaanbaatar, Mongolia, https://www.namem.gov.mn/ (last access: 5 January 2023), 2020.
National Oceanic and Atmospheric Administration (NOAA): US standard atmosphere, Vol. 76, edited by: Teweles, S., Washington DC, 003-017-00323-0, 1976.
Nishiizumi, K., Imamura, M., Caffee, M., Southon, J., Finkel, R., McAninch, J.: Absolute calibration of 10Be AMS Standards, Nucl. Instrum. Meth. B., 258, 403–413, https://doi.org/10.1016/j.nimb.2007.01.297, 2007.
Oliva, M., Palacios, D., Fernández-Fernández, J. M., Rodríguez-Rodríguez, L., García-Ruiz, J. M., Andrés, N., and Hughes, P. D.: Late Quaternary glacial phases in the Iberian Peninsula, Earth-Sci. Rev., 192, 564–600, https://doi.org/10.1016/j.earscirev.2019.03.015, 2019.
Olson, M. and Rupper, S.: Impacts of topographic shading on direct solar radiation for valley glaciers in complex topography, The Cryosphere, 13, 29–40, https://doi.org/10.5194/tc-13-29-2019, 2019.
Palacios, D., Stokes, C. R., Phillips, F. M., Clague, J. J., Alcalá-Reygosa, J., Andrés, N., and Ward, D. J.: The deglaciation of the Americas during the Last Glacial Termination, Earth-Sci. Rev., 203, 103113, https://doi.org/10.1016/j.earscirev.2020.103113, 2020.
Porter, S. C.: Snowline depression in the tropics during the Last Glaciation, Quaternary Sci. Rev., 20, 1067–1091, https://doi.org/10.1016/S0277-3791(00)00178-5, 2001.
Pötsch, S.: Dynamics and paleo-climatic forcing of late Pleistocene glaciers in the Turgen and Khangai mountains (Mongolia) reconstructed from geomorphology, 10Be surface exposure dating, and ice flow modelling, PhD thesis, Greifswald, Finsterwalde, urn:nbn:de:gbv:9-002817-2, 2017.
Quirk, B. J., Moore, J. R., Laabs, B. J., Plummer, M. A., andCaffee, M. W.: Latest Pleistocene glacial and climate history of the Wasatch Range, Utah, Quaternary Sci. Rev., 238, 106313, https://doi.org/10.1016/j.quascirev.2020.106313, 2020.
Ross, S. M.: Peirce's criterion for the elimination of suspect experimental data, J. Eng. Technol., 20, 38–41, 2003.
Rother, H., Lehmkuhl, F., Fink, D., and Nottebaum, V.: Surface exposure dating reveals MIS-3 glacial maximum in the Khangai Mountains of Mongolia, Quaternary Res., 82, 297–308, https://doi.org/10.1016/j.yqres.2014.04.006, 2014.
Sanders, J. W., Cuffey, K. M., Moore, J. R., MacGregor, K. R., and Kavanaugh, J. L.: Periglacial weathering and headwall erosion in cirque glacier bergschrunds, Geology, 40, 779–782, https://https://doi.org/10.1130/G33330.1, 2012.
Şengör, A., Natal'In, B., and Burtman, V.: Evolution of the Altaid tectonic collage and Palaeozoic crustal growth in Eurasia, Nature, 364, 299–307, https://doi.org/10.1038/364299a0, 1993.
Seong, Y. B., Dorn, R. I., and Yu, B. Y.: Evaluating the life expectancy of a desert pavement, Earth-Sci. Rev., 162, 129–154, https://doi.org/10.1016/j.earscirev.2016.08.005, 2016.
Shackleton, N.: Oxygen isotope analyses and Pleistocene temperatures re-assessed, Nature, 215, 15–17, https://doi.org/10.1038/215015a0, 1967.
Shackleton, N. J.: The 100,000-year ice-age cycle identified and found to lag temperature, carbon dioxide, and orbital eccentricity, Science, 289, 1897–1902, https://doi.org/10.1126/science.289.5486.1897, 2000.
Skinner, L. and Shackleton, N.: An Atlantic lead over Pacific deep-water change across Termination I: implications for the application of the marine isotope stage stratigraphy, Quaternary Sci. Rev., 24, 571–580, https://doi.org/10.1016/j.quascirev.2004.11.008, 2005.
Smith, S. G., Wegmann, K. W., Ancuta, L. D., Gosse, J. C., and Hopkins, C. E.: Paleotopography and erosion rates in the central Hangay Dome, Mongolia: Landscape evolution since the mid-Miocene, J. Asian. Earth. Sci., 125, 37–57, https://doi.org/10.1016/j.jseaes.2016.05.013, 2016.
Tang, Z. and Fang, J.: Temperature variation along the northern and southern slopes of Mt. Taibai, China, Agr. Forest Meteorol., 139, 200–207, https://doi.org/10.1016/j.agrformet.2006.07.001, 2006.
Tarasov, P., Peyron, O., Guiot, J., Brewer, S., Volkova, V., Bezusko, L., Dorofeyuk, N., Kvavadze, E., Osipova, I., and Panova, N.: Last Glacial Maximum climate of the former Soviet Union and Mongolia reconstructed from pollen and plant macrofossil data, Clim. Dynam., 15, 227–240, https://doi.org/10.1007/s003820050278, 1999.
Thackray, G. D.: Varied climatic and topographic influences on Late Pleistocene mountain glaciation in the western United States, J. Quaternary Sci., 23, 671–681, https://doi.org/10.1002/jqs.1210, 2008.
Thompson, W. G., Spiegelman, M. W., Goldstein, S. L., and Speed, R. C.: An open-system model for U-series age determinations of fossil corals, Earth Planet. Sc. Lett., 210, 365–381, https://doi.org/10.1016/S0012-821X(03)00121-3, 2003.
Traynor, J. and Sladen, C.: Tectonic and stratigraphic evolution of the Mongolian People's Republic and its influence on hydrocarbon geology and potential, Mar. Petrol. Geol., 12, 35–52, https://doi.org/10.1016/0264-8172(95)90386-X, 1995.
Vassallo, R., Jolivet, M., Ritz, J.-F., Braucher, R., Larroque, C., Sue, C., Todbileg, M., and Javkhlanbold, D.: Uplift age and rates of the Gurvan Bogd system (Gobi-Altay) by apatite fission track analysis, Earth Planet. Sc. Lett., 259, 333–346, https://doi.org/10.1016/j.epsl.2007.04.047, 2007.
Vassallo, R., Ritz, J.-F., and Carretier, S.: Control of geomorphic processes on 10Be concentrations in individual clasts: Complexity of the exposure history in Gobi-Altay range (Mongolia), Geomorphology, 135, 35–47, https://doi.org/10.1016/j.geomorph.2011.07.023, 2011.
Wang, Y.-J., Cheng, H., Edwards, R. L., An, Z., Wu, J., Shen, C.-C., and Dorale, J. A.: A high-resolution absolute-dated late Pleistocene monsoon record from Hulu Cave, China, Science, 294, 2345–2348, https://doi.org/10.1126/science.1064618, 2001.
Young, N. E., Briner, J. P., Leonard, E. M., Licciardi, J. M., and Lee, K.: Assessing climatic and nonclimatic forcing of Pinedale glaciation and deglaciation in the western United States, Geology, 39, 171–174, https://doi.org/10.1130/G31527.1, 2011.
Yu, K., Lehmkuhl, F., Diekmann, B., Zeeden, C., Nottebaum, V., and Stauch, G.: Geochemical imprints of coupled paleoenvironmental and provenance change in the lacustrine sequence of Orog Nuur, Gobi Desert of Mongolia, J. Paleolimnol., 58, 511–532, https://doi.org/10.1007/s10933-017-0007-7, 2017.
Yu, K., Lehmkuhl, F., Schlütz, F., Diekmann, B., Mischke, S., Grunert, J., Murad, W., Nottebaum, V., Stauch, G., and Zeeden, C.: Late Quaternary environments in the Gobi Desert of Mongolia: Vegetation, hydrological, and palaeoclimate evolution, Palaeogeogr. Palaeoclim., 514, 77–91, https://doi.org956/10.1016/j.palaeo.2018.10.004, 2019.
Zhang, S., Zhao, H., Sheng, Y., Chen, S., Li, G., and Chen, F.: Late Quaternary lake level record of Orog Nuur, southern Mongolia, revealed by optical dating of paleo-shorelines, Quat. Geochronol., 72, 101370, https://doi.org/10.1016/j.quageo.2022.101370, 2022.