the Creative Commons Attribution 4.0 License.
the Creative Commons Attribution 4.0 License.
 | 08 Jun 2023
Modelling rock glacier ice content based on InSAR-derived velocity, Khumbu and Lhotse valleys, Nepal
Stephan Harrison
Joanne Laura Wood
Active rock glaciers are viscous flow features embodying ice-rich permafrost and other ice masses. They contain significant amounts of ground ice and serve as potential freshwater reservoirs as mountain glaciers melt in response to climate warming. However, current knowledge about ice content in rock glaciers has been acquired mainly from in situ investigations in limited study areas, which hinders a comprehensive understanding of ice storage in rock glaciers situated in remote mountains over local to regional scales. This study proposes a novel approach for assessing the hydrological value of rock glaciers in a more quantitative way and presents exploratory results focusing on a small region. We develop an empirical rheological model to infer ice content of rock glaciers using readily available input data, including rock glacier planar shape, surface slope angle, active layer thickness, and surface velocity. The model is calibrated and validated using observational data from the Chilean Andes and the Swiss Alps. We apply the model to five rock glaciers in the Khumbu and Lhotse valleys, northeastern Nepal. The velocity constraints applied to the model are derived from interferometric synthetic aperture radar (InSAR) measurements. The volume of rock glacier is estimated based on an existing scaling approach. The inferred volumetric ice fraction in the Khumbu and Lhotse valleys ranges from 70 ± 8 % to 74 ± 8 %, and the water volume equivalents lie between 1.4 ± 0.2 and m3 for the coherently moving parts of individual rock glaciers. Due to the accessibility of the model inputs, our approach is applicable to permafrost regions where observational data are lacking, which is valuable for estimating the water storage potential of rock glaciers in remote areas.
- Article
(6357 KB) - Full-text XML
-
Supplement
(886 KB) - BibTeX
- EndNote


Rock glaciers are valley-floor and valley-side landforms that commonly occur in the glacial and periglacial realm. Intact rock glaciers contain a considerable amount of ground ice (Ballantyne, 2018; Berthling, 2011; Brenning, 2005a). Recent research has suggested that they represent important hydrological reservoirs in areas where glaciers are undergoing recession in the face of climate change, such as South America (Azócar and Brenning, 2010; Rangecroft et al., 2014), North America (Munroe, 2018), and Central Asia (Jones et al., 2018a). Corte (1976) first proposed the potential hydrological value of rock glaciers, yet research on the role of rock glaciers in maintaining hydrological stores in mountain catchments remains limited.
Jones et al. (2021) were the first to show that around 25 000 rock glaciers exist in the Himalayas, covering 3747 km2 and potentially containing 51.80 ± 10.36 km3 of water volume equivalent. The ratio between rock glacier ice content and that in glaciers in the region was 1:25, ranging from 1:42 to 1:17 in the eastern and central Himalaya and falling to 1:9 in Nepal. Importantly, we expect these existing ratios to be significantly reduced due to climate-warming-induced glacier melting. Few studies have investigated the hydrological contribution of rock glaciers to surface runoff at annual or seasonal timescales (e.g. Geiger et al., 2014; Harrington et al., 2018; Krainer and Mostler, 2002; Winkler et al., 2016), and little evidence has shown that rock glacier discharge is a prominent water source at present due to the insulation effect produced by their blocky surfaces (Duguay et al., 2015; Jones et al., 2019b; Pruessner et al., 2021). Yet, on multi-annual to centennial and millennial timescales, we expect rock glaciers with high ice content to serve as water reservoirs long after glaciers have melted.
To date, we have little quantitative information concerning the ice content of rock glaciers, which hinders our understanding of the potential future hydrological role of rock glaciers. Currently, estimates of ice content in rock glaciers focus on empirical information from drilling cores and boreholes (e.g. Hausmann et al., 2007; Arenson et al., 2002; Berthling et al., 2000; Croce and Milana, 2002; Guglielmin et al., 2004; Haeberli et al., 1998; Krainer et al., 2015; Leopold et al., 2011; Steig et al., 1998), as well as from geophysical surveys (e.g. for reviews see Hauck, 2013; Kneisel et al., 2008; Scott et al., 1990). However, these approaches to estimate the likely ice content are costly, time-consuming, and labour-intensive to apply to rock glaciers at high altitudes and in remote mountains. It is therefore desirable to develop alternative approaches to understand the likely ice content of rock glaciers, especially for regional-scale estimates.
Ice content is one factor controlling the movement of rock glaciers by influencing the driving force and the rheological properties of materials which constitute the permafrost core (Arenson and Springman, 2005a; Cicoira et al., 2020), in addition to other properties including ground temperature, subsurface structure, debris content, and water pressure (Moore, 2014). We therefore consider it feasible to infer ice content using rheological modelling and observed kinematic data. Here we adapt an empirical model by integrating rheological properties of rock glaciers derived from laboratory experiments (Arenson and Springman, 2005a) and parameterise the rheological model based on the structure and composition data for the Las Liebres rock glacier (Monnier and Kinnard, 2015; Monnier and Kinnard, 2016). We then apply the model to simulate surface velocities of three rock glaciers with known ice content in the Swiss Alps and evaluate the modelling results to determine a suitable parameterisation scheme. Finally, we apply the calibrated model for five rock glaciers in the study area of northeastern Nepal and model their ice contents based on remote-sensing-derived downslope velocities as constraints.
The Khumbu and Lhotse valleys are located in northeastern Nepal (Fig. 1a). Among the highest in the world, the Khumbu and Lhotse glaciers draining Everest have well-defined debris-covered snouts. The tributary valleys contain a variety of rock glaciers and composite landforms where glaciers are transitioning to rock glaciers (Jones et al., 2019a; Knight et al., 2019). There are five rock glaciers in the study area, namely Kala Patthar, Kongma, Lingten, Nuptse, and Tobuche (Fig. 1b). The five rock glaciers examined in this study are situated at 4900–5090 m a.s.l., near the lower limit of permafrost in the region. Previous seismic refraction surveys conducted on active rock glaciers indicate the lower limit of permafrost occurrence in this region to be ∼ 5000–5300 m a.s.l. (Jakob, 1992; Fukui et al., 2007), which is consistent with an earlier estimate of 4900 m a.s.l. based on ground temperature measurements (Fujii and Higuchi, 1976).
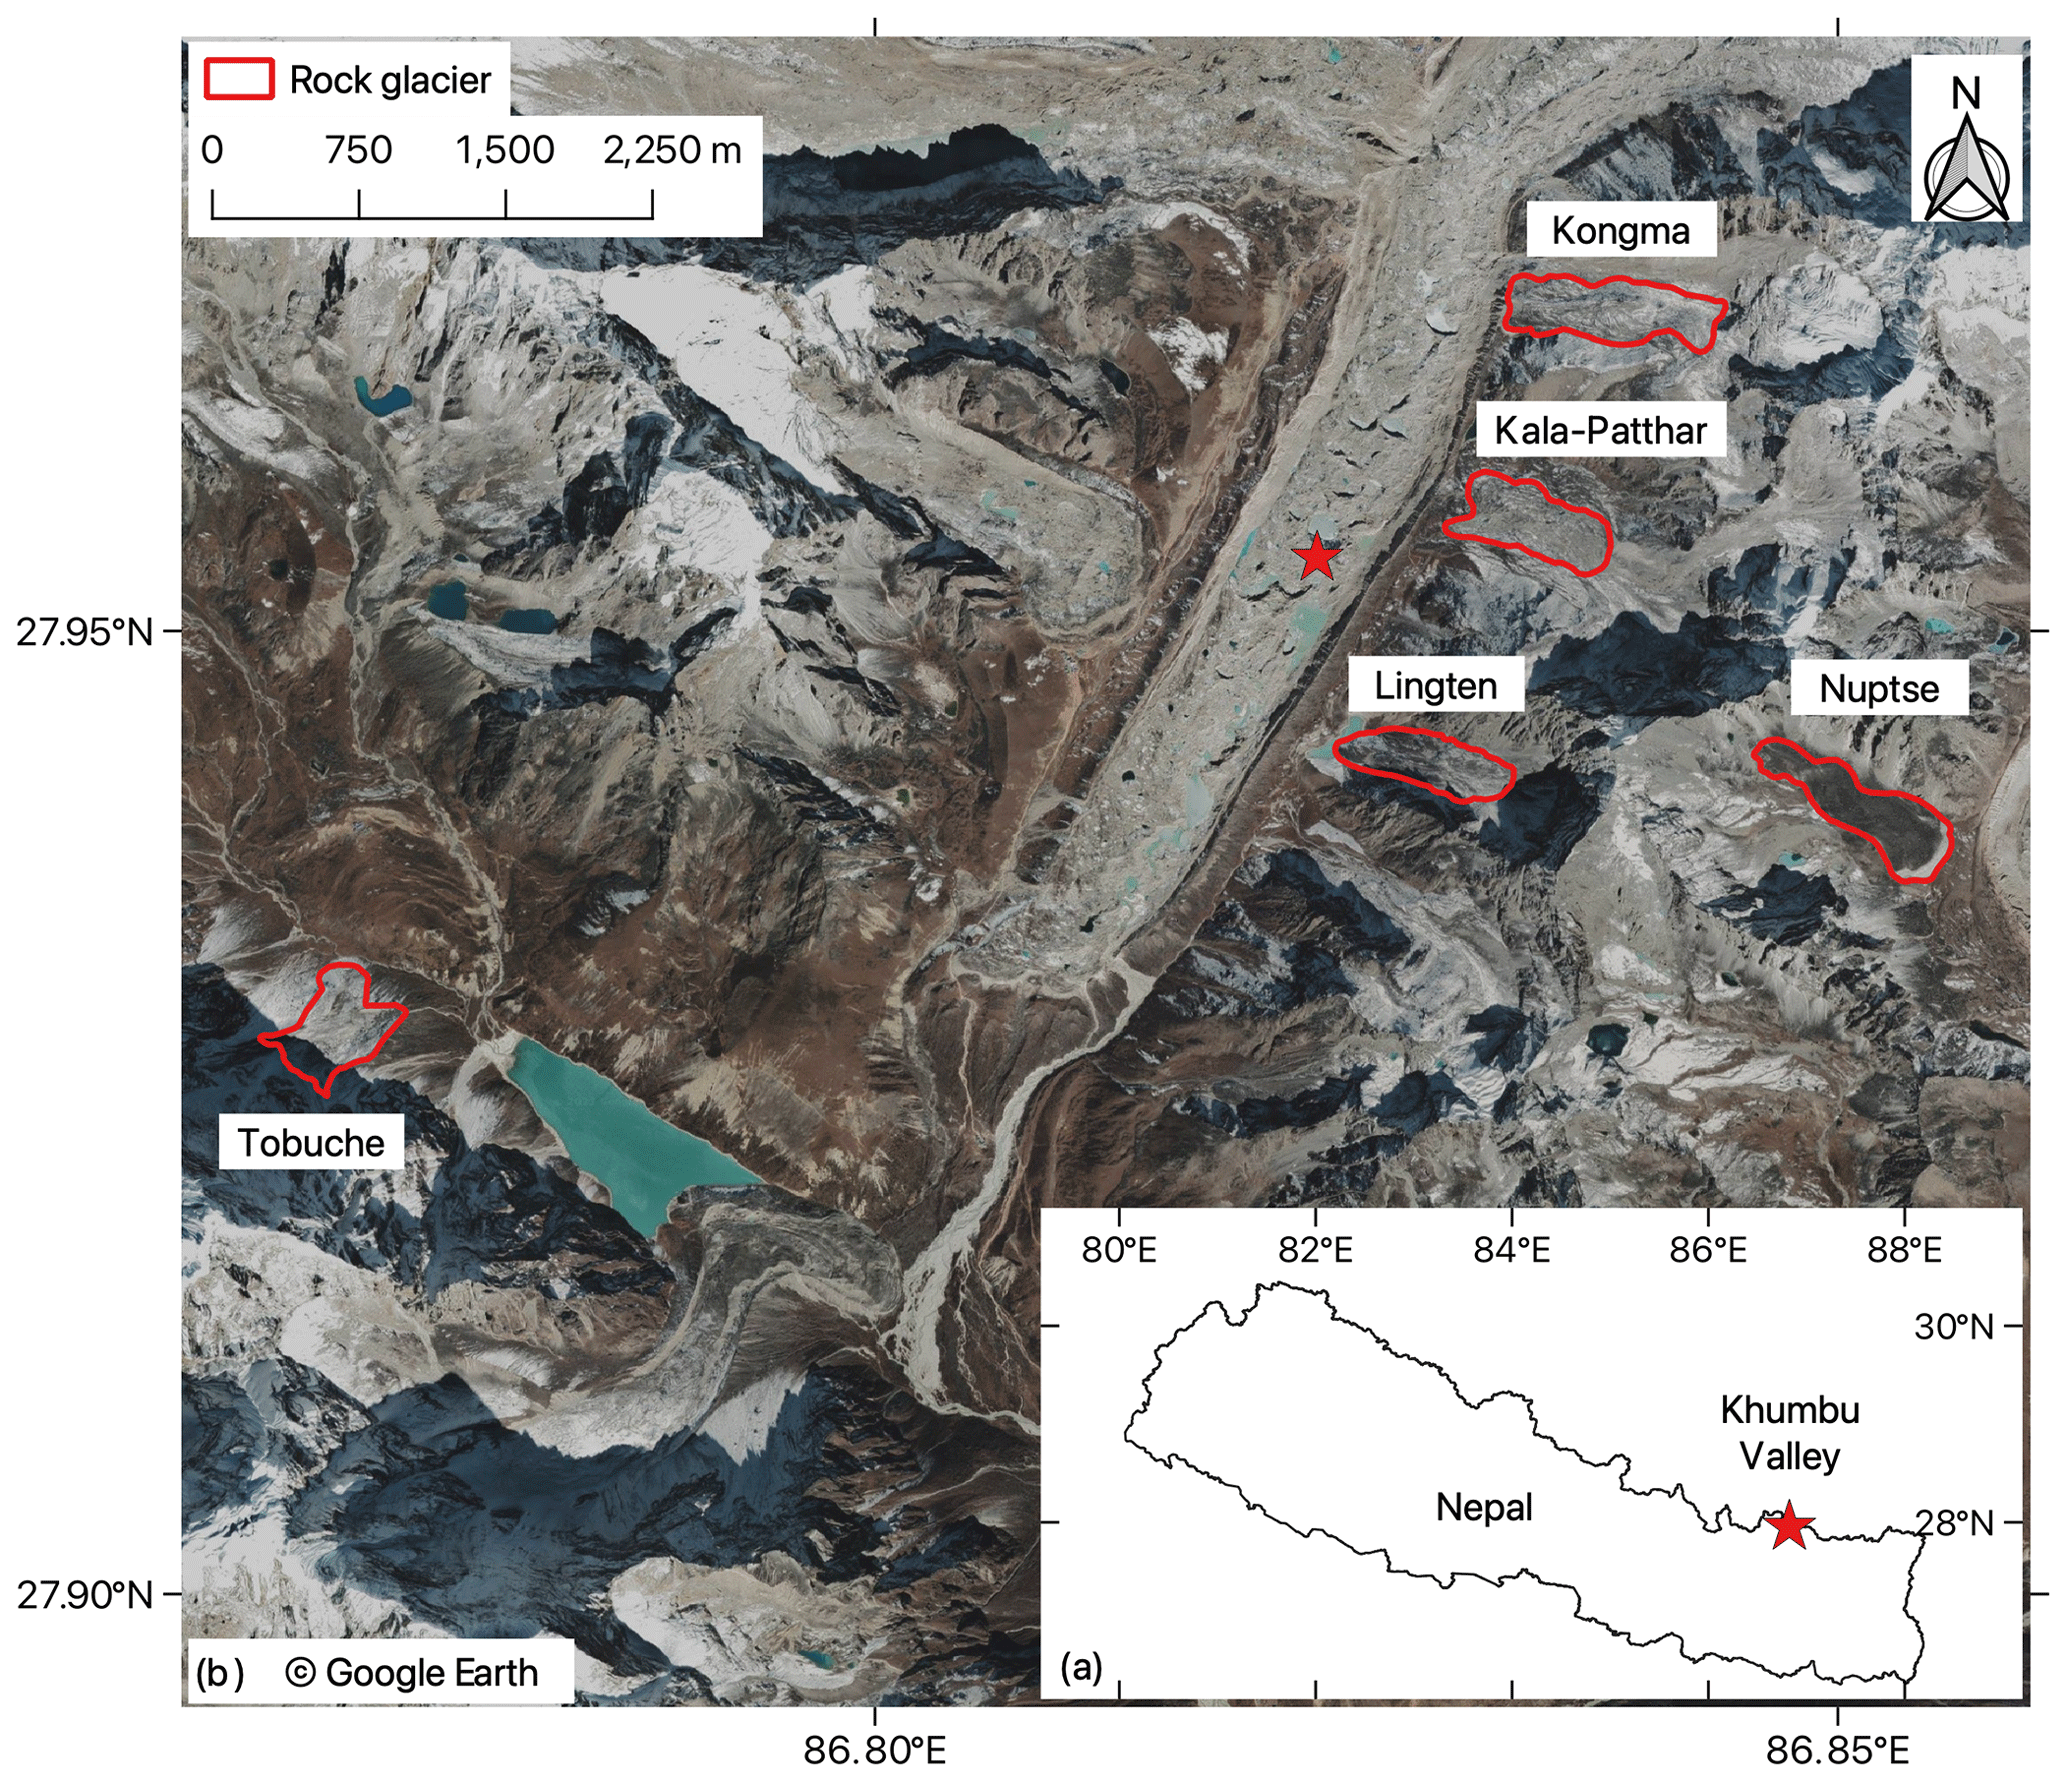
Figure 1(a) Location of the study site; (b) Google Earth images (taken in 2019) showing the spatial distribution of the active rock glaciers (RGs) outlined in red. The RGs are delineated by Jones et al. (2018).
Meteorological data provided by the Pyramid Observatory Laboratory near Lobuche village on the western side of the Khumbu Glacier (5050 m a.s.l.) reveal that the dominating climate of this area is the South Asian summer monsoon. For the period of 1994–2013, recorded accumulated annual precipitation was 449 mm yr−1, with 90 % of the precipitation concentrated during June–September (Salerno et al., 2015). The mean annual air temperature is −2.4 ∘C (Salerno et al., 2015).
Measurements of ground temperature in the study area are scarce in general. However, we infer that these rock glaciers develop in a warm permafrost environment for the following reasons: (1) they are located near or below the altitudinal limit of permafrost distribution in Nepal (Fujii and Higuchi, 1976; Jakob, 1992), indicating that the local environment is at the critical limit of permafrost occurrence; (2) based on empirical relationships between mean annual ground temperature (MAGT), mean annual air temperature, latitude, and altitude, the estimated MAGT is >0.5∘C, which suggests that permafrost in this area is in a warm and unstable state (Nan et al., 2002; Zhao and Sheng, 2015).
The main workflow of our method is illustrated in Fig. 2. In this section, we first introduce the model design and basic assumptions we adopted (Sect. 3.1). Then we present the following development steps in sequence: model calibration (Sect. 3.2), validation (Sect. 3.3), and sensitivity test (Sect. 3.4). Finally, we describe how we used InSAR-derived velocity measurements in the application of our model (Sect. 3.5).
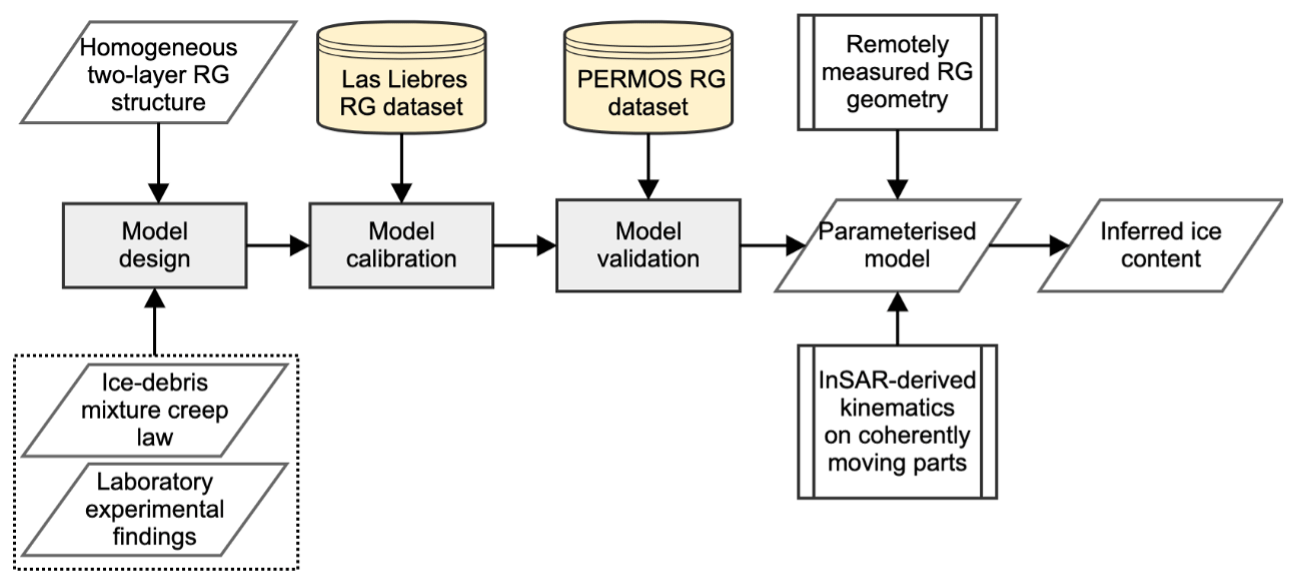
Figure 2Diagram of the workflow conducted in this study to develop and apply a modelling approach for inferring ice content of rock glaciers (RGs).
3.1 Model design and assumptions
Active rock glaciers are viscous flow features embodying ice-rich permafrost (Ballantyne, 2018; Berthling, 2011; Haeberli, 2000). Many previous modelling studies depict the deformation mechanism of rock glaciers based on Glen's flow law (e.g. Arenson and Springman, 2005a; Cicoira et al., 2020; Whalley and Azizi, 1994), which essentially relates strain rate ( with effective shear stress (τ) and describes the rheology of ice flow (Glen, 1955):
where A and n are creep parameters reflecting variations in environmental conditions (mainly temperature and pressure), material properties (such as composition, structure, and texture), and operating creep mechanisms (e.g. diffusion and dislocation).
In this study, we primarily adopted a creep model of ice–debris mixture, proposed by Moore (2014) based on Glen's flow law:
where E is a strain enhancement factor, and Γ is a parameter reflecting the strength of the ice–debris mixture associated with the volumetric debris content (θd). We assumed the rock glacier has an ice-rich permafrost core. When θd is less than a critical volumetric debris content (θdc), ice creep dominates the behaviour of the mixture, and the value of Γ equals 1. Theoretically, θdc is around 0.52 (Moore, 2014). τ is the driving stress and τth is a threshold stress imparted by the frictional strength between debris particles, also depending upon the volumetric debris content (θd).
Assuming that τth≪τ, θd<θdc, and Γ=1, Eq. (2) can be reduced to the following form (Monnier and Kinnard, 2016):
where B is the effective viscosity and is equal to . We introduced the effective viscosity (B) to absorb the intricate effects of strain enhancement factor (E), threshold stress (τth), and, most importantly, the creep parameter (A), which is primarily affected by ground temperatures (Mellor and Testa, 1969). Previous research (e.g. Arenson and Springman, 2005a; Azizi and Whalley, 1996; Kääb et al., 2007; Ladanyi, 2003) considered this factor by implementing a heat diffusion model (proposed by Carslaw and Jaeger, 1959). In this study, we used a constant effective viscosity (B) to describe the deformation behaviour of rock glaciers in a warm permafrost environment (>−3 ∘C). The empirical formula was developed based on existing observational data (Monnier and Kinnard, 2016) and laboratory findings (Arenson and Springman, 2005a). This warm ground condition is likely to be realistic in our study area (Sect. 2) and occurs in the rock glaciers in the Andes and Swiss Alps selected for model calibration and validation (Sect. 3.2 and 3.3).
We assume a homogeneous structure and consider each rock glacier to be a slab with uniform width and thickness as well as a semi-elliptical cross-section, resting on a bed of constant slope, which is a common setup in glaciology (Cuffey and Paterson, 2010). It consists of two layers: an active layer and a permafrost core. The active layer is a mixture of debris and air, and the permafrost core consists of ice, unfrozen water, debris, and air. Both layers are assumed to be homogeneous. Movement of rock glaciers is caused by the steady creep of the permafrost core in the plane parallel to the bed slope. The active layer moves passively along with the inner core, which has been validated by observations (Arenson et al., 2002; Haeberli, 2000).
Here we neglected the presence of shear horizon where deformation is enhanced and ground ice content is low, as discovered from borehole investigations (Arenson et al., 2002; Buchli et al., 2018; Haeberli et al., 1998). Field observations and numerical modelling suggest that unfrozen water within the shear horizon plays an important role in controlling the seasonal variations in rock glacier creep (e.g. Buchli et al., 2018; Cicoira et al., 2019b; Kenner et al., 2019; Wirz et al., 2016). However, the short-term rock glacier kinematic patterns are irrelevant to this study focusing on modelling the relationship between ice content and multi-annual average movement velocity.
From Eq. (3) and the structure and geometry illustrated in Fig. 3, we have
where is the velocity derivative relative to the depth z in the permafrost core.
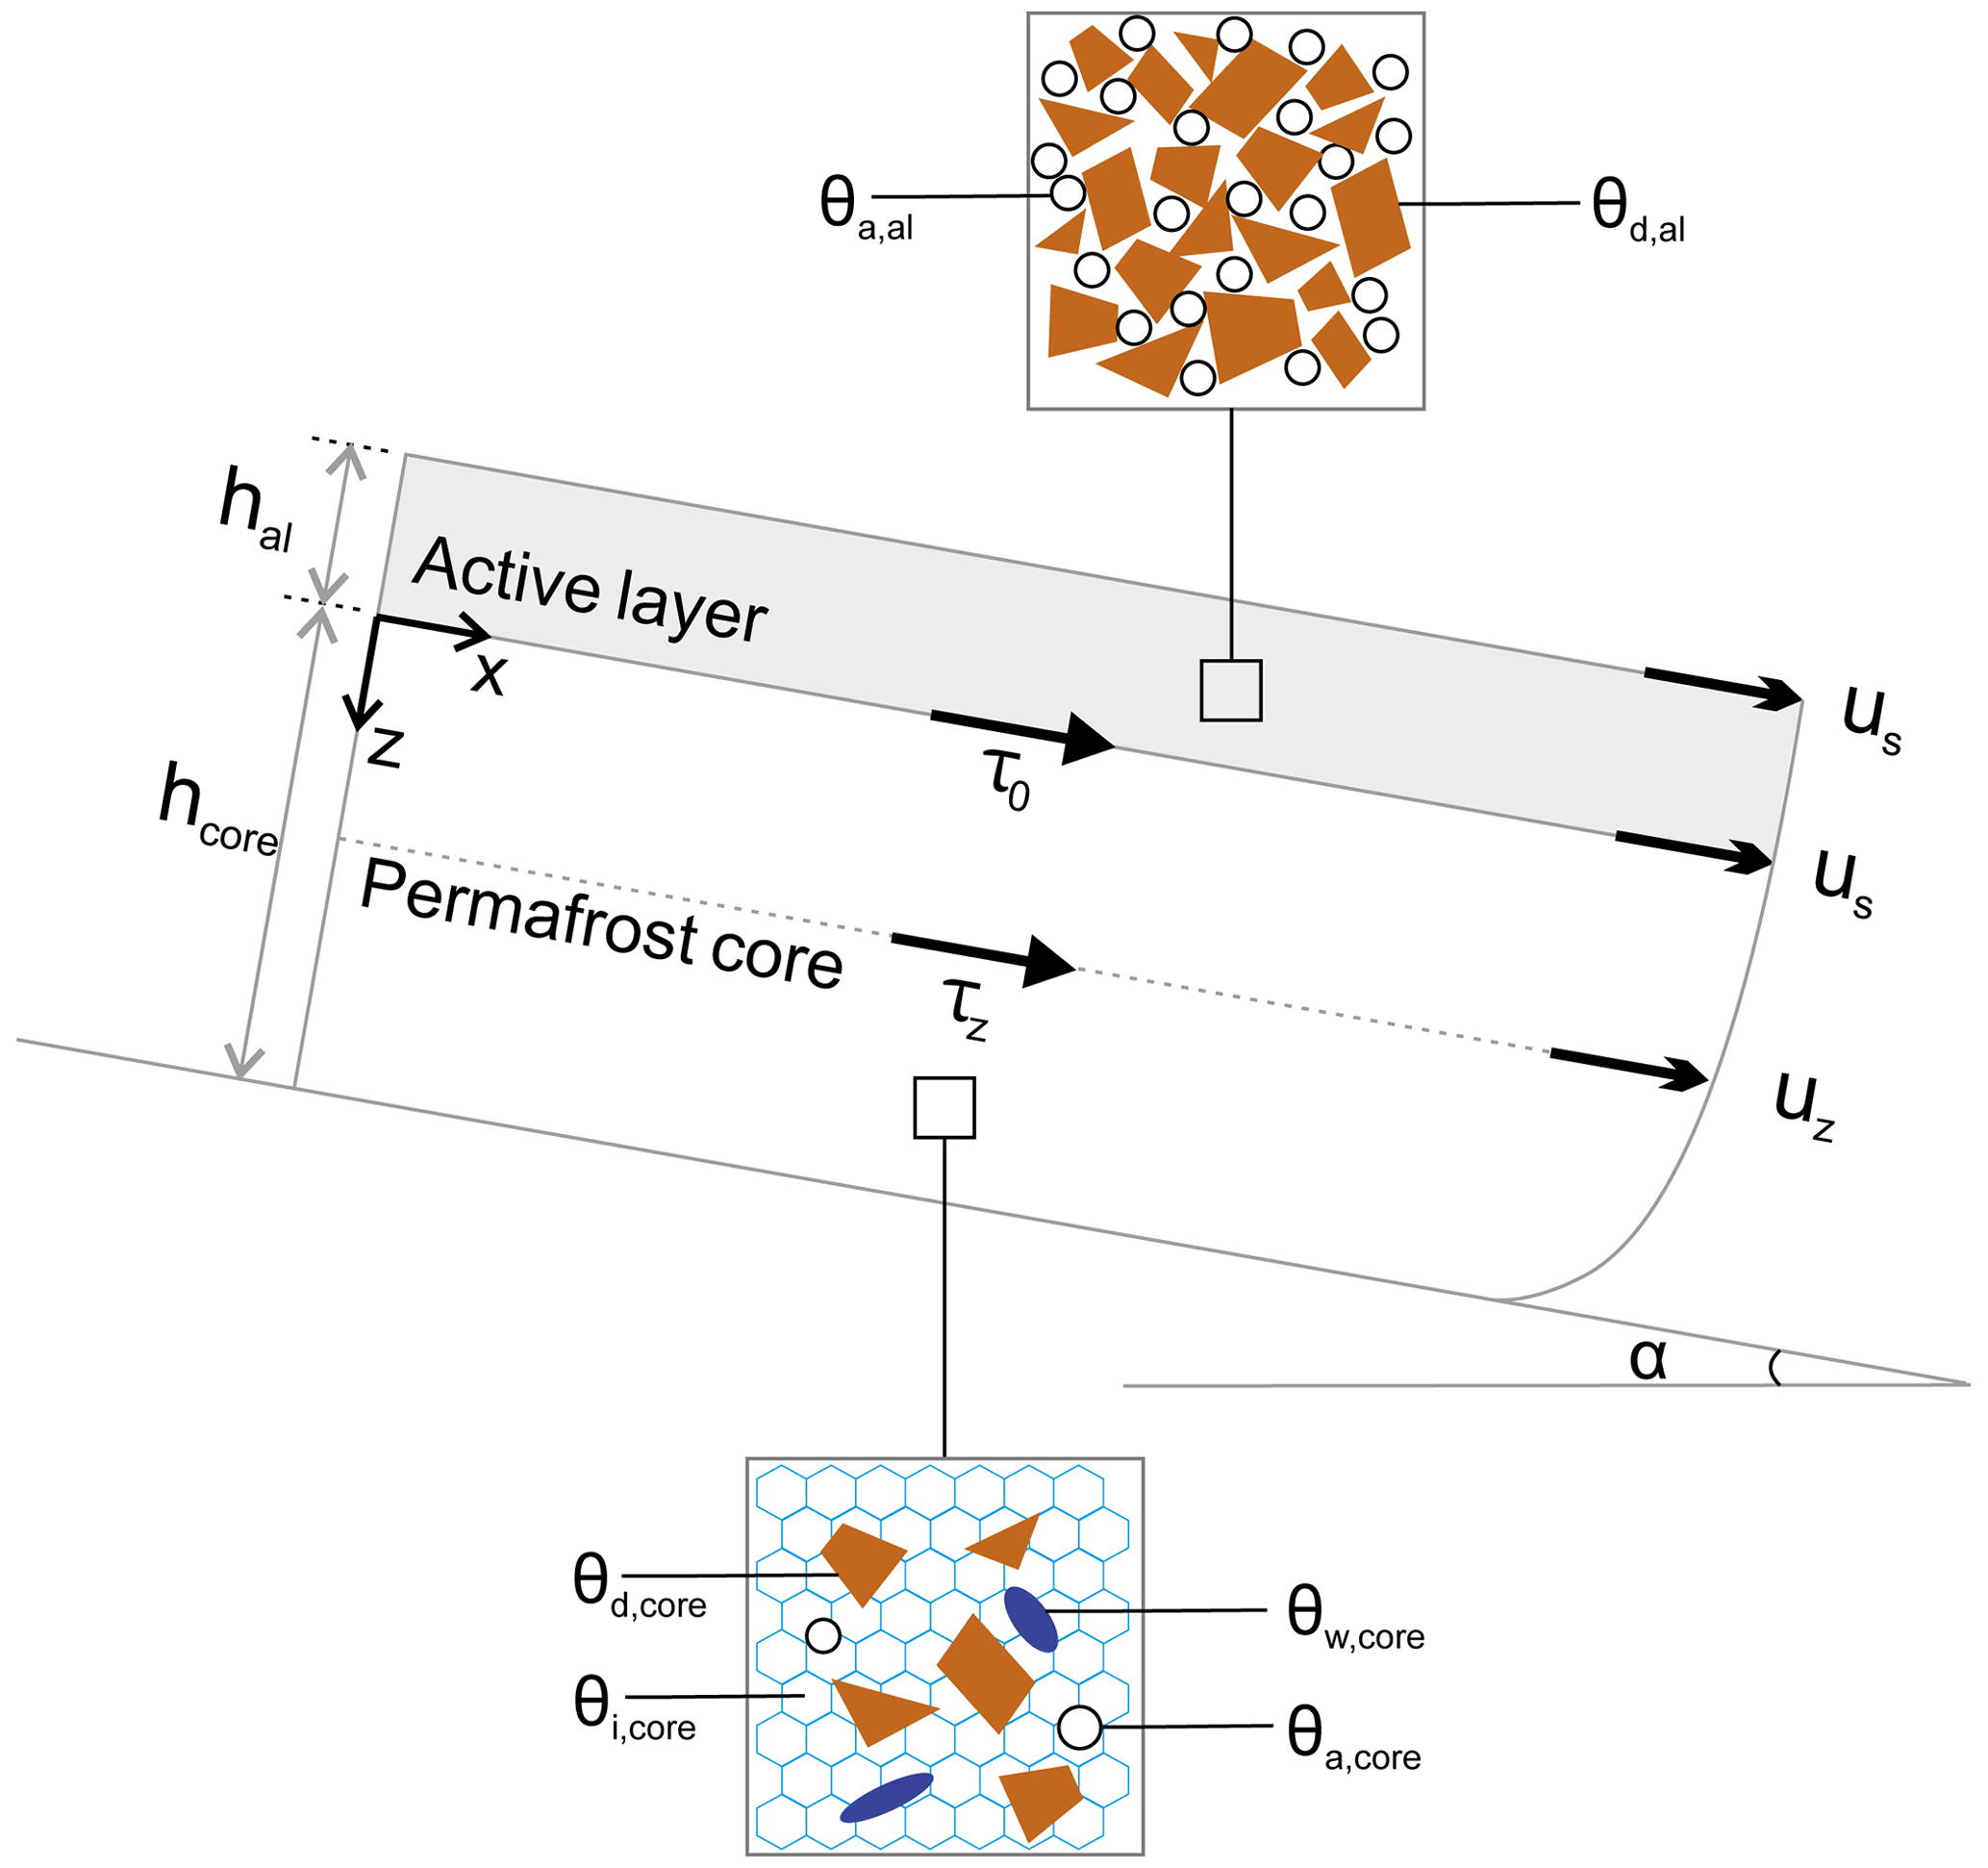
Figure 3Schematic geometry, structure, stress status, and composition of rock glaciers (adapted from Monnier and Kinnard, 2016). The rock glacier consists of a permafrost core underlying the active layer. Parameters involved in the model include surface slope (α), active layer thickness (hal), thickness of permafrost core (hcore), driving stress at the base of the active layer (τ0), driving stress at depth z (τz), surface velocity (us), and velocity at depth z (uz). θd,al and θa,al refer to the debris fraction and air fraction of the active layer. θd,core, θi,core, θw,core, and θa,core are the fractions of debris, ice, water, and air in the permafrost core, respectively.
At a given depth z, the driving stress τ is imparted, taking into account the loading of the above material and the effect of frictional drag occurring between the lateral margins and surrounding bedrock, which is represented by a shape factor Sf (Cuffey and Paterson, 2010):
where α is the slope angle, g is the gravitational acceleration, ρal and ρcore are the densities of the active layer and the permafrost core, respectively, and hal is the active layer thickness.
The shape factor is expressed as (Oerlemans, 2001)
where W and T are the width and thickness of the rock glacier, respectively.
The integration of the velocity profile (Eqs. 4 and 5) is expressed as
where us is the surface velocity as illustrated in Fig. 3. When z is set as the thickness of the ice core (hcore) and basal sliding is assumed to be absent, us is then expressed as
The densities of the active layer (ρal) and the permafrost core (ρcore) are given as
where θd,al and θa,al are the volumetric contents of debris and air in the active layer, respectively. The volumetric contents of the components in the inner core, namely debris, air, ice, and water, are expressed as θd,core, θa,core, θi,core, and θw,core, respectively. ρd, ρa, ρi, and ρw are the densities of debris, air, ice, and water, respectively.
We fixed the air content in the permafrost core as 7.5 %, which is a mean value of the air fraction in ice-rich permafrost samples (Arenson and Springman, 2005b). At near 0 ∘C, the volumetric content of water (θw,core) displays a positive correlation with the debris fraction (θd,core) (Monnier and Kinnard, 2016). Thus, we determined the θd,core–θw,core relationship based on the data published in Monnier and Kinnard (2015) and assumed the constitution of the selected rock glaciers for model validation and application followed the same linear relationship (Fig. S1 in the Supplement). The debris density (ρd) was given as 2450 kg m−3 (Monnier and Kinnard, 2016). The density of air (ρa) is determined by the elevation of each rock glacier: for instance, rock glaciers situated between 2500 and 3500 m have an air density of 1007 kg m−3. The ice density (ρi) is 916 kg m−3 and the water density (ρw) is 1000 kg m−3.
For the flow law exponent (n), we first used an empirical average value as assumed in modelling pure ice creep:
We also adopted a linear relationship between n and the volumetric ice content (θi,core) based on laboratory experiments undertaken on borehole samples from two rock glaciers (Arenson and Springman, 2005a):
3.2 Model calibration
Combining Eqs. (9)–(11) with Eqs. (12) or (13), we formulated several expressions depicting the relationship between the surface velocity and properties of rock glaciers, including their composition, structure, and geometry. We then calibrated the model by using observational data for the Las Liebres rock glacier in the central Chilean Andes (Monnier and Kinnard, 2015) to determine the curve of best fit between the effective viscosity (B) and the volumetric ice content (θi,core). Las Liebres rock glacier has a permafrost temperature close to 0 ∘C (Monnier and Kinnard, 2016), according to the borehole measurement of a nearby rock glacier (Monnier and Kinnard, 2013). The calibration dataset includes information on structure (hcore and hal), geometry (α and Sf), and composition (θd,core, θa,core, θi,core, and θw,core), all of which were derived from ground-penetrating radar (GPR) measurements. Surface velocities (us) were provided by a differential global positioning system (DGPS) along the central creep line at 14 locations on Las Liebres rock glacier (Monnier and Kinnard, 2015, 2016). The limited calibration data play an important role in the calculation of the uncertainty associated with our approach (detailed in Sect. 5.1.1).
First, we adopted the exponential B–θi,core relationship estimated by Monnier and Kinnard (2016) with the same dataset and a constant creep parameter n (Eq. 12). Then by integrating the relationship between n and ice content (Eq. 13), we applied both a second-degree polynomial regression model and an exponential regression model to determine the B–θi,core relationship. The polynomial regression model is used to capture the subtle increase in effective viscosity when the ice fraction increases. This trend was also shown by Arenson and Springman (2005a), who suggested a parabolic relationship between the minimum axial creep strain rate and the volumetric ice content.
3.3 Model validation
The calibrated parameterisation schemes were validated using observational data from three rock glaciers in the Swiss Alps, namely Murtèl, Muragl, and Schafberg (Cicoira et al., 2019a; Arenson et al., 2002; Hoelzle et al., 1998). All of the selected rock glaciers have warm cores showing permafrost temperatures between −1 and 0 ∘C (PERMOS, 2019). We simulated the surface velocity (us) of each rock glacier by varying the volumetric ice content (θi,core) of the permafrost core. Then we compared the modelled velocity with the measured velocity from Terrestrial Geodetic Surveys (PERMOS, 2019). We then referred to the previously estimated ice content of the selected rock glaciers to validate our predicted results.
To derive the input parameters, we first outlined the boundaries of the three rock glaciers from Google Earth images (September of 2018), from which their shapes and areal extents can be extracted using Geographic Information System tools. As Muragl and Schafberg rock glaciers consist of multiple and/or overlapping lobes, in each of them we focus on a single active lobe for which borehole and composition data are available. The three rock glaciers selected for validation are tongue-shaped. An empirical relationship established by Brenning (2005b) was then applied to calculate the rock glacier thickness (T) from its areal extent (Arg):
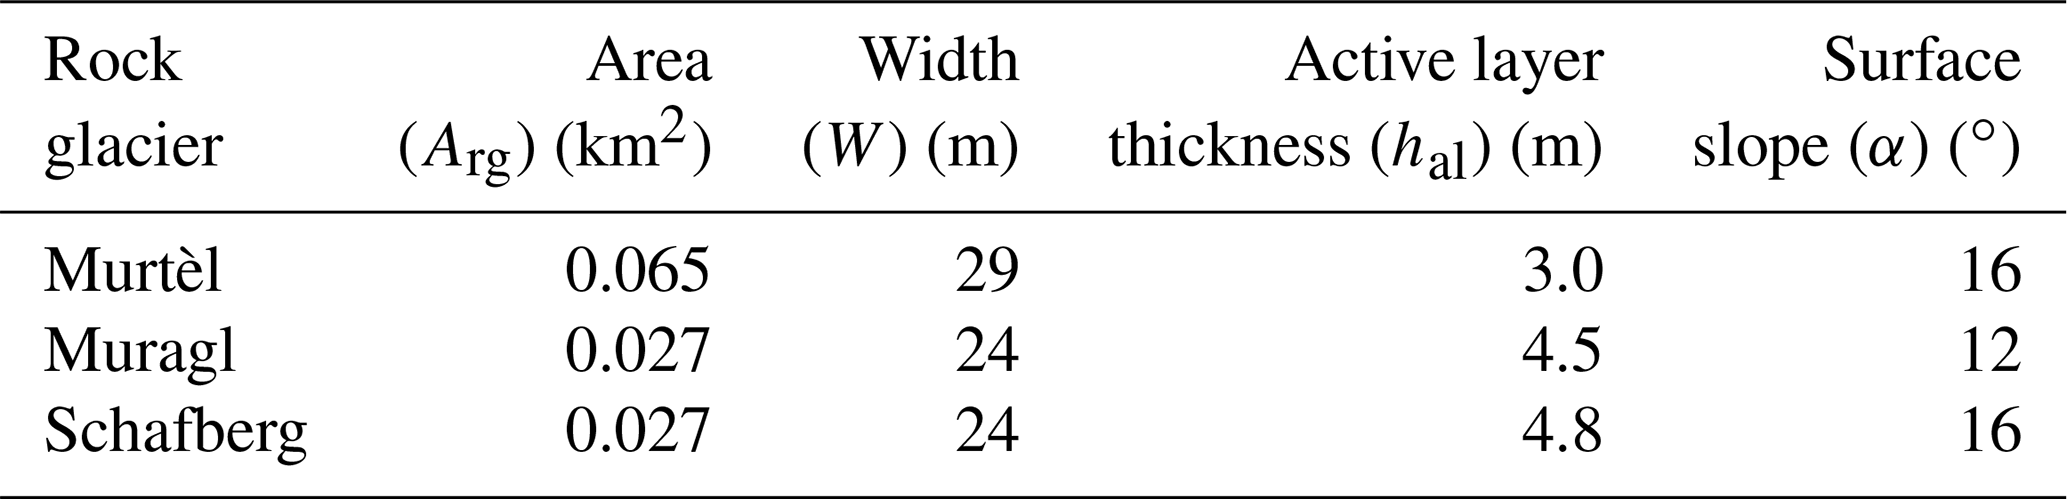
where the area (Arg) is in square kilometres (km2). We assigned a relative uncertainty of 40 % to the area parameter and considered the propagated error to the final modelling result. The width of each glacier was quantified as the width of its minimum envelop rectangle. We took the mean value of the active layer thickness obtained from borehole measurements in the PERMOS network as the input parameter hal for each rock glacier. The surface slope (α) was calculated based on the Shuttle Radar Topography Mission (SRTM) digital elevation model (DEM) with a spatial resolution of ∼ 30 m. Table 1 lists the values of the above parameters. The permafrost core thickness (hcore) can be obtained by subtracting hal from the total thickness T calculated using Eq. (14).
We assumed the volumetric ice content (θi,core) of the permafrost core to be between 40 % and 100 %, considering the prerequisites of the modified ice–debris mixture flow law (Eq. 3) that the debris fraction (θd,core) should be less than the threshold (θdc) (Sect. 3.1). We varied the ice content (θi,core) by 1 % in each step to model the corresponding surface velocities (us).
Table 1Summary of the geometric and structural parameters used in the validation.
3.4 Sensitivity analysis
To explore how uncertainties of the input parameters contribute to the final output of the developed approach, we tested the response of the model to varying input parameters by performing a series of synthetic sensitivity experiments. For these experiments, we simulated surface velocities of the rock glacier with variable ice fractions and inferred the current ice content from the velocity constraint. A reference scenario is set up with the parameters of Murtèl rock glacier and labelled as Sc-1.0. We designed eight scenarios extending from Sc-1.0, naming each scenario after a multiplication factor which indicates the ratio between the applied parameter and the reference scenario. For two parameters, namely debris density (ρd) and debris fraction in the active layer (θd,al), we applied a value range according to the known natural variability based on observations (ρd: 1450–3450 kg m−3; θd,al: 13 %–93 %). A full list of the parameters used in the sensitivity test is presented in Table S1 in the Supplement. We performed the sensitivity experiments by varying one parameter at a time while keeping the other variables constant.
3.5 Model application
The validated model with the optimal parameterisation Scheme (i.e. the one with the smallest inference bias, as detailed in Sect. 4.2) was applied to estimate ice content of rock glaciers with remotely sensed input data. In this subsection, we present our InSAR-based method to measure surface velocities of rock glaciers (Sect. 3.5.1) and use complementary remote sensing products to derive geometric and structural parameters (Sect. 3.5.2).
3.5.1 Deriving surface velocity constraints with differential InSAR
InSAR has been widely applied to quantifying surface velocities of rock glaciers (e.g. Strozzi et al., 2004; Bertone et al., 2022; Reinosch et al., 2021; Rouyet et al., 2019). In this study, we adopted the conventional two-pass differential InSAR method to derive the surface velocities by assuming rock glaciers creep along the slope direction (Liu et al., 2013; Wang et al., 2017). We identified the coherently moving part of the rock glacier and determined the surface velocity for constraining the model.
Step 1: interferometric processing
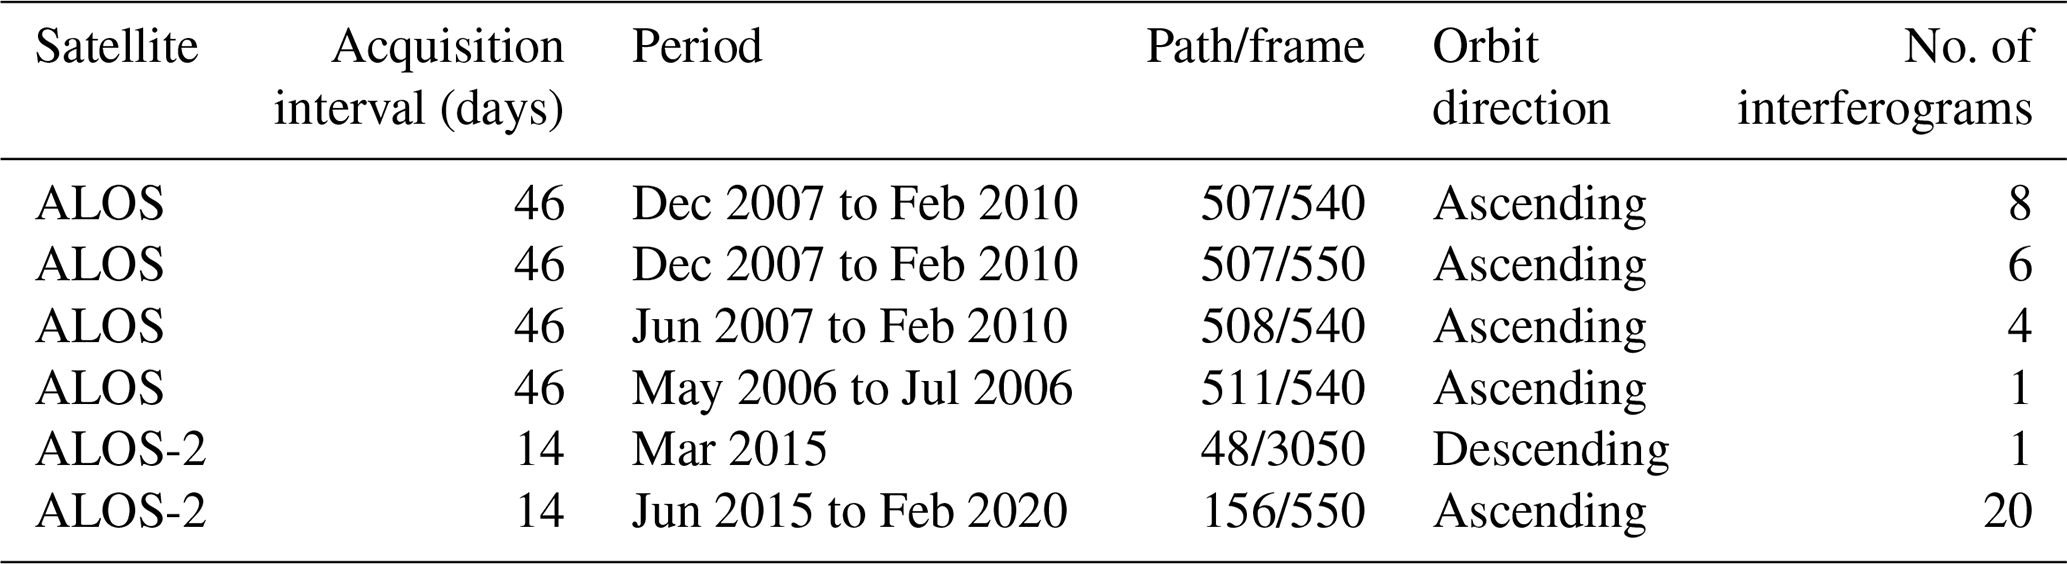
A total of 19 L-band ALOS PALSAR images and 21 ALOS-2 PALSAR-2 images acquired during 2006–2010 and 2015–2020, respectively, were used to form more than 50 interferograms to measure the surface displacements of the considered rock glaciers (Table 2). We selected interferograms to achieve high interferometric coherence by following criteria such as (1) short temporal spans (less than 92 d for ALOS pairs and 70 d for ALOS-2 pairs) and (2) short perpendicular baselines (smaller than 800 m for ALOS pairs and 400 m for ALOS-2 pairs). We estimated and removed the topographic phase with the 1 arcsec digital elevation models (DEMs) produced by the Shuttle Radar Topography Mission (SRTM) (a spatial resolution ∼ 30 m). Multi-looking operation and an adaptive Goldstein filter (8 × 8 pixels) were applied using the open-source software ISCE version 2.4.2 (available at https://github.com/isce-framework/isce2, last access: 17 November 2020). The final georeferenced interferograms have a ground resolution of ∼ 30 m. The interferograms were unwrapped using the SNAPHU software (Chen and Zebker, 2002). We randomly selected three pixels at places supposed to be stable outside but near each rock glacier (within 300 m) and averaged their phase values to re-reference the unwrapped phases measured within the rock glaciers. By doing so, atmospheric delays can be effectively removed because these lead to long-wavelength artefacts and can be assumed to be constant within the range of our study objects (Hanssen, 2001).
Step 2: calculating downslope velocities from high-quality interferograms
We then derived the surface velocities along the SAR satellite line-of-sight (LOS) direction from the unwrapped interferograms and projected the LOS velocities onto the downslope direction of the rock glaciers. The projection was conducted considering the satellite's flight direction, the local incidence angle, and the rock glacier topographic parameters including the aspect and slope angles (Massonnet and Feigl, 1998; Bechor and Zebker, 2006). We applied the projection to all pixels given that no steep slope occurs on the five rock glaciers of interest. We considered the propagation of errors introduced by the InSAR measurements and DEM data, which were used to determine the associated topographic parameters (Hu et al., 2021). For each interferogram, we quantified the uncertainty at the pixel level. Among all the highly coherent pixels, the largest uncertainty is 9.8 cm yr−1. The velocity uncertainty is therefore considered to be <10 cm yr−1.
To ensure high data quality, we selected the interferograms and documented rock glacier parts meeting the following criteria as valid results for further analyses: (1) only pixels showing acceptable coherence (>0.3) are kept, (2) the coherent pixels must cover more than 40 % of the rock glacier surfaces, and (3) the mean velocity of must be larger than 5 cm yr−1 (Wang et al., 2017). We set this empirical threshold considering the typical noise level from atmospheric delays (5 cm yr−1). Interferograms and rock glaciers that did not meet these criteria were discarded.
Step 3: determining the velocities of the coherently moving parts as the model constraint
Field observations have revealed that multiple areas moving differentially can occur on rock glaciers and exhibit complex kinematic patterns (e.g. Buchli et al., 2018), which violates the assumption of a continuously moving body (Sect. 3.1, Fig. 3). Therefore, we aim to identify the coherently moving part of the rock glacier that corresponds to our assumption and is thus suitable for model application.
After the procedure described in Step 2, for each selected rock glacier, the remaining interferograms constituted a series of observations spanning multiple years. Then we defined and outlined the “coherently moving part” of each rock glacier by considering the time series of the downslope velocity of each pixel acquired during the observational periods. If the InSAR-measured velocity was higher than 5 cm yr−1 in more than half of the interferograms, the pixel was included in the coherently moving part of the landform. Otherwise, the pixel was discarded, i.e. not included in the coherently moving part. The area was considered inactive or in a transitional kinematic status.
Then, we analysed the velocity values of all pixels within the coherently moving part of the rock glacier and selected the mean, median, and maximum values for each observation to characterise the surface kinematics. The mean velocity error is the square root of the quadratic sum of all the velocity errors (see the “Code and data availability” section), which is limited to <1 cm yr−1.
Finally, we take the range of the spatially averaged velocities within the coherently moving parts over the observational period as the velocity constraint for modelling ice content. By doing so, isolated patterns are neglected, assuming that they may be related to short-term fluctuations not representative of the multi-annual kinematic behaviour of the whole rock glacier.
Table 2List of ALOS PALSAR and ALOS-2 PALSAR-2 interferograms used in the study.
3.5.2 Deriving geometric and structural parameters from remote sensing products
Area, width, and slope angle are quantified using the same method as described in Sect. 3.3. Active layer thickness was determined as the mean value over the extent of each rock glacier based on the 2006–2017 estimate from the European Space Agency Permafrost Climate Change Initiative Product (ESA CCI) (Obu et al., 2020). The empirical relation for calculating rock glacier thickness used in the validation procedure (Sect. 3.3) was applied here to obtain the thickness parameter. The surface velocity constraint is the range of InSAR-derived downslope velocity during the observed period, except for the Tobuche rock glacier for which the abnormal value in 2015 has been removed from the range (see Sect. 4.4.1 for details).
In this section we first present the results of our model development including the calibrated parameterisation schemes (Sect. 4.1), model validation (Sect. 4.2), and model sensitivity (Sect. 4.3). Then we report the modelled ice content in the Khumbu and Lhotse valleys (Sect. 4.4).
4.1 Calibrated parameterisation schemes
By applying the different regression models to depict the B–θi,core relationship (Fig. 4a–c), we obtained three candidate parameterisation schemes expressed as
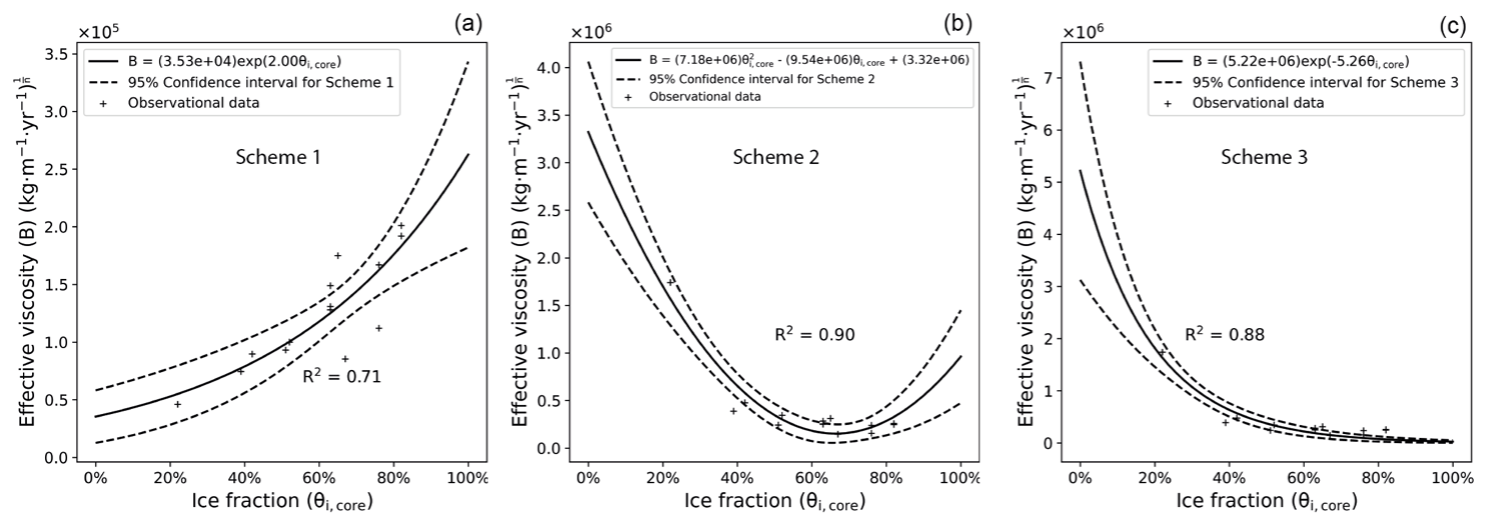
Figure 4(a–c) Relationships between the ice fraction (θi,core) and the effective viscosity (B) estimated from the three regression equations and parameterisation schemes (Eqs. 15, 16, and 17, respectively). The observational data are derived from the GPR and DGPS measurements by Monnier and Kinnard (2015, 2016).
4.2 Model validation
We simulated the surface velocities (us) of the three rock glaciers using Schemes 1–3. Uncertainties from the statistical analysis (dashed lines in Fig. 4) and area delineation (Sect. 3.3) have been considered in the simulation. We used the mean annual surface velocities, calculated from the Terrestrial Ground Survey data (PERMOS, 2019), as the constraint for inferring the ice content.
For each rock glacier, an inferred ice content range is derived based on the velocity constraint and modelled us–θi,core relationship. The median of the range is selected as the inferred ice content and compared with the reference ice content, i.e. the average value of the estimated ice content based on previous field measurements (Cicoira et al., 2019a; Arenson et al., 2002; Hoelzle et al., 1998).
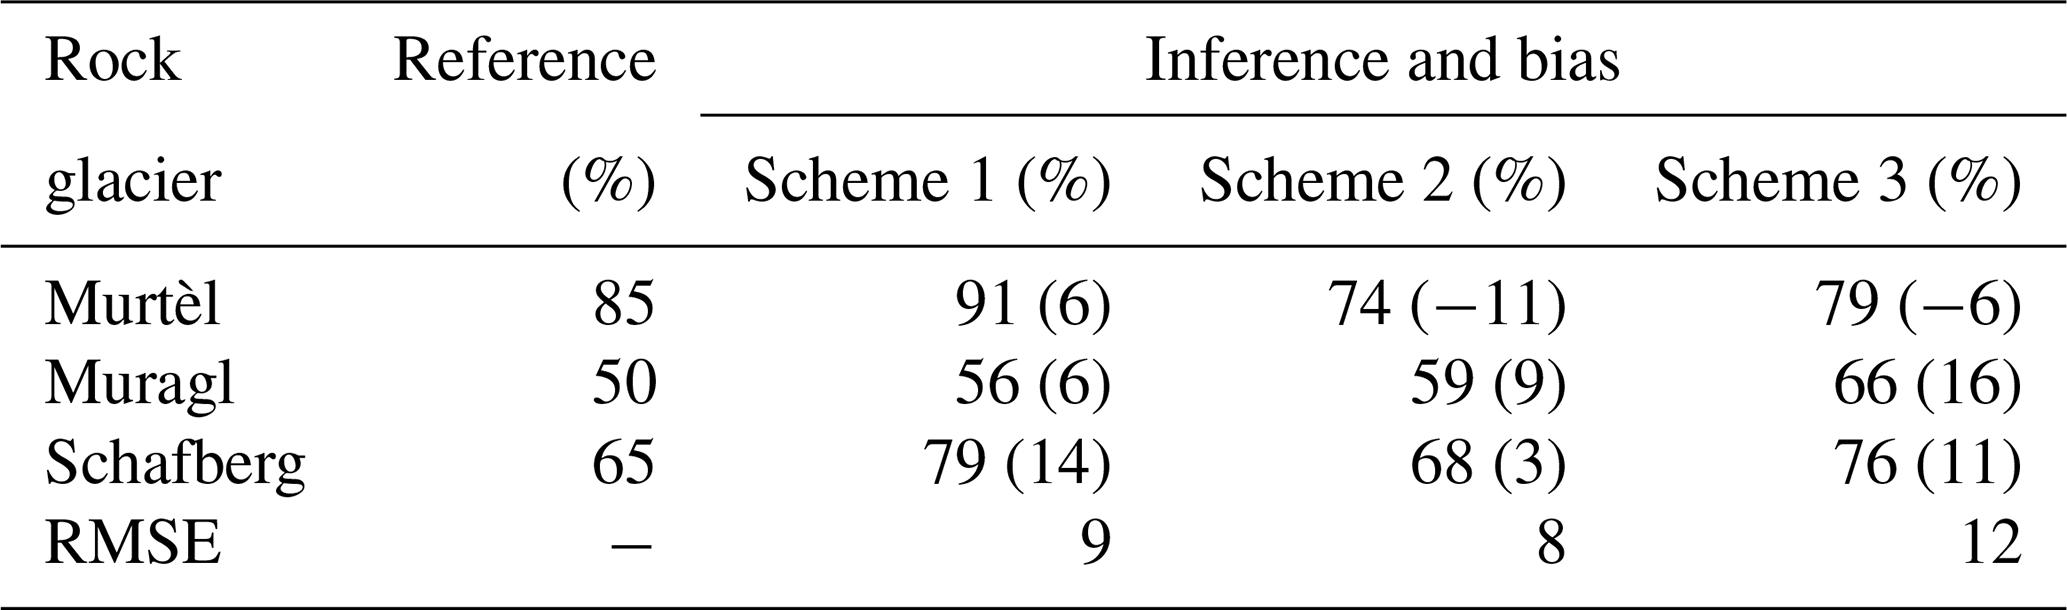
Comparing the observed and modelled ice content from the three schemes, we see that Scheme 2 is the optimal model for the following two reasons: (1) the reference ice content is within the range inferred from Scheme 2 (Figs. 5, S2, and S3), and (2) Scheme 2 gives the smallest root mean square error (RMSE) (8 %) compared with Scheme 1 (9 %) and Scheme 3 (12 %) (Table 3). We used the RMSE (8 %) derived from Scheme 2 to represent the uncertainty of our approach.
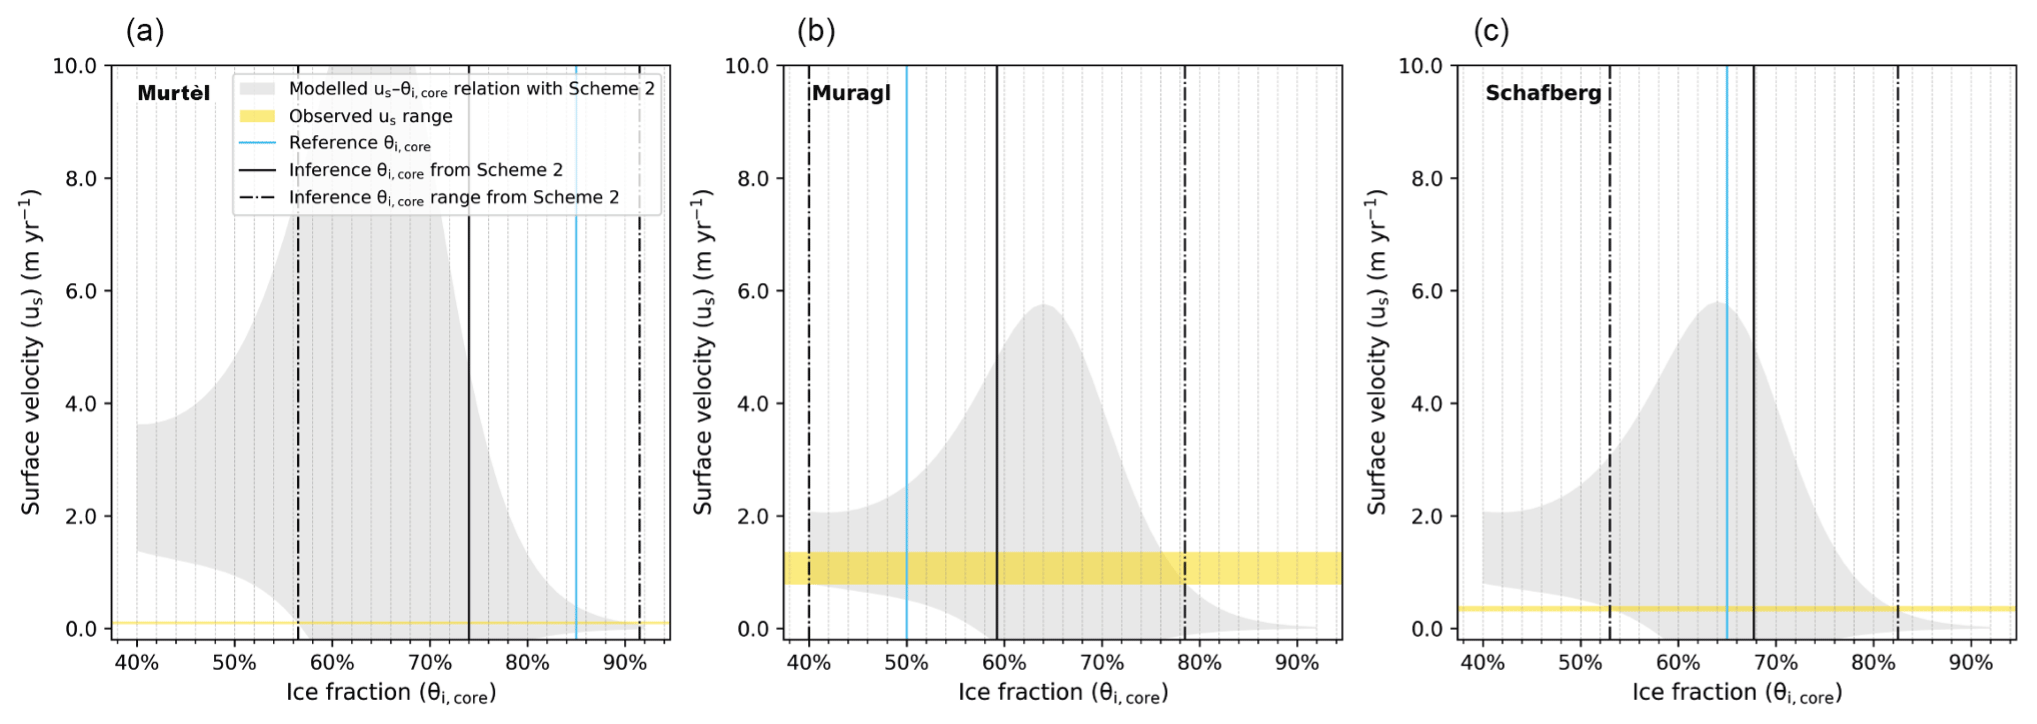
Figure 5Modelled relationships (grey shaded areas) between the ice fraction (θi,core) and the surface velocity (us) of 95 % confidence intervals for the three RGs monitored in the PERMOS network with model parameterisation Scheme 2. The yellow bands show the observed surface velocities, and the blue lines denote the reference ice contents. For each rock glacier, the intersection between the simulated θi,core–us relationship (grey shaded area) and the observed velocity (yellow band) gives the estimated range of ice content, as marked by the dash-dotted black lines. We take the average as the inferred ice content, as shown by the solid black line.
Table 3Summary of the reference and inference ice contents derived from the three model parameterisation schemes. The values in brackets following the inference ice contents give the corresponding bias from the reference ice contents. The last row presents the root mean square error (RMSE) of the schemes.
4.3 Model sensitivity
The results of the sensitivity experiments are normalised to the corresponding values of the reference scenario (Scn-1.0, Fig. 6). We observe that the inference result remains stable in response to most varying parameters, with a bias of less than 5 %, relative to the reference scenario (Scn-1.0). The model has a higher sensitivity to the surface slope angle. In the extreme scenario (Scn-0.2), the inferred ice content can be altered by 15 %. In non-extreme cases (e.g. Scn-0.8, Scn-0.6), the influences of varying slope angles can be well constrained within the 5 % range. In general, the model is mostly insensitive to the uncertainties of any single input parameter.
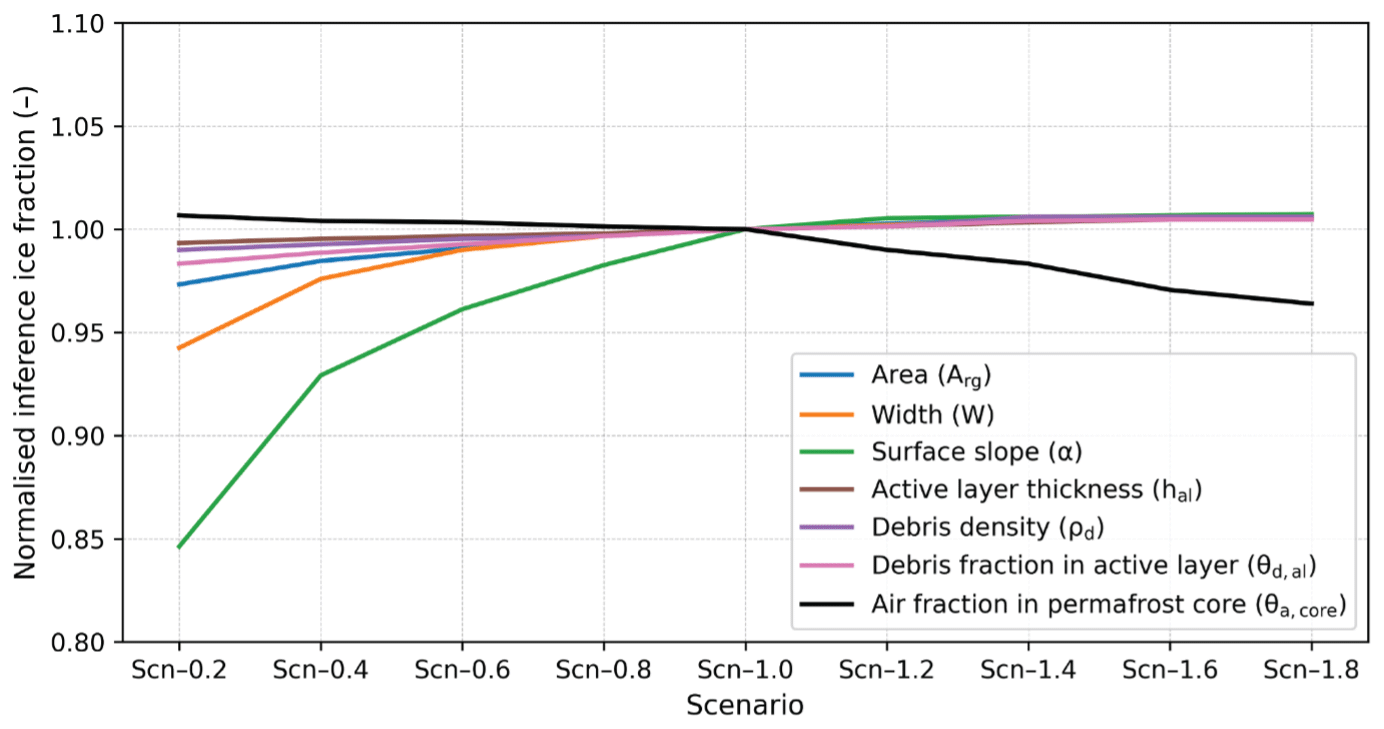
Figure 6Normalised inference ice fractions from sensitivity experiments with different parameter scenarios. The varying parameters include rock glacier area (blue line), width (orange line), surface slope (green line), active layer thickness (brown line), debris density (purple line), debris fraction in the active layer (pink line), and air faction in permafrost core (black line).
4.4 Modelled ice contents in Khumbu and Lhotse valleys
In this subsection, we summarise the characteristics of InSAR-derived surface velocities we used as model constraints (Sect. 4.4.1) and present the modelled ice content of the five rock glaciers in the study area (Sect. 4.4.2).
4.4.1 InSAR-derived surface velocities as model constraints
We used InSAR to derive the downslope surface velocities of five rock glaciers situated in the study region. Figure 7 shows the time series of the InSAR-derived surface velocities of the coherently moving sections of the rock glaciers. By selecting the mean velocity as the representative value, most rock glaciers, except for Tobuche, moved at a nearly constant rate, ranging from 5 to 30 cm yr−1 during the observational period, with the largest standard deviation being 3.4 cm yr−1 for Lingten (Fig. 7d). The maximum velocity represents the local extreme of the downslope rate and was as high as 112.1 ± 12.4 cm yr−1 for Lingten during 12 July–26 August 2019 (Fig. 7d). Tobuche displayed similar behaviour before 2010 but accelerated by more than 4 times from 14.9 ± 0.2 to 81.4 ± 2.4 cm yr−1 between 2010 and 2015 (Fig. 7e). The maximum velocity reached was 181.0 ± 57.4 cm yr−1 for the period 18–22 March 2015 (Fig. 7e). However, the associated uncertainties during this period were high: the relative uncertainties of mean, median, and maximum velocity were 2.9 %, 38.2 %, and 31.7 %, respectively. The acceleration of Tobuche cannot be confidently revealed by our data, and the 2015 acquisition was therefore discarded from the velocity series used as modelling constraints. The extents of coherently moving parts of the five rock glaciers are presented in Fig. 8, with the average velocities derived from the interferograms obtained during the observation period.
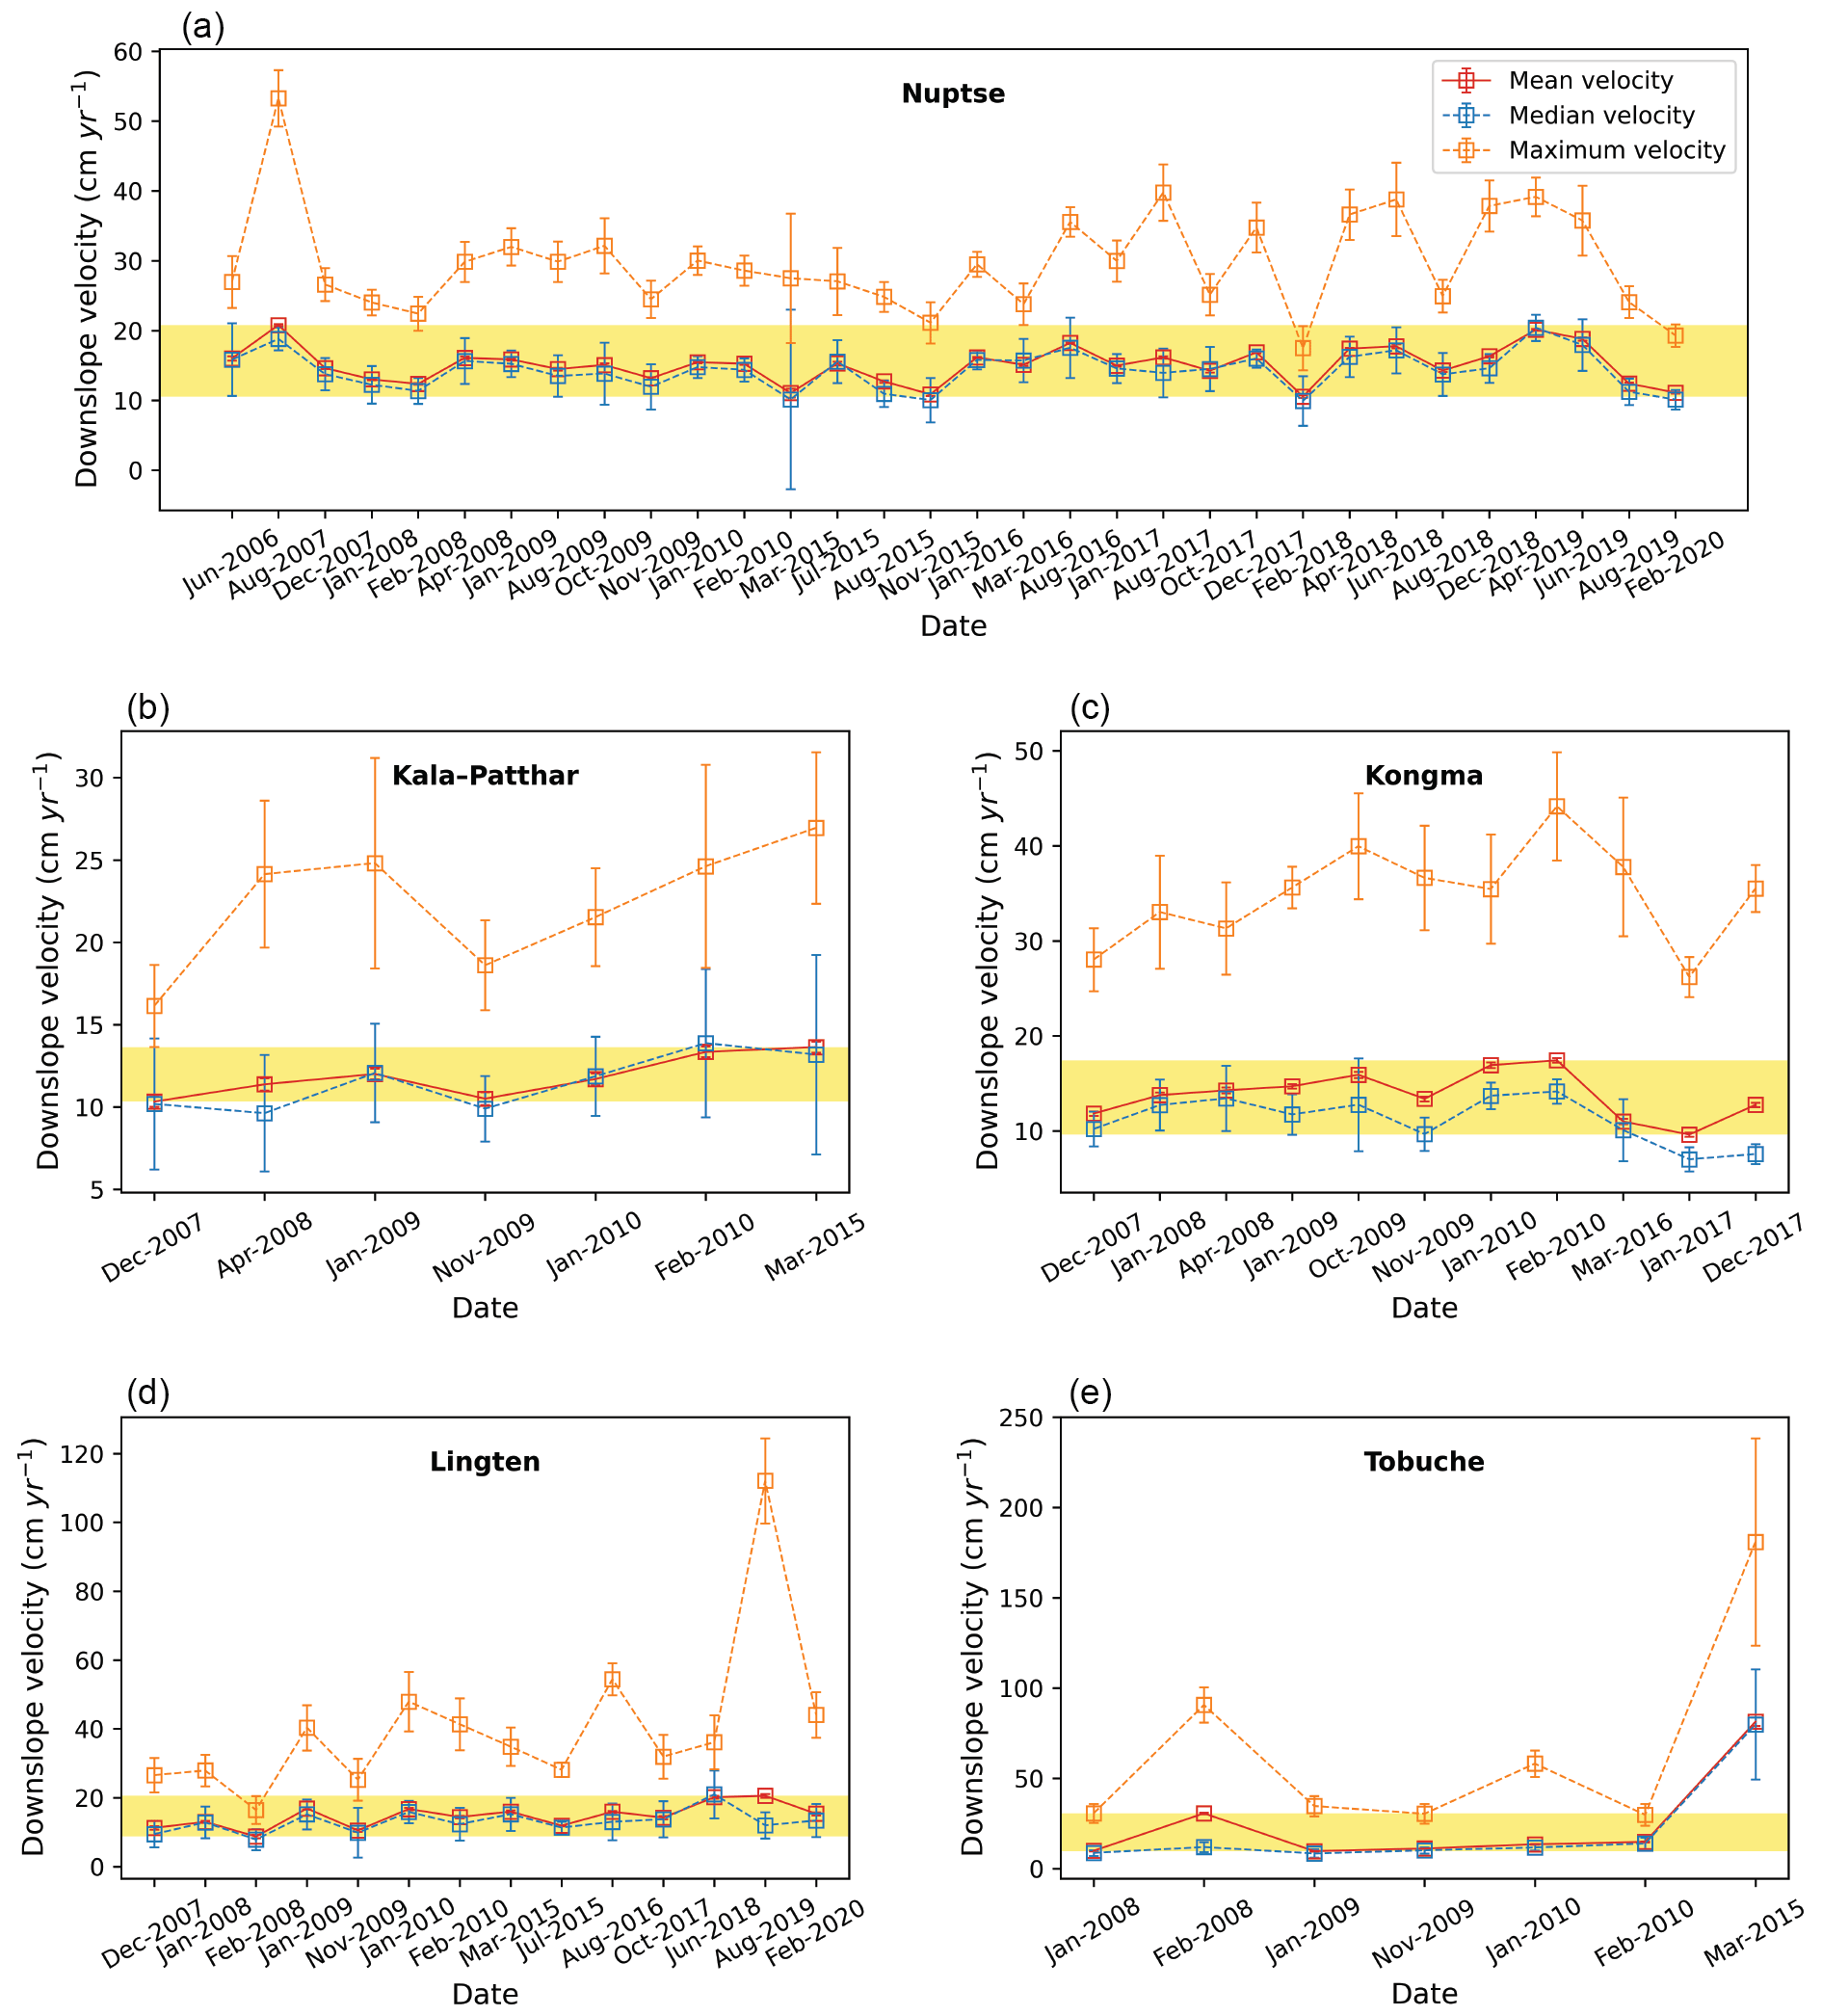
Figure 7Time series of the InSAR-derived downslope velocities of the rock glaciers. The spatial mean velocities and uncertainties during each period are shown (red squares and error bars) as are the median (blue) and maximum (orange) velocities. The yellow bands highlight the range of the mean velocities, which were used as model constraints to estimate ice fractions.
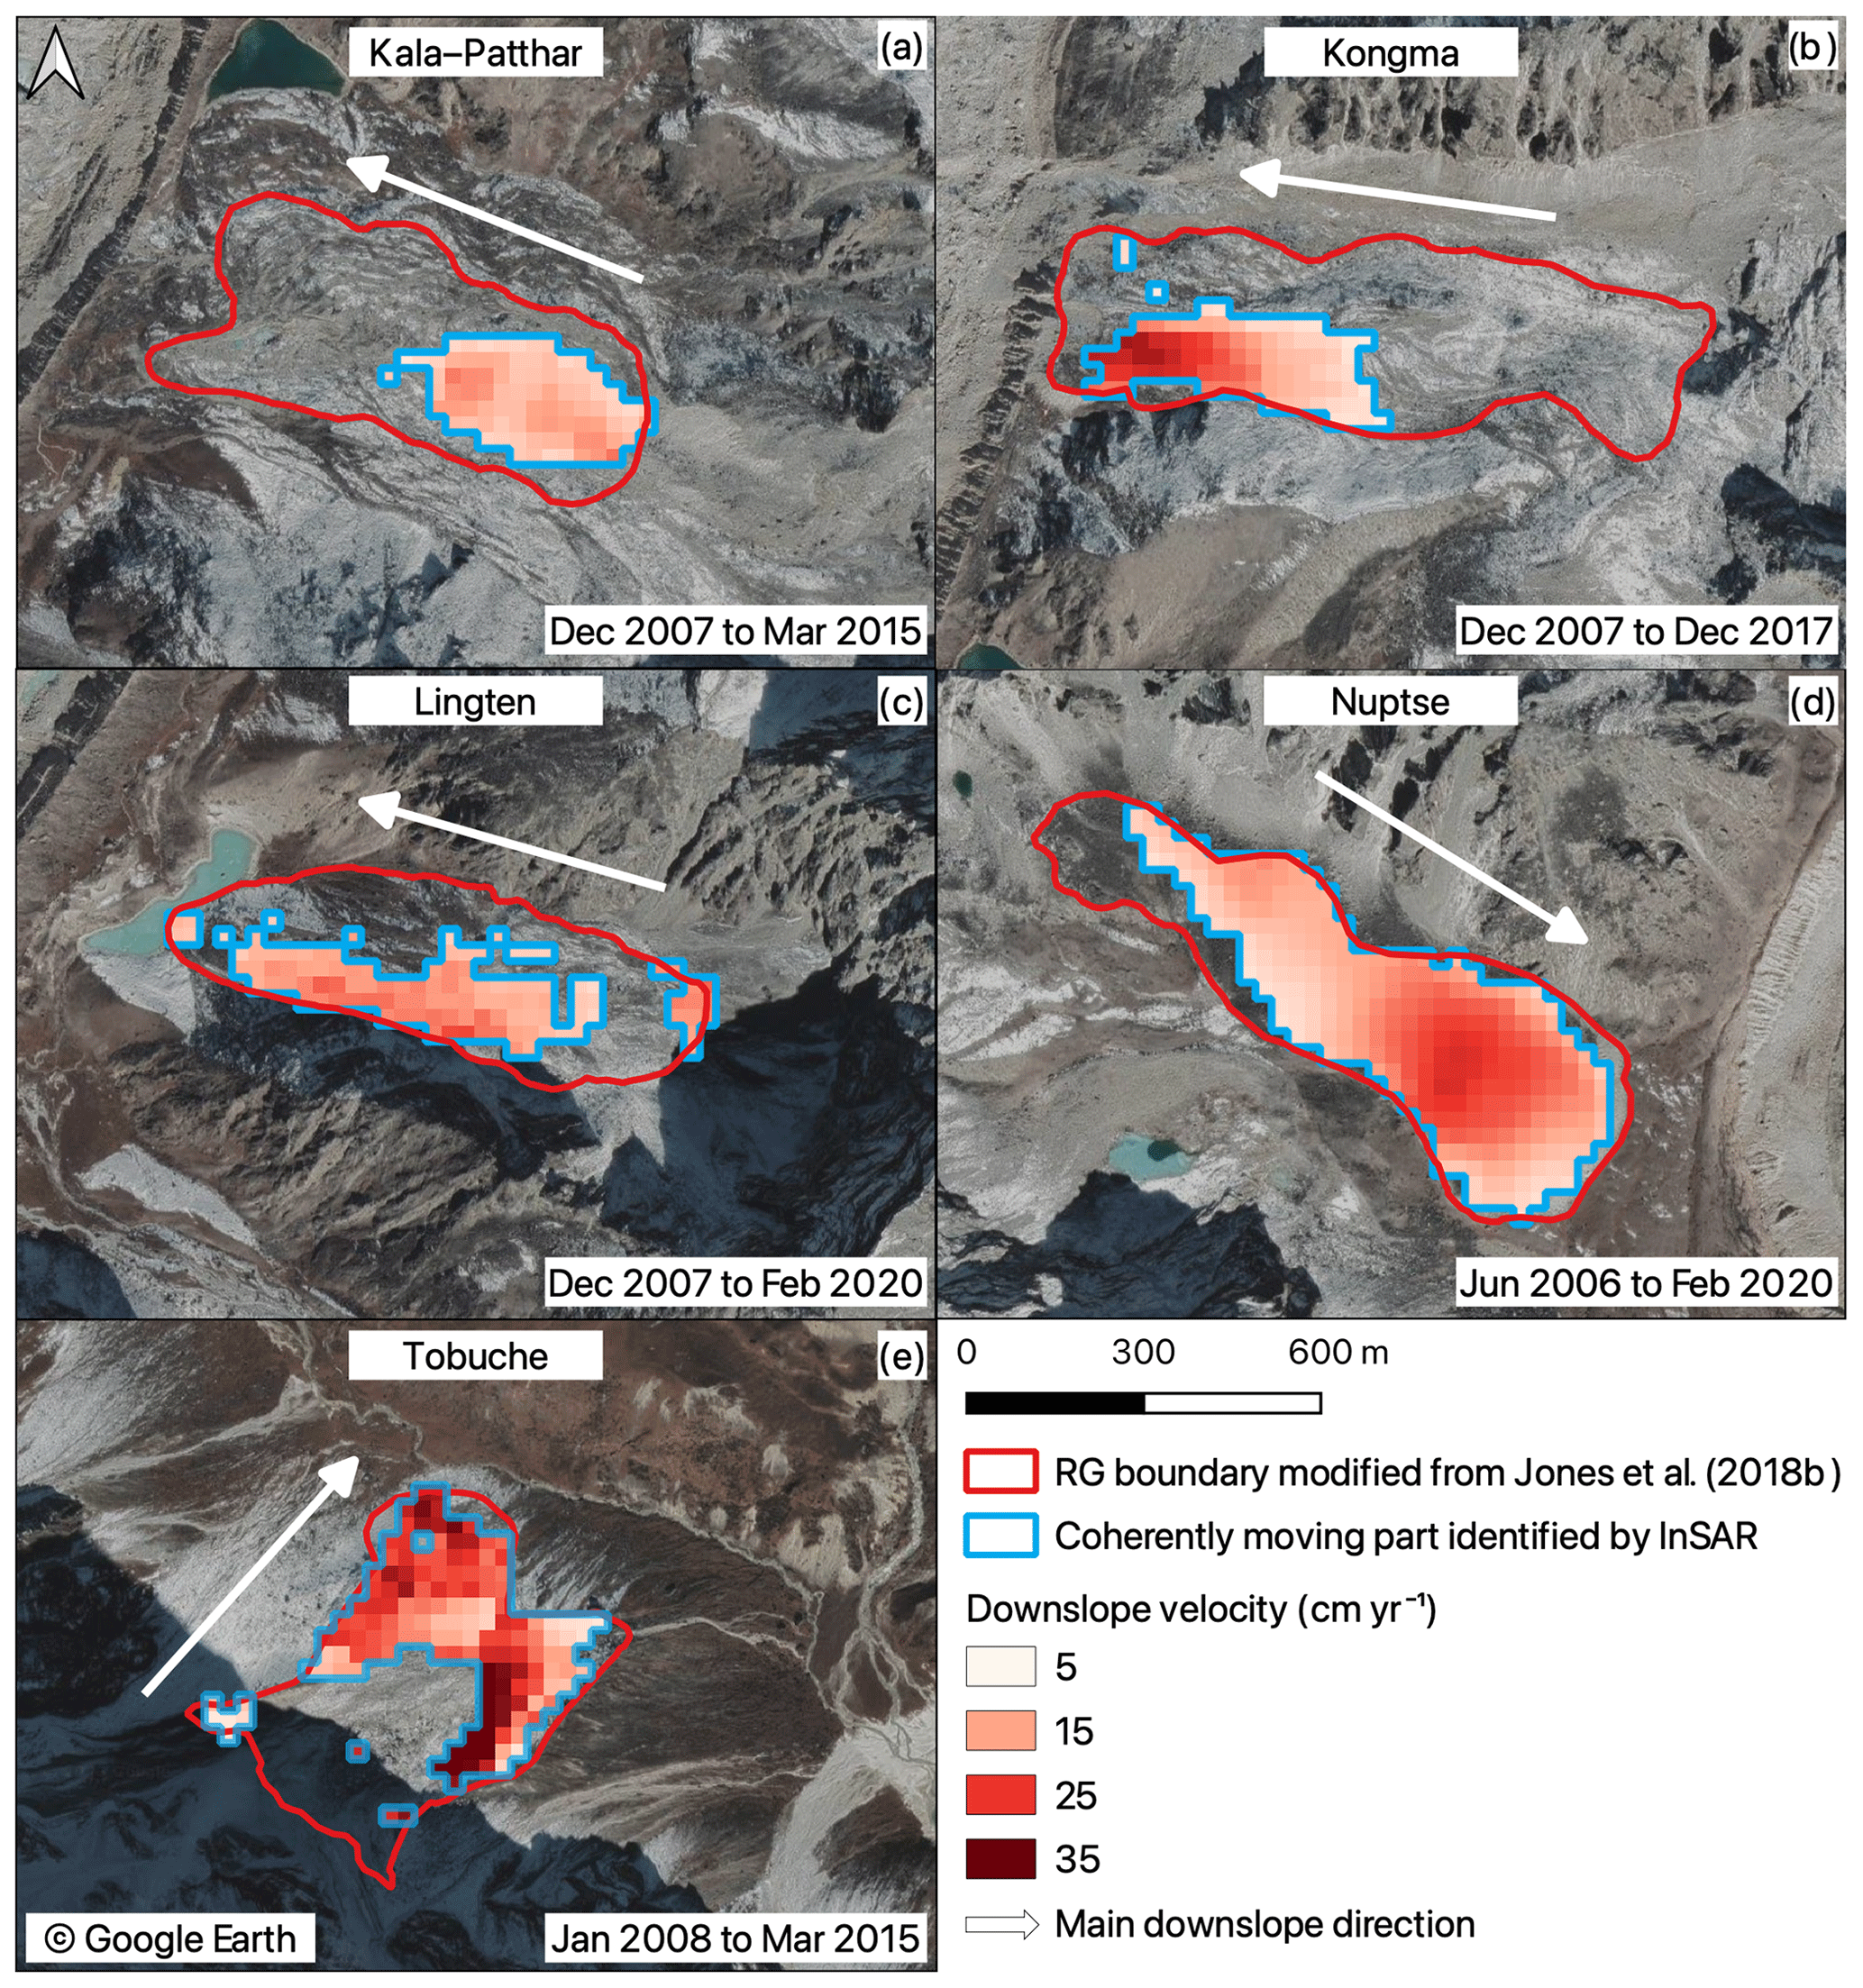
Figure 8Velocity field maps showing the average velocities of the coherently moving parts of the five rock glaciers (blue outlines) in the study area. The boundaries of the rock glaciers delineated in Jones et al. (2018b) are plotted in red. The transparent areas between the red and blue boundaries are due to low coherence or low velocity during the observational periods.
4.4.2 Modelled ice content
The geometric and structural data used as input parameters are detailed in Table 4. The five rock glaciers are tongue-shaped features and their areal extents are substantially larger than the three validation rock glaciers (Tables 1 and 4). Figure 9 and Table 4 present the inference ice contents of rock glaciers based on Scheme 2 in the study area. Considering the error of the modelling results (Sect. 4.2, Table 3), the inferred average ice fractions of the coherently moving parts of the rock glaciers range from 70 ± 8 % to 74 ± 8 %; the water volume equivalents of the moving parts of individual rock glaciers, which are calculated based on the ice fractions and the volume of the moving parts, range from 1.4 ± 0.2 to 5.9 ± 0.6×10⁶ m3. Nuptse stores the most ice by volume due to having the largest dimensions (Table 4). The total amount of water stored in rock glaciers in our study area lies between 12.1 and 15.1 × 10⁶ m3, with an average value of 13.6 × 10⁶ m3.
Table 4Summary of the geometric and structural parameters as well as the inferred ice content of the coherently moving parts of rock glaciers in the study area.
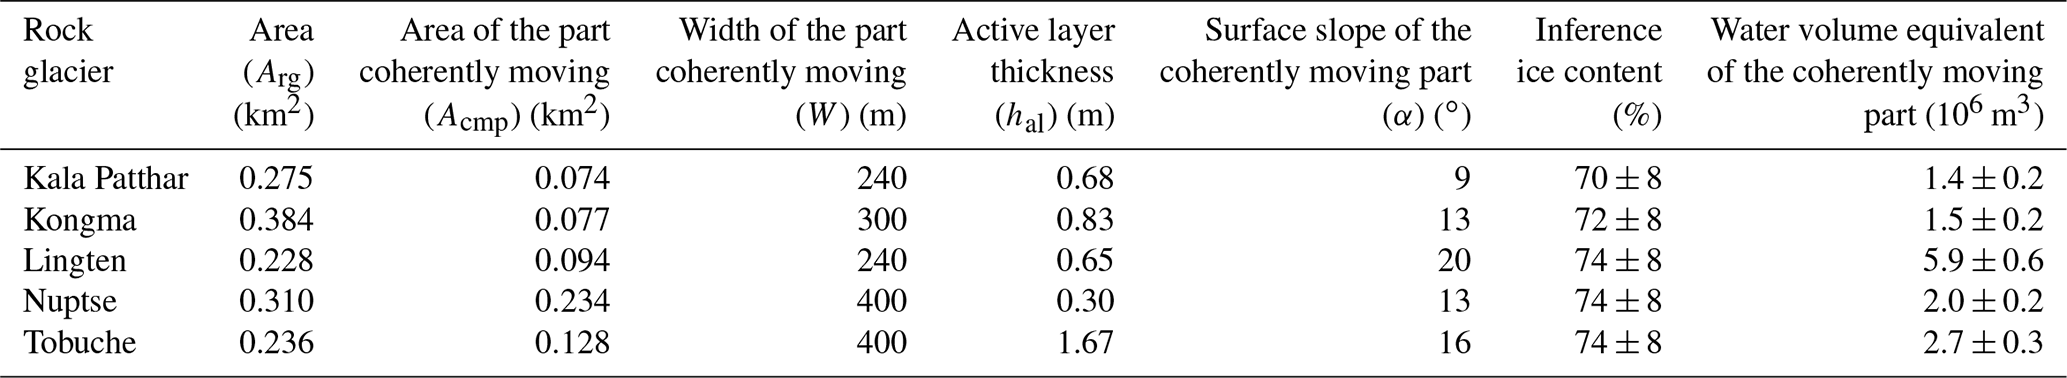
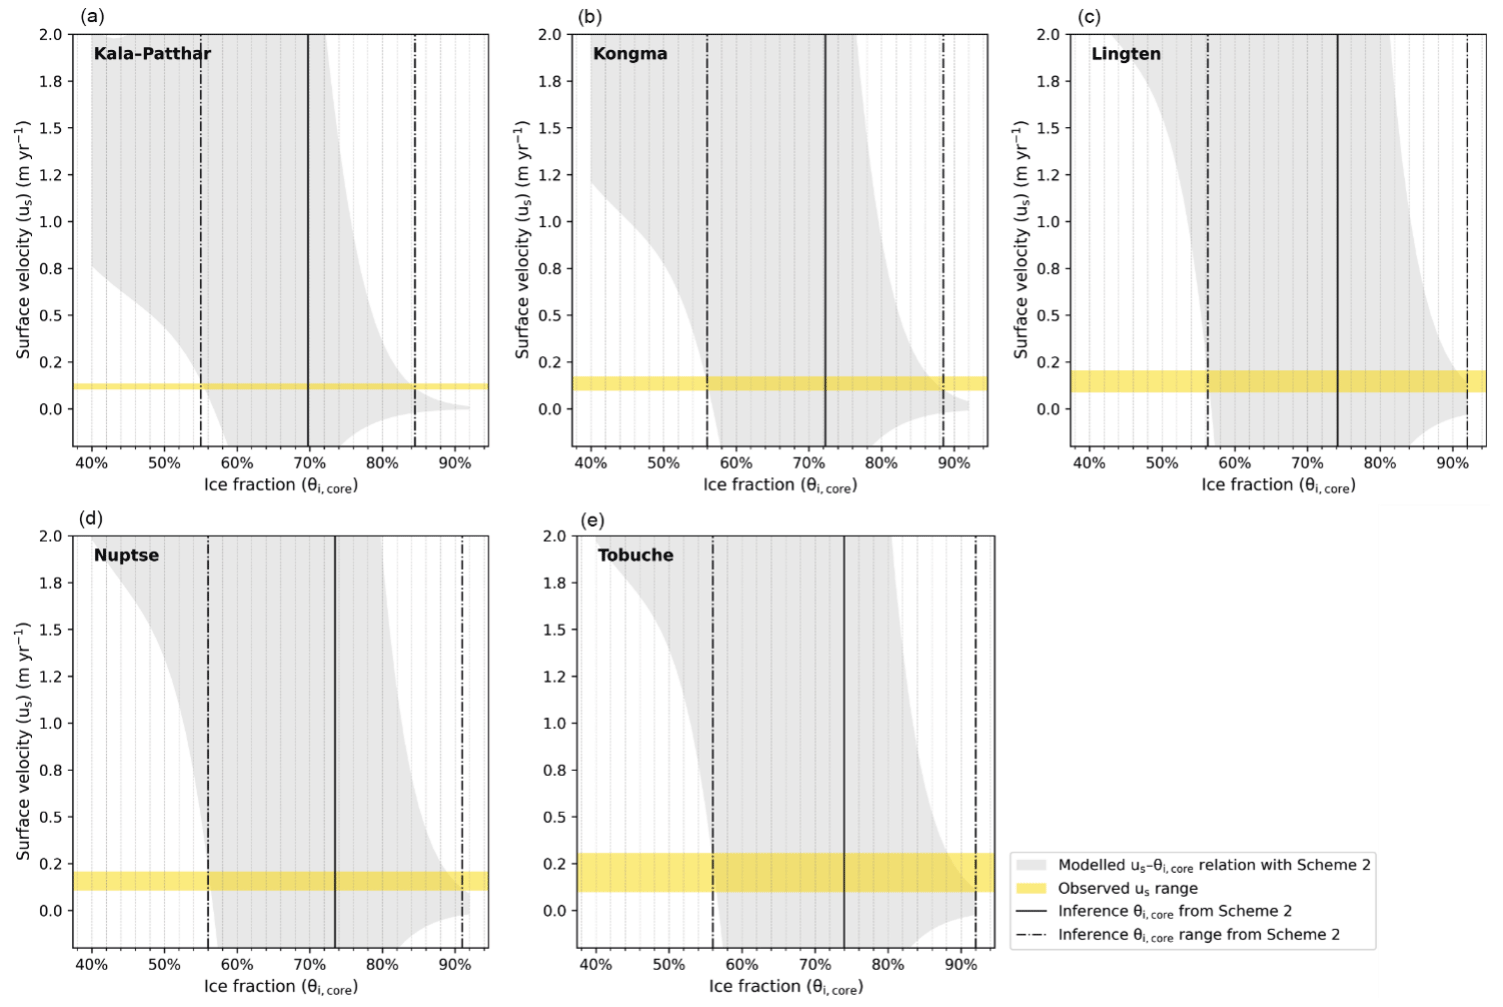
Figure 9Modelled relationships between the ice fraction (θi,core) and the surface velocity (us) of 95 % confidence intervals for the five RGs in Khumbu Valley with model parameterisation Scheme 2 (grey shaded areas). The ranges of the InSAR-derived velocities (yellow bands) are used as the velocity constraints for inferring ice contents from the modelled relationships. The upper and lower boundaries of the estimated ice contents are within the range outlined by the dash-dotted black lines, and the solid black lines show the mean values representing the inference ice contents.
In this section, we first discuss the two major sources of uncertainties in our approach, namely the amount of field data for model calibration (Sect. 5.1.1) and the derivation of rock glacier thickness (Sect. 5.1.2). Then we introduce two limitations of the model application including the incapability of predicting ground ice evolution (Sect. 5.2.1) and the limited application to rock glaciers in quasi-steady-state motion (Sect. 5.2.2). We conclude the discussion by summarising the contribution of this study in relation to previous research as well as the potential improvements and application prospects of the approach (Sect. 5.3).
5.1 Major uncertainty sources
The effects of minor error sources were tested and discussed in Sect. 4.3. Here we present two major uncertainty sources.
5.1.1 The amount of field data for model calibration
The empirical relationship between the effective viscosity and ice content is fundamental to model calibration in this study (Sect. 3.2). Currently, the amount of field data for deriving the statistical relationship is limited due to a lack of detailed knowledge of rock glacier composition, which is the most important factor affecting the accuracy of our approach.
We rely on the geophysical data obtained from Las Liebres rock glacier in the Andes to calibrate the model (Monnier and Kinnard, 2015) and hypothesise that the empirical expressions can be generalised to rock glaciers developed in a warm permafrost environment. The validation results achieved from samples in a different region, i.e. the Swiss Alps, prove the transferability of the model (Sect. 3.3). However, due to the limited amount of calibration data (14 measurements in total), the uncertainty of the derived effective viscosity–ice fraction relationship (dash lines in Fig. 4b) leads to a wide range of propagated uncertainty when modelling the ice content–surface velocity relationship (grey shadings in Fig. 5). More field data are necessary to accurately represent this empirical relationship.
5.1.2 Derivation of rock glacier thickness
We discuss the uncertainty in deriving rock glacier thickness because it influences the surface velocities most significantly. As shown in Eq. (8), the surface velocity is proportional to the thickness to the power of n+1, resulting from the vertical integration of Eq. (7). We use the thickness–area scaling relationship (Eq. 14, Brenning, 2005a), which has also been adopted by previous research on assessing the hydrological importance of rock glaciers (e.g. Azócar and Brenning, 2010; Bodin et al., 2010; Janke et al., 2017; Jones et al., 2018a, 2021; Perucca and Esper Angillieri, 2011; Rangercroft et al., 2015; Wagner et al., 2021), yet the reliability of this empirical derivation method has generated discussions (Arenson and Jakob, 2010; Brenning, 2010). Wagner et al. (2021) suggested an adapted relationship by subtracting 10 m from the derived thickness to remove the likely overestimation effect. An alternative empirical method is proposed as a linear relationship between surface slope angle and thickness (Cicoira et al., 2020). We compared the estimated thickness of the validated rock glaciers from the classical thickness–area and the recently established thickness–slope relationships with the field measurements and found that the two sets of results display the same level of error (∼ 2 m, Table S2).
In the validation part, we estimated the thickness-related error by considering the uncertainty involved in delineating the rock glacier area based on Google Earth images. The uncertainties were caused by multiple factors such as the variable image quality, the subjective judgement of operators, and the complexity of the rock glacier morphology (Brardinoni et al., 2019; Schmid et al., 2015; Way et al., 2021). We assumed a 40 % uncertainty in the area parameter, leading to a ∼ 10 % error (or an absolute error of 2–4 m) in thickness. In addition, we conducted an analysis assuming a more significant thickness error according to previous studies (Cicoira et al., 2020; Wagner et al., 2021), i.e. 6 and 10 m, and obtained errors in ice content of 12 % and 13 %, respectively, which are greater than the 8 % uncertainty in our results (Figs. S4 and S5; Table S3).
In general, accurately quantifying the uncertainty in deriving rock glacier thickness remains challenging, which is primarily attributed to the scarcity of ground-truth data to build a rigorous relationship between the rock glacier thickness and surface parameters (e.g. area, slope). In addition, rock glaciers, especially the talus-derived ones, tend to develop very variable thicknesses across the rock glacier, the distribution of which cannot be inferred using the existing empirical approaches. Thus, the uncertainty introduced by thickness derivation cannot be eliminated when applied to rock glaciers without known structural information.
5.2 Limitations of the model application
5.2.1 Incapability of predicting ground ice evolution
Our approach is not applicable to predict the evolution of ground ice in rock glaciers. Our results are presented in the form of a modelled relationship between the ice content and surface velocity (as shown by the grey shading in Figs. 5, S2, S3, and 9), which might mislead readers to interpret the ground ice changes from rock glacier kinematic variations. For instance, assuming that the surface velocity of Kala Patthar rock glacier reaches 1 m yr−1, the corresponding ice fraction would be approximately 60 % (detailed in Fig. S6 in the Supplement). However, we cannot draw the conclusion that ground ice stored in Kala Patthar rock glacier would decrease by 10 % if it accelerated to 1 m yr−1 because the geometric parameters of the rock glacier would change accordingly, particularly the thickness of the permafrost core and the active layer, making the current modelled relationship no longer valid.
In the proposed approach, we assume that the amount of ice stored in rock glaciers remains constant within the timescale of our study (1–2 decades, constrained by InSAR data), which is consistent with the fact that rock glaciers are currently not a major contribution to surface runoff in the study area (Duguay et al., 2015; Jones et al., 2019b). Landforms undergoing rapid changes in ice content and corresponding morphology, such as transitional features from glaciers to rock glaciers, are beyond the applicability of our model.
5.2.2 Limited application to rock glaciers in quasi-steady-state motion
By using the adapted form of Glen's flow law (Eq. 2), we primarily assumed the rock glacier movement to be steady-state creep driven by viscoelastic deformation of the ice–debris mixture (Moore, 2014). This premise indicates that our method is applicable to rock glaciers currently moving at a relatively constant rate. Recent research has reported abrupt and significant acceleration of rock glaciers triggered by abnormal surface warming events (Delaloye et al., 2013; Scotti et al., 2017). These destabilised rock glaciers are beyond the applicability of our method. In this study, we measure surface velocities of rock glaciers over multiple years to consider an average rate and avoid misleading conclusions based on short-term patterns.
Particularly, our model is suitable to be applied to the coherently moving part. Some parts of rock glaciers are in a transitional kinematic status (practically defined as velocities <5 cm yr−1) or behave differently from the coherently moving parts. The 1D InSAR method may fail to detect some moving areas of the rock glaciers creeping nearly along the satellite's flight direction due to the lack of sensitivities of the LOS geometry. These parts may also contain ice but are excluded from our estimation, causing some possible underestimation of ground ice storage.
Additionally, the motion of rock glaciers affected by significant subsidence (instead of or in addition to downslope creep) cannot be measured accurately due to the limitation of the 1D InSAR method: we converted the LOS measurements to surface velocities by assuming the rock glacier moves downslope without additional subsidence component.
5.3 Contribution and prospect of the approach
We present a model framework to infer ice content from remote-sensing-based input by taking advantage of existing observational data. Deriving ice content for rock glaciers relies on costly and labour-intensive in situ methods, such as borehole drillings and geophysical surveys, to accurately measure the ice content of individual rock glaciers (e.g. Haeberli et al., 1998; Hauck, 2013) or on categorised estimates for regional-scale studies (e.g. Jones et al., 2018a, 2021). Our approach allows quantitatively estimating the ground ice stored in individual rock glaciers by applying it to region-wide rock glacier inventories.
The proposed approach can be further improved. The likely emergence of more data to be integrated for model calibration and validation will allow for improving the accuracy of the method. A more accurate 2D surface velocity can be obtained by using multi-track InSAR data (e.g. Bertone et al., 2022; Zhang et al., 2021), allowing us to apply the model to rock glaciers with a complex velocity field.
We developed an empirical rheological model to infer ice content of the coherently moving parts of rock glaciers and apply it to estimate the water storage of rock glaciers situated in the Khumbu and Lhotse valleys using surface velocities derived from InSAR measurements. The main findings are summarised as follows.
-
An empirical rheological model is presented in this study to estimate the ice content of rock glaciers using five input parameters, namely rock glacier area, width, surface slope angle, active layer thickness, and surface velocity, all of which can be obtained from readily available remote sensing products or forthcoming datasets.
-
Mean downslope velocities in the coherently moving parts of five rock glaciers situated in the Khumbu and Lhotse valleys ranged from 5 to 30 cm yr−1 and remained (with an exception for the Tobuche rock glacier) constant during the observational period (2006–2020).
-
The inferred average ice contents of rock glaciers in the Khumbu and Lhotse valleys range from 70 ± 8 % to 74 ± 8 %; the water volume equivalent ranges from 1.4 to 5.9 ×10⁶ m3 for individual rock glaciers. The Nuptse rock glacier stores the most ice due to having the largest dimensions among the five studied rock glaciers. The total amount of water stored in the five rock glaciers in Khumbu and Lhotse valleys ranges from 12.1 ± 0.2 to 15.1 ± 0.6 ×10⁶ m3, with an average value of 13.6 ×10⁶ m3.
This study develops an approach to infer ice content of rock glaciers by using a surface-velocity-constrained model. The estimated ice content and water storage in the study area confirm the hydrological significance of rock glaciers in the Nepalese Himalaya. We argue that the model shows great promise for assessing ice storage in rock glaciers, although more field data are needed to improve the reliability of this initial modelling framework.
The source code of ISCE is available at https://github.com/isce-framework/isce2/releases/tag/v2.4.2 (isce-framework, 2020). The ALOS PALSAR and ALOS-2 PALSAR-2 data are copyrighted and provided by the Japan Aerospace Exploration Agency through the EO-RA2 project ER2A2N081. Data for the rock glacier kinematics in the Swiss Alps are available at https://doi.org/10.13093/permos-2021-01 (Swiss Permafrost Monitoring Network PERMOS, 2021). The ESA CCI permafrost data are available at http://catalogue.ceda.ac.uk/uuid/1f88068e86304b0fbd34456115b6606f (Obu et al., 2020). The code of the modelling approach for estimating ice content will be provided by Yan Hu upon request.
The supplement related to this article is available online at: https://doi.org/10.5194/tc-17-2305-2023-supplement.
YH developed the code, performed the data analysis and interpretation, visualised the results, and wrote the majority of the paper. SH conceptualised the research goal, supervised the study, and wrote Sect. 1 of the draft. LL advised YH and actively helped the investigation process. JLW helped formulate the initial framework of the method and collect research data. All the authors contributed to the reviewing and editing of the paper.
The contact author has declared that none of the authors has any competing interests.
Publisher's note: Copernicus Publications remains neutral with regard to jurisdictional claims in published maps and institutional affiliations.
We thank Juliet Ermer for helping to digitalise landform boundaries used in this work and Adina Racoviteanu for offering advice during the revision of the paper. We also thank Lukas U. Arenson, the other anonymous reviewers, and the editor for their contributions during the review process, which helped greatly improve the paper.
This work is supported by the CUHK Global Scholarship Programme, the CUHK–Exeter Joint Centre for Environmental Sustainability and Resilience (ENSURE, grant no. 4930821), the Hong Kong Research Grants Council (grant nos. CUHK14303417, CUHK14302421 and HKPFS PF16-03859), and the CUHK Direct Grant for Research (grant no. 4053481).
This paper was edited by Regula Frauenfelder and reviewed by Lukas U. Arenson and four anonymous referees.
Arenson, L. U. and Jakob, M.: The significance of rock glaciers in the dry Andes – A discussion of Azócar and Brenning (2010) and Brenning and Azócar (2010), Permafrost Periglac., 21, 282–285, https://doi.org/10.1002/ppp.693, 2010.
Arenson, L. and Springman, S.: Mathematical descriptions for the behaviour of ice-rich frozen soils at temperatures close to 0 C, Can. Geotech. J., 42, 431–442, https://doi.org/10.1139/t04-109, 2005a.
Arenson, L. and Springman, S.: Triaxial constant stress and constant strain rate tests on ice-rich permafrost samples, Can. Geotech. J., 42, 412–430, https://doi.org/10.1139/t04-111, 2005b.
Arenson, L., Hoelzle, M., and Springman, S.: Borehole deformation measurements and internal structure of some rock glaciers in Switzerland, Permafrost Periglac., 13, 117–135, https://doi.org/10.1002/ppp.414, 2002.
Azizi, F. and Whalley, W. B.: Numerical modelling of the creep behaviour of ice-debris mixtures under variable thermal regimes, in: International Offshore and Polar Engineering Conference Proceedings, The Sixth International Offshore and Polar Engineering Conference, Los Angeles, 362–366, ISBN 1880653222, 1996.
Azócar, G. F. and Brenning, A.: Hydrological and geomorphological significance of rock glaciers in the dry Andes, Chile (27∘–33∘ S), Permafrost Periglac., 21, 42-53, https://doi.org/10.1002/ppp.669, 2010.
Ballantyne, C. K.: Periglacial geomorphology, John Wiley & Sons, Hoboken, NJ, USA, ISBN 9781405100069, 2018.
Bechor, N. B. D. and Zebker, H. A.: Measuring two-dimensional movements using a single InSAR pair, Geophys. Res. Lett., 33, L16311, https://doi.org/10.1029/2006gl026883, 2006.
Berthling, I.: Beyond confusion: Rock glaciers as cryo-conditioned landforms, Geomorphology, 131, 98–106, https://doi.org/10.1016/j.geomorph.2011.05.002, 2011.
Berthling, I., Etzelmüller, B., Isaksen, K., and Sollid, J. L.: Rock glaciers on Prins Karls Forland. II: GPR soundings and the development of internal structures, Permafrost Periglac., 11, 357–369, https://doi.org/10.1002/1099-1530(200012)11:4<357::aid-ppp366>3.0.co;2-6, 2000.
Bertone, A., Barboux, C., Bodin, X., Bolch, T., Brardinoni, F., Caduff, R., Christiansen, H. H., Darrow, M. M., Delaloye, R., Etzelmüller, B., Humlum, O., Lambiel, C., Lilleøren, K. S., Mair, V., Pellegrinon, G., Rouyet, L., Ruiz, L., and Strozzi, T.: Incorporating InSAR kinematics into rock glacier inventories: insights from 11 regions worldwide, The Cryosphere, 16, 2769–2792, https://doi.org/10.5194/tc-16-2769-2022, 2022.
Bodin, X., Rojas, F., and Brenning, A.: Status and evolution of the cryosphere in the Andes of Santiago (Chile, 33.5∘ S.), Geomorphology, 118, 453–464, https://doi.org/10.1016/j.geomorph.2010.02.016, 2010.
Brardinoni, F., Scotti, R., Sailer, R., and Mair, V.: Evaluating sources of uncertainty and variability in rock glacier inventories, Earth Surf. Processes, 44, 2450–2466, https://doi.org/10.1002/esp.4674, 2019.
Brenning, A.: Geomorphological, hydrological and climatic significance of rock glaciers in the Andes of Central Chile (33–35∘ S), Permafrost Periglac., 16, 231–240, https://doi.org/10.1002/ppp.528, 2005a.
Brenning, A.: Climatic and geomorphological controls of rock glaciers in the Andes of Central Chile, Humboldt-Universität zu Berlin, Mathematisch-Naturwissenschaftliche Fakultät II, https://doi.org/10.18452/15332, 2005b.
Brenning, A.: The significance of rock glaciers in the dry Andes – reply to L. Arenson and M. Jakob, Permafrost Periglac., 21, 286–288, 2010.
Buchli, T., Kos, A., Limpach, P., Merz, K., Zhou, X. H., and Springman, S. M.: Kinematic investigations on the Furggwanghorn Rock Glacier, Switzerland, Permafrost Periglac., 29, 3–20, https://doi.org/10.1002/ppp.1968, 2018.
Carslaw, H. S. and Jaeger, J. C.: Conduction of heat in solids, Oxford Science Publications, Clarendon Press, Oxford, ISBN 9780198533689, 1959.
Chen, C. W. and Zebker, H. A.: Phase unwrapping for large SAR interferograms: statistical segmentation and generalized network models, IEEE T. Geosci Remote, 40, 1709–1719, https://doi.org/10.1109/TGRS.2002.802453, 2002.
Cicoira, A., Beutel, J., Faillettaz, J., Gärtner-Roer, I., and Vieli, A.: Resolving the influence of temperature forcing through heat conduction on rock glacier dynamics: a numerical modelling approach, The Cryosphere, 13, 927–942, https://doi.org/10.5194/tc-13-927-2019, 2019a.
Cicoira, A., Beutel, J., Faillettaz, J., and Vieli, A.: Water controls the seasonal rhythm of rock glacier flow, Earth Planet Sc. Lett., 528, 115844, https://doi.org/10.1016/j.epsl.2019.115844, 2019b.
Cicoira, A., Marcer, M., Gärtner-Roer, I., Bodin, X., Arenson, L. U., and Vieli, A.: A general theory of rock glacier creep based on in-situ and remote sensing observations, Permafrost Periglac., 32, 139–153, https://doi.org/10.1002/ppp.2090, 2020.
Corte, A.: The Hydrological Significance of Rock Glaciers, J. Glaciol., 17, 157–158, https://doi.org/10.3189/s0022143000030859, 1976.
Croce, F. A. and Milana, J. P.: Internal structure and behaviour of a rock glacier in the Arid Andes of Argentina, Permafrost Periglac., 13, 289–299, https://doi.org/10.1002/ppp.431, 2002.
Cuffey, K. and Paterson, W. S. B.: The physics of glaciers, 4th edn., Butterworth-Heinemann/Elsevier, Burlington, MA, ISBN 978-0123694614, 2010.
Delaloye, R., Morard, S., Barboux, C., Abbet, D., Gruber, V., Riedo, M., and Gachet, S.: Rapidly moving rock glaciers in Mattertal, Geogr. Helv., 29, 21–31, 2013.
Duguay, M. A., Edmunds, A., Arenson, L. U., and Walnstein, P. A.: Quantifying the significance of the hydrological contribution of a rock glacier – A review, in: Proceedings of the 68th Canadian Geotechnical Conference and 7th Canadian Permafrost Conference (GeoQuébec 2015), 2015.
Fujii, Y. and Higuchi, K.: Ground Temperature and its Relation to Permafrost Occurrences in the Khumbu Region and Hidden Valley, Journal of Japanese Society of Snow and Ice, 38, 125–128, https://doi.org/10.5331/seppyo.38.Special_125, 1976.
Fukui, K., Fujii, Y., Ageta, Y., and Asahi, K.: Changes in the lower limit of mountain permafrost between 1973 and 2004 in the Khumbu Himal, the Nepal Himalayas, Global Planet. Change, 55, 251–256. https://doi.org/10.1016/j.gloplacha.2006.06.002, 2007.
Geiger, S. T., Daniels, J. M., Miller, S. N., and Nicholas, J. W.: Influence of Rock Glaciers on Stream Hydrology in the La Sal Mountains, Utah, Arct. Antarct. Alp. Res., 46, 645–658, https://doi.org/10.1657/1938-4246-46.3.645, 2014.
Glen, J. W.: The creep of polycrystalline ice, P. Roy. Soc. Lond. A Mat., 228, 519–538, https://doi.org/10.1098/rspa.1955.0066, 1955.
Guglielmin, M., Camusso, M., Polesello, S., and Valsecchi, S.: An old relict glacier body preserved in permafrost environment: The Foscagno rock glacier ice core (Upper Valtellina, Italian central Alps), Arct. Antarct. Alp. Res., 36, 108–116, https://doi.org/10.1657/1523-0430(2004)036[0108:AORGBP]2.0.CO;2, 2004.
Haeberli, W.: Modern research perspectives relating to permafrost creep and rock glaciers: A discussion, Permafrost Periglac., 11, 290–293, https://doi.org/10.1002/1099-1530(200012)11:4<290::AID-PPP372>3.0.CO;2-0, 2000.
Haeberli, W., Hoelzle, M., Kääb, A., Keller, F., Vonder Mühll, D., and Wagner, S.: Ten years after drilling through the permafrost of the active rock glacier Murtèl, eastern Swiss Alps: answered questions and new perspectives, in: Collection Nordicana, 7th International Conference on Permafrost, edited by: Lewkowicz, A. G. and Allard, M., 23–27 June 1998, Université Laval, Yellowknife, Canada, 403–410, 1998.
Hanssen, R. F.: Radar interferometry : data interpretation and error analysis, Dordrecht Boston: Kluwer Academic, ISBN 0792369459, 2001.
Harrington, J. S., Mozil, A., Hayashi, M., and Bentley, L. R.: Groundwater flow and storage processes in an inactive rock glacier, Hydrol. Process., 32, 3070–3088, https://doi.org/10.1002/hyp.13248, 2018.
Hauck, C.: New concepts in geophysical surveying and data interpretation for permafrost terrain, Permafrost Periglac., 24, 131–137, https://doi.org/10.1002/ppp.1774, 2013.
Hausmann, H., Krainer, K., Bruckl, E., and Mostler, W.: Internal structure and ice content of reichenkar rock glacier (Stubai alps, Austria) assessed by geophysical investigations, Permafrost Periglac., 18, 351–367, https://doi.org/10.1002/ppp.601, 2007.
Hoelzle, M., Wagner, S., Kääb, A., and Vonder Mühll, D.: Surface movement and internal deformation of ice-rock mixtures within rock glaciers in the Upper Engadin, Switzerland, Proceedings of the 7th International Conference on Permafrost, 465–471, ISBN 2920197576, 1998.
Hu, Y., Liu, L., Wang, X., Zhao, L., Wu, T., Cai, J., Zhu, X., and Hao, J.: Quantification of permafrost creep provides kinematic evidence for classifying a puzzling periglacial landform, Earth Surf. Proc. Land., 46, 465–477, https://doi.org/10.1002/esp.5039, 2021.
isce-framework: InSAR Scientific Computing Environment version 2 (ISCE2), version 2.4.2, GitHub [code] https://github.com/isce-framework/isce2/releases/tag/v2.4.2, last access: 17 November 2020.
Jakob, M.: Active rock glaciers and the lower limit of discontinuous alpine permafrost, Khumbu-Himalaya, Nepal, Permafrost Periglac., 3, 253–256, 1992.
Janke, J. R., Ng, S., and Bellisario, A.: An inventory and estimate of water stored in firn fields, glaciers, debris-covered glaciers, and rock glaciers in the Aconcagua River Basin, Chile, Geomorphology, 296, 142–152, https://doi.org/10.1016/j.geomorph.2017.09.002, 2017.
Jones, D. B., Harrison, S., Anderson, K., and Betts, R. A.: Mountain rock glaciers contain globally significant water stores, Sci. Rep., 8, 2834, https://doi.org/10.1038/s41598-018-21244-w, 2018a.
Jones, D. B., Harrison, S., Anderson, K., Selley, H. L., Wood, J. L., and Betts, R. A.: The distribution and hydrological significance of rock glaciers in the Nepalese Himalaya, Global Planet. Change, 160, 123–142, https://doi.org/10.1016/j.gloplacha.2017.11.005, 2018b.
Jones, D. B., Harrison, S., and Anderson, K.: Mountain glacier-to-rock glacier transition, Global Planet. Change, 181, 102999, https://doi.org/10.1016/j.gloplacha.2019.102999, 2019a.
Jones, D. B., Harrison, S., Anderson, K., and Whalley, W. B.: Rock glaciers and mountain hydrology: A review, Earth-Sci. Rev., 193, 66–90, https://doi.org/10.1016/j.earscirev.2019.04.001, 2019b.
Jones, D. B., Harrison, S., Anderson, K., Shannon, S., and Betts, R. A.: Rock glaciers represent hidden water stores in the Himalaya, Sci. Total Environ., 793, 145368, https://doi.org/10.1016/j.scitotenv.2021.145368, 2021.
Kääb, A., Frauenfelder, R., and Roer, I.: On the response of rockglacier creep to surface temperature increase, Global Planet. Change, 56, 172–187, https://doi.org/10.1016/j.gloplacha.2006.07.005, 2007.
Kenner, R., Pruessner, L., Beutel, J., Limpach, P., and Phillips, M.: How rock glacier hydrology, deformation velocities and ground temperatures interact: Examples from the Swiss Alps, Permafrost Periglac., 31, 3–14, https://doi.org/10.1002/ppp.2023, 2019.
Kneisel, C., Hauck, C., Fortier, R., and Moorman, B.: Advances in geophysical methods for permafrost investigations, Permafrost Periglac., 19, 157–178, https://doi.org/10.1002/ppp.616, 2008.
Knight, J., Harrison, S., and Jones, D. B.: Rock glaciers and the geomorphological evolution of deglacierizing mountains, Geomorphology, 324, 14–24, https://doi.org/10.1016/j.geomorph.2018.09.020, 2019.
Krainer, K. and Mostler, W.: Hydrology of Active Rock Glaciers: Examples from the Austrian Alps, Arct. Antarct. Alp. Res., 34, 142–149, https://doi.org/10.1080/15230430.2002.12003478, 2002.
Krainer, K., Bressan, D., Dietre, B., Haas, J. N., Hajdas, I., Lang, K., Mair, V., Nickus, U., Reidl, D., Thies, H., and Tonidandel, D.: A 10 300-year-old permafrost core from the active rock glacier Lazaun, southern Ötztal Alps (South Tyrol, northern Italy), Quaternary Res., 83, 324–335, https://doi.org/10.1016/j.yqres.2014.12.005, 2015.
Ladanyi, B.: Rheology of ice/rock systems and interfaces, in: Proceedings of the 8th International Conference on Permafrost, The 8th International Conference on Permafrost, Zurich, Switzerland, 621–626, ISBN 9058095827, 2003.
Leopold, M., Williams, M. W., Caine, N., Völkel, J., and Dethier, D.: Internal structure of the Green Lake 5 rock glacier, Colorado Front Range, USA, Permafrost Periglac., 22, 107–119, https://doi.org/10.1002/ppp.706, 2011.
Liu, L., Millar, C. I., Westfall, R. D., and Zebker, H. A.: Surface motion of active rock glaciers in the Sierra Nevada, California, USA: inventory and a case study using InSAR, The Cryosphere, 7, 1109–1119, https://doi.org/10.5194/tc-7-1109-2013, 2013.
Massonnet, D. and Feigl, K. L.: Radar interferometry and its application to changes in the Earth's surface, Rev. Geophys., 36, 441–500, https://doi.org/10.1029/97rg03139, 1998.
Mellor, M. and Testa, R.: Effect of temperature on the creep of ice, J. Glaciol., 8, 131–145, 1969.
Monnier, S. and Kinnard, C.: Internal structure and composition of a rock glacier in the Andes (upper Choapa valley, Chile) using borehole information and ground-penetrating radar, Ann. Glaciol., 54, 61–72, https://doi.org/10.3189/2013AoG64A107, 2013.
Monnier, S. and Kinnard, C.: Internal structure and composition of a rock glacier in the Dry Andes, Inferred from ground-penetrating radar data and its artefacts, Permafrost Periglac., 26, 335–346, https://doi.org/10.1002/ppp.1846, 2015.
Monnier, S. and Kinnard, C.: Interrogating the time and processes of development of the Las Liebres rock glacier, central Chilean Andes, using a numerical flow model, Earth Surf. Proc. Land., 41, 1884–1893, https://doi.org/10.1002/esp.3956, 2016.
Moore, P. L.: Deformation of debris-ice mixtures, Rev. Geophys., 52, 435–467, https://doi.org/10.1002/2014rg000453, 2014.
Munroe, J. S.: Distribution, evidence for internal ice, and possible hydrologic significance of rock glaciers in the Uinta Mountains, Utah, USA, Quaternary Res., 90, 50–65, https://doi.org/10.1017/qua.2018.24, 2018.
Nan, Z., Li, S., and Liu, Y.: Mean annual ground temperature distribution on the Tibetan plateau: Permafrost distribution mapping and further application, J. Glaciol. Geocryol., 24, 142–148, 2002.
Obu, J., Westermann, S., Barboux, C., Bartsch, A., Delaloye, R., Grosse, G., Heim, B., Hugelius, G., Irrgang, A., Kääb, A. M., Kroisleitner, C., Matthes, H., Nitze, I., Pellet, C., Seifert, F. M., Strozzi, T., Wegmüller, U., Wieczorek, M., and Wiesmann, A.: ESA Permafrost Climate Change Initiative (Permafrost_cci): Permafrost version 2 data products, Centre for Environmental Data Analysis, ESA CCI [data set], http://catalogue.ceda.ac.uk/uuid/1f88068e86304b0fbd34456115b6606f (last access: 30 June 2020), 2020.
Oerlemans, J.: Glaciers and climate change, A. A. Balkema Publishers, Lisse, ISBN 9789026518133, 2001.
PERMOS: Permafrost in Switzerland 2014/2015 to 2017/2018, edited by: Noetzli, J., Luethi, R., and Staub, B., the Cryospheric Commission of the Swiss Academy of Sciences, Glaciological Report (Permafrost) 12–15, 104 pp., 2019.
Perucca, L. and Esper Angillieri, M. Y.: Glaciers and rock glaciers' distribution at 28∘ SL, Dry Andes of Argentina, and some considerations about their hydrological significance, Environ. Earth Sci., 64, 2079–2089, https://doi.org/10.1007/s12665-011-1030-z, 2011.
Pruessner, L., Huss, M., Phillips, M., and Farinotti, D.: A framework for modeling rock glaciers and permafrost at the basin-scale in high alpine catchments, J. Adv. Model. Earth Sy., 13, e2020MS002361, https://doi.org/10.1029/2020ms002361, 2021.
Rangecroft, S., Harrison, S., Anderson, K., Magrath, J., Castel, A. P., and Pacheco, P.: A first rock glacier inventory for the Bolivian Andes, Permafrost Periglac., 25, 333–343, https://doi.org/10.1002/ppp.1816, 2014.
Rangecroft, S., Harrison, S., and Anderson, K.: Rock Glaciers as Water Stores in the Bolivian Andes: An Assessment of Their Hydrological Importance, Arct. Antarct. Alp. Res., 47, 89–98, https://doi.org/10.1657/AAAR0014-029, 2015.
Reinosch, E., Gerke, M., Riedel, B., Schwalb, A., Ye, Q., and Buckel, J.: Rock glacier inventory of the western Nyainqêntanglha Range, Tibetan Plateau, supported by InSAR time series and automated classification, Permafrost Periglac., 32, 657–672, https://doi.org/10.1002/ppp.2117, 2021.
Rouyet, L., Lauknes, T. R., Christiansen, H. H., Strand, S. M., and Larsen, Y.: Seasonal dynamics of a permafrost landscape, Adventdalen, Svalbard, investigated by InSAR, Remote Sens. Environ., 231, 111236, https://doi.org/10.1016/j.rse.2019.111236, 2019.
Salerno, F., Guyennon, N., Thakuri, S., Viviano, G., Romano, E., Vuillermoz, E., Cristofanelli, P., Stocchi, P., Agrillo, G., Ma, Y., and Tartari, G.: Weak precipitation, warm winters and springs impact glaciers of south slopes of Mt. Everest (central Himalaya) in the last 2 decades (1994–2013), The Cryosphere, 9, 1229–1247, https://doi.org/10.5194/tc-9-1229-2015, 2015.
Schmid, M.-O., Baral, P., Gruber, S., Shahi, S., Shrestha, T., Stumm, D., and Wester, P.: Assessment of permafrost distribution maps in the Hindu Kush Himalayan region using rock glaciers mapped in Google Earth, The Cryosphere, 9, 2089–2099, https://doi.org/10.5194/tc-9-2089-2015, 2015.
Scott, W. J., Sellmann, P. V., and Hunter, J. A.: Geophysics in the study of permafrost, in: Geotechnical and Environmental Geophysics: Volume I, Review and Tutorial, 355–384, https://doi.org/10.1190/1.9781560802785.ch13, 1990.
Scotti, R., Crosta, G. B., and Villa, A.: Destabilisation of Creeping Permafrost: The Plator Rock Glacier Case Study (Central Italian Alps), Permafrost Periglac., 28, 224–236, https://doi.org/10.1002/ppp.1917, 2017.
Steig, E. J., Fitzpatrick, J. J., Potter, j. N., and Clark, D. H.: The geochemical record in rock glaciers, Geogr. Ann. A., 80, 277–286, https://doi.org/10.1111/j.0435-3676.1998.00043.x, 1998.
Strozzi, T., Kääb, A., and Frauenfelder, R.: Detecting and quantifying mountain permafrost creep from in situ inventory, space-borne radar interferometry and airborne digital photogrammetry, Int. J. Remote Sens., 25, 2919–2931, https://doi.org/10.1080/0143116042000192330, 2004.
Swiss Permafrost Monitoring Network (PERMOS): Swiss Permafrost Monitoring Network Database, Fribourg and Davos, Switzerland, PERMOS Database [data set], https://doi.org/10.13093/permos-2021-01, 2021.
Wagner, T., Kainz, S., Helfricht, K., Fischer, A., Avian, M., Krainer, K., and Winkler, G.: Assessment of liquid and solid water storage in rock glaciers versus glacier ice in the Austrian Alps, Sci. Total Environ., 800, 149593, https://doi.org/10.1016/j.scitotenv.2021.149593, 2021.
Wang, X., Liu, L., Zhao, L., Wu, T., Li, Z., and Liu, G.: Mapping and inventorying active rock glaciers in the northern Tien Shan of China using satellite SAR interferometry, The Cryosphere, 11, 997–1014, https://doi.org/10.5194/tc-11-997-2017, 2017.
Way, R. G., Wang, Y., Bevington, A. R., Bonnaventure, P. P., Burton, J. R., Davis, E., Garibaldi, M. C., Lapalme, C. M., Tutton, R., Wehbe, M. A. E.: Consensus-Based Rock Glacier Inventorying in the Torngat Mountains, Northern Labrador, American Society of Civil Engineers Proceedings, Regional Conference on Permafrost and the 19th International Conference on Cold Regions Engineering, 24–29 October 2021, https://doi.org/10.31223/X5C60W, 2021.
Whalley, W. B. and Azizi, F.: Rheological models of active rock glaciers – evaluation, critique and a possible test, Permafrost Periglac., 5, 37–51, https://doi.org/10.1002/ppp.3430050105, 1994.
Winkler, G., Wagner, T., Pauritsch, M., Birk, S., Kellerer-Pirklbauer, A., Benischke, R., Leis, A., Morawetz, R., Schreilechner, M. G., and Hergarten, S.: Identification and assessment of groundwater flow and storage components of the relict Schöneben Rock Glacier, Niedere Tauern Range, Eastern Alps (Austria), Hydrogeol. J., 24, 937–953, https://doi.org/10.1007/s10040-015-1348-9, 2016.
Wirz, V., Gruber, S., Purves, R. S., Beutel, J., Gärtner-Roer, I., Gubler, S., and Vieli, A.: Short-term velocity variations at three rock glaciers and their relationship with meteorological conditions, Earth Surf. Dynam., 4, 103–123, https://doi.org/10.5194/esurf-4-103-2016, 2016.
Zhang, X., Feng, M., Zhang, H., Wang, C., Tang, Y., Xu, J., Yan, D., and Wang, C.: Detecting rock glacier displacement in the Central Himalayas using multi-temporal InSAR, Remote Sens., 13, 4738, https://doi.org/10.3390/rs13234738, 2021.
Zhao, L., and Sheng, Y.: Permafrost survey manual, Science Press, Beijing, ISBN 9787030456113, 2015.