the Creative Commons Attribution 4.0 License.
the Creative Commons Attribution 4.0 License.
 | 16 May 2023
Change in Antarctic ice shelf area from 2009 to 2019
Anna E. Hogg
Heather L. Selley
Antarctic ice shelves provide buttressing support to the ice sheet, stabilising the flow of grounded ice and its contribution to global sea levels. Over the past 50 years, satellite observations have shown ice shelves collapse, thin, and retreat; however, there are few measurements of the Antarctic-wide change in ice shelf area. Here, we use MODIS (Moderate Resolution Imaging Spectroradiometer) satellite data to measure the change in ice shelf calving front position and area on 34 ice shelves in Antarctica from 2009 to 2019. Over the last decade, a reduction in the area on the Antarctic Peninsula (6693 km2) and West Antarctica (5563 km2) has been outweighed by area growth in East Antarctica (3532 km2) and the large Ross and Ronne–Filchner ice shelves (14 028 km2). The largest retreat was observed on the Larsen C Ice Shelf, where 5917 km2 of ice was lost during an individual calving event in 2017, and the largest area increase was observed on Ronne Ice Shelf in East Antarctica, where a gradual advance over the past decade (535 km2 yr−1) led to a 5889 km2 area gain from 2009 to 2019. Overall, the Antarctic ice shelf area has grown by 5305 km2 since 2009, with 18 ice shelves retreating and 16 larger shelves growing in area. Our observations show that Antarctic ice shelves gained 661 Gt of ice mass over the past decade, whereas the steady-state approach would estimate substantial ice loss over the same period, demonstrating the importance of using time-variable calving flux observations to measure change.
- Article
(4399 KB) - Full-text XML
-
Supplement
(104083 KB) - BibTeX
- EndNote


Ice shelves fringe three-quarters of the Antarctic coastline, providing buttressing support to the grounded ice and linking the ice sheet with the Southern Ocean. The calving front represents the seaward limit of the ice shelf edge and is the boundary of the Antarctic coastal margin. The calving front location (CFL) can change gradually through sustained growth or retreat (Cook and Vaughan, 2010) or more suddenly due to large events such as iceberg calving (Hogg and Gudmundsson, 2017) and ice shelf collapse (Rott et al., 1996; Rack and Rott, 2004; Padman et al., 2012). Mapping the time-variable calving front location on Antarctic ice shelves is important (i) for estimating the total ice shelf freshwater budget, (ii) as a precursor for dynamic instability and therefore ice sheet sea level contribution, (iii) as an indicator of changing ice shelf structural conditions, and (iv) as a proxy for changing ocean and atmospheric forcing. Satellite observations have shown that a reduction in ice shelf area can cause upstream glaciers to thin (Scambos et al., 2004) and accelerate by up to 8 times their previous speed (Rignot et al., 2004), increasing the ice dynamic sea level contribution from the affected region. Some zones of floating ice provide significantly more structural stability to the ice sheet, with ice inland of the compressive arch or in contact with a pinning point triggering instability if lost (Holland et al., 2015). The effect of change in ice shelf area is not always local, with studies showing that ice shelves provide far-reaching buttressing support to grounded ice hundreds of kilometres away (Fürst et al., 2016). However, many iceberg calving events form part of the natural cycle of ice shelf evolution, with the steady regrowth and advance of the calving front typically seen after a calving event (Hogg and Gudmundsson, 2017).
Over the past 30 years, ice shelves across Antarctica have been observed to advance steadily, retreat after iceberg calving events, and collapse catastrophically, as seen in the case of the Larsen A (Rott et al., 1996), Larsen B (Rack and Rott, 2004), and Wilkins ice shelves (Padman et al., 2012) on the Antarctic Peninsula. Tracking the change in the calving front location is a vital input parameter for ice flow models, as it is used to inform studies of calving processes and their driving forces (Trevers et al., 2019) and is required to compute ice shelf mass change from calving, a component part of the total budget along with basal melt and surface mass input (Rignot et al., 2013). Measurements of the ice shelf calving front location have been made using a range of methods, including historical ship-based observations dating from 1842 on the Ross Ice Shelf (Jacobs et al., 1986; Keys et al., 1998), manual delineation of images acquired by aerial photography (Cook et al., 2005), and optical and synthetic aperture radar (SAR) satellites (Cook and Vaughan, 2010; MacGregor et al., 2012), automated ice front detection (Baumhoer et al., 2019), and by applying edge detection techniques to satellite radar altimetry elevation data (Wuite et al., 2019). The spatial resolution, accuracy, and frequency of these complementary techniques vary, with the temporal and spatial extent of calving front measurements largely dependent on the repeat period and coverage of data acquired and the manual intensity of the processing technique used. While data prior to the satellite era (pre-1960s) are extremely limited, historical records are an important reference dataset for understanding long-term change in the ice front position and its response to environmental forcing. Due to the importance of this glaciological parameter, there are several recent publications that measure change in the Antarctic ice shelf calving front locations, from regional assessments to full continent-wide evaluations (MacGregor et al., 2012; Lilien et al., 2018; Wuite et al., 2019; Baumhoer et al., 2018, 2019, 2021; Greene et al., 2022; Christie et al., 2022). In this study, we expand on this previous work and provide a circum-Antarctic survey by mapping the annual calving front location on 34 ice shelves around Antarctica from 2009 to 2019, using MODIS (Moderate Resolution Imaging Spectroradiometer) satellite imagery (Scambos et al., 1996). The results provide a comprehensive assessment of ice front migration across Antarctica over the last decade, expanding on historic patterns of ice movement and enabling areas of growth and retreat to be accurately quantified (Fig. 1).
We measured the annual calving front position on 34 ice shelves, encompassing 80 % of the Antarctic coastline, over the 11 years from 2009 to 2019 (Fig. 1). We used over 350 multispectral optical images, acquired by the MODIS instrument on board the NASA Terra and Aqua satellites (Scambos et al., 1996; Table S1 in the Supplement). Images acquired during the austral summer, from mid-January to the end of February, were selected throughout the decade to ensure consistent sampling and to avoid aliasing seasonal variation in the calving front position. Cloud-free satellite images, with open ocean at the calving front, were preferentially selected whenever possible, as the presence of sea ice and iceberg melange can reduce the accuracy with which the calving front location can be visually identified. Images acquired around midday were also prioritised, as the illumination at this time provides better contrast, enabling clearer identification of the ice shelf edge. The study period started in 2009 on 30 ice shelves; however, on the Wordie, Baudouin, Nansen, and Drygalski ice shelves, suitable images were not acquired until 2011. Therefore, this year was used as the earliest start date in these three regions throughout this study (Table 1). We produced an annual measurement of the ice front position on 34 ice shelves around Antarctica by manually delineating the calving front location at the point where the ice shelf surface visibly transitioned to open ocean or sea ice in each satellite image (Cook et al., 2005; Cook and Vaughan, 2010).
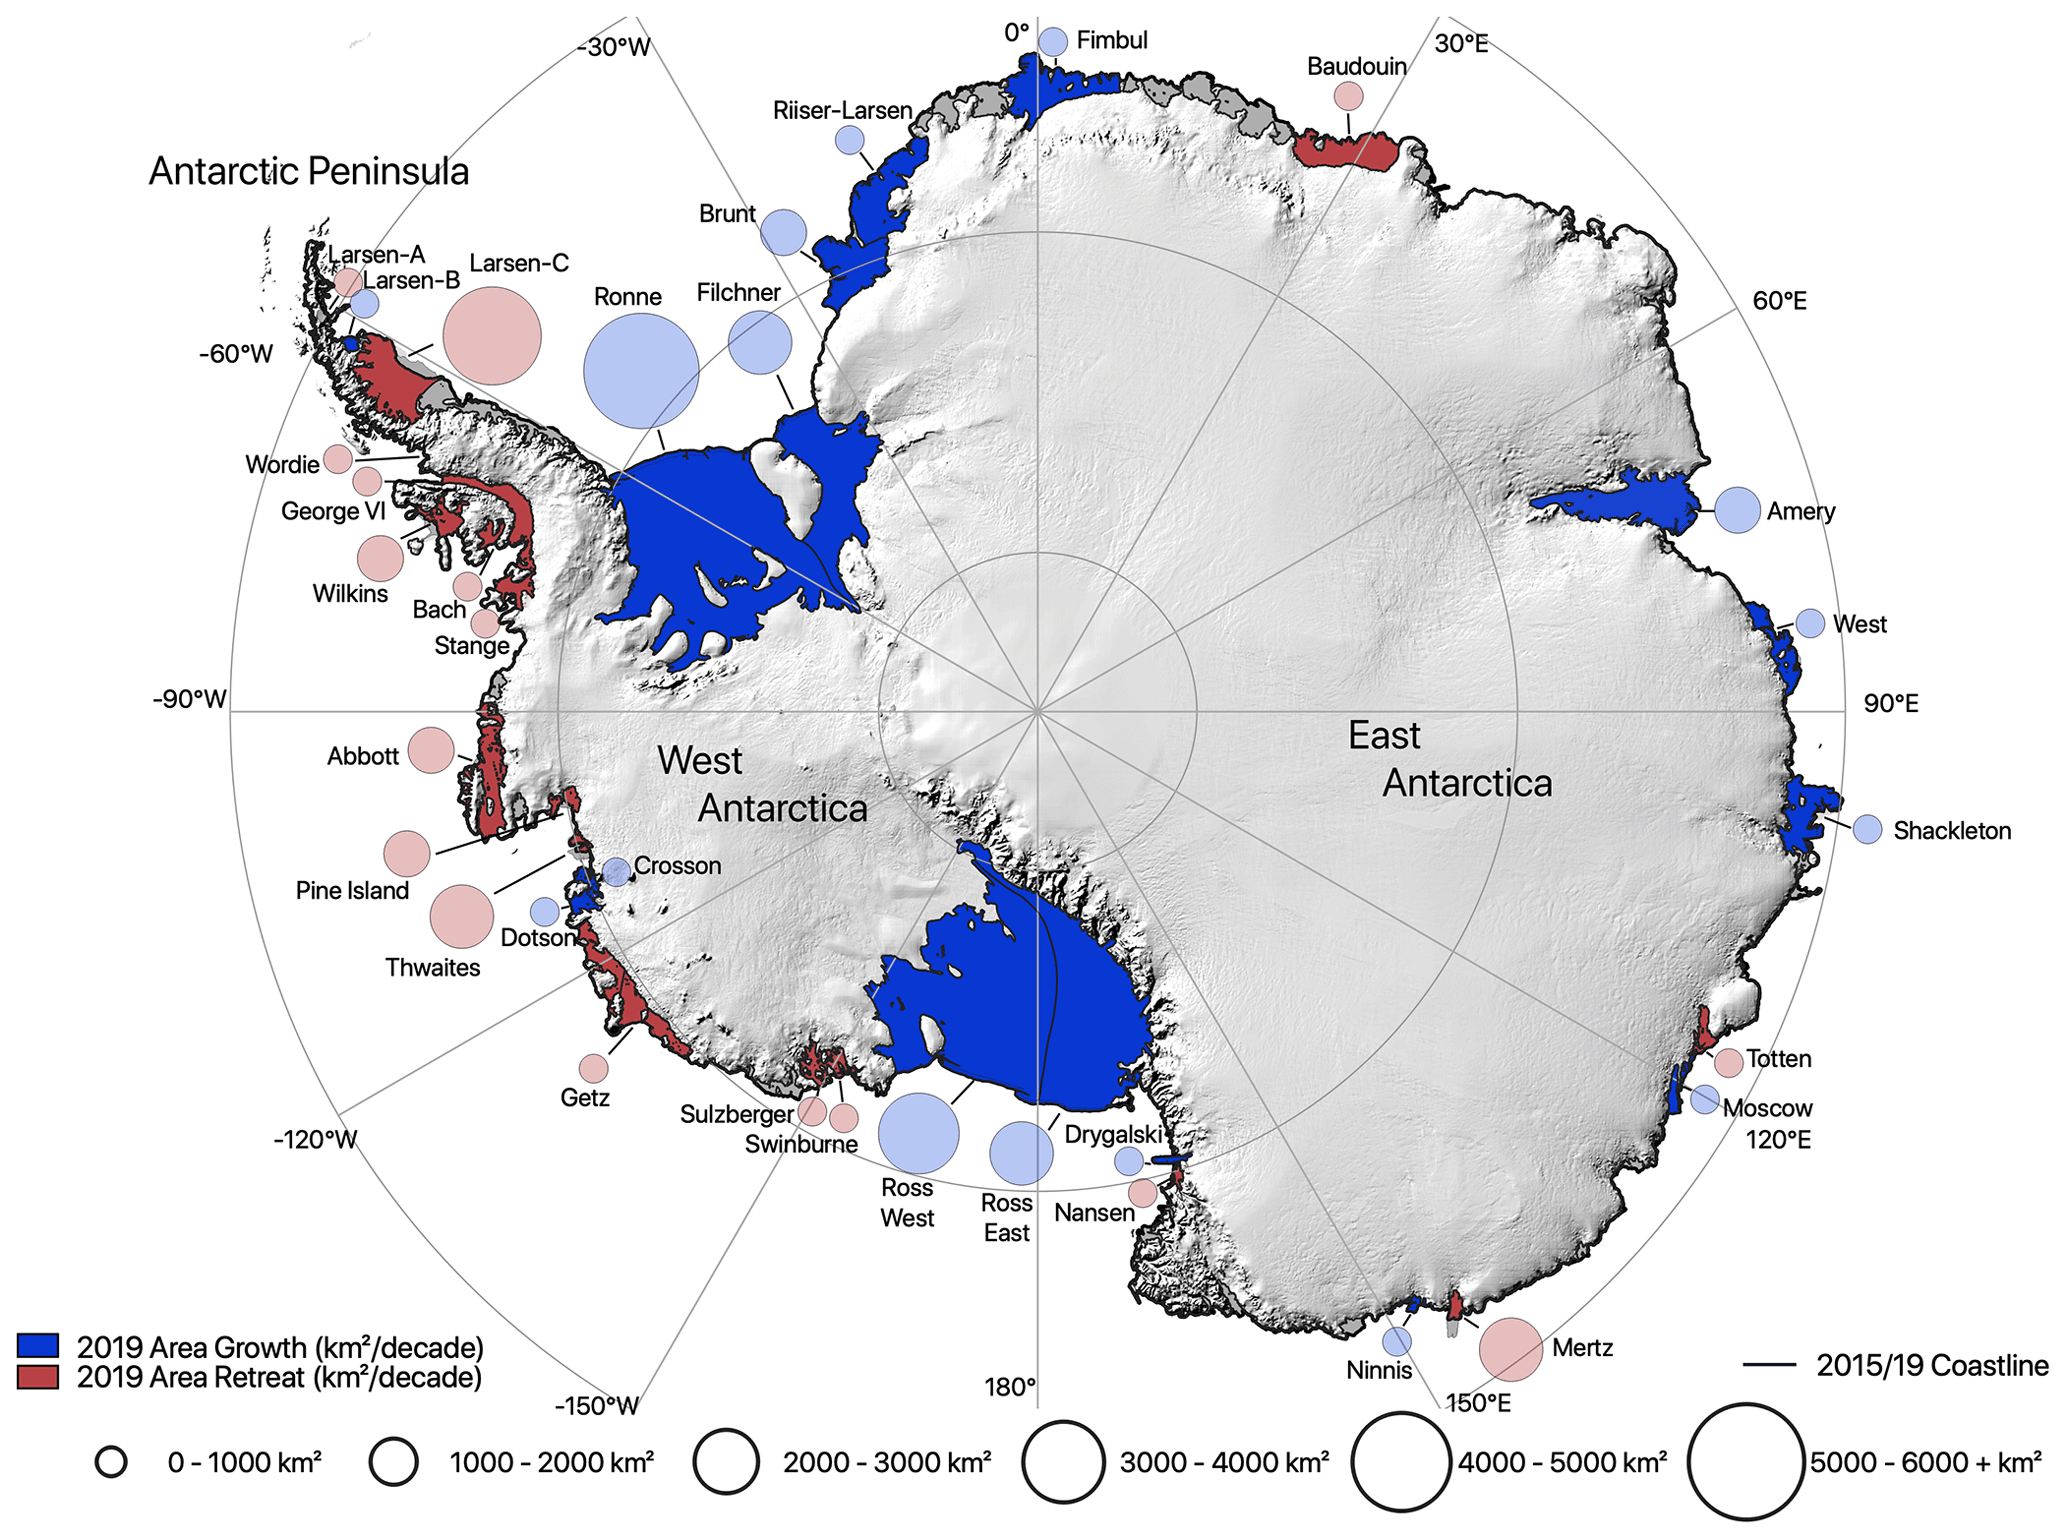
Figure 1Antarctic map of ice shelf area change from 2009 to 2019, with ice shelf names overlaid on a Bedmap2 surface of Antarctica. The circle areas denote the total amount of ice shelf area (in km2) lost (red) or gained (blue). The bold black line represents the Antarctic coastline, combining 2015 and 2019 data.
Equidistant points were plotted every ∼1000 m along the ice front, using a Polar Stereographic projection to standardise the distance scale, point density, and accuracy of the calving front boundary on every ice shelf. The ice shelf calving front location is constantly evolving, with the measured location representative of the time stamp of the satellite image used; however, for the purposes of this study, we assume that this reflects the annual location. The accuracy of the calving front position is limited by the georeferencing precision of the image and the digitisation of the boundary. We assessed the uncertainty in the measurement technique by delineating the calving front boundary five times, using the 2017 image on the Dotson Ice Shelf, and then measuring the variance from the mean position. The results show that the standard deviation of the calving front measurement is 254 m, which we assume to be our measurement uncertainty. This reflects the spatial resolution of the MODIS imagery, which has a pixel size of 250×250 m. The contemporary calving front positions from this study were combined with historical measurements on the Antarctic Peninsula to extend the record of change back to 1947, including the Larsen A to C, George VI, Wilkins, Wordie, Bach, and Stange ice shelves (Cook and Vaughan, 2010). Overall, this study has produced 366 calving front measurements between 2009 and 2019 and utilised 53 historical measurements on the Antarctic Peninsula to provide the most temporally and spatially extensive assessment of change in ice front position across Antarctica.
The annual area of each ice shelf was measured from 2009 to 2019 by combining the digitised calving front locations with a reference grounding line position, Making Earth Science Data Records for Use in Research Environments (MEaSUREs) Antarctic Grounding Line from Differential Satellite Radar Interferometry, Version 2 (Rignot et al., 2016), which marks the inland limit of the ice shelf boundary (Thomas et al., 1979). The grounding line and calving front positions were polygonised and then intersected for each Antarctic drainage basin fringed by an ice shelf, with isolated islands and nunataks subtracted from the area, creating a bounded area for each ice shelf for each year of the study. The total area change over the decade-long study period was calculated by differencing the most recent ice shelf area observation (2019) from the oldest (2009 or 2011; Table 1). We computed the mean annual rate of calving by dividing the total area change by the number of years observed and calculated the percentage area change by dividing the total area change by the 2009 area (Table 1). To assess the volume and ice mass change caused by calving front evolution, we extracted ice thickness from Bedmap2 (Fretwell et al., 2013) across the most inland measured calving front position, which ranged from 2009 to 2019, depending on the ice shelf (Table 1). We then calculated a mean thickness at the calving front for each shelf. We calculated the annual mass change in each ice shelf due to calving processes by computing the volume change in the calved ice and multiplying each annual area by the mean ice thickness and ice density (0.9166 Gt km−3). The mean rate of volume change was computed by dividing the annually varying ice shelf volume change by the study period. As the accuracy of ice shelf area measurements depends on both variations in the width and the length of the coastline, we rounded this to 1 km2 precision, which is in line with the methodology of previous studies (Cook and Vaughan, 2010), and to account for errors within the calving front delineation (254 m). The same method of calculating the area, volume, and calving mass change was applied to the historical calving front positions on the Antarctic Peninsula.
Table 1Summary table with data on each ice shelf, including area change from 2009 to 2019, the absolute difference, percentage difference, and rate of change between the first and last recorded dates (ice shelves that have experienced major calving events are indicated in parentheses), the year and amount of maximum area change, and the observed calving flux and steady-state calving fluxes. The values denoted in bold format are to indicate that those values are sums of ice shelf groupings (aka AP total, WAIS total, EAIS total, large shelf total, and Antarctica total).

This study presents a spatially and temporally extensive record of the calving front location and area change for 34 major ice shelves in Antarctica, from 2009 to 2019 (Fig. 1; Table 1), with three of those shelves measured from 2009 to 2021. Over the 11 years from 2009 to 2019, we observed six distinct types of ice shelf calving front behaviour characterised by (a) major calving events, (b) rapid calving front retreat, (c) gradual calving front retreat, (d) advance with periodic retreat, (e) rapid calving front advance, and (f) steady calving front advance (Fig. S1 in the Supplement). We grouped the ice shelves into these six categories to describe the changes observed to provide a detailed evaluation of ice shelf behaviour in Antarctica over the last decade.
3.1 Major calving events
Major calving events are defined as the loss of a significant proportion of the ice shelf, >5 % of the total area, resulting in the production of one or more icebergs over a short time period (calving events that occurred in less than a month). Six ice shelves in Antarctica experienced major calving events between 2009 and 2019, including the Wilkins, Wordie, and Larsen C ice shelves on the Antarctic Peninsula in 2009, 2013, and 2017, respectively, Thwaites Glacier in West Antarctica in 2012, and Mertz and Nansen ice shelves in East Antarctica in 2010 and 2016, respectively (Fig. 3a). Thwaites Ice Shelf experienced the largest relative area change, losing a total of 53.7 % (−2924 km2) of its original area (Table 1) due to the combined effects of both iceberg calving (2012 ice tongue calving event) and retreat (Fig. S33). Between 1963 and 2008, the Larsen C Ice Shelf retained 91 % of its area (50 837 km2; ice fronts provided by Cook and Vaughan, 2010); however, in 2017, it calved a >200 km long iceberg (A68; Hogg and Gudmundsson, 2017), reducing its area by 12.7 % (−5917 km2) and resulting in an overall ice loss of 10.2 % from 2009 to 2019 (Fig. S4).
The Wordie Ice Shelf on the western edge of the Antarctic Peninsula decreased in area by 90 % between 1966 and 2008 (ice fronts provided by Cook and Vaughan, 2010), resulting in four isolated ice shelf remnants buttressing the Carlson, Prospect, and Hariot glaciers and an unnamed remnant between the Hariot and Fleming glaciers (Fig. S7). Several ice rises played a crucial stabilising role in the Wordie grounding zone; however, they also act as wedges, splintering and weakening the ice shelf from the three inflowing tributary glaciers (Vaughan, 1993). Between 2011 and 2019, the Wordie Ice Shelf lost 45.2 % of its remaining area (Table 1), with 88 % of this loss caused by a 35 km2 calving event in 2013. After a period of sustained retreat since 1990 (Cook and Vaughan, 2010), the north and western portions of Wilkins Ice Shelf have retreated by 1204 km2 between 2009 and 2010 (Fig. S6). This was due to the loss of a 1 km wide ice bridge to Charcot Island, which is thought to be caused by easterly winds driving cyclic motion and ice mélange pressurised against the ice bridge due to wind stress (Humbert et al., 2010).
In 2010, the Mertz Glacier calved a 78 km long iceberg (C28), losing 45.3 % of its original area (−2451 km2) after the B-09B iceberg, which calved from the Ross Ice Shelf in 1987, collided with the highly crevassed floating ice tongue (Figs. 2a, S21; Massom et al., 2015). Grounded icebergs around the Mertz coastline influence the floating shelf by creating a layer of fast ice cover that extends the ice tongue's length; additionally, Mertz is responsible for the drainage of 0.8 % of the EAIS (Massom et al., 2015). The Nansen Ice Shelf grew steadily at an average rate of 7 km2 yr−1 from 2011 to 2016; however, between 2016 and 2017, 8.9 % (182 km2) of the total ice shelf area was lost through calving (Fig. S23). The fracture that formed the C-33 and C-33b icebergs was first recorded in 1987, growing at a rate of 7 km yr−1 from 2011 to 2013 (Li et al., 2016; Dziak et al., 2018), with the eventual calving in 2016 thought to be triggered by a low-pressure storm (Dziak et al., 2018). Mertz Glacier and the Nansen Ice Shelf are the only two regions in East Antarctica to have major calving events between 2009 and 2019 and are two of four ice shelves in East Antarctica to experience a net area loss over the 11-year study period. After their calving events, the Wilkins and Thwaites ice shelves continued to retreat at a more gradual rate, whereas the Mertz Ice Shelf readvanced, and the extent of the Wordie Ice Shelf remained relatively static. Between 2019 and 2022, major calving events occurred on the Amery Ice Shelf (September 2019; iceberg D-28; 1636 km2; Francis et al., 2021; Fig. S16), the Brunt Ice Shelf (February 2021; iceberg A-74; 1270 km2; Fig. S12), and the Ronne Ice Shelf (May 2021; iceberg A-76; 4310 km2; Fig. S10), significantly expanding the region in East Antarctica that has experienced a net area loss since 2009. This analysis of the calving events on an annual scale provides robust data for future studies to assess whether there has been a significant increase in iceberg calving over the past decade or whether the more frequent repeat period of satellite observations has better captured the true frequency of major iceberg calving events in Antarctica.
3.2 Rapid calving front retreat
A rapid calving front retreat is defined as ice shelves that have experienced sustained and significant ice loss throughout the 11-year study period (2009–2019), losing at least 15 % of their total area. Three ice shelves in Antarctica experienced rapid calving front retreat between 2009 and 2019, including the Larsen A Ice Shelf on the Antarctic Peninsula and Pine Island Glacier and Swinburne Ice Shelf in West Antarctica (Fig. 3b). These ice shelves are fed by fast-flowing glaciers, resulting in observations of modest annual advance (typically between 1 % and 2 %). Larsen A Ice Shelf on the northeastern Antarctic Peninsula had a total area of 2929 km2 in 1963 and began to experience some collapse in the 1980s (Fig. S2; ice fronts provided by Cook and Vaughan, 2010). In January 1995, a collapse of 2270 km2 of ice (Rott et al., 1996) left Larsen A with only 682 km2 of its original area after surface meltwater ponds triggered hydro-fracturing through crevasses (Scambos et al., 2000). From 1995 to 2008, Larsen A experienced a steady retreat of the ice shelf remnant, with 637 km2 of ice lost, and from 2009 to 2019, the Larsen A Ice Shelf continued to retreat, losing a further 11 km2 of ice and leaving a remaining area of 22 km2. In this study, all Larsen A area calculations do not include the Seal Nunataks region.
Pine Island Glacier (PIG) is in the Amundsen Sea Embayment, where incursions of warm Circumpolar Deep Water (CDW) onto the continental shelf have caused high basal melt rates (Dutrieux et al., 2014) and accelerated ice discharge into the ocean (Figs. 2b, S34; Joughin et al., 2014; MacGregor et al., 2012). Previous studies have shown that PIG has experienced long-term ice shelf retreat since the 1970s (Crabtree and Doake, 1982), where the unbuttressing of the grounded ice has caused large, negative ice dynamic loss from the basin over the past 3 decades (Mouginot et al., 2014). In 2011, a rift occurred across the shelf further inland than previously on record (since 1947), causing a calving event in 2013, where 689 km2 of ice was lost. Since 2009, our results show that PIG has retreated by 1043 km2, at a rate of −95 km2 yr−1. Elsewhere in West Antarctica, the Swinburne Ice Shelf experienced a relatively uniform rate of ice loss throughout the study period, with a total of 185 km2 of ice lost at an average rate of −17 km2 yr−1, losing 20.4 % of its area by 2019 (Fig. S27).
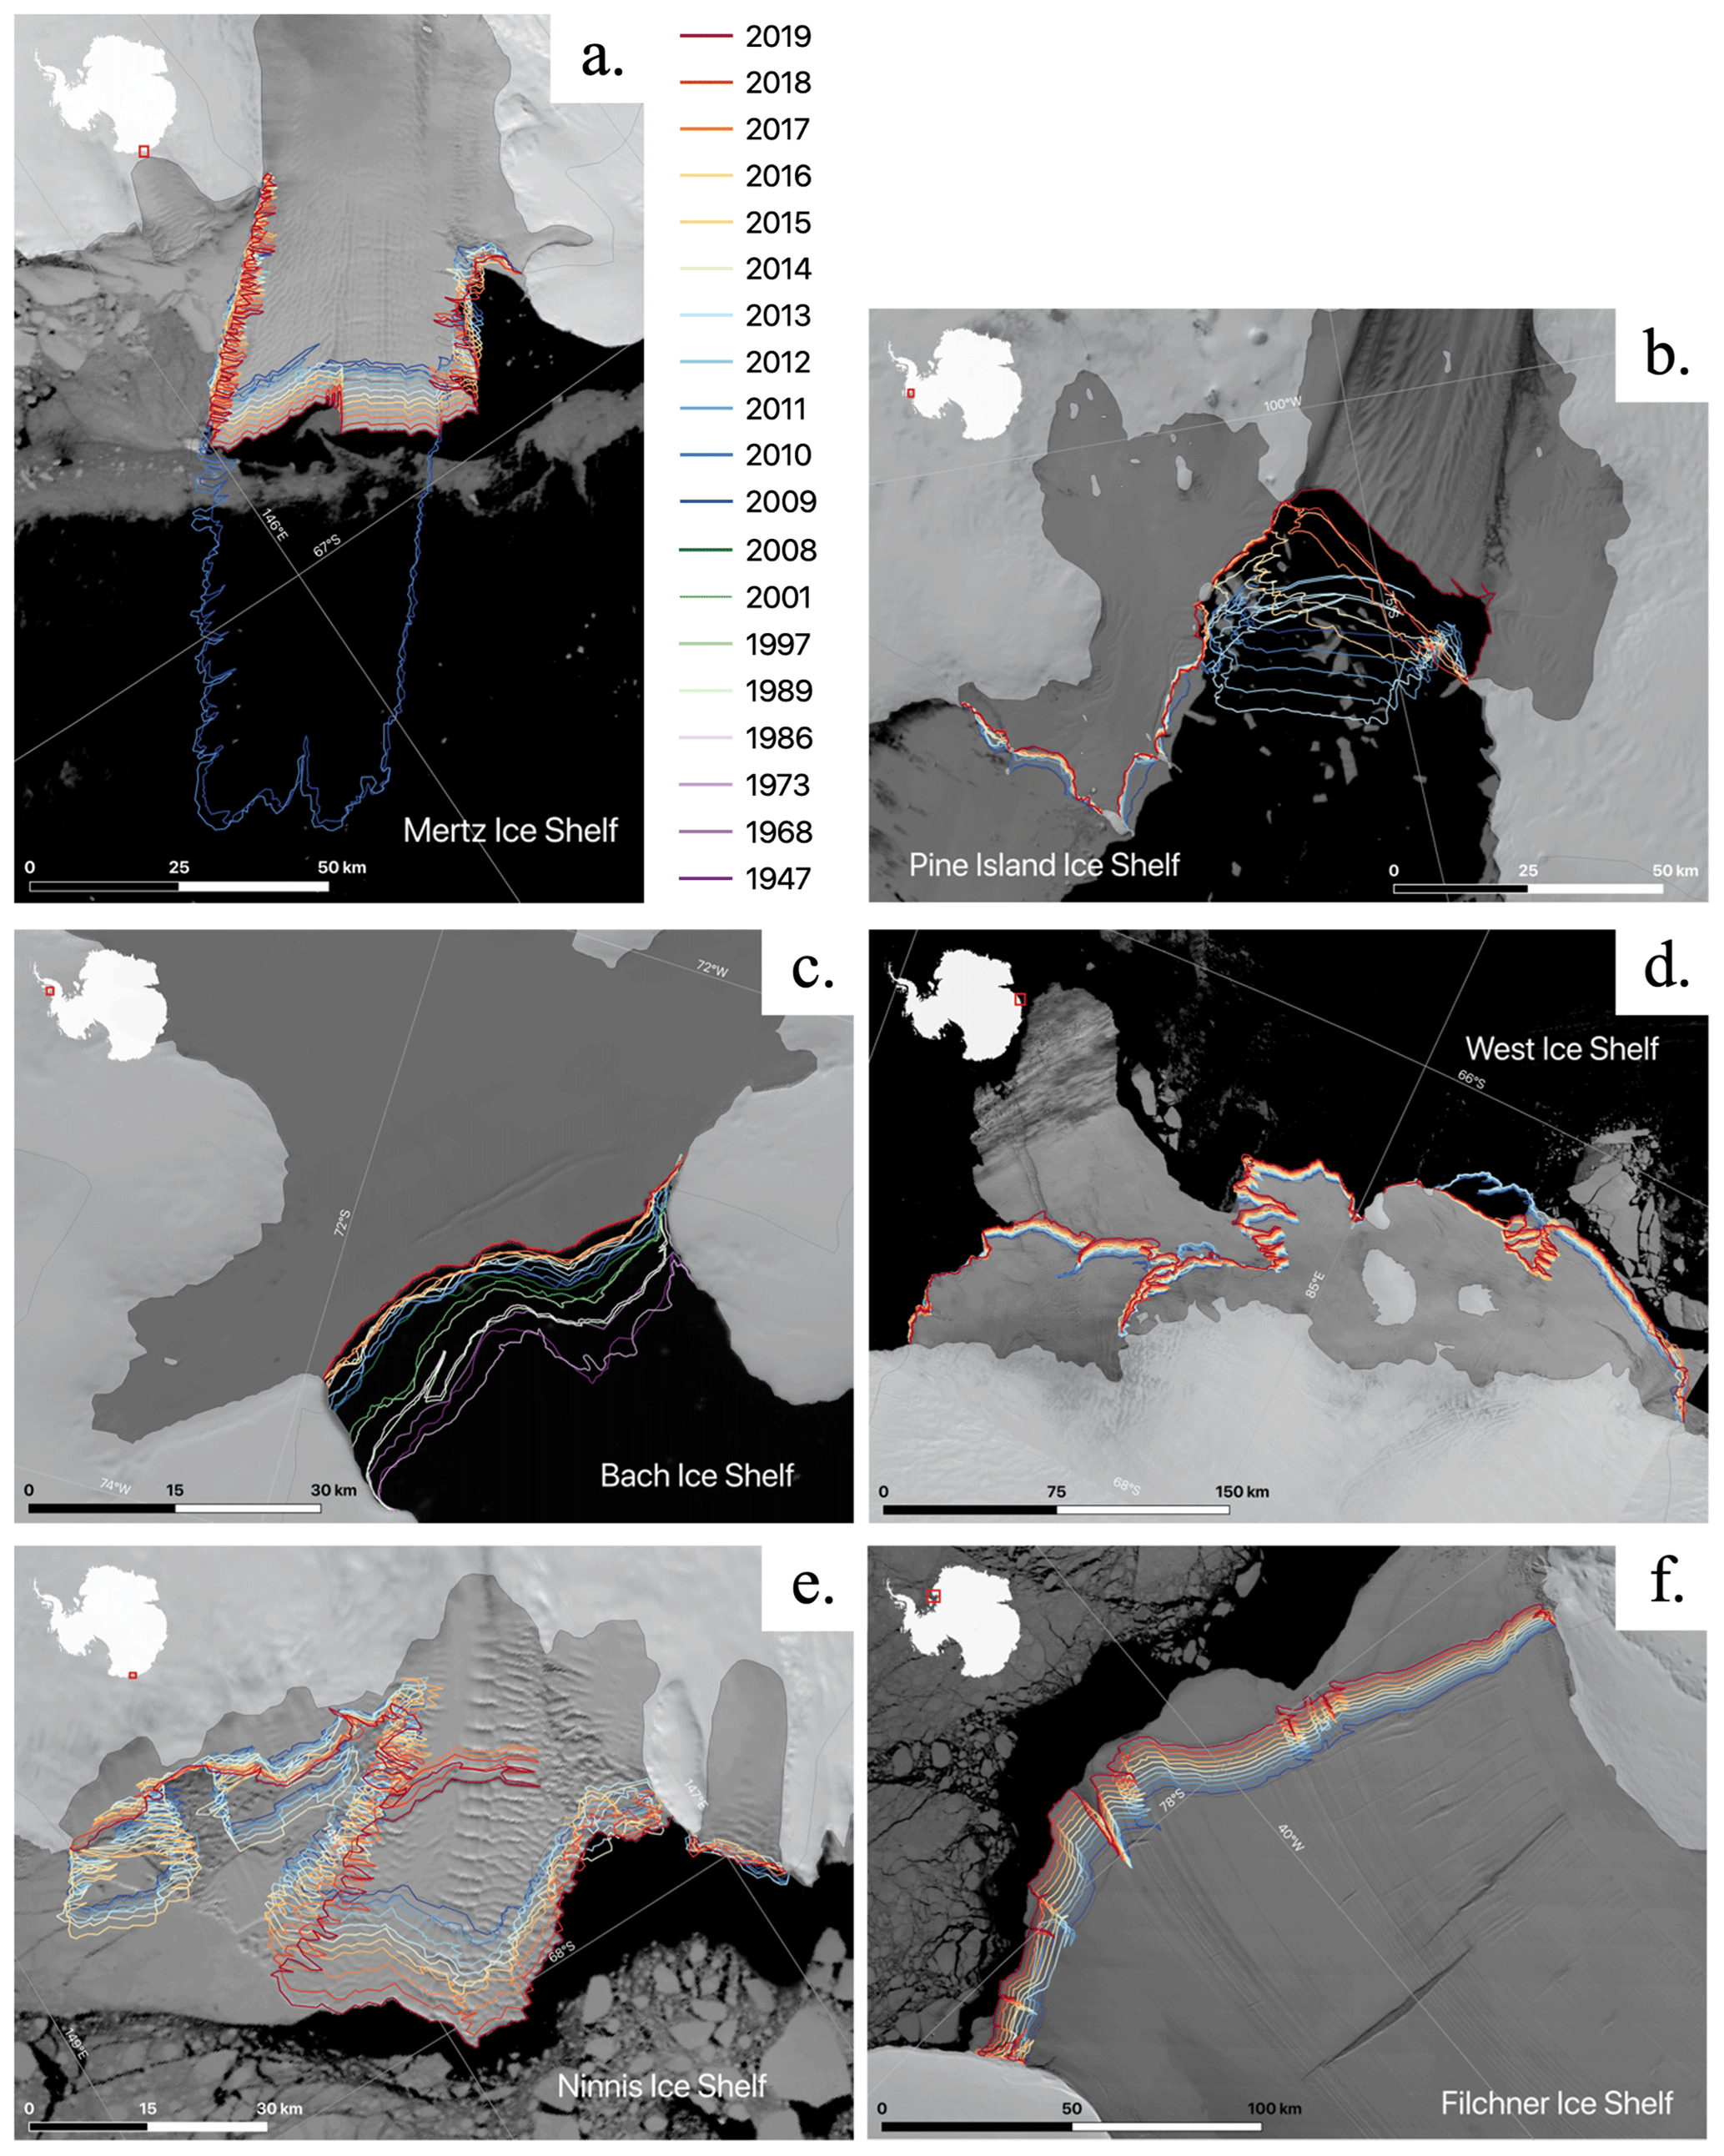
Figure 2Maps of calving front change from 1947 to 2019, representing (a) a major calving event, (b) a rapid calving front retreat, (c) a gradual calving front retreat, (d) an advance with periodic retreat, (e) a rapid calving front advance, and (f) a steady calving front advance overlaying MODIS satellite images from 2019 (Scambos et al., 1996).
3.3 Gradual calving front retreat
We define the gradual calving front retreat as ice shelves that lost less than 4 % of their total area over the 11-year study period (2009–2019), where the maximum percentage of annual growth is 1.31 % and the maximum retreat is −3.76 %. This category is the largest grouping of ice shelves containing eight locations in Antarctica, including the George VI, Bach, and Stange ice shelves on the Antarctic Peninsula, Sulzberger, Getz, and Abbot ice shelves in West Antarctica, and Totten and Baudouin ice shelves in East Antarctica (Fig. 3c).
The George VI (GVI) Ice Shelf is the largest ice shelf (22 882 km2 in 2019) on the Antarctic Peninsula's western coast and exists as an ice-bridged channel between Alexander Island and the continent (Fig. S5). GVI has two ice fronts 500 km apart, with the northern front and the southern front facing Marguerite Bay and Belgica Trough, respectively. GVI experiences seasonal surface melt in the austral summer and high rates of basal melting, which have been attributed to warm southeastern Pacific basin water supplied by the CDW beneath the shelf (Lucchitta and Rosanova, 1998). From 1947 to 2008, GVI lost 1943.7 km2 of ice, therefore retaining 92.4 % of its 1947 size (ice fronts provided by Cook and Vaughan, 2010). This slow but steady ice loss continued from 2009 until 2019 at an average rate of 55 km2 yr−1, with 601.9 km2 of ice lost throughout the 11-year study period. The Bach and Stange ice shelves are located on either side of the GVI southern opening and have also exhibited similar slow and steady rates of retreat over many decades. Bach lost 304 km2 of ice over 62 years from 1947 to 2008 (ice fronts provided by Cook and Vaughan, 2010), with a further 113 km2 (2.5 %) ice lost in the 11 years between 2009 and 2019 (Figs. 2c, S8). Stange Ice Shelf exhibited similar behaviour, retaining 97 % of its originally recorded ice area between 1973 and 2008 (a loss of 272 km2) and losing a further 2.6 % of its area (210 km2) in the last decade (Fig. S9).
The Getz and Abbot ice shelves are the largest shelves in West Antarctica, flanking large portions of the coastline. These ice shelves are anchored at their calving front by a series of islands that limit the rate and scale of iceberg calving events. While the grounded ice inland of the Getz Ice Shelf has exhibited ice dynamic speed-up over the last 20 years (Selley et al., 2021), the ice shelf area (33 605 km2 in 2019) has remained relatively stable. Overall, 403 km2 of ice was lost from the ice shelf over the past decade, with a calving front retreat rate of 17 km2 yr−1 in the western portion (Fig. S29) and 20 km2 yr−1 on the eastern shelf (Fig. S30). During the 11-year study period from 2009 and 2019, both ice shelves have lost a small amount of their total area. Abbot Ice Shelf lost 3.6 % of its total area (1141 km2), with some periods of modest growth in 2014 and from 2016 to 2019 (Fig. S35). Sulzberger Ice Shelf is located in West Antarctica between Swinburne Ice Shelf and the Guest Peninsula facing the Ross Sea, with an area of 12 276 km2 in 2019 (Fig. S28). Sulzberger has a complex structure with numerous islands and pinning points flanking the ice front, with ice that is less than 80 m thick on average at its terminus and an ocean depth of ∼150 m (Le Brocq et al., 2010). Satellite observations indicate that there have been no significant ice dynamic speed changes on this ice shelf over the past 35 years (Brunt et al., 2011); however, the pattern of ice flow around the 11 ice rises (and smaller ice rumples) has created lines of weakness, which may increase the likelihood of ice fracturing (Matsuoka et al., 2015). In 2011, a Japanese earthquake triggered a tsunami that caused rifts to form on the Sulzberger Ice Shelf. This directly led to a 10 km× 6 km iceberg calving event (Brunt et al., 2011) that reduced Sulzberger's area by 142.1 km2. Between 2009 and 2019, Sulzberger retreated at a gradual rate of 19 km2 yr−1 overall, losing 1.7 % of its total area.
In East Antarctica, the Baudouin Ice Shelf is located on the northern coast and experienced an overall area loss of 239.4 km2 between 2011 and 2019, with an average retreat of 27 km2 yr−1 (Fig. S15). Totten Glacier is also in East Antarctica and drains the large Aurora Subglacial Basin, which contains enough ice to raise global sea levels by 3.5 m (Fig. S19; Greenbaum et al., 2015). Ice flux from Totten Glacier is the largest in EAIS and third highest behind Pine Island and Thwaites in Antarctica (Roberts et al., 2018), and the ice streams' deeply grounded bed geometry makes the region susceptible to grounding line retreat and marine ice sheet instability (MISI). Between 2009 and 2019, our results show that the Totten Ice Shelf experienced a total ice loss of 153 km2 at an average rate of −14 km2 yr−1. By the end of the study period in 2019, the Totten Ice Shelf retained 97.5 % of its 2009 area.
3.4 Advance with periodic retreat
We define the advance with periodic retreat category as ice shelves that not only have faced overall growth of at least 0.9 % but also have individual years of retreat within the last decade (2009–2019) that range from −0.02 % to −4.21 %. Since 2009, this category includes the Dotson Ice Shelf in West Antarctica, and West, Moscow University, and Drygalski ice shelves in East Antarctica. The calving events observed over the past decade on these ice shelves are often small in size, with area regrowth occurring in subsequent years (Fig. 3d).
Dotson Ice Shelf had an area of 5791 km2 in 2009 and is located in the Amundsen Sea Embayment between the larger Thwaites and Getz ice shelves (Fig. S31). Over the last 11 years, Dotson Ice Shelf's area has grown modestly by 0.9 % to 5843.3 km2. Ice flow from Kohler Glacier is the primary input driving this advance; however, in 2016, a small calving event occurred, causing a total of 51.8 km2 of ice to be lost. Subsequent regrowth from 2017 to 2019 led to an area gain of 9.9 km2 over the following 2 years. The West Ice Shelf has a large area of 15 855 km2 in 2009 and is located along the coast of the EAIS between the Amery and Shackleton ice shelves (Figs. 2d, S17). Our results showed that, by 2019, the ice shelf area had increased moderately by 3.1 % to 16 343 km2, with one small iceberg calving event in 2013 losing 667.7 km2 of ice. Moscow University Ice Shelf experienced 3 years of calving front retreat in 2010, 2015, and 2016, totalling 251.3 km2 of ice loss, but Moscow University witnessed an overall marginal growth of 131 km2 from 2009 to 2019 (Fig. S20). The 88 km (2019) long Drygalski ice tongue is located on the Scott Coast in East Antarctica, adjacent to the Nansen Ice Shelf (Fig. S24). This ice tongue has an area (2019) of 2384 km2, with ice flow supplied from the David Glacier, which drives its average rate of advance of 5 km2 yr−1. Between 2011 and 2019, the Drygalski ice tongue area grew by 48 km2, with a small iceberg calving event occurring in 2011, and had additional retreat in 2012, 2014, and 2016. While relatively small in comparison to major iceberg calving events, this category of ice shelves demonstrates the importance of making annual calving front measurements to accurately capture the real ice mass loss through calving events.

Figure 3Area percentage change since 2009. (a) Major calving events, (b) rapid calving front retreat, (c) gradual calving front retreat, (d) advance with periodic retreat, (e) rapid calving front advance, and (f) steady calving front advance. Antarctic Peninsula (AP) ice shelves are represented in blue, West Antarctic Ice Sheet (WAIS) ice shelves are represented in orange, and East Antarctic Ice Sheet (EAIS) ice shelves are represented in purple.
3.5 Rapid calving front advance
Ice shelves that have undergone rapid calving front advance increased their size by over 5 % during the 11-year study period (2009–2019), with maximum growth of just under 15 %. As with the gradual ice shelf area growth category, calving front advance is controlled by the rate of ice flow; however, rapid calving front advance ice shelves are on average 10 times smaller (11 762 km2 rather than 141 684 km2). Therefore the calving front advance represents a larger proportion of the total area change. Ice shelves in this category include the Larsen B remnant which is advancing after much of the ice shelf collapsed in March 2002 (Rack and Rott, 2004), in addition to the Ninnis and Brunt ice shelves on the East Antarctic Ice Sheet (EAIS) and Crosson Ice Shelf along the West Antarctic Ice Sheet (WAIS; Fig. 3f). The Larsen B Ice Shelf is located on the northeastern side of the Antarctic Peninsula. Between 1963 and 2009, the Larsen B Ice Shelf lost 83.0 % (9055 km2) of its area, resulting in an 1850 km2 ice shelf remnant in the Scar Inlet in 2009 (Fig. S3; ice fronts provided by Cook and Vaughan, 2010). The majority of this ice loss occurred during a catastrophic collapse event in 2002, where crevasse hydrofracture caused 3250 km2 of ice to be lost within a few days (Rack and Rott, 2004; Cook and Vaughan, 2010) due to an original large tabular calving event that occurred in 1995 (Kulessa et al., 2014). Observations have shown that area loss from the Larsen B Ice Shelf has led to the unbuttressing of grounded ice on the Antarctic Peninsula, resulting in an 8-fold acceleration in ice flow between 2000 and 2003 and a corresponding increase in sea level contribution from this region (Rignot et al., 2004). Over the 11-year period between 2009 and 2019, ice flow into the remaining portion of the Larsen B Ice Shelf caused a rapid calving front advance at a rate of 23 km2 yr−1, with a total area gain of 13.5 % (250 km2).
The Ninnis Ice Shelf is located next to the Mertz Glacier tongue on the George V Coast of East Antarctica and has grown by 268 km2 (15.1 %) since 2009 (Figs. 2f and S22). Ice shelf growth was not uniform across the full extent of the Ninnis ice tongue, with a small calving event occurring in 2017 on its eastern side. The Brunt Ice Shelf is located to the east of the of Ronne–Filcher ice shelves in Dronning Maud Land, with its previous historical calving event occurring 51 years ago in 1971 (Anderson et al., 2014). From 2009 to 2019, the Brunt Ice Shelf grew in area by 1881 km2 in total at a rate of 171 km2 yr−1 (Fig. S12). In the last decade, three major fractures have become active and grown on the Brunt Ice shelf. Chasm 1 is located on the western side of the Brunt Ice Shelf and lay dormant for 35 years; however, satellite observations showed that the crack began to advance in 2012. Chasm 1 propagated across the ice shelf even more rapidly from 2014 onwards, reaching a length of 55 km by 2019. As of 2021, a ∼5 km long ice bridge connects the tip of Chasm 1 with the McDonald Ice Rumples, a pinning point on the Brunt Ice Shelf. On 31 October 2016, a second fracture called the Halloween Crack was observed on the Brunt Ice Shelf. Measuring over 60 km long, it grows inland and away from the McDonald Ice Rumples. In November 2020, a third crevasse called the Northern Rift was identified on the eastern side of the McDonald Ice rumples. This crevasse propagated rapidly across the ice shelf and calved a 56 km long, 33 km wide iceberg (A74) in February 2021, resulting in a total area of 38 175 km2 in 2021. The Crosson Ice shelf, located adjacent to the Dotson Ice Shelf and fed by Pope Glacier and the eastern branch of Smith Glacier, experienced an overall rapid calving front advance of 8.3 % (295 km2), with periodic years of retreat in 2010, 2012, 2013, and 2015 (Fig. S32; Lilien et al., 2018).
3.6 Steady calving front advance
We define the steady calving front advance as ice shelves that have gradually grown in area from 2009 to 2019, as controlled by the rate of ice flow. Overall, we find that ice shelves in this category grew on average by just under 4 % over the decade-long study period, with yearly retreat limited to a maximum of 0.29 %, annual growth ranging from 0 to 0.58 %, and an average annual growth of 0.18 %. Ice shelves in this category include the four largest ice shelves in Antarctica, all over 100 000 km2 in area, which tend to contain some of the thickest floating ice. All eight ice shelves in this category are located in East Antarctica and include the Ross east and west ice shelves and Ronne, Filchner, Riiser–Larsen, Fimbul, Amery, and Shackleton ice shelves (Fig. 3e).
Ross is the largest ice shelf in Antarctica, bridging the gap between the Siple Coast on the West Antarctic Ice Sheet and the Transantarctic Mountains in the east. Over the decade from 2009 to 2019, both the Ross east and Ross west ice shelves have grown steadily by a total of 5896 km2 at rates of 187 and 350 km2 yr−1, respectively (Figs. S25 and S26). Central regions of the Ross Ice Shelf experience periodic thickening, which is thought to be due to marine ice refreezing onto the ice shelf base during the austral winter (Adusumilli et al., 2020; Hogg et al., 2021). During the warmer summer months, observations have shown that localised thinning occurs at the eastern ice shelf calving front driven by atmospherically heated Antarctic surface water (Tinto et al., 2019). Thermal heating of surface water in the Ross Sea occurs when strong offshore winds prevent sea ice from forming, a process which persistently occurs in the Ross Sea polynya (Lazzara et al., 2008). Prior to 2009, major pre-existing rifts resulted in significant calving events in 1987 and 2008 (Lazzara et al., 2008), with periods of steady ice shelf regrowth in between. Our observations, combined with those from previous studies (Smethie and Jacobs, 2005; Lazzara et al., 2008), suggest that the Ross Ice Shelf exists in a regenerative cycle, where multiple decades of growth result in periodic large calving events.
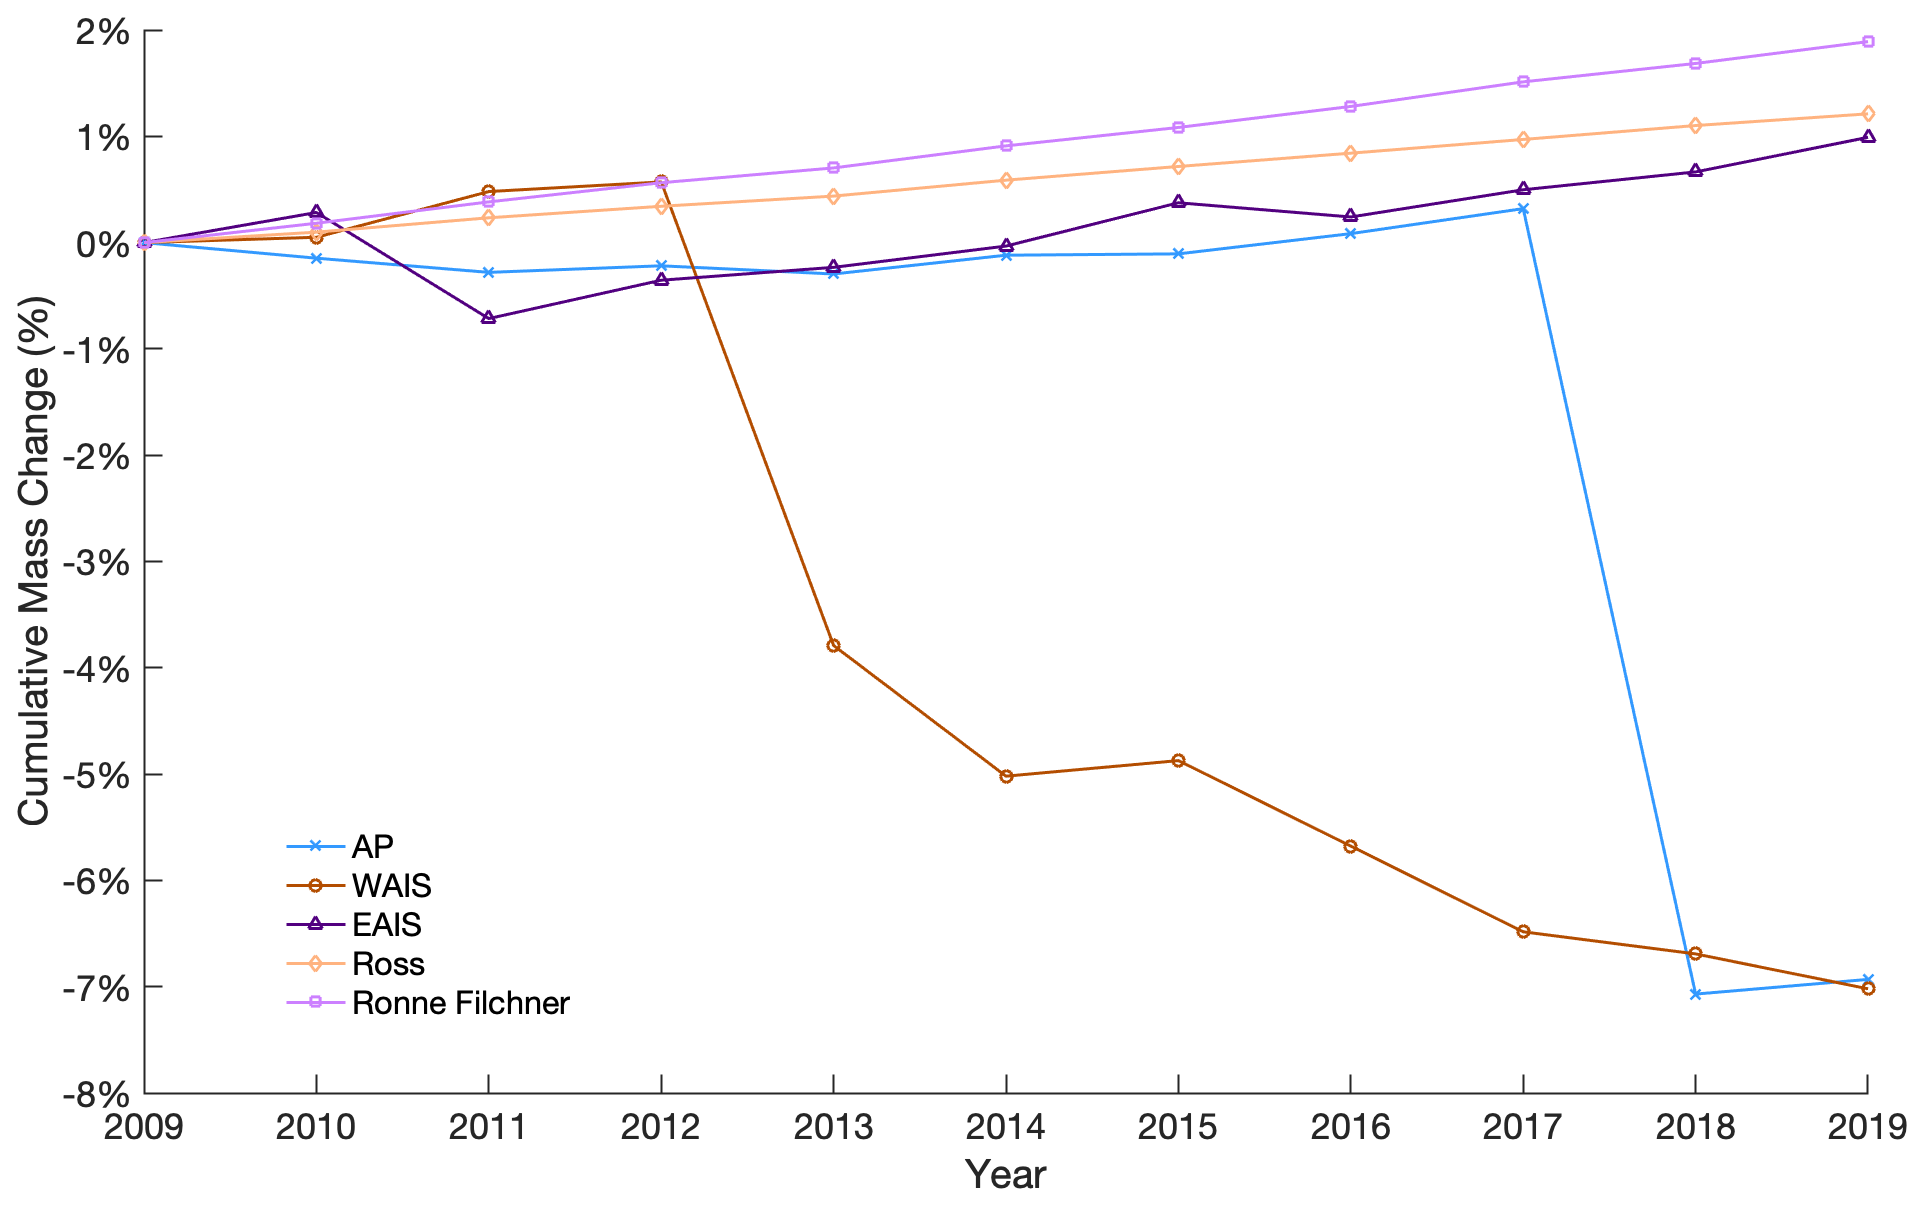
Figure 4Cumulative ice shelf mass change from 2009 to 2019 for the AP, WAIS, EAIS, Ross Ice Shelf, and Ronne–Filchner ice shelves.
The Ronne and Filchner ice shelves are located on the opposite side of Antarctica, flowing into the Weddell Sea. From 2009 to 2019, the area of Ronne and Filchner ice shelves increased by 5889 km2 (1.7 %) and 2243 km2 (2.2 %; Fig. 2e), respectively, with annual growth rates of 535 and 204 km2 yr−1 (Figs. S10 and S11). Before 2009, major calving events occurred on the Filchner Ice Shelf in 1986, where a total area of 11 500 km2 was lost, and 1998, when a 150 km × 35 km iceberg calved, returning the ice shelf calving front to its 1947 position (Ferrigno and Gould, 1987). Prior to these calving events, large 19 km wide rifts grew parallel to the ice front from 1957 onwards, illustrating the long-term gradual build-up to the calving events (Swithinbank et al., 1988). In May 2021, the Ronne Ice Shelf calved an iceberg from its western edge, with an area of 4 310 km2, resulting in a total ice shelf area of 341 957 km2.
Since 2009, the area of the Riiser–Larsen ice shelves has grown by 1.1 %, from 43 544 km2 in 2009 to 44 042 km2 in 2019, with an average growth rate of 45 km2 yr−1 (Fig. S13). Few historical calving events have been reported on the Riiser–Larsen ice shelves. This suggests that it has remained in a relatively stable configuration, with faster-flowing ice feeding the southern zone (73 to 74∘ S) and slower-flowing ice feeding into the north (72 to 73∘ S; Lange and Kohnen, 1985). The Fimbul Ice shelf is located adjacent to the Riiser–Larsen in Dronning Maud Land and has grown by 1.2 % from 40 801 km2 in 2009 and 41 277 km2 in 2019 (Fig. S14). The central region of the Fimbul Ice Shelf is primarily fed by the flow of ice from Jutulstraumen Glacier, which flows at speeds of approximately 760 m yr−1 (Neckel et al., 2021). The Jutulstraumen Glacier splits the ice shelf into the fast-flowing eastern region, which includes the Trolltunga ice tongue, and the slower western sector (Humbert and Steinhage, 2011).
The Amery Ice Shelf is located in central East Antarctica and has grown steadily by 1502 km2 from 2009 to 2019. Prior to 2009, Amery's most recent major calving event occurred in 1963/1964, where approximately 10 000 km2 of ice was lost (Fricker et al., 2002). At its 2019 average rate of advance of 137 km2 yr−1, it would take an additional 5 to 10 years for the calving front location to return to its 1960 pre-calved position, possibly indicating a calving cycle of around 60 to 70 years (Fricker et al., 2002). Satellite observations have shown several prominent and growing rifts at the centre of the ice shelf calving front, and over the past 34+ years, this rift has stretched inland and split into two separate branches caused by transverse ice spreading (Fricker et al., 2002). In early 2019, the northern branch reached a total length of 35 km from the main rift, while the southern branch reached 25 km. In September 2019, the western side of this fracture calved off, forming a 30 km wide and 60 km long iceberg (D-28), with this calving event thought to be triggered by major twin polar cyclones producing increased tides and winds (Fig. S16; Francis et al., 2021). Shackleton Ice Shelf, situated between West Ice Shelf and Law Dome and one of the larger ice shelves in East Antarctica, experienced overall growth of 840.7 km2 from 2009 to 2019 (Fig. S18).
3.7 Overall change in Antarctic ice shelf area
Our results show that, over the 11 years from 2009 to 2019, ice shelves in Antarctica gained a modest 0.4 % (or 5305 km2) of their total ice area (Table 1; Fig. 1). This area gain was dominated by significant 14 028 km2 (1.5 %) ice shelf area gains on the two largest Antarctic ice shelves, Ronne–Filchner and Ross, and a 3532 km2 (1.3 %) area gain on the East Antarctic ice shelves. This counteracted the large reduction in ice shelf area on the Antarctic Peninsula, where 7.0 % (−6692.5 km2) of ice was lost, and West Antarctica, where ice shelves lost 5.5 % (−5563 km2) of their 2009 area. From 2009 to 2019, our observations show that the WAIS and Antarctic Peninsula (AP) experienced overall cumulative mass loss, whereas the AP, Ross, and Ronne–Filchner saw cumulative ice mass growth (Fig. 4). Ice shelves along the West Antarctic Ice Sheet lost 150.2 Gt yr−1 of ice mass, with individual drainage basins including Pine Island, Thwaites, and Abbot contributing the most ice loss. On the Antarctic Peninsula, ice shelves also lost a total mass of 104 Gt yr−1 over the last decade, contributing significantly to freshwater input into the ocean. Larger shelves such as Ross, Ronne, and Filchner, gained 262 Gt yr−1 of ice. In East Antarctica, Baudouin, Totten, Mertz, and Nansen were the only shelves to lose ice (−5, −4, −50, and −2 Gt yr−1, respectively); however, the region as a whole gained 51 Gt yr−1 of ice from 2009 to 2019.
3.8 Steady-state calving flux
In the absence of an observed measurement of ice loss from iceberg calving, previous studies have used the steady-state calving approximation to estimate the volume of ice lost through calving processes (Rignot et al., 2013; Depoorter et al., 2013). This method assumes that all ice flow through a fixed flux gate, usually located near or at the last known calving front position, is lost through iceberg calving (Rignot et al., 2013). We calculated the mass change from both the observed and steady-state calving flux methods for all 34 ice shelves in Antarctica to assess the impact of fully accounting for observed change over the last decade (Table 1). We calculated the ice mass change using the observed calving flux by multiplying the area difference from 2009 to 2019 by the mean ice thickness (Fretwell et al., 2013) at the most inland calving front and the density of ice (ρ=0.9166 Gt km−3). The ice mass change, using a steady-state assumption, was estimated using a flux gate located at the most inland observed calving front position on each ice shelf since 2009, where the mean ice speed, MEaSUREs ice velocity at 450 m resolution, is extracted from the gate location (Mouginot et al., 2019). This is multiplied by the mean ice thickness (Fretwell et al., 2013), the length of the calving front, and the density of ice (Rignot et al., 2013; Table S2). We used the most inland calving front position when calculating ice thickness and velocity to ensure that the fronts were within the spatial coverage of the thickness and velocity datasets. To compare the different methods, we calculated the difference between the two numbers on all ice shelves within the study. We observed mass loss on 18 ice shelves and mass gain on 16. Overall, the steady-state assumption will overestimate ice loss on ice shelves that are advancing and underestimate ice loss on ice shelves that are retreating. The assumption also does not hold well for any irregular behaviour, such as ice shelves that have lost ice through large calving events. Our observations show that Antarctic ice shelves gained 660.6 Gt of ice mass from 2009 to 2019, whereas the steady-state approach would estimate ice loss of −20 028.1 Gt over the same period (Table 1). The steady-state calving flux approximation is closest to the observations on the Antarctic Peninsula; however, the amount of ice loss is significantly overestimated in both West and East Antarctica and on all large ice shelves. These comparisons are in agreement with past studies that compare observed data to steady state (Liu et al., 2015) and show that time-variable observations of calving flux are essential for accurately quantifying the timing and volume of ice shelf calving flux in Antarctica.
This study has generated a comprehensive dataset of change in ice shelf area on 34 Antarctica ice shelves over the last decade. Overall, ice shelves on the Antarctic Peninsula and West Antarctica lost areas of 6693 km2 and 5563 km2, respectively, while East Antarctic ice shelves gained 3532 km2 of ice, and the large ice shelves of Ross, Ronne, and Filchner grew by 14 028 km2 (total). This dataset is a high spatial resolution record of change from 2009 to 2019, which shows the regional differences in ice shelf calving behaviour and documents the frequency and magnitude of ice shelf calving events across the continent on decadal timescales. These observations will be useful for regional studies of ice shelf change in Antarctica and can be used as an input dataset for modelling studies or as a validation dataset for future studies that develop more automated methods of measuring change in ice shelf calving front position. Future studies should use the historical satellite data archives to extend the record of ice shelf area change, which will allow us to establish whether there is a long-term change in ice shelf calving frequency in Antarctica. We must develop and apply automated techniques to increase the frequency with which calving front measurements can be made, particularly on smaller ice shelves and glaciers, which will allow shorter-term, seasonal calving behaviour to be characterised and monitored.
The MODIS satellite imagery is available from the MODIS Antarctic ice shelf Image Archive (https://doi.org/10.7265/N5NC5Z4N; Scambos et al., 1996). Ice shelf thickness data and surface elevation Bedmap2 data are available at https://www.bas.ac.uk/project/bedmap-2/ and https://doi.org/10.5194/tc-7-375-2013 (Fretwell et al., 2013). Ice velocity data from the MEaSUREs InSAR-Based Antarctica Ice Velocity Map, Version 2, are available at https://doi.org/10.5067/IKBWW4RYHF1Q (Rignot et al., 2016). The coastline delineations presented in this work are available as .zip shapefiles at https://doi.org/10.5281/zenodo.7830051 (Andreasen et al., 2023).
The supplement related to this article is available online at: https://doi.org/10.5194/tc-17-2059-2023-supplement.
JRA and AEH planned the research. JRA and HLS performed the measurements. JRA and AEH analysed the data, wrote the draft, and reviewed and edited the paper.
The contact author has declared that none of the authors has any competing interests.
Publisher’s note: Copernicus Publications remains neutral with regard to jurisdictional claims in published maps and institutional affiliations.
This work was led by Julia R. Andreasen at the University of Minnesota's Department of Soil, Water, and Climate and the School of Earth and Environment at the University of Leeds. Julia R. Andreasen has been supported by the Future Investigators in NASA Earth and Space Science and Technology (FINESST) Award. Anna E. Hogg has been supported by the Natural Environment Research Council (NERC) DeCAdeS project (grant no. NE/T012757/1) and the ESA Polar+ Ice Shelves project (grant no. ESA-IPL-POE-EF-cb-LE-2019-834). The authors gratefully acknowledge the National Aeronautics and Space Administration for acquiring the MODIS satellite data. We acknowledge the use of the datasets produced through the NASA MEaSUREs programme and are grateful for the funding of the development of long-term climate data records from satellite observations.
This research has been supported by the Natural Environment Research Council (grant no. 118294).
This paper was edited by Nicolas Jourdain and reviewed by Chad Greene and one anonymous referee.
Adusumilli, S., Fricker, H. A., Medley, B., Padman, L., and Siegfried, M. R.: Interannual variations in meltwater input to the Southern Ocean from Antarctic ice shelves, Nat. Geosci., 13, 616–620, https://doi.org/10.1038/s41561-020-0616-z, 2020.
Anderson, R., Jones, D. H., and Gudmundsson, G. H.: Halley Research Station, Antarctica: calving risks and monitoring strategies, Nat. Hazards Earth Syst. Sci., 14, 917–927, https://doi.org/10.5194/nhess-14-917-2014, 2014.
Andreasen, J. R., Hogg, A. E., and Selley, H. L.: Change in Antarctic Ice Shelf Area from 2009 to 2019, Zenodo [data set], https://doi.org/10.5281/zenodo.7830051, 2023.
Baumhoer, C., Dietz, A., Dech, S., and Kuenzer, C.: Remote Sensing of Antarctic Glacier and Ice-Shelf Front Dynamics–A Review, Remote Sens., 10, 1445, https://doi.org/10.3390/rs10091445, 2018.
Baumhoer, C. A., Dietz, A. J., Kneisel, C., and Kuenzer, C.: Automated Extraction of Antarctic Glacier and Ice Shelf Fronts from Sentinel-1 Imagery Using Deep Learning, Remote Sens., 11, 2529, https://doi.org/10.3390/rs11212529, 2019.
Baumhoer, C. A., Dietz, A. J., Kneisel, C., Paeth, H., and Kuenzer, C.: Environmental drivers of circum-Antarctic glacier and ice shelf front retreat over the last two decades, The Cryosphere, 15, 2357–2381, https://doi.org/10.5194/tc-15-2357-2021, 2021.
Brunt, K. M., Okal, E. A., and MacAyeal, D. R.: Antarctic ice-shelf calving triggered by the Honshu (Japan) earthquake and tsunami, J. Glaciol., 57, 785–788, https://doi.org/10.3189/002214311798043681, 2011.
Christie, F. D. W., Benham, T. J., Batchelor, C. L., Rack, W., Montelli, A., and Dowdeswell, J. A.: Antarctic ice-shelf advance driven by anomalous atmospheric and sea-ice circulation, Nat. Geosci., 15, 356–362, https://doi.org/10.1038/s41561-022-00938-x, 2022.
Cook, A. J. and Vaughan, D. G.: Overview of areal changes of the ice shelves on the Antarctic Peninsula over the past 50 years, The Cryosphere, 4, 77–98, https://doi.org/10.5194/tc-4-77-2010, 2010.
Cook, A. J., Fox, A. J., Vaughan, D. G., and Ferrigno, J. G.: Retreating Glacier Fronts on the Antarctic Peninsula over the Past Half-Century, Science, 308, 541–544, https://doi.org/10.1126/science.1104235, 2005.
Crabtree, R. D. and Doake, C. S. M.: Pine Island Glacier and Its Drainage Basin: Results From Radio Echo-Sounding, Ann. Glaciol., 3, 65–70, https://doi.org/10.3189/S0260305500002548, 1982.
Depoorter, M. A., Bamber, J. L., Griggs, J. A., Lenaerts, J. T. M., Ligtenberg, S. R. M., van den Broeke, M. R., and Moholdt, G.: Calving fluxes and basal melt rates of Antarctic ice shelves, Nature, 502, 89–92, https://doi.org/10.1038/nature12567, 2013.
Dutrieux, P., Stewart, C., Jenkins, A., Nicholls, K. W., Corr, H. F. J., Rignot, E., and Steffen, K.: Basal terraces on melting ice shelves, Geophys. Res. Lett., 41, 5506–5513, https://doi.org/10.1002/2014GL060618, 2014.
Dziak, R. P., Song Lee, W., Yun, S., Lee, C.-K., Haxel, J. H., Lau, T.-K., Matsumoto, H., Roche, L., and Tepp, G.: The 2016 Nansen Ice Shelf Calving Event: Hydroacoustic and Meteorological Observations of Ice Shelf Fracture and Iceberg Formation, 2018 OCEANS – MTS/IEEE Kobe Techno-Ocean (OTO), Kobe, 1–7, https://doi.org/10.1109/OCEANSKOBE.2018.8559076, 2018.
Ferrigno, J. G. and Gould, W. G.: Substantial changes in the coastline of Antarctica revealed by satellite imagery, Polar Rec., 23, 577–583, https://doi.org/10.1017/S003224740000807X, 1987.
Francis, D., Mattingly, K. S., Lhermitte, S., Temimi, M., and Heil, P.: Atmospheric extremes caused high oceanward sea surface slope triggering the biggest calving event in more than 50 years at the Amery Ice Shelf, The Cryosphere, 15, 2147–2165, https://doi.org/10.5194/tc-15-2147-2021, 2021.
Fretwell, P., Pritchard, H. D., Vaughan, D. G., Bamber, J. L., Barrand, N. E., Bell, R., Bianchi, C., Bingham, R. G., Blankenship, D. D., Casassa, G., Catania, G., Callens, D., Conway, H., Cook, A. J., Corr, H. F. J., Damaske, D., Damm, V., Ferraccioli, F., Forsberg, R., Fujita, S., Gim, Y., Gogineni, P., Griggs, J. A., Hindmarsh, R. C. A., Holmlund, P., Holt, J. W., Jacobel, R. W., Jenkins, A., Jokat, W., Jordan, T., King, E. C., Kohler, J., Krabill, W., Riger-Kusk, M., Langley, K. A., Leitchenkov, G., Leuschen, C., Luyendyk, B. P., Matsuoka, K., Mouginot, J., Nitsche, F. O., Nogi, Y., Nost, O. A., Popov, S. V., Rignot, E., Rippin, D. M., Rivera, A., Roberts, J., Ross, N., Siegert, M. J., Smith, A. M., Steinhage, D., Studinger, M., Sun, B., Tinto, B. K., Welch, B. C., Wilson, D., Young, D. A., Xiangbin, C., and Zirizzotti, A.: Bedmap2: improved ice bed, surface and thickness datasets for Antarctica, The Cryosphere, 7, 375–393, https://doi.org/10.5194/tc-7-375-2013, 2013 (data available at: https://www.bas.ac.uk/project/bedmap-2/, last access: 12 May 2023).
Fricker, H. A., Young, N. W., Allison, I., and Coleman, R.: Iceberg calving from the Amery Ice Shelf, East Antarctica, Ann. Glaciol., 34, 241–246, https://doi.org/10.3189/172756402781817581, 2002.
Fürst, J. J., Durand, G., Gillet-Chaulet, F., Tavard, L., Rankl, M., Braun, M., and Gagliardini, O.: The safety band of Antarctic ice shelves, Nat. Clim. Change, 6, 479–482, https://doi.org/10.1038/nclimate2912, 2016.
Greenbaum, J. S., Blankenship, D. D., Young, D. A., Richter, T. G., Roberts, J. L., Aitken, A. R. A., Legresy, B., Schroeder, D. M., Warner, R. C., van Ommen, T. D., and Siegert, M. J.: Ocean access to a cavity beneath Totten Glacier in East Antarctica, Nat. Geosci., 8, 294–298, https://doi.org/10.1038/ngeo2388, 2015.
Greene, C. A., Gardner, A. S., Schlegel, N.-J., and Fraser, A. D.: Antarctic calving loss rivals ice-shelf thinning, Nature, 609, 948–953, https://doi.org/10.1038/s41586-022-05037-w, 2022.
Hogg, A. E. and Gudmundsson, G. H.: Impacts of the Larsen-C Ice Shelf calving event, Nat. Clim. Change, 7, 540–542, https://doi.org/10.1038/nclimate3359, 2017.
Hogg, A. E., Gilbert, L., Shepherd, A., Muir, A. S., and McMillan, M.: Extending the record of Antarctic ice shelf thickness change, from 1992 to 2017, Adv. Space Res., 68, 724–731, https://doi.org/10.1016/j.asr.2020.05.030, 2021.
Holland, P. R., Brisbourne, A., Corr, H. F. J., McGrath, D., Purdon, K., Paden, J., Fricker, H. A., Paolo, F. S., and Fleming, A. H.: Oceanic and atmospheric forcing of Larsen C Ice-Shelf thinning, The Cryosphere, 9, 1005–1024, https://doi.org/10.5194/tc-9-1005-2015, 2015.
Humbert, A. and Steinhage, D.: The evolution of the western rift area of the Fimbul Ice Shelf, Antarctica, The Cryosphere, 5, 931–944, https://doi.org/10.5194/tc-5-931-2011, 2011.
Humbert, A., Gross, D., Müller, R., Braun, M., van de Wal, R. S. W., van den Broeke, M. R., Vaughan, D. G., and van de Berg, W. J.: Deformation and failure of the ice bridge on the Wilkins Ice Shelf, Antarctica, Ann. Glaciol., 51, 49–55, https://doi.org/10.3189/172756410791392709, 2010.
Jacobs, S. S., MacAyeal, D. R., and Ardai Jr., J. L.: The Recent Advance of the Ross Ice Shelf Antarctica, J. Glaciol., 32, 464–474, https://doi.org/10.3189/S0022143000012181, 1986.
Joughin, I., Smith, B. E., and Medley, B.: Marine Ice Sheet Collapse Potentially Under Way for the Thwaites Glacier Basin, West Antarctica, Science, 344, 735–738, https://doi.org/10.1126/science.1249055, 2014.
Keys, H. J. R., Jacobs, S. S., and Brigham, L. W.: Continued northward expansion of the Ross Ice Shelf, Antarctica, Ann. Glaciol., 27, 93–98, https://doi.org/10.3189/1998AoG27-1-93-98, 1998.
Kulessa, B., Jansen, D., Luckman, A. J., King, E. C., and Sammonds, P. R.: Marine ice regulates the future stability of a large Antarctic ice shelf, Nat. Commun., 5, 3707, https://doi.org/10.1038/ncomms4707, 2014.
Lange, M. A. and Kohnen, H.: Ice Front Fluctuations in the Eastern and Southern Weddell Sea, Ann. Glaciol., 6, 187–191, https://doi.org/10.3189/1985AoG6-1-187-191, 1985.
Lazzara, M. A., Jezek, K. C., Scambos, T. A., MacAyeal, D. R., and Van Der Veen, C. J.: On the recent calving of icebergs from the Ross ice shelf, Polar Geography, 31, 15–26, https://doi.org/10.1080/10889370802175937, 2008.
Le Brocq, A. M., Payne, A. J., and Vieli, A.: An improved Antarctic dataset for high resolution numerical ice sheet models (ALBMAP v1), Earth Syst. Sci. Data, 2, 247–260, https://doi.org/10.5194/essd-2-247-2010, 2010.
Li, T., Ding, Y., Zhao, T., and Cheng, X.: Iceberg calving from the Antarctic Nansen Ice Shelf in April 2016 and its local impact, Sci. Bull., 61, 1157–1159, https://doi.org/10.1007/s11434-016-1124-9, 2016.
Lilien, D. A., Joughin, I., Smith, B., and Shean, D. E.: Changes in flow of Crosson and Dotson ice shelves, West Antarctica, in response to elevated melt, The Cryosphere, 12, 1415–1431, https://doi.org/10.5194/tc-12-1415-2018, 2018.
Liu, Y., Moore, J. C., Cheng, X., Gladstone, R. M., Bassis, J. N., Liu, H., Wen, J., and Hui, F.: Ocean-driven thinning enhances iceberg calving and retreat of Antarctic ice shelves, P. Natl. Acad. Sci. USA, 112, 3263–3268, https://doi.org/10.1073/pnas.1415137112, 2015.
Lucchitta, B. K. and Rosanova, C. E.: Retreat of northern margins of George VI and Wilkins Ice Shelves, Antarctic Peninsula, Ann. Glaciol., 27, 41–46, https://doi.org/10.3189/1998AoG27-1-41-46, 1998.
MacGregor, J. A., Catania, G. A., Markowski, M. S., and Andrews, A. G.: Widespread rifting and retreat of ice-shelf margins in the eastern Amundsen Sea Embayment between 1972 and 2011, J. Glaciol., 58, 458–466, https://doi.org/10.3189/2012JoG11J262, 2012.
Massom, R. A., Giles, A. B., Warner, R. C., Fricker, H. A., Legrésy, B., Hyland, G., Lescarmontier, L., and Young, N.: External influences on the Mertz Glacier Tongue (East Antarctica) in the decade leading up to its calving in 2010: External factors affect glacier tongue, J. Geophys. Res.-Earth, 120, 490–506, https://doi.org/10.1002/2014JF003223, 2015.
Matsuoka, K., Hindmarsh, R. C. A., Moholdt, G., Bentley, M. J., Pritchard, H. D., Brown, J., Conway, H., Drews, R., Durand, G., Goldberg, D., Hattermann, T., Kingslake, J., Lenaerts, J. T. M., Martín, C., Mulvaney, R., Nicholls, K. W., Pattyn, F., Ross, N., Scambos, T., and Whitehouse, P. L.: Antarctic ice rises and rumples: Their properties and significance for ice-sheet dynamics and evolution, Earth-Sci. Rev., 150, 724–745, https://doi.org/10.1016/j.earscirev.2015.09.004, 2015.
Mouginot, J., Rignot, E., and Scheuchl, B.: Sustained increase in ice discharge from the Amundsen Sea Embayment, West Antarctica, from 1973 to 2013, Geophys. Res. Lett., 41, 1576–1584, https://doi.org/10.1002/2013GL059069, 2014.
Mouginot, J., Rignot, E., and Scheuchl, B.: Continent-Wide, Interferometric SAR Phase, Mapping of Antarctic Ice Velocity, Geophys. Res. Lett., 46, 9710–9718, https://doi.org/10.1029/2019GL083826, 2019.
Neckel, N., Franke, S., Helm, V., Drews, R., and Jansen, D.: Evidence of Cascading Subglacial Water Flow at Jutulstraumen Glacier (Antarctica) Derived From Sentinel-1 and ICESat-2 Measurements, Geophys. Res. Lett., 48, e2021GL094472, https://doi.org/10.1029/2021GL094472, 2021.
Padman, L., Costa, D. P., Dinniman, M. S., Fricker, H. A., Goebel, M. E., Huckstadt, L. A., Humbert, A., Joughin, I., Lenaerts, J. T. M., Ligtenberg, S. R. M., Scambos, T., and van den Broeke, M. R.: Oceanic controls on the mass balance of Wilkins Ice Shelf, Antarctica, J. Geophys. Res., 117, C01010, https://doi.org/10.1029/2011JC007301, 2012.
Rack, W. and Rott, H.: Pattern of retreat and disintegration of the Larsen B ice shelf, Antarctic Peninsula, Ann. Glaciol., 39, 505–510, https://doi.org/10.3189/172756404781814005, 2004.
Rignot, E., Casassa, G., Gogineni, P., Krabill, W., Rivera, A., and Thomas, R.: Accelerated ice discharge from the Antarctic Peninsula following the collapse of Larsen B ice shelf, Geophys. Res. Lett., 31, L18401, https://doi.org/10.1029/2004GL020697, 2004.
Rignot, E., Jacobs, S., Mouginot, J., and Scheuchl, B.: Ice-Shelf Melting Around Antarctica, Science, 341, 266–270, https://doi.org/10.1126/science.1235798, 2013.
Rignot, E., Mouginot, J., and Scheuchl, B.: MEaSUREs Antarctic Grounding Line from Differential Satellite Radar Interferometry, Version 2, NSIDC-0484 [data set], https://doi.org/10.5067/IKBWW4RYHF1Q, 2016.
Roberts, J., Galton-Fenzi, B. K., Paolo, F. S., Donnelly, C., Gwyther, D. E., Padman, L., Young, D., Warner, R., Greenbaum, J., Fricker, H. A., Payne, A. J., Cornford, S., Le Brocq, A., van Ommen, T., Blankenship, D., and Siegert, M. J.: Ocean forced variability of Totten Glacier mass loss, Geological Society, London, Special Publications, 461, 175–186, https://doi.org/10.1144/SP461.6, 2018.
Rott, H., Skvarca, P., and Nagler, T.: Rapid Collapse of Northern Larsen Ice Shelf, Antarctica, Science, 271, 788–792, https://doi.org/10.1126/science.271.5250.788, 1996.
Scambos, T. A., Bohlander, J., and Raup, B.: Images of Antarctic Ice Shelves, Boulder, Colorado, USA, National Snow and Ice Data Center [data set], https://doi.org/10.7265/N5NC5Z4N, 1996.
Scambos, T. A., Hulbe, C., Fahnestock, M., and Bohlander, J.: The link between climate warming and break-up of ice shelves in the Antarctic Peninsula, J. Glaciol., 46, 516–530, https://doi.org/10.3189/172756500781833043, 2000.
Scambos, T. A., Bohlander, J. A., Shuman, C. A., and Skvarca, P.: Glacier acceleration and thinning after ice shelf collapse in the Larsen B embayment, Antarctica, Geophys. Res. Lett., 31, L18402, https://doi.org/10.1029/2004GL020670, 2004.
Selley, H. L., Hogg, A. E., Cornford, S., Dutrieux, P., Shepherd, A., Wuite, J., Floricioiu, D., Kusk, A., Nagler, T., Gilbert, L., Slater, T., and Kim, T.-W.: Widespread increase in dynamic imbalance in the Getz region of Antarctica from 1994 to 2018, Nat. Commun., 12, 1133, https://doi.org/10.1038/s41467-021-21321-1, 2021.
Smethie, W. M. and Jacobs, S. S.: Circulation and melting under the Ross Ice Shelf: estimates from evolving CFC, salinity and temperature fields in the Ross Sea, Deep-Sea Res, Pt. I, 52, 959–978, https://doi.org/10.1016/j.dsr.2004.11.016, 2005.
Swithinbank, C., Brunk, K., and Sievers, J.: A Glaciological Map of Filchner-Ronne Ice Shelf, Antarctica, Ann. Glaciol., 11, 150–155, https://doi.org/10.3189/S0260305500006467, 1988.
Thomas, R. H., Sanderson, T. J. O., and Rose, K. E.: Effect of climatic warming on the West Antarctic ice sheet, Nature, 277, 355–358, https://doi.org/10.1038/277355a0, 1979.
Tinto, K. J., Padman, L., Siddoway, C. S., Springer, S. R., Fricker, H. A., Das, I., Caratori Tontini, F., Porter, D. F., Frearson, N. P., Howard, S. L., Siegfried, M. R., Mosbeux, C., Becker, M. K., Bertinato, C., Boghosian, A., Brady, N., Burton, B. L., Chu, W., Cordero, S. I., Dhakal, T., Dong, L., Gustafson, C. D., Keeshin, S., Locke, C., Lockett, A., O'Brien, G., Spergel, J. J., Starke, S. E., Tankersley, M., Wearing, M. G., and Bell, R. E.: Ross Ice Shelf response to climate driven by the tectonic imprint on seafloor bathymetry, Nat. Geosci., 12, 441–449, https://doi.org/10.1038/s41561-019-0370-2, 2019.
Trevers, M., Payne, A. J., Cornford, S. L., and Moon, T.: Buoyant forces promote tidewater glacier iceberg calving through large basal stress concentrations, The Cryosphere, 13, 1877–1887, https://doi.org/10.5194/tc-13-1877-2019, 2019.
Vaughan, D. G.: Implications of the break-up of Wordie Ice Shelf, Antarctica for sea level, Antartic Science, 5, 403–408, https://doi.org/10.1017/S0954102093000537, 1993.
Wuite, J., Nagler, T., Gourmelen, N., Escorihuela, M. J., Hogg, A. E., and Drinkwater, M. R.: Sub-Annual Calving Front Migration, Area Change and Calving Rates from Swath Mode CryoSat-2 Altimetry, on Filchner-Ronne Ice Shelf, Antarctica, Remote Sens., 11, 2761, https://doi.org/10.3390/rs11232761, 2019.