the Creative Commons Attribution 4.0 License.
the Creative Commons Attribution 4.0 License.
 | 05 Apr 2023
Snowmelt characterization from optical and synthetic-aperture radar observations in the La Joie Basin, British Columbia
Sara E. Darychuk
Joseph M. Shea
Brian Menounos
Anna Chesnokova
Georg Jost
Frank Weber
Snowmelt runoff serves both human needs and ecosystem services and is an important parameter in operational forecasting systems. Sentinel-1 synthetic-aperture-radar (SAR) observations can estimate the timing of melt within a snowpack; however, these estimates have not been applied on large spatial scales. Here we present a workflow to combine Sentinel-1 SAR and optical data from Landsat-8 and Sentinel-2 to estimate the onset and duration of snowmelt in the La Joie Basin, a 985 km2 watershed in the southern Coast Mountains of British Columbia. A backscatter threshold is used to infer the point at which snowpack saturation occurs and the snowpack begins to produce runoff. Multispectral imagery is used to estimate snow-free dates across the basin to define the end of the snowmelt period. SAR estimates of snowmelt onset form consistent trends in terms of elevation and aspect on the watershed scale and reflect snowmelt records from continuous snow water equivalence observations. SAR estimates of snowpack saturation are most effective on moderate to low slopes (< 30∘) in open areas. The accuracy of snowmelt duration is reduced due to persistent cloud cover in optical imagery. Despite these challenges, snowmelt duration agrees with trends in snow depths observed in the La Joie Basin. This approach has high potential for adaptability to other alpine regions and can provide estimates of snowmelt timing in ungauged basins.
- Article
(8725 KB) - Full-text XML
-
Supplement
(2297 KB) - BibTeX
- EndNote


Snowmelt runoff is an important source of streamflow or groundwater recharge in many regions of the world. Snowmelt comprises approximately 32 % of global freshwater discharge (Meybeck et al., 2001), and over a billion people depend on this seasonal water source (Barnett et al., 2005). Both the volume and persistence of the snowpack are altered by warming global temperatures (Mote et al., 2005). Changes in snowmelt timing will broadly impact ecosystem health and natural hazard frequency, as the timing of snowmelt is linked with trends in soil moisture (Harpold et al., 2015; Kampf et al., 2015), streamflow (Luce and Holden, 2009; Rauscher et al., 2008; Déry et al., 2009), and wildfires (Westerling, 2016; Westerling et al., 2006). To predict the release of water from a snowpack, a thorough understanding of snowmelt is required.
Snowmelt occurs during three phases: moistening, ripening, and runoff (Dingman, 2015). Snowmelt begins with moistening, when the top layers of the snowpack start to melt due to increases in air temperatures or solar radiation. When the wetting front penetrates the snowpack, the ripening phase begins. Once the snowpack is fully saturated and isothermal (0 ∘C throughout), further energy inputs will be directed at snowmelt and liquid water will be released (Dingman, 2015). The phases of snowmelt can be identified through continuous measurements of liquid water content (LWC) and snow water equivalence (SWE). The runoff phase initiates when a snowpack has reached its maximum liquid water content and SWE sharply declines.
Several methods exist to monitor SWE and snowpack LWC. SWE is measured manually via snow sampling tubes or automatically via snow scales and snow pillows (Kinar and Pomeroy, 2015). Manual and automated measurements of LWC use variable techniques, including dielectric, centrifugal, or calorimetric methods (Kinar and Pomeroy, 2015). Centrifugal and calorimetric methods are time-consuming and destructive, whereas dielectric techniques are more common for in situ observations of LWC. Systems that exploit dielectric properties in the microwave region of the electromagnetic spectrum, such as the snowpack analyzer (Stähli et al., 2004) or upward-looking ground-penetrating radar (Schmid et al., 2014), can provide automated LWC measurements for operational forecasting. Establishing networks of continuous SWE and LWC observations is labour-intensive and expensive in high alpine areas, which are difficult to access and can experience extreme winter conditions. Due to these time and cost constraints, physical snowpack observations are often limited to point observations at mid-elevations of mountainous ranges and are insufficient to capture the spatial variability of the snowpack.
Snow cover is highly variable from the watershed to sub-grid scale (Deems et al., 2006; Lopez-Moreno et al., 2015), and point observations do not always represent snowpack conditions in nearby areas (Elder et al., 1991; Neumann et al., 2006). Further, high-elevation snowpack observations are crucial, as headwater regions generate large proportions of baseflow in mountain streams (Rumsey et al., 2020). In the province of British Columbia, Canada, there are 120 automated snow weather stations that monitor 22 major watersheds (Government of British Columbia, 2017). These stations are situated at an average elevation of 1400 m above sea level (), and less than 10 % are located above 2000 to monitor high alpine snowpacks (i.e., the Coast Mountains and Rocky Mountains of British Columbia reach elevations of 4000 and 3300 , respectively). The low density of physical observations in mountain regions, such as those in British Columbia, hinder snowpack monitoring and modelling efforts. Distributed observations of the snowpack are required for accurate snowmelt runoff forecasting and model improvement (Luce et al., 1998). Considering the need for spatially distributed observations of the snowpack, remote sensing observations are attractive supplements to physical monitoring systems.
Remote sensing data offer alternative methods to monitor snowmelt and estimate the timing of runoff from the snowpack. Marin et al. (2020) demonstrated the sensitivity of Sentinel-1 synthetic aperture radar (SAR) to SWE and snowpack LWC at five test sites in the European Alps. Three phases of melting were identified from the SAR time series at point locations. The onset of snowmelt runoff, or the point in time when LWC is at its maximum and SWE sharply declines, coincided with minima in SAR time series at all test locations. SAR is effective for monitoring snowmelt due to its sensitivity to the LWC of snow; however, SAR signals will be broadly impacted by land cover type and topography.
C-band SAR signals (such as those from Sentinel-1) can penetrate dry snowpacks to depths of several metres (Mätzler, 1987). In a dry snowpack, the backscatter signal is the sum of volume scattering within the snowpack and surface scattering at the snow–ground interface; however, surface scattering is the dominant signal (Shi and Dozier, 1995; Nagler and Rott, 2000). In a wet snowpack, liquid water becomes the dominant factor influencing backscatter and surface scattering can be neglected (Shi and Dozier, 1995; Nagler and Rott, 2000). As demonstrated by Marin et al. (2020), backscatter values become increasingly negative as LWC increases during the ablation season, reaching a minimum at the point of runoff (or melt) onset. After reaching their minima, backscatter values increase until the snowpack dissipates (Marin et al., 2020). However, the relation between SAR and snowmelt will be impacted by physical properties of the snowpack and local terrain. SAR signals are altered by snowpack properties such as snow grain size, density, depth, stratigraphy, impurity content, and surface roughness (Liu et al., 2006). Further, the magnitude of SAR backscatter values over snow-covered regions will be impacted by local incidence angle (Nagler and Rott, 2000; Shi and Dozier, 1995), forest cover (Pivot, 2012), and polarization (Nagler et al., 2016). The influence of snowpack characteristics and topography on SAR estimates of snowmelt onset requires further exploration.
In British Columbia, where mountain ranges and winter snowpacks dominate the landscape, remote sensing observations are needed to characterize snowmelt because few physical snowpack measurements are available. In this paper, we use C-band Sentinel-1 SAR imagery with Landsat-8 and Sentinel-2 multispectral imagery to define the onset and duration of snowmelt in the La Joie Basin, a large watershed in the southern Coast Mountains of British Columbia. We examine how the relation between SAR minima and snowmelt (Marin et al., 2020) is impacted by polarization, land cover, aspect, and hillslope in the La Joie Basin. We further assess how estimates of snowmelt onset and duration can be verified with continuous records of SWE. This work establishes a low-cost and adaptable method for monitoring snowmelt onset in ungauged basins that can be used by watershed managers across western North America.

Figure 1The La Joie Basin by land cover type. Land cover types were determined via a random forest classification in Google Earth Engine from Sentinel-2 imagery.
The La Joie Basin is a 985 km2 watershed located in the Coast Mountains of British Columbia, 170 km north of Vancouver. Runoff in the watershed flows into Downton Lake, which is formed by the La Joie Dam. The La Joie Basin is a critical area for hydroelectric power generation as the La Joie Dam is the first structure in a larger hydroelectric system that generates approximately 5 % of the province's power. The watershed ranges in elevation from 800 to 2800 and has a median elevation of 1910 The lower elevations of the La Joie Basin are forested, and the treed area covers 47 % of the catchment (Fig. 1). The dominant biogeoclimatic zones in the watershed are Engelmann Spruce–Subalpine Fir and Montane Spruce, with small areas of Interior Mountain Heather Alpine and Boreal Altai Fescue Alpine zones (Pojar et al., 1987). Forest harvesting occurs within the watershed to a minor extent, with less than 10 % of the basin impacted.
Precipitation records from the Green Mountain automated weather station (Fig. 1) indicate this region received an average of 1090 mm of precipitation between 1993 and 2011. During this period, approximately 39 % of precipitation fell as snow and SWE values exceeded 1300 mm. Of the total basin area, 16 % is glacierized (Fig. 1). As a result, the basin has a nival–glacial hydrological regime and is mostly fed by snowmelt in May and June and glacier melt in July and August.
3.1 Telemetry and lidar data
Two automated weather stations located in the La Joie Basin are operated by the provincial hydroelectric utility BC Hydro (Fig. 1). The Downton Lake Upper automated weather station (1829 ) and Green Mountain automated weather station (1725 ) provide hourly records of temperature, precipitation, and SWE. Downton Lake Upper is situated on a northwest-facing slope and is classified as disturbed forest (Fig. 1). Green Mountain is situated on a northeast-facing slope and is classified as mature forest (Fig. 1).
A 5 m bare-earth lidar DEM was used to create slope, aspect, and elevation classes in the La Joie Basin. Lidar data were collected on 22 September 2017 from a fixed-wing aircraft using methods described elsewhere (Pelto et al., 2019). The DEM was resampled to 30 m and classified into 4 aspect classes, 6 slope classes, and 20 elevation classes.
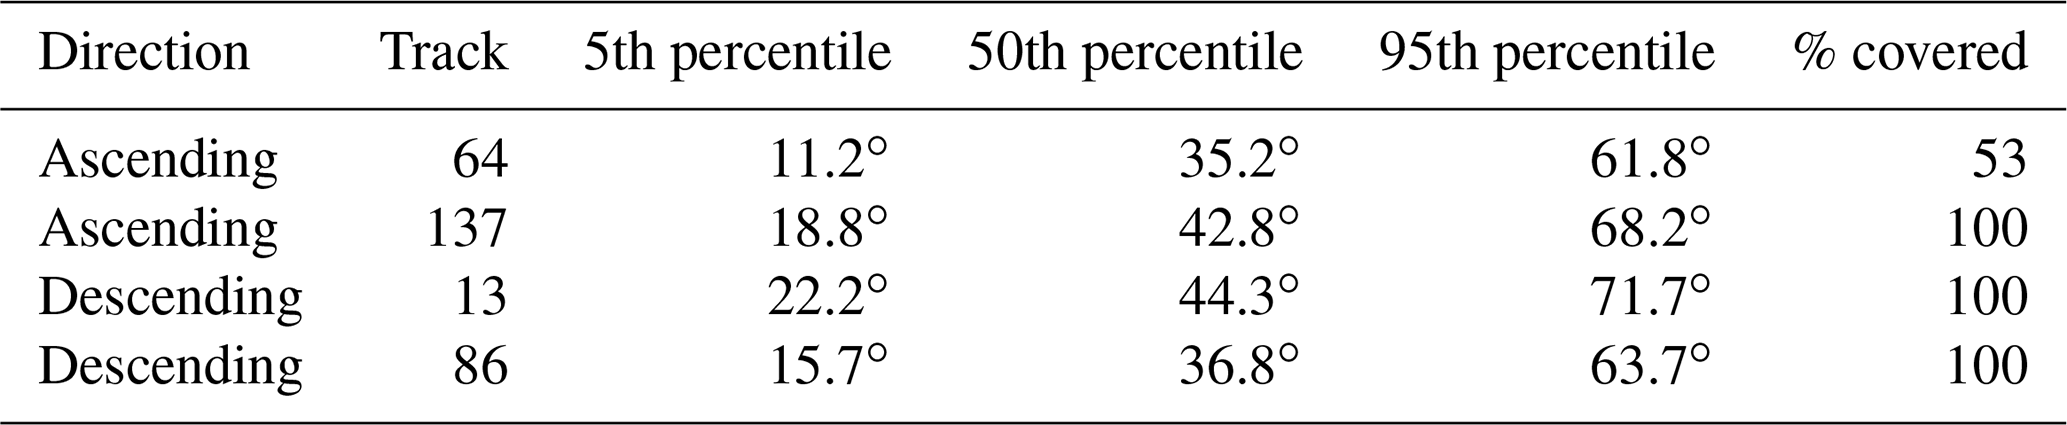
Table 1Sentinel-1 SAR orbit tracks over the La Joie Basin. Percentiles for average local incidence angles for each track are displayed, as well as the area covered by that track (calculated as a percent of the total basin area).
3.2 Sentinel-1 SAR
The Sentinel-1 constellation acquires SAR scenes every 2 to 3 d over the La Joie Basin. The constellation consists of two satellites orbiting the Earth in ascending and descending directions. Each satellite has two tracks that capture the La Joie Basin. In the descending direction both tracks (13 and 86) completely capture the La Joie Basin; however, in the ascending direction only one track (137) has full coverage, while the other (64) only captures the eastern side of the basin (Table 1). Local incidence angles vary slightly by satellite track (Table 1). On average, incidence angles are higher for tracks in the descending direction (Table 1). Local incidence angles in descending Sentinel-1 images at Downton Lake Upper measure between 33 and 42 ∘, whereas at Green Mountain they measure between 26 and 34∘.
Images over the watershed are acquired in the interferometric wide-swath mode, the default collection mode over land. These SAR scenes have a resolution of 10 m and have two polarization bands available, VV (vertical–vertical) and VH (vertical–horizontal).
The Level-1 ground-range-detected (GRD) Sentinel-1 SAR dataset from Google Earth Engine (GEE) is pre-processed using the Sentinel-1 Toolbox (European Space Agency, 2021). The images undergo five steps during correction:
-
application of the precise orbital file,
-
removal of the GRD border noise,
-
removal of thermal noise,
-
conversion of digital numbers to backscatter (σ∘) in decibels (dB),
-
correction of images for terrain (range–Doppler method)
The Committee on Earth Observation Society Analysis Ready Data for Land (CEOS-ARD) identify additional steps needed for SAR pre-processing (Lewis et al., 2018) that are not included in the Sentinel-1 GEE catalogue. These steps include radiometric terrain correction and pixel-based identification of shadow or layover (Lewis et al., 2018).
3.3 Multispectral and optical data
The operational land imager and thermal infrared sensor aboard Landsat-8 from the National Aeronautics and Space Administration acquire imagery over the La Joie Basin every 16 d. Images are provided at a 30 m resolution, and bands provide coverage across the visible, near-infrared, and shortwave-infrared spectrums. Top-of-atmosphere (TOA) reflectance Landsat-8 scenes are publicly available in the GEE data catalogue.
The multispectral instrument aboard Sentinel-2 from the European Space Agency collects multispectral imagery over the La Joie Basin every 6 d. Images are provided at 20 m resolution, and bands provide coverage across the visible, red-edge, near-infrared, shortwave-infrared, and thermal spectrums. TOA reflectance Sentinel-2 scenes are freely available in the GEE data catalogue.
4.1 Snowpack saturation from Sentinel-1 SAR
Dates of snowpack saturation from 2018 to 2021 were estimated from Sentinel-1 SAR images. GEE was used to access, correct, and download Sentinel-1 SAR scenes. To detect the onset of snowmelt in the basin, we restricted our analysis for SAR scenes acquired between February and August. We created eight image collections from Sentinel-1 SAR scenes, with two collections created for each study year based on the directional pass of the satellite (ascending or descending) (Table 2). To prevent border noise from impacting results, we only selected images containing the whole basin (i.e., those captured by tracks 13, 86, and 137) to create the stacks. We corrected the Sentinel-1 image collections for slope-induced radiometric distortion using a volumetric model (Vollrath et al., 2020) and applied a filter to reduce radar-induced speckle (Lopes et al., 1990). After corrections, we resampled the image collections to 30 m for consistent analysis with optical imagery and downloaded them. We performed these steps for images captured in both VV and VH polarizations.
Table 2The number of Sentinel-1 SAR images used for analysis by satellite pass direction.

We used RStudio, an integrated development environment for R (RStudio Team, 2021), to estimate snowpack saturation from the created Sentinel-1 image collections. Before we extracted saturation dates, we temporally smoothed time series of backscatter values in each pixel using a locally weighted least-squares regression with a span of 0.2 (Supplement). This correction reduces noise in SAR time series and thus minimizes false positives in the final saturation date maps. After smoothing, we identified the date of the minimum backscatter value for each pixel.
We used backscatter minima to approximate the date of snowpack saturation (Marin et al., 2020) for all pixels in the basin, regardless of their snow-covered status. After we extracted saturation dates, we calculated mean values for each elevation, slope, aspect, and land cover class. To correct for any remaining artefacts of SAR speckle and distortion, we removed any pixels with estimated saturation dates that were outside of 2.5 standard deviations of the calculated means. We then infilled saturation dates with the median value from that pixel's elevation, slope, aspect, and land cover class (Table 3).
Table 3Total corrected area for SAR estimates of melt onset, optical estimates of snow disappearance, and optical-radar estimates of melt duration.
To further validate the behaviour of SAR signals over complex terrain, we focus on SAR time series extracted from pixels between elevations of 1600 and 1800 m and average them by land cover type and slope. We also extracted SAR time series at the Green Mountain and Downton Lake Upper automated weather stations, where continuous measurements of SWE are available. To create SAR signals at the location of each automated weather station, we used the average pixel values from all pixels located within a 40 m circular radius of each station. All SAR time series were smoothed with a LOESS regression with a span of 0.2.
4.2 Snow disappearance from Landsat-8 and Sentinel-2
We determined snow disappearance from Sentinel-2 and Landsat-8 images in GEE. We filtered Sentinel-2 and Landsat-8 scenes to create collections of images containing the La Joie Basin captured between February and September from 2018 to 2021 (Table 4). Images were further filtered to remove scenes with more than 60 % cloud cover, resulting in the use of 53 %, 51 %, 56 %, and 55 % of all available images each year from 2018 to 2021, respectively. We masked images for clouds and combined them into a single image collection for each study year (Table 4).
Table 4Number of Sentinel-2 and Landsat-8 images used for analysis.

Table 5Vegetation indices used to detect snow cover from optical and multispectral imagery.

We utilized a hybrid approach to approximate snow disappearance from the multi-source images. Over non-glacierized areas, we calculated Normalized Difference Snow Index (NDSI; Hall et al., 1995) and Normalized Difference Forest Snow Index (NDFSI; Wang et al., 2015) values to classify each image for snow cover using a threshold of 0.4 (Table 5). For glacierized areas of the La Joie Basin, we used a k-means clustering algorithm to classify the initial image collection for snow cover. We created two classes on the glacier, snow and ice, based on reflectance values in the visible, near-infrared, and shortwave-infrared spectrums (Shea et al., 2013).
For all areas in the basin, we selected the first snow-free date per pixel and extracted the corresponding date. We then exported the maps of snow disappearance, or snowmelt end, from GEE and calculated mean values for each elevation, slope, aspect, and land cover class. To correct for errors due to clouds and cloud masking, we removed any pixels with estimated snow disappearance dates that were outside of 2.5 standard deviations of the calculated means. We then infilled snow disappearance dates with the median value from that pixel's elevation, slope, aspect, and land cover class (Table 3).
4.3 Snowmelt duration estimates
We approximated snowmelt duration from the created maps of snowpack saturation and snowmelt end. We took the difference in days between disappearance and saturation estimates as the duration of melt production for each study year. Elevation-based thresholds were used to identify improbable melt duration estimates, such as negative estimates or estimates exceeding 120 d. Improbable melt duration estimates were infilled with the median value from that pixel's elevation, slope, aspect, and land cover class.
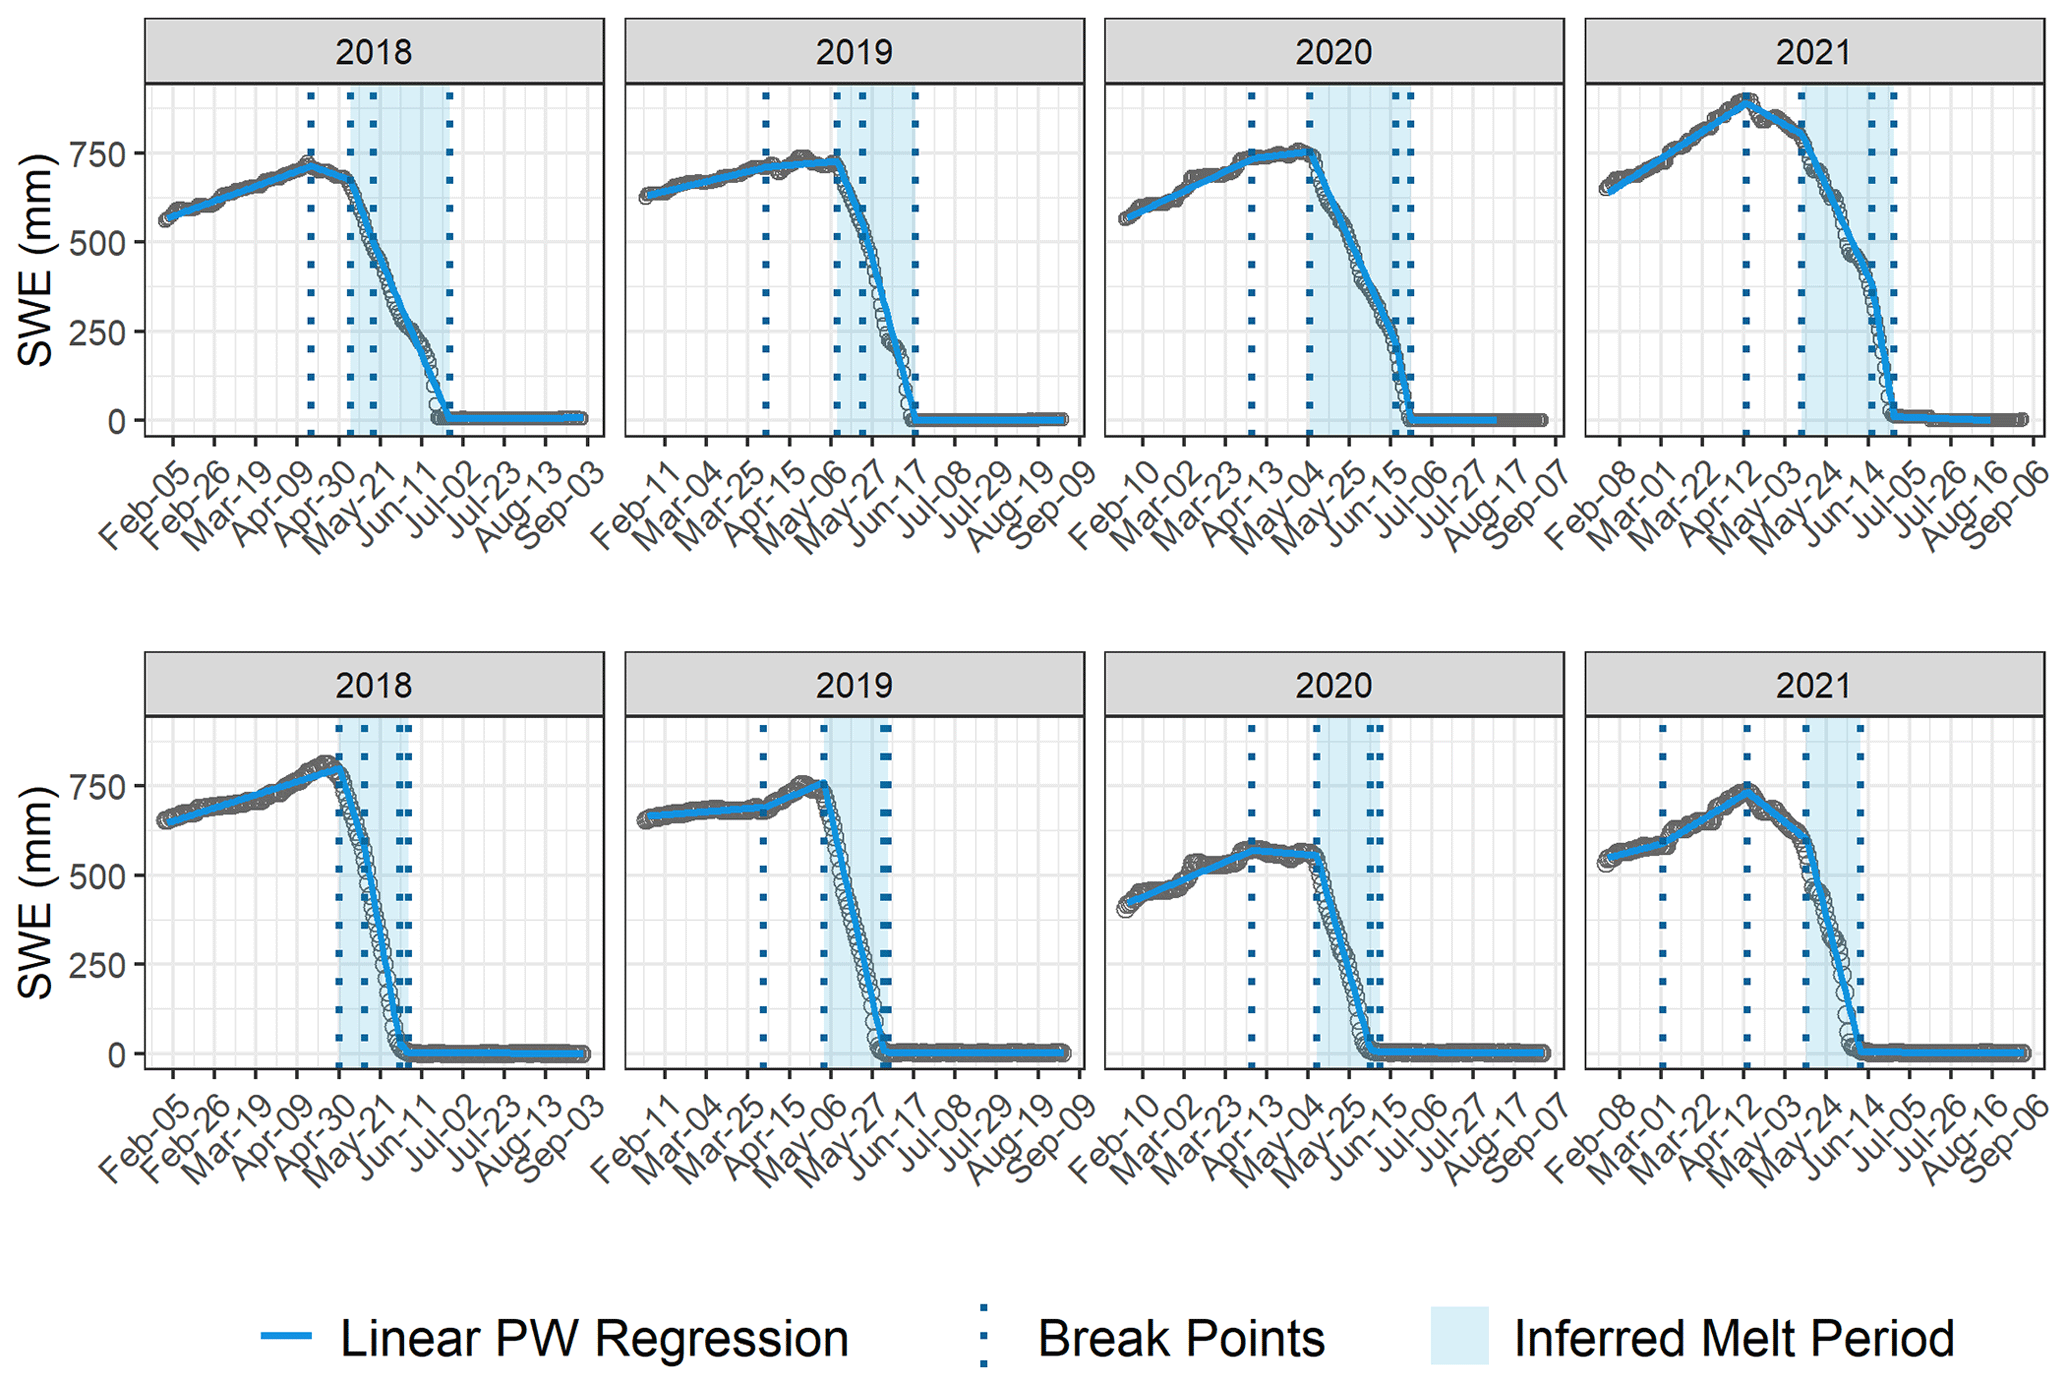
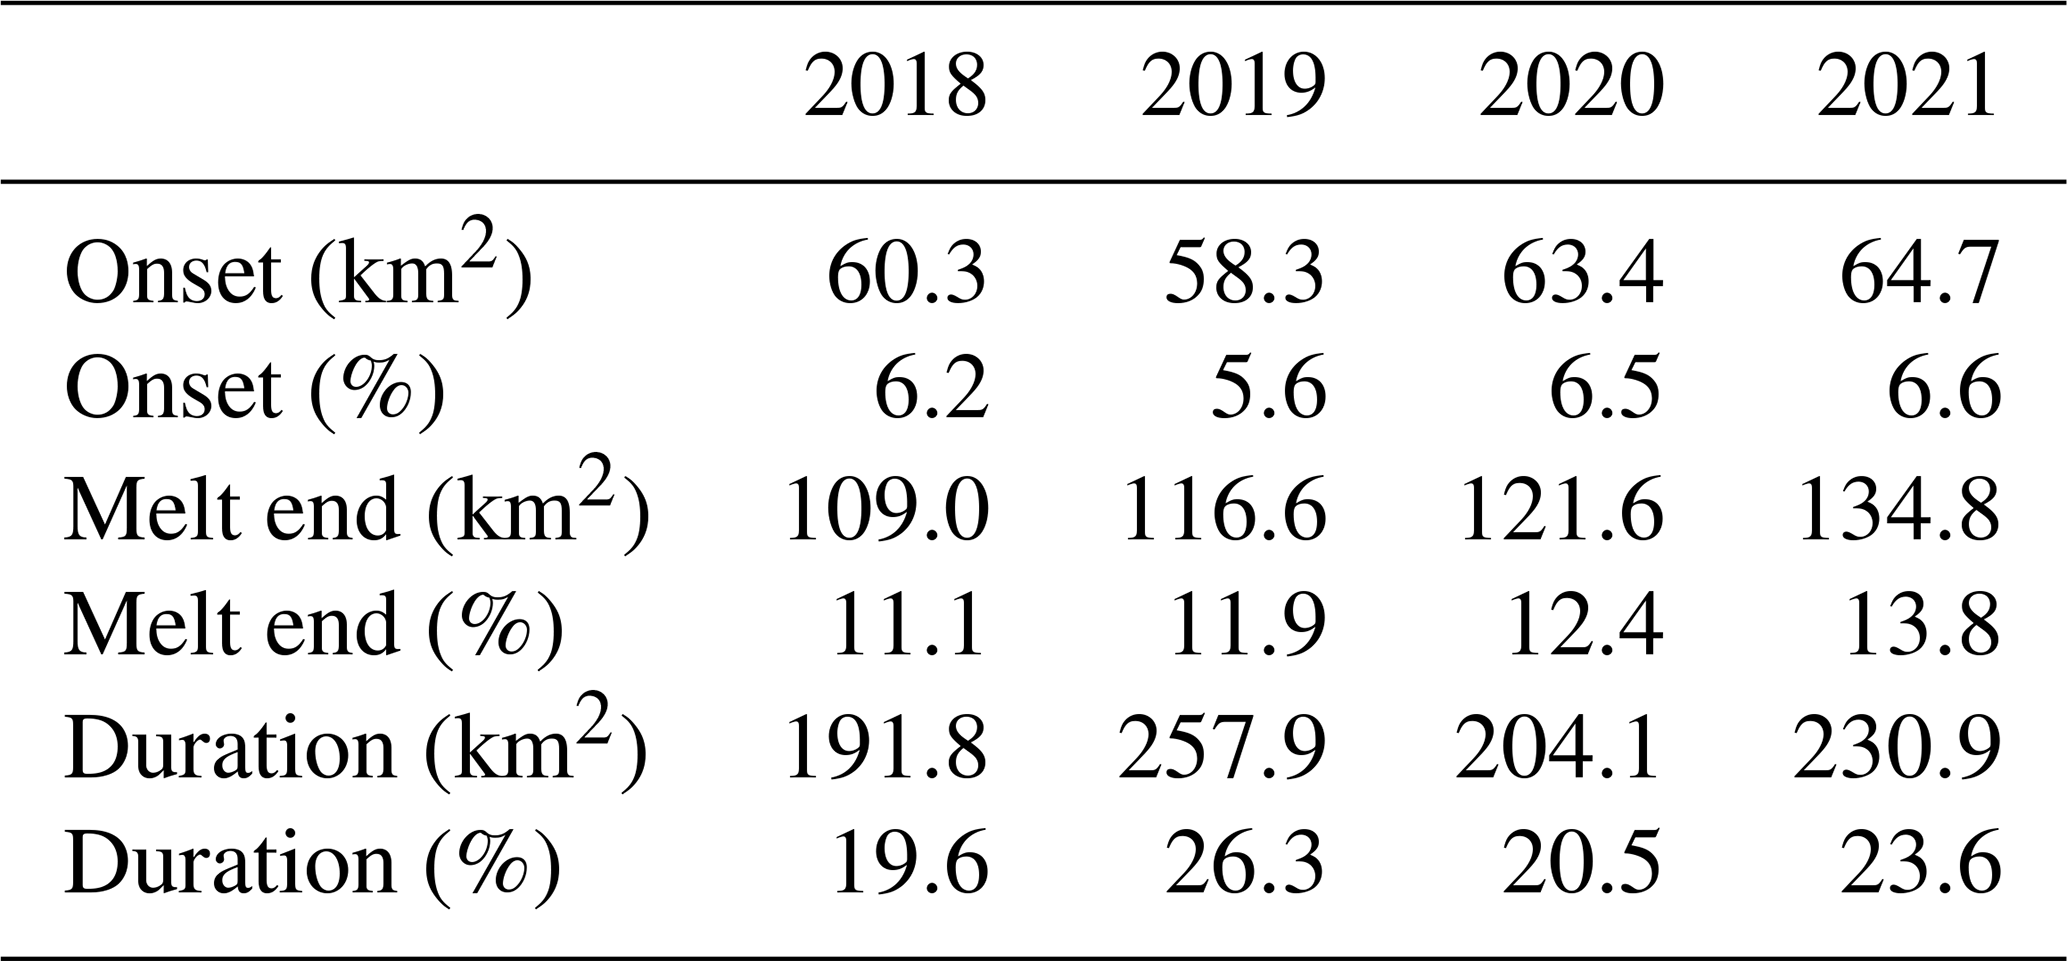
Figure 2Snow water equivalence records from Downton Lake Upper (top) and Green Mountain (bottom). Linear piecewise regressions of SWE trends are displayed with observational data. Breakpoints in the regression are marked with vertical dotted lines, and the inferred melt period from the regression is shaded in light blue.
4.4 Telemetry data
To validate SAR time series, estimates of snowmelt onset, and estimates of snowmelt duration we used continuous SWE records from the Downton Lake Upper and Green Mountain automated weather stations. We averaged hourly SWE measurements for each day and calculated maximum SWE for each snow season between 2018 and 2021. We used a piecewise linear regression to infer the period of melt at each station. Regression models were determined using the “segmented” package (Muggeo, 2017), which implements a bootstrap restarting algorithm (Wood, 2001) to estimate breakpoints in the time series. We used the first breakpoint after maximum SWE to approximate melt onset, and we used the last breakpoint to approximate the end of melt (Fig. 2).
5.1 Snowmelt from SWE records
Estimates of snowmelt onset and duration from the linear piecewise regression were consistent during the study period. At Downton Lake Upper, snowmelt duration ranged from 40 to 51 d among study years, with the shortest duration observed in 2019. Snowmelt onset dates were consistent at Downton Lake Upper, ranging from 4 to 10 May, with the earliest onset recorded in 2018. At Green Mountain, snowmelt duration ranged from 27 to 35 d among study years, with the shortest duration estimated in 2021. Estimates of melt onset at Green Mountain ranged from 29 April to 13 May, with the earliest onset observed in 2018.
Figure 3Comparisons of SAR time series and continuous snow water equivalence records (SWE) at Downton Lake Upper. SWE records are displayed in dark blue, with melt periods shaded in light blue. SAR time series for VV and VH polarized images are depicted in green, with time series minima denoted by dashed lines.
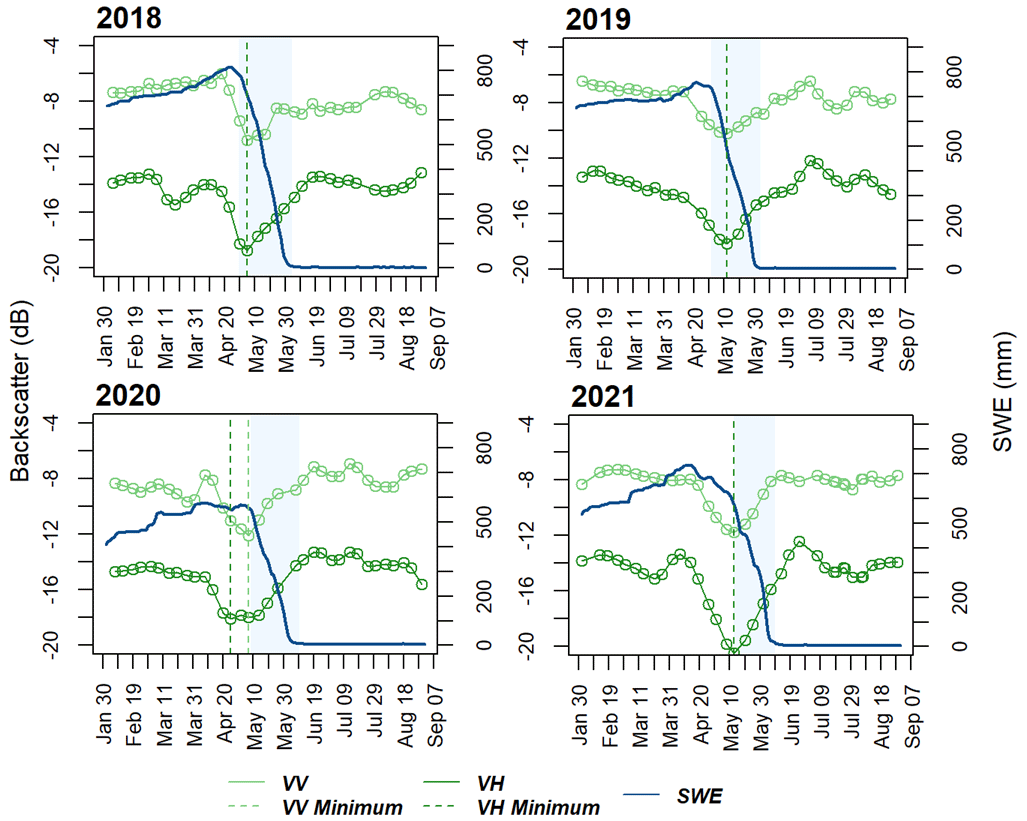
Figure 4Comparisons of SAR time series and continuous snow water equivalence records (SWE) at Green Mountain. SWE records are displayed in dark blue, with melt periods shaded in light blue. SAR time series for VV and VH polarized images are depicted in green, with time series minima denoted by dashed lines.
5.2 Sensitivity of SAR to snowmelt
At automated weather stations, the minimum value in each SAR time series coincided with rapid (10–20 mm d−1) declines in snow water equivalence (Figs. 3 and 4). At Downton Lake Upper, SAR time series minima occurred within 0–10 d of SWE melt onset estimates for both polarizations (Fig. 3). Comparing across four melt seasons at Downton Lake Upper, the maximum difference (+4 d) between onset estimates from VV polarized time series and telemetry records was produced in 2019. The minimum difference was produced in 2018 when there was no difference between telemetry records of melt onset and SAR estimates of melt onset. The maximum difference (−10 d) between estimates from VH polarized time series and telemetry records was produced in 2020 at Downton Lake Upper. The minimum difference was produced in 2018, when (similar to the VV time series) there was no difference between telemetry records of melt onset and SAR estimates of melt onset. At Green Mountain, SAR minima occurred within 1–13 d of SWE melt onset estimates (Fig. 4). Among study years, the maximum difference (+11 d) between onset estimates from VV polarized time series and telemetry records was produced in 2019. The minimum difference was produced in 2019 (−1 d). The maximum difference (−13 d) between onset estimates from VH polarized time series and telemetry records was produced in 2020 at Green Mountain. The minimum difference was produced in 2021, when there was no difference between telemetry records of melt onset and SAR estimates of melt onset. Minima from VV polarized images produced more accurate approximations of melt onset compared to those produced from VH polarized images at both stations. At Downton Lake Upper, all VV-derived minima occurred within 7 d of SWE melt onset estimates. At this location, only 50 % of minima from VH polarized images occurred within 7 d of melt onset. At Green Mountain, 75 % of VV-derived minima occurred within 7 d of SWE melt onset estimates. Similar to the results at Downton Lake Upper, only 50 % of minima at Green Mountain from VH polarized images occurred within 7 d of melt onset.
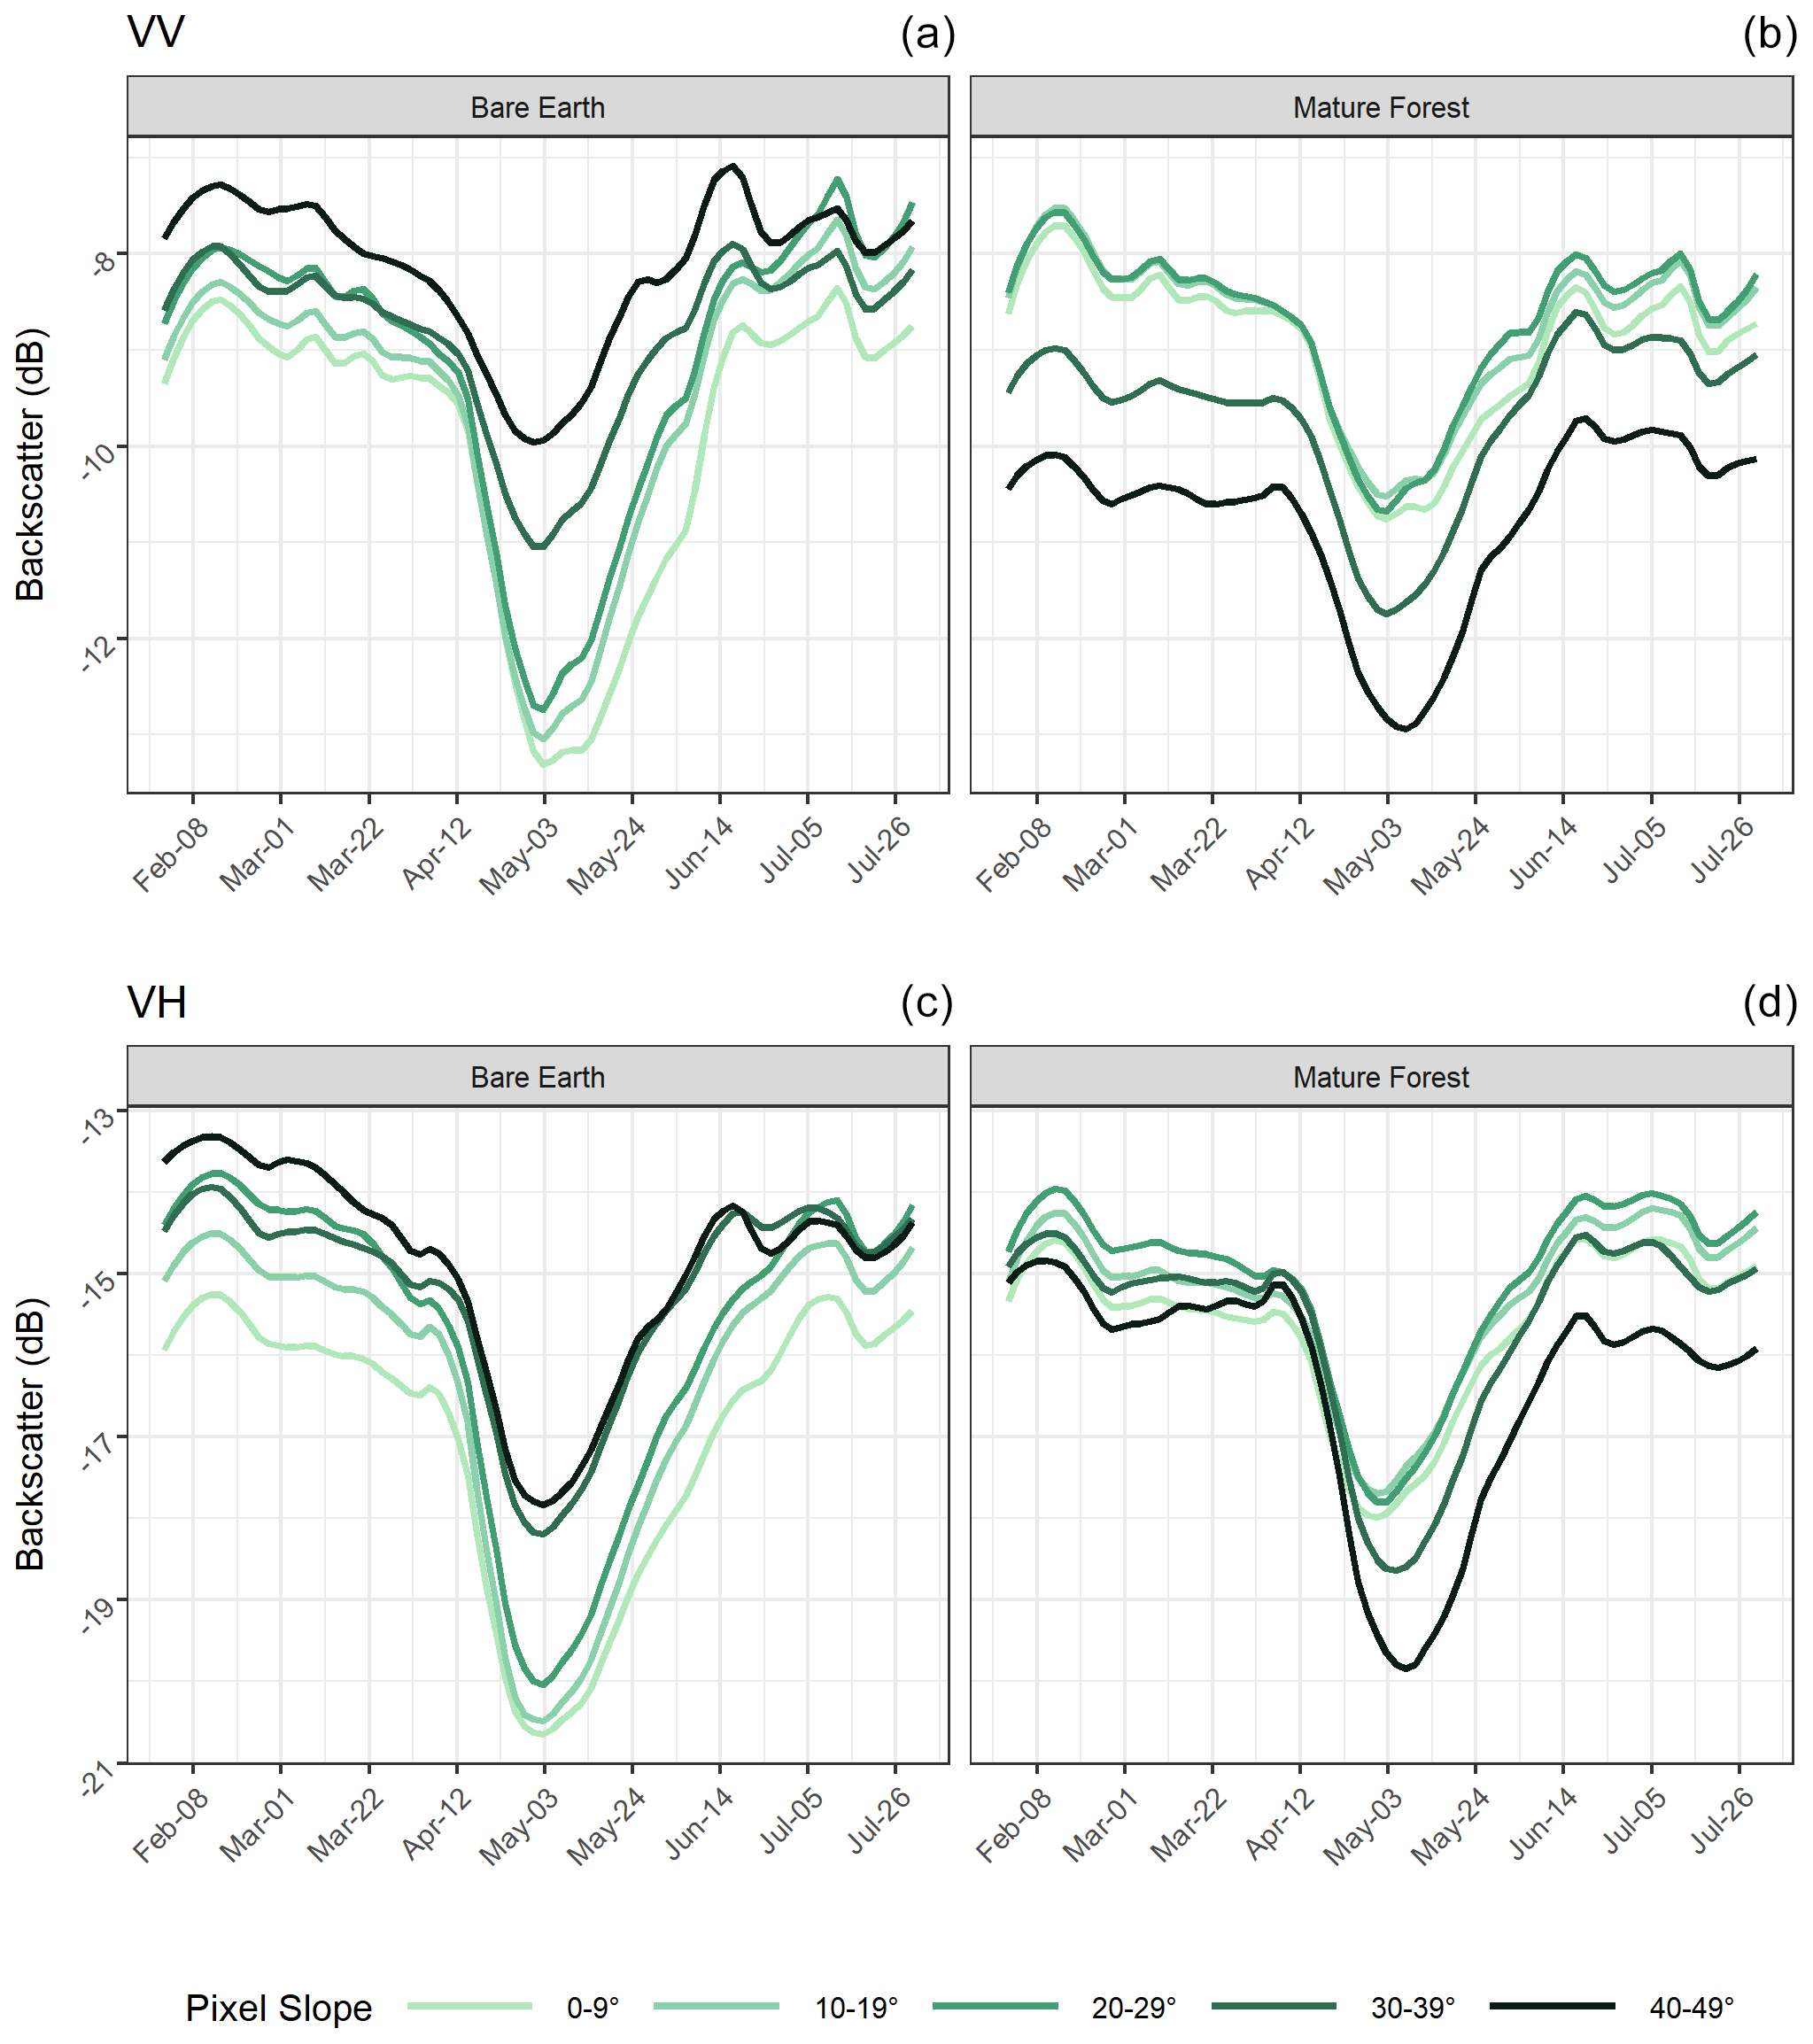
Figure 5SAR backscatter time series in the La Joie Basin from pixels located between 1600 and 1800 m from VV (a, b) and VH (c, d) polarized images. Observations under mature forest cover are displayed on the right (b, d), whereas observations in open areas are displayed on the left (a, c). Average backscatter for each cover type is shown by the shaded lines, with each line representing a different slope category. Observations are from 2021.
SAR backscatter time series from across the basin have a characteristic “U” shape, with their lowest values occurring in late spring (Fig. 5). In open areas, the seasonal decrease is most pronounced on gentle slopes (< 10∘) and decreases in amplitude as slope increases.In forested regions of the La Joie Basin, the seasonal decrease in backscatter showed the greatest amplitude on steep slopes (40–49∘). Among land cover classes, SAR minima are the most pronounced over bare earth and become harder to detect under dense vegetation, especially on moderate (10–29∘) slopes.
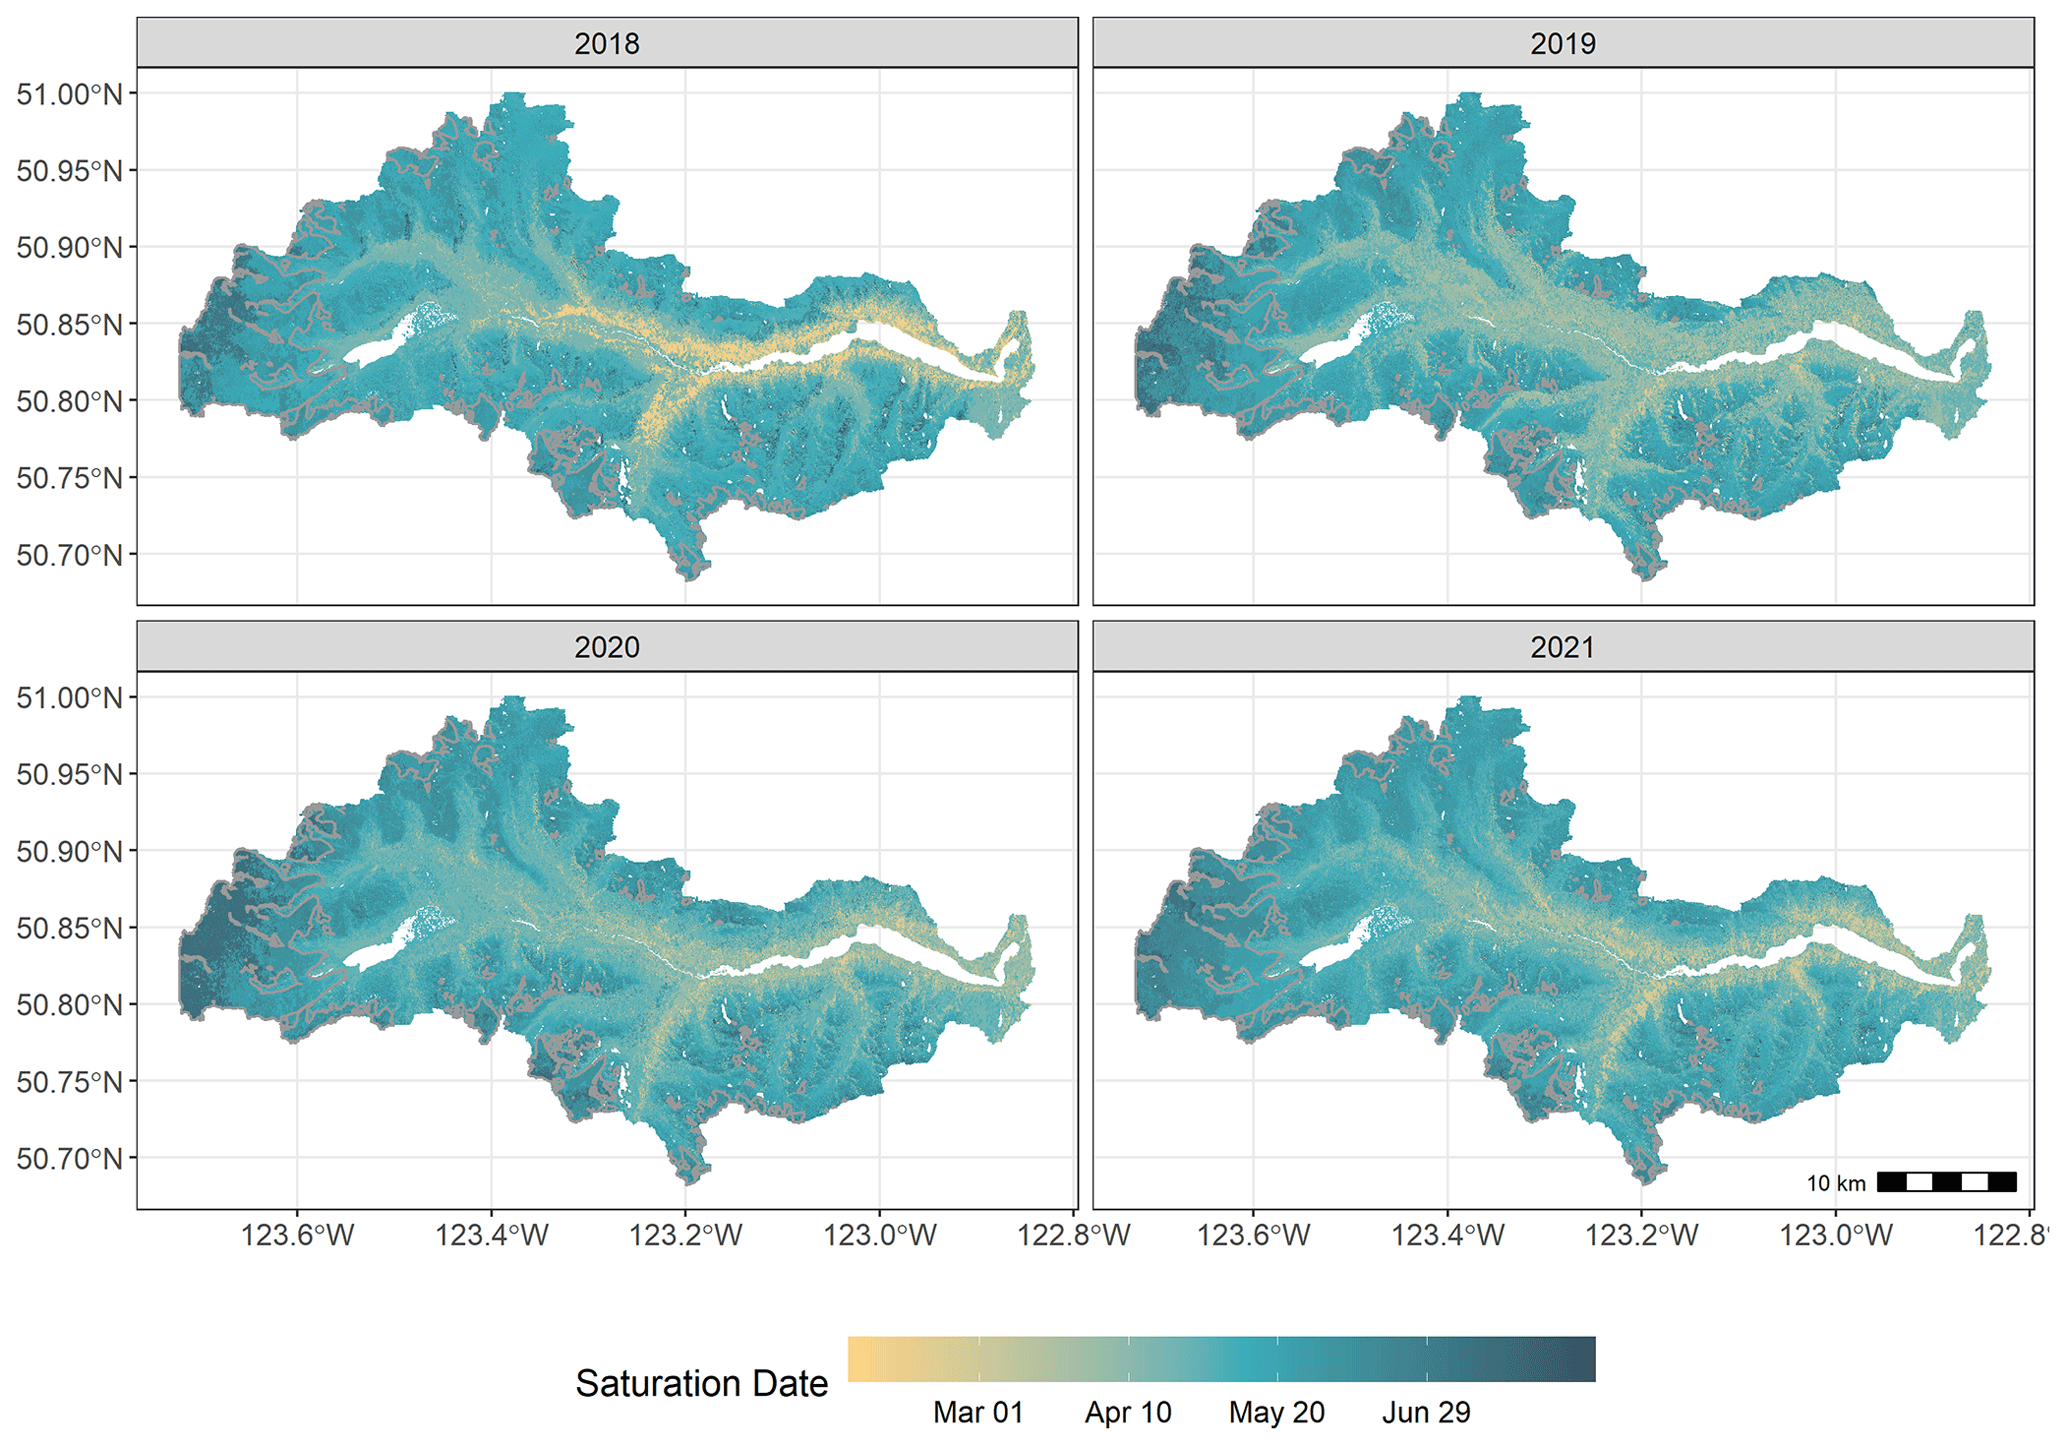
Figure 6Estimates of snowpack saturation (snowmelt onset) from Sentinel-1 SAR images of the La Joie Basin. Snowmelt onset estimates are inferred from minima in SAR time series.
5.3 SAR estimates of melt onset in the La Joie Basin
Due to the lower frequency of images in the ascending direction, results are shown for imagery captured by the descending pass of the satellite only. As time series from VH polarized images produced less reliable estimates of melt onset at Green Mountain and Downton Lake Upper, only results from VV polarized images are shown. For results from VH polarized images, see the Supplement. From 2018 to 2021 in the La Joie Basin, onset estimates were consistent by elevation with slight interannual variability (Fig. 6).
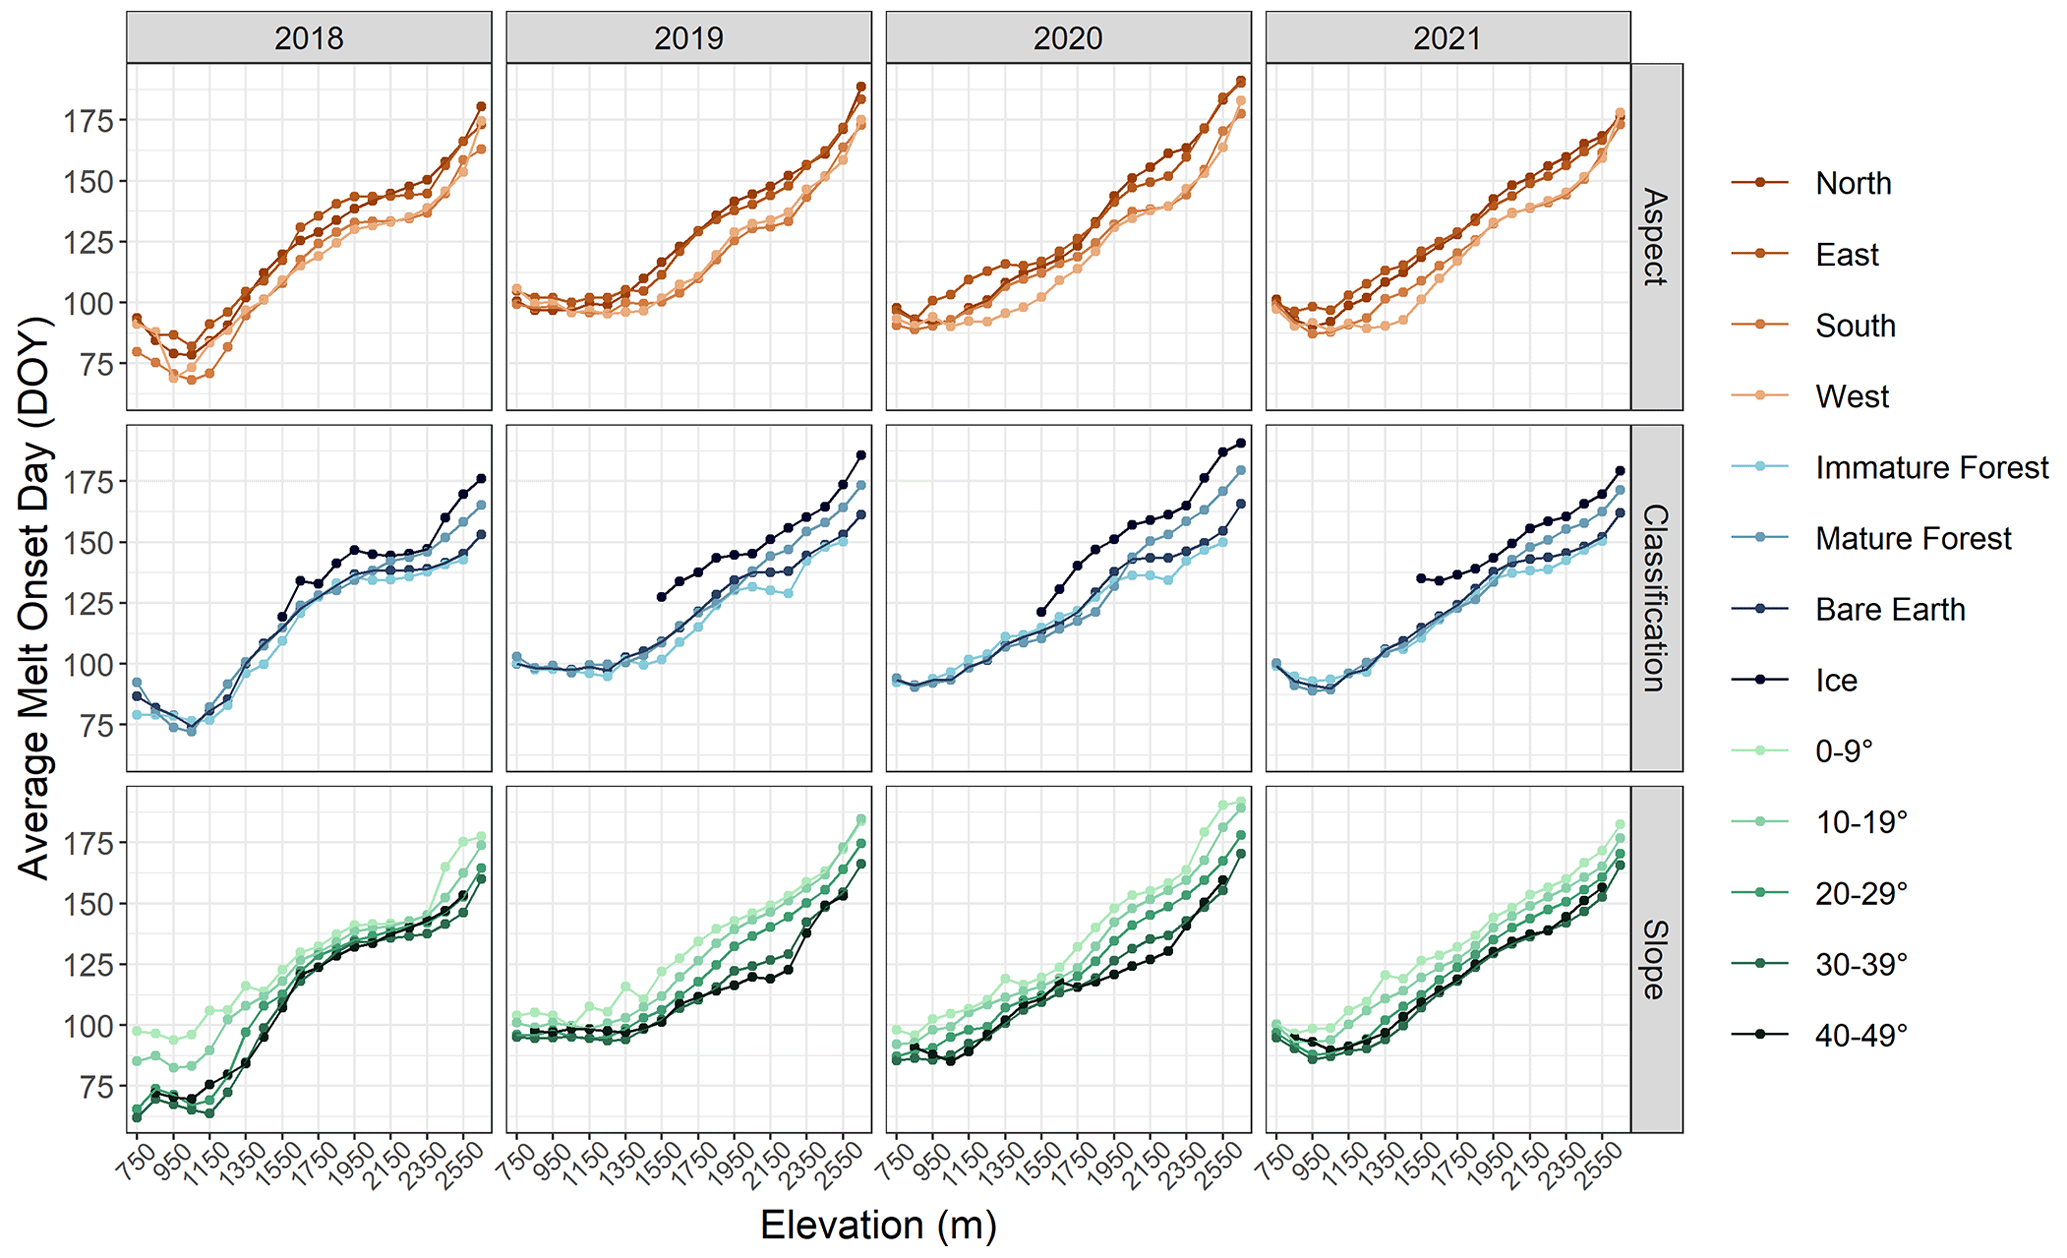
Figure 7Average estimates of snowmelt onset by elevation, aspect, classification, and slope. Estimates of melt onset are inferred from minima in Sentinel-1 SAR time series.
Generally, SAR estimates of melt onset indicate that snowmelt initiates in early March at low elevations in the La Joie Basin, with later snowmelt onset dates observed at higher elevations. The highest-elevation pixels are estimated to initiate melt in mid-July. When examined by elevation, 2018 showed the earliest average melt onset dates when compared to other study years, with low elevations estimated to initiate melt as early as 15 March. At low elevations, pixels were estimated to initiate melt the latest in 2019 when compared to other study years, with estimates averaging as late as 7 April. The largest range in mean melt onset estimates was produced in 2018, with 97 d between the earliest and latest elevation-binned averages. The smallest range was produced in 2019, with 83 d between the earliest and latest elevation-binned averages. At high elevations, the latest average melt onset dates were estimated in 2020, with pixels initiating melt on 5 July. The earliest average melt onset dates at high elevations were estimated in 2018, with the highest-elevation pixels initiating melt on 20 June. Melt onset estimates across elevations were influenced by aspect, slope, and land cover (Fig. 7). From 2018 to 2021, south- and west-facing slopes initiated melt earlier than north- and east-facing slopes. SAR melt onset estimates indicate that melt initiates earlier in the La Joie Basin on steep slopes (40–49∘) and initiates progressively later as slope decreases. Melt onset dates are similar between land cover types, with the exception of seasonal snow on glaciers, which initiated later than other classes in all study years.

Figure 8Estimates of snow-free dates in the La Joie Basin from Landsat-8 and Sentinel-2. Grey shading represents perennial snow, and the grey outlines delineate glaciers.
5.4 Optical estimates of snow disappearance
Snow-free dates estimated from optical and multispectral imagery (Fig. 8) show a similar elevation dependence to melt onset. However, we observe a greater variability in the snow-free dates in forested regions and at lower elevations.
The detection of snow-free dates from Landsat-8 and Sentinel-2 images provided consistent estimates by aspect, elevation, land cover type, and slope (see the Supplement). The impact of aspect is most pronounced at upper elevations, with northern and eastern slopes melting later than southern and western slopes. Similar to SAR estimates of melt onset, snow disappearance estimates were the most variable on steep slopes (> 30∘). When compared to the other land classes, snow cover on glaciers disappears much later in the ablation season. Trends in snow-free dates are consistent among study years.
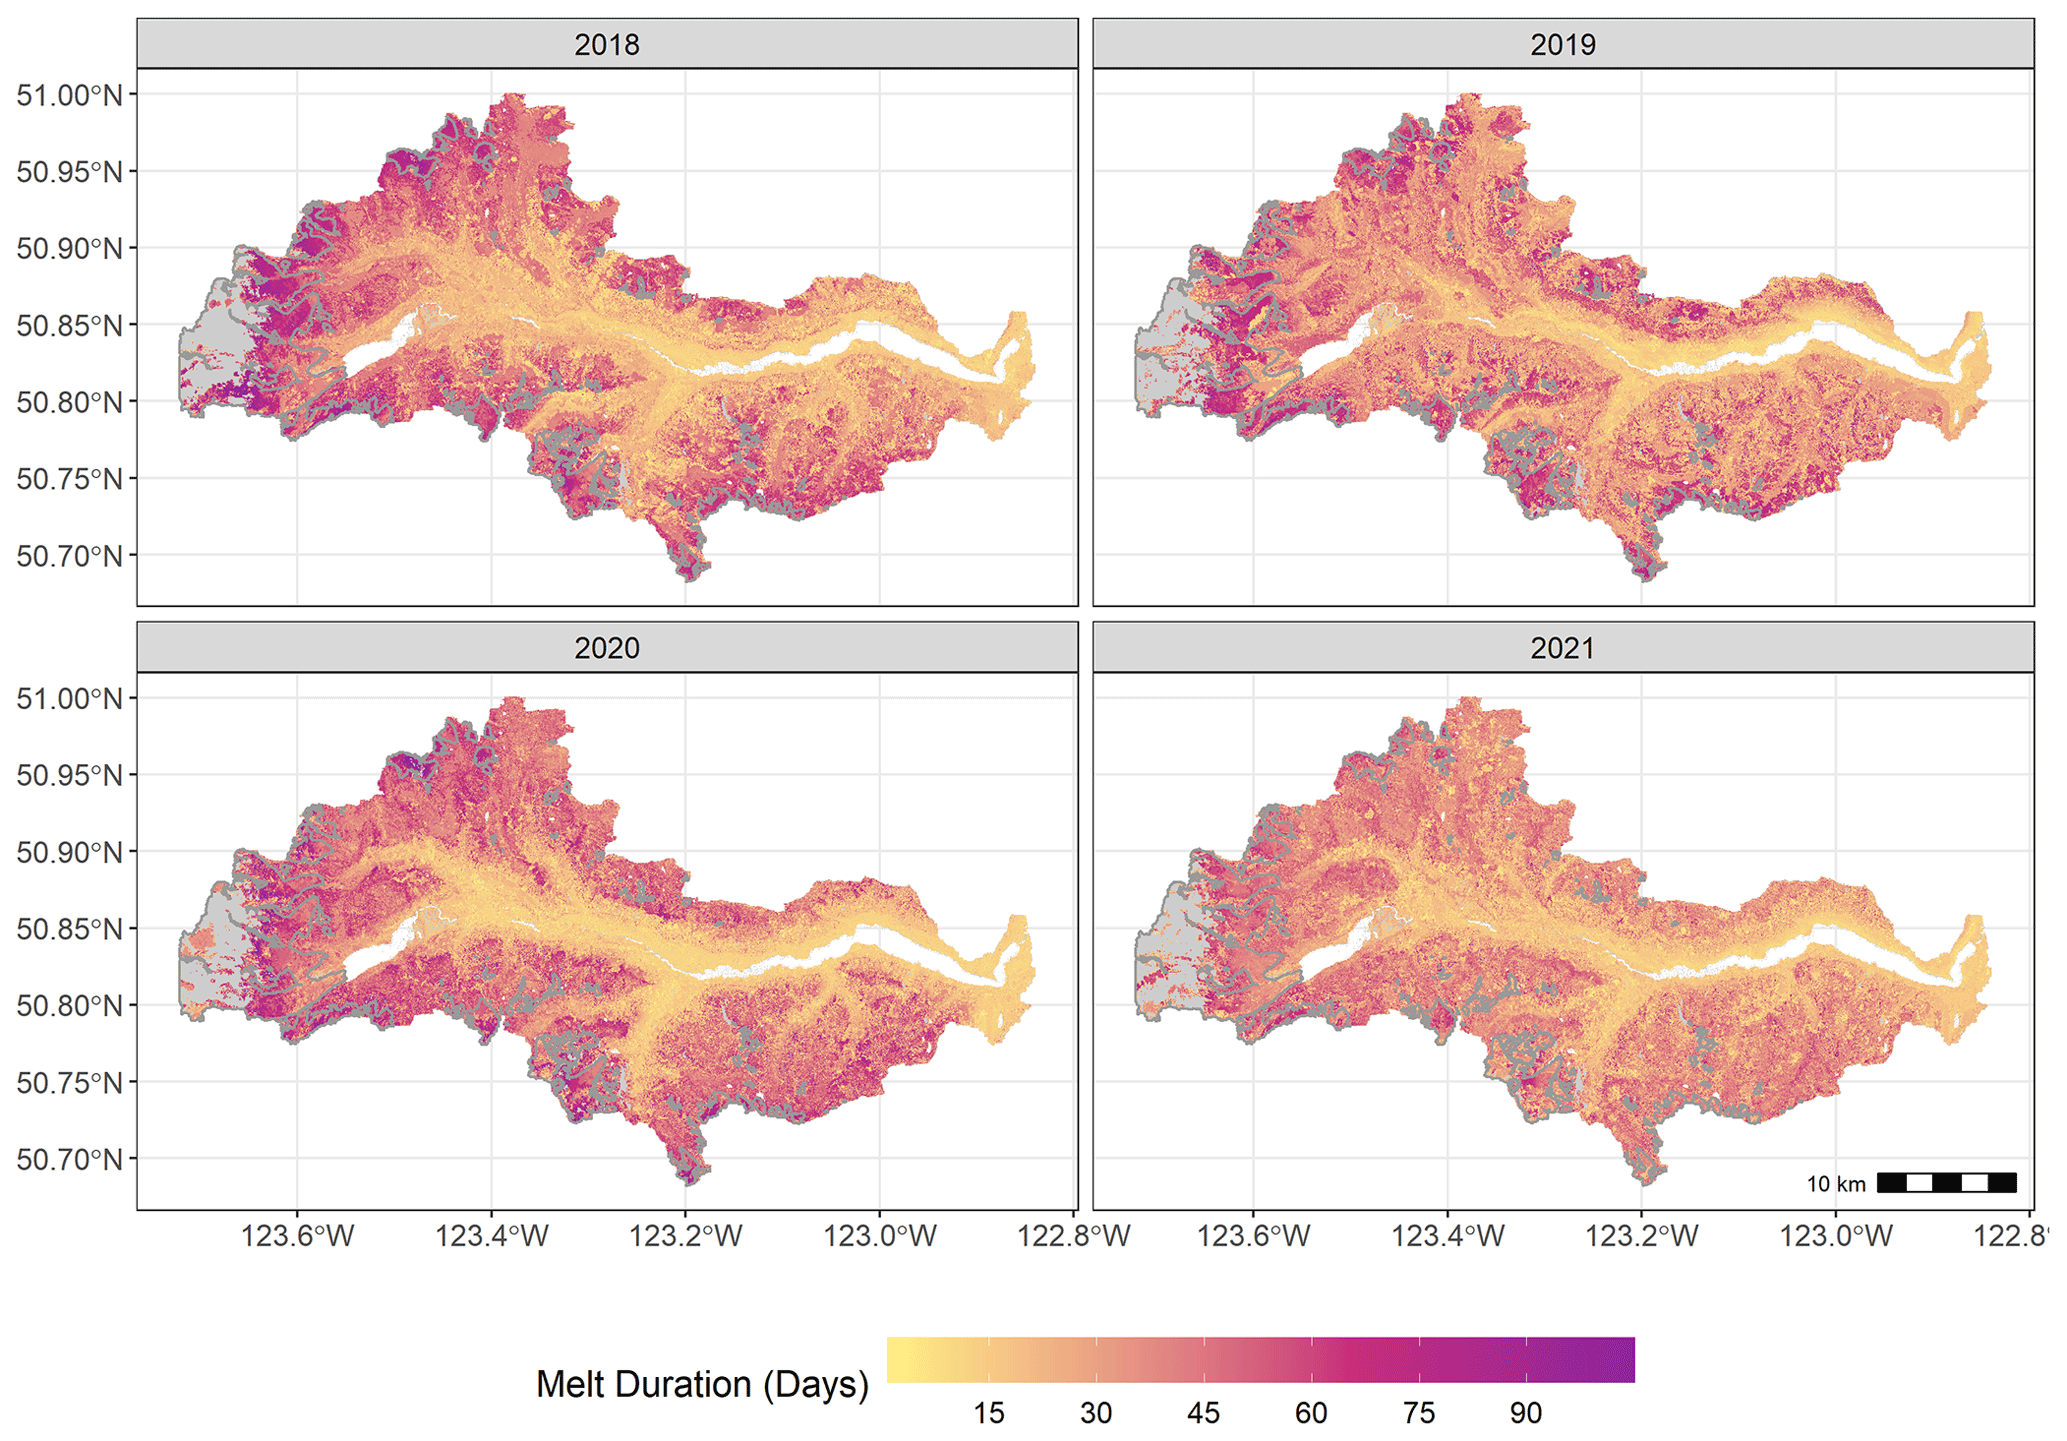
Figure 9Snowmelt runoff duration in the La Joie Basin from optical-radar melt products. Duration is approximated by differencing radar estimates of snowmelt onset and optical and multispectral estimates of snow-free dates. Grey shading represents perennial snow, and the grey outlines delineate glaciers.
5.5 Snowmelt duration products
With SAR-derived estimates of melt onset and optical and multispectral estimates of snow disappearance, we map snowmelt duration in the La Joie Basin (Fig. 9).
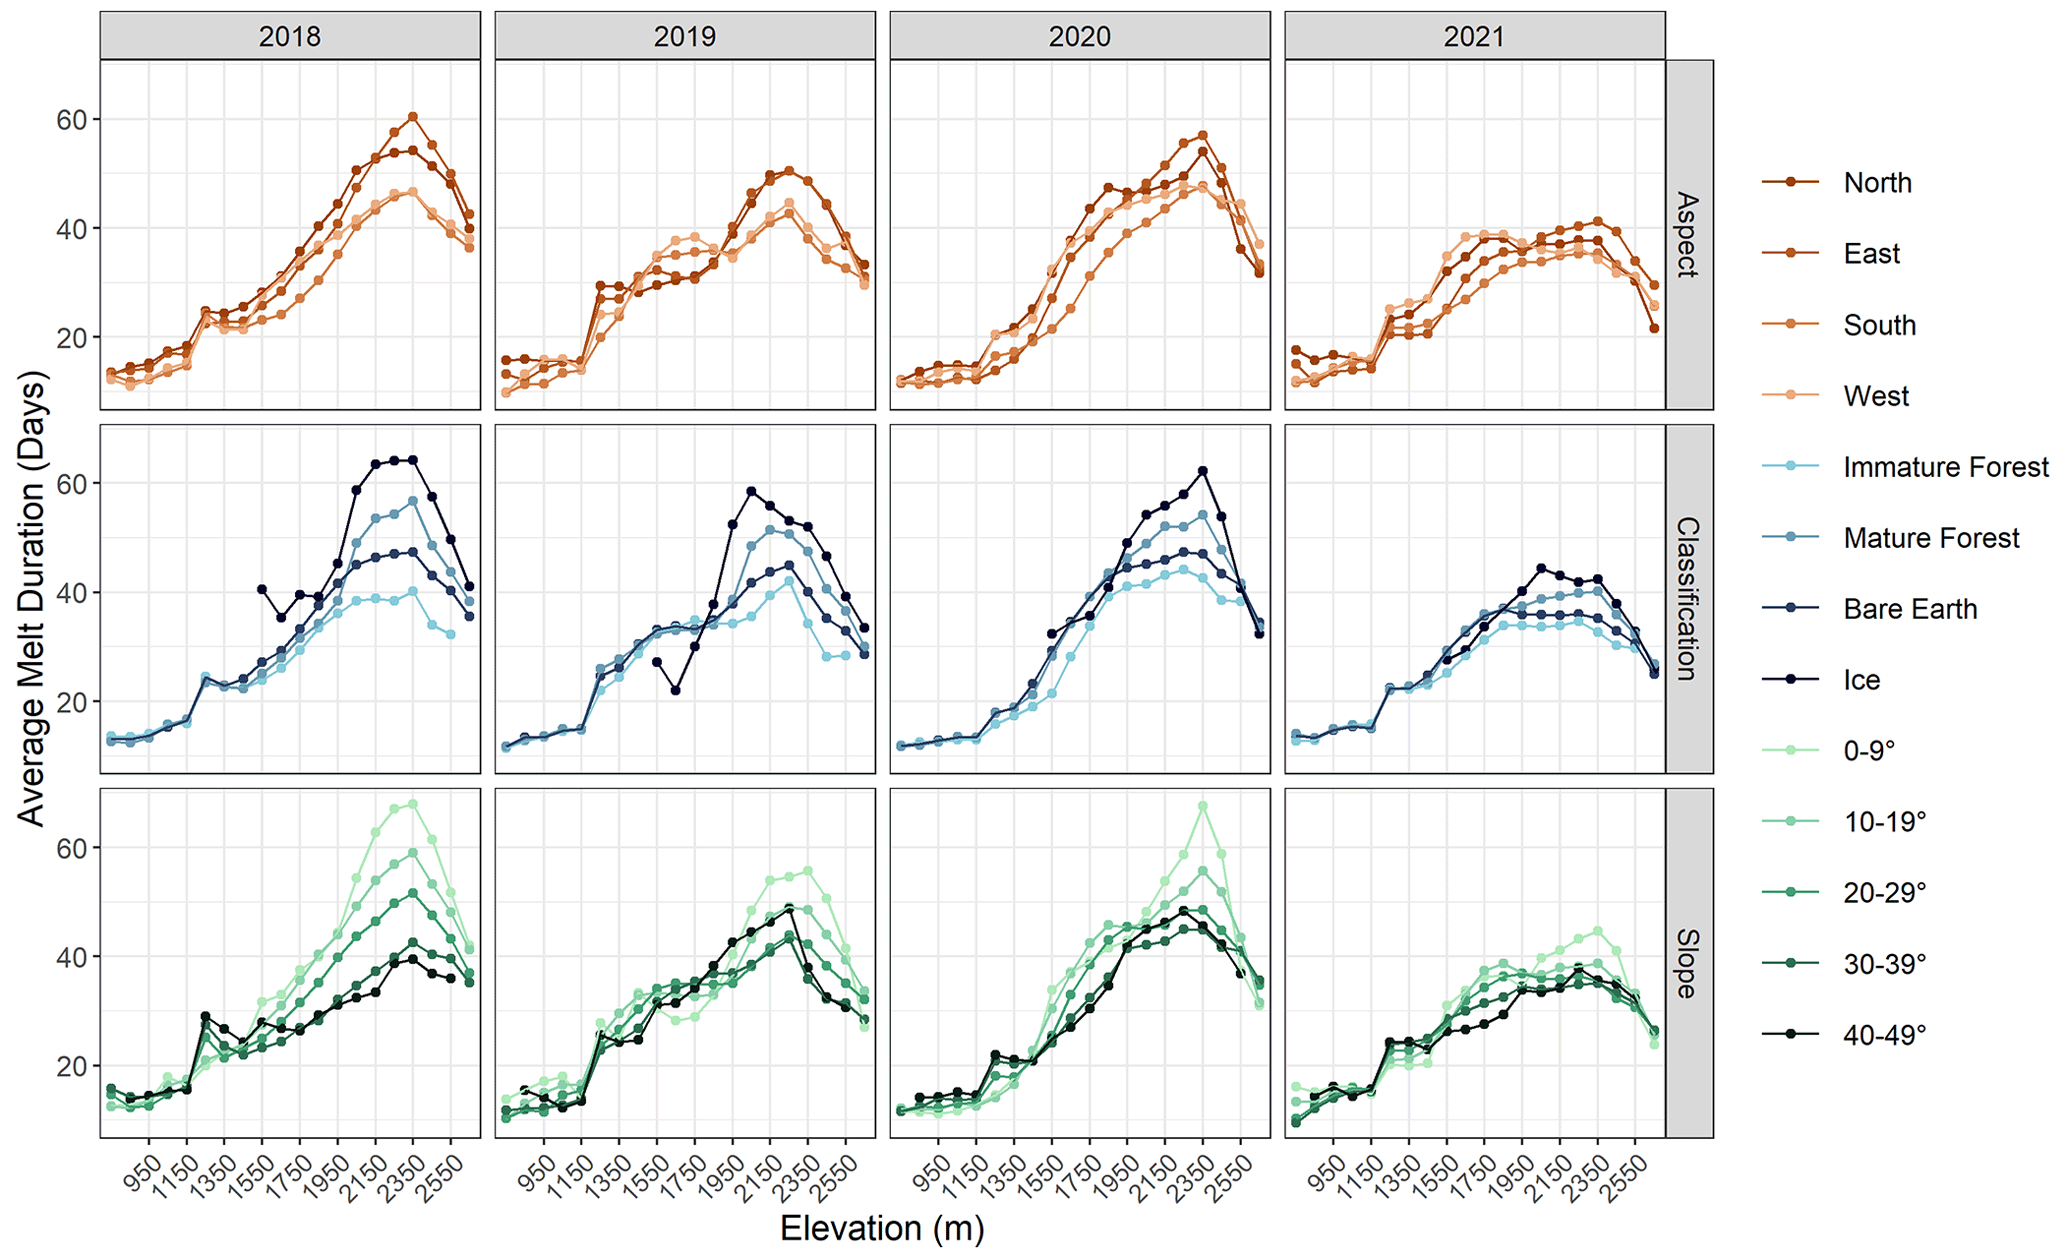
Figure 10Average estimates of snowmelt duration by elevation, aspect, classification, and slope. Estimates of melt duration are derived from SAR-based estimates of melt onset and optical estimates of melt end. Averages are obtained from VV polarized SAR images.
SAR snowmelt duration estimates formed consistent patterns based on elevation (Fig. 10). Snowmelt duration estimates were the longest between elevations of 2200 and 2400 in the La Joie Basin from 2018 to 2021. Between 2200 and 2400 the snowpack produced runoff for 46 d on average, whereas the basin-wide average was 30 d. At elevations above 2400 duration estimates shorten to an average of 38 d. Below 1200 , estimated snowmelt duration is the shortest, lasting 14 d on average. Among study years, elevation-averaged snowmelt duration estimates were the shortest in 2021 at 27 d on average and the longest in 2018 at 32 d on average.
Snowmelt duration is more sensitive to land cover, slope, and aspect when compared to melt onset dates, especially at elevations of greater than 1400 Melt durations were longer on north- and east-facing slopes compared to southern and western slopes. Increasing slope duration decreases melt duration in the La Joie Basin, with the longest durations observed in relatively flat areas (0–9∘) above 2000 Land cover strongly influences melt duration. On average, from 2018 to 2021 snowmelt duration estimates were the longest over glacierized terrain, followed by mature forest. Snowmelt duration estimates were the shortest over disturbed or immature forest, followed by bare earth.
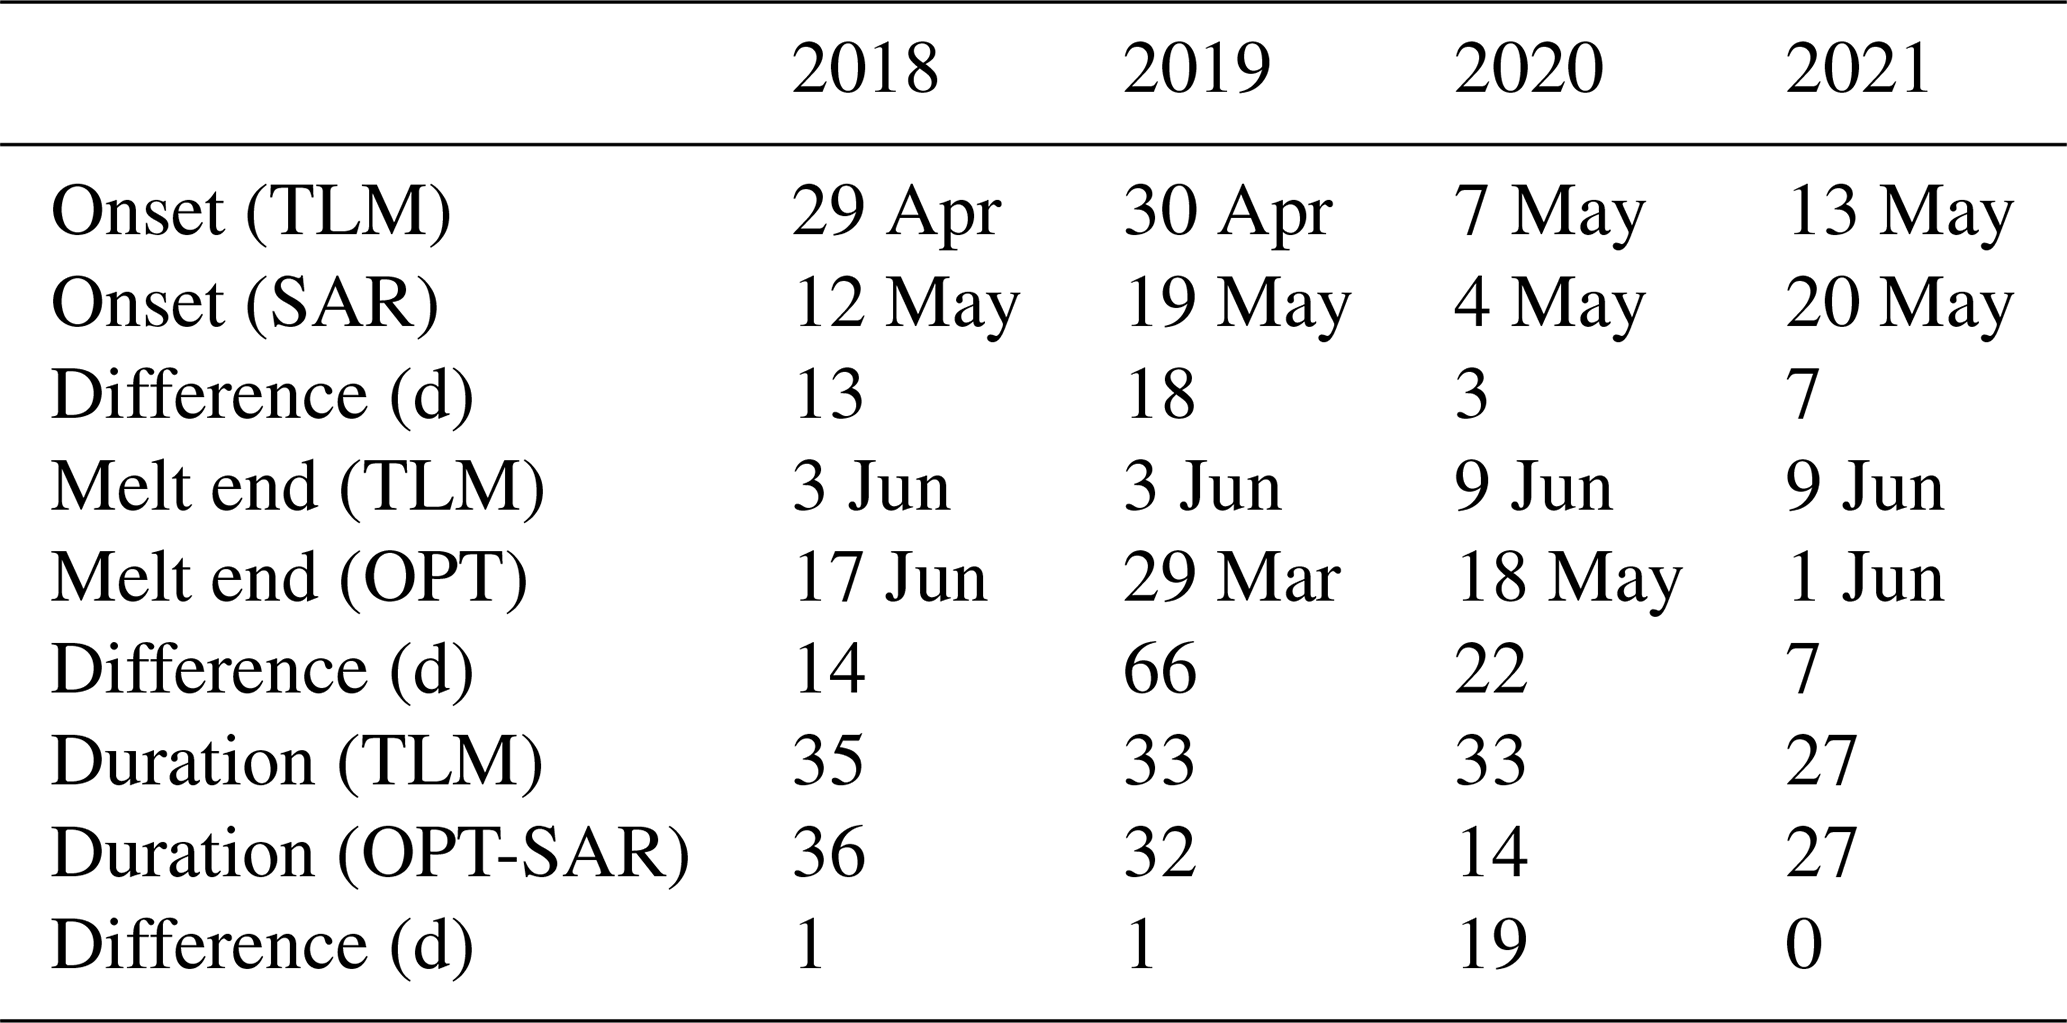
Multi-source snowmelt duration estimates did not always reflect melt duration from SWE records at automated weather stations (Tables 6 and 7). Optical-radar melt duration ranged from 19 to 38 d at Downton Lake Upper and from 14 to 36 d at Green Mountain. Higher inaccuracies are seen in the optical estimates of snow-free dates when compared to SAR estimates of snowmelt onset.
Table 6Comparison of multi-source and SWE estimates of snowmelt end, onset, and duration at Downton Lake Upper. The difference in days is provided between telemetry-based (TLM) estimates of melt and SAR, optical (OPT), and optical-radar (OPT-SAR) estimates of melt.
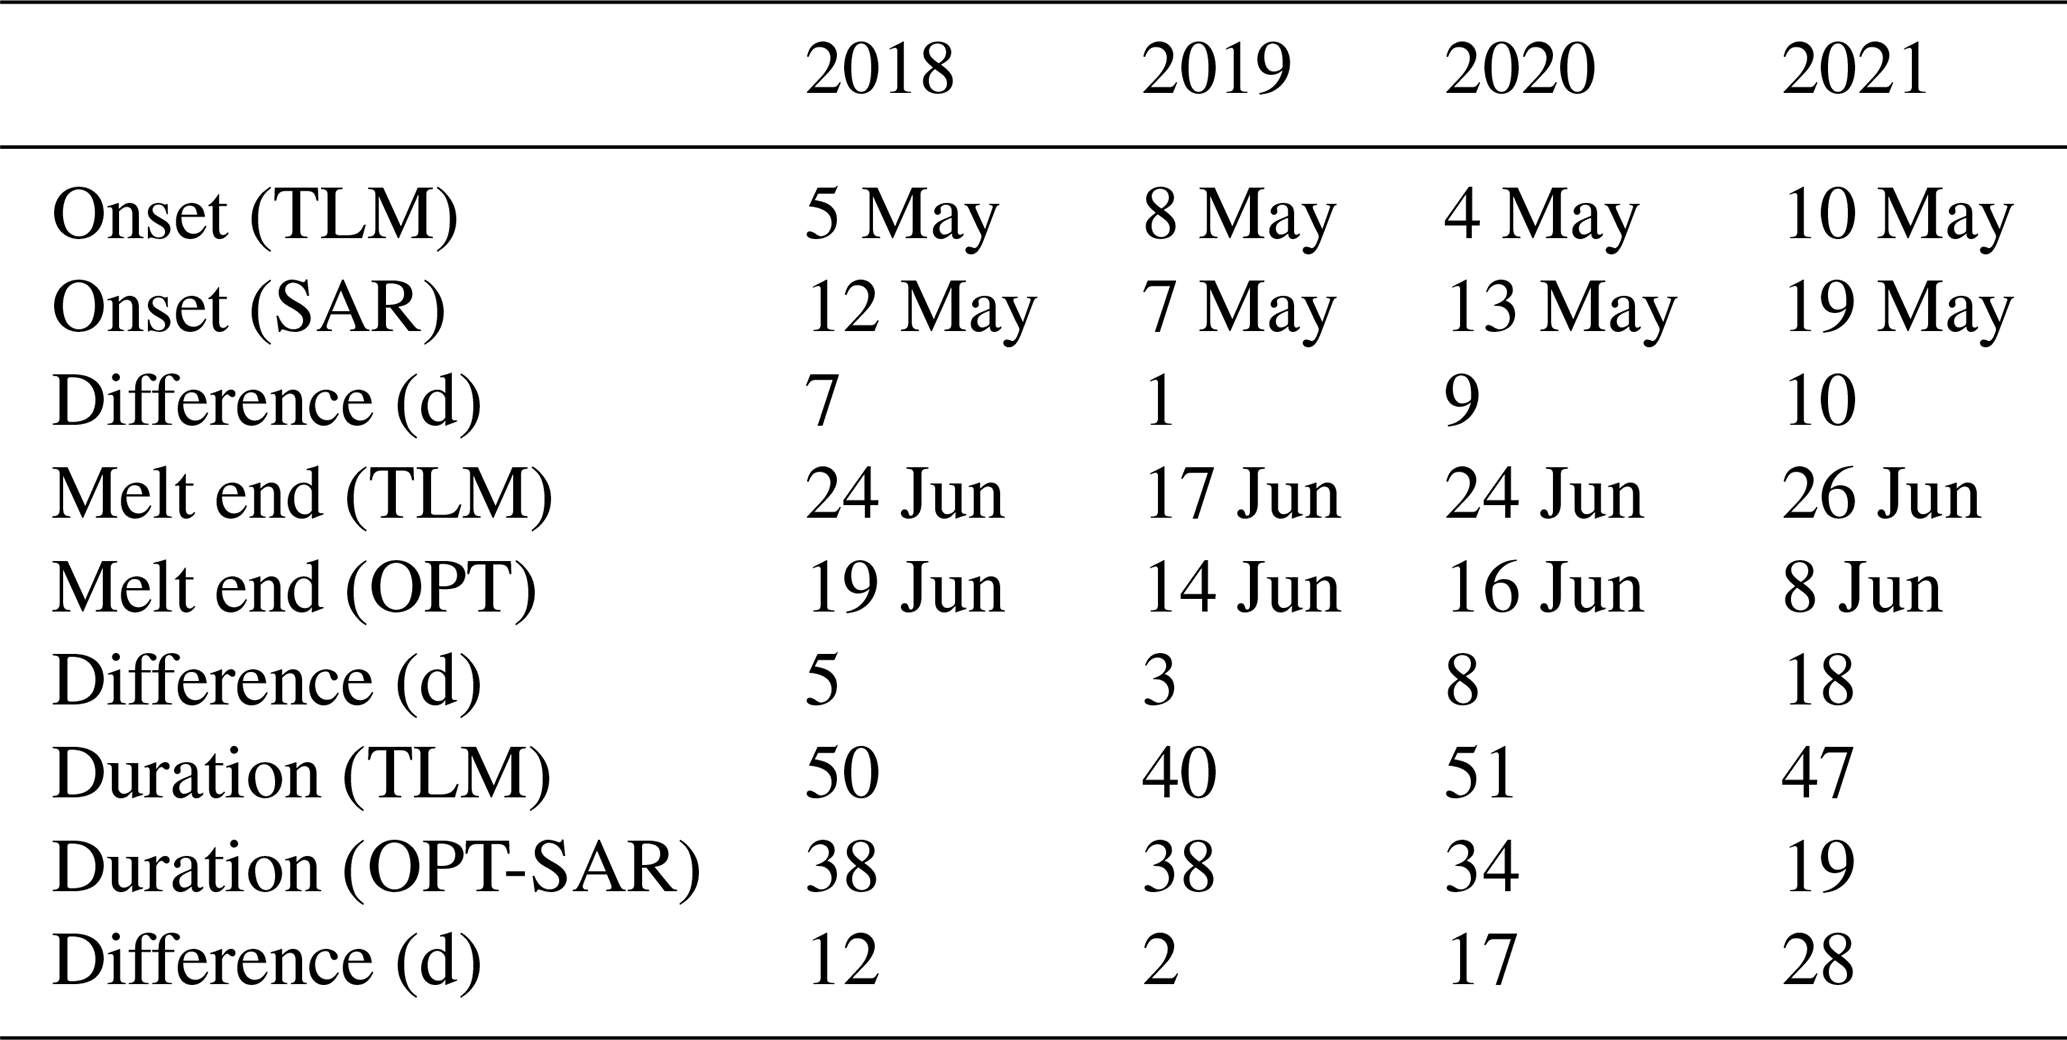
Table 7Comparison of multi-source and SWE estimates of snowmelt end, onset, and duration at Green Mountain. The difference in days is provided between telemetry-based (TLM) estimates of melt and SAR, optical (OPT), and optical-radar (OPT-SAR) estimates of melt.
6.1 Role of slope, cover, and satellite polarization in snowmelt onset estimates
While VV polarized time series produced more accurate estimates of melt compared to VH polarized time series at automated weather stations, increased noise in VV time series is observed in the La Joie Basin (Fig. 5). The amplified noise in the VV time series can be attributed to the steep slopes and forest cover present in the La Joie Basin. Vegetation covers a significant proportion (∼ 45 %) of the total area of the La Joie Basin. Manickam and Barros (2020) report that a common thresholding approach for mapping wet snow using co-polarized SAR images (Nagler and Rott, 2000) failed in Colorado, USA, due to the presence of conifer forest. Backscatter coefficients from cross-polarization were more sensitive to snow cover below vegetation compared to those from co-polarization and enabled wet snow mapping below the treeline (Manickam and Barros, 2020). Furthermore, the high relief in our study area may amplify the observed noise in co-polarized images, as steep slopes reduce the ability of VV polarization to distinguish between wet snow and snow-free surfaces (Nagler et al., 2016). The combination of steep slopes and forested regions present in the La Joie Basin increase noise in VV time series; however, VV polarized SAR images are shown to be more sensitive to wet snow compared to VH polarized images (Nagler et al., 2016). The increased sensitivity to wet snow in VV polarized images is reflected in the La Joie Basin through the greater accuracy of VV time series for approximating snowmelt onset at Downton Lake Upper and Green Mountain.
The U shape of SAR time series is more pronounced in open areas compared to mature forest (Fig. 5). As a result, estimates of melt onset and duration were less reliable in forested areas. The decreased sensitivity in forested areas can be attributed to the scattering of SAR signals by the forest canopy. Forests effectively scatter radar energy depending on their structure, composition, and stem density (Bernier, 1987). Conifers, in particular, strongly scatter C-band SAR signals (Bernier, 1987). Spruce and fir trees (conifers) dominate forests in the La Joie Basin, leading to increased noise in melt onset maps from Sentinel-1 data. The locally weighted least-squares regression temporal smoother helped to reduce the variability of melt onset estimates in forested regions; however, ground truthing in these regions is required to verify the validity of this shift.
In open areas, the U shape of SAR time series is more pronounced on flat slopes when compared to steep slopes (Fig. 5). Manickam and Barros (2020) presented similar findings in the Swiss Alps, where between April and May backscattering coefficients were less sensitive to wet snow as slope increased. In forested regions, however, slope has a less uniform effect on SAR signals. The most distinct U-shaped signals are created from SAR time series collected on steep (> 30∘) slopes and the least distinct are collected on moderate (10–29∘) slopes. Scatter from forests is impacted by terrain, which induces changes in trunk–ground and crown–ground scattering mechanisms (Park et al., 2012). Vegetative scattering mechanisms can create more negative values based on ground surface tilt (Park et al., 2012). In the La Joie Basin, the increased visibility of SAR minima on steep slopes in forested regions may be related to terrain-induced changes in vegetative scattering mechanisms.
6.2 Interannual variability in multi-source melt products
Optical-radar estimates of melt onset and duration were impacted by interannual climate fluctuations. At Downton Lake Upper, SAR estimates of melt onset from VV times series from 2018 to 2021 were within 0–4 d of telemetry estimates. For VH polarized time series, melt onset estimates were within 0–4 d of telemetry estimates in 2018 and 2021 only, with minima occurring 10 and 9 d early in 2019 and 2020, respectively. At Green Mountain, VH estimates of melt onset were also early in 2020, with minima occurring 13 d before telemetry estimates. VV and VH estimates were late in 2019 at Green Mountain, with both minima occurring 11 d after telemetry estimates. In 2020, early estimates of melt onset at both stations may be the product of large temperature fluctuations in early April. Melt–refreeze cycles alter snowpack LWC and grain size (Yamaguchi et al., 2010), and they will thus impact SAR signals (Liu et al., 2006). The late and early melt onset estimates in 2019 are also a likely result of temperature fluctuations. In 2019, daytime and nighttime temperatures at the La Joie Basin exceeded 0 ∘C from 17 to 22 March, increasing snowpack LWC and thus the possibility for early melt onset estimates. However, after the initial warming period in 2019 temperatures decreased, with average nighttime temperatures of below 0 ∘C for the entire month of April. Snowpack refreezing can decrease seasonal differences in SAR backscatter values (Floricioiu and Rott, 2001), and, as a result, minima in SAR time series may become less pronounced during refreezing periods. Among study years, interannual variations in climate, and therefore snowpack metamorphosis, influenced the accuracy of SAR snowmelt retrieval in the La Joie Basin and can partially explain the variability in snowmelt onset at automated weather stations.
6.3 Validation of multi-source melt products
Melt onset and duration estimates displayed varying agreement with continuous SWE records at Downton Lake Upper and Green Mountain. While all VV SAR minima from the extracted time series were within 5 d of melt onset at Downton Lake Upper, they occurred up to 11 d apart at Green Mountain. Green Mountain is located on a northeast-facing slope and receives morning sunlight. For this analysis only descending images were used, which are captured around 07:00 PST (Pacific standard time) in the La Joie Basin. Descending images in the La Joie Basin may be more susceptible to false positives from morning wetting on east-facing slopes during the ripening stage. Morning wetting of the snowpack may attribute to the greater variability seen in Green Mountain time series when compared to Downton Lake Upper. At both locations, time series estimates of melt onset were improved in VV polarization when compared to VH polarization. Final melt onset maps, however, were more accurate from VH polarized melt onset estimates when compared to VV, with 75 % of VH estimates at Green Mountain occurring within 1 d of telemetry estimates (see the Supplement). Co-polarized SAR signals have shown greater sensitivity to wet snow when compared to cross-polarized images (Nagler et al., 2016); however, cross-polarized images are preferable when mapping wet snow below the treeline (Nagler et al., 2016; Manickam and Barros, 2020). Green Mountain is more heavily vegetated compared to Downton Lake Upper, which may result in the increased accuracy of VH estimates at this location. As the accuracy of VH observations at Green Mountain in final melt onset maps was not mirrored in time series estimates, increased physical observations of the snowpack are required to further quantify the impact of polarization when using SAR minima as proxies for snowmelt onset.
Inaccuracies in snowmelt duration is attributed to errors in SAR onset estimates and optical snow disappearance estimates. Among study years, SAR acquisitions are available every 5 to 12 d, averaging 6 d in each year. Optical observations are variable among study years (Table 4); however, average revisit intervals are consistent at 4 d in 2018 and 2019 and 3 d in 2020 and 2021. We calculated errors in snowmelt duration (σD) using Eq. (1).
where error in the onset (σONS) and disappearance dates (σEND) are taken as the average revisit interval for each data type and study year. Rounding to the nearest day, this yields an average error in the duration estimates of ± 7 d for all study years. Ideally, a revisit time for SAR observations of 3 d would reduce this error to ± 4 d. Daily SAR observations could reduce error in duration estimates to ± 3 d; however, high-resolution optical imagery is needed at more frequent revisit intervals for reduced error or operational applications.
Snowpack monitoring with optical remote sensing data is challenging in the La Joie Basin, as imagery is frequently obscured by cloud cover. Cloud cover is persistent at high elevations during the ablation season in the La Joie Basin. Missing data from cloud cover reduce the temporal resolution at which imagery is available, decreasing the accuracy of snow disappearance estimates. The inclusion of optical data with a more frequent revisit interval or the use of complex snow detection algorithms could improve this analysis. Support vector machine algorithms have yielded promising results for multi-source snow detection with optical and SAR data in mountainous environments (He et al., 2015; Lui et al., 2020). Further, downscaling and gap-filling algorithms can improve snow cover detection using multi-source optical data (Premier et al., 2021; Revuelto et al., 2021). Revuelto et al. (2021) produced 20 m snow cover products by downscaling observations from the high-frequency, low-resolution Moderate Resolution Imaging Spectroradiometer with Sentinel-2 observations. In future studies, downscaling or machine-learning methods can be adopted to reduce error in snow disappearance estimates.
Despite errors in snow-free estimates, the observed trends in snowmelt duration agree with trends in snow depths observed in the study area (Sergio Tagle and Brian Menounos, personal communication, 2021). The snowpack is generally deepest at middle to high elevations (2200 to 2400 ) in the La Joie Basin, as at the highest elevations there is heavy redistribution of snow by wind and avalanching.
SAR retrievals of snowmelt onset and duration rely on the high resolution and revisit frequency of Sentinel-1. On 23 December 2021, Sentinel-1B malfunctioned and has not been communicating data since (European Space Agency, 2022). The loss of Sentinel-1B reduces the number of observations available for snowpack monitoring, which means that there may not be sufficient data to capture melt onset until the launch of Sentinel-1C in 2023. Alternative C-Band SAR datasets can be explored for snowmelt monitoring, such as the RADARSAT Constellation Mission.
We present a low-cost, adaptable method to estimate snowmelt onset and duration using Sentinel-1, Sentinel-2, and Landsat-8 imagery. Estimates of snowmelt onset from Sentinel-1 SAR were in agreement with continuous SWE observations from automated weather stations in the La Joie Basin. On the watershed scale, estimates of snowmelt onset in the La Joie Basin reflect changes in elevation and topography and are sensitive to land cover and slope. While steep slopes introduce error into SAR snowmelt onset estimates in open areas, they can improve minima detection under vegetative cover. To map snowmelt on the watershed scale, VV polarized images are recommended; however, VH polarized images may produce more accurate results in forested areas. Although snowmelt duration agreed with snow depth records in the La Joie Basin, they were inaccurate at automated weather stations due to cloud cover in Sentinel-2 and Landsat-8 imagery.
To reduce errors in snowmelt duration in future studies, optical and multispectral imagery with a higher cadence are both recommended. Further, a dense network of field observations is required to validate estimates of snowmelt onset and duration, particularly under varied land cover types. Future research will explore the impact of forest cover on snowmelt estimates in greater depth and will provide additional validation for snowmelt estimates in alpine regions.
Snowmelt dominates hydrologic regimes in western North America and thus requires frequent monitoring. Our study supports findings from Marin et al. (2020) that Sentinel-1 SAR can be used to characterize snowmelt in these regions. We demonstrate that Sentinel-1 SAR observations provide high-resolution estimations of snowmelt onset and can be used to characterize snowmelt in ungauged basins. These findings are of increased importance as current snowmelt regimes are threatened by warming global temperatures, which alter the extent and the duration of snow cover (Mote et al., 2005). As changes in snowmelt timing impact freshwater availability and natural hazard risk, increased observations of the snowpack, such as those provided by radar satellites, are required moving forward.
The code used to download Sentinel-1 SAR images for snowmelt analysis is freely available at https://github.com/saradarychuk/Snowmelt-Characterization-from-Sentinel-1-SAR (Darychuk, 2023a). Code for estimating snow disappearance from Sentinel-2 and Landsat-8 images is available at https://github.com/saradarychuk/Snowmelt-Characterization-from-Sentinel-1-SAR (Darychuk, 2023b).
Sentinel-1, Sentinel-2, and Landsat-8 image collections are available via the Google Earth Engine Data Catalogue: https://developers.google.com/earth-engine/datasets/catalog (Google Earth Engine, 2023).
The supplement related to this article is available online at: https://doi.org/10.5194/tc-17-1457-2023-supplement.
All authors contributed to research design and result interpretation. Analysis was performed by SED, with regular guidance from JMS and AC. SED wrote the paper based on input and feedback from JMS, AC, and BM. Lidar data were provided by BM.
The contact author has declared that none of the authors has any competing interests.
Publisher's note: Copernicus Publications remains neutral with regard to jurisdictional claims in published maps and institutional affiliations.
We gratefully acknowledge BC Hydro for their collaboration and support during with this project, as well as Bill Floyd and Chris Derksen for their guidance and assistance. Further, we are grateful to the editor, Kang Yang, for their feedback and support throughout the publication process, alongside our three referees (Carlo Marin, Giacomo Bertoldi, and one anonymous referee). Automated weather stations in the La Joie Basin are maintained and operated by BC Hydro, and optical and SAR data are distributed by the European Space Agency and the USGS. Lidar estimates of snow depth were processed by Sergio Tagle.
This research has been supported by BC Hydro and Mitacs (grant no. IT13256); the Ministry of Forests, Lands, Natural Resource Operations and Rural Development (grant no. RC21-4162 (TP22WMB0003)); and the Natural Sciences and Engineering Research Council of Canada (grant no. RGPIN-2019-07112). Lidar imaging was supported by Canada Research Chairs Program, the Natural Sciences and Engineering Research Council of Canada, and the Tula Foundation.
This paper was edited by Kang Yang and reviewed by Carlo Marin, Giacomo Bertoldi, and one anonymous referee.
Barnett, T. P., Adam, J. C., and Lettenmaier, D. P.: Potential impacts of a warming climate on water availability in snow-dominated regions, Nature, 438, 303–309, 2005.
Bernier, P. Y.: Microwave Remote Sensing of Snowpack Properties: Potential and Limitations, Hydrol. Res., 18, 1–20, https://doi.org/10.2166/nh.1987.0001, 1987.
Darychuk, S.: Export Sentinel-1 SAR Images for Snowmelt Analysis, Github [code], https://github.com/saradarychuk/Snowmelt-Characterization-from-Sentinel-1-SAR, last access: 31 March 2023a.
Darychuk, S.: Snow Disappearance Estimates in Glacierized Basins, Github [code], https://github.com/saradarychuk/Snowmelt-Characterization-from-Sentinel-1-SAR, last access: 31 March 2023b.
Deems, J. S., Fassnacht, S. R., and Elder, K. J.: Fractal Distribution of Snow Depth from Lidar Data, J. Hydrometerol., 7, 285–297, 2006.
Déry, S. J., Stahl, K., Moore, R. D., Whitfield, P. H., Menounos, B., and Burford, J. E.: Detection of runoff timing changes in pluvial, nival, and glacial rivers of western Canada: Western Canada Runoff Timing, Water Resour. Res., 45, W04426, https://doi.org/10.1029/2008wr006975, 2009.
Dingman, L. S.: Physical Hydrology: Third Edition, Waveland Press, ISBN 10 1478611189, ISBN 13 9781478611189, 643 pp., 2015.
Elder, K., Dozier, J., and Michaelsen, J.: Snow Accumulation and Distribution in an Alpine Watershed, Water Resour. Res., 27, 1541–1552, 1991.
European Space Agency: Sentinel-1 toolbox, https://sentinel.esa.int/web/sentinel/toolboxes/sentinel-1 (last access: 29 June 2021), 2021.
European Space Agency: Copernicus Sentinel-1B anomaly (4th update), 28 January 2022, https://sentinels.copernicus.eu/web/sentinel/-/copernicus-sentinel-1b-anomaly-4th-update/1.1?redirect=%2Fweb%2Fsentinel%2F-%2Fcopernicus-sentinel-1b-anomaly-updat-2%2F1.1%3Fredirect%3D%252Fweb%252Fsentinel%252Fmissions%252Fsentinel-1 (last access: 2 February 2022), 2022.
Floricioiu, D. and Rott, H.: Seasonal and Short-Term Variability of Multifrequency, Polarimetric Radar Backscatter of Alpine Terrain From SIR-C/X-SAR and AIRSAR Data, IEEE T. Geosci. Remote, 39, 2634–2648, 2001.
Government of British Columbia: Automated Snow Weather Station Locations, Environmental Monitoring and Analysis Branch [data set], https://catalogue.data.gov.bc.ca/dataset/automated-snow-weather-station-locations (last access: 13 March 2023), 2017.
Google Earth Engine: Earth Engine Data Catalog, Google Earth Engine [data set], https://developers.google.com/earth-engine/datasets/catalog, last access: 31 March 2023.
Hall, D. K., Riggs, G. A., and Salomonson, V. V.: Development of methods for mapping global snow cover using moderate resolution imaging spectroradiometer data, Remote Sens. Environ., 54, 127–140, https://doi.org/10.1016/0034-4257(95)00137-p, 1995.
Harpold, A. A., Molotch, N. P., Musselman, K. N., Bales, R. C., Kirchner, P. B., Litvak, M., and Brooks, P. D.: Soil moisture response to snowmelt timing in mixed-conifer subalpine forests, Hydrol. Process., 29, 2782–2798, https://doi.org/10.1002/hyp.10400, 2015.
He, G., P. Xiao, X. Feng, X. Zhang, Z. Wang and Chen, N.: Extracting snow cover in mountain areas based on SAR and optical data, IEEE Geosci. Remote S., 12, 1136–1140, 2015.
Kampf, S., Markus, J., Heath, J., and Moore, C.: Snowmelt runoff and soil moisture dynamics on steep subalpine hillslopes, Hydrol. Process., 29, 712–723, https://doi.org/10.1002/hyp.10179, 2015.
Kinar, N. J. and Pomeroy, W.: Measurement of the physical properties of the snowpack. Rev. Geophys., 53, 481–544, https://doi.org/10.1002/2015RG000481, 2015.
Lewis, A., Lacey, J., Mecklenburg, S., Ross, J., Siqueira, A., Killough, B., Szantoi, Z., Tadono, T., Rosenavist, A., Goryl, P., Miranda, N., and Hosford, S.: CEOS Analysis Ready Data for Land (CARD4L) Overview, in: IGARSS 2018 – 2018 IEEE Int. Geosci. and Remote Sens. Symp., 7407–7410, 2018.
Liu, H., Wang, L., and Jezek, K. C.: Automated delineation of dry and melt snow zones in Antarctica using active and passive microwave observations from space, IEEE T. Geosci. Remote, 44, 2152–2163, https://doi.org/10.1109/tgrs.2006.872132, 2006.
Lopes, A., Nezry, E., Touzi, R., and Laur, H.: Maximum A Posteriori Speckle Filtering And First Order Texture Models In Sar Images, 10th Annual International Symposium on Geoscience and Remote Sensing, 2409–2412, 1990.
Lopez-Moreno, J. I., Revuelto, J, Fassnacht, R., Azorn-Molina, C., Vicente-Serrano, S. M., Moran-Tejeda, E., and Sexstone, G. A.: Snowpack Variability Across Various Spatio-Temporal Resolutions, Hydrol. Process., 29, 1213–1224, 2015.
Luce, C. H. and Holden, Z. A.: Declining annual streamflow distributions in the Pacific Northwest United States, 1948–2006, Geophys. Res. Lett., 36, L16401, https://doi.org/10.1029/2009gl039407, 2009.
Luce, C. H., Tarboton, D. G., and Cooley, K. R.: The Influence of the Spatial Distribution of Snow on Basin-Averaged Snowmelt, Hydrol. Process., 12, 1671–1683, 1998.
Lui, Y., X. Chen, Hao, J.-S., and Li, L.: Snow cover estimation from MODIS and Sentinel-1 SAR data using machine learning algorithms in the western part of the Tianshan Mountains, J. Mt. Sci., 17, 884–897, 2020.
Manickam, S. and Barros, A.: Parsing Synthetic Aperture Radar Measurements of Snow in Complex Terrain: Scaling Behaviour and Sensitivity to Snow Wetness and Landcover, Remote Sens.-Basel, 12, 483, https://doi.org/10.3390/rs12030483, 2020.
Marin, C., Bertoldi, G., Premier, V., Callegari, M., Brida, C., Hürkamp, K., Tschiersch, J., Zebisch, M., and Notarnicola, C.: Use of Sentinel-1 radar observations to evaluate snowmelt dynamics in alpine regions, The Cryosphere, 14, 935–956, https://doi.org/10.5194/tc-14-935-2020, 2020.
Mätzler, C.: Applications of the Interaction of Microwaves with the Natural Snow Cover, Routledge, 133 pp., https://doi.org/10.1080/02757258709532086, 1987.
Meybeck, M., Green, P., and Vörösmarty, C.: A New Typology for Mountains and Other Relief Classes, Mt. Res. Dev., 21, 34–45, 2001.
Mote, P. W., Hamlet, A. F., Clark, M. P., and Lettenmaier, D. P.: Declining Mountain Snowpack in Western North America, B. Am. Meteorol Soc., 21, 34–45, https://doi.org/10.1175/bams-86-1-39, 2005.
Muggeo, V. M.: Interval Estimation for the Breakpoint in Segmented Regression: a Smoothed Score-Based Approach, Aust. NZ J. Stat., 59, 311–322, 2017.
Nagler, T. and Rott, H.: Retrieval of wet snow by means of multitemporal SAR data, IEEE T. Geosci. Remote, 38, 754–765, 2000.
Nagler, T., Rott, H., Ripper, E., Bippus, G., and Hetzenecker, M.: Advancements for Snowmelt Monitoring by Means of Sentinel-1 SAR, Remote Sens.-Basel, 8, 348, https://doi.org/10.3390/rs8040348, 2016.
Neumann, N. N., Derksen, C., Smith, C., and Goodison, B.: Characterizing Local Scale Snow Cover Using Point Measurements During the Winter Season, Atmos. Ocean, 44, 257–259, 2006.
Park, S. E., Moon, W. M., and Potter, E.: Assessment of Scattering Mechanism of Polarimetric SAR Signal From Mountainous Forest Areas, IEEE T. Geosci. Remote, 44, 4711–4719, https://doi.org/10.1109/TGRS.2012.2194153, 2012.
Pelto, B. M., Menounos, B., and Marshall, S. J.: Multi-year evaluation of airborne geodetic surveys to estimate seasonal mass balance, Columbia and Rocky Mountains, Canada, The Cryosphere, 13, 1709–1727, https://doi.org/10.5194/tc-13-1709-2019, 2019.
Pivot, F. C.: C-Band SAR Imagery for Snow-Cover Monitoring at Treeline, Churchill, Manitoba, Canada, Remote Sens.-Basel, 4, 2133–2155, https://doi.org/10.3390/rs4072133, 2012.
Pojar, J., Klinka, K., and Meidinger, D. V.: Biogeoclimatic ecosystem classification in British Columbia, Forest Ecol. Manag., 22, 119–154, https://doi.org/10.1016/0378-1127(87)90100-9, 1987.
Premier, V., Marin, C., Steger, S., Notarnicola, C., and Bruzzone, L.: A novel approach based on a hierarchical multiresolution analysis of optical time series to reconstruct the daily high resolution snow cover area, IEEE J. Sel. Top. Appl., 14, 9223–9240, 2021.
Rauscher, S. A., Pal, J. S., Diffenbaugh, N. S., and Benedetti, M. M.: Future changes in snowmelt-driven runoff timing over the western US, Geophys. Res. Lett., 35, L16703, https://doi.org/10.1029/2008gl034424, 2008.
Revuelto, J., Alonso-Gonzalez, E., Gascoin, S., Rodriguez-Lopez, G., and Lopez-Moreno, J. I.: Spatial downscaling of MODIS snow cover observations using Sentinel-2 snow products, Remote Sens.-Basel, 13, 4513, https://doi.org/10.3390/rs13224513, 2021.
RStudio Team: RStudio: Integrated Development Environment for R, RStudio [code], PBC, Boston, MA, http://www.rstudio.com/ (last access: 13 March 2023), 2021.
Rumsey, C. A., Miller, M. P., and Sexstone, G. A.: Relating Hydroclimatic Change to Streamflow, Baseflow, and Hydrologic Partitioning in the Upper Rio Grande Basin, 1980 to 2015, J. Hydrol., 584, 124715, https://doi.org/10.1016/j.jhydrol.2020.124715, 2020.
Schmid, L., Heilig, A., Mitterer, C., Jürg Schweizer, Maurer, H., Okorn, R., and Eisen, O.: Continuous snowpack monitoring using upward-looking ground-penetrating radar technology, J. Glaciol., 60, 509–525, https://doi.org/10.3189/2014jog13j084, 2014.
Shea, J. M., Menounos, B., Moore, R. D., and Tennant, C.: An approach to derive regional snow lines and glacier mass change from MODIS imagery, western North America, The Cryosphere, 7, 667–680, https://doi.org/10.5194/tc-7-667-2013, 2013.
Shi, J. and Dozier, J.: Inferring snow wetness using C-band data from SIR-C's polarimetric synthetic aperture radar, IEEE T. Geosci. Remote, 33, 905–914, https://doi.org/10.1109/36.406676, 1995.
Stähli, M., Stacheder, M., Gustafsson, D., Schlaeger, S., Schneebeli, M., and Brandelik, A.: A new in situ sensor for large-scale snow-cover monitoring, Ann. Glaciol., 38, 273–278, https://doi.org/10.3189/172756404781814933, 2004.
Vollrath, A., Mullissa, A., and Reiche, J.: Angular-Based Radiometric Slope Correction for Sentinel-1 on Google Earth Engine, Remote Sens.-Basel, 12, 1867, https://doi.org/10.3390/rs12111867, 2020.
Wang, X. Y., Wang, J., Jiang, Z. Y., Li, H. Y., and Hao, X. H.: An Effective Method for Snow-Cover Mapping of Dense Coniferous Forests in the Upper Heihe River Basin Using Landsat Operational Land Imager Data, Remote Sens.-Basel, 7, 17246–17257, https://doi.org/10.3390/rs71215882, 2015.
Westerling, A. L.: Increasing western US forest wildfire activity: sensitivity to changes in the timing of spring, Philos. T. Roy. Soc. B, 371, 20150178, https://doi.org/10.1098/rstb.2015.0178, 2016.
Westerling, A. L., Hidalgo, H. G., Cayan, D. R., and Swetnam, T. W.: Warming and earlier spring increase western U. S. forest wildfire activity, Science, 313, 940–943, 2006.
Wood, S. N.: Minimizing Model Fitting Objectives that Contain Spurious Local Minima by Bootstrap Restarting, Biometrics, 57, 240–244, 2001.
Yamaguchi, S., Katsuchima, T., Sato, A., and Kumakura, T.: Water retention curve of snow with different grain sizes,Cold Reg. Sci. Technol., 64, 87–93, 2010.