the Creative Commons Attribution 4.0 License.
the Creative Commons Attribution 4.0 License.
 | 03 Apr 2023
Assessment of Arctic seasonal snow cover rates of change
Lawrence Mudryk
Arctic snow cover extent (SCE) trends and rates of change reported across recent climate assessments vary due to the time period of available data, the selection of snow products, and methodological considerations. While all reported trends are strongly negative during spring, more uncertainty exists in autumn. Motivated to increase the confidence in SCE trends reported in climate assessments, we quantify the impact of (1) year-over-year increases in time series length over the past 2 decades, (2) the choice of reference period, (3) the application of a statistical methodology to improve inter-dataset agreement, (4) the dataset ensemble size, and (5) product version changes. Results show that the rate of change during May and June has remained consistent over the past decade as time series length has increased and is largely insensitive to the choice of reference period. Although new product versions have increased spatial resolution, use more advanced reanalysis meteorology to force snow models, and include improved remote sensing retrieval algorithms, these enhancements do not result in any notable changes in the observed rate of Arctic SCE change in any month compared to a baseline set of older products. The most impactful analysis decision involves the scaling of dataset climatologies using an updated version of the NOAA snow chart climate data record as the baseline. While minor for most months, this adjustment can influence the calculated rate of change for June by a factor of 2 relative to different climatological baselines.
- Article
(5132 KB) - Full-text XML
- BibTeX
- EndNote


As comprehensively assessed in the Intergovernmental Panel on Climate Change (IPCC) Special Report on Oceans and Cryosphere in Changing Climate (SROCC), changes to the Arctic cryosphere driven by the response to warming surface temperatures are unequivocal (Meredith et al., 2019). Sea ice extent reductions are occurring in all months of the year (Stroeve and Notz, 2018) and are most dramatic in the late summer and early autumn as earlier melt onset and subsequent enhanced ice loss result in increased heat stored by the ocean, which in turn delays ice formation (Stroeve et al., 2014). Near-surface permafrost temperatures have reached record highs in the observational period (Biskaborn et al., 2019). Warmer summer air temperature and hence soil temperature induce a deeper active layer with implications for thermokarst events, changes to surface hydrology, and carbon release (Turetsky et al., 2020). Arctic seasonal snow cover on land is responding directly to warming temperatures (Mudryk et al., 2020).
Unlike the proportion of sea ice cover that presently survives the summer melt season (at least for the immediate future), terrestrial snow (outside of snow on glaciers and sporadic snow patches) disappears completely from the Arctic land surface every summer. The most climate-sensitive indicators are therefore Arctic snow extent during the onset (autumn season) and Arctic snow extent during melt (spring season). Variability and trends in snow phenology have important implications for the surface energy budget (Flanner et al., 2011), snow-related impacts on permafrost (Walvoord and Kurylyk, 2016), the timing of snowmelt contributions to streamflow (Déry et al., 2016), and impacts on the habitat of flora and fauna (Bokhorst et al., 2016). Given this importance, the strong sensitivity of snow-to-surface temperature (Mudryk et al., 2017), and one of the longest historical data records from satellite (Estilow et al., 2015), spring snow cover is a compelling indicator of climate change impacts on the Arctic. As such, it is commonly included as part of climate assessments (e.g. Meredith et al., 2019; Mudryk et al., 2021; AMAP, 2021).
In this study, we examine Arctic snow cover trends through the lens of these climate assessments. The motivation comes from our participation in two different types of assessments. The Arctic Report Card (ARC) is published annually by NOAA (https://www.arctic.noaa.gov/Report-Card, last access: 28 March 2023). The purpose of the ARC is to provide an annual update on long-term trends of key Arctic climate indicators, with an emphasis on placing the most recent year in the context of historical variability and trends. We have led the “Terrestrial Snow” contribution to the ARC every year since 2009 (e.g. Mudryk et al., 2021). We also participated in the IPCC SROCC “Polar regions” chapter (Meredith et al., 2019) and contributed snow cover trend information to the IPCC Sixth Assessment Report. Unlike the annually updated ARC, assessments like the SROCC and AR6 cover literature and data up to a specific cut-off date.
Both the Fifth Assessment Report (Vaughn et al., 2013) and the Sixth Assessment Report (Gulev et al., 2021) of the IPCC assigned “very high confidence” to observed spring snow extent reductions at the hemispheric scale (IPCC calibrated uncertainty language is described in Mastrandrea et al., 2011). The SROCC assessment, however, assigned only “high confidence” to observed changes to Arctic snow cover extent (IPCC, 2019). Inconsistent autumn trends due to the choice of snow dataset (e.g. Brown and Derksen, 2013) and large inter-product differences in spring snow extent magnitude and trends (e.g. Brown et al., 2010) precluded the attribution of “very high confidence”.
The snow-cover–climate literature communicates snow cover changes in different ways depending on the context and motivating science questions. To assess how conditions in one particular year differ from the long-term average, the anomaly is the relevant calculation. To determine the long-term change in a specific snow quantity, the trend is the appropriate metric. To understand the pace of observed changes, the rate of change is insightful. In both the ARC and the SROCC, change in spring snow cover extent was communicated as a rate, expressed as percent per decade. This approach is common and is applied in widely cited and public-facing assessments of change for other variables, such as Arctic sea ice extent (http://nsidc.org/arcticseaicenews/, last access: 28 March 2023). Change expressed as percent per decade is attractive because it is straightforward for non-expert interpretation, facilitates comparison between different variables (e.g. snow cover versus sea ice), and is easily applied to both historical observations and climate model projections. There are limitations, however, because a rate change is sensitive to the reference period against which the change is determined, and large proportional changes are exaggerated when absolute values are small.
In this study we determine the sensitivity of the commonly used metric of change in snow cover extent (expressed as percent per decade) to year-over-year changes in time series length, choice of reference period, the application of a statistical methodology to improve inter-dataset agreement, version-to-version changes in snow products, and snow product ensemble size. Results quantify the sensitivity to the range of choices available to investigators, thereby increasing confidence in reported Arctic snow extent changes.
2.1 Snow products
Snow on the ground is a challenging variable to measure (Brown et al., 2021), model (Menard et al., 2021), and remotely sense (Frei and Lee, 2010). It is challenging to characterize using surface observations because of local-scale variability driven by interactions between snow, wind, vegetation, and topography. It is generally accepted that a single point in space (e.g. snow depth as is typically measured at automatic weather stations) provides some locally relevant information, which decreases in value with distance from that point. Uncertainty arises from extrapolation. Gridded datasets (remotely sensed; modelled) also have limitations by providing a single value over some integrated area; conventional wisdom is that uncertainty increases as resolution gets coarser. Uncertainty arises from aggregation and the inability to resolve spatial variability. Because point (or short transect) observations are generally used to validate gridded datasets, uncertainty is circular.
Despite these issues, evaluation with snow course measurements shows that ensembles of gridded snow products exhibit more skill than individual datasets (provided certain poorly performing datasets are excluded from the averaging as described in Mortimer et al., 2020). There is clear value in averaging multiple independent snow products together to reduce uncertainty. Unfortunately, maintaining up-to-date multi-product snow time series is difficult: some products fail to be updated, products inevitably transition to new versions, and new datasets emerge. In this study, we update the available set of snow products in order to determine the sensitivity to various analysis scenarios and choices as outlined in Sect. 3. We also maintain two generations of the products to allow an assessment of the impact of version changes.
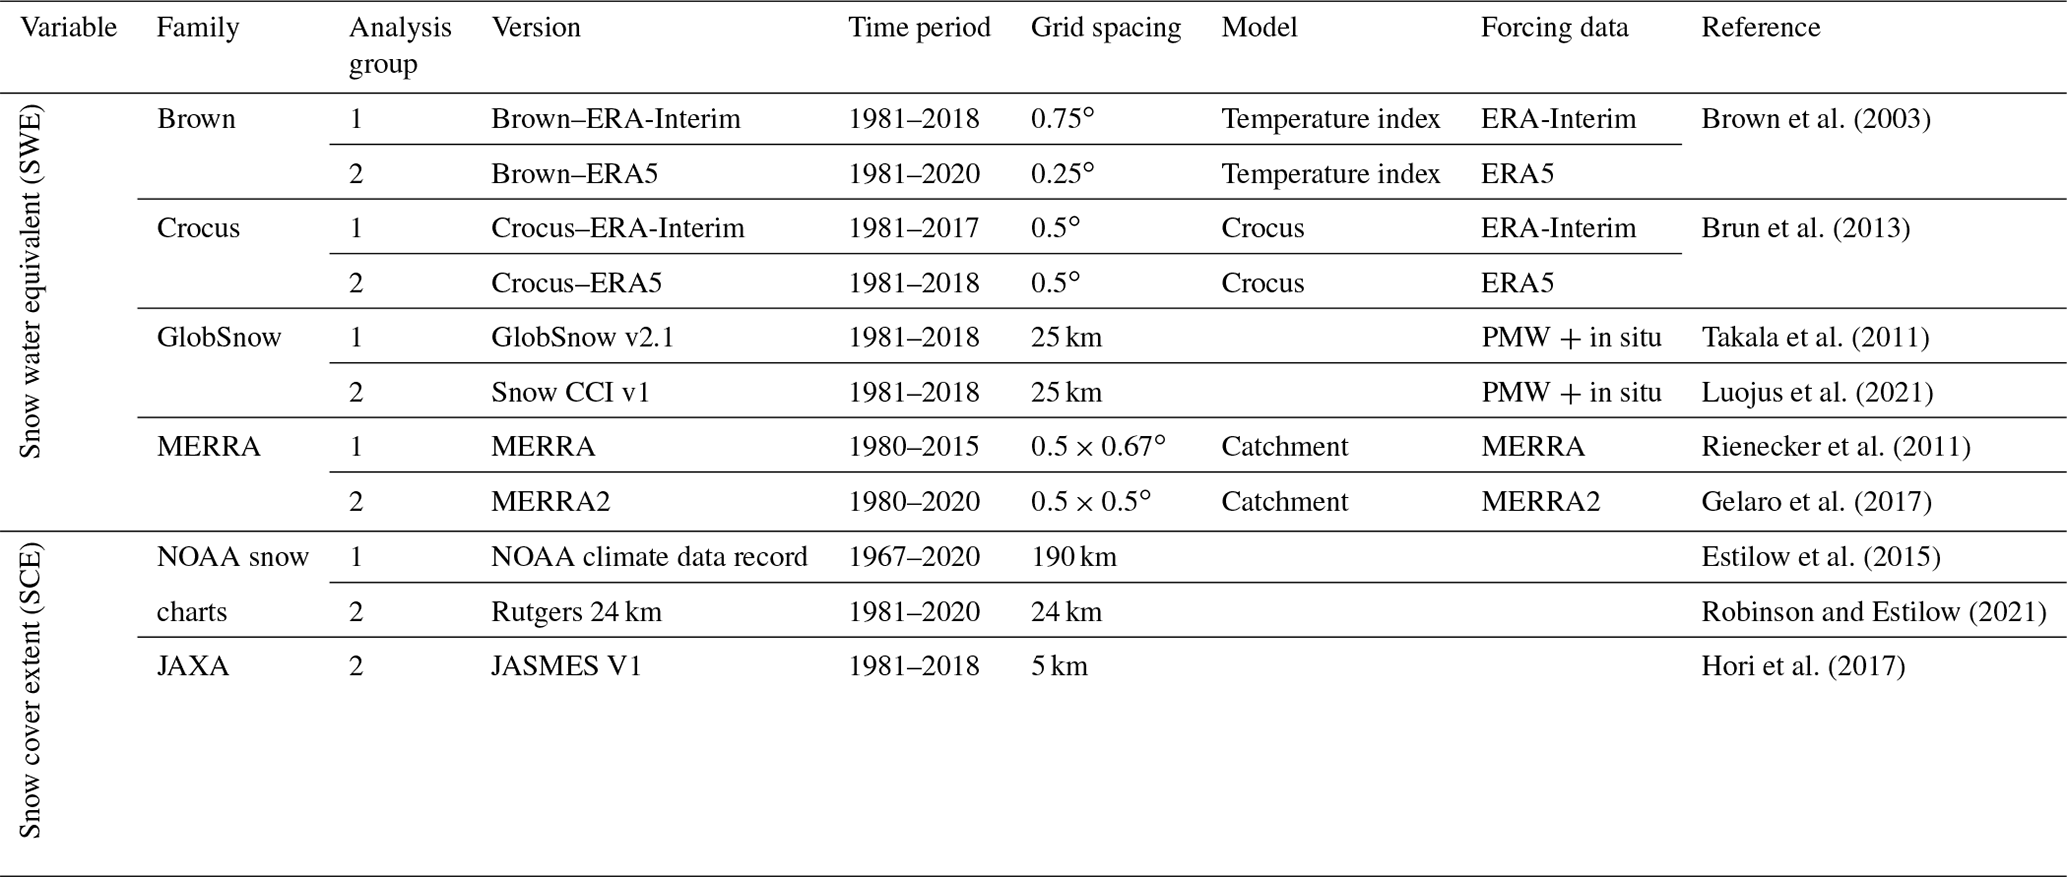
As summarized in Table 1, the snow products are the following:
-
Output from the Modern-Era Retrospective Analysis for Research and Applications version 2 (MERRA-2) (Gelaro et al., 2017), which follows from MERRA (Rienecker et al., 2011). Both datasets employ an intermediate-complexity snow scheme (within the Catchment Land Surface Model) forced by MERRA meteorology.
-
Snow accumulation determined by a simple temperature index model after Brown et al. (2003) driven by ERA-Interim or ERA5 reanalysis. While the index model itself remains the same, the output is sensitive to the reanalysis version used to drive the model.
-
The Crocus physical snow model driven by ERA-Interim (Brun et al., 2013) or ERA5 reanalysis.
-
The European Space Agency Snow CCI SWE dataset (version 1) derived from a combination of satellite passive microwave data and climate station snow depth observations (Luojus et al., 2021), which is an update of the ESA GlobSnow dataset (Takala et al., 2011). There are several versions of GlobSnow; we use version 2.1 as it was the product used in previous analysis (e.g. Mudryk et al., 2017), and its algorithm differs more from the recent advances implemented in Snow CCI. Both the GlobSnow and Snow CCI datasets mask out complex terrain, so snow mass was replaced in the mountain grid cells using the mean value from datasets 1–3 above (consistent with Mudryk et al., 2020).
-
The historical snow chart products (NOAA CDR and Rutgers 24 km). The NOAA CDR (climate data record) is a 190 km resolution binary snow cover product (Estilow et al., 2015) based on historical snow charts. These snow charts were originally produced by analysts who relied primarily on visible satellite imagery. Starting in 1998 their production switched to the 24 km Interactive Mapping System (IMS). The original NOAA CDR was produced by digitizing the historical charts at 190 km resolution and merging them with the IMS charts coarsened to the same 190 km grid spacing. Recently, the pre-IMS snow charts from late 1980 onwards have been re-digitized at 24 km resolution to match that of the IMS charts. This process enabled production of a revised snow cover product with improved grid spacing (Robinson and Estilow, 2021). We denote the recent product as Rutgers 24 km and use it for our primary analysis over the 1981–2020 period. We denote the original product as NOAA CDR and only use it when necessary to extend the time series to the 1967–1980 period (Figs. 1–3) or when comparing older and updated products (Figs. 7–8).
-
The JAXA JASMES snow extent product, derived from objective analysis of AVHRR and MODIS imagery (Hori et al., 2017). Only a single version of this product is available.
Gridded daily snow cover is calculated for datasets 1–4 by applying a 5 mm SWE threshold to determine snow extent (background on the derivation of this threshold is provided in Krinner et al., 2018). These daily fields are averaged over each month to produce monthly snow cover fraction (SCF). For datasets 5–6 averaged monthly, snow cover fraction was interpolated from the submonthly data. Finally, Arctic snow extent is calculated by summing monthly SCF over land north of 60∘ latitude. Grid cells with perennial snow cover (e.g. snow on glaciers) were not retained in the analysis. While this could have an appreciable effect on snow mass analysis, there is a minimal effect on snow extent at the pan-Arctic scale.
Table 1Summary of snow datasets. Analysis group 2 represents the newest product versions relative to analysis group 1.
2.2 Time series adjustment
In previous studies (e.g. Mudryk et al., 2020), the climatology and standard deviation of multiple snow extent datasets were adjusted before analysis by employing a methodology described in Brown et al. (2010) and Brown and Robinson (2011). We followed this process to create “adjusted” versions of each dataset that differed from the raw versions by two factors. First, each climatology was replaced by the climatology of the Rutgers 24 km product. Second, each dataset's variability was scaled towards the average of all datasets. The first adjustment was made by calculating anomalies using each dataset's own climatology and adding those anomalies to the Rutgers 24 km climatology. The second adjustment was made by standardizing the anomalies using the standard deviation of each dataset but then “de-standardizing” using the average standard deviation of all datasets (see equations in Sect. 3.1 for further details). These decisions were made under the assumption that the Rutgers 24 km record represents the best estimate of the “true” historical snow extent and that the variability of the six-component dataset is more accurate than any single dataset. This approach was prompted by the analysis in Mudryk et al. (2017), which showed that variability in the NOAA-CDR dataset may be artificially high during spring, an issue which remains in the Rutgers 24 km version (not shown). These six adjusted time series were averaged over the 1981–2017 period, and this average time series was merged with the adjusted NOAA time series over the 1967–1980 period. This methodology allows the “scaled” versions of datasets which start in 1981 to be extended back to 1967 and ensures that the transition between the pre- and post-1981 periods does not contain any discontinuities due to changes in climatology or variability.
The impact of the adjustment process as applied to each snow extent dataset is shown in Fig. 1 for the month of May. We focus on the set of the six most recent product versions (including JASMES). The raw time series (Fig. 1a) cover a range of approximately 6 ×10⁶ km2 (between 6 ×10⁶ and 12 ×106 km2). This is a sobering number (not far below the mean May snow cover extent of ∼ 8 ×10⁶ km2 from all the products) and approximately the same as the product range for the older family of datasets (not shown). The inter-product range slightly exceeds the value calculated from an even older product set described in Brown et al. (2010), although there are some methodological differences in how snow extent was defined. Regardless, there is no evidence of increased agreement in the absolute climatological extent of snow amongst the most recent product versions compared to previously published analysis. The adjustment process as described in Sect. 2 enforces climatological agreement while retaining the interannual variability of each dataset (Fig. 1b). This yields a mean May SCE between 1981–2018 of 10.6 (±0.76 SD) ×106 km2, which is very similar to Brown et al. (2010). The SCE rate of change since 1981, calculated for end years starting in 2000 (e.g. 1981–2000, 1981–2001, and so on), is shown in Fig. 1c. The inter-product range is −2 % per decade to −5 % per decade. The rate of May snow cover loss increased from 2005 through 2015 in all datasets and has stabilized in recent years.
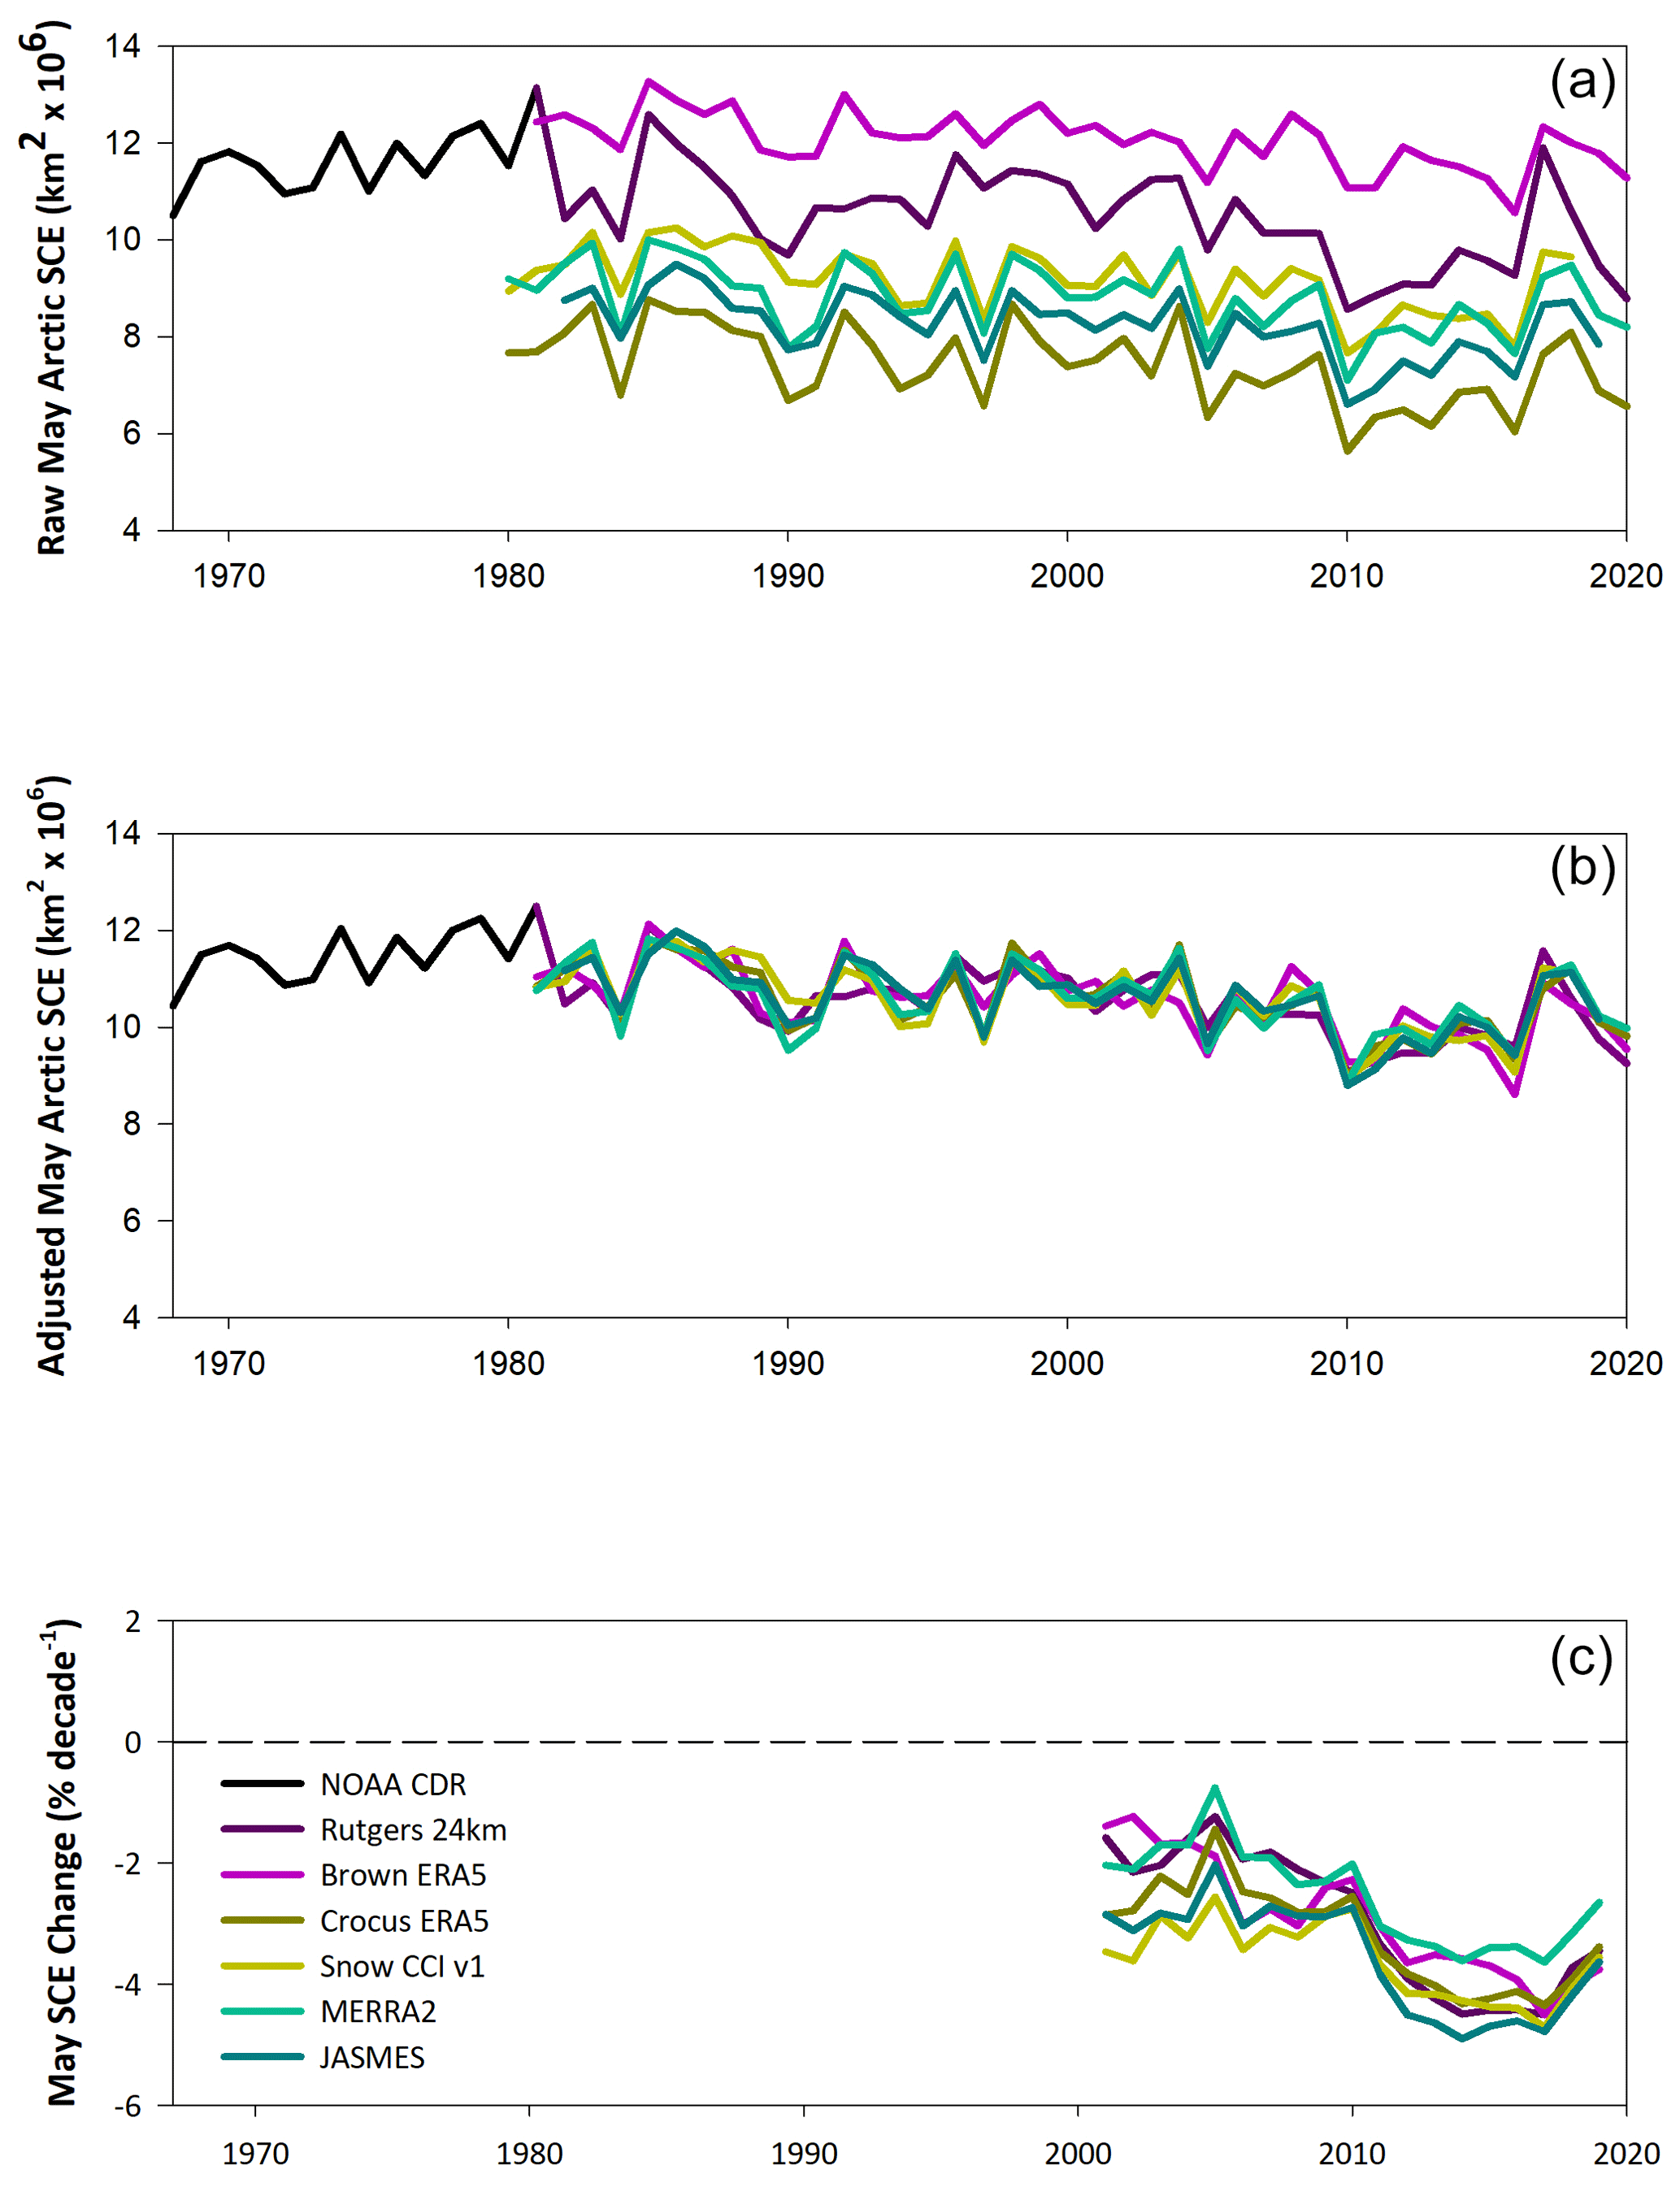
Figure 1Raw time series of May Arctic snow extent (a), adjusted time series (b), and rate of change since 1981 of adjusted time series (c).
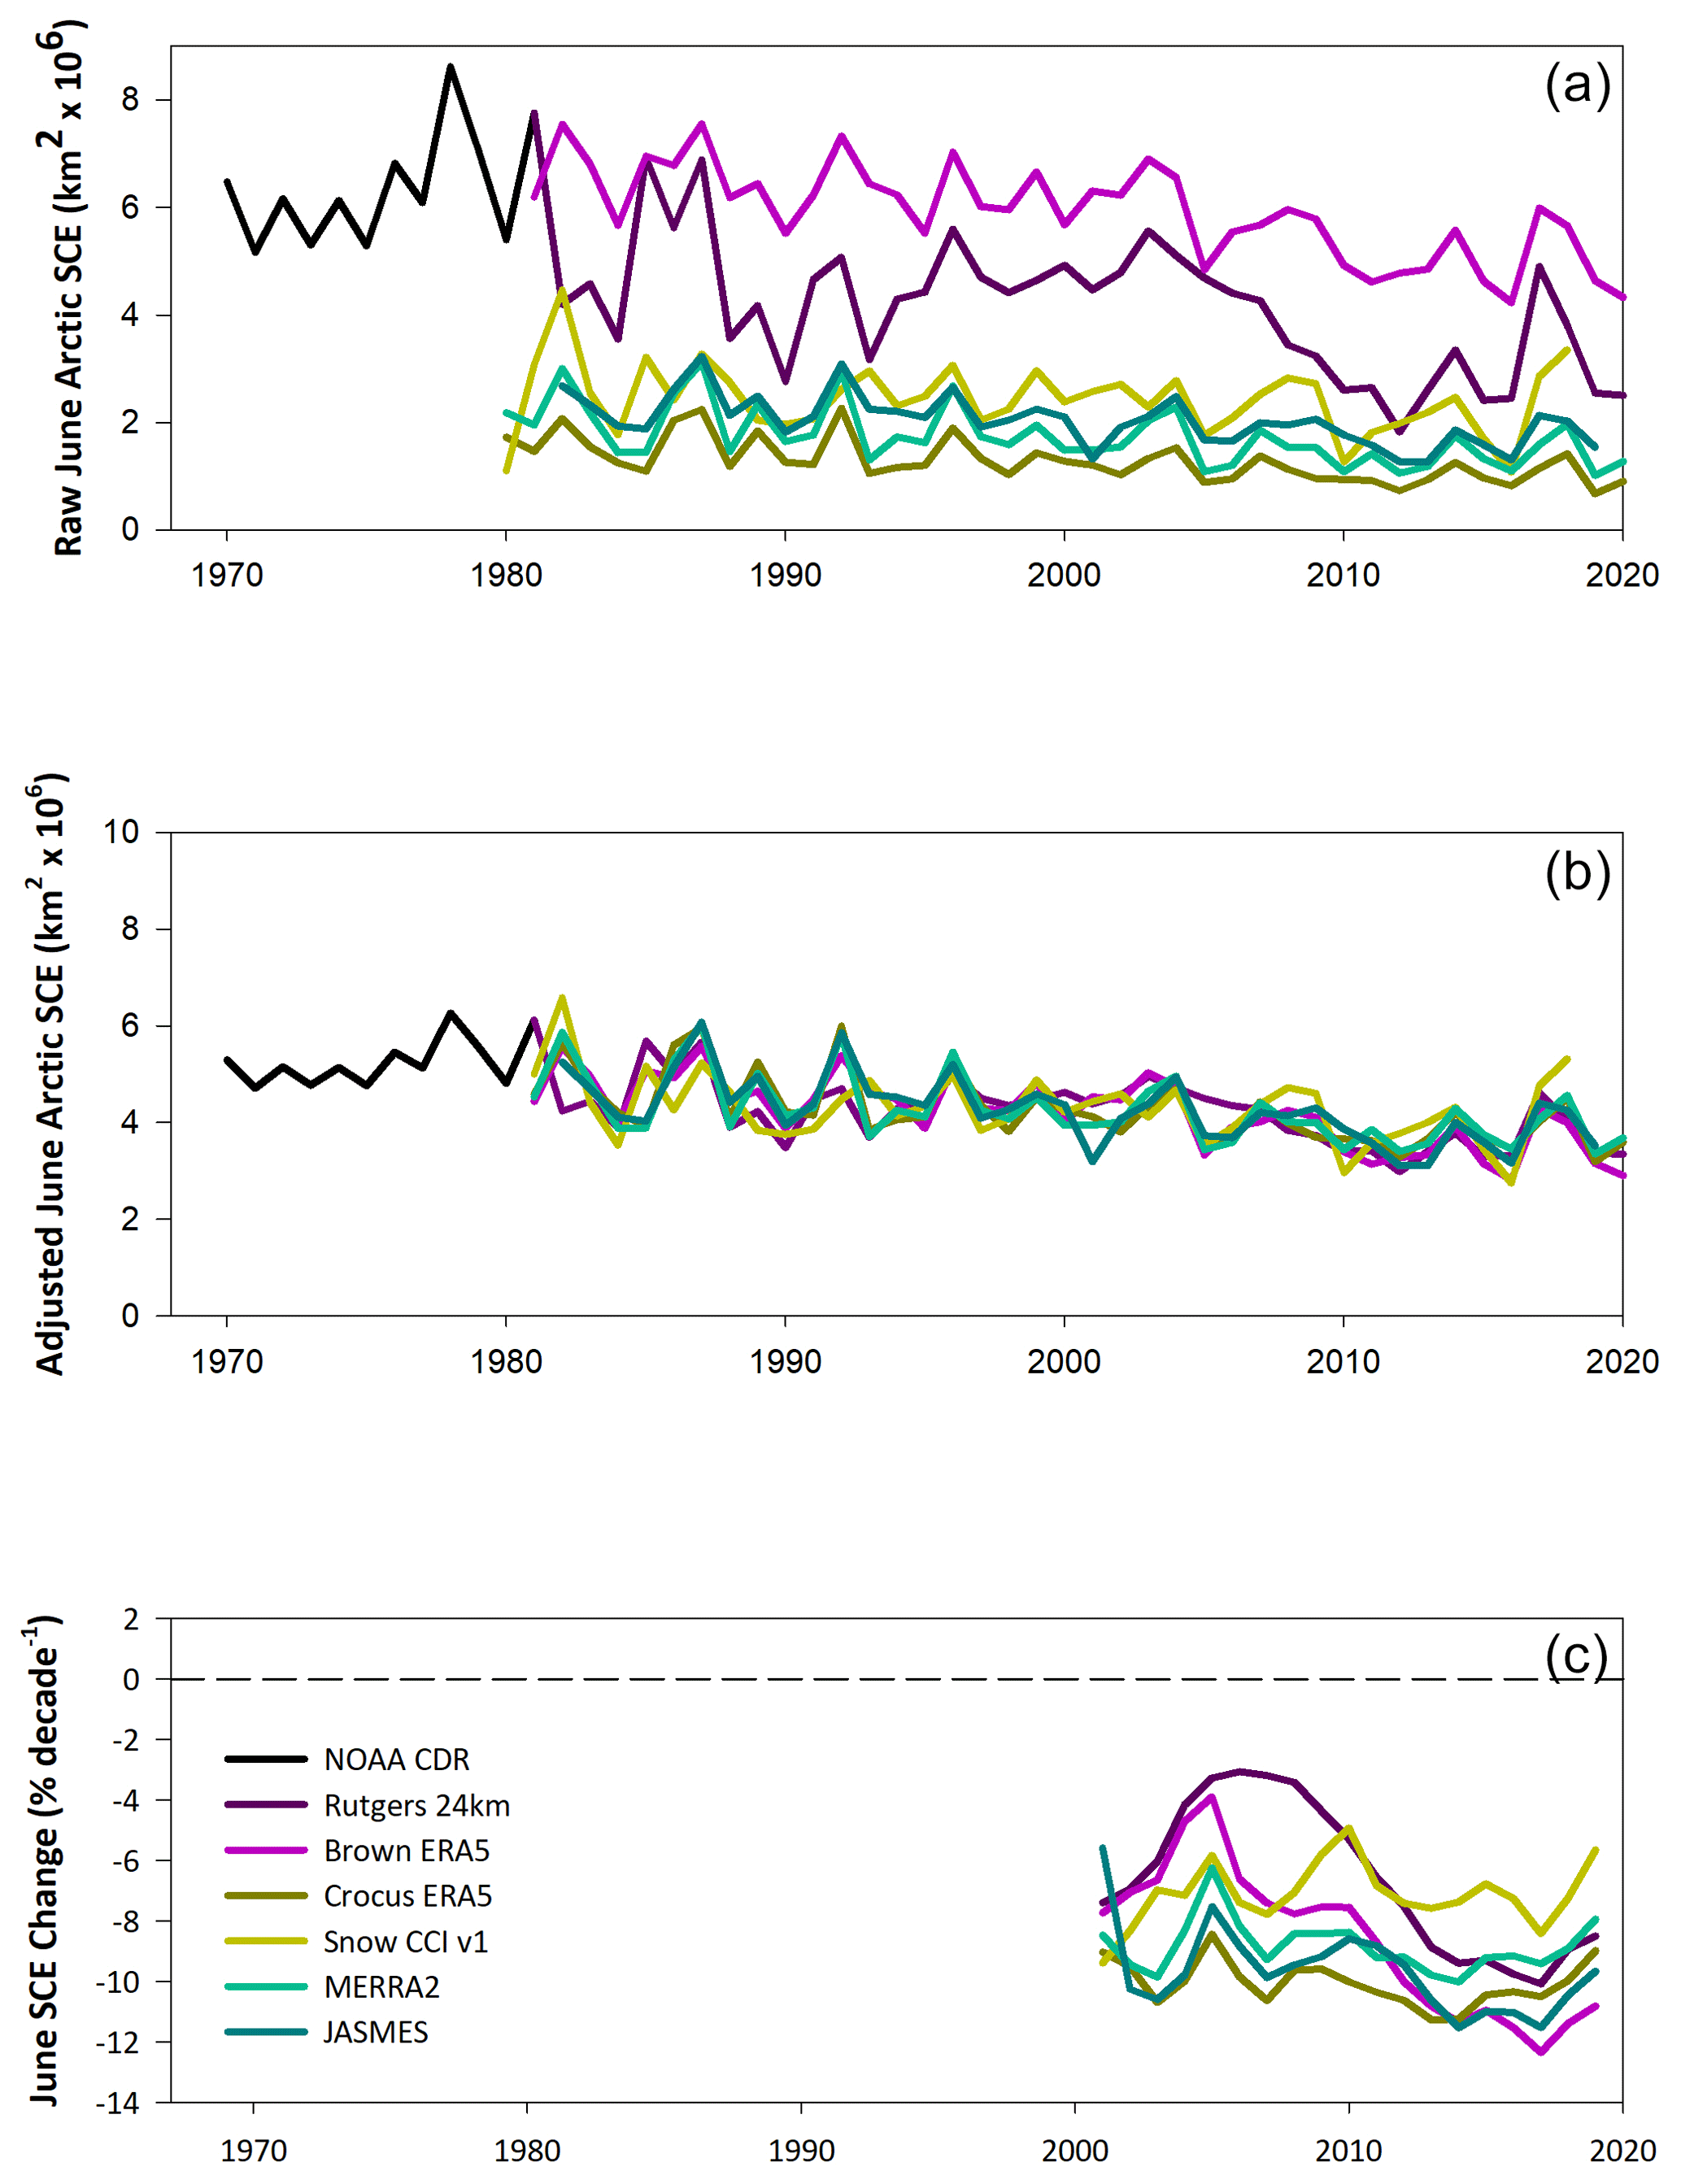
The impact of dataset adjustment is similar for the month of June (Fig. 2a and b). The large range of raw snow extent values includes some datasets with very little snow (<2 ×10⁶ km2), with others showing over 4 ×10⁶ km2. Extensive June SCE in the NOAA-CDR dataset before 1980 explains the strong negative trends in June reported in studies which analyzed this record on its own (Derksen and Brown, 2012; Mudryk et al., 2017). From 2000, the inter-product range in SCE reductions is −4 % per decade to −12 % per decade (Fig. 2c).
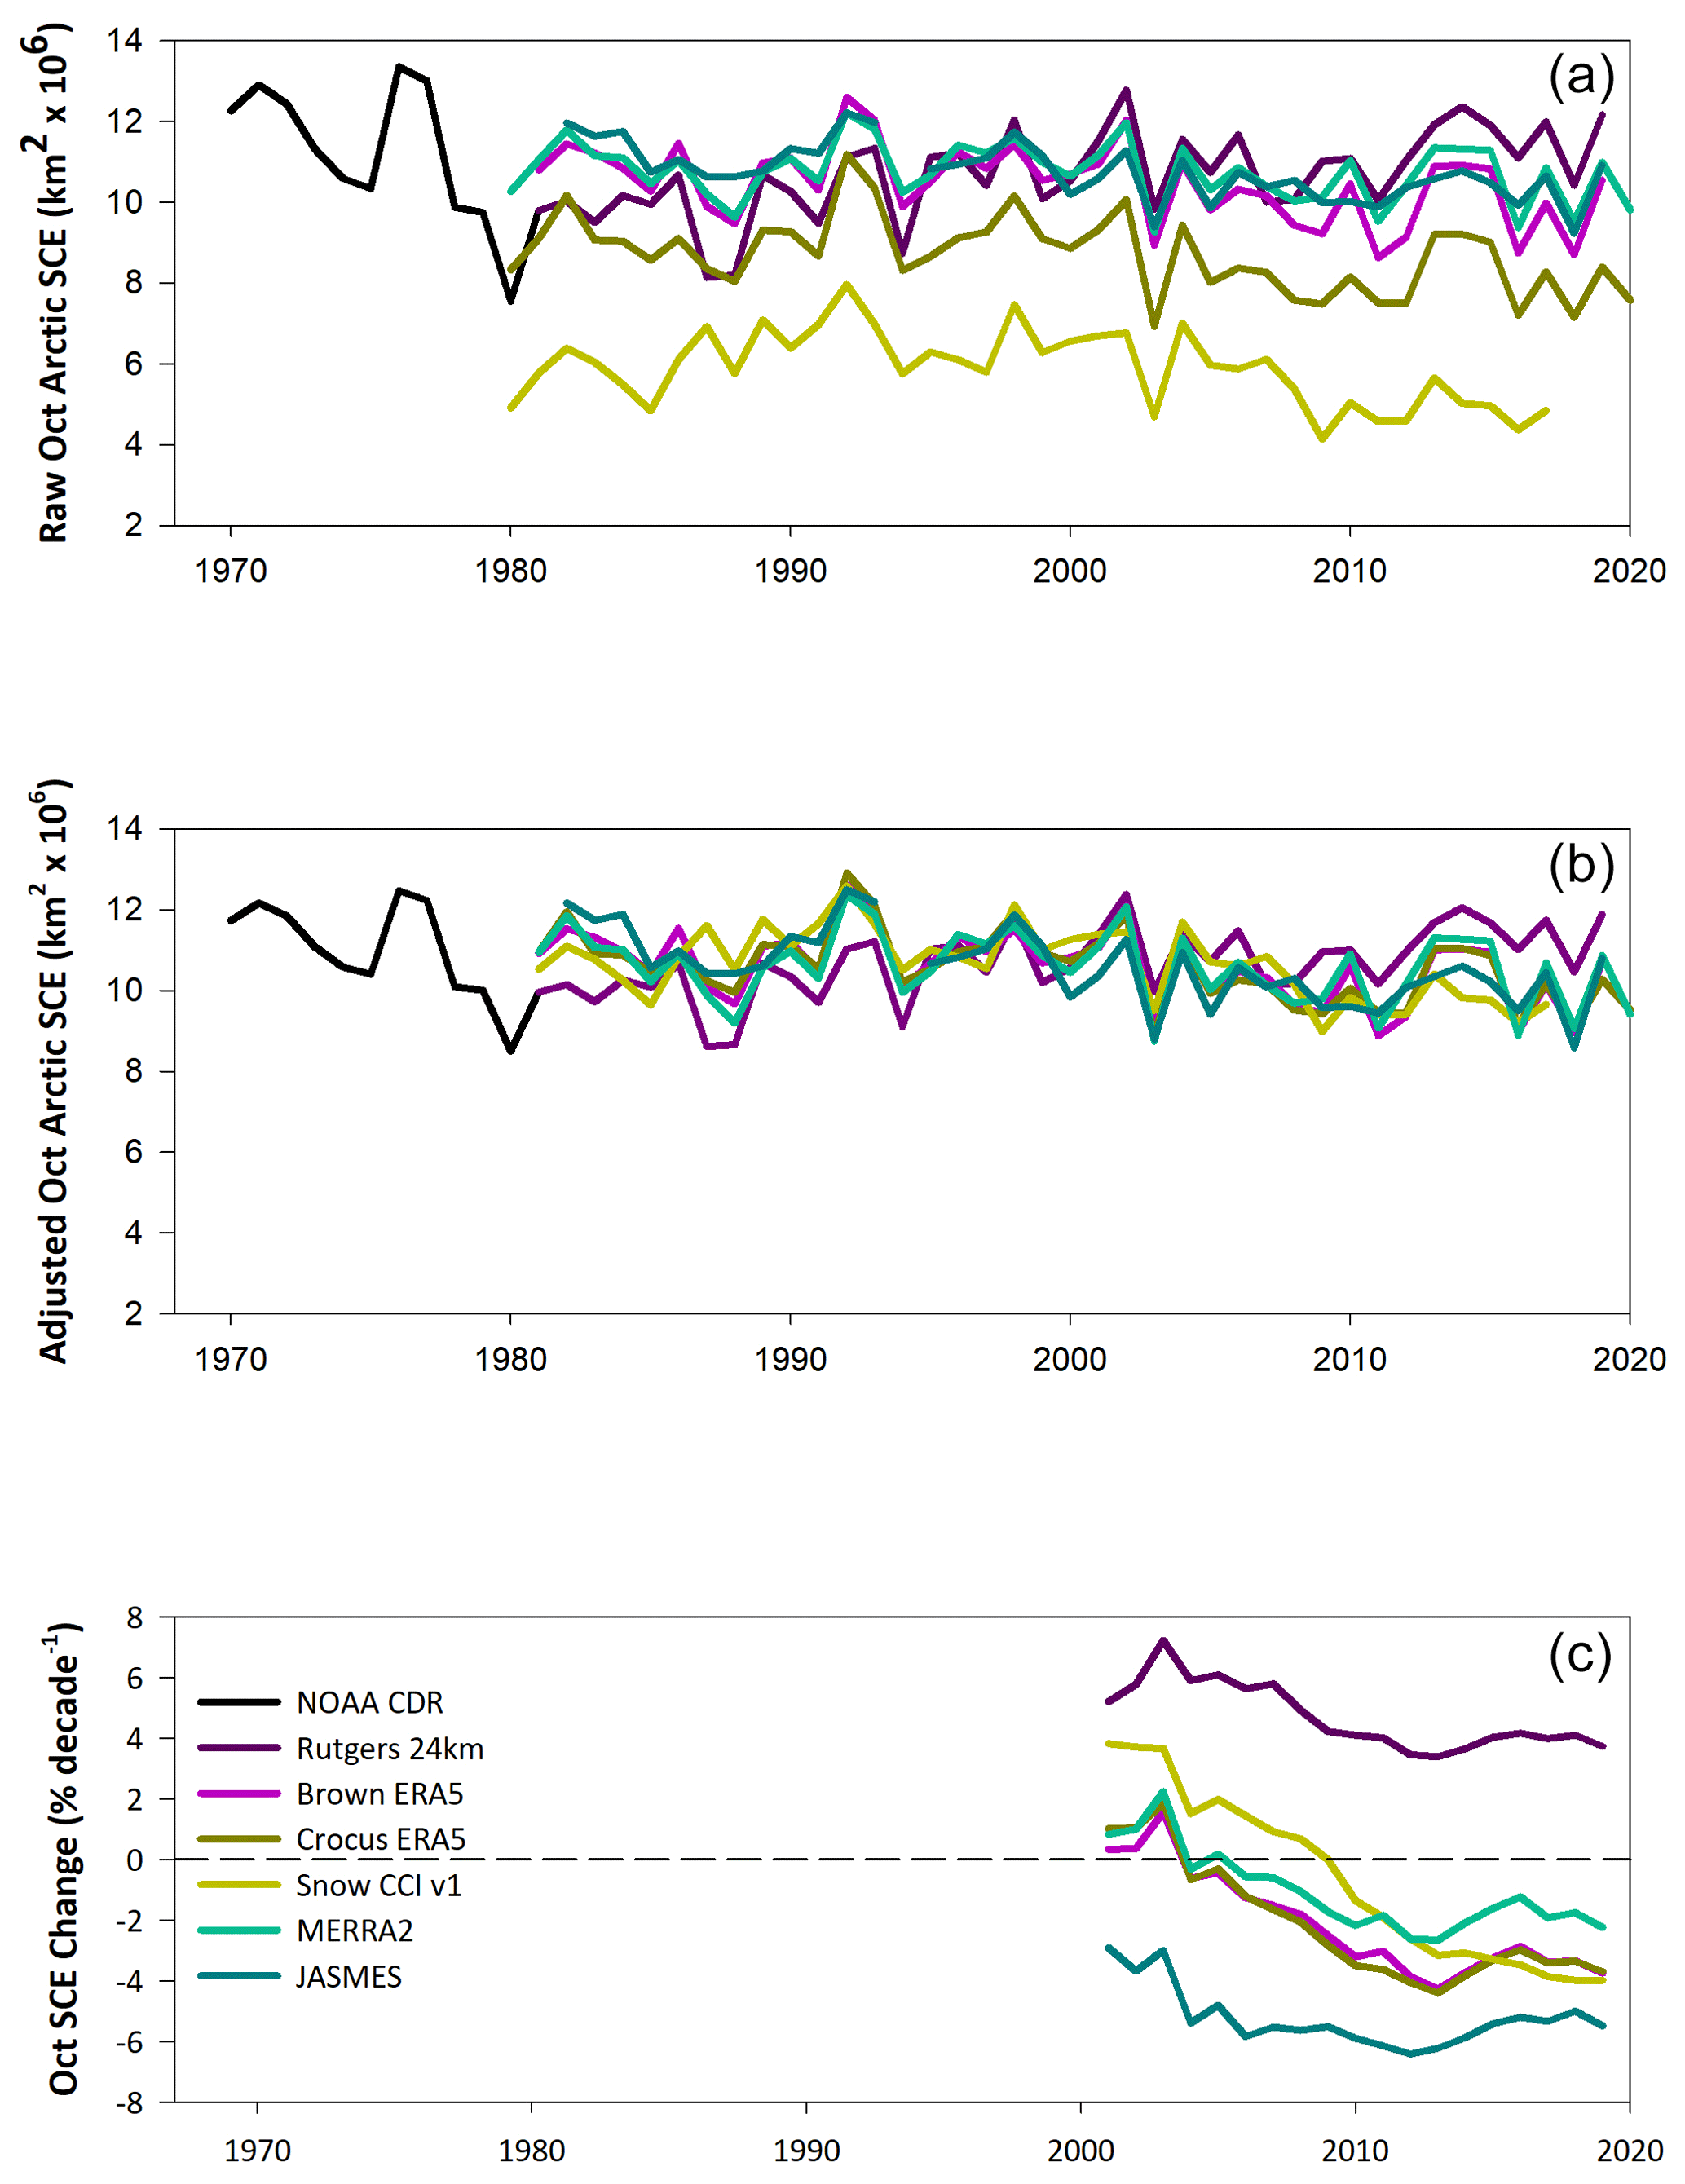
October snow cover trends have long been of interest because an apparent increase in snow extent evident in the NOAA CDR was identified as the trigger to a sequence of feedbacks during the Northern Hemisphere winter (Cohen et al., 2012; Henderson et al., 2018). An assessment has shown, however, that other datasets do not exhibit a positive snow extent trend in October (Brown and Derksen, 2013; Hori et al., 2017), so the NOAA-CDR trend is a significant outlier (Mudryk et al., 2017), as is the Rutgers 24 km product as seen in Fig. 3. Like May, the raw snow extent time series span a large range in October (∼ 8 ×10⁶ km2; Fig. 3a). The adjustment process by definition aligns the absolute magnitude at an average of 10.5 ×10⁶ km2 (±0.87 SD; Fig. 3b), but because the Rutgers 24 km trend does not agree with the other products, a larger inter-product spread is evident in the October SCE rates of change (Fig. 3c). Unlike May and June, there is disagreement in the trend direction between datasets through approximately 2005. After that point, all datasets indicate a loss of October snow cover, with the exception of the Rutgers 24 km product.
3.1 Rate-of-change calculations
We use the following notation for a time series:
where xi represents a snow extent time series for a given month (e.g. June SCE), represents the climatological mean for the choice of reference period, and Δxi represents the yearly anomalies. A linear trend for the above series can be determined by ordinary-least-squares regression. The rate of change of the time series ri (its slope) depends only on the anomalies (the selection of years considered) and not on the choice of reference period used to determine . In what follows we will use time window to denote the selection of yearly anomalies considered and reference period to denote the years used to determine .
To calculate a percent rate of change (for example, to cite a trend in units of percent per decade) we use a normalized time series:
with a percent rate of change that now depends not only on the anomaly time window, but also on the choice of reference period, P.
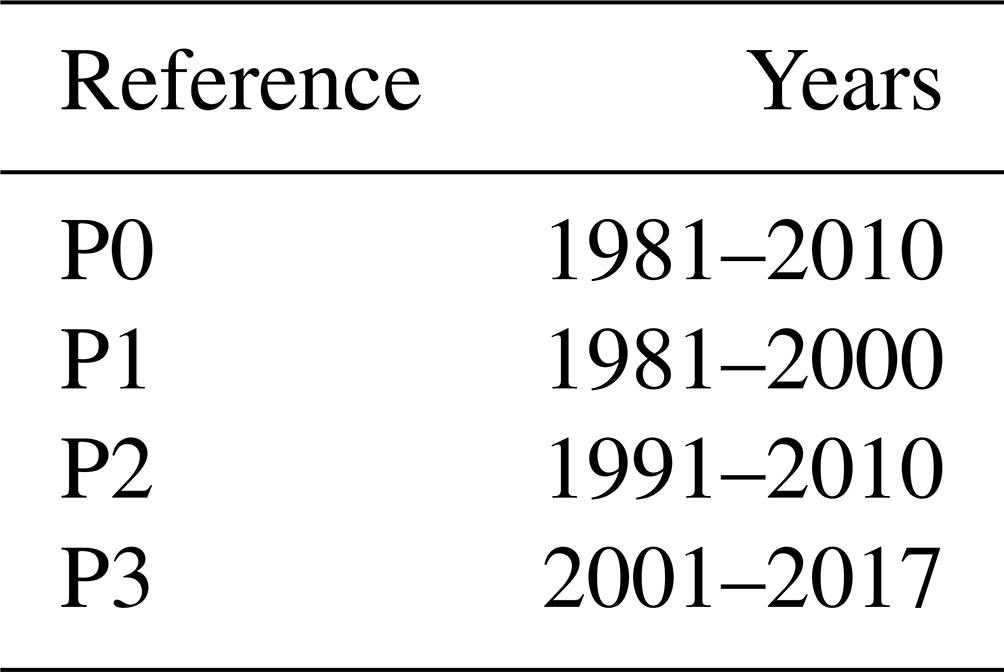
All our calculations use time windows that begin in 1981, so in the following we label rates of change with the final year of the time window and a reference period taken from Table 2. For example denotes the percent rate of change calculated using anomalies from 1981–2000 but normalized with respect to a climatological period of 1991–2010.
The adjusted time series have the following form:
where is the climatology of the NOAA CDR and is the ratio of the average standard deviation from all the datasets (denoted 〈SD〉) to the standard deviation of the dataset under consideration (denoted 〈SDx〉). While this ratio will vary if sampled over drastically different periods, it is approximately constant for the selection of years considered here (not shown); hence, we compute it for the 1981–2017 time period and take it to be constant in what follows. The normalized form can be written as
This time series differs from its unadjusted version by two factors, and . At times we will express the percent rate of change of this time series using these two parameters ), so that the percent rate of the change of the unadjusted time series is obtained by setting both f1 and f1 to unity, viz. .
3.2 Year-over-year increases in time series length
We determined the impact on the percent rate of change due to year-over-year increases in the length of the time series. An initial rate of change was first calculated for adjusted time series anomalies in the 1981–2000 time window (20 years). Subsequent differences in the rate from the previous value were then calculated for each new year in the time series (difference between 1981–2001 and 1981–2000, difference between 1981–2002 and 1981–2001, and so on) through 1981–2017 – the consistent time series covered by all six datasets. All calculations used the 1981–2017 reference period (P0 in Table 2). This procedure yields the following 17 differences:
which are repeated for each of the six datasets to yield an ensemble of 102 differences.
3.3 Reference period
To compare the impact of the reference period on the rate of SCE change, three blocks of approximately 20 years were identified (Table 2). While shorter than the standard climatological “normal” of 30 years, these shorter periods facilitate the comparison of three different periods within the total available time series of 1981 to 2017. The metric was calculated as the absolute difference in the rates of change between reference period P3 and reference period P1 sampled from available anomaly time windows:
The absolute difference is used because the effect of the normalization is to change the magnitude of the existing trend. If the later reference period has a smaller (larger) climatology than the earlier period, the trend magnitude is increased (decreased). These 18 calculations are performed for each of the six datasets to yield an ensemble of 108 differences.
3.4 Dataset adjustments
The impact on the SCE rate of change from adjusting both the climatology and variability of each dataset was identified by comparing the adjusted and raw versions of each dataset. A metric was calculated as the difference in the rates of change using reference period P0 sampled from available anomaly time windows:
4.1 Impact of dataset adjustment procedure, time series length, and reference period
A key factor underpinning confidence in reported changes in Arctic snow cover is understanding the impact of various data processing and analysis decisions. To address this, we focus on the rate of change in Arctic snow extent (expressed as percent per decade) because this is a widely used metric in climate assessments. As described in Sect. 3, we performed a series of calculations to isolate the sensitivity in this rate to a number of factors:
-
year-over-year increases in the length of the time series as time passes, relevant to annually updated assessments such as the Arctic Report Card;
-
the choice of reference period (Table 2 provides a summary of the different reference periods using in the calculations) which evolves from decade to decade as new updated climate normals are determined;
-
the decision to adjust the climatology and standard deviation of each dataset (as described in Sect. 2).
The influence of the first factor we consider is unavoidable: assuming datasets are maintained, time series length will always increase year over year. The second and third considerations are analytical choices based on expert judgement. To help conceptualize our analysis, Fig. 4 provides an overview of the sensitivity of the change in Arctic SCE calculation (percent per decade) for May. The impacts of year-to-year increases in time series length, reference period differences, and changes due to dataset adjustments are noted and represent the first three factors outlined above.
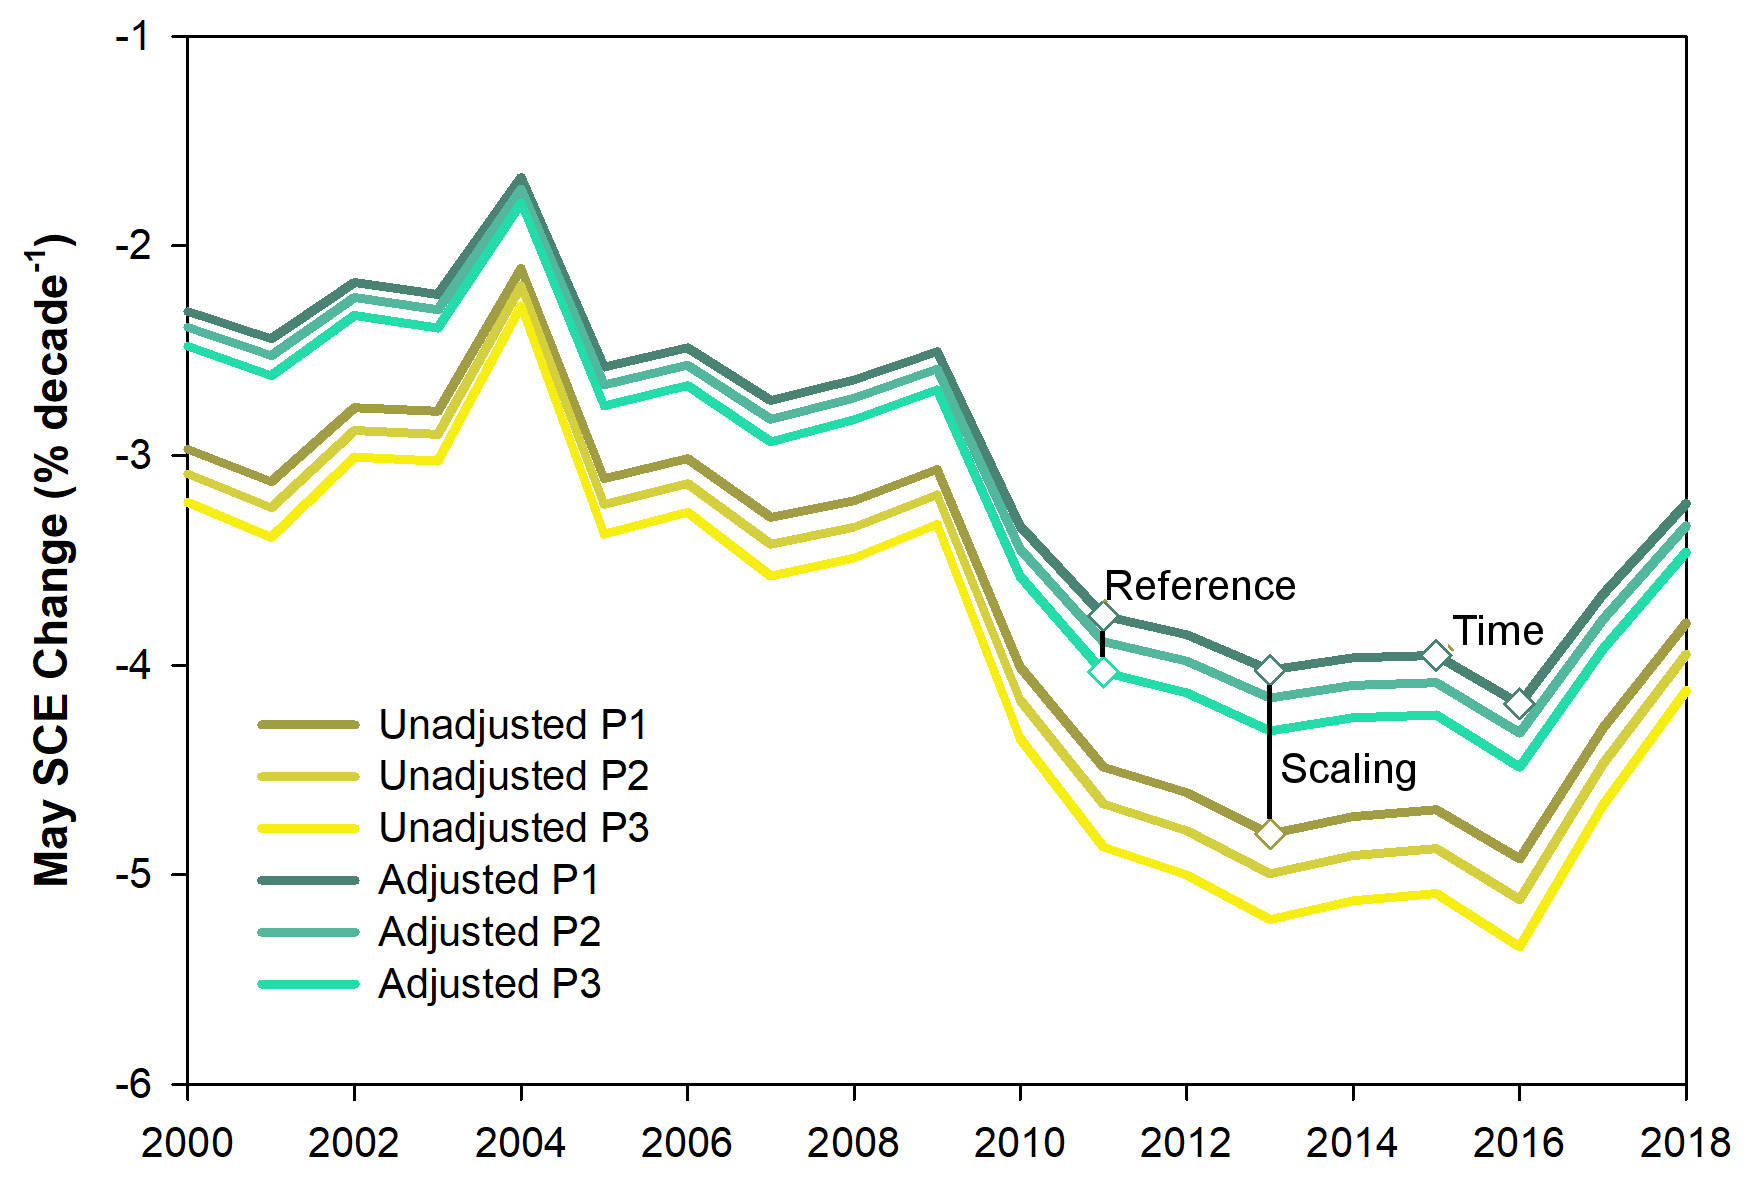
Figure 4Change in Arctic SCE (percent per decade) for May since 1981 relative to three reference periods (P1, P2, P3; see Table 2) and scaled versus unscaled datasets since 1981 through the year noted on the x axis. The impacts of year-to-year increases in time series length, reference period differences, and changes due to dataset adjustments are noted.
Descriptions of metrics that reflect each these factors are provided in Sect. 3.2–3.4. We focus on the months of April through June and September through November because Arctic land areas are always 100 % snow covered between December and April and essentially snow-free during July and August. Figure 5 illustrates that the impact of additional years in the time series is small, peaking at approximately −2 % in September and falling to within ±1 % for the remaining months. The net effect of additional years over the past decade is a slight weakening in the rate of change during the autumn season because SCE values reached a minimum in approximately 2015 and have not decreased further. Were current trend estimates for all months to remain stable going forward, the average value of this metric should tend to zero since it only reflects year-to-year variability. The second factor illustrated in Fig. 5, the choice of reference period, only has a noticeable effect in September and June. The most recent reference periods considered (1991–2010; 2001–2017; see Table 2) have less snow extent than the reference periods which include 1981–2000. When expressed as a percent change relative to these different baselines, the rates appear stronger. The magnitude of this effect is small but does reach 2 % per decade in June and September. Furthermore, the magnitude will grow if snow cover reductions continue and new 30-year normal periods are progressively used in future decades. Finally, the dataset adjustment process has only a small net effect during the fall but weakens SCE rates of change in the spring, reaching −5 % per decade in June.
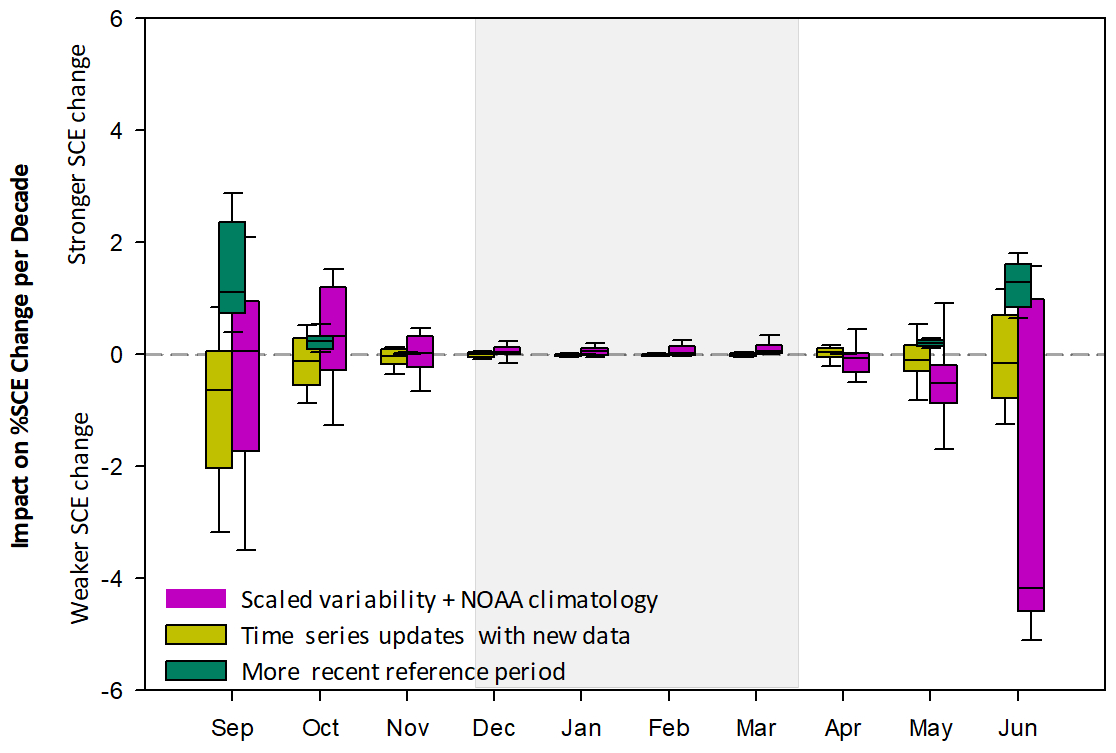
Figure 5Sensitivity of Arctic snow cover extent rate-of-change calculations (expressed as percent per decade) to changes in the available time series length, selection of reference period, and the adjustment process. Values above zero indicate a stronger SCE rate of change; values below zero indicate a weaker SCE rate of change.
Overall, the results in Fig. 5 suggest the previously published rates of change in Arctic snow cover are comparable regardless of analytical decisions such as the choice of reference period and any adjustments made to the data. June remains the month most sensitive to the inter-dataset scaling used to achieve product consistency in absolute SCE values. We produced similar plots to Fig. 5 for each individual dataset (not shown). The relatively narrow range of results when all six products are considered together reflects the generally consistent inter-dataset behaviour with the various metrics employed in this study, with the largest inter-product spread associated with normalizing the trends using the NOAA climatology in June and September.
4.2 Ensemble size
The impact of ensemble size was determined by calculating the rate of SCE change using a 1981–2017 time window with a 1981–2000 reference period for all datasets individually, all combinations of three datasets, and all six datasets averaged together. Results for the new product set are shown in Fig. 6. For all months, the rate of SCE change narrows with an increase in ensemble size. This reduction in spread with increased ensemble size is consistent with an increase in the skill of SWE estimates with an increase in ensemble size (evaluated using reference snow course measurements) identified by Mortimer et al. (2020).

4.3 Dataset version changes
Figures 1a, 2, and 3a showed that although the interannual variability is strongly correlated, raw snow extent time series are very different between products in absolute terms. Large absolute differences in snow extent also exist when subsequent versions from the same product are compared to each other (Fig. 7). We examined the 4 months during which Arctic snow extent is the most dynamic: May and June during the snowmelt season and October and November during initial snow accumulation. During spring, product version differences reach nearly 4 ×10⁶ km2. The Brown temperature index model is clearly sensitive to the change in forcing from ERA-Interim to ERA5 meteorology, with much greater spring snow extent in the ERA5 version. The change from GlobSnow v2.1 to Snow CCI v1 produces a large difference after 2010 in May, which requires further exploration. Product version differences are much smaller during the period of snow line advance, particularly by November when nearly all of the Arctic land surface is snow covered.
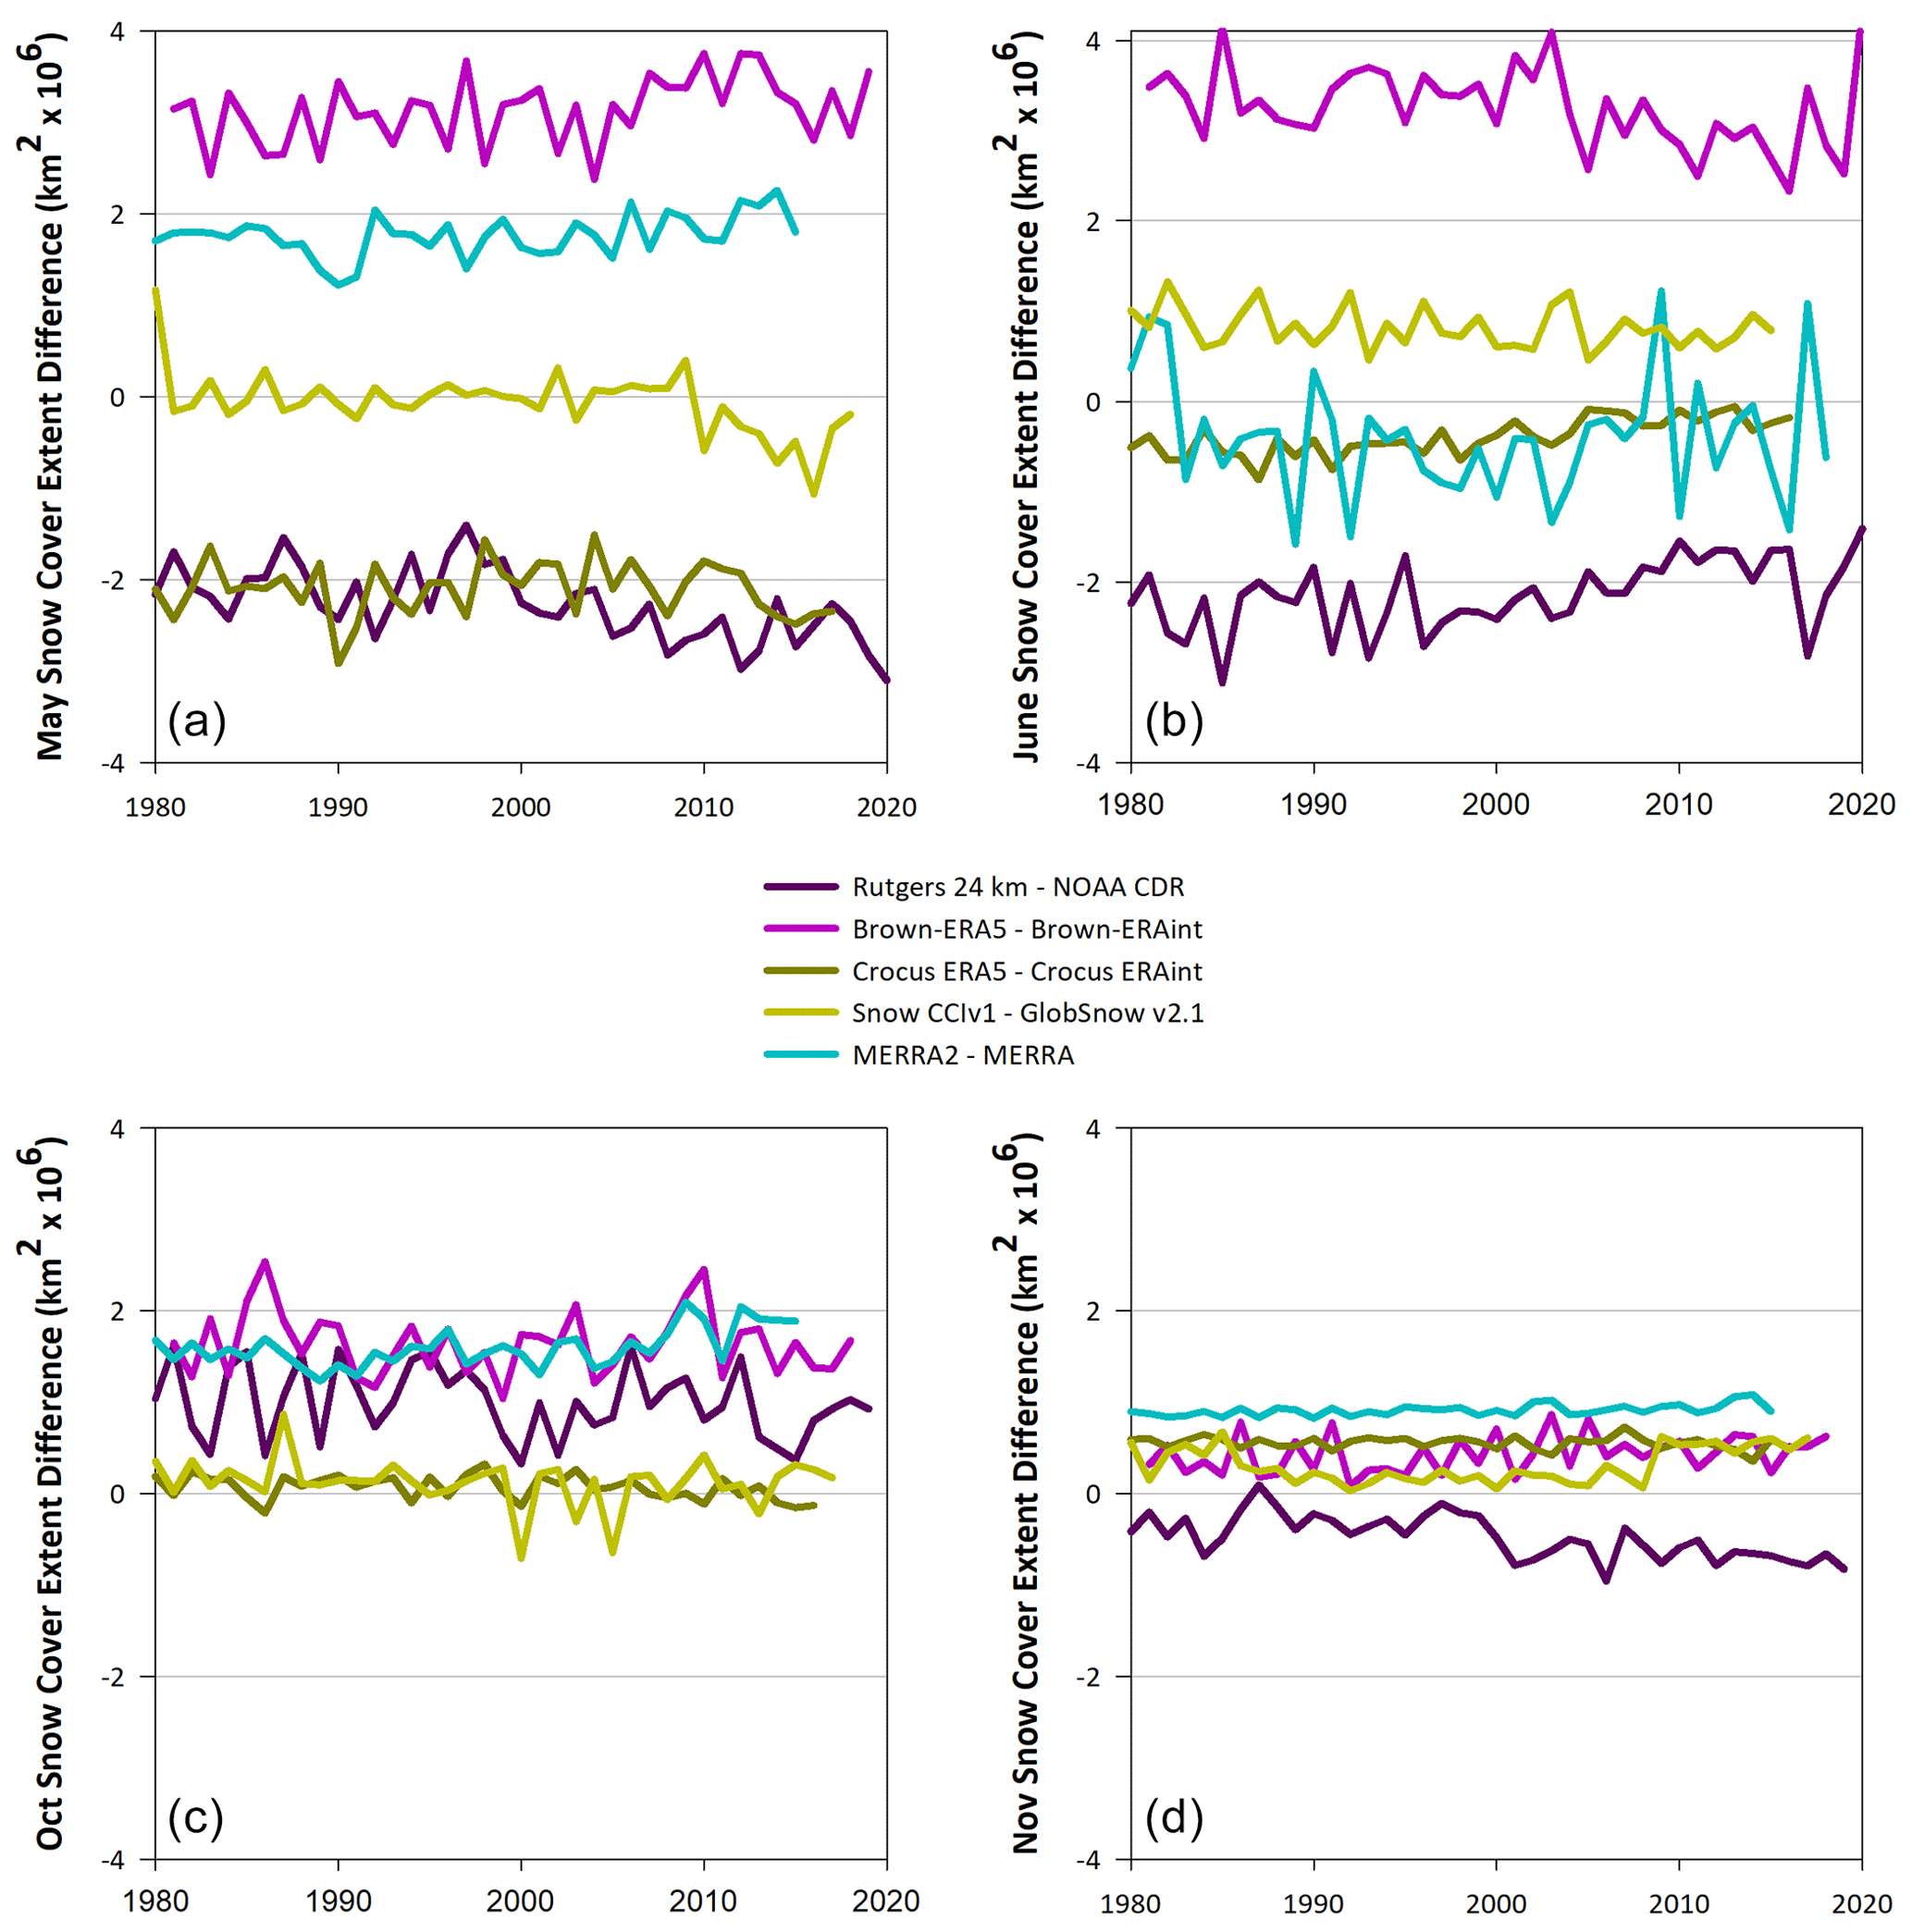
Figure 7Product version differences in snow extent (new version minus previous version) for (a) May, (b) June, (c) October, and (d) November.
Mean snow extent trends for the entire Northern Hemisphere and Arctic land areas for the two product groups summarized in Table 1 are shown in Fig. 8a (old product set) and Fig. 8b (new product set). There is very little difference in both hemispheric and Arctic SCE trends over the common 1981–2017 period covered by both product sets. Arctic snow extent trends are virtually zero over the December-through-April period when there is consistently complete snow cover over land areas north of 60∘ N. The negative SCE trends observed for the Northern Hemisphere during these months are by necessity driven by mid-latitude regions. Discounting the Arctic summer months when the absolute Arctic snow-covered area is very small (July, August, September), the proportional contribution of the Arctic to the Northern Hemisphere trend is greatest in May, June, and October. During these months, the Arctic contributes the majority of the trend signal, with some contributions from mid-latitude high-elevation areas (mountain areas; Tibetan Plateau).
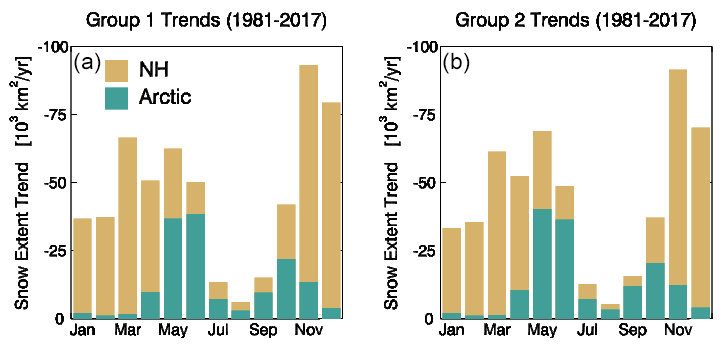
Figure 8Snow extent trends over 1981–2017 from multi-product groups outlined in Table 1: older product versions (a) and updated product versions (b).
We have quantified the impact of increasing time series length, the choice of reference period, the application of a statistical methodology to improve inter-dataset agreement, the product version changes, and the dataset ensemble size on Arctic SCE rates of change. In general, estimates of the rate of change in Arctic snow cover extent have remained consistent over the past 2 decades as time series length has increased and are broadly insensitive to the choice of reference period. New product versions include enhancements in spatial resolution, more advanced reanalysis meteorology to force snow models, and enhanced remote sensing retrieval algorithms. Overall, these improvements result in only small changes in the observed monthly rates of Arctic SCE change. The most impactful analysis decision involves the data adjustment: scaling of dataset variability and using the Rutgers 24 km product climatology as the baseline to determine rates of change. This results in a small impact in the estimated rate of change for October and May but reaches 5 % per decade in June. This result reinforces that spring trends in the Rutgers 24 km product and its NOAA-CDR predecessor are stronger compared to other products.
In the IPCC SROCC “Polar regions” chapter, sea ice trends were assigned “very high confidence”, while seasonal snow extent trends were assigned “high confidence”. We believe the analysis in this study now supports the use of stronger confidence language underpinning Arctic snow extent trends because we have documented an understanding of how analysis is affected by changes in time series, reference periods, and product versions. The evolution of estimates of Arctic spring snow cover extent rates of change from various studies over the past decade is summarized in Fig. 9. In the context of annual assessment updates through the Arctic Report Card, May and June Arctic SCE exhibits stable rates of change over the past decade.
-
The rate of May snow extent change has remained very consistent over the past decade at approximately −4 % per decade. Overall, we have tighter constraints on May snow cover loss compared to June. Inter-dataset agreement is stronger in May than June; inter-version differences are smaller in May than June; and sensitivity to changes in time series length, reference period, and normalizing to the NOAA climatology is smaller in May than June.
-
The calculated rates of June snow extent have weakened slightly over the past decade, compared to the estimate from just the NOAA CDR from Derksen and Brown (2012).
-
Improvements in analysis in recent years to include multi-product ensembles allowed improved quantification of trend uncertainty, as illustrated by the error bars in Fig. 9.
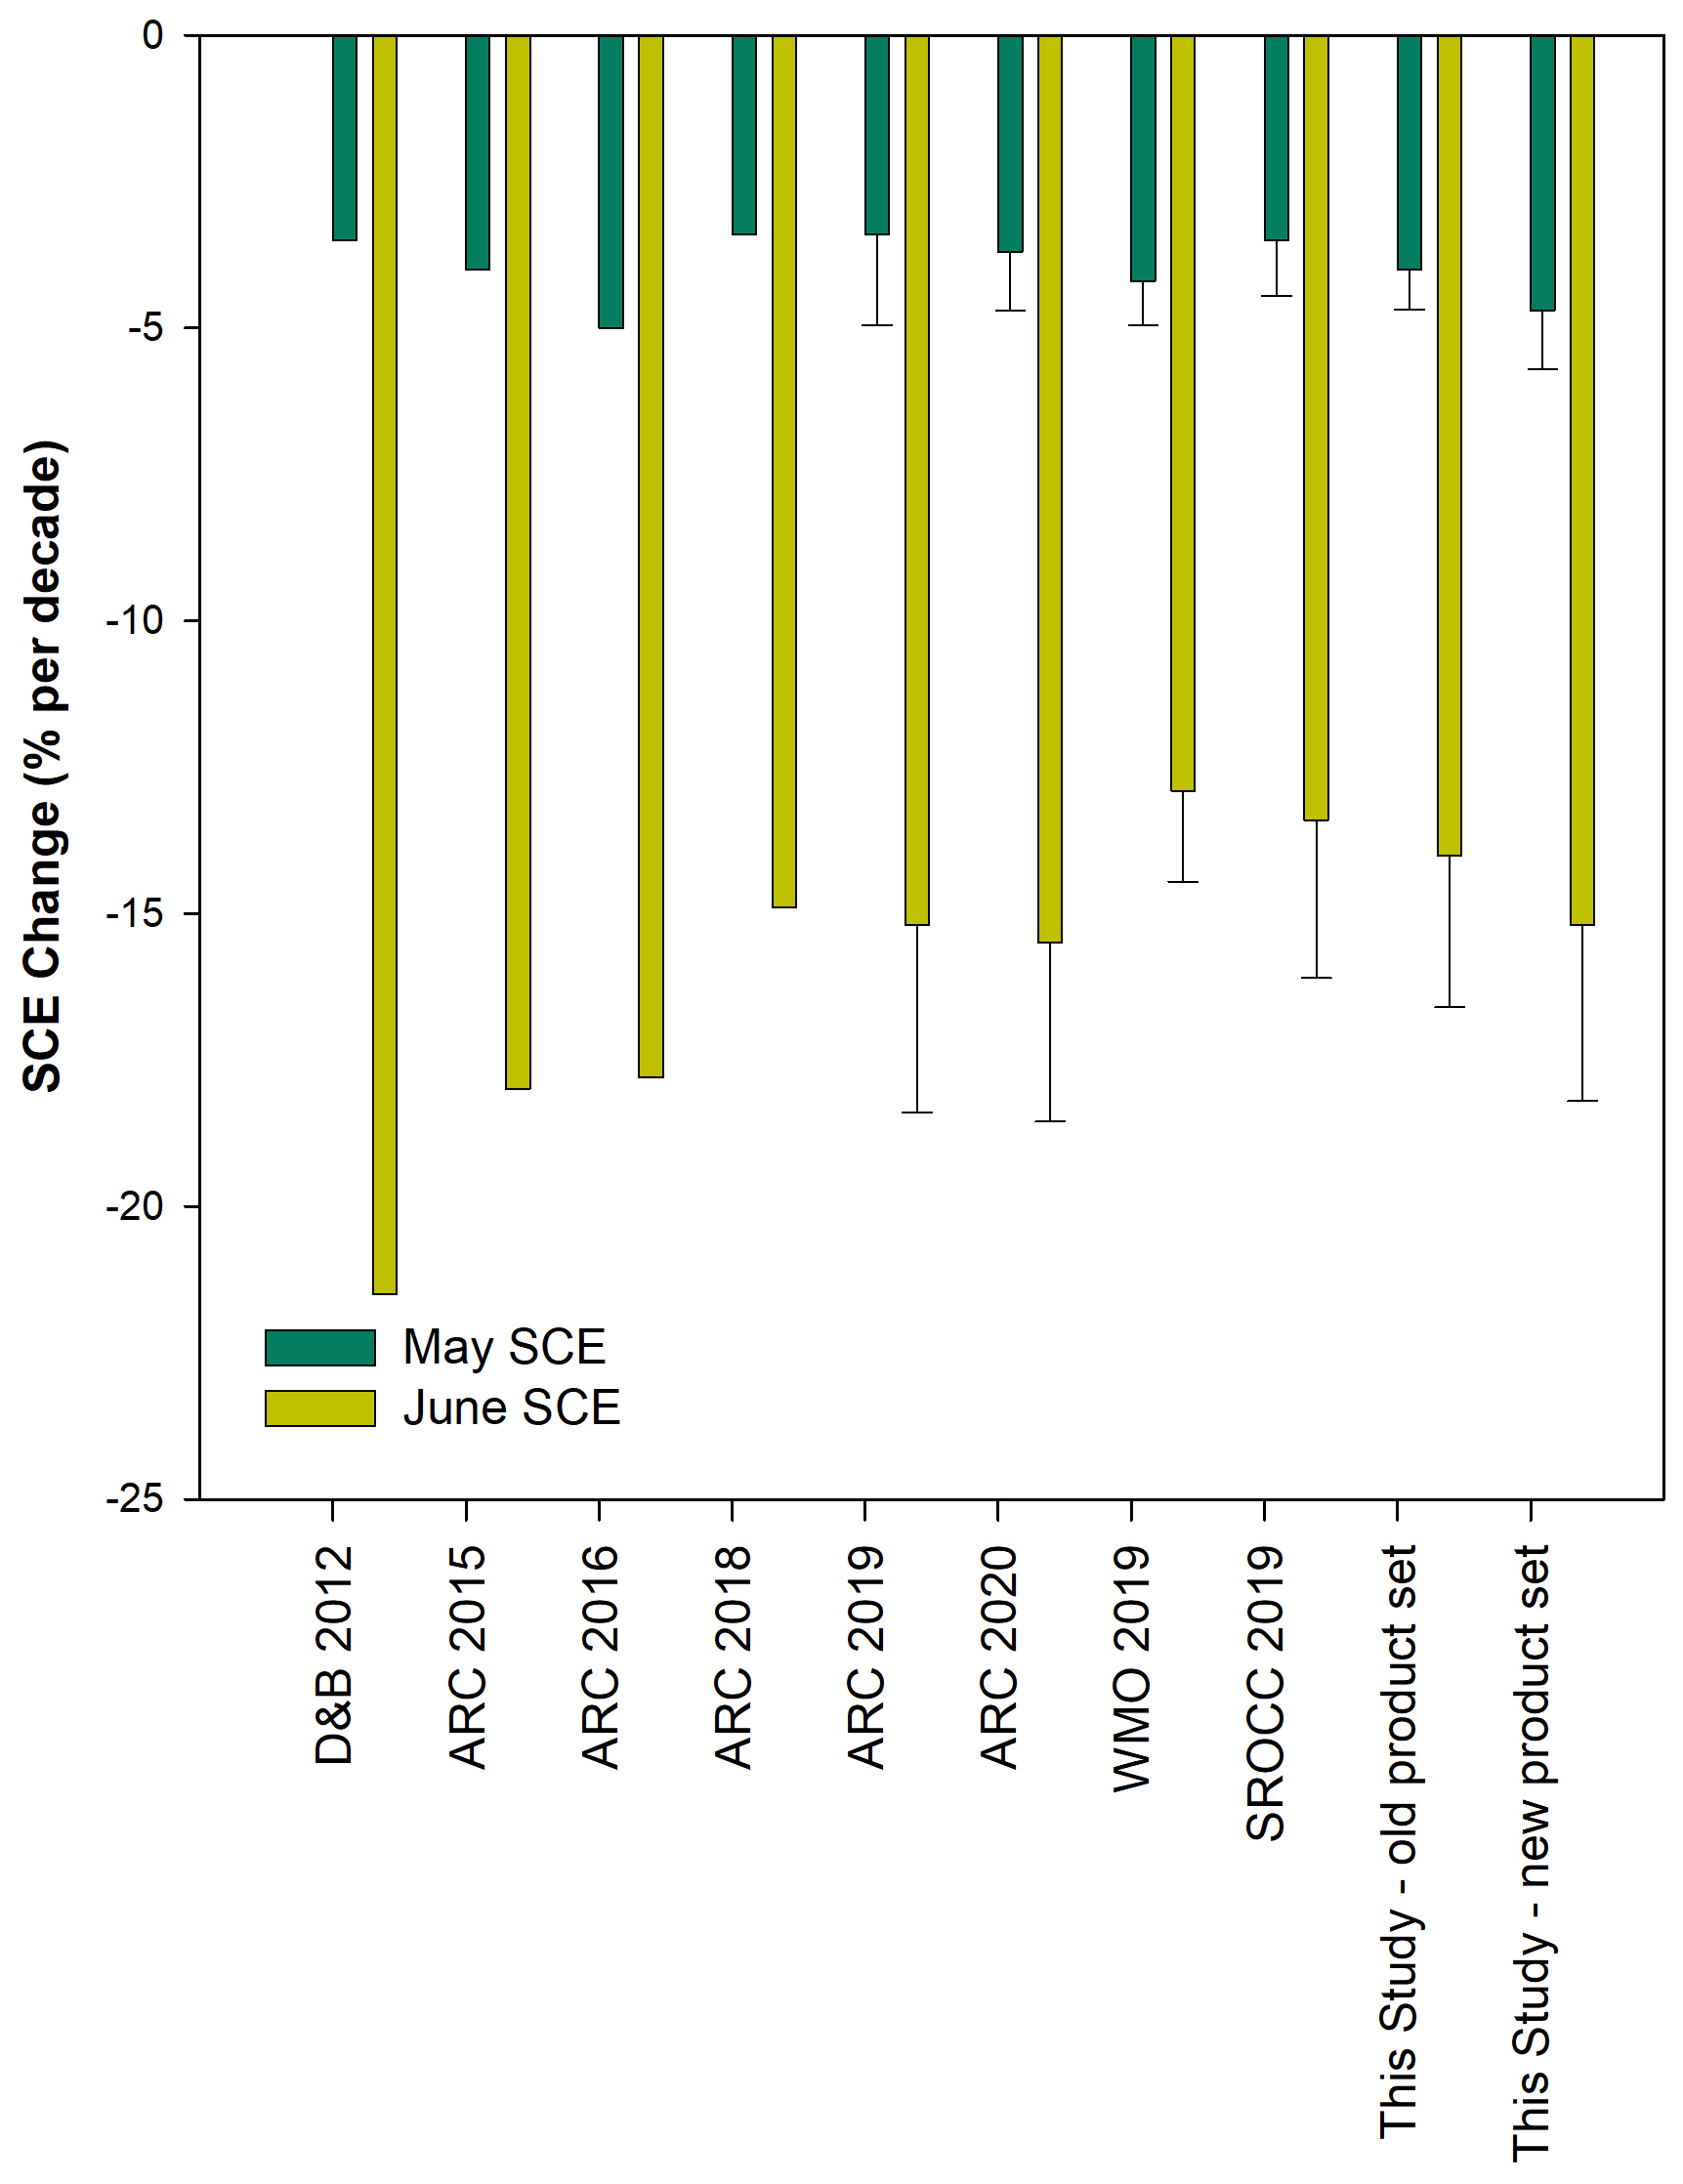
Figure 9May and June Arctic snow cover extent rates of change from various assessments over the past decade.
We make the following recommendations based on the analysis presented in this study.
-
We focused on better understanding the sensitivity of the rate of snow extent change expressed as percent per decade because this is a widely used metric. It is important to point out, however, that percent change is less useful when absolute snow extent values become very small. While June snow cover remains the month with the greatest rate of snow extent loss, we will eventually need to drop June from assessments due to a lack of snow cover, in the same way September is presently ignored.
-
The analysis of data averaged to calendar months is common (e.g. the widely cited change in September sea ice extent), but of course this creates arbitrary and non-physical temporal boundaries to the data. Many of the snow products assessed in this study are all available at a daily time step. The most dynamic period of Arctic snow extent change spans late May into early June (snow line retreat) and late October into early November (snow line advance). Because these snow extent changes are rapid, temporal precision is lost through the use of monthly averaged data. For example, when melt occurs during the last week of May and first week of June, the monthly averages will still be largely influenced by weeks with stable snow cover. At the very least, the analysis should shift to weekly averaged data, which would better capture year-to-year variability in the timing of snow extent changes.
-
It is very difficult to work with raw time series from a multi-product ensemble – not just because of inter-product differences, but because of differences between versions of the same product. The adjustment procedure employed in this study (and previous studies such as Mudryk et al., 2020) is an effective way to standardize time series and quantify uncertainty. We acknowledge that this procedure introduced notable impacts in June, highlighting that June Arctic snow extent trends are more uncertain than those in May.
-
This study focused exclusively on snow extent because it is the variable most commonly used in climate assessments. Snow extent is conceptually straightforward, with variability and trends directly forced by surface temperature (Mudryk et al., 2020). Snow mass is arguably more important given processes related to insulation of underlying soil and snowmelt release. Seasonal maximum snow water equivalent (SWEmax) is a commonly cited metric (assessed in detail for the Arctic in Brown et al., 2017), but SWE/snow mass is a conceptually trickier variable for snow non-experts to digest in an assessment context. It integrates both temperature and precipitation through the entire snow season, so the attribution of the drivers of variability and trends is more complicated than snow extent. The timing of when SWEmax occurs is another necessary consideration. Despite these challenges, additional effort should be placed into the provision of robust SWEmax trends for climate assessment. The underlying assumption in the snow community has always been that snow mass products have a higher uncertainty than snow extent. While the spread in absolute snow mass between products is high (Mudryk et al., 2015; Mortimer et al., 2020), especially in mountain regions (Wrzesien et al., 2018), the large spread between snow extent products evident in Figs. 1, 2, and 3 shows that this conventional wisdom may be misplaced.
All processed datasets analyzed in this study will be accessible through the Environment and Climate Change Canada open-data catalogue. The original snow products are available as follows. MERRA (https://doi.org/10.5067/YL8Z7MICQZF9; GMAO, 2008) and MERRA-2 (https://doi.org/10.5067/RKPHT8KC1Y1T; GMAO, 2015) are available from Goddard Earth Sciences Data and Information Service. GlobSnow data are available at https://www.globsnow.info/; Snow CCI data (https://doi.org/10.5285/fa20aaa2060e40cabf5fedce7a9716d0; Luojus et al., 2020) are available from the European Space Agency Climate Change Initiative Open Data Portal. The NOAA Climate Data Record (https://doi.org/10.7289/V5N014G9; Robinson et al., 2012) and Rutgers Northern Hemisphere 24 km Weekly Snow Cover Extent (https://doi.org/10.7265/zzbm-2w05; Robinson and Estilow, 2021) are accessible via the Rutgers University Global Snow Laboratory. The Japan Aerospace Exploration Agency (JASMES) snow extent data are available at https://www.eorc.jaxa.jp/cgi-bin/jasmes/monthly/jasmes_list_v3.cgi?prod=CSF&type=map&area=GL&year=2023&lang=en. The Brown (produced at Environment and Climate Change Canada) and Crocus (produced at Météo-France) datasets are available from the authors upon request.
CD conducted the analysis and drafted the manuscript; LM processed data, contributed to analysis, and revised the manuscript.
At least one of the (co-)authors is a member of the editorial board of The Cryosphere. The peer-review process was guided by an independent editor, and the authors also have no other competing interests to declare.
Publisher’s note: Copernicus Publications remains neutral with regard to jurisdictional claims in published maps and institutional affiliations.
We thank the snow dataset providers for their efforts in product development, production, and distribution.
This paper was edited by Masashi Niwano and reviewed by two anonymous referees.
AMAP: Arctic Climate Change Update 2021: Key Trends and Impacts, Summary for Policy-makers, Arctic Monitoring and Assessment Programme (AMAP), Tromsø, Norway, 16 pp., 2021.
Biskaborn, B., Smith, S., Noetzli, J., Matthes, H., Vieira, G., Streletskiy, D., Schoeneich, P., Romanovsky, V., Lewkowicz, A., Abramov, A., Allard, M., Boike, J. Cable, W., Christiansen, H., Delaloye, R., Diekmann, B., Drozdov, D., Etzelmüller, B., Grosse, G., Guglielmin, M., Ingeman-Nielsen, T., Isaksen, K., Ishikawa, M., Johansson, M., Johannsson, H., Joo, A., Kaverin, D., Kholodov, A., Konstantinov, P., Kröger, T., Lambiel, C., Lanckman, J-P., Luo, D., Malkova, G., Meiklejohn, I., Moskalenko, N., Oliva, M., Phillips, M., Ramos, M., Britta, A., Sannel, K., Sergeev, D., Seybold, C., Skryabin, P., Vasiliev, A., Wu, Q., Yoshikawa, K., Zheleznyak M., Lantuit, H. Biskaborn, B., Smith, S., Noetzli, J., Matthes, H., Vieira, G., Streletskiy, D., Schoeneich, P., Romanovsky, V., Lewkowicz, A., Abramov, A., Allard, M., Boike, J. Cable, W., Christiansen, H., Delaloye, R., Diekmann, B., Drozdov, D., Etzelmüller, B., Grosse, G., Guglielmin, M., Ingeman-Nielsen, T., Isaksen, K., Ishikawa, M., Johansson, M., Johannsson, H., Joo, A., Kaverin, D., Kholodov, A., Konstantinov, P., Kröger, T., Lambiel, C., Lanckman, J.-P., Luo, D., Malkova, G., Meiklejohn, I., Moskalenko, N., Oliva, M., Phillips, M., Ramos, M., Britta, A., Sannel, K., Sergeev, D., Seybold, C., Skryabin, P., Vasiliev, A., Wu, Q., Yoshikawa, K., Zheleznyak, M., and Lantuit, H.: Permafrost is warming at a global scale, Nat. Comm., 10, 264, https://doi.org/10.1038/s41467-018-08240-4, 2019.
Bokhorst, S., Pedersen, S. H., Brucker, L., Anisimov, O., Bjerke, J. Brown, R., Ehrich, D., Essery, R., Heilig, A., Ingvander, S., Johansson, C., Johansson, M., Jónsdóttir, I. S., Inga, N., Luojus, K., Macelloni, G., Mariash, H., McLennan, D., Rosqvist, G. N., Sato, A., Savela, H., Schneebeli, M., Sokolov, A., Sokratov, S., Terzago, S., Vikhamar-Schuler, D., Williamson, S., Qiu, Y., and Callaghan, T.: Changing Arctic snow cover: A review of recent developments and assessment of future needs for observations, modelling, and impacts, Ambio, 45, 516–537, https://doi.org/10.1007/s13280-016-0770-0, 2016.
Brown, R.: Gridded North American monthly snow depth and snow water equivalent for GCM evaluation, Atmos.-Ocean, 41, 1–14, https://doi.org/10.3137/ao.410101, 2003.
Brown, R. and Derksen, C.: Is Eurasian October snow cover extent increasing?, Env. Res. Lett., 8, 024006, https://doi.org/10.1088/1748-9326/8/2/024006, 2013.
Brown, R., Derksen, C., and Wang, L.: A multi-dataset analysis of variability and change in Arctic spring snow cover extent, 1967–2008, J. Geophys. Res., 115, D16111, https://doi.org/10.1029/2010JD013975, 2010.
Brown, R., Vikhamar Schuler, D., Bulygina, O., Derksen, C., Luojus, K., Mudryk, L., Wang, L., and Yang, D.: Arctic terrestrial snow cover, in Snow, Water, Ice and Permafrost in the Arctic (SWIPA), 25–64, Arctic Monitoring and Assessment Programme (AMAP), Oslo, Norway, 2017.
Brown, R., Smith, C., Derksen, C., and Mudryk, L.: Canadian in situ snow cover trends 1955–2017 including an assessment of the impact of automation, Atmos.-Ocean, 59, 77–92, https://doi.org/10.1080/07055900.2021.1911781, 2021.
Brown, R. D. and Robinson, D. A.: Northern Hemisphere spring snow cover variability and change over 1922–2010 including an assessment of uncertainty, The Cryosphere, 5, 219–229, https://doi.org/10.5194/tc-5-219-2011, 2011.
Brun, E. Vionnet, V., Boone, A., Decharme, B., Peings, Y., Vallette, R., Karbou, F., and Morin, S.: Simulation of northern Eurasian local snow depth, mass, and density using a detailed snowpack model and meteorological reanalyses, J. Hydrometeorol., 14, 203–219, https://doi.org/10.1175/JHM-D-12-012.1, 2013.
Cohen, J., Furtado, J., Barlow, M., Alexeev, V., and Cherry, J.: Arctic warming, increasing snow cover and widespread boreal winter cooling, Env. Res. Lett., 7, 014007, https://doi.org/10.1088/1748-9326/7/1/014007, 2012.
Derksen, C., and Brown, R.: Spring snow cover extent reductions in the 2008–2012 period exceeding climate model projections, Geophys. Res. Lett., 39, L19504, https://doi.org/10.1029/2012GL053387, 2012.
Déry, S. J., Stadnyk, T. A., MacDonald, M. K., and Gauli-Sharma, B.: Recent trends and variability in river discharge across northern Canada, Hydrol. Earth Syst. Sci., 20, 4801–4818, https://doi.org/10.5194/hess-20-4801-2016, 2016.
Estilow, T. W., Young, A. H., and Robinson, D. A.: A long-term Northern Hemisphere snow cover extent data record for climate studies and monitoring, Earth Syst. Sci. Data, 7, 137–142, https://doi.org/10.5194/essd-7-137-2015, 2015.
Flanner, M. Shell, K., Barlage, M., Perovich, D., and Tschudi, M.: Radiative forcing and albedo feedback from the Northern Hemisphere cryosphere between 1979 and 2008, Nature Geosci., 4, 151–155, https://doi.org/10.1038/ngeo1062, 2011.
Frei, A. and Lee, S: A comparison of optical-band based snow extent products during spring over North America, Remote Sens. Environ., 114, 1940–1948, https://doi.org/10.1016/j.rse.2010.03.015, 2010.
Gelaro, R., McCarty, W., Suárez, M. J., Todling, R., Molod, A., Takacs, L., Randles, C. A., Darmenov, A., Bosilovich, M. G., Reichle, R., Wargan, K., Coy, L., Cullather, R., Draper, C., Akella, S., Buchard, V., Conaty, A., da Silva, A. M., Gu, W., Kim, G., Koster, R., Lucchesi, R., Merkova, D., Nielsen, J. E., Partyka, G., Pawson, S., Putman, W., Rienecker, M., Schubert, S. D., Sienkiewicz, M., and Zhao, B.: The Modern-Era Retrospective Analysis for Research and Applications, Version 2 (MERRA-2), J. Clim., 30, 5419–5454, https://doi.org/10.1175/JCLI-D-16-0758.1, 2017.
GMAO (Global Modeling and Assimilation Office): tavg1_2d_lnd_Nx: MERRA 2D IAU Diagnostic, Land Only States and Diagnostics, Time Average 1-hourly V5.2.0, Greenbelt, MD, USA, Goddard Earth Sciences Data and Information Services Center (GES DISC) [data set], https://doi.org/10.5067/YL8Z7MICQZF9, 2008.
GMAO (Global Modeling and Assimilation Office): MERRA-2 tavg1_2d_lnd_Nx: 2d, 1-Hourly, Time-Averaged, Single-Level, Assimilation, Land Surface Diagnostics V5.12.4, Greenbelt, MD, USA, Goddard Earth Sciences Data and Information Services Center (GESDISC) [data set], https://doi.org/10.5067/RKPHT8KC1Y1T, 2015.
Gulev, S. K., Thorne, P. W., Ahn, J., Dentener, F. J., Domingues, C. M., Gerland, S., Gong, D., Kaufman, D. S., Nnamchi, H. C., Quaas, J., Rivera, J. A., Sathyendranath, S., Smith, S. L., Trewin, B., von Schuckmann, K., and Vose, R. S.: Changing State of the Climate System, in: Climate Change 2021: The Physical Science Basis. Contribution of Working Group I to the Sixth Assessment Report of the Intergovernmental Panel on Climate Change, edited by: Masson-Delmotte, V., Zhai, P., Pirani, A., Connors, S. L., Péan, C., Berger, S., Caud, N., Chen, Y., Goldfarb, L., Gomis, M. I., Huang, M., Leitzell, K., Lonnoy, E., Matthews, J. B. R., Maycock, T. K., Waterfield, T., Yelekçi, O., Yu, R., and Zhou, B., Cambridge University Press, Cambridge, United Kingdom and New York, NY, USA, pp. 287–422, https://www.ipcc.ch/report/ar6/wg1/chapter/chapter-2/ (last access: 7 February 2023), 2021.
Hori, M. Sugiura, K., Kobayashi, K., Aoki, T., Tanikawa, T., Kuchiki, K., Niwano, M., and Enomoto, H.: A 38-year (1978–2015) Northern Hemisphere daily snow cover extent product derived using consistent objective criteria from satellite-borne optical sensors, Remote Sens. Environ., 191, 402–418, https://doi.org/10.1016/j.rse.2017.01.023, 2017.
IPCC: Summary for Policymakers, in: IPCC Special Report on the Ocean and Cryosphere in a Changing Climate, edited by: Pörtner, H.-O., Roberts, D. C., Masson-Delmotte, V., Zhai, P., Tignor, M., Poloczanska, E., Mintenbeck, K., Alegría, A., Nicolai, M., Okem, A., Petzold, J., Rama, B., and Weyer, N. M., Cambridge University Press, Cambridge, UK and New York, NY, USA, pp. 3–35, https://doi.org/10.1017/9781009157964.001, 2019.
Krinner, G., Derksen, C., Essery, R., Flanner, M., Hagemann, S., Clark, M., Hall, A., Rott, H., Brutel-Vuilmet, C., Kim, H., Ménard, C. B., Mudryk, L., Thackeray, C., Wang, L., Arduini, G., Balsamo, G., Bartlett, P., Boike, J., Boone, A., Chéruy, F., Colin, J., Cuntz, M., Dai, Y., Decharme, B., Derry, J., Ducharne, A., Dutra, E., Fang, X., Fierz, C., Ghattas, J., Gusev, Y., Haverd, V., Kontu, A., Lafaysse, M., Law, R., Lawrence, D., Li, W., Marke, T., Marks, D., Ménégoz, M., Nasonova, O., Nitta, T., Niwano, M., Pomeroy, J., Raleigh, M. S., Schaedler, G., Semenov, V., Smirnova, T. G., Stacke, T., Strasser, U., Svenson, S., Turkov, D., Wang, T., Wever, N., Yuan, H., Zhou, W., and Zhu, D.: ESM-SnowMIP: assessing snow models and quantifying snow-related climate feedbacks, Geosci. Model Dev., 11, 5027–5049, https://doi.org/10.5194/gmd-11-5027-2018, 2018.
Luojus, K., Luojus, K., Pulliainen, J., Takala, M., Lemmetyinen, J., Mortimer, C., Derksen, C., Mudryk, L., Moisander, M., Hiltunen, M., Smolander, T., Ikonen, J., Cohen, J., Salminen, M., Norberg, J., Veijola, K., and Venäläinen, P.: GlobSnow v3.0 Northern Hemisphere snow water equivalent dataset, Sci. Data, 8, 163, https://doi.org/10.1038/s41597-021-00939-2, 2021.
Luojus, K., Moisander, M., Pulliainen, J., Takala, M., Lemmetyinen, J., Derksen, C., Mortimer, C., Schwaizer, G., and Nagler, T.: ESA Snow Climate Change Initiative (Snow_cci): Snow Water Equivalent (SWE) level 3C daily global climate research data package (CRDP) (1979–2018), version 1.0, Centre for Environmental Data Analysis [data set], https://doi.org/10.5285/fa20aaa2060e40cabf5fedce7a9716d0, 2020.
Mastrandrea, M., Mach, K., and Plattner, G.: The IPCC AR5 guidance note on consistent treatment of uncertainties: a common approach across the working groups, Clim. Change, 108, 675–691, 2011.
Menard, C., Essery, R., Krinner, G., Arduini, G., Bartlett, P., Boone, A., Brutel-Vuilmet, C., Burke, E., Cuntz, M., Dai, Y., Decharme, B., Dutra, E., Fang, X., Fierz, C., Gusev, Y., Hagemann, S., Haverd, V., Kim, H., Lafaysse, M., Marke, T., Nasonova, O., Nitta, T., Niwano, M., Pomeroy, J., Schädler, G., Semenov, V., Smirnova, T., Strasser, U., Swenson, S., Turkov, D., Wever, N., and Yuan, H.: Scientific and Human Errors in a Snow Model Intercomparison, Bull. Am. Met. Soc., 102, E61–E79, https://doi.org/10.1175/BAMS-D-19-0329.1, 2021.
Meredith, M., Sommerkorn, M., Cassotta, S., Derksen, C., Ekaykin, A., Hollowed, A., Kofinas, G., Mackintosh, A., Melbourne-Thomas, J., Muelbert, M., Ottersen, G., Pritchard, H., and Schuur, E.: Polar Regions, in: IPCC Special Report on the Ocean and Cryosphere in a Changing Climate, edited by: Pörtner, H.-O., Roberts, D. C., Masson-Delmotte, V., Zhai, P., Tignor, M., Poloczanska, E., Mintenbeck, K., Alegría, A., Nicolai, M., Okem, A., Petzold, J., Rama, B., and Weyer, N. M., Cambridge University Press, Cambridge, UK and New York, NY, USA, pp. 203–320, https://doi.org/10.1017/9781009157964.005, 2019.
Mortimer, C., Mudryk, L., Derksen, C., Luojus, K., Brown, R., Kelly, R., and Tedesco, M.: Evaluation of long-term Northern Hemisphere snow water equivalent products, The Cryosphere, 14, 1579–1594, https://doi.org/10.5194/tc-14-1579-2020, 2020.
Mudryk, L., Derksen, C., Kushner, P., and Brown, R.: Characterization of Northern Hemisphere snow water equivalent datasets, 1981–2010, J. Clim., 28, 8037–8051, https://doi.org/10.1175/JCLI-D-15-0229.1, 2015.
Mudryk, L. Kushner, P., Derksen, C., and Thackeray, C.: Snow cover response to temperature in observational and climate model ensembles, Geophys. Res. Lett., 44, 919–926 https://doi.org/10.1002/2016GL071789, 2017.
Mudryk, L., Santolaria-Otín, M., Krinner, G., Ménégoz, M., Derksen, C., Brutel-Vuilmet, C., Brady, M., and Essery, R.: Historical Northern Hemisphere snow cover trends and projected changes in the CMIP6 multi-model ensemble, The Cryosphere, 14, 2495–2514, https://doi.org/10.5194/tc-14-2495-2020, 2020.
Mudryk, L., Elias Chereque, A., Brown, R., Derksen, C., Luojus, K., and Decharme, B.: “Terrestrial Snow” in NOAA Arctic Report Card, https://arctic.noaa.gov/Report-Card/Report-Card-2021 (last access: 1 March 2023), 2021.
Rienecker, M., Rienecker, M. M., Suarez, M. J., Gelaro, R., Todling, R., Bacmeister, J., Liu, E., Bosilovich, M. G., Schubert, S. D., Takacs, L., Kim, G., Bloom, S., Chen, J., Collins, D., Conaty, A., da Silva, A., Gu, W., Joiner, J., Koster, R. D., Lucchesi, R., Molod, A., Owens, T., Pawson, S., Pegion, P., Redder, C. R., Reichle, R., Robertson, F. R., Ruddick, A. G., Sienkiewicz, M., and Woollen, J.: MERRA: NASA's Modern-Era Retrospective Analysis for Research and Applications, J. Clim., 24, 3624–3648, https://doi.org/10.1175/JCLI-D-11-00015.1, 2011.
Robinson, D. A. and Estilow, T. W.: Rutgers Northern Hemisphere 24 km Weekly Snow Cover Extent, September 1980 Onward, Version 1, Boulder, Colorado, USA, NSIDC: National Snow and Ice Data Center [data set], https://doi.org/10.7265/zzbm-2w05, 2021.
Robinson, D. A., Estilow, T. W., and NOAA CDR Program: NOAA Climate Data Record (CDR) of Northern Hemisphere (NH) Snow Cover Extent (SCE), Version 1. [r01], NOAA National Centers for Environmental Information [data set], https://doi.org/10.7289/V5N014G9 (last access: 13 January 2020), 2012.
Stroeve, J. and Notz, D.: Changing state of Arctic sea ice across all seasons, Env. Res. Lett., 13, 103001, https://doi.org/10.1088/1748-9326/aade56, 2018.
Stroeve, J., Markus, T., Boisvert, L., Miller, J., and Barrett, A.: Changes in Arctic melt season and implications for sea ice loss, Geophys. Res. Lett., 41, 1216–1225, https://doi.org/10.1002/2013GL058951, 2014.
Takala, M., Luojus, K., Pulliainen, J., Derksen, C., Lemmetyinen, J., Kärnä J.-P., and Koskinen, J.: Estimating northern hemisphere snow water equivalent for climate research through assimilation of space-borne radiometer data and ground-based measurements, Remote Sens. Environ., 115, 3517–3529, https://doi.org/10.1016/j.rse.2011.08.014, 2011.
Turetsky, M., Abbott, B., Jones, M., Walter Anthony, K., Olefeldt, D., Schuur, E. A. G., Grosse, G., Kuhry, P., Hugelius, G., Koven, C., Lawrence, D. Gibson, C., Britta, A., Sannel, K., and McGuire, D.: Carbon release through abrupt permafrost thaw, Nat. Geosci., 13, 138–143, https://doi.org/10.1038/s41561-019-0526-0, 2020.
Vaughan, D. G., Comiso, J. C., Allison, I., Carrasco, J., Kaser, G., Kwok, R., Mote, P., Murray, T., Paul, F., Ren, J., Rignot, E., Solomina, O., Steffen, K., and Zhang, T.: Observations: Cryosphere, in: Climate Change 2013: The Physical Science Basis. Contribution of Working Group I to the Fifth Assessment Report of the Intergovernmental Panel on Climate Change, edited by: Stocker, T. F., Qin, D., Plattner, G.-K., Tignor, M., Allen, S. K., Boschung, J., Nauels, A., Xia, Y., Bex, V., and Midgley, P. M., Cambridge University Press, Cambridge, United Kingdom and New York, NY, USA, 2013.
Walvoord, M. A. and Kurylyk, B. L.: Hydrologic impacts of thawing permafrost – a review, Vadose Zone, 15, 6, https://doi.org/10.2136/vzj2016.01.0010, 2016.
Wrzesien, M. L. Durand, M. T., Pavelsky, T. M., Kapnick, S. B., Zhang, Y., Guo, J., and Shum, C. K.: A new estimate of North American mountain snow accumulation from regional climate model simulations, Geophys. Res. Lett., 45, 1423–1432, https://doi.org/10.1002/2017GL076664, 2018.