the Creative Commons Attribution 4.0 License.
the Creative Commons Attribution 4.0 License.
 | 13 Mar 2023
The temperature-dependent shear strength of ice-filled joints in rock mass considering the effect of joint roughness, opening and shear rates
Haowei Cai
Zekun Xin
Gang Liu
Global warming causes many rockfall activities in alpine mountains, especially when ice-filled joints in the rock mass become thawed. The warming and thawing of frozen soils and intact rocks have been widely studied in the past several decades; however, the variation of shear strengths of ice-filled joints is not fully understood. In this study, a series of compression–shear experiments were conducted to investigate the shear strength of ice-filled rock joints by considering the effects of joint roughness, temperature, opening, shear rates and normal stress. The joint roughness can improve the shear strength of ice-filled joints. However, the contribution of joint roughness is controlled by some noticeable bulges instead of the joint roughness coefficient (JRC) index. The peak shear strength of the ice-filled joint linearly increases with the increasing aggregation of rupture ice area before these noticeable bulges. As the joint opening increases, the effect of joint roughness decreases, and the shear strength of ice-filled joints tends to be equal to the shear strength of pure ice. In addition, the shear strength quickly reduces with increasing temperature from −15 to −0.5 ∘C. The shear failure mode changes from shear cracking of joint ice to the shear debonding of the ice–rock interface above −1 ∘C. Increasing shear rate decreases the shear strength of ice-filled joints because the joint ice displays the brittle failure phenomenon at a high shear rate. The peak shear strength of the ice-filled joint linearly increases with the increase in normal stress. Moreover, it is also proved that the Mohr–Coulomb criterion can be used to characterize the shear strength of ice-filled joints under different normal stresses. This research can provide a better understanding of the warming degradation mechanism of ice-filled joints by considering the abovementioned important influencing factors.
- Article
(11749 KB) - Full-text XML
- BibTeX
- EndNote


With the increase in global temperature and human activities in permafrost areas, many alpine rock masses have become more unstable (Gruber and Haeberli, 2007; Allen and Huggel, 2013; Hartmeyer et al., 2020; Legay et al., 2021; Hilger et al., 2021). A large number of rockfalls in permafrost alpine bedrock slopes have indicated the exposure of broken ice after shear failure, which could cause serious natural geological disasters (Krautblatter et al., 2021; Walter et al., 2019). For example, the rockfall disaster that happened in Chamoli, Indian Himalaya, in 2021 took more than 200 lives and destroyed two hydropower facilities (Shugar et al., 2021). According to investigation results, this rockfall disaster was caused by the warming and thawing of ice. It is evidenced that a huge frost heaving pressure is produced to drive the propagation of voids and joints and thus cause the instability of joint rock masses during the freezing process (Huang et al., 2022, 2023). Fortunately, the bonding strength between ice and joint wall can strengthen the joints themselves after complete freezing (Matsuoka and Murton, 2008; Zhang et al., 2020; Shan et al., 2021; Wang et al., 2022). However, if the joint ice were thawed, the rock–ice–rock “sandwich” structure would be debonded and unstable. In addition, the liquid water produced by warming ice could lower the friction between joint surface and thus reduce the stability of joint rock slopes (Zhao et al., 2017). Field data show that most of the irreversible fracture displacement and rockfall happen in the warm seasons instead of the cool seasons because the warming and thawing of joint ice could greatly decrease the strength of rock mass containing ice-filled joints (Weber et al., 2018; Etzelmüller et al., 2022). Yang et al. (2019) claimed that the existence of detached ice block could promote the mobility of the ice–rock system and thus cause a more serious geological disaster on alpine rock slopes. Therefore, the warming degradation of the ice–rock interface and the strength loss of ice-filled joints should be comprehensively studied.
In the past decades, the warming degradation of permafrost soils was widely investigated; however, there is little literature reporting the strength loss of rocks containing ice-filled joints. The shear experiment of the ice–rock interface might be first conducted by replacing the rock with concrete in order to make a specific roughness (Davies et al., 2001, 2017). These experiments were conducted at a temperature ranging from −5 to 0 ∘C. Krautblatter et al. (2012) developed a shear strength model for the ice-filled joints that incorporates the cracking of rock bridges, the friction of rough joint walls, creep of ice and detachment of rock–ice interfaces. Mamot et al. (2018) conducted a systematic study of the shear failure of limestone–ice and mica-rich interfaces at constant strain rates from −10 to −0.5 ∘C, and they found that the normal stress and freezing temperature were two important factors influencing the shear strength. However, the uniform joint surfaces were used without considering the influence of joint roughness. Mamot et al. (2021) further predicted the warming stability of permafrost slopes containing ice-filled joints by using the Universal Distinct Element Code (UDEC). The simulation results verified that the warming temperature close to the melting point might drive the slide of a slope with an angle of 50–62∘, and the actual slope angle also depends on the joint orientation. The above research mainly investigated the thawing temperature and normal stress on the shear strength of ice-filled joints. The highest normal stress was about 1.438 MPa (Davies et al., 2001), and the maximum range for the temperature was −10 to −0.5 ∘C (Mamot et al., 2018). However, the freezing depth could exceed 100 m for some alpine caves containing frozen ice (normal stress higher than 2 MPa), and the temperature was less than −15 ∘C as observed in the field (Colucci and Guglielmin, 2019). Therefore, a much wider range of temperature should be considered when investigating the shear characteristics of ice-filled joints.
In addition, although some scholars began to pay attention to the mechanical properties of ice-filled joint rock mass, the influence of many important factors on the shear strength of ice-filled joints was not investigated, including the joint roughness, shear rate, normal stress and joint opening. Generally, the natural joints have different roughness and openings (Shen et al., 2020). In this study, a comprehensive shear experiment was performed on the ice-filled joints in sandstones. The main purpose was to reveal the influencing mechanism of freezing temperature, joint roughness, shear rate, joint opening and normal stress on the shear strength of ice-filled joints in rock masses. This research can provide a better understanding of the warming degradation process of the ice-filled joints and the thawing disaster of alpine mountains in cold regions.
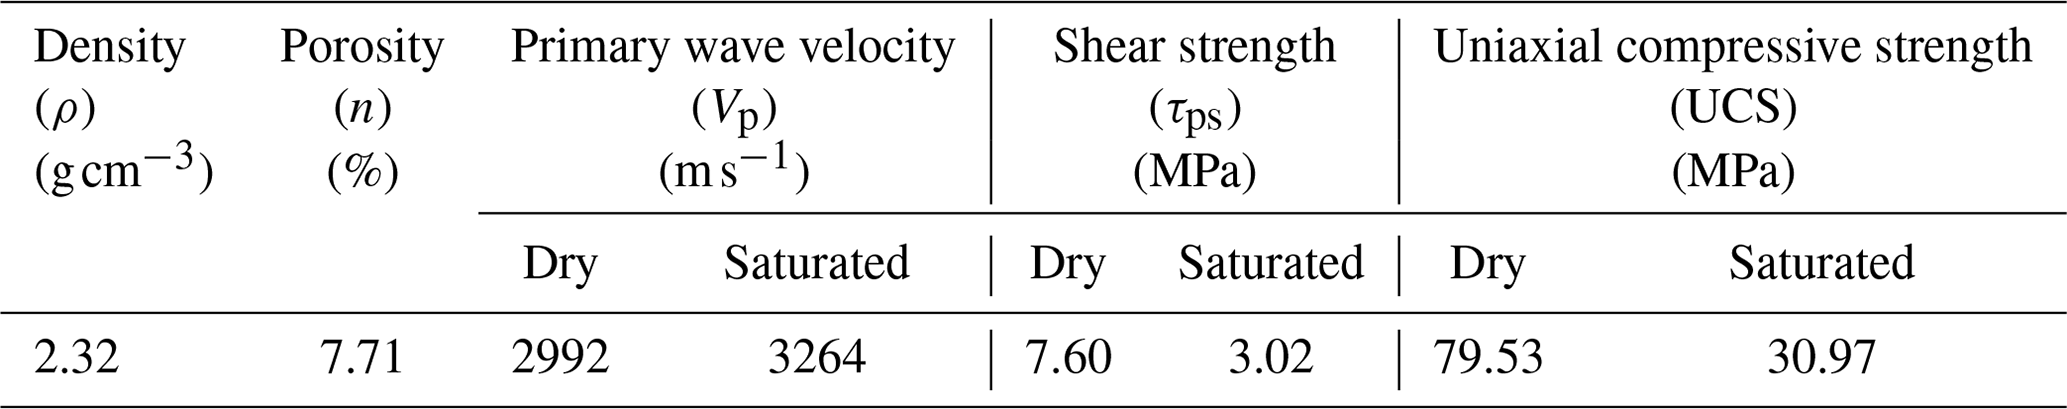
Table 1The basic physico-mechanical properties of the fresh sandstone.
2.1 Collection of sandstones
Red sandstone collected from the city of Yichang of Hubei Province was used in this experiment. This is a typical sedimentary rock and is widely distributed on the surface of the earth. The block samples with approximately equal P-wave (compressional wave) velocities were chosen to make frozen samples containing ice-filled joints. The basic physico-mechanical properties of this red sandstone are given in Table 1.
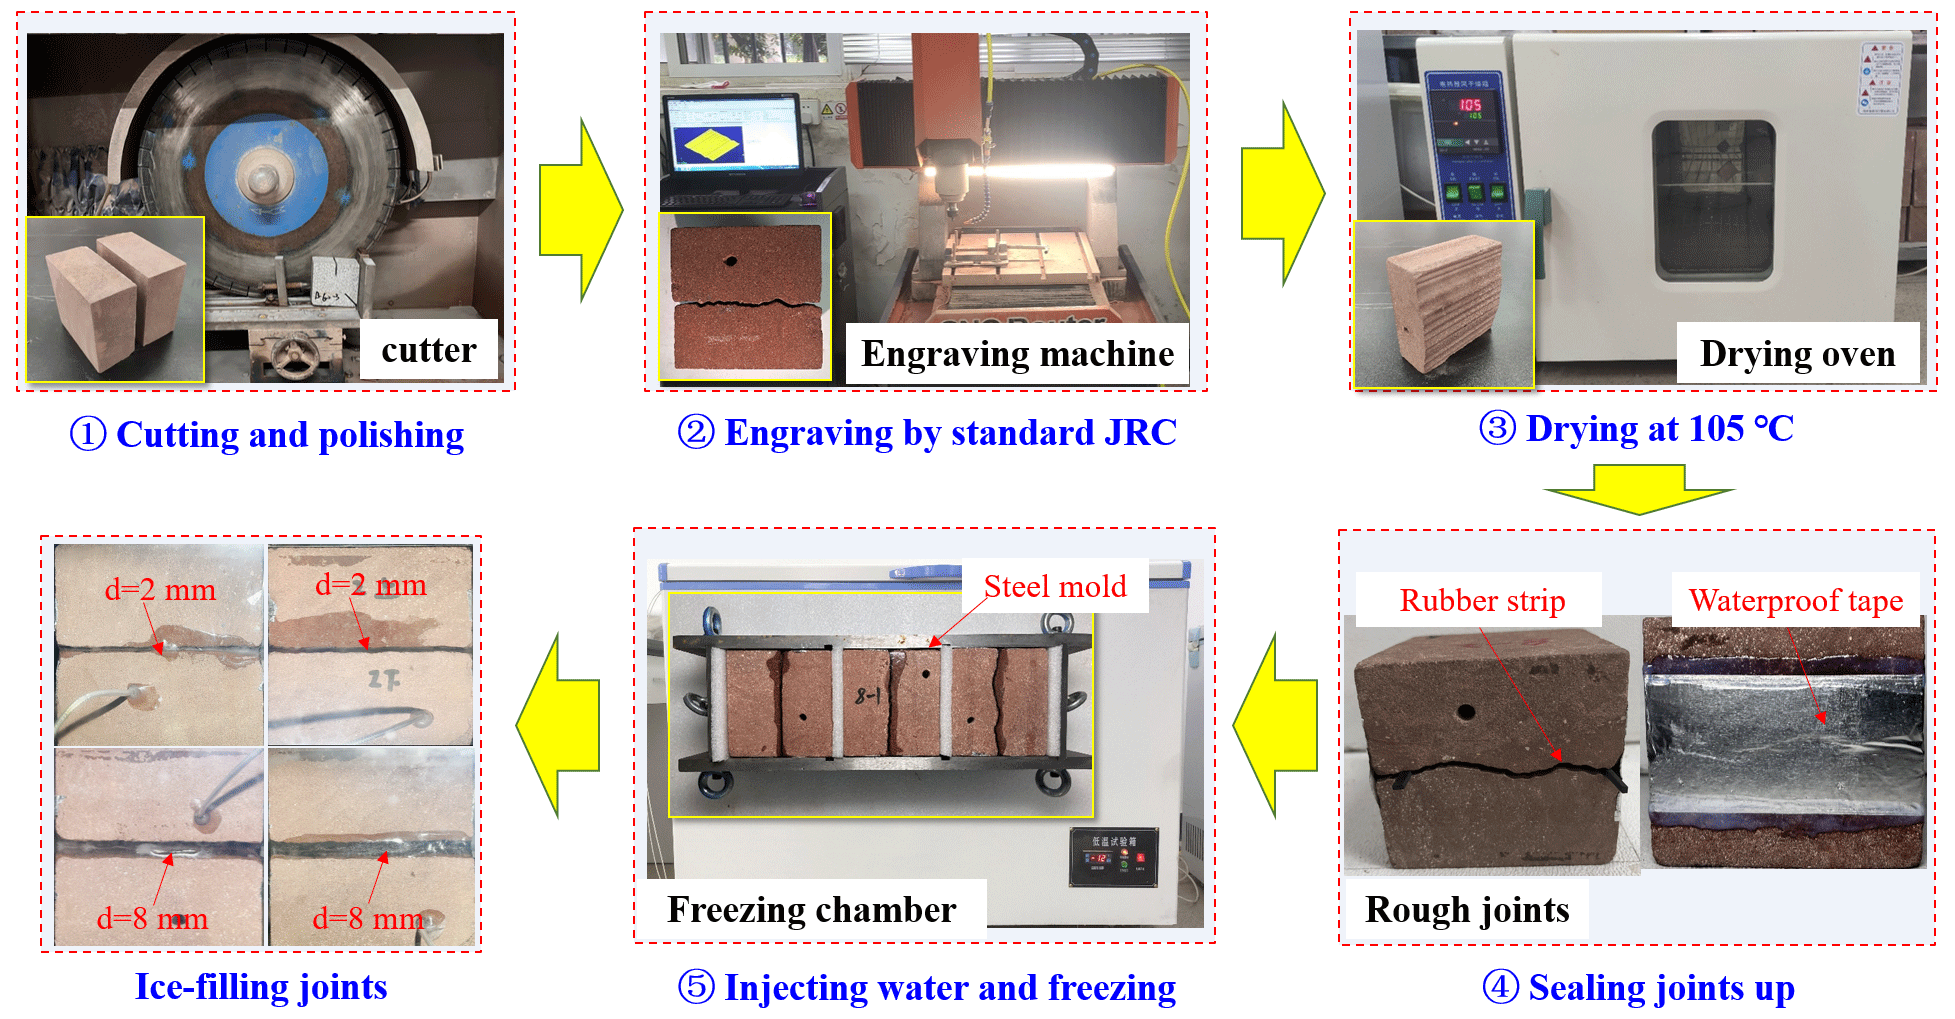
Figure 1Preparation of ice-filled joints. The preparation steps are as follows: (1) cutting and polishing, (2) engraving by standard, (3) drying at 105 ∘C, (4) sealing joints up, and (5) injecting water and freezing.
2.2 Preparation of ice-filled joint rock mass
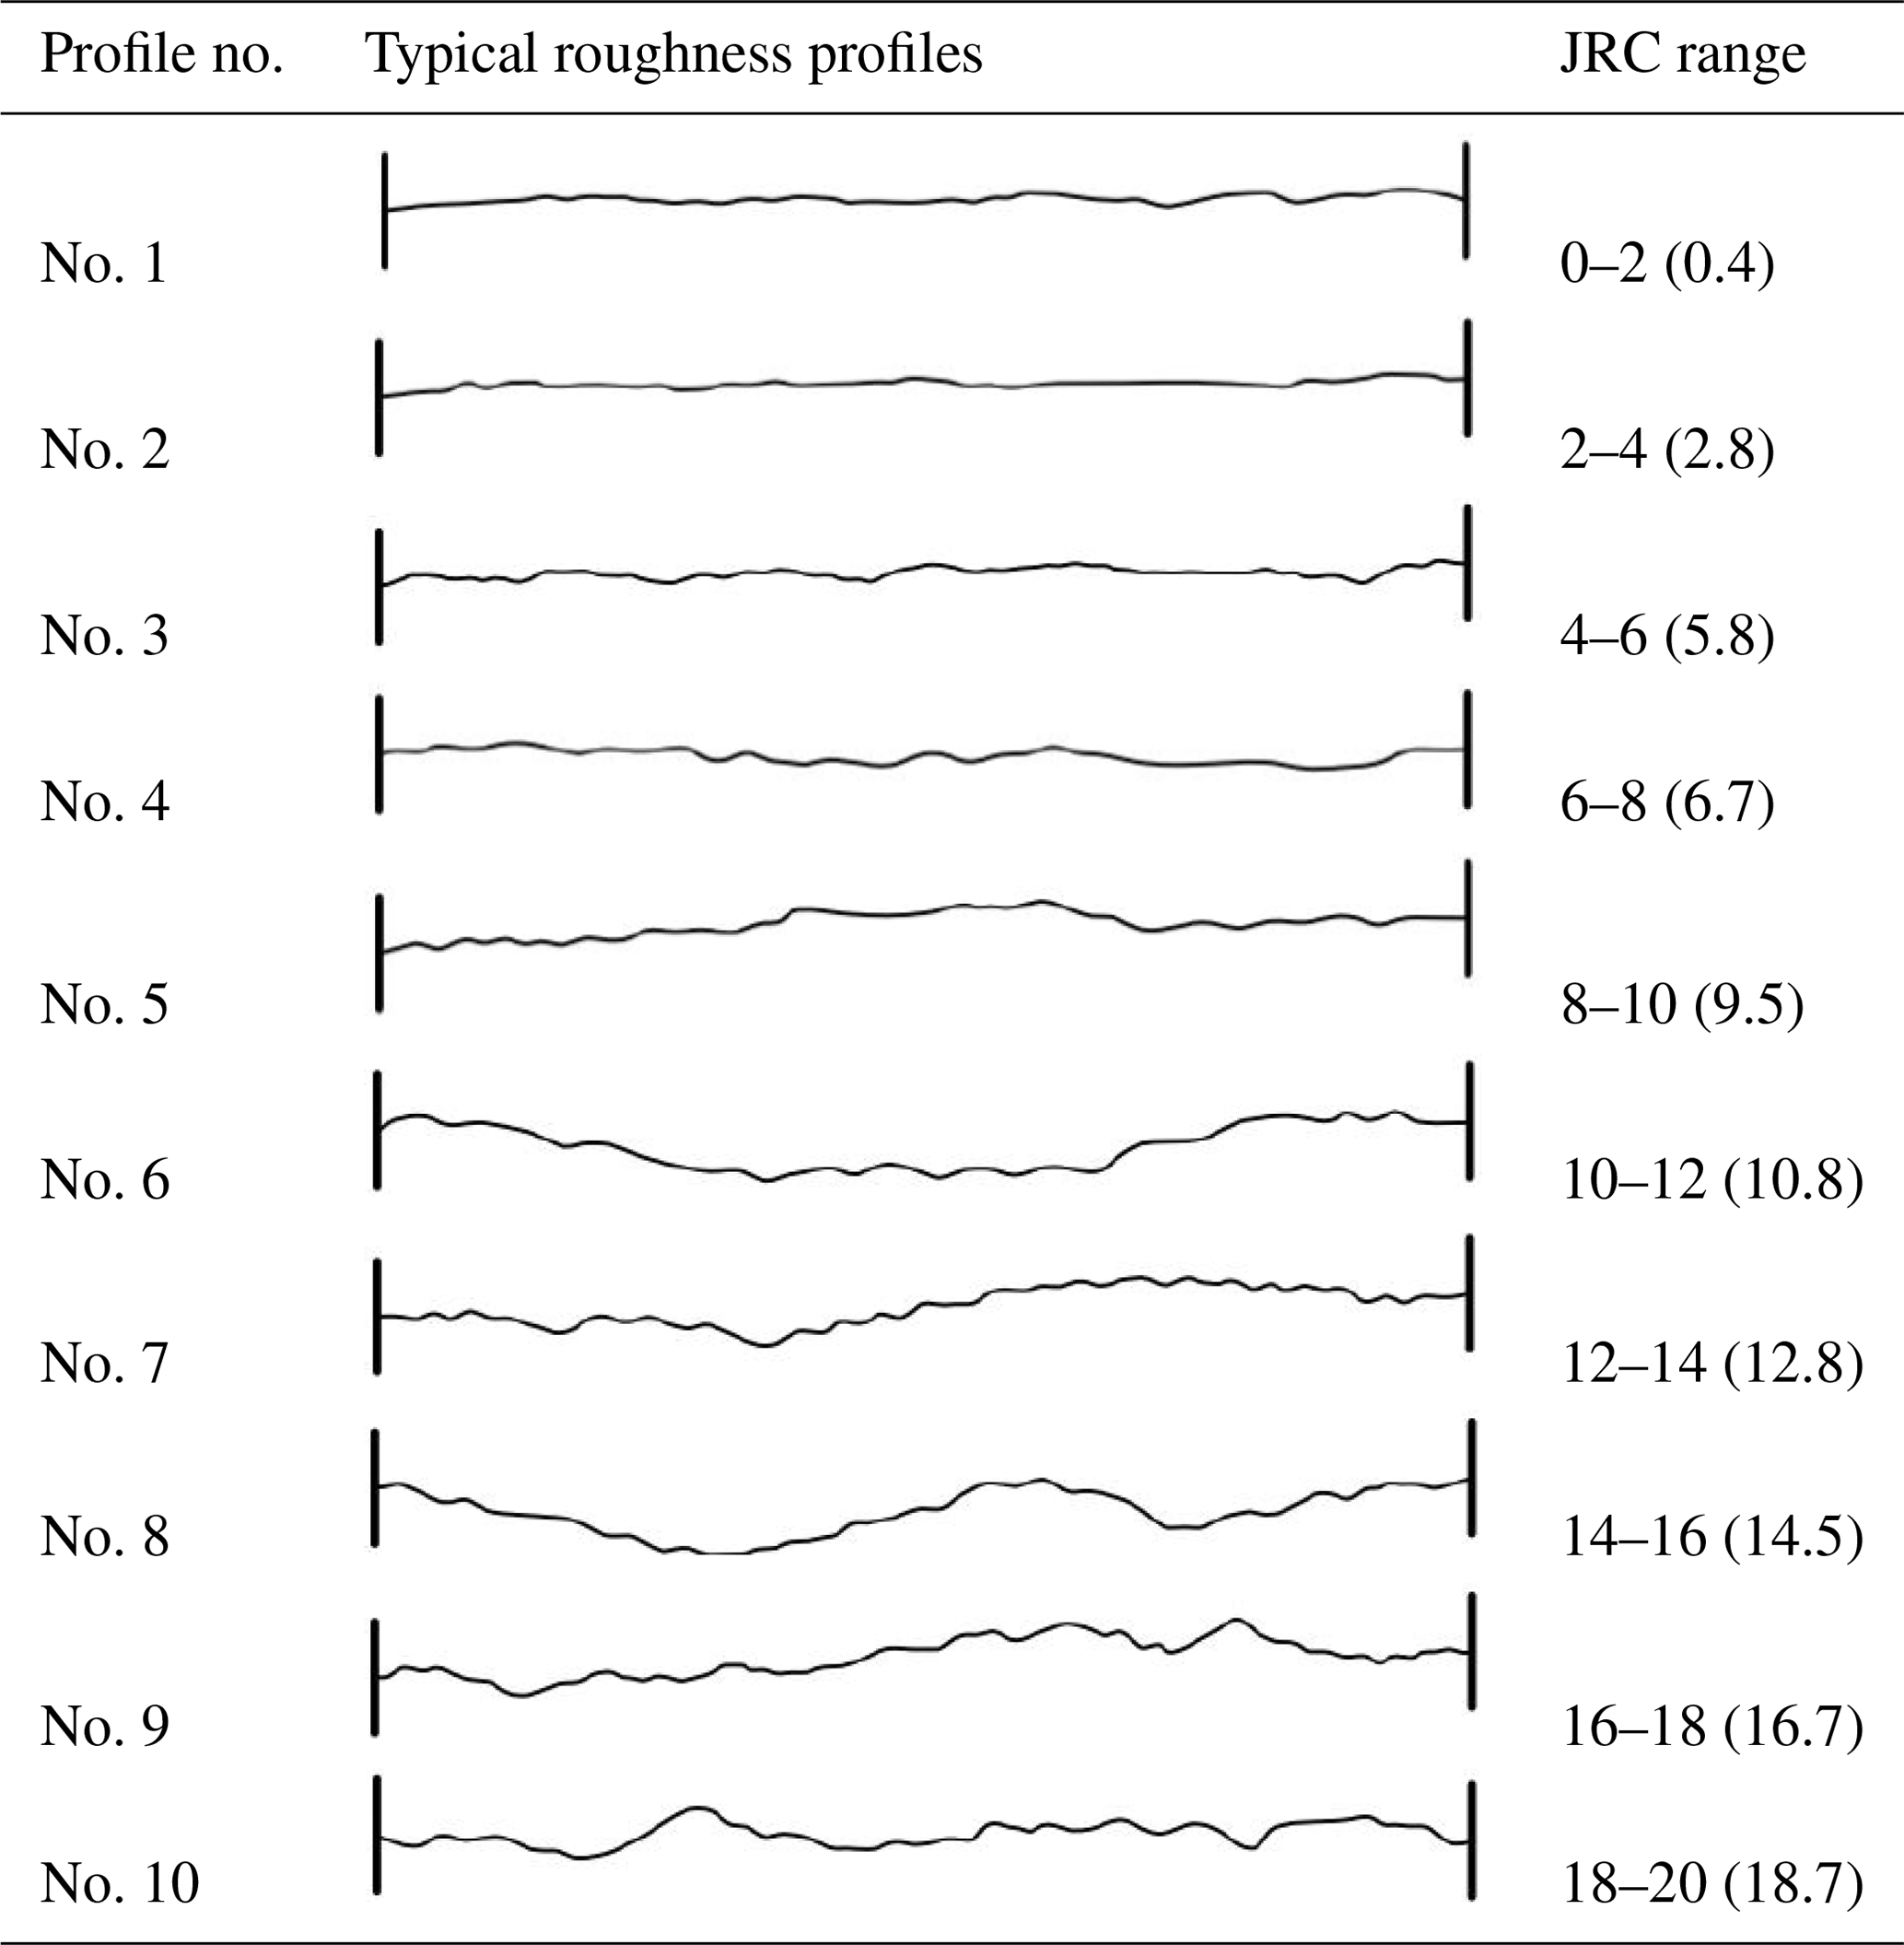
According to the joint roughness coefficient (JRC) index proposed by Barton and Choubey (1977), five kinds of roughness were used in this experiment, including profile no. 2 (2–4∘), no. 4 (6–8∘), no. 6 (10–12∘), no. 8 (14–16∘) and no. 10 (18–20∘). The frozen samples containing ice-filled joints are made in the laboratory because it is hard to cut or drill them in the fields. The manufacturing process of ice-filled joint rock mass mainly includes the following steps.
-
The original rock blocks were cut into the designed rectangular blocks (100 mm × 100 mm × 50 mm) by using a rock-cutting machine.
-
These rectangular blocks were used to engrave different rough curves on the surface by using a 3D numerical control engraving machine. The roughness can be controlled by implanting the standard JRC curves into the controlling system of this machine. Each frozen rock sample containing an ice-filled joint was assembled by using a pair of rectangular blocks with the same roughness.
-
The rock blocks were heated in a dry oven at 105 ∘C in order to tightly paste the waterproof tape and prevent the escape of joint water during freezing.
-
The joint opening was divided into different specified thicknesses, which were controlled by inserting rubber strips, and a piece of waterproof tape was pasted on the surface in order to store water.
-
When the waterproof tape was tightly bonded on the rock surface, liquid water was injected into the artificial joint until no water leaked out. After that, the water-filled joint rock mass was put into a steel mold to freeze in a freezing chamber. The steel mold was used to control the joint opening because the volume of joint water would expand during freezing. Then ice-filled joint samples could be derived after freezing at −20 ∘C for 12 h. The manufacturing procedure and related ice-filled joint samples are shown in Fig. 1.
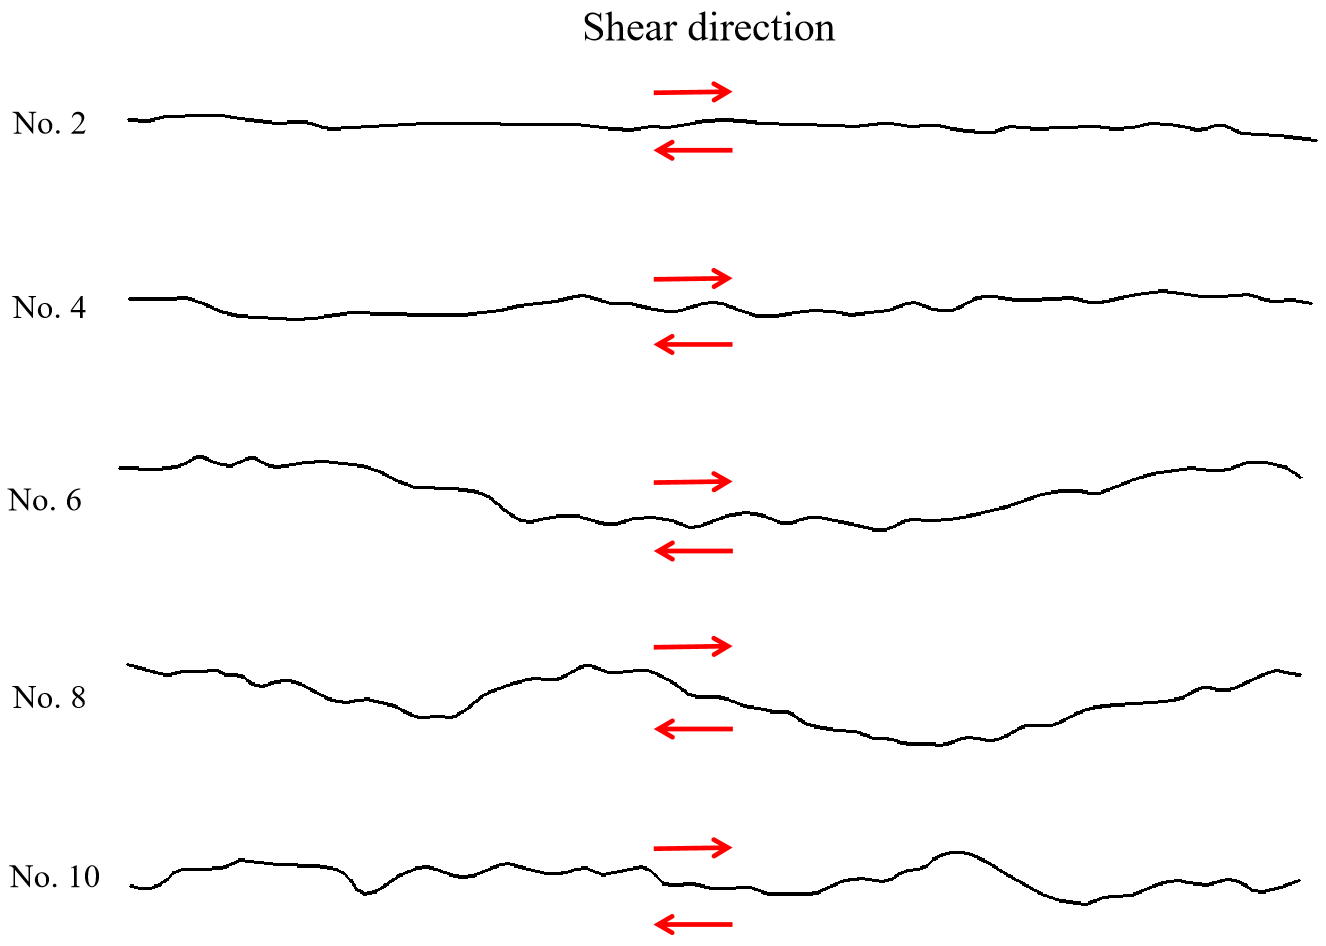
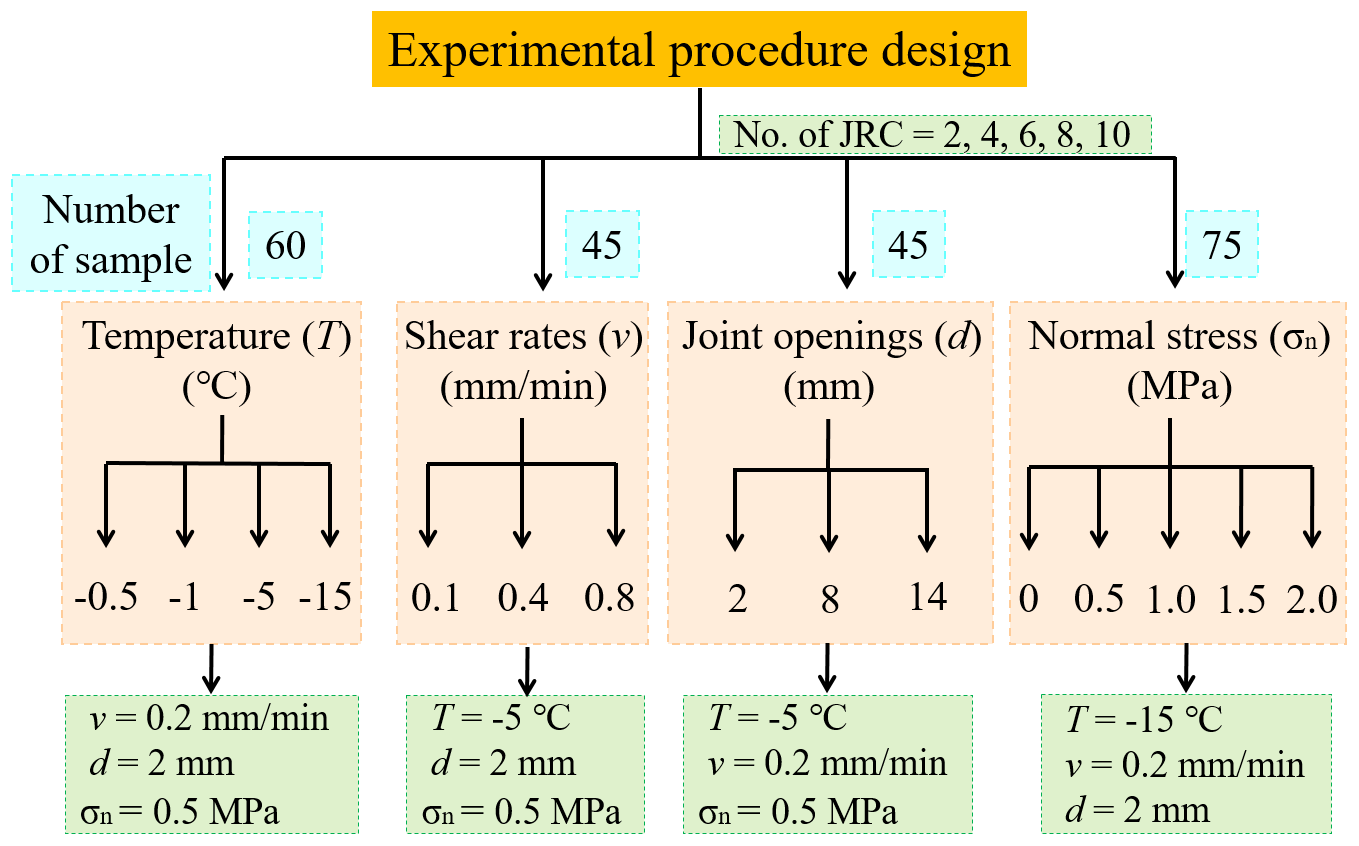
Figure 3Distribution of rock samples containing ice-filled joints. T: temperature. v: shear rates. d: joint openings. σn: normal stress.
2.3 Experimental procedures
The main objective of this study is to investigate the effect of critical factors on the shear strength of ice-filled joint rock mass, including the freezing temperature, joint roughness, shear rates, joint opening and normal stress. The joint roughness is a basic index for rock joints, which is always considered when investigating other factors. Therefore, all the samples can be divided into four groups, namely the temperature group, shear rate group, joint opening group and normal stress group. In the pre-test, the shear strength of the ice-filled joint does not change when the temperature is below −5 ∘C; however, it greatly decreases when the temperature increases from −5 to 0 ∘C. Therefore, the temperatures are set as −15, −5, −1 and −0.5 ∘C, respectively. The shear rates are 0.2, 0.4 and 0.8 mm min−1 in the shear rate group. In the joint opening group, the openings of ice-filled joints are 2, 8 and 14 mm, respectively. The freezing depth on the earth may be small, but it can exceed 100 m in some alpine caves, where the in situ stress is close to 2 MPa. Therefore, in the normal stress group, the normal stresses are set as 0, 0.5, 1, 1.5 and 2 MPa, respectively. Three parallel experiments were performed on each group to eliminate the discreteness of ice-filled joint samples and experiment error. There are approximately 225 ice-filled joint samples prepared in this experiment. The distribution of these ice-filled joint samples is shown in Fig. 3.
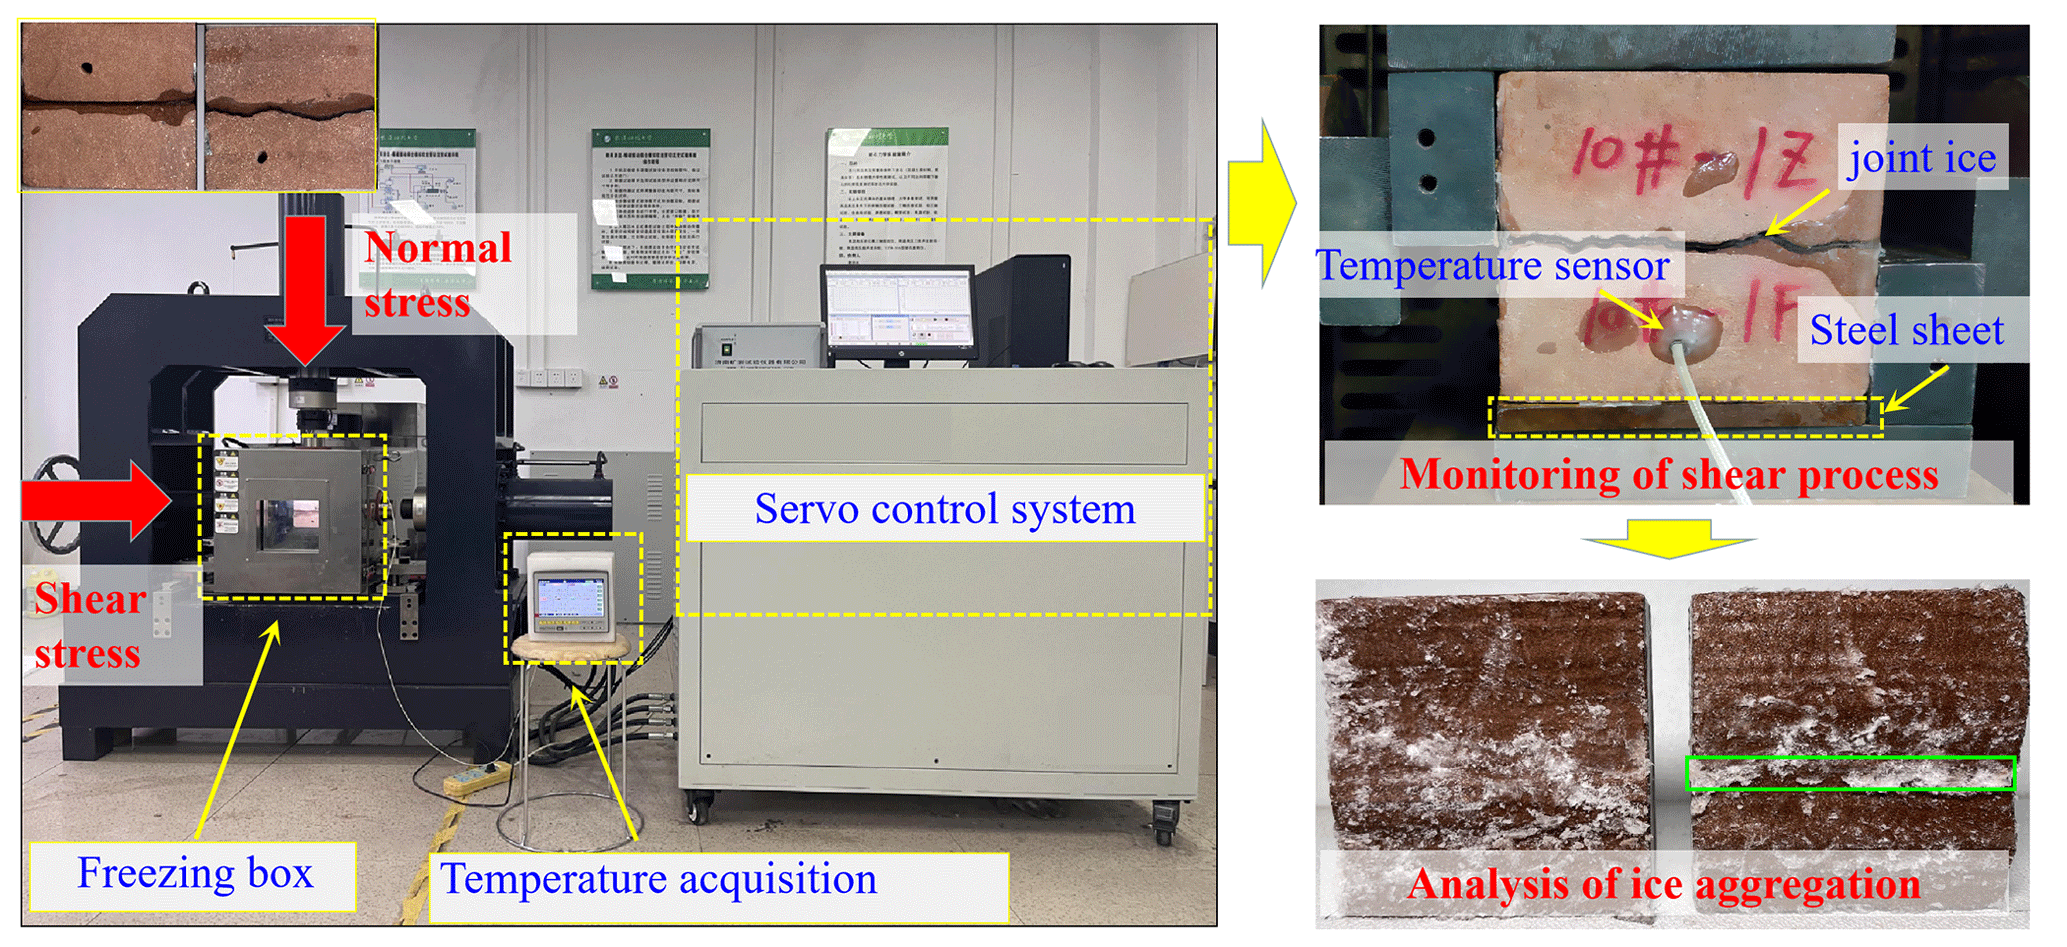
All the water-containing joints were frozen in a freeze box at a specific temperature for about 12 h, and they were used to conduct the direct shear experiment on a temperature-controlled shearing instrument under the scheduled low temperature and normal stress (Fig. 4). A temperature sensor was implanted into the sample to accurately monitor the internal temperature change of ice-filled joint samples. In order to adjust the height of the ice-filled samples, a steel sheet was placed between the indenter and joint blocks. When the scheduled freezing temperature was reached, the normal stress was applied with a loading rate of 0.2 kN s−1. Then the shear process was performed in the displacement mode with the designed shear rate. After the shear experiment, the rupture modes of ice-filled joints were captured and analyzed by using a camera.
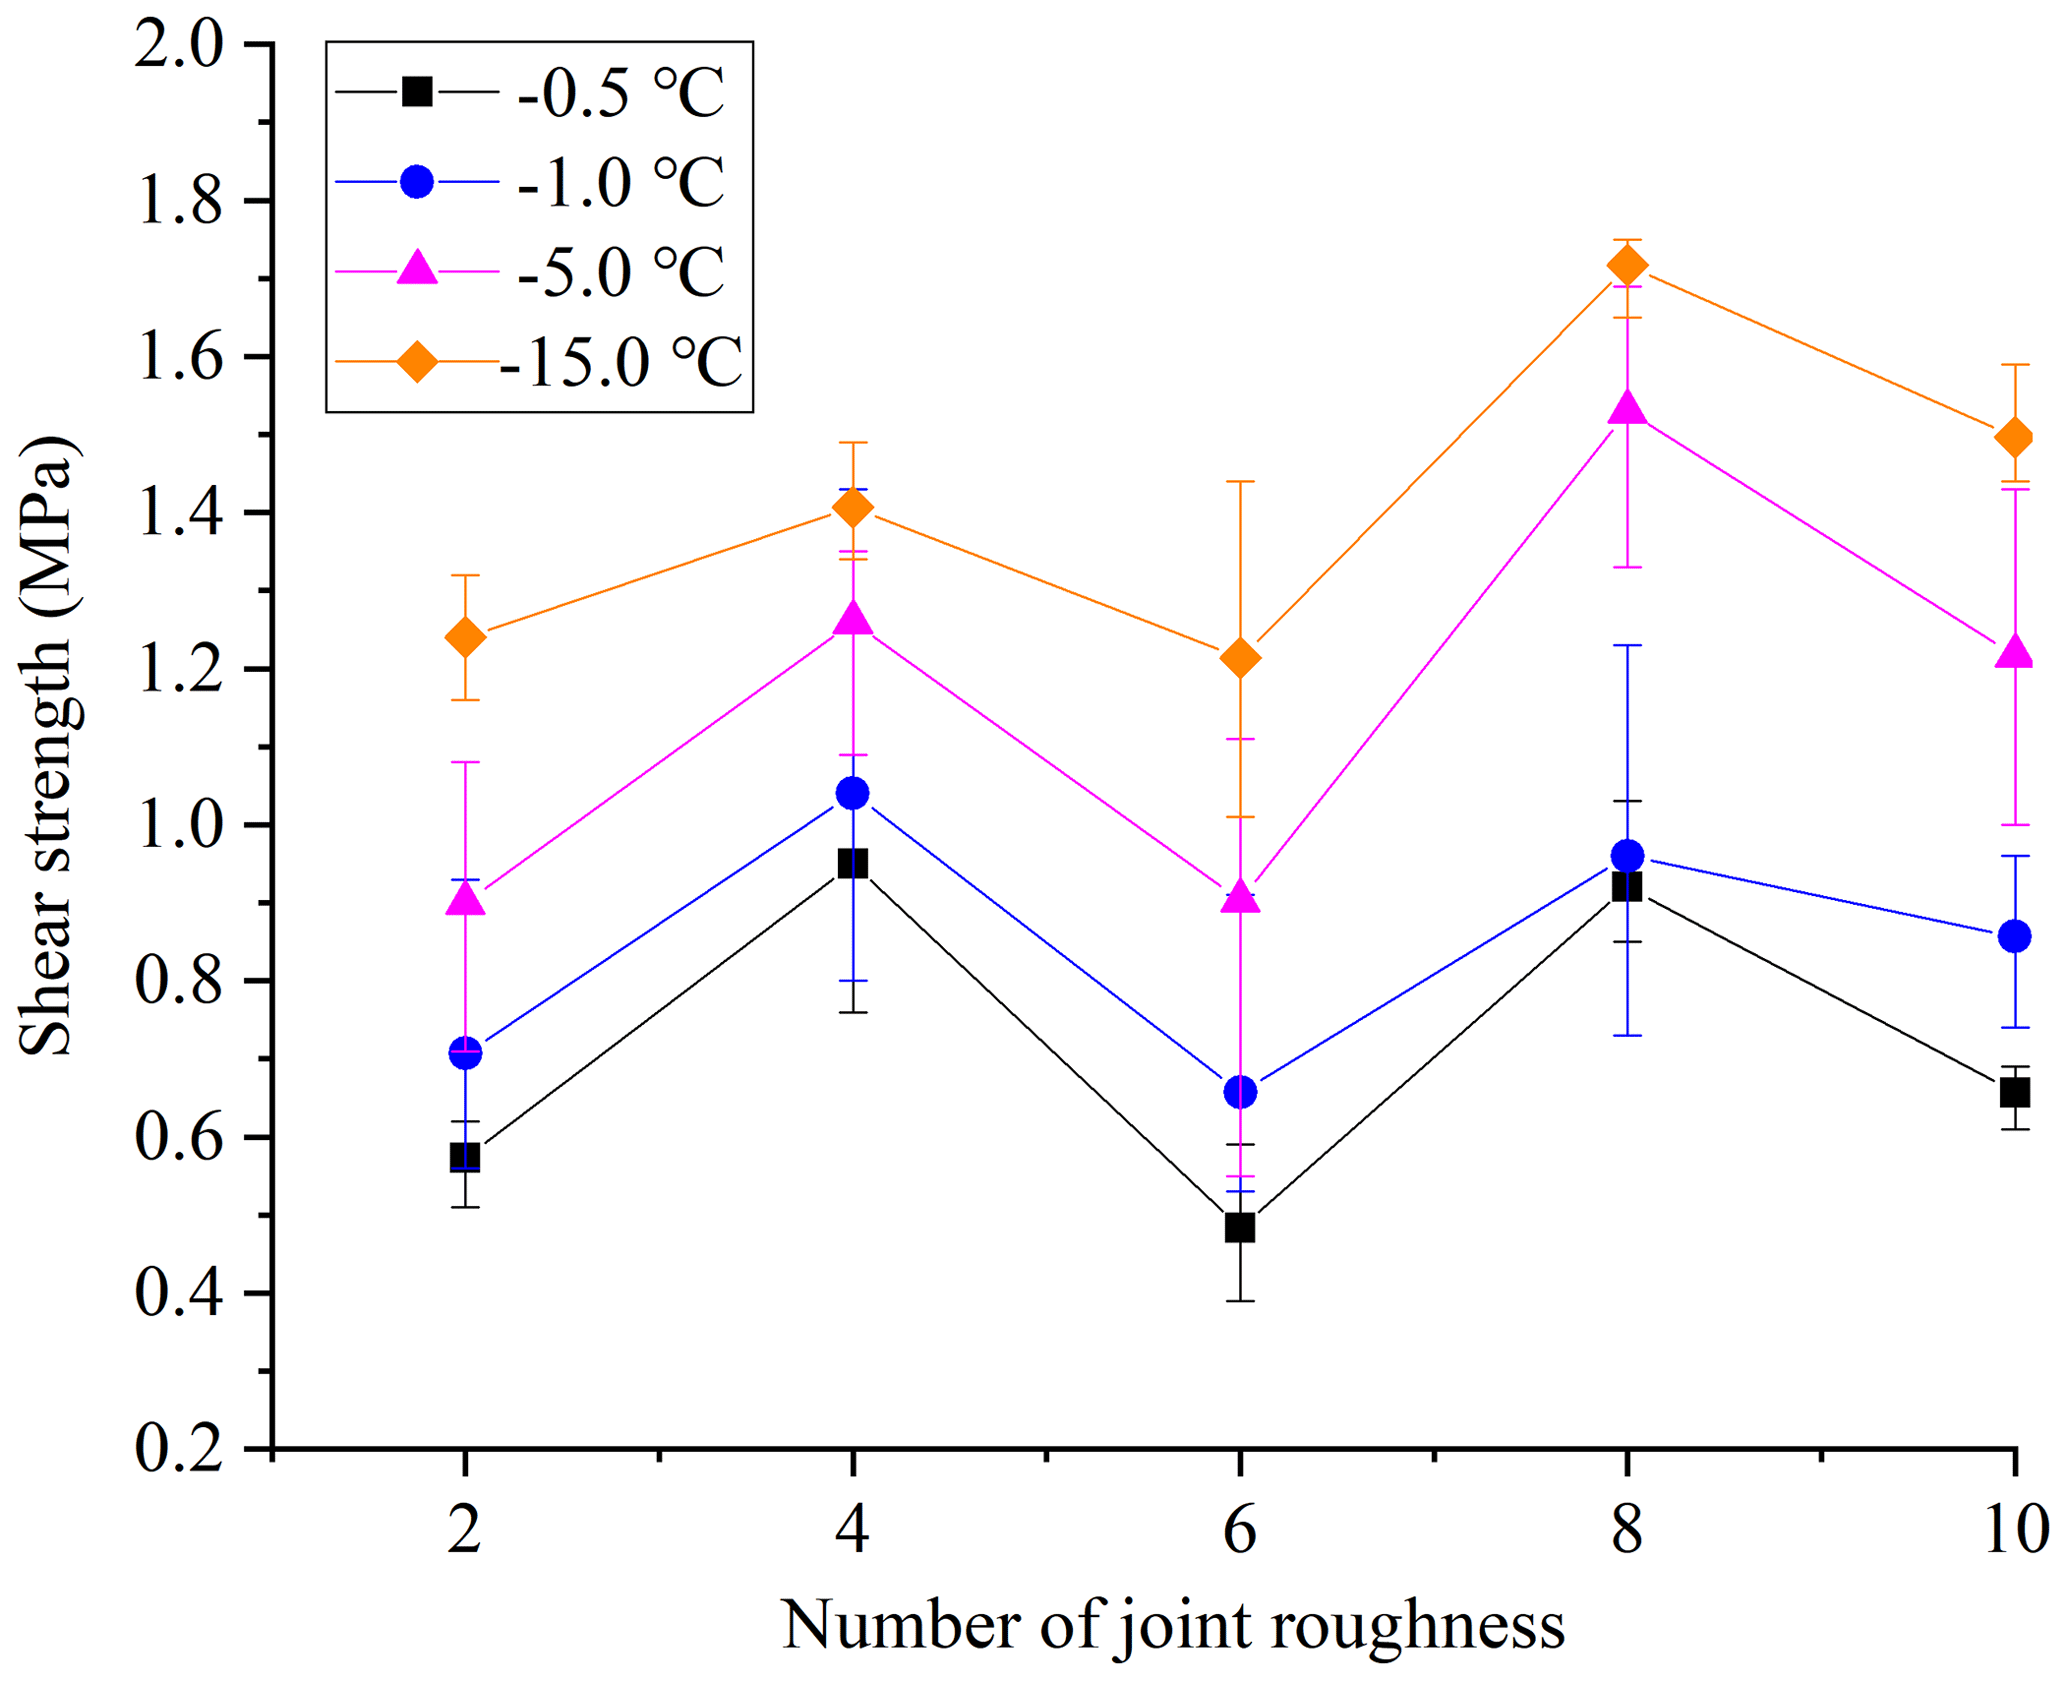
Figure 5Shear strength against joint roughness at different freezing temperatures. Experimental conditions: v = 0.2 mm min−1, d = 2 mm and σn = 0.5 MPa.
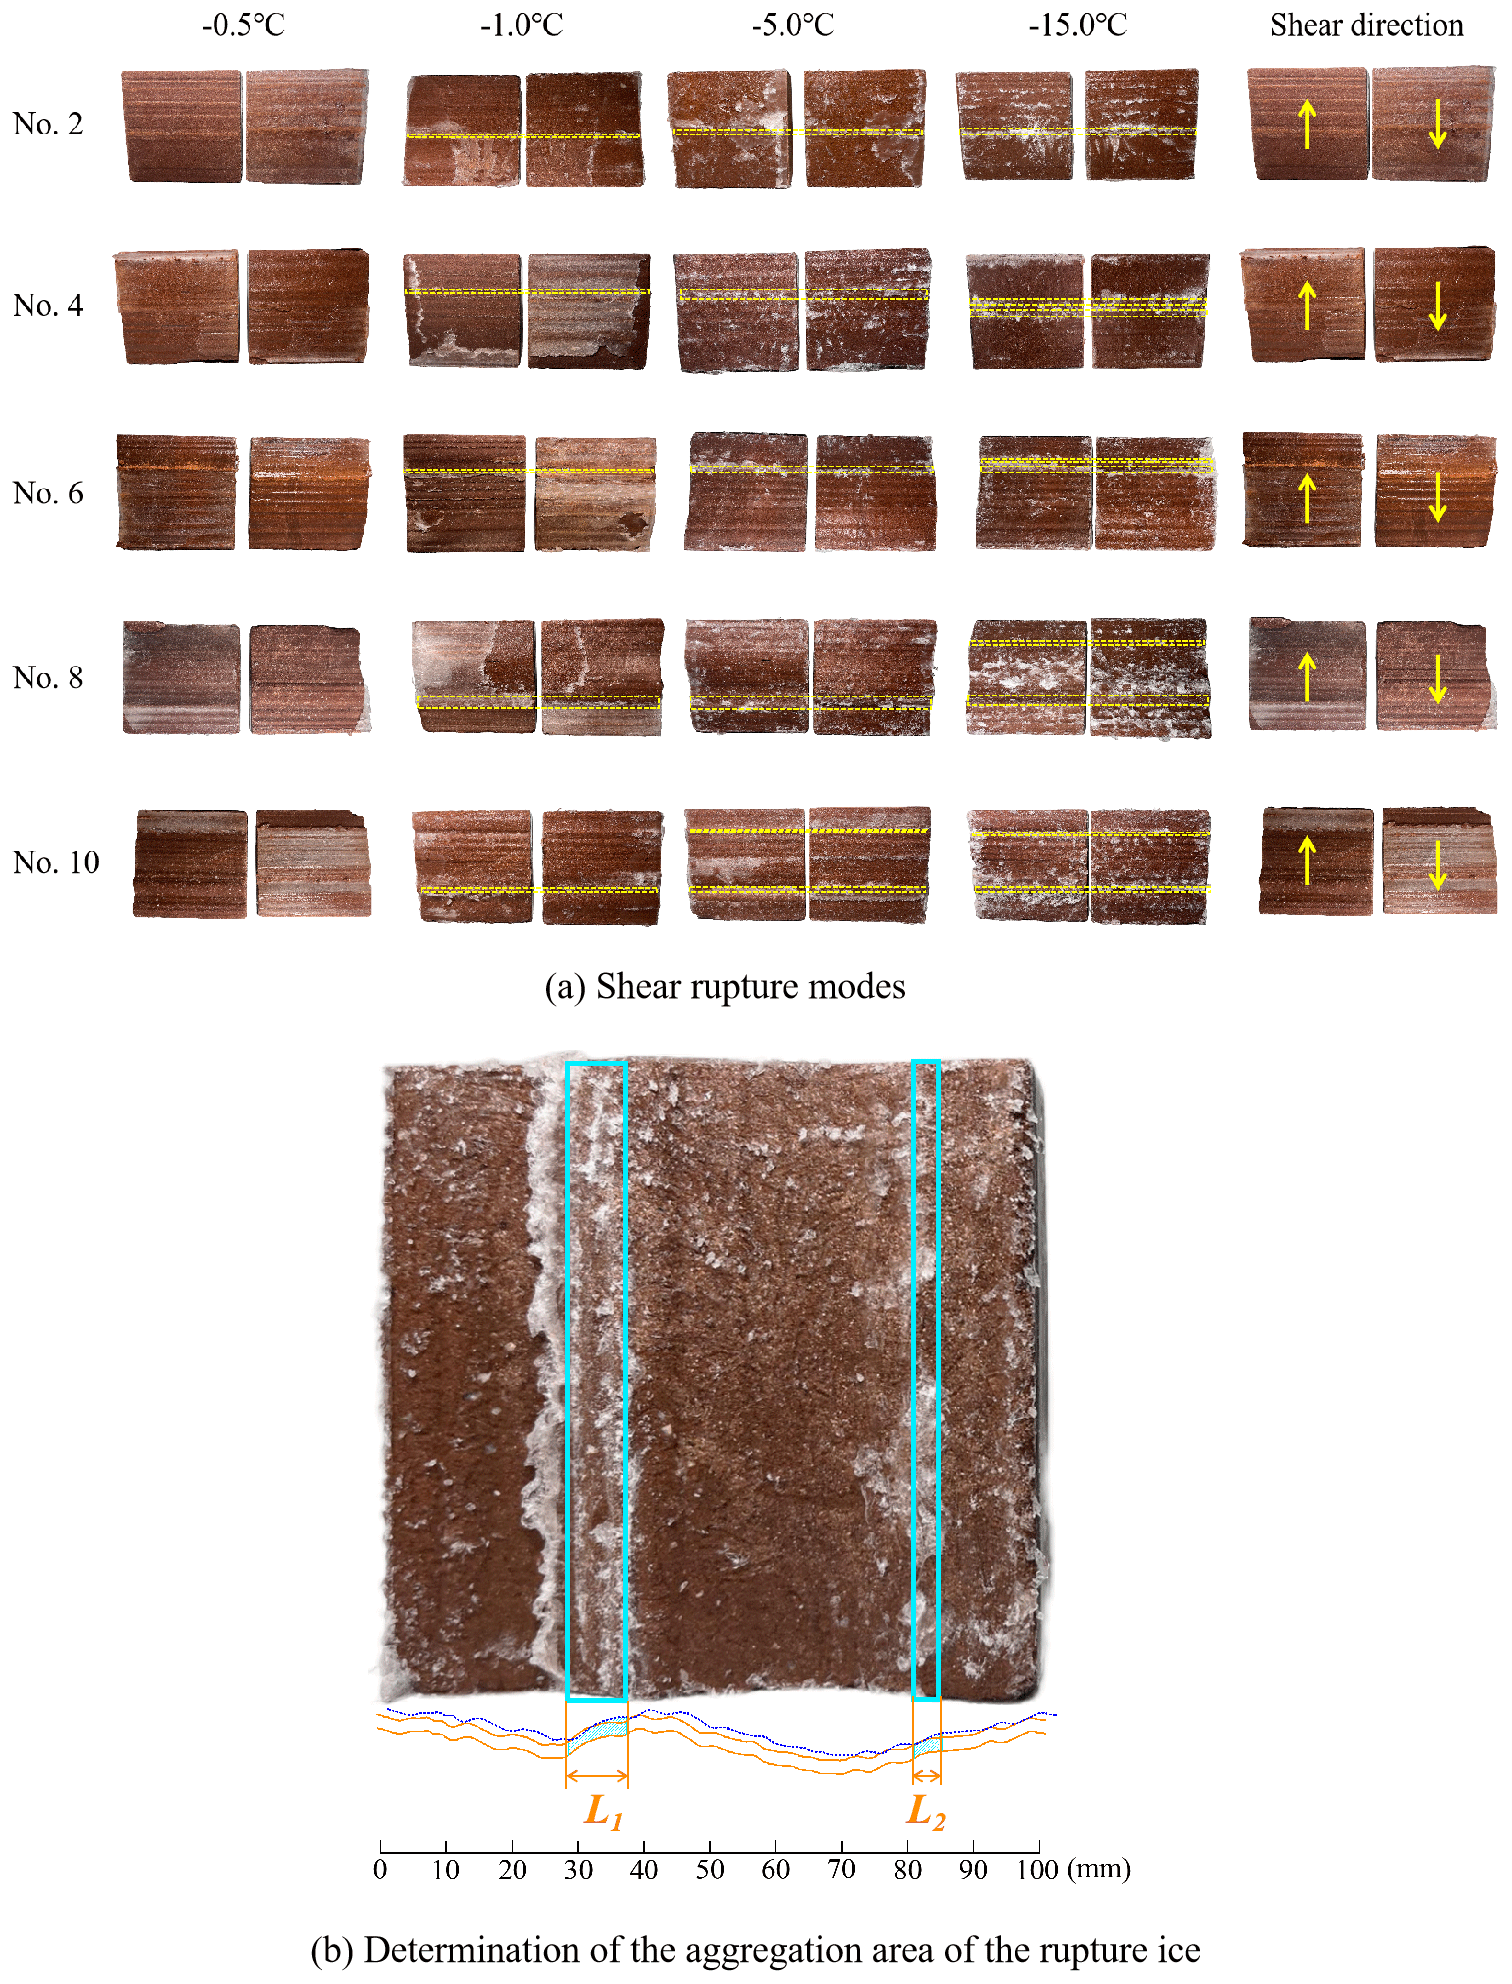
Figure 6Shear rupture modes and aggregation area of ice-filled joints at different freezing temperatures. The dotted yellow lines show the main aggregation of rupture ice. Ice after rupture aggregates in roughness bulges perpendicular to the shear direction.
3.1 Effect of freezing temperature and joint roughness
In the temperature group, freezing temperatures were set as −15, −5, −1 and −0.5 ∘C, and the joint roughness was named by the profile number in Table 2. The shear strength is dependent on the freezing temperature and joint roughness as shown in Fig. 5. The shear strength decreases remarkably with increasing freezing temperature. When the temperature increases from −15 to −0.5 ∘C, the mean strength decreases by approximately 54 %, 32 %, 60 %, 46 % and 56 % for profile no. 2, no. 4, no. 6, no. 8 and no. 10, respectively. The shear strength of ice-filled joints does not always increase with the JRC index, which has a considerable reduction at joint profile no. 6 and no. 10. It illustrates that solid ice is a kind of special infilled material, which is different from soft soils or cement-based materials (Xu et al., 2012; Zhao et al., 2020). The change trend of shear strength against the JRC index may be explained by the shear rupture mode, as shown in Fig. 6a. There are several aggregation regions of rupture ice close to large noticeable bulges on the surface of joints. The peak shear strength of ice-filled joints is related to the aggregation area of rupture ice, because a large shear force is required to promote the solid ice to shear slide along the slope of bulges. It should be noted that the rupture ice has a white appearance, low transparency and obvious rupture characteristics, which can be seen by observing the enlarged pictures of the ice-filled joints after shear failure. Only the rupture ice before the noticeable bulges displays aggregation behavior. The area of the ice aggregation can be calculated after estimating the width of the ice aggregation from the pictures (Fig. 6b), because the joints are two-dimensional surfaces. This is a simple and approximate estimation method for the aggregation area of rupture ice.
The accumulated aggregation area percentage of the rupture ice can be calculated as
where Lk is the width of the ice aggregation for the bulge k and Ljoint = 10 cm, which is the trace length of the joint.
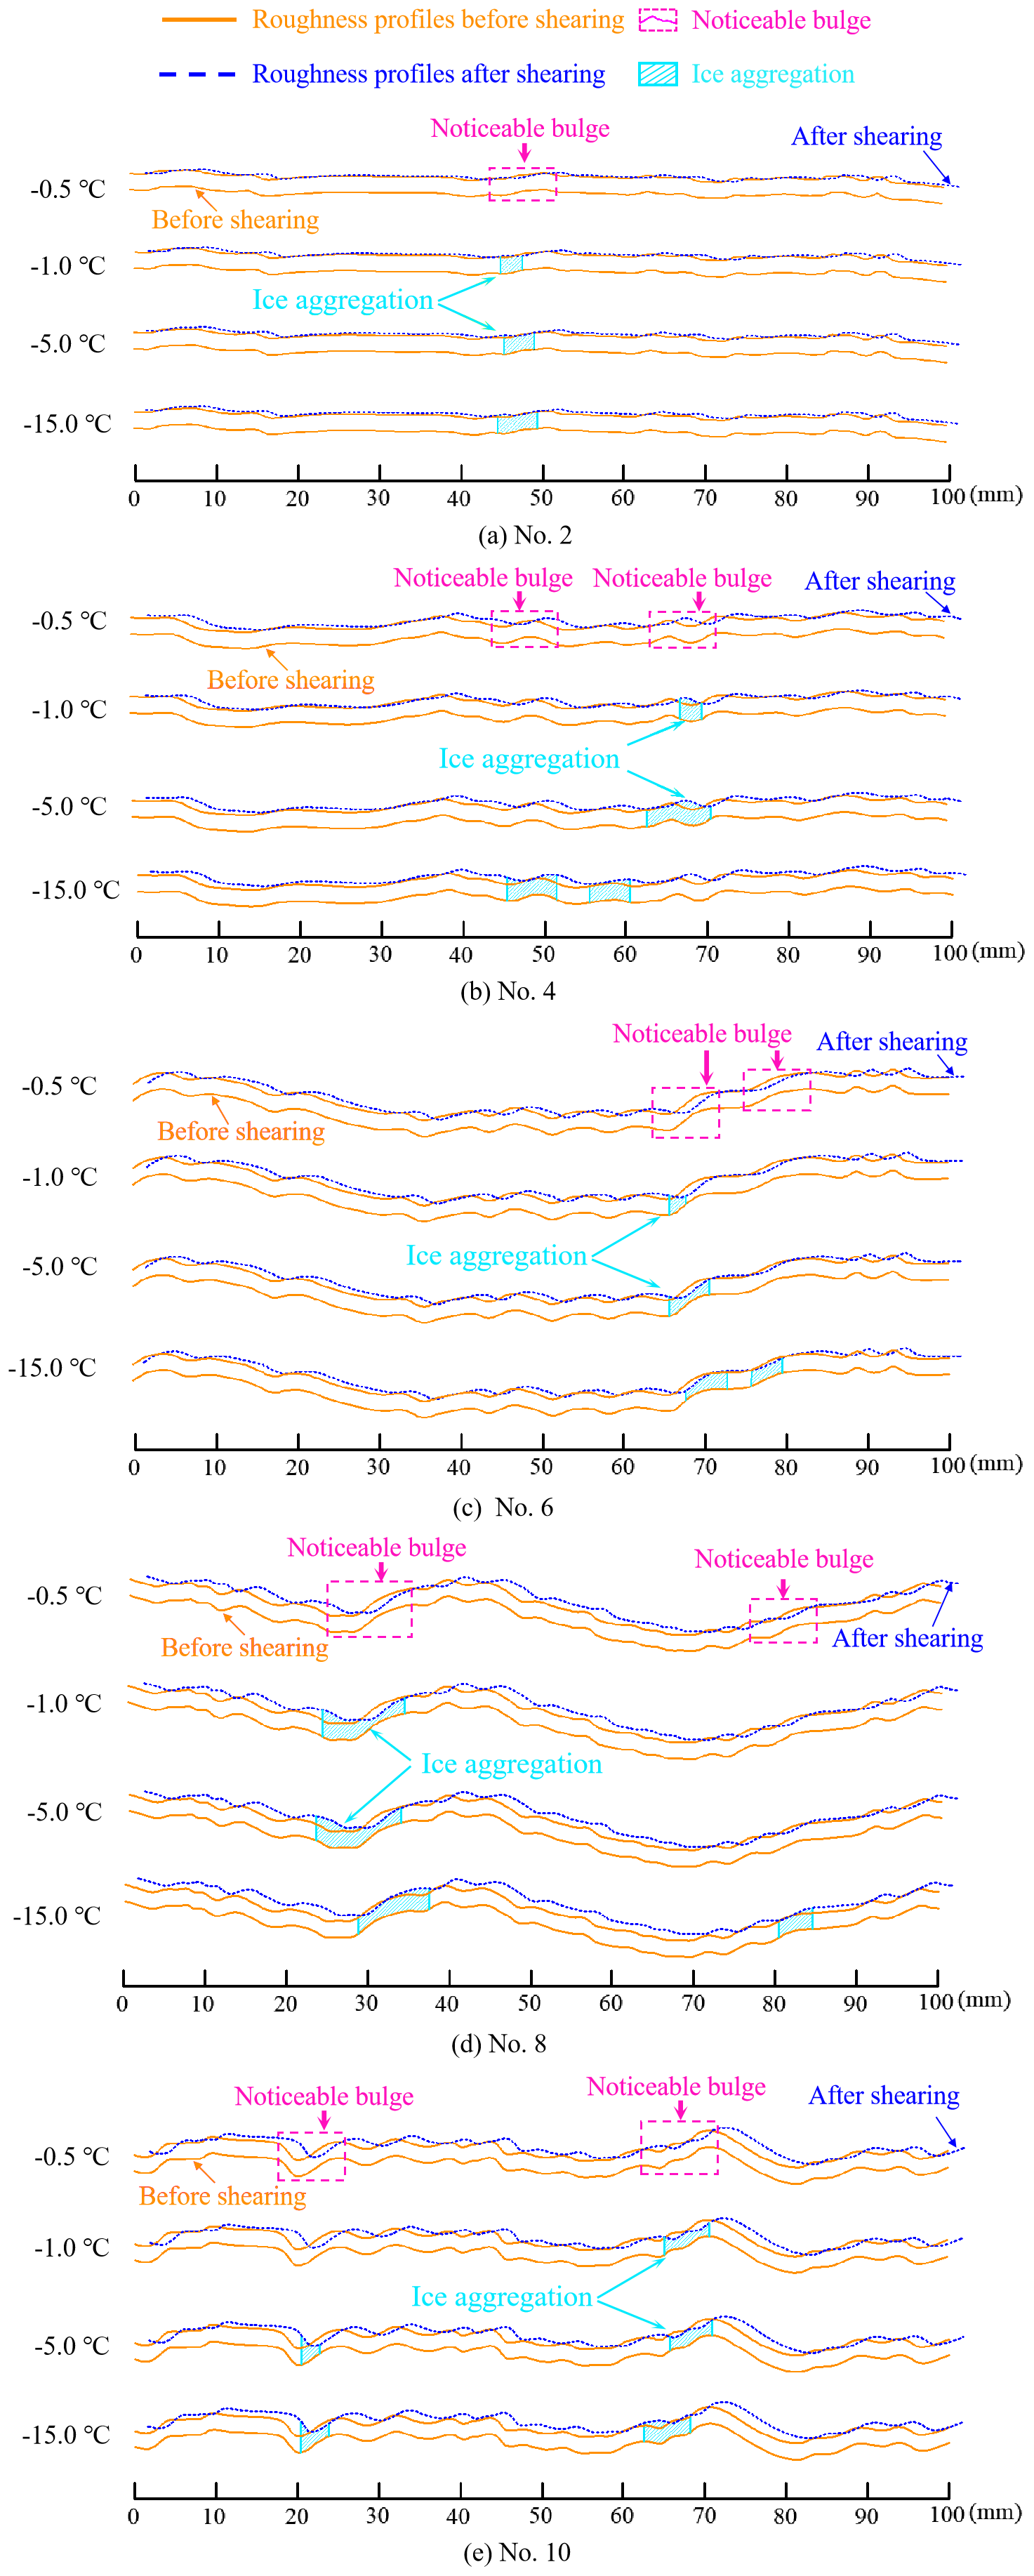
Figure 7Shear aggregation areas of ice along the profile of roughness. Experimental conditions: v = 0.2 mm min−1, d = 2 mm and σn = 0.5 MPa. Some blue profiles (dotted curves) are located under the orange profiles (solid curves) after shearing, which means the width of joints decreases. Generally, the reduction in joint width occurs before some bulges, and the rupture ice aggregates before these bulges. The bulges causing the reduction in joint width and aggregation of ice are called noticeable bulges. The noticeable bulges have larger inclination angles, and they are far away from the joint edges.
The aggregation area and location along the rough profile of joints after shear failure are plotted in Fig. 7. It can be observed that the ice aggregation appears before several high bulges, and the aggregation location is almost independent of the freezing temperature if ice aggregation occurs. The noticeable bulges in front of the ice aggregation are noticeable and influential. This implies that the influence of joint roughness on the shear strengths of these ice-filled joints may be only controlled by several noticeable bulges instead of the JRC index. Figure 8 shows that the shear strengths of no. 6 and no. 10 display obvious reduction trends, which may be in accordance with the ice aggregation area. The ice aggregation area decreases with increasing freezing temperature, because the bonding strength between ice and joint surface becomes weaker, and the shear rupture happens along the ice–rock interface instead of solid ice when the freezing temperature is higher than −0.5 ∘C.
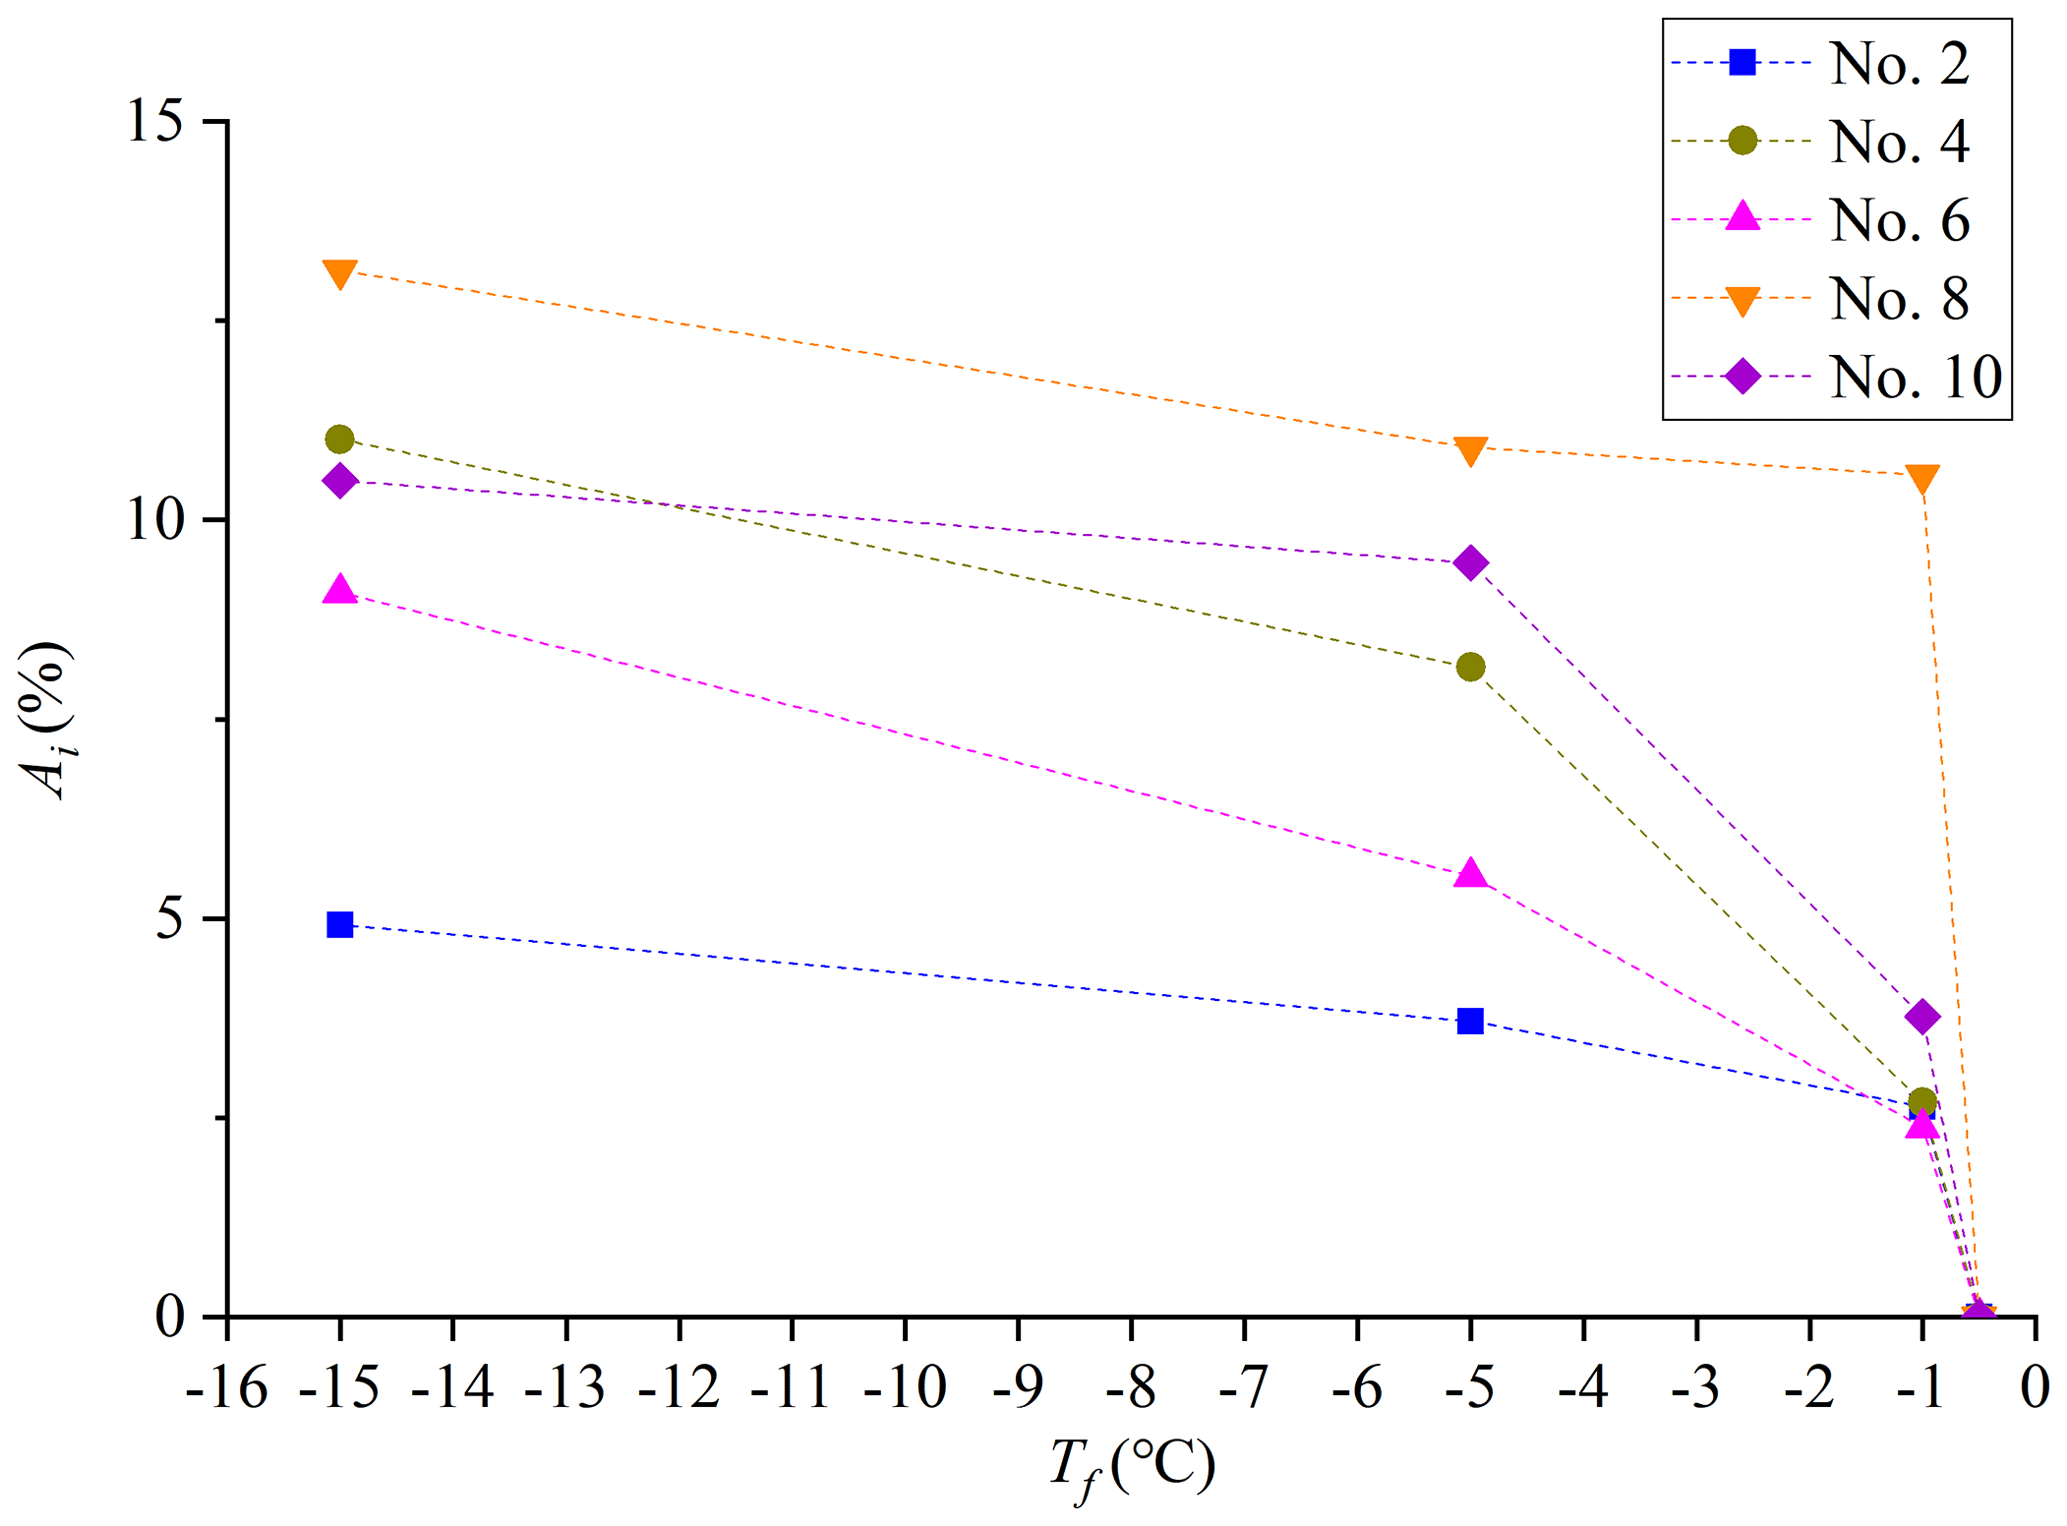
Figure 8The aggregation area of rupture ice increases with the reduction in freezing temperature. Experimental conditions: v = 0.2 mm min−1, d = 2 mm and σn = 0.5 MPa. Ai: aggregation area percentage of rupture ice.
In addition, when the freezing temperature is close to 0 ∘C, the pre-melting of the ice–rock interface induced by the normal stress causes a reduction in bonding strength. Therefore, the shear strength between bonded ice–rock interfaces is much lower than the shear strength of solid ice at a high freezing temperature close to the melting point of bulk ice, such as −0.5 ∘C. It should be noted that the aggregation phenomenon of rupture ice disappears when T = −0.5 ∘C because the high-temperature ice experiences ductile failure along the ice–rock interface instead of the joint ice itself. However, the climbing effect still makes a significant contribution to the increase in shear strength.
The peak shear displacement and normal displacement also are dependent on the freezing temperature (Tables 3 and 4). With the increase in freezing temperature, the peak shear displacement increases because the joint ice changes from brittle to ductile (Bragov et al., 2015). The brittle–ductile transition of pure ice is also related to the freezing temperature, and the rupture ice is produced under the brittle failure condition. Lou and Wu (2022) claimed that plain ice has high brittleness at temperatures from −5 to −20 ∘C. The increasing aggregation area of the rupture ice in Fig. 6 further proves that the brittleness of ice increases with decreasing freezing temperature. The maximum shear displacement before failure is smaller at −15 ∘C, which may be caused by the high brittleness. When the temperature increases to −1 ∘C, the solid ice becomes ductile; therefore, a larger shear displacement arises before failure. However, the shear dilatancy reduces with increasing freezing temperature. Solid ice is a kind of temperature-dependent material, the elastic modulus of which almost linearly decreases with increasing freezing temperature (Sinha, 1989; Han et al., 2016). The inhibition of normal stress on the shear dilatancy is greater at high freezing temperature during the shear process.
Table 3The peak shear displacement at the peak points of shear strength (mm).
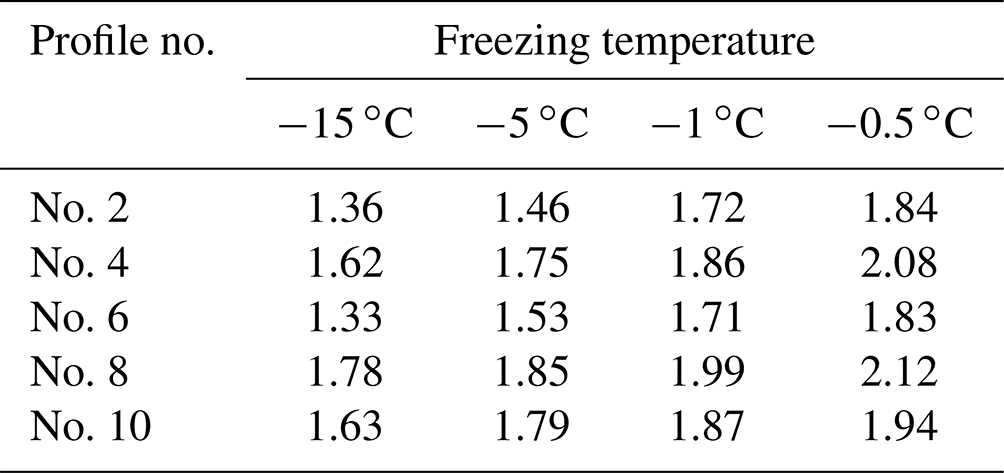
Table 4The normal shear dilatancy at the point of peak shear strength (mm).
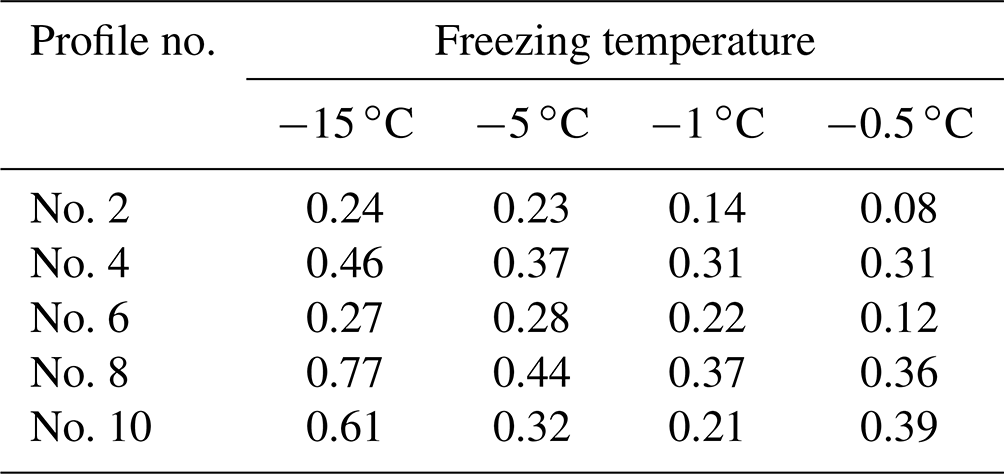
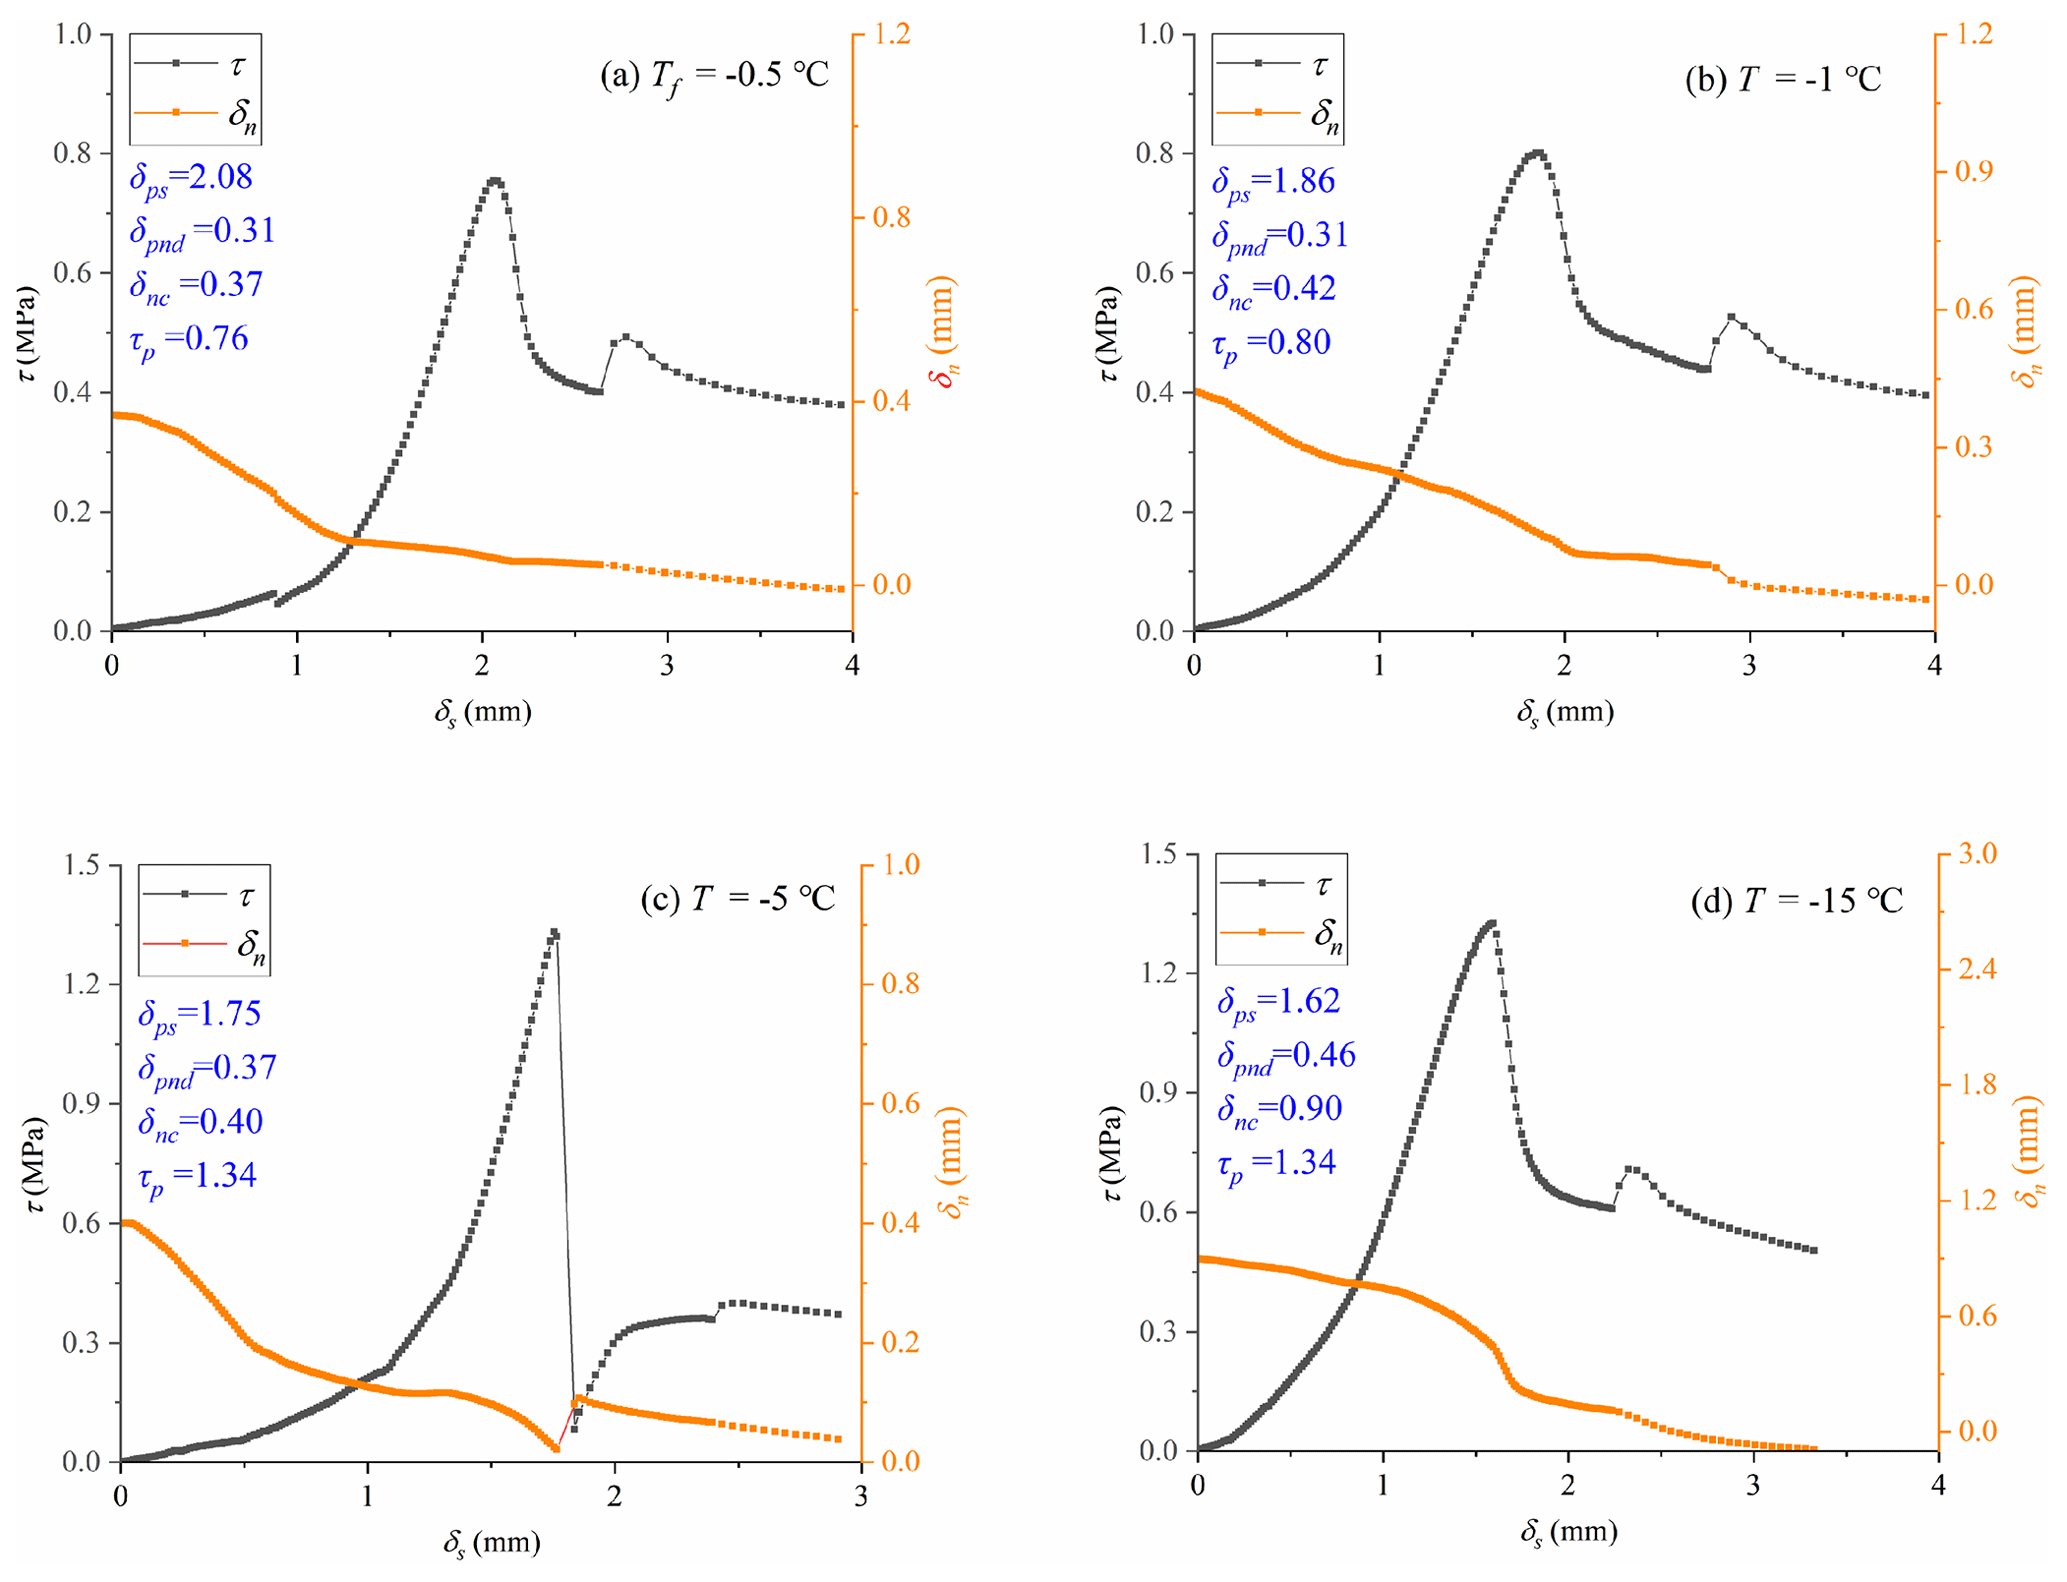
Figure 9Shear strength and normal displacement versus the shear displacement for profile no. 4 in the temperature group. δps and δpnd are the shear displacement and normal shear dilatancy at the point of peak shear strength, τp, and δnc is the initial compression deformation.
Several typical shear-stress-displacement and normal-shear-displacement curves for profile no. 4 are plotted in Fig. 9. The ice-filled joint shows significant residual shear strength beyond the peak point, which slightly decreases with increasing shear displacement. This residual shear strength is caused by the friction effect between the upper and lower ice-filled blocks. In addition, the normal shear dilatancy displays an increasing trend with shear displacement, which is caused by the climbing effect of ice-filled joints. It should be noted that the shear strength has a second rising point at the residual strength stage, because the shear rate is increased from 0.2 to 1 mm min−1 in order to accelerate the completion of the shear process. Schulson and Fortt (2012) claimed that the friction between ice interfaces increases when the shear rates increase from 0.06 to 0.6 mm min−1. Therefore, the sudden rise of residual shear strength can be attributed to the accelerated shear rate.
Another finding is that the JRC index is not suitable to interpret the influence of joint roughness on the shear strength of ice-filled joints, because the peak shear strength does not monotonically increase with an increasing JRC index. The peak shear strength displays an increase–decrease–increase–decrease trend against the JRC index from profile no. 2 to no. 10 (Fig. 5). Figure 10 shows that the peak shear strength displays a linear increasing trend with increasing aggregation areas of fragmented ice after failure. The aggregation area of fragmented ice can be treated as the effective climbing area, which makes a significant contribution to the improvement of shear strength, because the fragmented ice is produced under compression–shear stress in the process of climbing the steep bulges. As a consequence, only these steep bulges causing aggregation of rupture ice contribute to the improvement of shear strength. The variation law of shear dilatancy against the roughness is also in accordance with the shear strength of ice-filled joints, but it is different from the change law of the JRC number (Table 4). In Fig. 7, the gathering of fragmented ice mainly arises in the front of the steepest bulge. It illustrates that the improvement of shear strength of joint ice is caused by a part of the steepest bulge instead of the total roughness. Therefore, the JRC index may not be suitable for the prediction of shear strength of ice-filled joints. For example, although the JRC index of no. 6 is much larger than no. 4, the aggregation of rupture ice area caused by effective steep bulges of no. 6 is smaller than no. 4 (Fig. 8). This phenomenon confirms that the improvement of shear strength is only caused by some noticeable steep bulges instead of the total bulges.
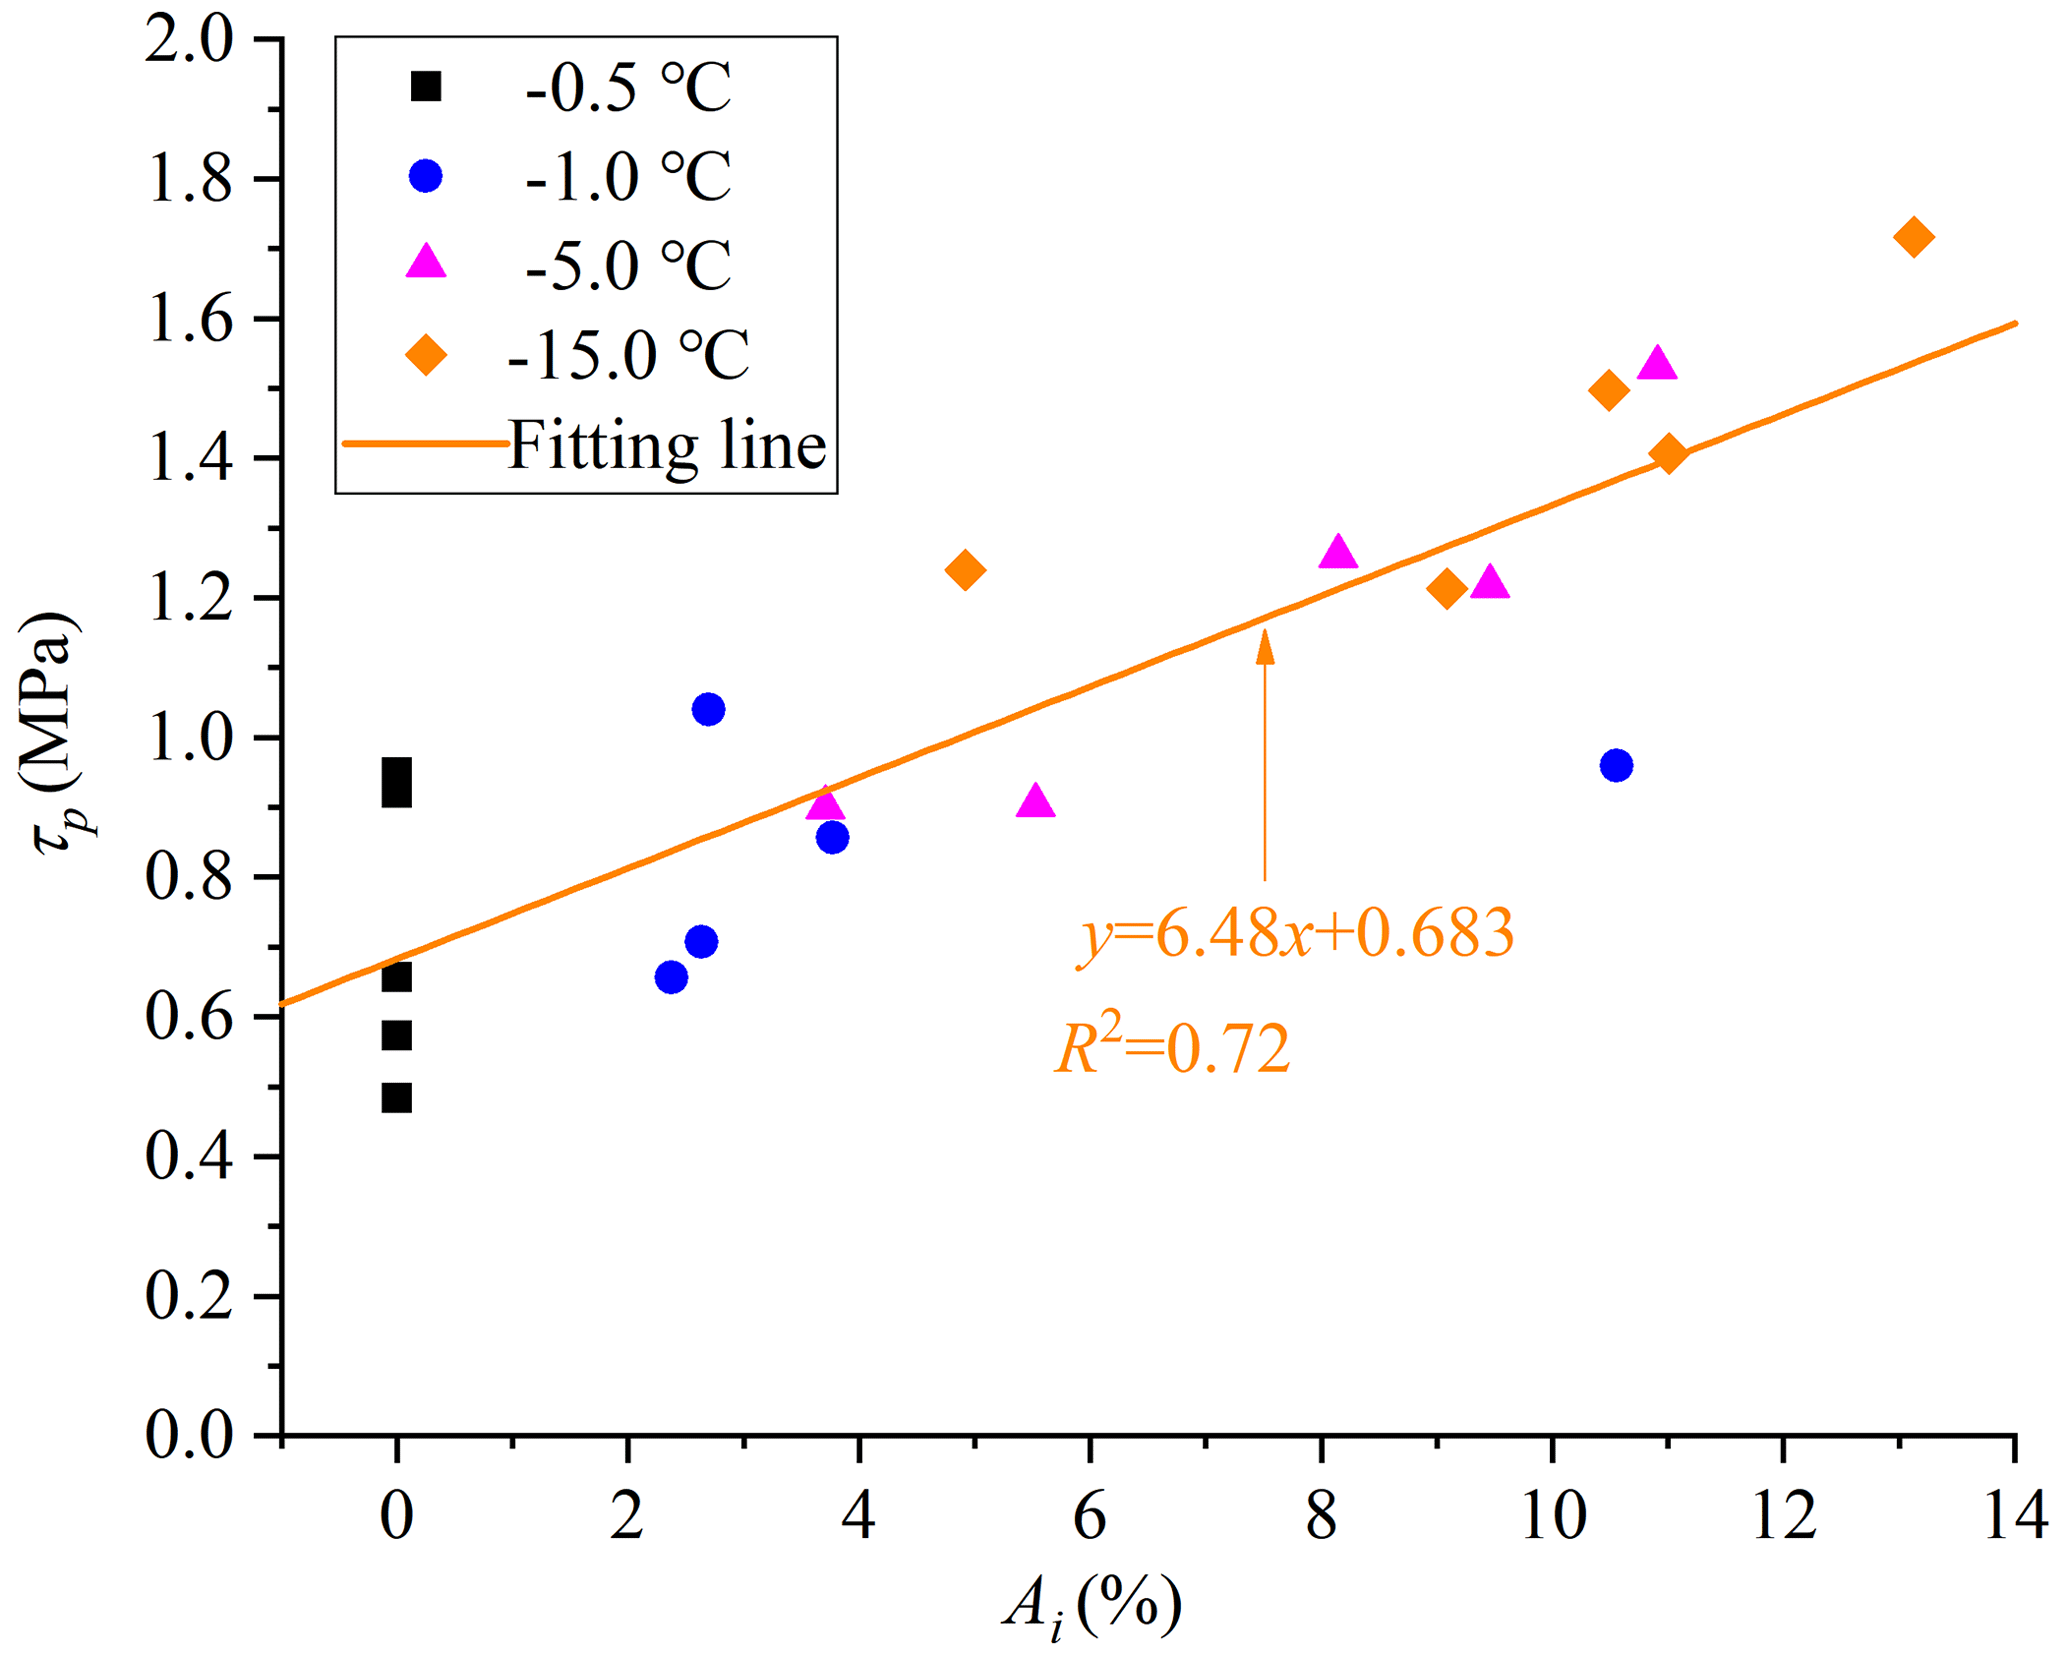
Figure 10Peak shear strength linearly increases with increasing aggregation areas of rupture ice. Experimental conditions: v = 0.2 mm min−1, d = 2 mm and σn = 0.5 MPa.
3.2 Effect of shear rates
The shear rates have significant effects on the strength of solid ice as observed in the previous literature (Petrovic, 2003). Low shear rates are used to conduct quasi-static shear experiments, including 0.2, 0.4 and 0.8 mm min−1. Figure 11 shows that the peak shear strength slightly decreases with increasing shear rates. Solid ice is a kind of typical elasto-plastic material. When the shear rate is slow, the ice crystal has enough time to shear slip, and it presents ductile failure characteristics. At a low shear rate, the free water on the slip interface reorganizes at the water–ice interface to form ice; however, it is hard for the ice crystal to adjust to the shear slip at high shear rates, which causes the shear rupture of ice crystals and hinders the growth of ice on the water–ice interface (Luo et al., 2019). Mamot et al. (2018) claimed that a high strain rate of 10−3 s−1 can induce brittle failure of ice and rock–ice contacts. At a lower shear rate, the stress concentration inside infilled ice can be relaxed, and it changes to ductile creep deformation. Fukuzawa and Narita (1993) held that the brittle–ductile transition of ice under the shear process occurs around the strain rate of 10−4 s−1. Here, the shear displacement rate is from 0.2 to 0.8 mm min−1, corresponding to the strain rates from 1.67 × 10⁻³ to 6.67 × 10⁻³ s−1. Therefore, the shear rate in this study is very close to the threshold of the brittle–ductile transition given in the previous literature. Figure 12 shows that a high shear rate induces brittle failure of joint ice, and more fragmented ice crystals are produced. As a result, the shear strength reduces with increasing shear rates from 0.2 to 0.8 mm min−1. In this study, the exact shear rate for the brittle and ductile transition of ice-filled joints is not accurately determined due to the limitation of the shear rate range. Furthermore, shear experiments should be carried out on the ice and ice-filled joints by adopting a larger range of the shear rate.
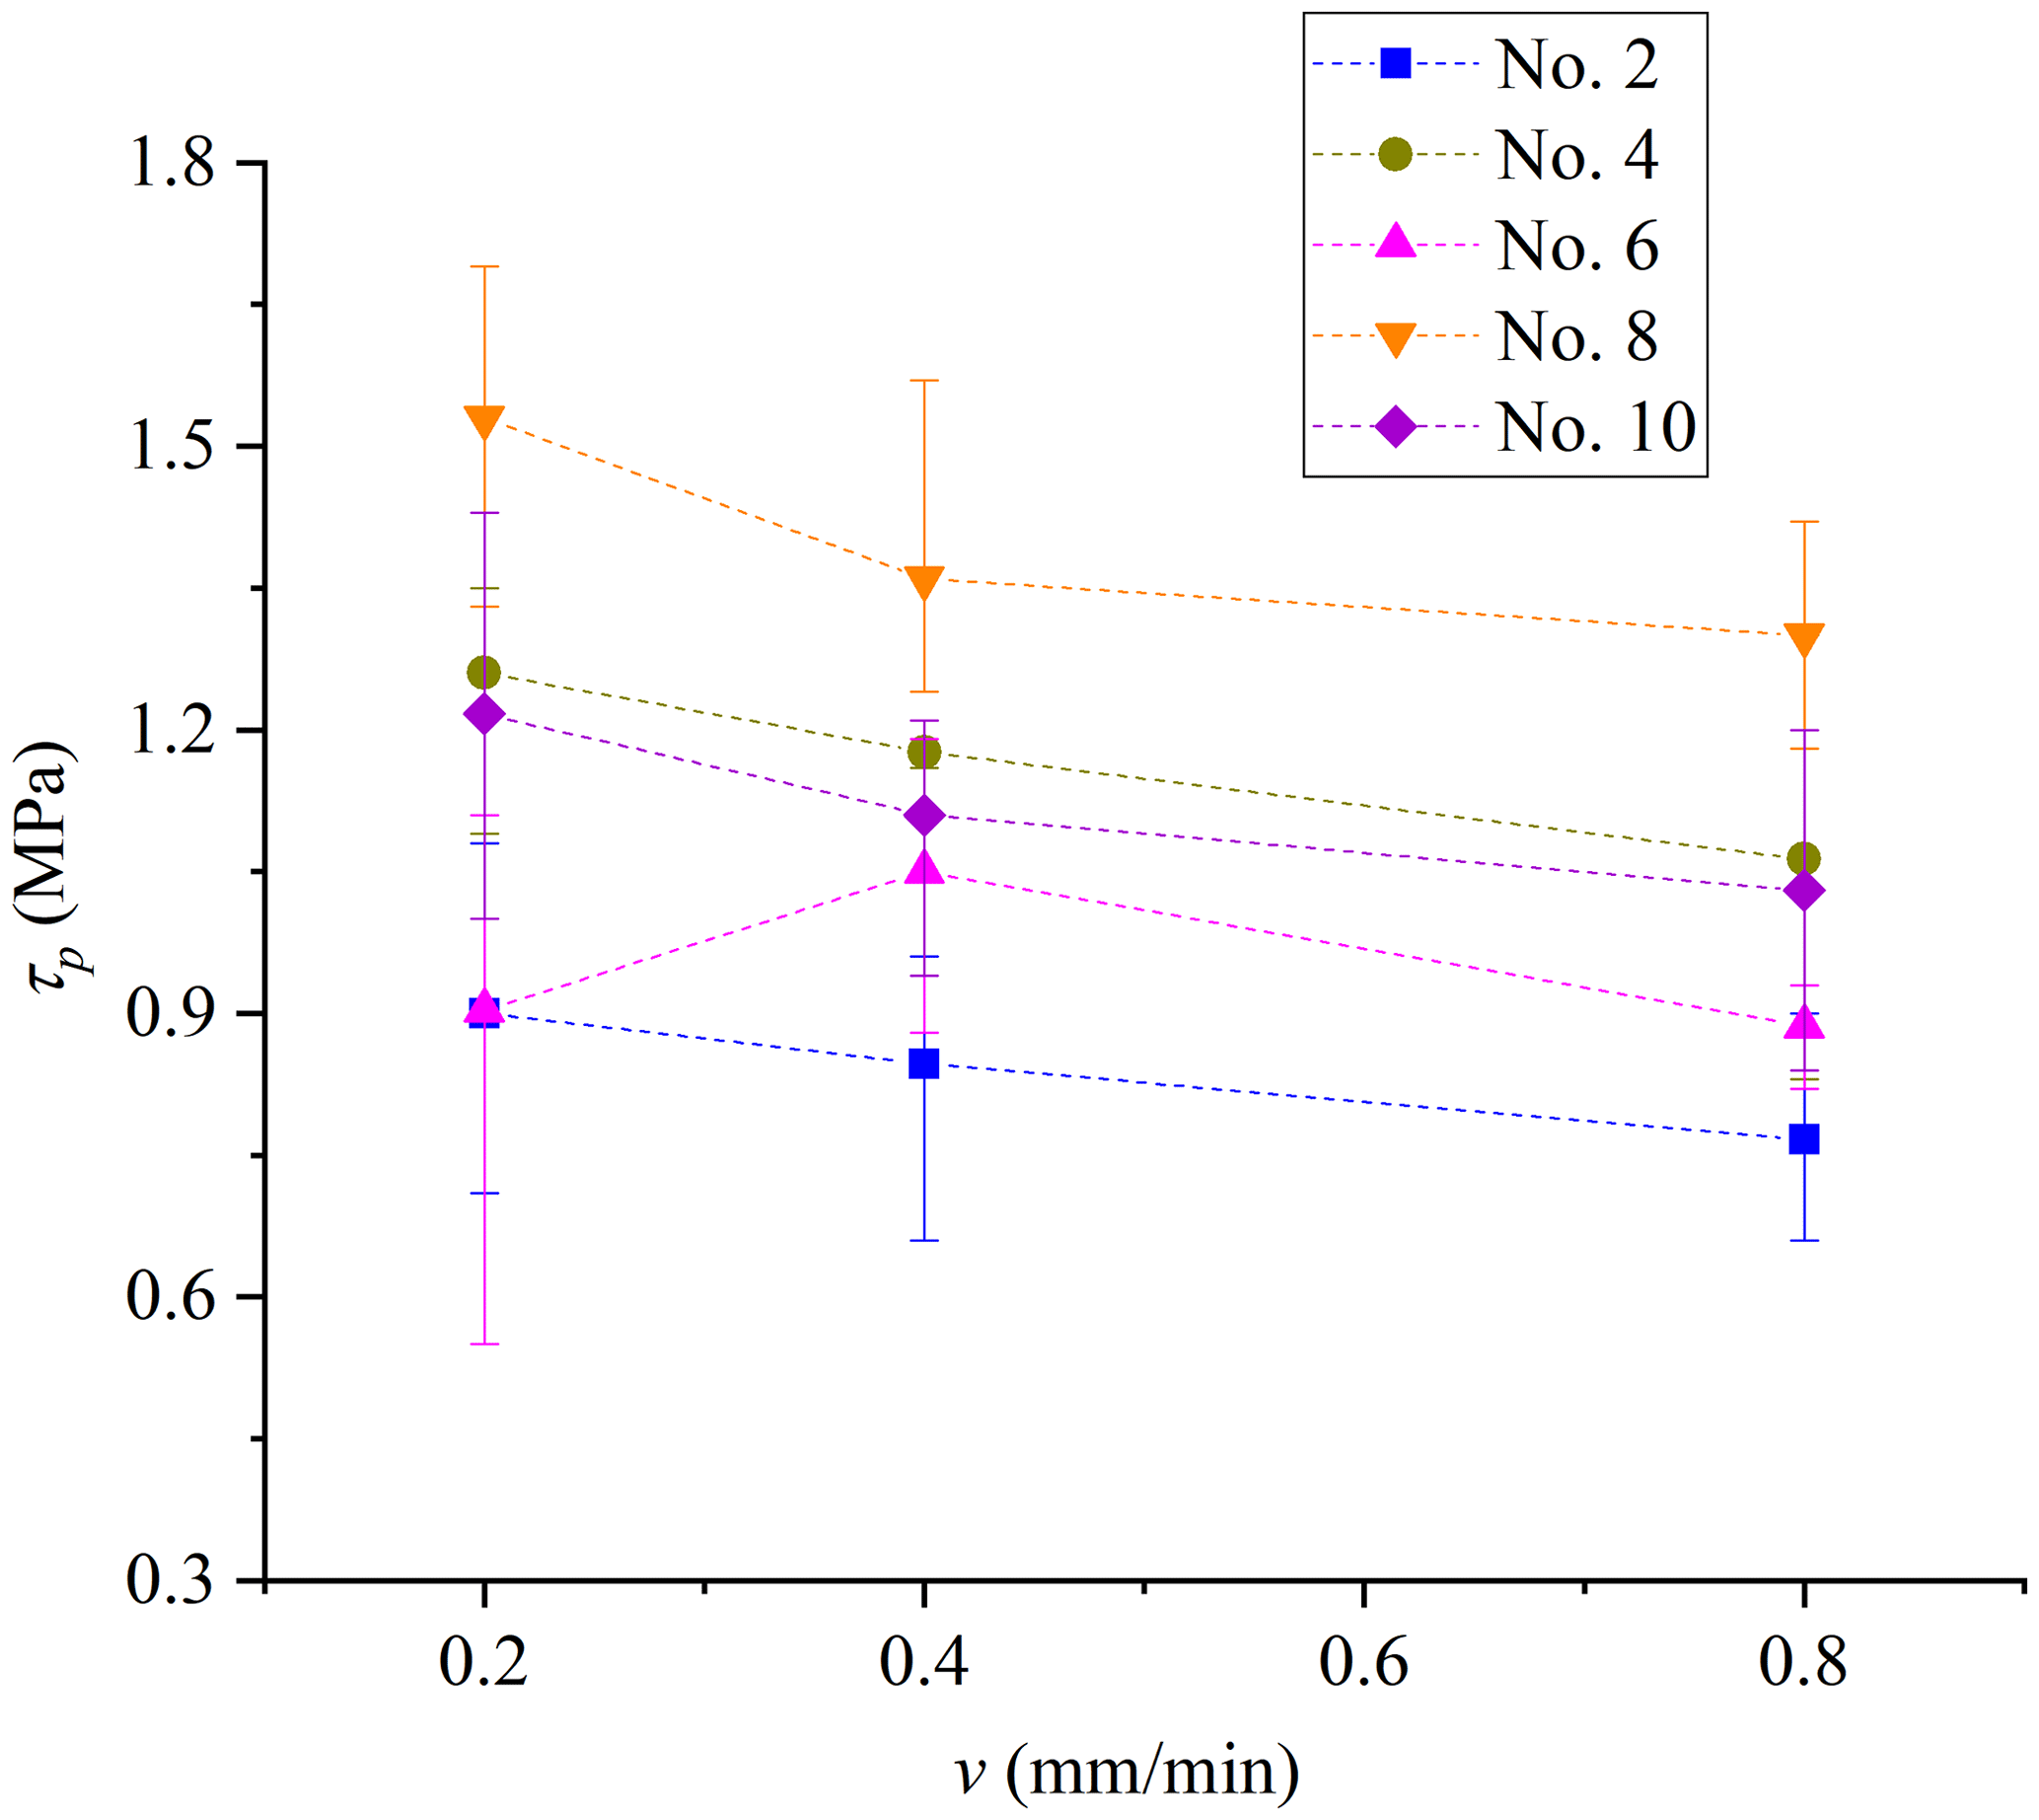
Figure 11Effect of shear rate on the peak shear strength. Experimental conditions: T = −5 ∘C, d = 2 mm and σn = 0.5 MPa.
3.3 Effect of joint openings
Joint opening is another critical factor influencing the shear strength of ice-filled joints, which is defined as the vertical distance between the upper and lower blocks. The standard JRC curves are suggested by Barton and Choubey (1977). We tested that the maximum height difference of the standard JRC curves is approximately 2.14, 2.40, 6.24, 6.85 and 4.48 mm for profile no. 2, no. 4, no. 6, no. 8 and no. 10, respectively. The joint openings are chosen as 2, 8 and 14 mm, because 2 mm is smaller than all the maximum height differences, while 14 mm is much larger than them. The rupture characteristics of joint ice against the joint opening are plotted in Fig. 13. When the joint opening is 2 mm, the aggregation phenomenon of rupture ice is evident. However, the aggregation phenomenon disappears for profile no. 2, no. 4 and no. 6 when the joint opening is 8 mm. When the joint opening increases to 14 mm, there is not any aggregation of rupture ice arising for all the joints. Figure 14 shows that when the joint opening increases from 2 to 14 mm, the shear strength of ice-filled joints decreases. The shear strength of pure solid ice is also measured in the laboratory, which is approximately 0.83 MPa, under conditions T = −5 ∘C, v = 0.2 mm min−1 and σn = 0.5 MPa. When the joint opening is 14 mm, the shear strengths of ice-filled joints are approximately 0.83 MPa, and they are independent of the joint roughness. When the joint opening is 8 mm, the shear strengths of ice-filled joints are very close to the shear strength of pure solid ice (0.83 MPa) for the joint of profile no. 2, no. 4 and no. 6. The reason is that 8 mm exceeds the critical filling thickness of these joints (no. 2, no. 4 and no. 6); therefore, the shear strength of these ice-filled joints is only controlled by the solid ice instead of joint roughness. In addition, there is not any significant ice aggregation on the joint surfaces of no. 2, no. 4 and no. 6 when the joint opening is 8 mm, and the shear failure happens inside the joint ice. However, for the ice-filled joints of no. 8 and no. 10, the shear strengths are larger than 0.83 MPa, which illustrates that the critical filling thickness for profile no. 8 and no. 10 should be larger than 8 mm but smaller than 14 mm. Ice aggregation arises before large bulges, and these large bulges prevent the direct shear failure of joint ice and improve the shear strength.
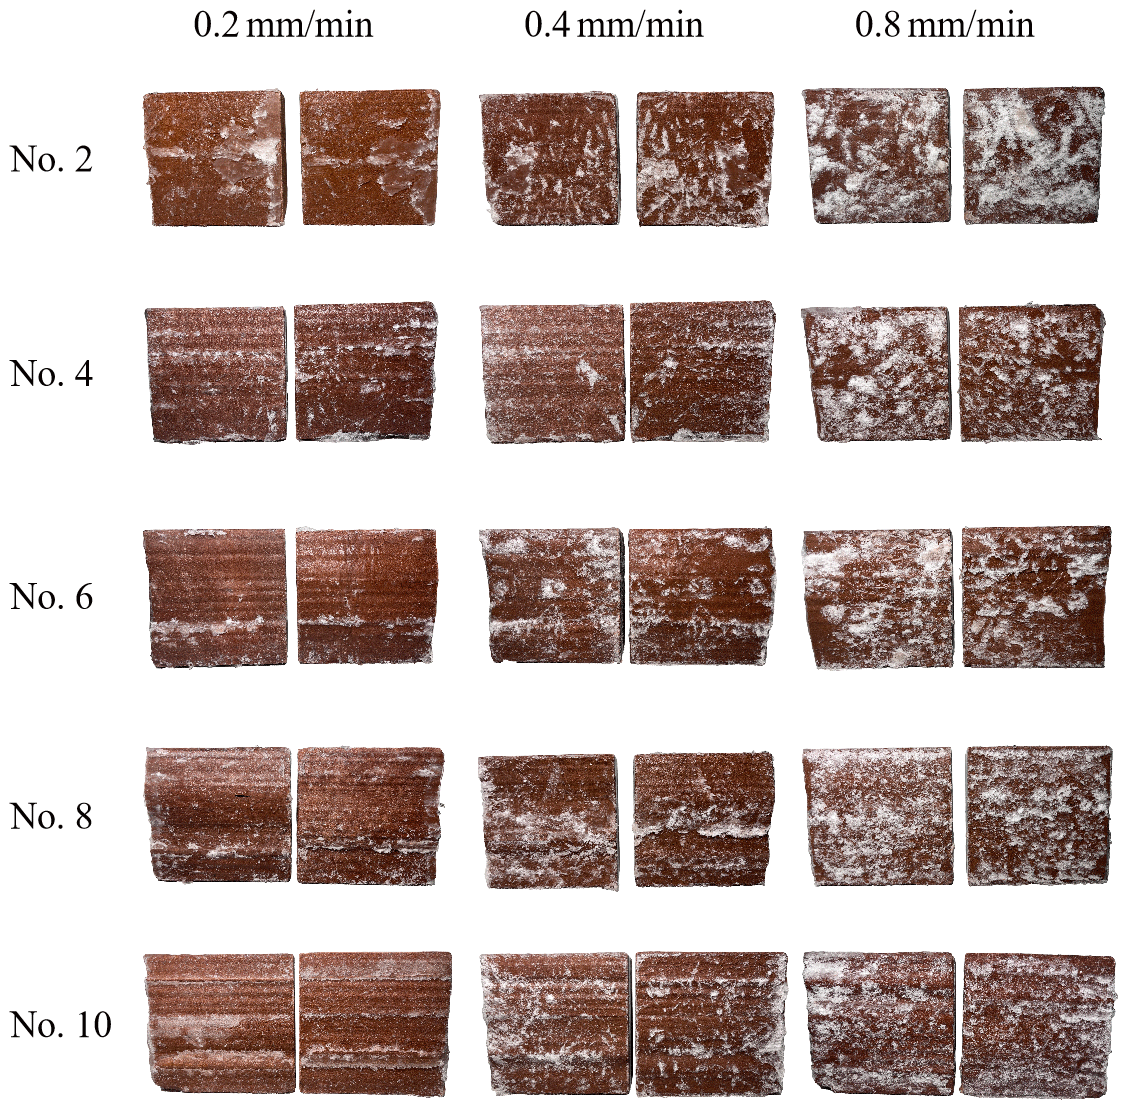
Figure 12The shear rupture characteristics of joint ice under different shear rates. Experimental conditions: T = −5 ∘C, d = 2 mm and σn = 0.5 MPa. The ice crystal that cannot adapt to shear slip at high shear rates induces brittle failure. The joint ice of brittle failure shows more micro-fractures, which make it more reflective. This causes a white appearance of the rupture ice on the joint surface. The ductile failure of ice displays a transparent appearance without a white color, which is hard to observe. Therefore, a larger area of white appearance implies a much more serious brittle failure of joint ice.
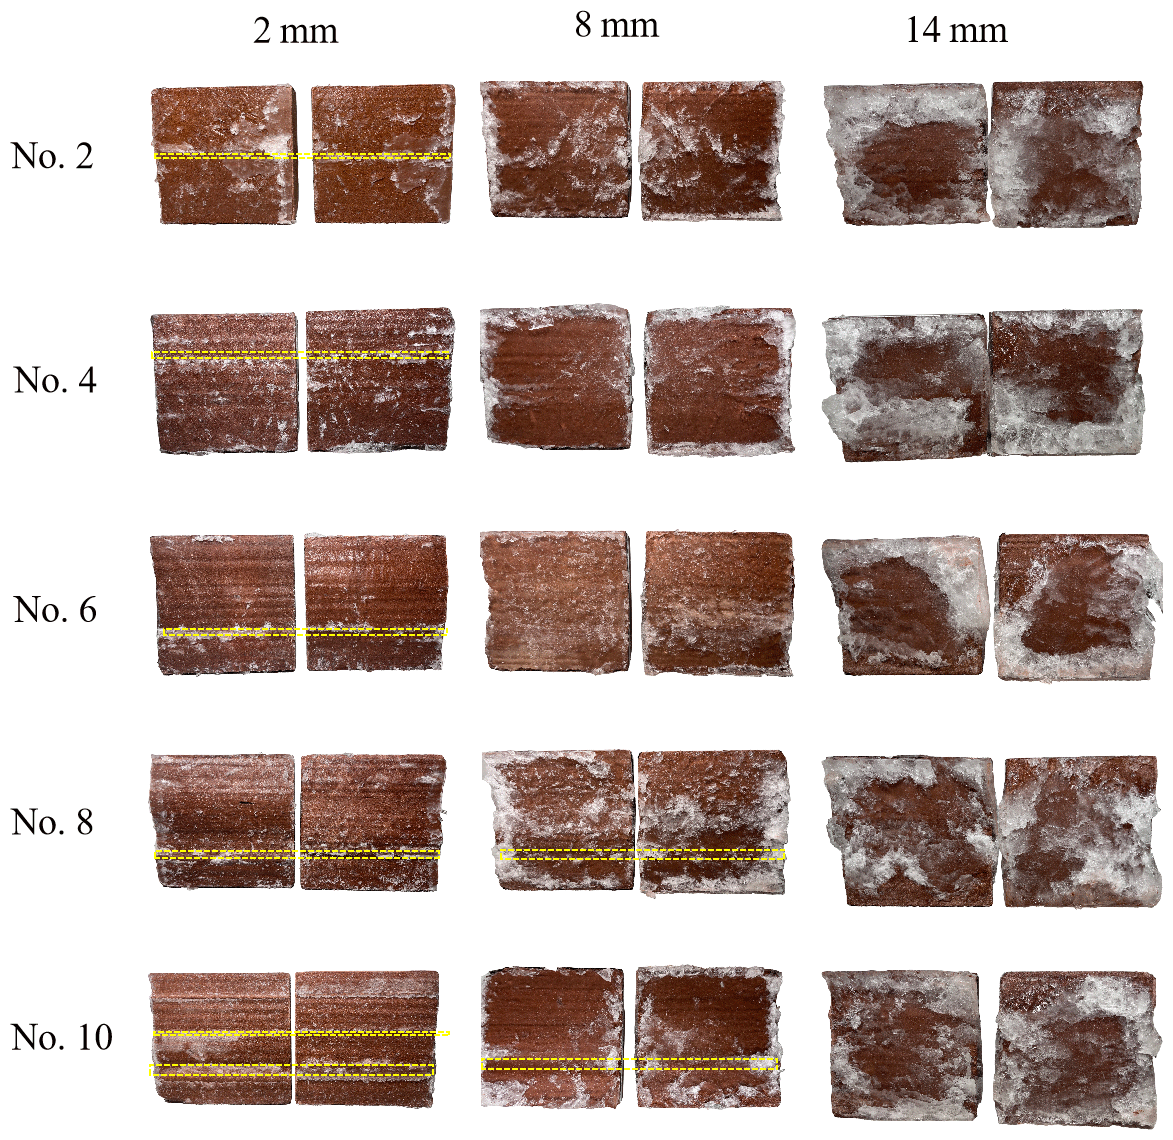
Figure 13The shear rupture characteristics of ice-filled joints with different openings. Experimental conditions: T = −5 ∘C, d = 2 mm and σn = 0.5 MPa. The yellow lines show the main aggregation of rupture ice. Ice after rupture aggregates in roughness bulges perpendicular to the shear direction. The aggregation phenomenon disappears as the joint openings increase. The aggregation phenomenon of profile no. 2, no. 4 and no. 6 disappears in 8 mm joint openings. All profiles' aggregation phenomena disappear in 14 mm joint openings.
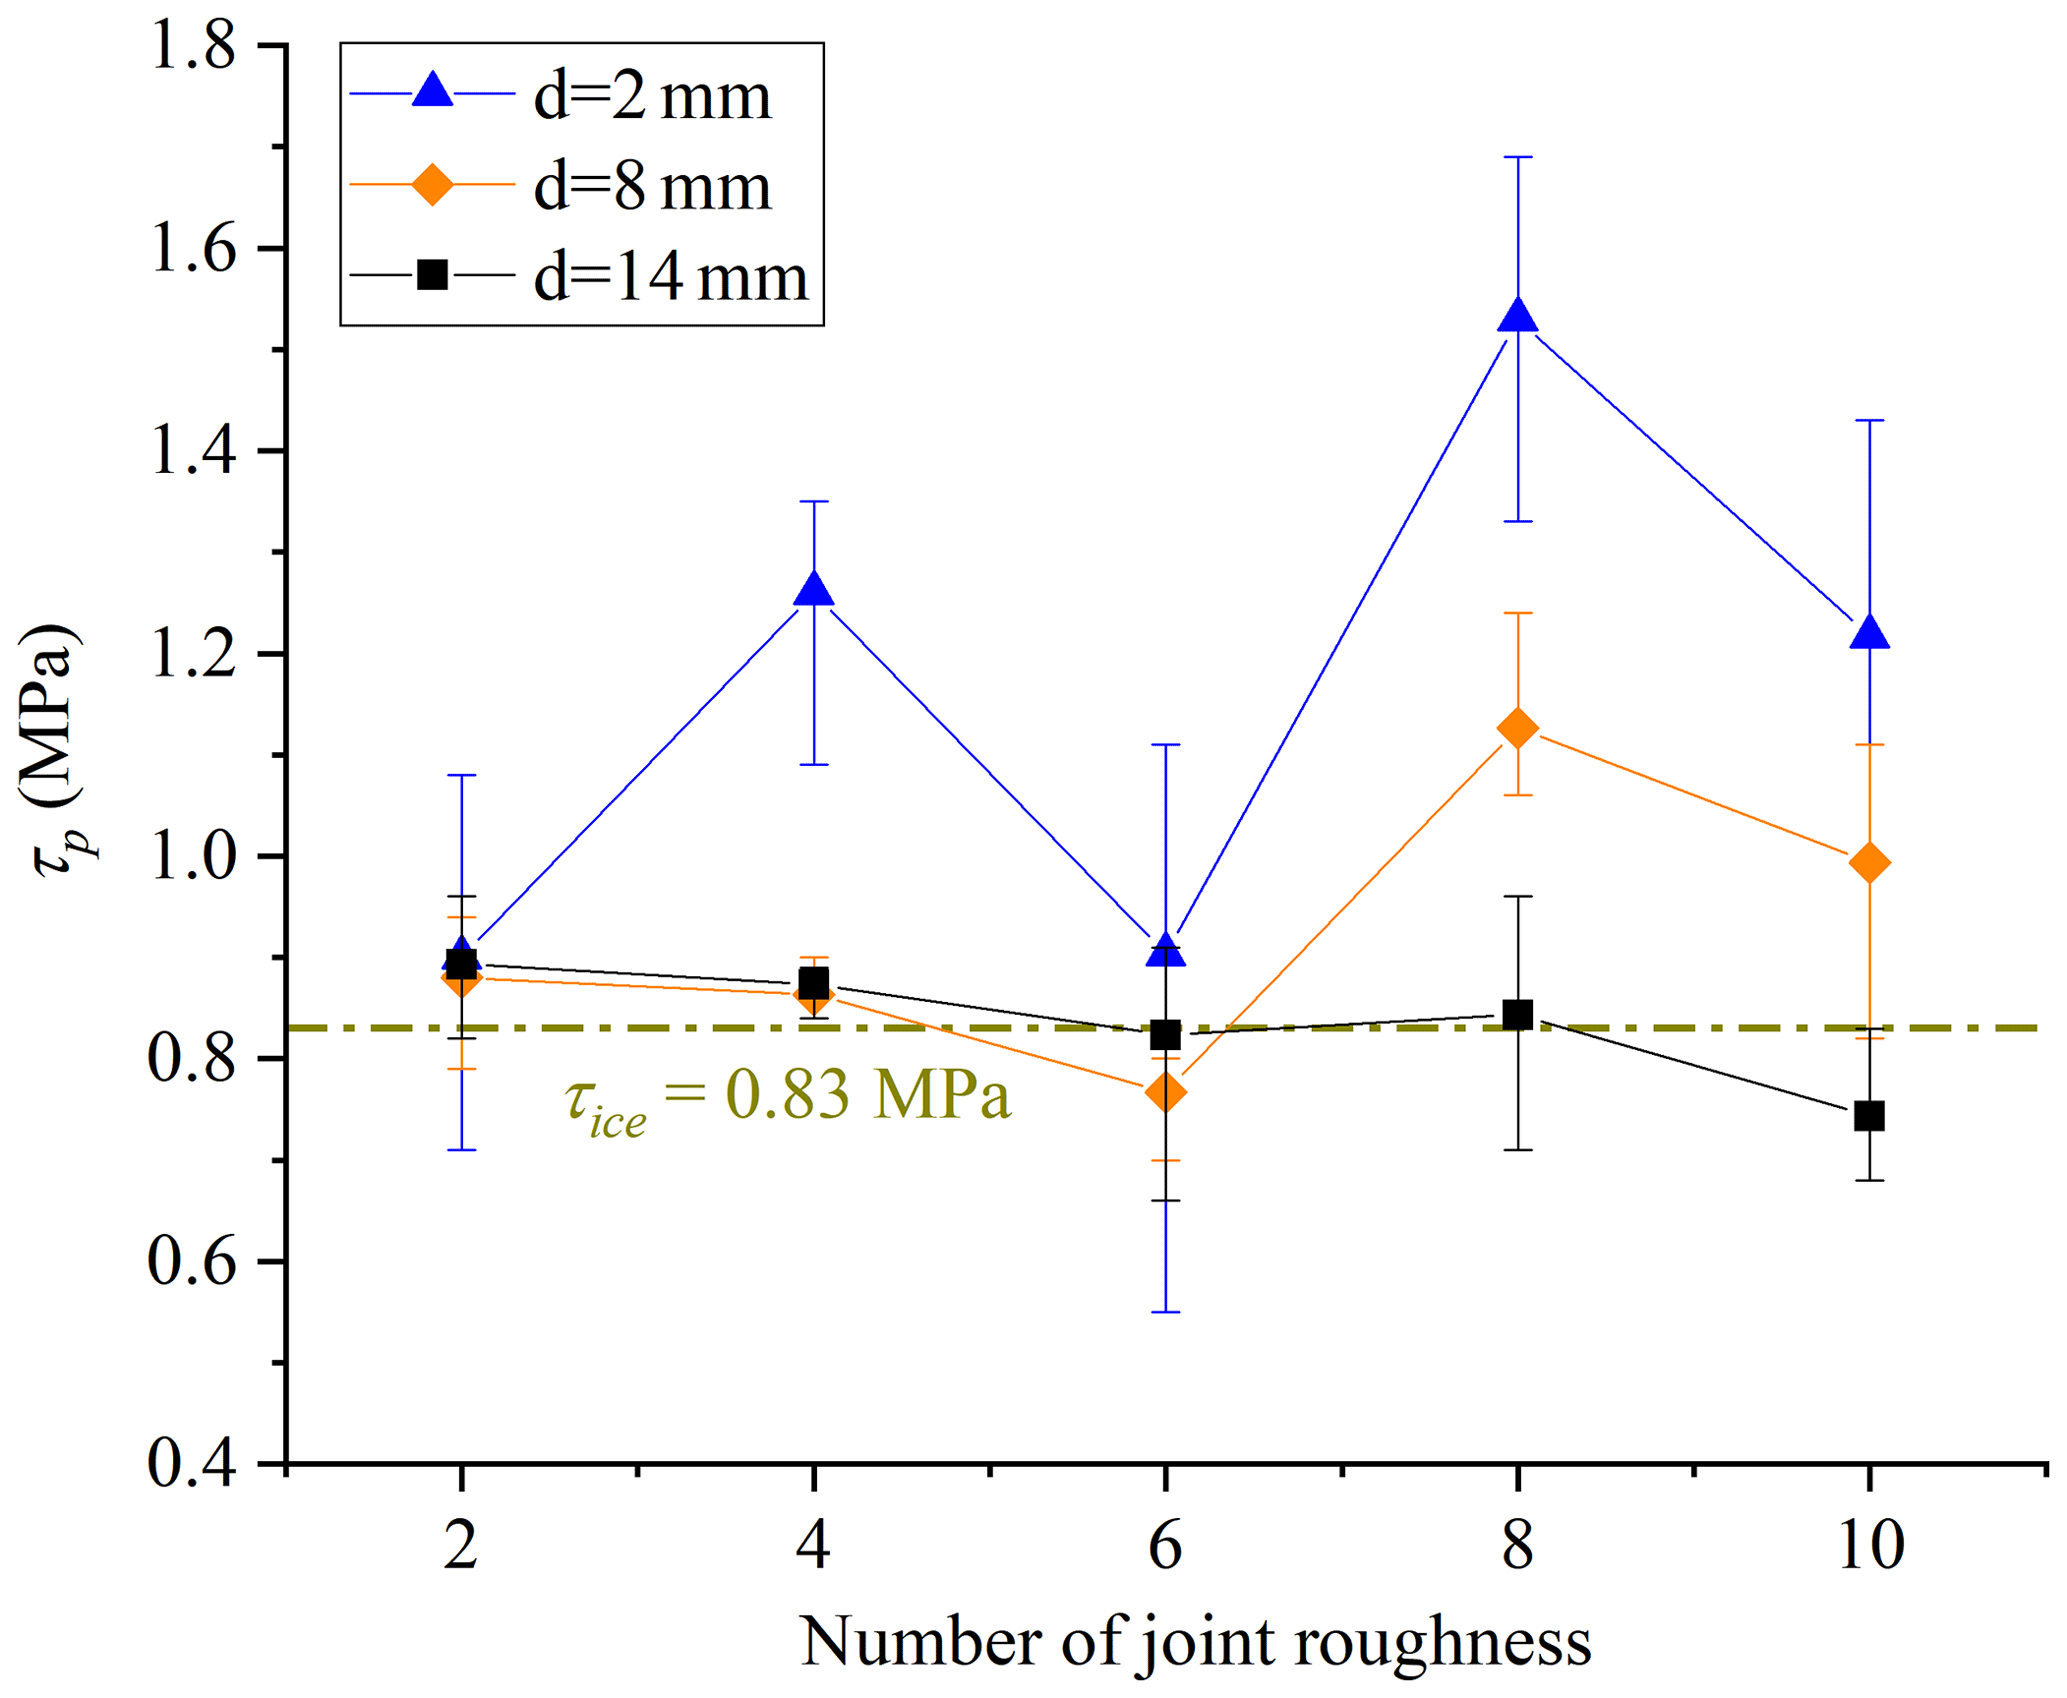
Figure 14Effect of joint opening on the peak shear strength. Experimental conditions: T = −5 ∘C, v = 0.2 mm min−1 and σn = 0.5 MPa.
The influence of joint opening and roughness on the shear strength can be explained by using the shear failure path of ice-filled joints as shown in Fig. 15. When d = 2 mm, the shear climbing occurs before some large bulges for all the joint profiles. This climbing action induces the aggregation of rupture ice and change of shear path. As a consequence, the shear strength improves. When d = 8 mm, the shear failure path is not disturbed for profile no. 2, no. 4 and no. 6; however, the shear failure path changes due to the climbing action for profile no. 8 and no. 10, in which a significant aggregation of rupture ice is produced. Therefore, the shear strengths of ice-filled joints for profile no. 2, no. 4 and no. 6 are approximately equal to the solid ice, while the shear strengths for profile no. 8 and no. 10 are much larger than 0.83 MPa. When d = 14 mm, the shear failure happens inside the joint ice for all joint profiles; therefore, the shear failure path and shear strength are not influenced by the joint roughness, and no aggregation of rupture ice occurs. The shear dilatancy deformation of the ice-filled joints in Fig. 16 has further proved the climbing actions, including all the profiles with a joint opening of 2 mm, as well as profile no. 8 and no. 10 with a joint opening of 8 mm. The climbing effect of the profile no. 2 ice-filled joint with an opening of 2 mm is not remarkable; therefore, the shear dilatancy is very small, and the shear strength is also close to pure solid ice (0.83 MPa). Regardless of the critical filling thickness, the present study shows that the shear strength of ice-filled joints decreases with increasing joint openings from 2 to 14 mm, and it is related to the joint roughness below the critical infilled thickness. When the filling ice exceeds the critical thickness, the shear strength of ice-filled joints is equal to the shear strength of solid ice under the same condition. It should be noted that the critical filling thickness for each roughness will be determined in future studies.
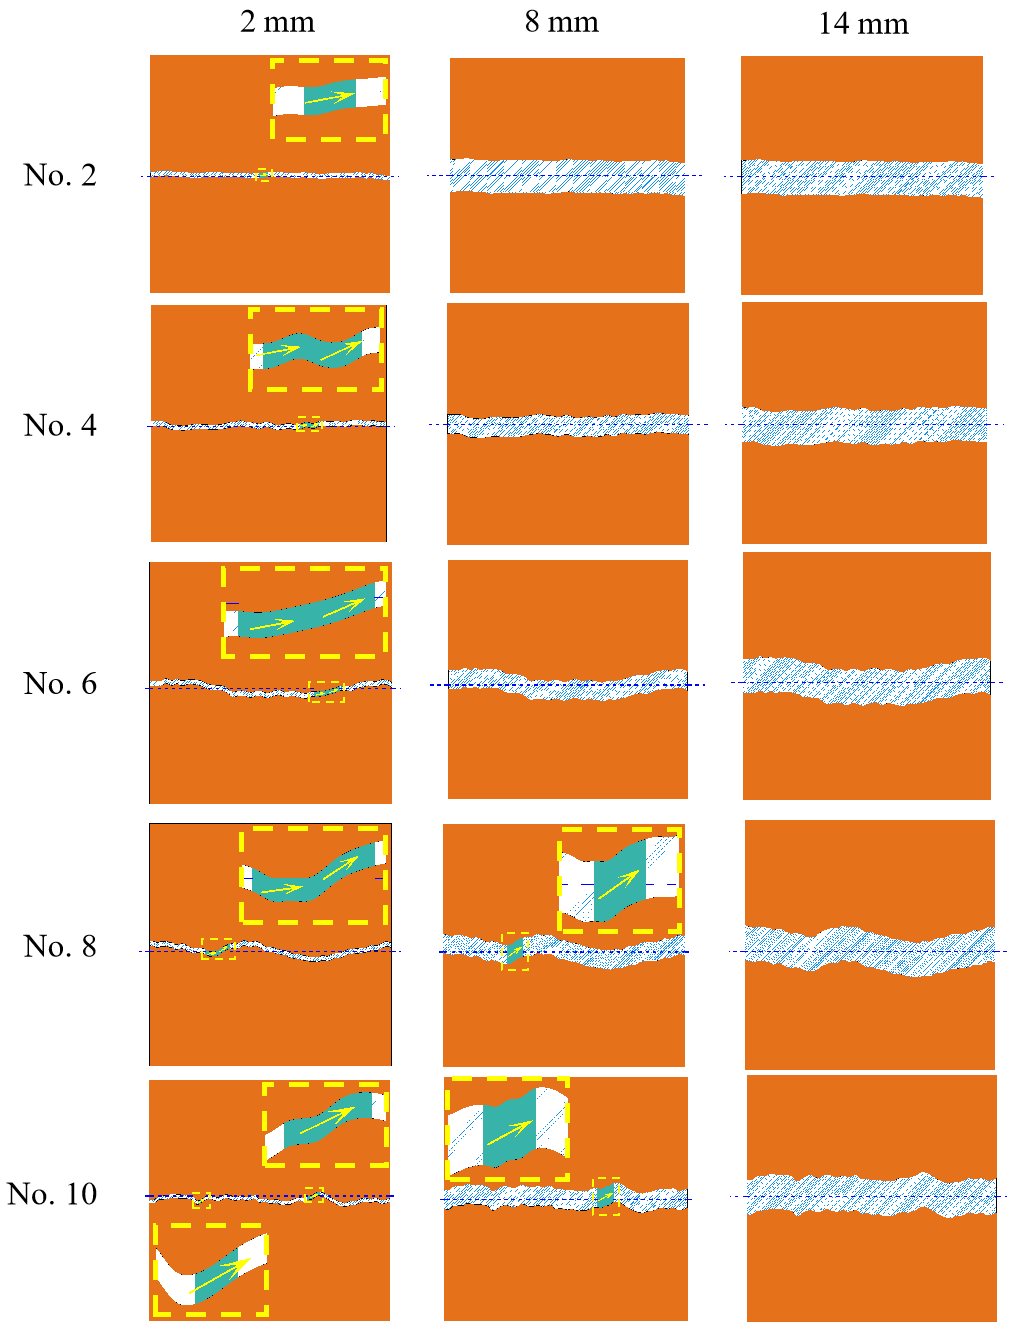
Figure 15Influence of joint roughness on the shearing slip path. Experimental conditions: T = −5 ∘C, v = 0.2 mm min−1 and σn = 0.5 MPa.
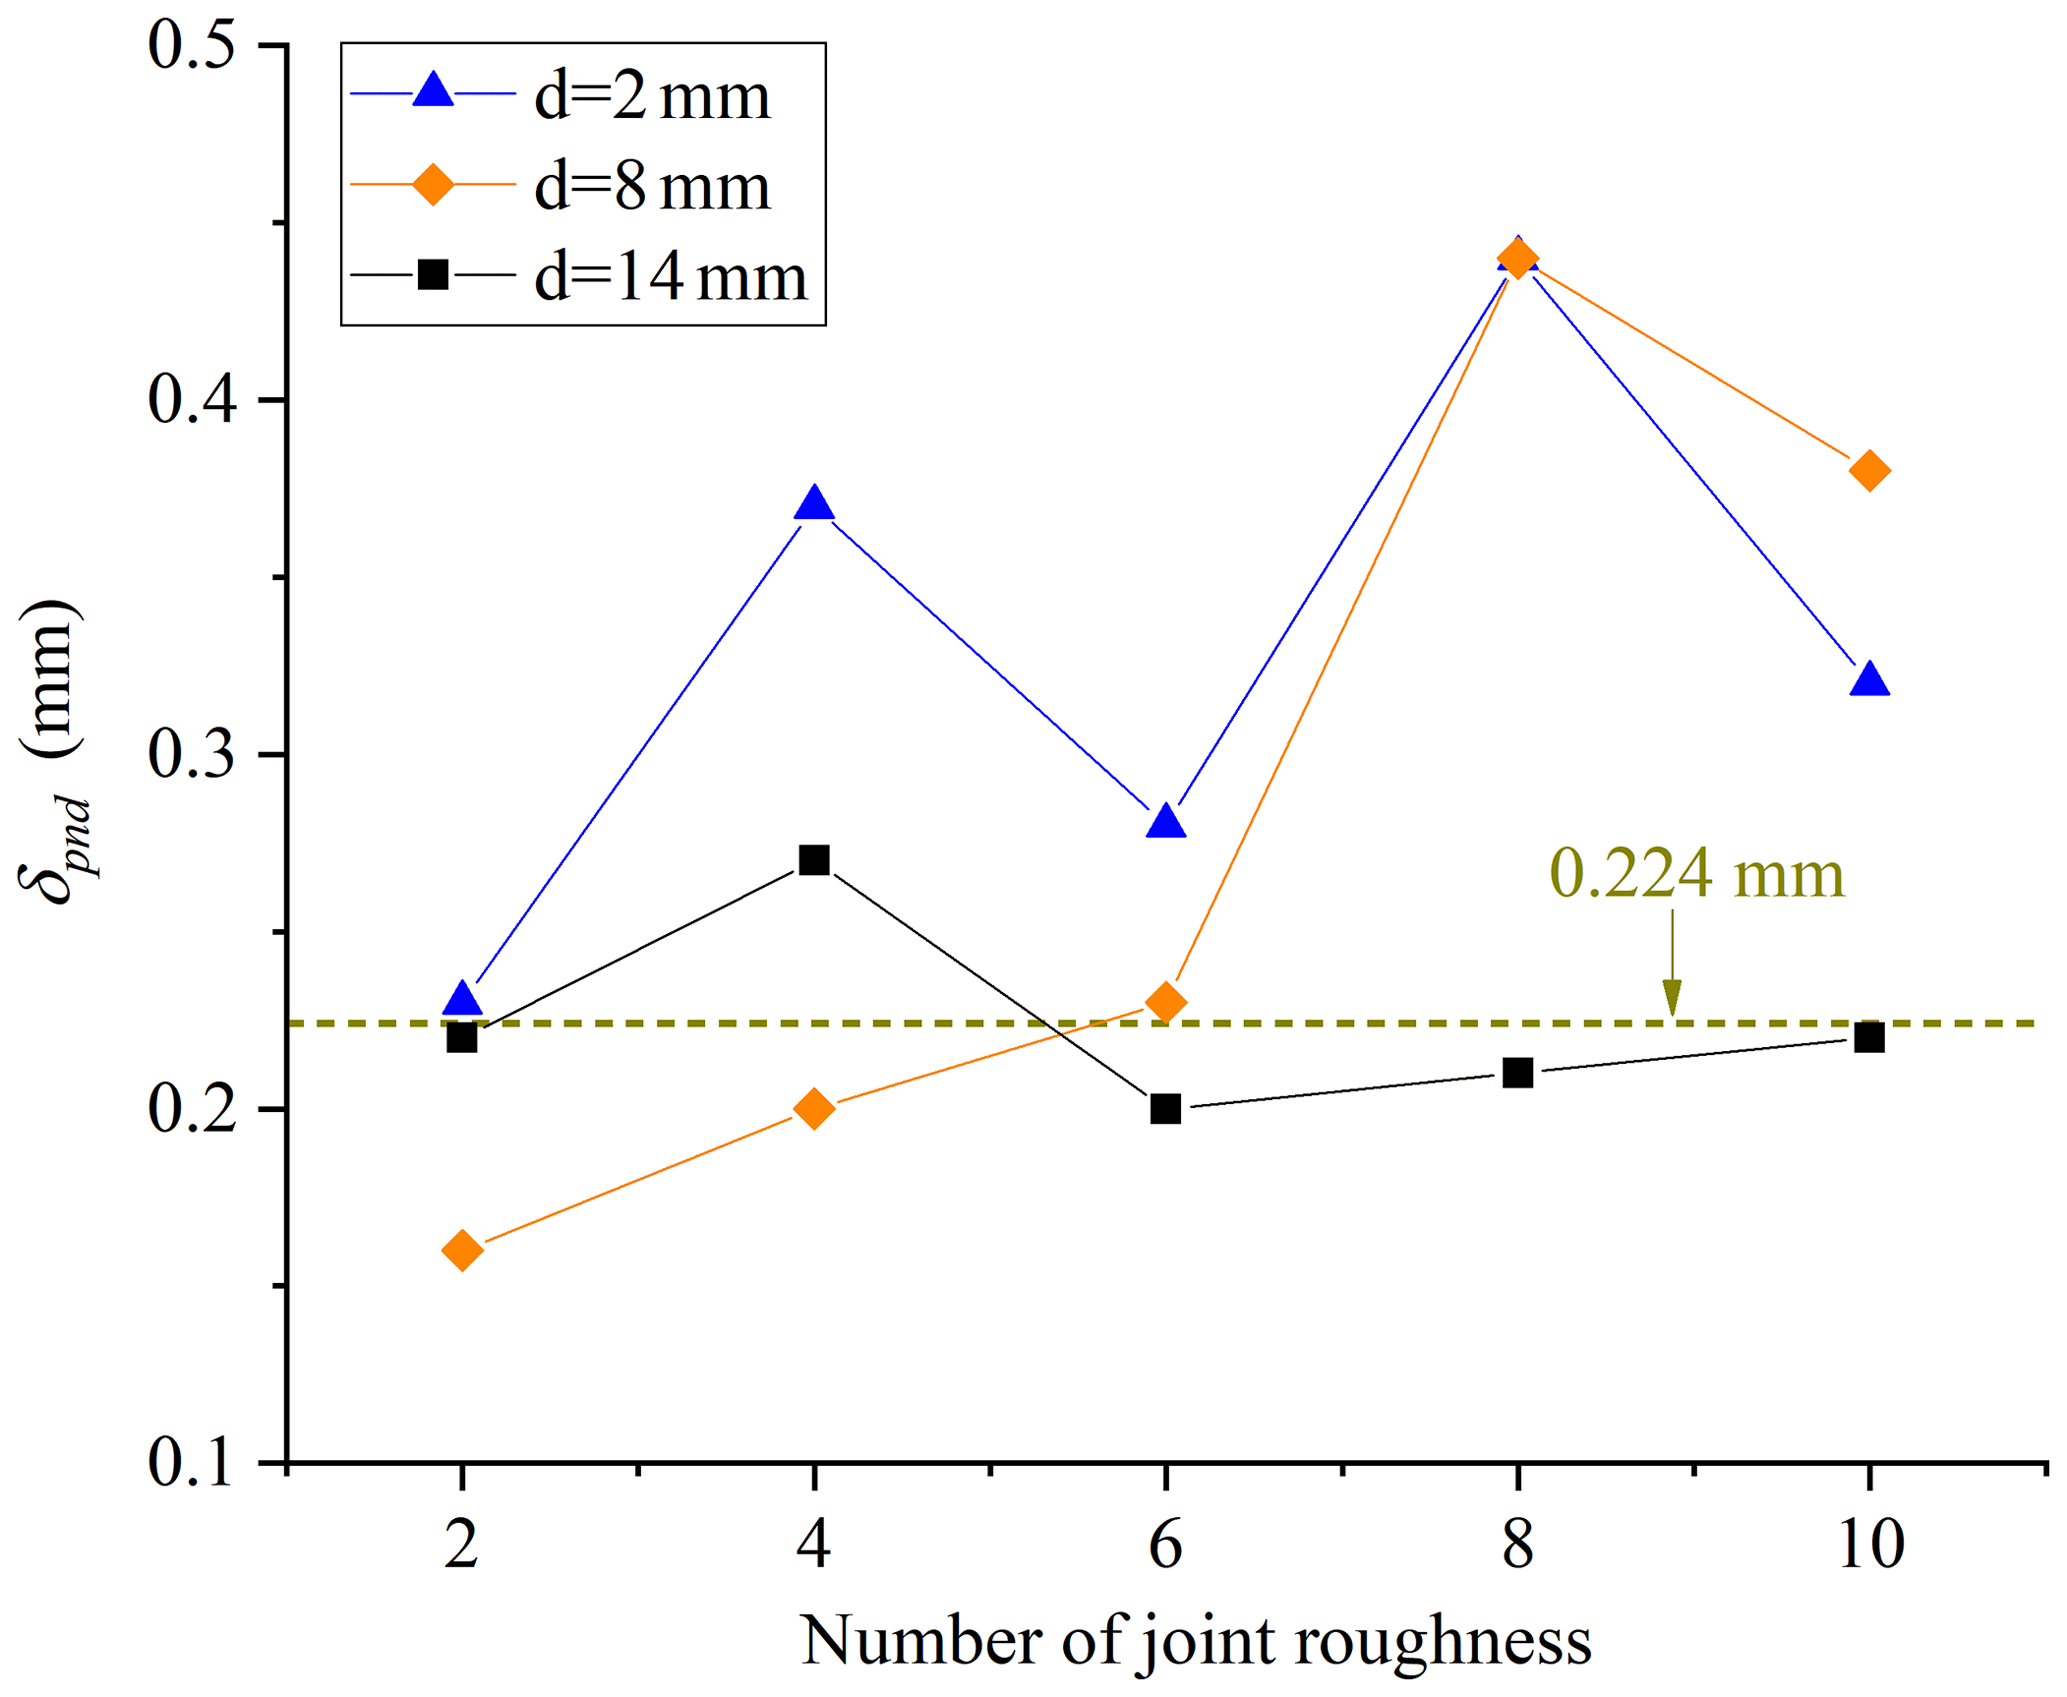
Figure 16Effect of joint opening on the shearing dilatancy. Experimental conditions: T = −5 ∘C, v = 0.2 mm min−1 and σn = 0.5 MPa.
3.4 Effect of normal stress
The normal stress group was used to investigate the effect of normal stress on the shear strength of ice-filled joints, including 0, 0.5, 1.0, 1.5 and 2.0 MPa. The shear strength of ice-filled joints displays a significant increasing trend with increasing normal stress (Fig. 17). The Mohr–Coulomb criterion may be used to express the relationship between the shear strength and normal stress as below:
where τp is the shear stress on the plane, σn is the normal stress on the plane, cj is the cohesion of ice-filled joints and ϕj is the internal friction angle of ice-filled joints.
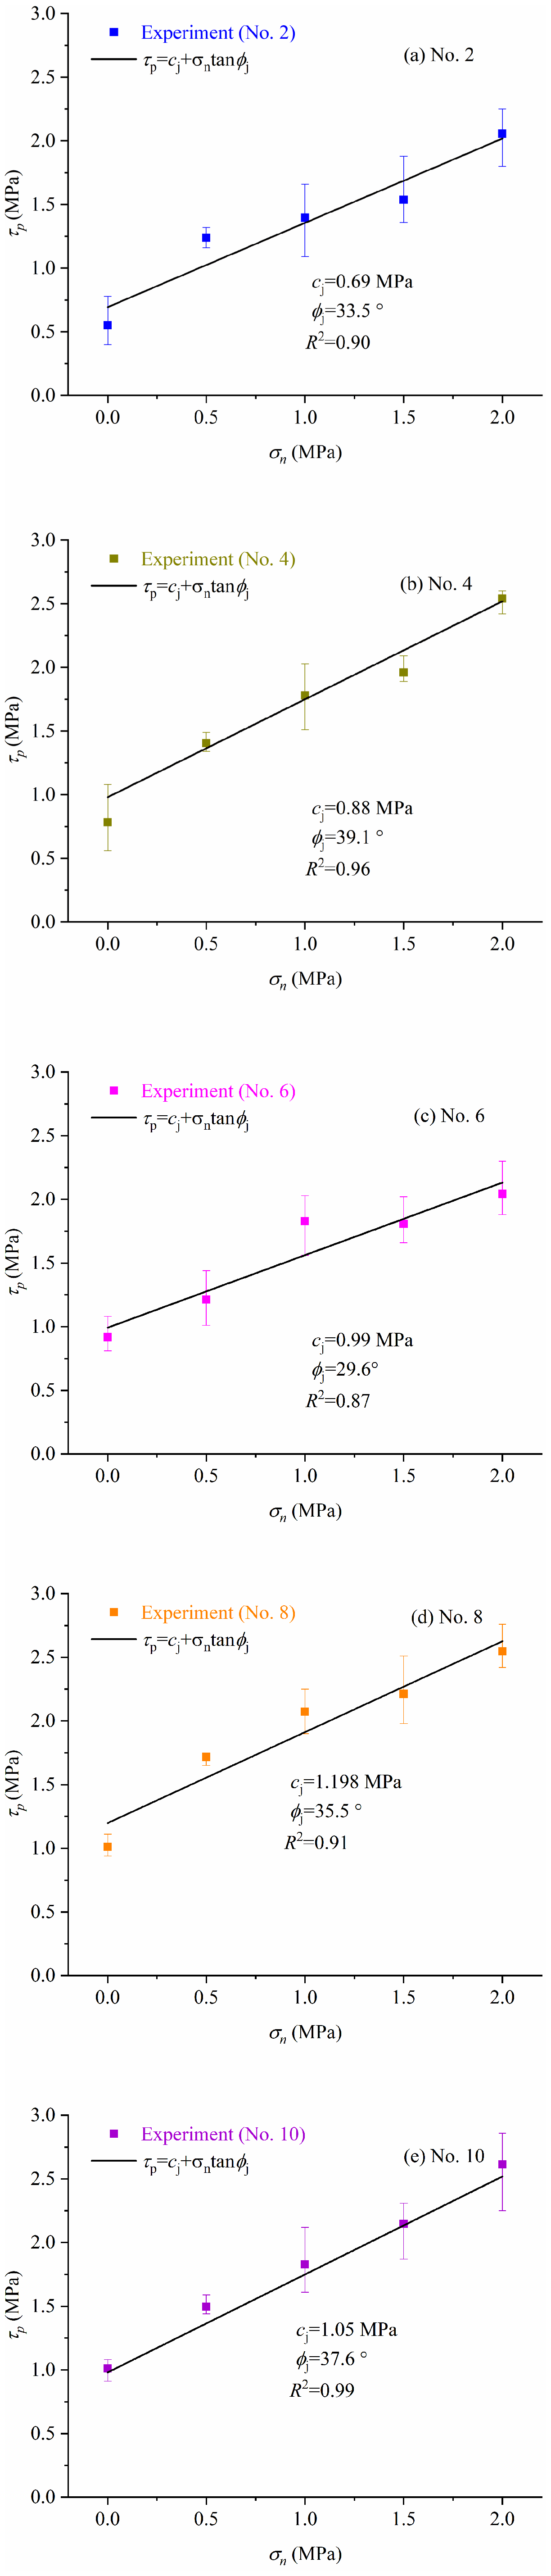
Figure 17Effect of normal stress on the peak shear strength of ice-filled joints. Experimental conditions: T = −15 ∘C, v = 0.2 mm min−1 and d = 2 mm.
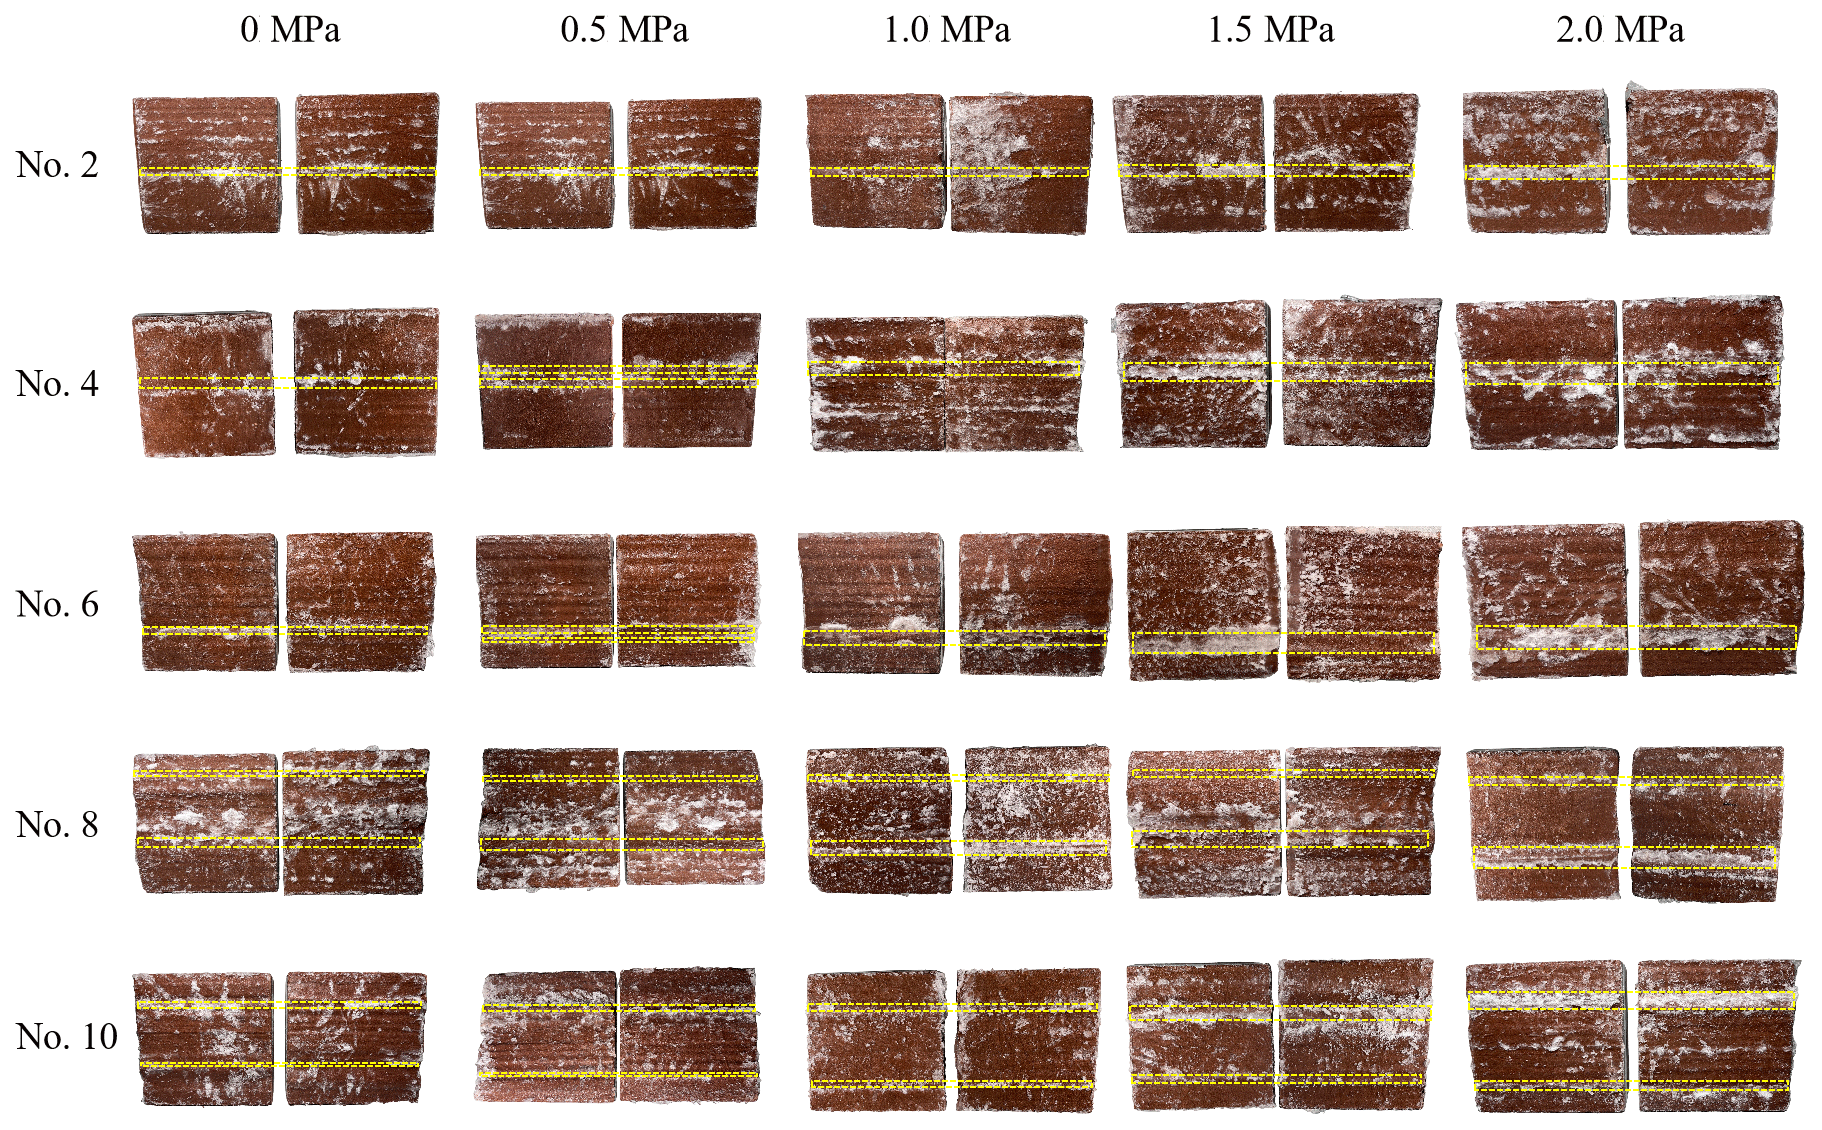
Figure 18Aggregation of rupture ice under different normal stresses. Experimental conditions: T = −15 ∘C, d = 2 mm and v = 0.2 mm min−1. The yellow lines show the main aggregation of rupture ice.
Figure 17 shows that the Mohr–Coulomb criterion can be used to calculate the shear strength of ice-filled joints against the normal stress. The shear rupture modes of the joint ice are given in Fig. 18. A remarkable ice aggregation phenomenon can be found on the surface of joints, and the aggregation occurs at a stable location of the joint profile regardless of the normal stress. The aggregation area of rupture ice increases with increasing normal stress, because noticeable bulges are harder and the solid ice is easier to crush at the front of large bulges under the higher normal stress (Fig. 19). Section 3.1 illustrates that the aggregation area of rupture ice is an important index to reflect the shear strength of ice-filled joints at different freezing temperatures. Actually, the shear strength also linearly increases with increasing aggregation area of rupture ice under different normal stress as shown in Fig. 20. This further illustrates that only some large bulges causing the aggregation of rupture ice can contribute to the improvement of shear strength instead of the total roughness index, such as the JRC index.
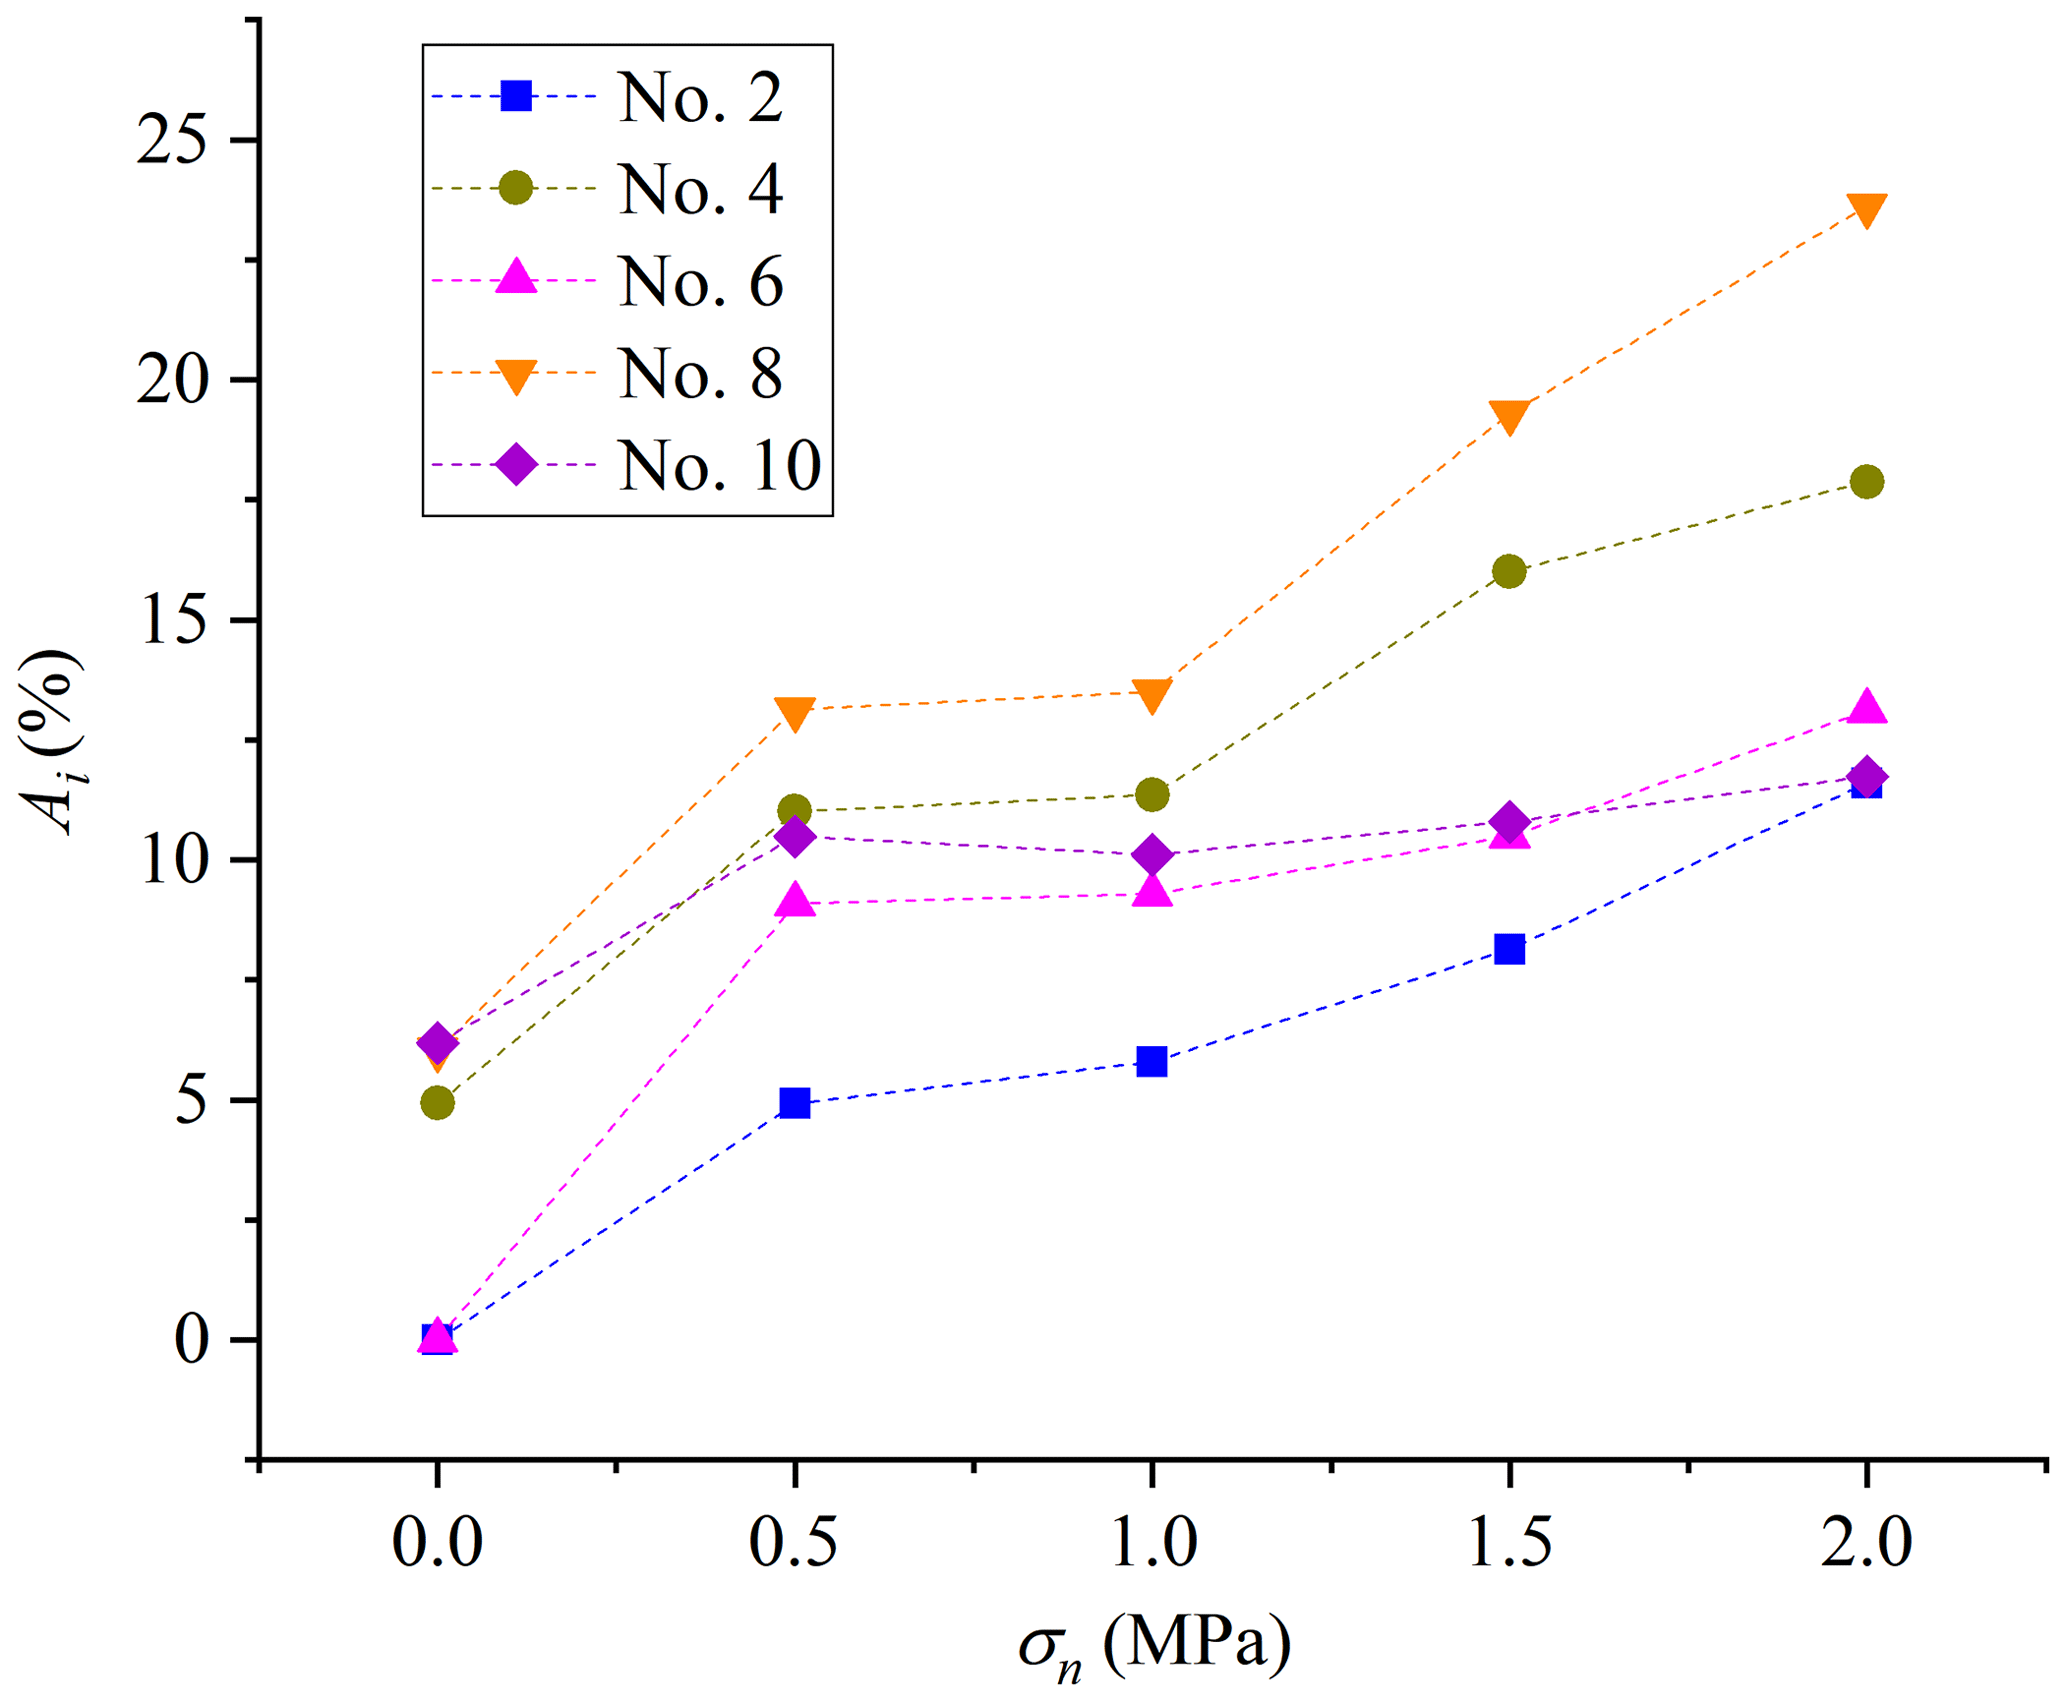
Figure 19Aggregation area of rupture ice increases with increasing normal stress. Experimental conditions: T = −15 ∘C, d = 2 mm and v = 0.2 mm min−1.
4.1 The warming degradation mechanism of ice-filled joints
This paper details the comprehensive investigation by experiments of the influence of freezing temperature, shear rate, joint opening and normal stress on the shear strength of ice-filled joints in rock masses. The shear strength remarkably reduces with increasing freezing temperature, because the shear strengths of solid ice and the ice–rock interface decrease with increasing temperature. In order to deeply understand the warming degradation mechanism of ice-filled joints, the shear strength of pure ice and the ice–rock bonding interface under different freezing temperatures was also tested in this study (Fig. 21).
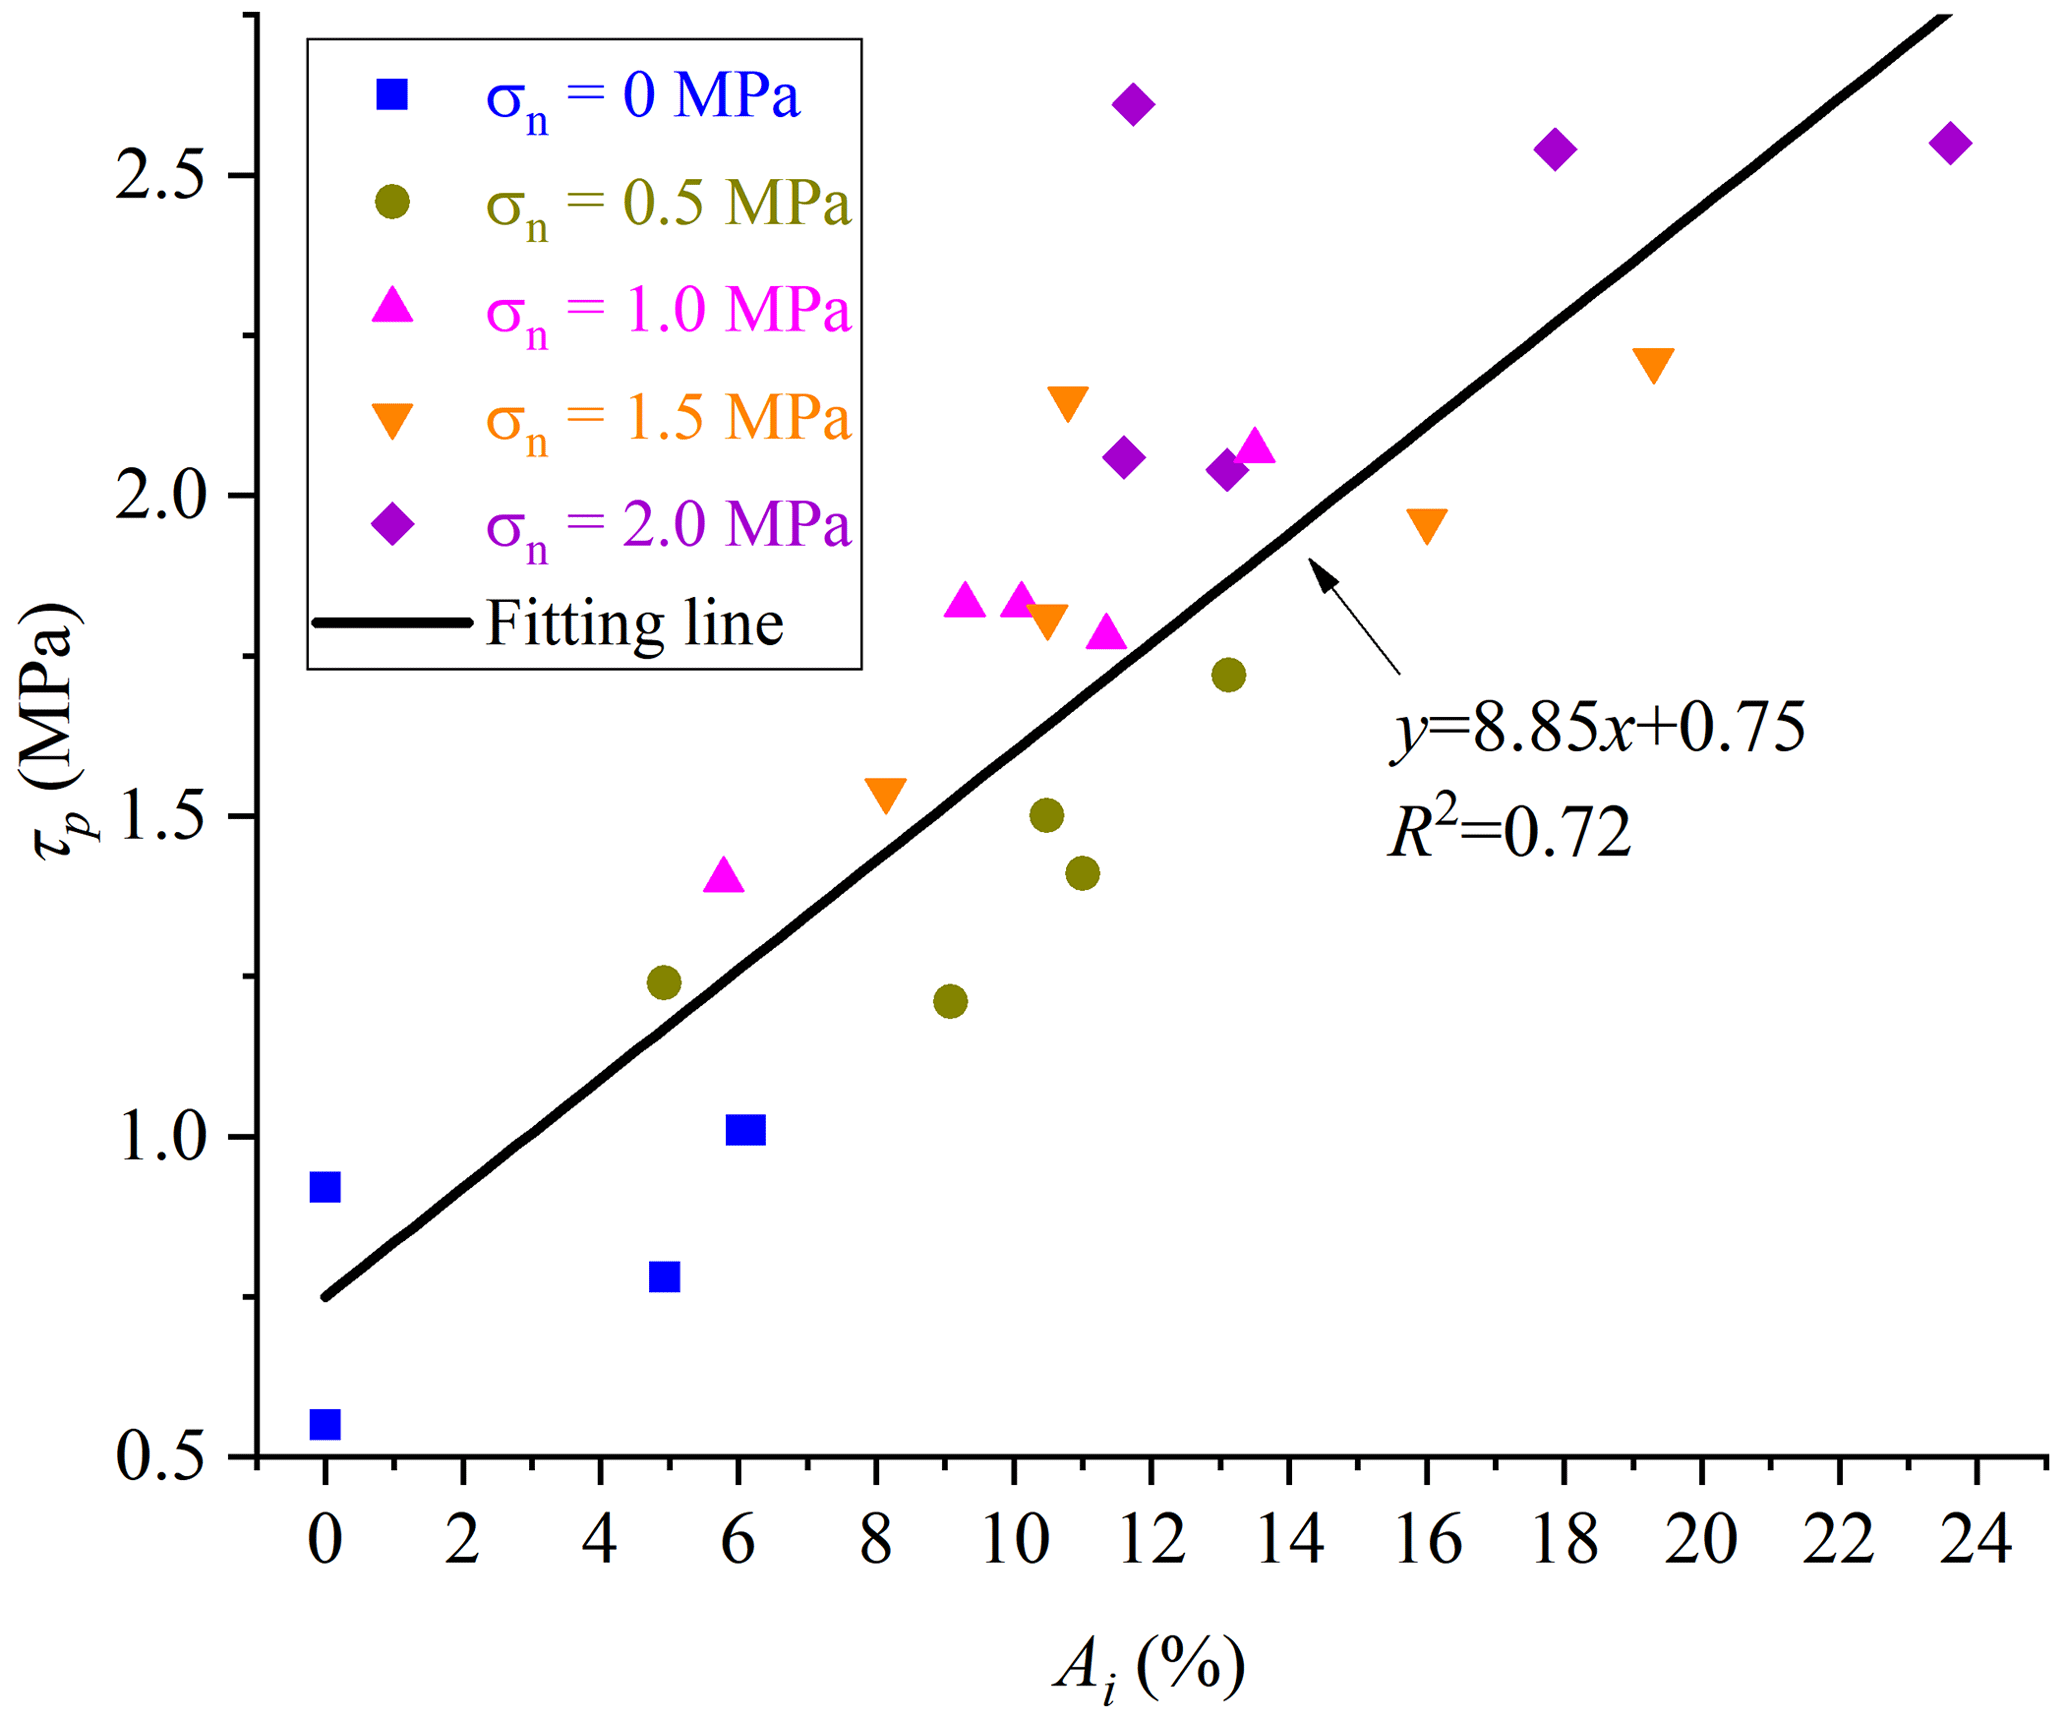
Figure 20Peak shear strength linearly increases with increasing aggregation areas of rupture ice. Experimental conditions: T = −15 ∘C, d = 2 mm and v = 0.2 mm min−1.

Figure 21Influence of freezing temperature on the direct shear strength of ice and ice-filled joints. Experimental condition: v = 0.2 mm min−1.
The test results show that the shear strength of the smooth ice–rock bonding interface is higher than that of pure solid ice at freezing temperatures ranging from −15 to −0.5 ∘C (Fig. 21a). This implies that the shear failure should be inside the solid ice instead of the ice–rock interface. When the freezing temperatures increase from −1 to −0.5 ∘C, the shear strengths of the ice–rock interface and the solid ice reduce very quickly. Jia et al. (2015) also claimed the same change law of solid ice against the temperature.

Figure 22Shear failure characteristics of ice–rock interfaces under different temperatures. Experimental conditions: v = 0.2 mm min−1 and σn = 0.5 MPa.
However, the experimental results show that the shearing failure of many rough ice-filled joints at −0.5 ∘C is the debonding of ice–rock interfaces (Figs. 6, 12, 13 and 18). More shear experiments were carried out on rough ice–rock interfaces with profile no. 4 and no. 8 on the same experimental condition (σn = 0.5 MPa and v = 0.2 mm min−1). It shows that the shear strength of the rock–ice–rock “sandwich” interface is a little larger than that of the ice–rock interface, although the shear strengths of the rock–ice–rock “sandwich” interface and ice–rock interface decrease with the increase in freezing temperature. Another novel finding is that the shear strength of the ice–rock interface is higher than the shear strength of solid ice itself below −1 ∘C (Fig. 21b). Therefore, the shear failure below −1 ∘C displays the cracking of joint ice instead of the ice–rock interface, and some aggregation areas of rupture ice occur before large bulges (Figs. 6, 12, 13 and 18). However, the shear strength of solid ice is higher than that of the ice–rock interface above −1 ∘C. This is the main reason for the shear failure of rough ice-filled joints along ice–rock interfaces at −0.5 ∘C. The freezing temperature of −1 ∘C is the transition point of shear failure modes. Figure 22 shows that the shear failure is along the ice–rock interface when the freezing temperature is approximately −0.5 ∘C; however, the area of ice attached to the joints has a great increase with the decrease in freezing temperature from −0.5 to −15 ∘C. It further illustrates that the shear strength of the rough ice–rock interface is higher than that of the solid ice below −5 ∘C. Mamot et al. (2018) also found that the shear failure modes of the smooth ice-filled joints changed from shearing cracking of joint ice to the debonding of the ice–rock interface when the freezing temperatures increased from −10 to −0.5 ∘C. The smooth joints have little ability to resist the shear slide of ice-filled joints. Mamot et al. (2018) claimed that three shear failure modes may arise between −5 and −1 ∘C, including the debonding of the ice–rock interface, shear cracking of joint ice and their mixed mode. However, only the shear cracking of joint ice occurs at −5 to −1 ∘C in this study. Therefore, the joint roughness has an effect on the shear strength of ice-filled joints and the shear failure modes.
4.2 The coupled effect of joint roughness, opening and normal stress
The shear strength of smooth ice-filled joints was investigated by Mamot et al. (2018). They found that the shear strength of smooth ice-filled joints also linearly increases with decreasing temperatures. Actually, the roughness is another important factor influencing the shear strength of ice-filled joints, which can improve the ability to resist the shear slide of joints (Fig. 23). The shear strength of the profile no. 2 ice-filled joint is much lower than that of profile no. 8 and no. 10 joints. For profile no. 2, the shear strength of ice-filled joints is approximately equal to that of the solid ice when the normal stress is less than 1.5 MPa, because the joint opening of 2 mm is also very close to the maximum height difference. Therefore, the joint opening determines the effect of joint roughness. However, the shear strength of solid ice is much lower compared with the shear strength of ice-filled joints when the normal stress is 2 MPa. It is observed that this normal stress causes some vertical micro-cracks inside the solid ice. For the ice-filled joints, the compression damage may not be remarkable, because both the adhesion of the ice–rock interface and bulges prevent the lateral expansion of solid ice under high normal stress. A higher roughness may provide a much stronger confining effect on the lateral expansion. Although the shear strength increases with increasing JRC number in general, the quantitative relationship between them is hard to determine. Figure 5 shows that the change in shear strength against the JRC number is fluctuating. A novel finding of this study is that the aggregation area of rupture ice before large bulges can be used to predict the shear strength of ice-filled joints. However, it should be noted that a new index of roughness should be proposed in future research in order to build the shear strength model considering joint roughness.
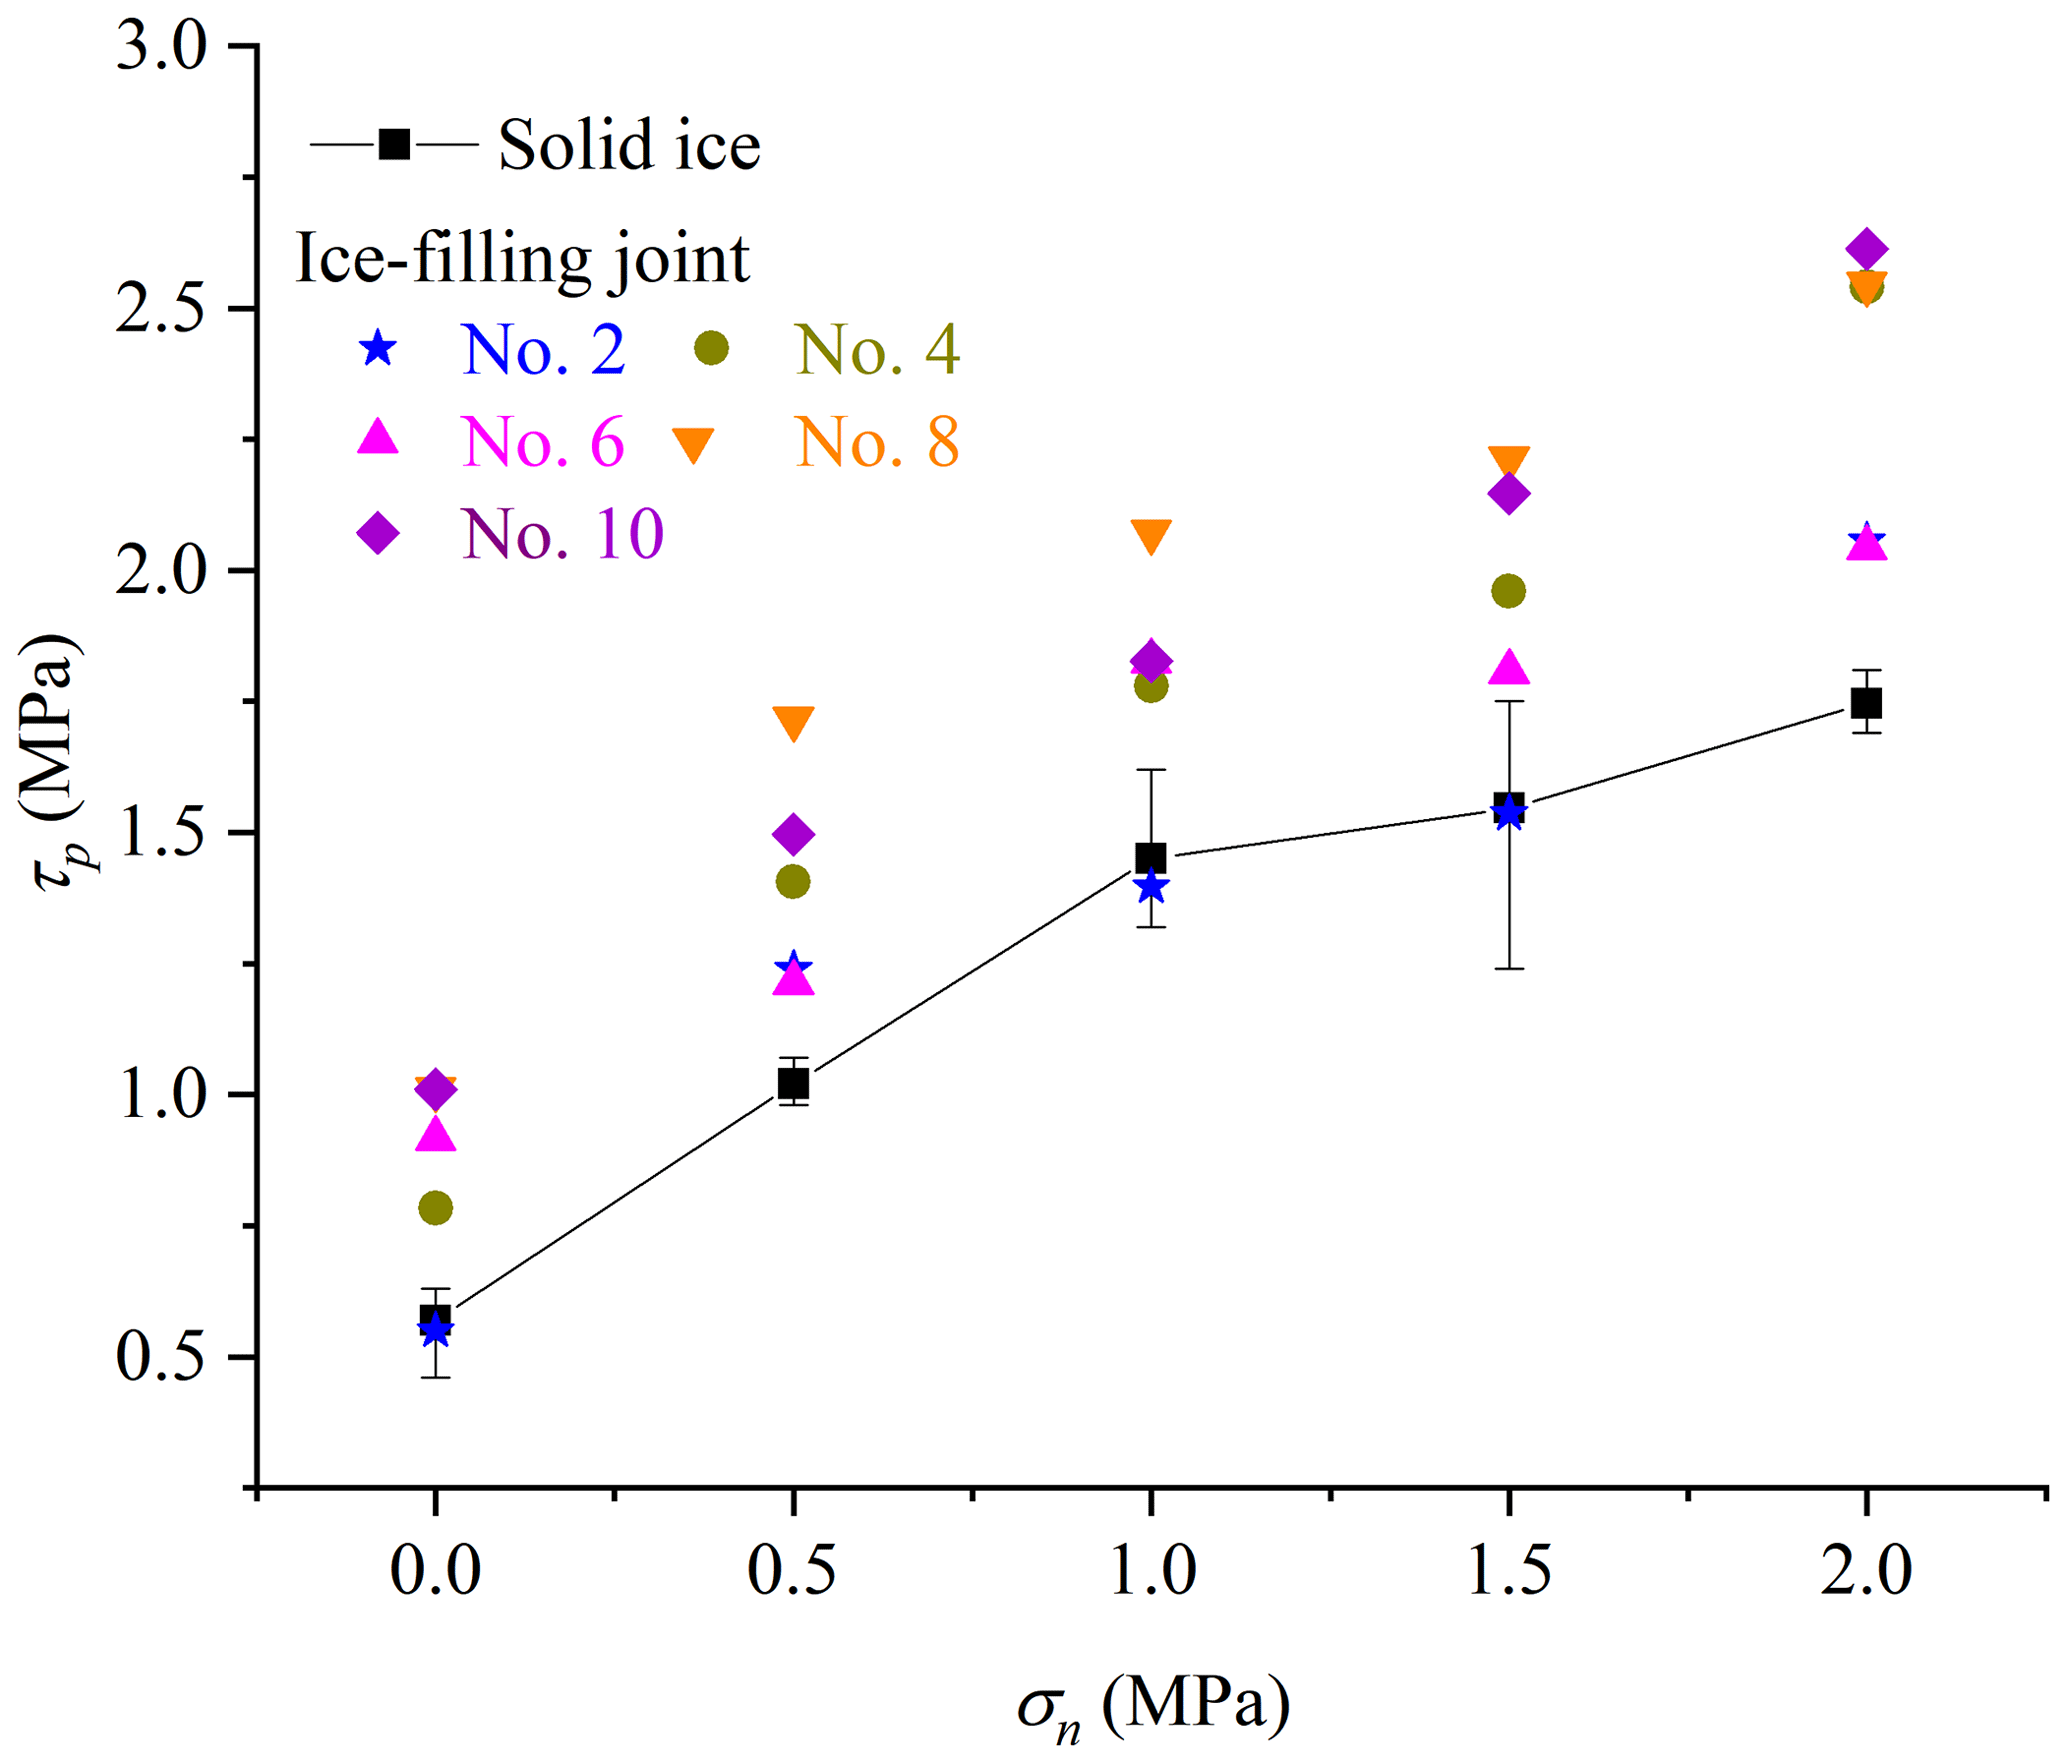
Figure 23Shear failure characteristics of ice–rock interfaces under different normal stress. Experimental conditions: v = 0.2 mm min−1, d = 2 mm and T = −15 ∘C.
In addition, if the joint opening exceeds the critical value, the influence of joint roughness on the shear strength of ice-filled joints disappears. For example, when the thickness of joint ice exceeds 14 mm, the shear strength of all the ice-filled joints is equal to the shear strength of infilled ice. Section 3.4 illustrates that the value of a critical joint opening depends on the maximum height difference of the joint, which requires further study.
4.3 Potential application for prediction of rock avalanches in a warming climate
In recent years, many large rock avalanches have occurred in the Alps. The rock avalanches that occurred on the Brenva Glacier, the Punta Thurwieser (also known as Thurwieserspitze) and the Drus (also known as Aiguille du Dru) are some of the recent examples which have had strong impacts on the high-mountain-infrastructure stability and landscape evolution (Mamot et al., 2018). The rock avalanches are related to the degradation of bedrock permafrost and ice-filled joints. Our study shows that the peak shear strength of ice-filled joints increases with the increase in roughness and normal pressure. This implies that the rockfall is more stable with higher roughness and normal pressure. In addition, when the joint openings increase, the peak shear strength decreases, and large joint openings reduce the effect of joint roughness. The peak shear strength of ice-filled joints decreases with the increase in freezing temperature. Moreover, when the freezing temperature is close to 0 ∘C, the pre-melting of the ice–rock interface induced by the normal stress causes a reduction in bonding strength. This result can explain the phenomenon when the boundary of ice-filled joints between the frozen and unfrozen state becomes unstable, especially in summer. The peak shear strength of ice-filled joints decreases with the increase in shear rate. It is hard for the ice crystal to adjust to the shear slip at high shear rates so the rockfall may happen.
As the global temperatures rise, collapse disasters of ice-filled rock mass caused by warming and thawing will often occur in permafrost regions. A constitutive model can be further constructed according to the experiment results. Then, in combination with numerical software, this constitutive model can be used to predict the disaster of rock avalanches in cold regions in future research. Although Mamot et al. (2018) established a constitutive model for joints, the constitutive model only considers temperature and normal stress; however, the influence of the joint roughness, opening and shear rate is ignored. Through our study, it is evidenced that the joint roughness, shear rate, joint opening and temperature are physical quantities that must be considered in the constitutive model. A constitutive model including these physical quantities will be proposed in our future research.
The following conclusions can be obtained in this study.
-
The shear strength of ice-filled joints decreases with increasing temperature. The shear failure mode changes from shear rupture of joint ice to the debonding of the ice–rock interface when the temperature increases to −0.5 ∘C, because the bonding strength of the ice–rock interface is less than that of solid ice at −0.5 ∘C (v = 0.2 mm min−1 and σn = 0.5 MPa).
-
The joint roughness can improve the shear strength of ice-filled joints, but it is related to the joint opening and normal stress. The shear strength of ice-filled joints linearly increases with the increasing aggregation area of rupture ice before noticeable bulges. However, the relationship between the JRC index and the shear strength is not significant.
-
The shear strength of ice-filled joints decreases with increasing joint opening. When the joint opening increases from 2 to 14 mm, the aggregation of rupture ice gradually disappears, and the shear strength of ice-filled joint is equal to that of solid ice. A critical value of infilled thickness may exist, which requires further study.
-
The shear strength of ice-filled joints decreases when the shear rate increases from 0.2 to 0.8 mm min−1. The infilled ice may change from ductile to brittle failure with increasing shear rate. The aggregation area of rupture ice also decreases, while the brittle rupture phenomenon of joint ice is more obvious as the shear rate increases.
-
The shear strength of ice-filled joints linearly increases with increasing normal stress, which well satisfies the Mohr–Coulomb criterion. The aggregation area of rupture ice also increases with increasing normal stress. In addition, the improvement of shear strength caused by the normal stress is much larger for the ice-filled joints than the solid ice, because the bulges can prevent the lateral expansion of ice under compression.
Field data in Sect. 1 and shear strength of pure ice (Jia et al., 2015) in Fig. 21 are available upon request to the corresponding author.
SH contributed to the conceptualization, methodology, software, formal analysis, visualization, and writing of the original draft. HC contributed to the main experiments, supervision, and review and editing of the manuscript. ZX contributed to the initial experiments. GL contributed to setting up the experimental equipment and obtaining data.
The contact author has declared that none of the authors has any competing interests.
Publisher's note: Copernicus Publications remains neutral with regard to jurisdictional claims in published maps and institutional affiliations.
We would like to extend a warm thanks to all the scientists and students who participated in the experiments and manuscript writing. We would also like to express our gratitude to the anonymous reviewers who provided us with valuable comments.
This work was supported by the National Natural Science Foundation of China (grant nos. 42072300 and 41702291) and the Project of Natural Science Foundation of Hubei Province (grant no. 2021CFA094).
This paper was edited by Adam Booth and reviewed by two anonymous referees.
Allen, S. and Huggel, C.: Extremely warm temperatures as a potential cause of recent high mountain rockfall, Global Planet. Change, 107, 59–69, https://doi.org/10.1016/j.gloplacha.2013.04.007, 2013.
Barton, N. and Choubey, V.: The shear strength of rock joints in theory and practice, J. Rock. Mech. Geotech., 10, 1–54, https://doi.org/10.1007/BF01261801, 1977.
Bragov, A., Igumnov, L., Konstantinov, A., Lomunov, A., Filippov, A., Shmotin, Y., Didenko R., and Krundaeva, A.: Investigation of strength properties of freshwater ice, EPJ Web of Conferences, 94, 01070, https://doi.org/10.1051/epjconf/20159401070, 2015.
Colucci, R. R. and Guglielmin, M.: Climate change and rapid ice melt: Suggestions from abrupt permafrost degradation and ice melting in an alpine ice cave, Prog. Phys. Geog., 43, 561–573, https://doi.org/10.1177/0309133319846056, 2019.
Davies, M. C., Hamza, O., and Harris, C.: The effect of rise in mean annual temperature on the stability of rock slopes containing ice-filled discontinuities, Permafrost. Periglac., 12, 137–144, https://doi.org/10.1002/ppp.378, 2001.
Davies, M. C., Hamza, O., Lumsden, B. W., and Harris, C.: Laboratory measurement of the shear strength of ice-filled rock joints, Ann. Glaciol., 31, 463–467, https://doi.org/10.3189/172756400781819897, 2017.
Etzelmüller, B., Czekirda, J., Magnin, F., Duvillard, P.-A., Ravanel, L., Malet, E., Aspaas, A., Kristensen, L., Skrede, I., Majala, G. D., Jacobs, B., Leinauer, J., Hauck, C., Hilbich, C., Böhme, M., Hermanns, R., Eriksen, H. Ø., Lauknes, T. R., Krautblatter, M., and Westermann, S.: Permafrost in monitored unstable rock slopes in Norway – new insights from temperature and surface velocity measurements, geophysical surveying, and ground temperature modelling, Earth Surf. Dynam., 10, 97–129, https://doi.org/10.5194/esurf-10-97-2022, 2022.
Fukuzawa, T. and Narita, H.: An experimental study on the mechanical behavior of a depth hoar layer under shear stress, PhD thesis, Institute of Low Temperature Science, Hokkaido University, Japan, 5 pp., 1993.
Gruber, S. and Haeberli, W.: Permafrost in steep bedrock slopes and its temperature-related destabilization following climate change, J. Geophys. Res.-Earth., 112, F02S18, https://doi.org/10.1029/2006JF000547, 2007.
Han, H. W., Jia, Q., Huang, W. F., and Li, Z. J.: Flexural strength and effective modulus of large columnar-grained freshwater ice, J. Cold Reg. Eng., 30, 04015005, https://doi.org/10.1061/(ASCE)CR.1943-5495.0000098, 2016.
Hartmeyer, I., Delleske, R., Keuschnig, M., Krautblatter, M., Lang, A., Schrott, L., and Otto, J.-C.: Current glacier recession causes significant rockfall increase: the immediate paraglacial response of deglaciating cirque walls, Earth Surf. Dynam., 8, 729–751, https://doi.org/10.5194/esurf-8-729-2020, 2020.
Hilger, P., Hermanns, R. L., Czekirda, J., Myhra, K. S., Gosse, J. C., and Etzelmüller, B.: Permafrost as a first order control on long-term rock-slope deformation in (Sub-) Arctic Norway, Quaternary Sci. Rev., 251, 106718, https://doi.org/10.1016/j.quascirev.2020.106718, 2021.
Huang, S. B., Yu, S. L., Ye, Y. H., Ye, Z. Y., and Cheng, A. P.: Pore structure change and physico-mechanical properties deterioration of sandstone suffering freeze-thaw actions, Constr. Build. Mater., 330, 127200, https://doi.org/10.1016/j.conbuildmat.2022.127200, 2022.
Huang, S. B., Wang, J., Liu, Y. Z., Tian, Q., and Cai, C.: Experimental investigation on crack coalescence and strength loss of rock-like materials containing two parallel water-filled flaws under freeze-thaw, Theor. Appl. Fract. Mec., S0167-8442, 00413-X, https://doi.org/10.1016/j.tafmec.2022.103669, 202b.
Jia, Q., Li, J. J., Han, H. W., Yu, K., Gu, X.: Experimental Study on Shear Strength of Freshwater Ice in a Reservoir, Math. Pract. Theory., 45, 132–137, 2015.
Krautblatter, M., Funk, D., Günzel, F. K.: Why permafrost rocks become unstable: a rock–ice-mechanical model in time and space, Earth. Surf. Proc. Land., 38, 876–887, https://doi.org/10.1002/esp.3374, 2012.
Krautblatter, M., Huggel, C., Deline, P., and Hasler, A.: Research perspectives on unstable high-alpine bedrock permafrost: Measurement, modelling and process understanding, Permafrost. Periglac., 23, 80–88, https://doi.org/10.1002/ppp.740, 2021.
Legay, A., Magnin, F., and Ravanel, L.: Rock temperature prior to failure: Analysis of 209 rockfall events in the Mont Blanc massif (Western European Alps), Permafrost. Periglac., 32, 520–536, https://doi.org/10.1002/ppp.2110, 2021.
Lou, X. N. and Wu, Y.: Influence of temperature and fiber content on direct shear properties of plain ice and fiber-reinforced ice, Cold Reg. Sci. Technol., 194, 103458, https://doi.org/10.1016/j.coldregions.2021.103458, 2021.
Luo, S., Li, C., Li, F., Wang, J., and Li, Z. G.: Ice crystallization in shear flows, J. Phys. Chem. C, 123, 21042–21049, https://doi.org/10.1021/acs.jpcc.9b06225, 2019.
Mamot, P., Weber, S., Schröder, T., and Krautblatter, M.: A temperature- and stress-controlled failure criterion for ice-filled permafrost rock joints, The Cryosphere, 12, 3333–3353, https://doi.org/10.5194/tc-12-3333-2018, 2018.
Mamot, P., Weber, S., Eppinger, S., and Krautblatter, M.: A temperature-dependent mechanical model to assess the stability of degrading permafrost rock slopes, Earth Surf. Dynam., 9, 1125–1151, https://doi.org/10.5194/esurf-9-1125-2021, 2021.
Matsuoka, N. and Murton, J.: Frost weathering: recent advances and future directions, Permafrost. Periglac., 19, 195–210, https://doi.org/10.1002/ppp.620, 2008.
Petrovic, J. J.: Review mechanical properties of ice and snow, J. Mater. Sci., 38, 1–6, https://doi.org/10.1023/A:1021134128038, 2003.
Schulson, E. M. and Fortt, A. L.: Friction of ice on ice, J. Geophys. Res.-Sol. Ea., 117, B12204, https://doi.org/10.1029/2012JB009219, 2012.
Shan, R. L., Bai, Y., Ju, Y., Han, T. Y., Dou, H. Y., and Li, Z. L.: Study on the triaxial unloading creep mechanical properties and damage constitutive model of red sandstone containing a single ice-filled flaw, Rock Mech. Rock Eng., 54, 833–855, https://doi.org/10.1007/s00603-020-02274-1, 2021.
Shen, Y. J., Yang, H. W., Xi, J. M., Yang, Y., Wang, Y. Z., and Wei, X.: A novel shearing fracture morphology method to assess the influence of freeze-thaw actions on concrete-granite interface, Cold Reg. Sci. Technol., 169, 102900, https://doi.org/10.1016/j.coldregions.2019.102900, 2020.
Shugar, D. H., Jacquemart, M., Shean, D., Bhushan, S., Upadhyay, K., Sattar, A., Schwanghart, W., Mcbride, S., Van Wyk De Vries, M., Mergili, M., Emmer, A., Deschamps-Berger, C., Mcdonnell, M., Bhambri, R., Allen, S., Berthier, E., Carrivick, J. L., Clague, J. J., Dokukin, M., Dunning, S. A., Frey, H., Gascoin, S., Haritashya, U. K., Huggel, C., Kääb, A., Kargel, J. S., Kavanaugh, J. L., Lacroix, P., Petley, D., Rupper, S., Azam, M. F., Cook, S. J., Dimri, A. P., Eriksson, M., Farinotti, D., Fiddes, J., Gnyawali, K. R., Harrison, S., Jha, M., Koppes, M., Kumar, A., Leinss, S., Majeed, U., Mal, S., Muhuri, A., Noetzli, J., Paul, F., Rashid, I., Sain, K., Steiner, J., Ugalde, F., Watson, C. S., and Westoby, M. J.: A massive rock and ice avalanche caused the 2021 disaster at Chamoli, Indian Himalaya, Science, 373, 300–306, https://doi.org/10.1126/science.abh4455, 2021.
Sinha, N. K.: Elasticity of natural types of polycrystalline ice, Cold Reg. Sci. Technol., 17, 127–135, https://doi.org/10.1016/S0165-232X(89)80003-5, 1989.
Walter, F., Amann, F., Kos, A., Kenner, R., Phillips, M., de Preux, A., Huss, M., Tognacca, C., Clinton, J., Diehl, T., and Bonanomi, Y.: Direct observations of a three million cubic meter rock-slope collapse with almost immediate initiation of ensuing debris flows, Geomorphology, 351, 106933, https://doi.org/10.1016/j.geomorph.2019.106933, 2019.
Wang, C., Li, Y., Dai, F., Wu, G. N., Yin, F. T., Li, K. P., and Wang, K.: Experimental investigation on mechanical properties and failure mechanism of rock-like specimens containing an arc-shaped ice-filled flaw under uniaxial compression, Theor. Appl. Fract. Mec., 119, 103368, https://doi.org/10.1016/j.tafmec.2022.103368, 2022.
Weber, S., Fäh, D., Beutel, J., Faillettaz, J., Gruber, S., and Vieli, A.: Ambient seismic vibrations in steep bedrock permafrost used to infer variations of ice-fill in fractures, Earth Planet. Sc. Lett., 501, 119–127, https://doi.org/10.1016/j.epsl.2018.08.042, 2018.
Xu, D. P., Feng, X. T., Cui, Y. J.: A simple shear strength model for interlayer shear weakness zone, Eng. Geol., 147, 114–123, https://doi.org/10.1016/j.enggeo.2012.07.016, 2012.
Yang, Q. Q., Su, Z. M., Cheng, Q. G., Ren, Y. H., and Cai, F.: High mobility of rock–ice avalanches: Insights from small flume tests of gravel–ice mixtures, Eng. Geol., 260, 105260, https://doi.org/10.1016/j.enggeo.2019.105260, 2019.
Zhang, G. Z., Chen, G. Q., Xu, Z. X., Yang, Y., and Lin, Z. H.: Crack failure characteristics of different rocks under the action of frost heaving of fissure water, Front. Earth. Sci.-Switz., 8, 13, https://doi.org/10.3389/feart.2020.00013, 2020.
Zhao, Y. L., Zhang, L. Y., Asce, F., Wang, W. J., Liu, Q., Tang, L. M., and Cheng, G. M.: Experimental Study on Shear Behavior and a Revised Shear Strength Model for Infilled Rock Joints, Int. J. Geomech., 20, 04020141, https://doi.org/10.1061/(ASCE)GM.1943-5622.0001781, 2020.
Zhao, Z. H., Yang, J., Zhou, D., and Chen, Y. F.: Experimental investigation on the wetting-induced weakening of sandstone joints, Eng. Geol., 225, 61–67, https://doi.org/10.1016/j.enggeo.2017.04.008, 2017.