the Creative Commons Attribution 4.0 License.
the Creative Commons Attribution 4.0 License.
 | 16 Dec 2022
Impacts of snow assimilation on seasonal snow and meteorological forecasts for the Tibetan Plateau
Jie Chen
Yvan J. Orsolini
Yiheng Xiang
Retish Senan
Patricia de Rosnay
The Tibetan Plateau (TP) contains the largest amount of snow outside the polar regions and is the source of many major rivers in Asia. An accurate long-range (i.e. seasonal) meteorological forecast is of great importance for this region. The fifth-generation seasonal forecast system of the European Centre for Medium-Range Weather Forecasts (SEAS5) provides global long-range meteorological forecasts including over the TP. However, SEAS5 uses land initial conditions produced by assimilating Interactive Multisensor Snow and Ice Mapping System (IMS) snow data only below 1500 m altitude, which may affect the forecast skill of SEAS5 over mountainous regions like the TP. To investigate the impacts of snow assimilation on the forecasts of snow, temperature and precipitation, twin ensemble reforecasts are initialized with and without snow assimilation above 1500 m altitude over the TP for spring and summer 2018. Significant changes occur in the springtime. Without snow assimilation, the reforecasts overestimate snow cover and snow depth while underestimating daily temperature over the TP. Compared to satellite-based estimates, precipitation reforecasts perform better in the west TP (WTP) than in the east TP (ETP). With snow assimilation, the reforecasts of snow cover, snow depth and temperature are consistently improved in the TP in the spring. However, the positive bias between the precipitation reforecasts and satellite observations worsens in the ETP. Compared to the experiment with no snow assimilation, the snow assimilation experiment significantly increases temperature and precipitation for the ETP and around the longitude 95∘ E. The higher temperature after snow assimilation, in particular the cold bias reduction after initialization, can be attributed to the effects of a more realistic, decreased snowpack, providing favourable conditions for generating more precipitation. Overall, snow assimilation can improve seasonal forecasts through the interaction between land and atmosphere.
- Article
(11501 KB) - Full-text XML
-
Supplement
(943 KB) - BibTeX
- EndNote


The Tibetan Plateau (TP) is often regarded as the Third Pole due to high altitudes and complex terrains (Qiu, 2008), and it plays an important role in the atmospheric circulation of the Northern Hemisphere, regulating mid-latitude westerlies and the Asian monsoon system (Yang et al., 2014, 2019; Chen et al., 2020). In addition, the TP is the headwater of many major rivers in Asia, such as the Indus, Brahmaputra, Yellow, Yangtze and Lancang–Mekong rivers. Thus, it is also regarded as the Asian water tower (Immerzeel et al., 2010; Kuang and Jiao, 2016). Considering the special role of the TP, an accurate long-range (i.e. seasonal) meteorological forecast in this region would provide a reliable meteorological background for the downstream regions and further bring huge socioeconomic benefits through the prediction of meteorological and hydrological processes (Hansen, 2002; Shafiee-Jood et al., 2014; Clark et al., 2017; Ceglar et al., 2018; Li et al., 2019).
The fifth-generation seasonal forecast system of the European Centre for Medium-Range Weather Forecasts (ECMWF; SEAS5) is a forecast model configuration of ECMWF's Integrated Forecasting System (IFS) comprising the IFS atmosphere model coupled to the NEMO (Nucleus for European Modelling of the Ocean) 3.4 ocean model and LIM2 (Louvain-la-Neuve Sea Ice Model). A comprehensive description of SEAS5 is provided by Johnson et al. (2019). The SEAS5 provides operational meteorological forecasts for a lead time of up to 7 months with an ensemble of 51 members. Reforecasts with 25 members over the historical period (1981–2016) are used for the calibration of operational forecasts. These reforecasts have also been used to evaluate the ability of SEAS5 in forecasting temperature and precipitation. For example, Wang et al. (2019) compared SEAS5 with its predecessor in the Australian continent and found that a large improvement was achieved in forecasting daily maximum temperature and precipitation, yet with little improvement in daily minimum temperature. Gubler et al. (2020) found that the SEAS5 was reliable in forecasting temperature and precipitation in many regions of South America affected by El Niño–Southern Oscillation (ENSO) variability. In addition, Ehsan et al. (2020) showed that SEAS5 could capture the observed climatological mean and variability patterns of peak summer monsoon precipitation over Pakistan, despite being biased over complex topography zones. Chevuturi et al. (2021) indicated that SEAS5 performed well in forecasting the dynamical features of a large-scale monsoon 1 month ahead.
The impact of rapid snow variability over the TP during winter and spring on medium-range to subseasonal forecasts has recently been investigated by W. Li et al. (2018, 2020). On a longer seasonal timescale, the impact of the snow initialization in seasonal prediction system – in particular in SEAS5 – has not been evaluated, especially in the spring. Considering the special climate and topography in this region, a first evaluation of SEAS5 forecasts for the surface fields is needed – and also for precipitation. More importantly, the SEAS5 forecasts were produced without assimilating the Interactive Multisensor Snow and Ice Mapping System (IMS) snow data above 1500 m, including over the TP. The same restriction applies to ERA5 reanalyses and to operational ECMWF medium-range forecasts (Orsolini et al., 2019). Although IMS snow cover assimilation improves snow and surface representation, it has a complex impact on the atmospheric forecasts. The impact of restricting the assimilation of IMS snow data below 1500 m was detailed in de Rosnay et al. (2014). They showed that the new ECMWF snow analysis combining improvements in the analysis approach (Optimal Interpolation (OI) vs. Cressman method) and data pre-processing and quality control (IMS snow cover product resolution and implementation of a 1500 m altitude threshold) had an overall positive impact on the atmospheric forecast skill, with the root mean square error forecast for the 1000 hPa geopotential height improved by 1 %–4 % in the short range (forecasts until day 4). This altitude threshold has been used since its implementation in November 2010, including in the recent IFS cycles used for ERA5 (41r2) and in the current operational cycle. However, IMS snow cover assimilation in mountainous areas is constantly evaluated to address the complex feedback between the surface and the atmosphere. Moving towards coupled assimilation ECMWF aims at enhancing the consistency between the different Earth system components, which will allow for better exploitation of observations which are sensitive to the surface (such as snow cover). Moreover, assimilating the IMS snow data, but only below 1500 m altitude, might influence the forecasting ability over the TP (Wang et al., 2020; Lin et al., 2021), and the inclusion of IMS above an altitude of 1500 m might be beneficial to seasonal forecasts at the regional scale.
In order to investigate the impacts of snow assimilation over the TP on the forecasting ability of the SEAS5, twin initialized forecast experiments with and without the IMS snow data assimilation (DA) above 1500 m were conducted as a case study for the year 2018. The orography threshold for using IMS observations in the snow assimilation system was removed specifically from the TP region and maintained elsewhere. The configuration for these experiments is largely similar to the current SEAS5 but with lower atmospheric (∼ 0.44∘) and ocean (∼ 1∘) resolution and a newer IFS model cycle (CY45R1; ECMWF, 2018). Using these twin experiments, this case study investigates how snow assimilation over the TP influences the long-range prediction of snow, temperature and precipitation over the TP.
This study focuses on the TP within China (25–40∘ N, 73–105∘ E; Fig. 1). Regions where the orography is >1500 m account for 98.7 % of the whole study area. Precipitation is influenced by the westerlies, the South Asian and the East Asian summer monsoon systems (Schiemann et al., 2009; Yao et al., 2012; Yang et al., 2014). Specifically, precipitation in the southeastern TP is under the control of the warm and humid Indian monsoon (D. Li et al., 2020), with the multiyear-averaged precipitation being more than 2000 mm and most of the precipitation concentrated between May and September. As moisture transport is blocked by high mountains, precipitation in northwestern TP is reduced to less than 50 mm (Curio and Scherer, 2016). In addition, the multiyear-averaged temperature changes from 20 to below −6 ∘C from southeast to northwest. The climate pattern in the eastern TP (ETP) is usually considered to be wet, while it is usually considered to be dry in the western TP (WTP). Considering the high spatial variability in the precipitation and temperature in the TP, the study area for our analysis was divided into the ETP and the WTP by longitude at 95∘ E, according to previous studies (Qian et al., 2003; D. Li et al., 2020).
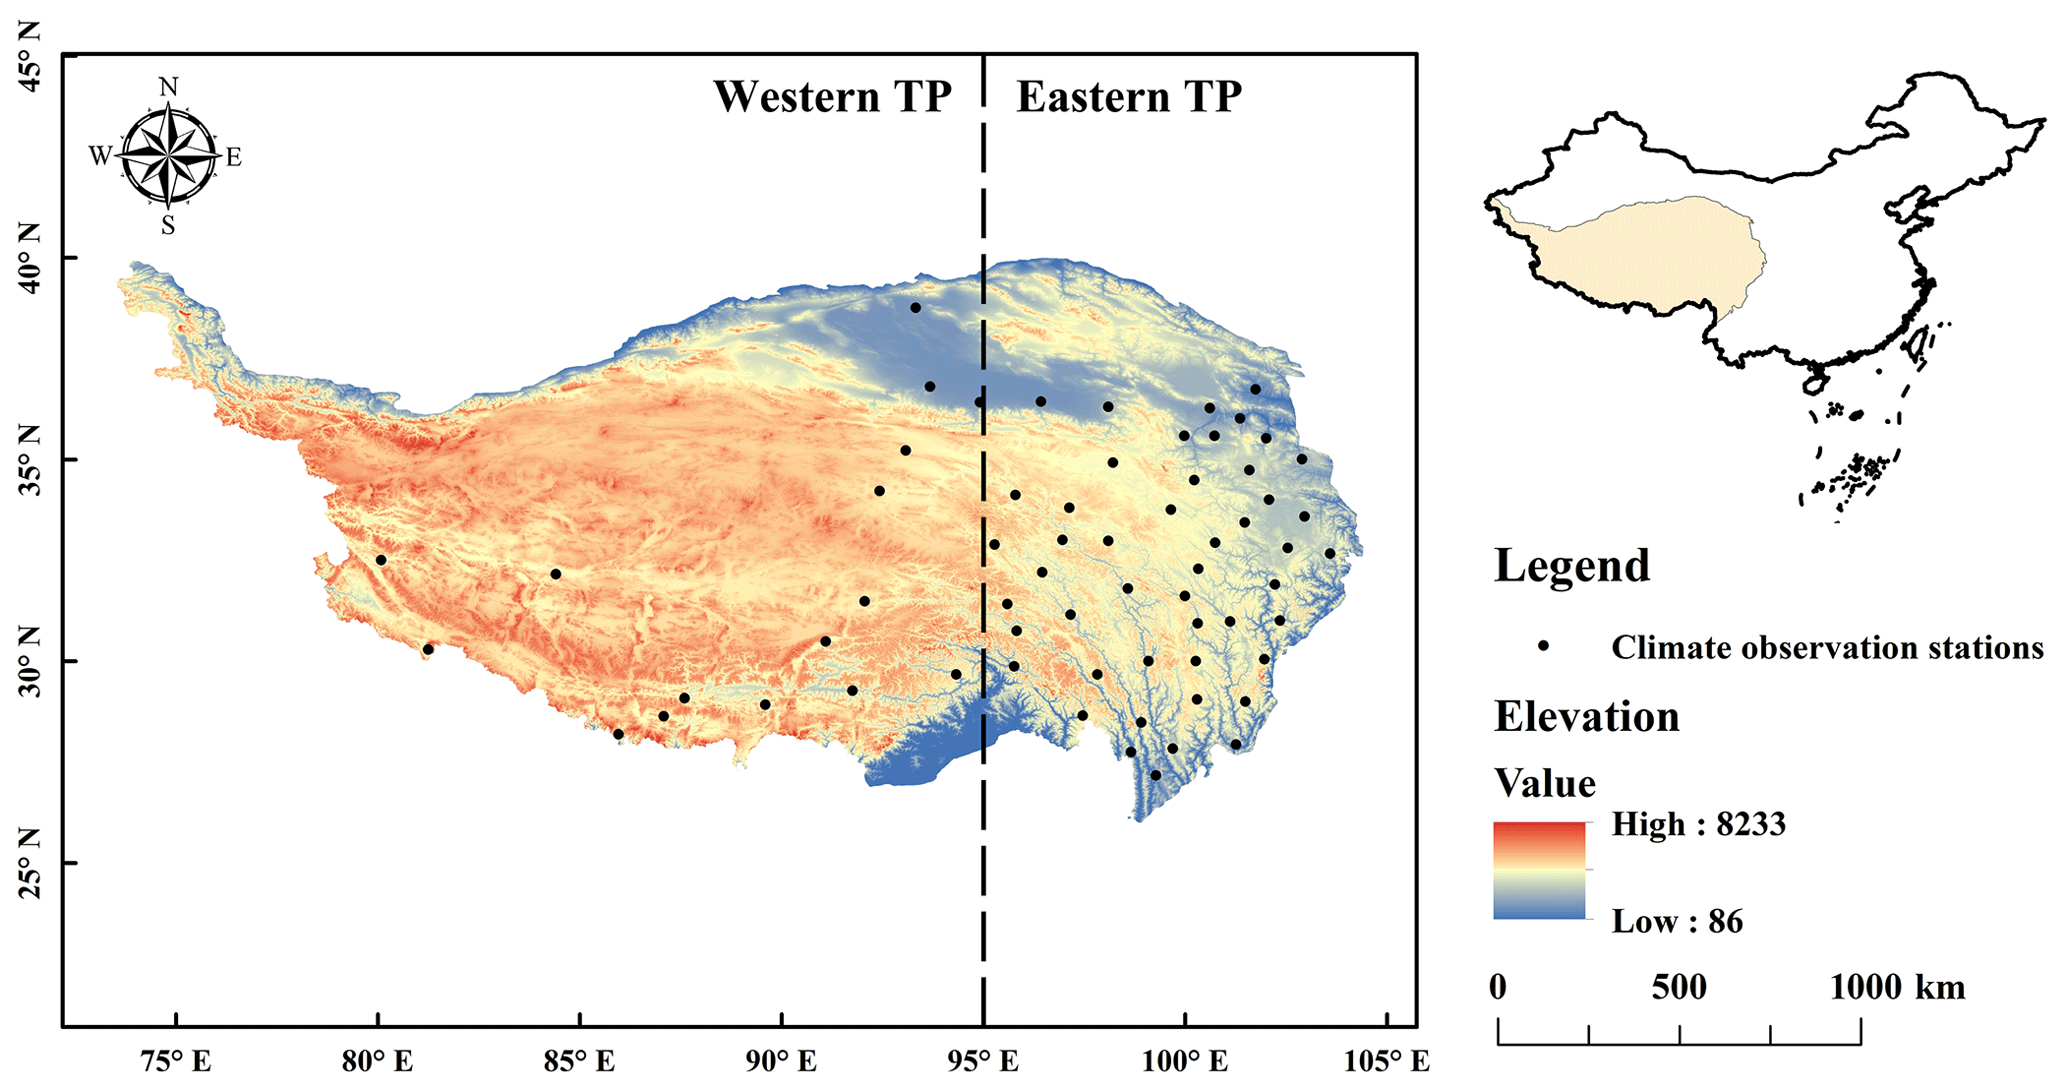
Figure 1The location and elevation of the Tibetan Plateau (TP) and the location of climate observation stations.
3.1 Forecast experiments design
The configuration of the twin experiments for this case study in the year 2018 is similar to the current SEAS5 (Johnson et al., 2019) but with lower atmospheric (∼ 0.44∘) and ocean (∼ 1∘) resolution and a newer IFS model cycle (CY45R1). The ocean and sea ice initial conditions for the twin experiments were provided by the new operational ocean analysis system OCEAN5 (Zuo et al., 2019). The atmospheric and land initial conditions for both experiments were obtained from dedicated analysis experiments with the ECMWF Land Data Assimilation System (LDAS). Details about the LDAS can be found in Dee et al. (2011) and de Rosnay et al. (2014). Here, we use twin forecast experiments that differ only in the land initial states produced by two analysis experiments; the control experiment included the assimilation of daily, 4 km IMS snow cover below 1500 m globally, as in SEAS5, while the sensitivity experiment (the DA experiment) included, in addition, assimilation of the same IMS snow cover above 1500 m. Both analysis experiments were conducted from 1 November 2017 to 30 April 2018, using IFS cycle 45R1 in a weakly coupled land–atmosphere data assimilation configuration. The IMS snow data assimilation method relies on a two-dimensional optimal interpolation approach which is used to analyse the IFS land surface model (HTESSEL; Balsamo et al., 2009; Dutra et al., 2010) snow depth, with the adjustment of snow density when fresh snow is added by positive increments. Full details on the snow data assimilation method are provided in the IFS documentation CY45R1 (Part II: Data assimilation, Chapter 9; ECMWF, 2018).
Using the two analysis experiments as initial land states, the twin forecast experiments produced two ensemble reforecasts with a spatial resolution of 0.44∘ and 25 ensemble members. To generate the 25-member ensemble, initial condition perturbations to atmosphere and ocean initial conditions and perturbations to the atmospheric model were applied. Perturbing the initial conditions was used to represent uncertainty in the initial state and to increase the ensemble spread. Among all members, ensemble member 0 was initialized from unperturbed atmospheric initial conditions, while in other members, all upper-air fields and a limited set of land fields (snow, soil moisture, soil temperature, skin temperature and sea ice temperature) were perturbed. The perturbation of the atmospheric model was use to represent uncertainty from missing or unresolved subgrid-scale processes (e.g. clouds, convection, radiation and turbulence) which had to be parameterized (Palmer, 2012).
Both reforecasts start from 1 April 2018, with a lead time of 4 months, i.e. from 1 April to 31 July 2018. In order to analyse the seasonal changes in the reforecasts with snow DA and without, 1 April to 31 May is defined as spring, while 1 June to 31 July is defined as summer. The output temporal resolution ranges from 6 to 24 h, depending on the variable. In this study, we analysed the impacts of snow assimilation over the TP on the snowpack state (snow cover fraction, snow depth and snowfall) in addition to near-surface variables (land surface albedo, 2 m air temperature, 10 m wind and total precipitation, i.e. liquid and snowfall) and upper-air variables (geopotential height and temperature at 600 hPa).
3.2 Data
Since IMS snow data were assimilated in the twin analysis experiments, the performance of IMS snow data was evaluated. The IMS snow data used in this study were retrieved from the National Snow and Ice Data Center (NSIDC) and has a resolution of 4 km. More details about this dataset can be found in https://nsidc.org/data/g02156 (last access: 16 November 2022). In this study, the high-resolution binary IMS snow data were post-processed as following steps to obtain the lower-resolution fractional IMS snow cover. First, the raw IMS snow data were resampled to a resolution of 0.005∘ ( of the resolution of the reforecasts) based on the nearest cell. Second, a grid with same horizontal resolution of the reforecasts was produced. In each cell of the grid, there were 10 000 pixels of the IMS snow data as the resolution of the IMS snow data after resampling was of that of the cell. The number of pixels which were covered by snow was counted and then divided by 10 000 to obtain the ratio of the snow-covered pixels in each cell. Finally, the ratios of the snow-covered pixels in every cell of the grid were calculated to obtain the IMS snow cover fraction with same horizontal resolution of the reforecasts.
A daily snow cover fraction dataset for TP (hereinafter TPSCF) provided by China National Cryosphere Desert Data Center was used as observation. The dataset was produced based on MODIS normalized snow index data, with a spatial resolution of 500 m, combining the terrain data and a variety of snow cover estimation algorithms to realize the re-estimation of snow cover under the conditions of cloud cover. The dataset only has data from January to June in each year. More details about this dataset can be found at https://www.scidb.cn/en/detail?dataSetId=633694460970008576&dataSetType=journal# (last access: 16 November 2022). Moreover, a daily snow depth dataset for TP (hereinafter TPSD) produced by Yan et al. (2021) was also used. The TPSD dataset was derived from the fusion of snow probability data and the long-term series of snow depth dataset over China and has a spatial resolution of 0.05∘. More details about the TPSD dataset can be found at http://data.tpdc.ac.cn/zh-hans/data/0515ce19-5a69-4f86-822b-330aa11e2a28/ (last access: 16 November 2022).
In addition, gridded temperature and precipitation from multiple sources were used to benchmark the ability of the twin reforecasts because of sparse meteorological stations in the TP. The gridded temperature dataset (CN05.1) was generated based on the 2416 meteorological stations in China by Wu et al. (2017) and had been used in many other studies (Xu et al., 2009). The CN05.1 temperature dataset is at the daily scale and has a spatial resolution of 0.25∘. The gridded precipitation includes a Global Precipitation Measurement (GPM), which is an international satellite mission launched by the National Aeronautics and Space Administration (NASA) and the Japanese Space Agency (JAXA; Hou et al., 2014). The spatial and temporal resolutions of the GPM are 0.1∘ and half-hourly, respectively. The GPM has been compared with other satellite precipitation products in many studies (Guo et al., 2016; Tan and Duan, 2017; Prakash et al., 2018) and ranks top among them. Besides the gridded data, in situ temperature and precipitation observations in TP were also used. There are 64 meteorological stations in total, and most of them are located in the ETP. The gauged data were quality-controlled and provided by the China Meteorological Data Service Center and were also used in the generation of the CN05.1 dataset.
4.1 Changes in snow variables with the snow assimilation
Considering that the only difference between the twin forecast experiments is whether we are assimilating IMS above 1500 m over the TP or not, the snow cover is first analysed to evaluate the effects of the snow assimilation. The spatial differences in snow cover fraction between IMS and TPSCF and between the ensemble reforecasts and TPSCF in spring are presented in Fig. 2a–c. For most places on the TP, the snow cover fraction of IMS and the two reforecasts are larger than the TPSCF snow cover fraction. The differences between the IMS and TPSCF snow cover fraction (IMS minus TPSCF) are smaller than 0.4 for most places. The snow cover fraction of the control reforecasts is significantly larger than the TPSCF snow cover fraction around the boundary of the WTP and ETP where the differences (the control reforecasts minus TPSCF) are larger than 0.6. Meanwhile, the differences in snow cover fraction when the DA reforecasts minus TPSCF are smaller than 0.4 for most places, which is consistent with the differences between IMS and TPSCF. Figure 2d–f presents the spatial differences in snow cover fraction between the two reforecasts. In both the spring and the whole period, with added snow assimilation, the snow cover fraction of the DA reforecasts is significantly smaller than that of the control reforecasts for most places on the TP, especially for the ETP and around the boundary of the WTP and ETP. However, in summer, the differences between the two reforecasts are small and range from −0.1 to 0.1 for most places. Overall, the positive bias in snow cover is much reduced in the DA reforecasts, at least in the spring.
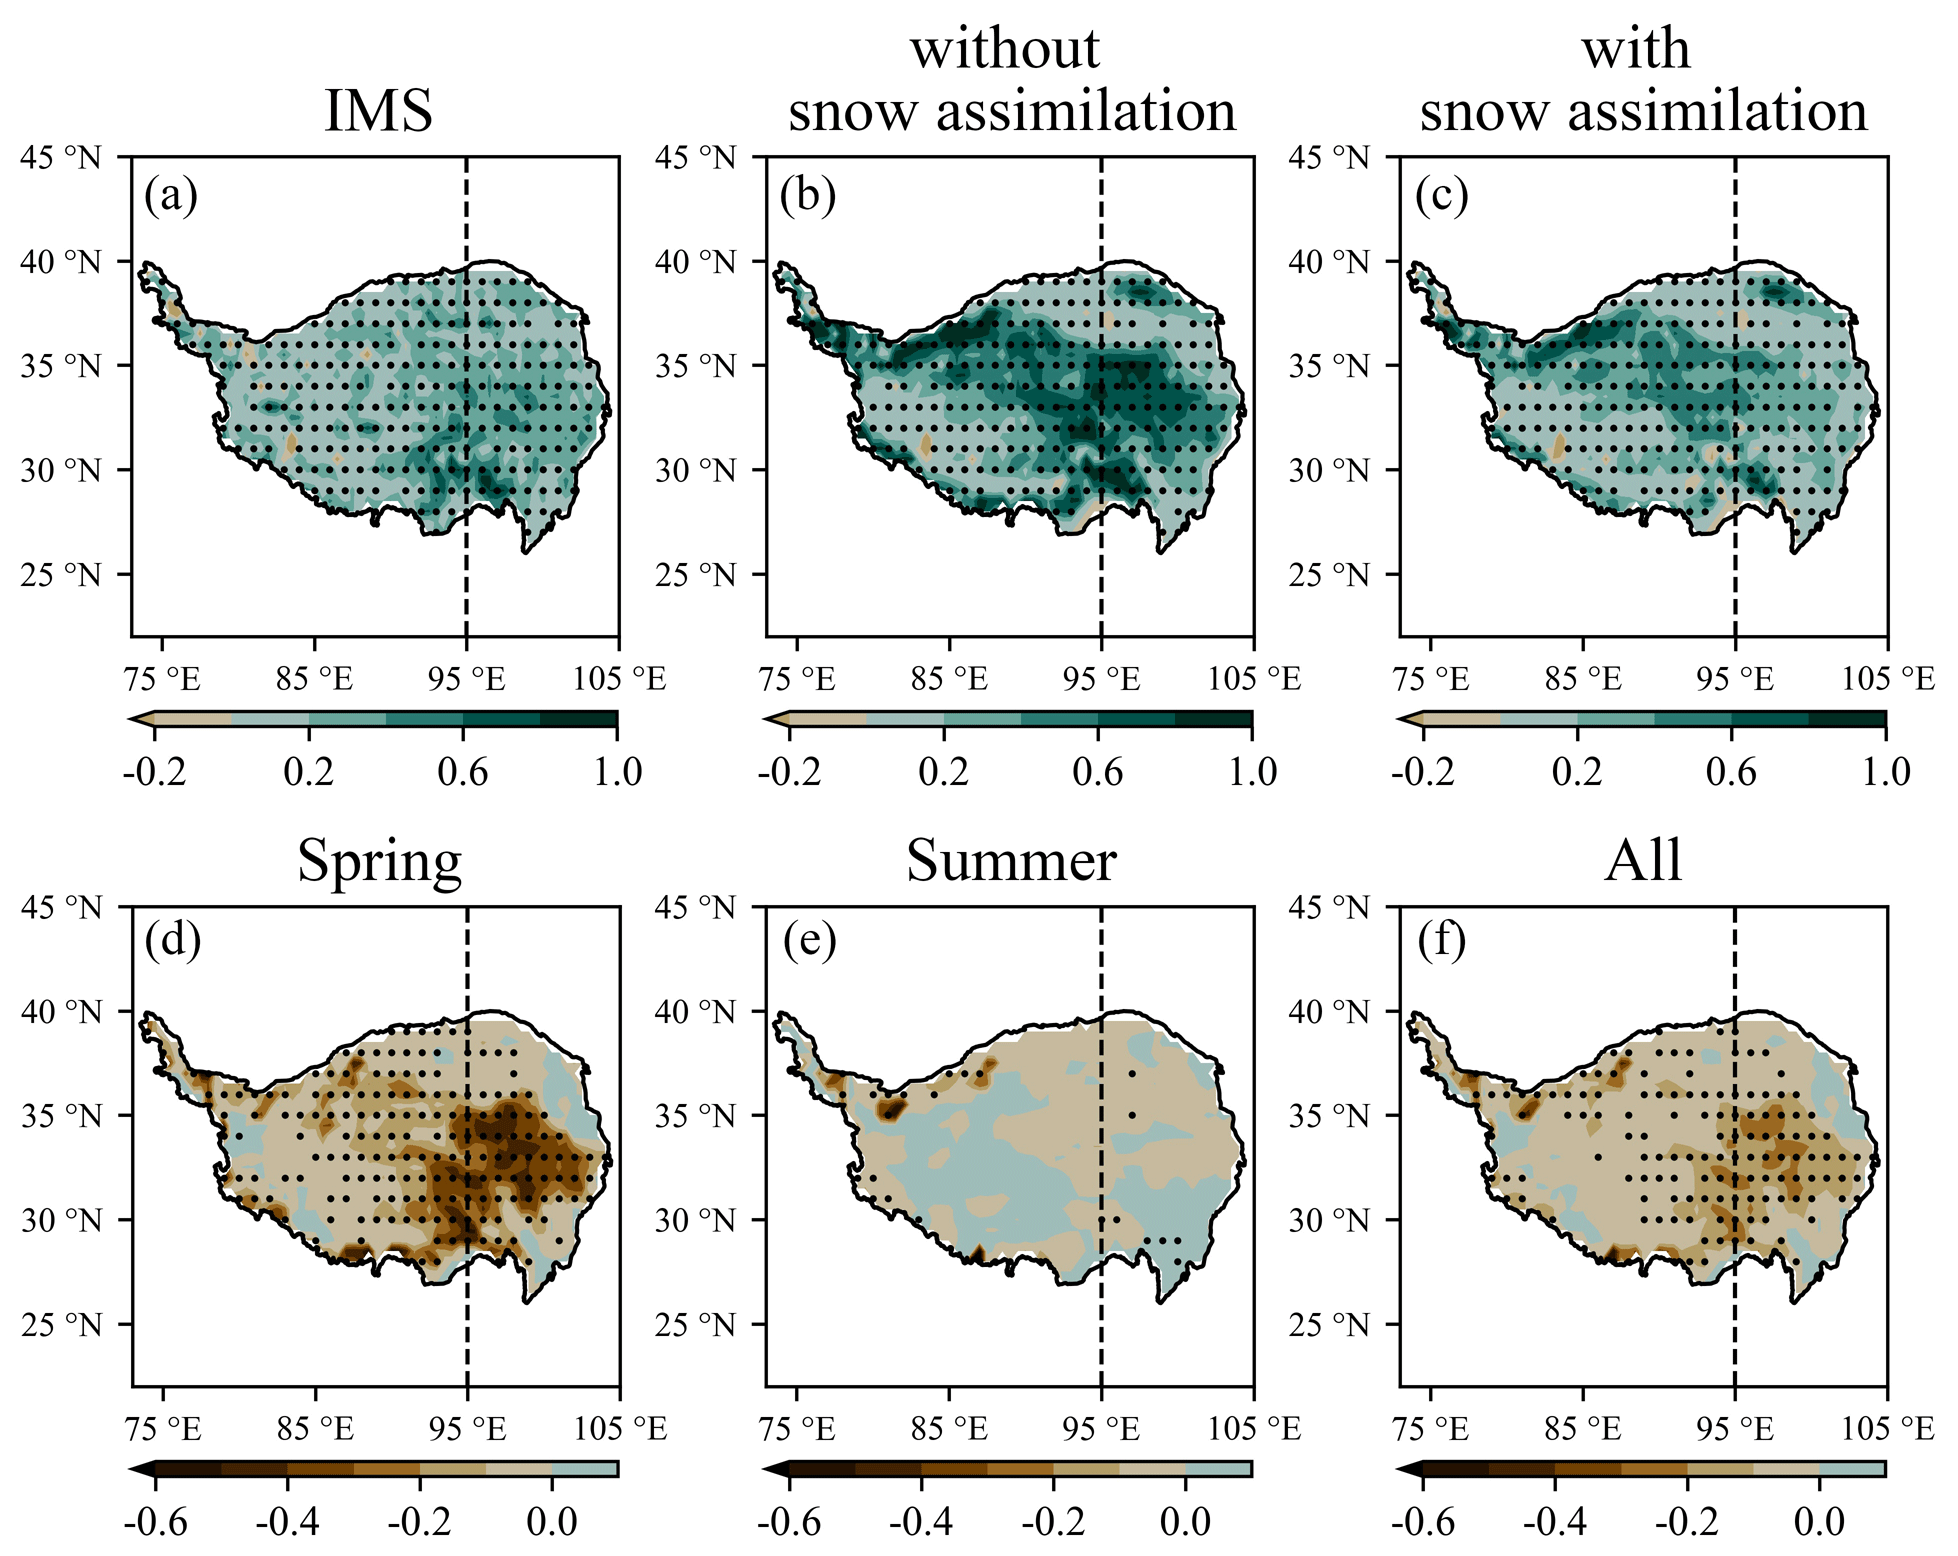
Figure 2(a–c) The spatial differences in snow cover fraction between IMS and TPSCF and between the ensemble reforecasts and TPSCF in spring. (d–f) The spatial differences in snow cover fraction between the two reforecasts (the DA reforecasts minus the control reforecasts). The stippled regions show the statistical significance of the differences identified by the t test at a 5 % significance level.
The time series of snow depth from 1 April to 31 July for the two ensemble reforecasts and TPSD are presented in Fig. 3. The snow depth was averaged over the domain (i.e. the WTP and ETP), and the times series were smoothed by a 5 d moving window. The blue area and line represent the ranges and ensemble mean of the control reforecasts, respectively, while the orange area and line represent the ranges and ensemble mean of the DA reforecasts, respectively. The black line represents TPSD data. Both in the WTP and ETP, the ensemble means of the snow depth of the two reforecasts are higher than those of the TPSD data. However, the snow depth of the DA reforecasts is closer to the TPSD data than that of the control reforecasts. The differences in snow depth between the two reforecasts decrease with time. In the WTP (Fig. 3a), the snow depth of the control reforecasts is higher than that of the DA reforecast for the whole period, while in the ETP, the snow depth of the two ensemble reforecasts is almost the same in the summer. Although the snow depth of the two ensemble reforecasts has an overall downward seasonal trend, the snow depth of the DA reforecasts increases around 15 April.
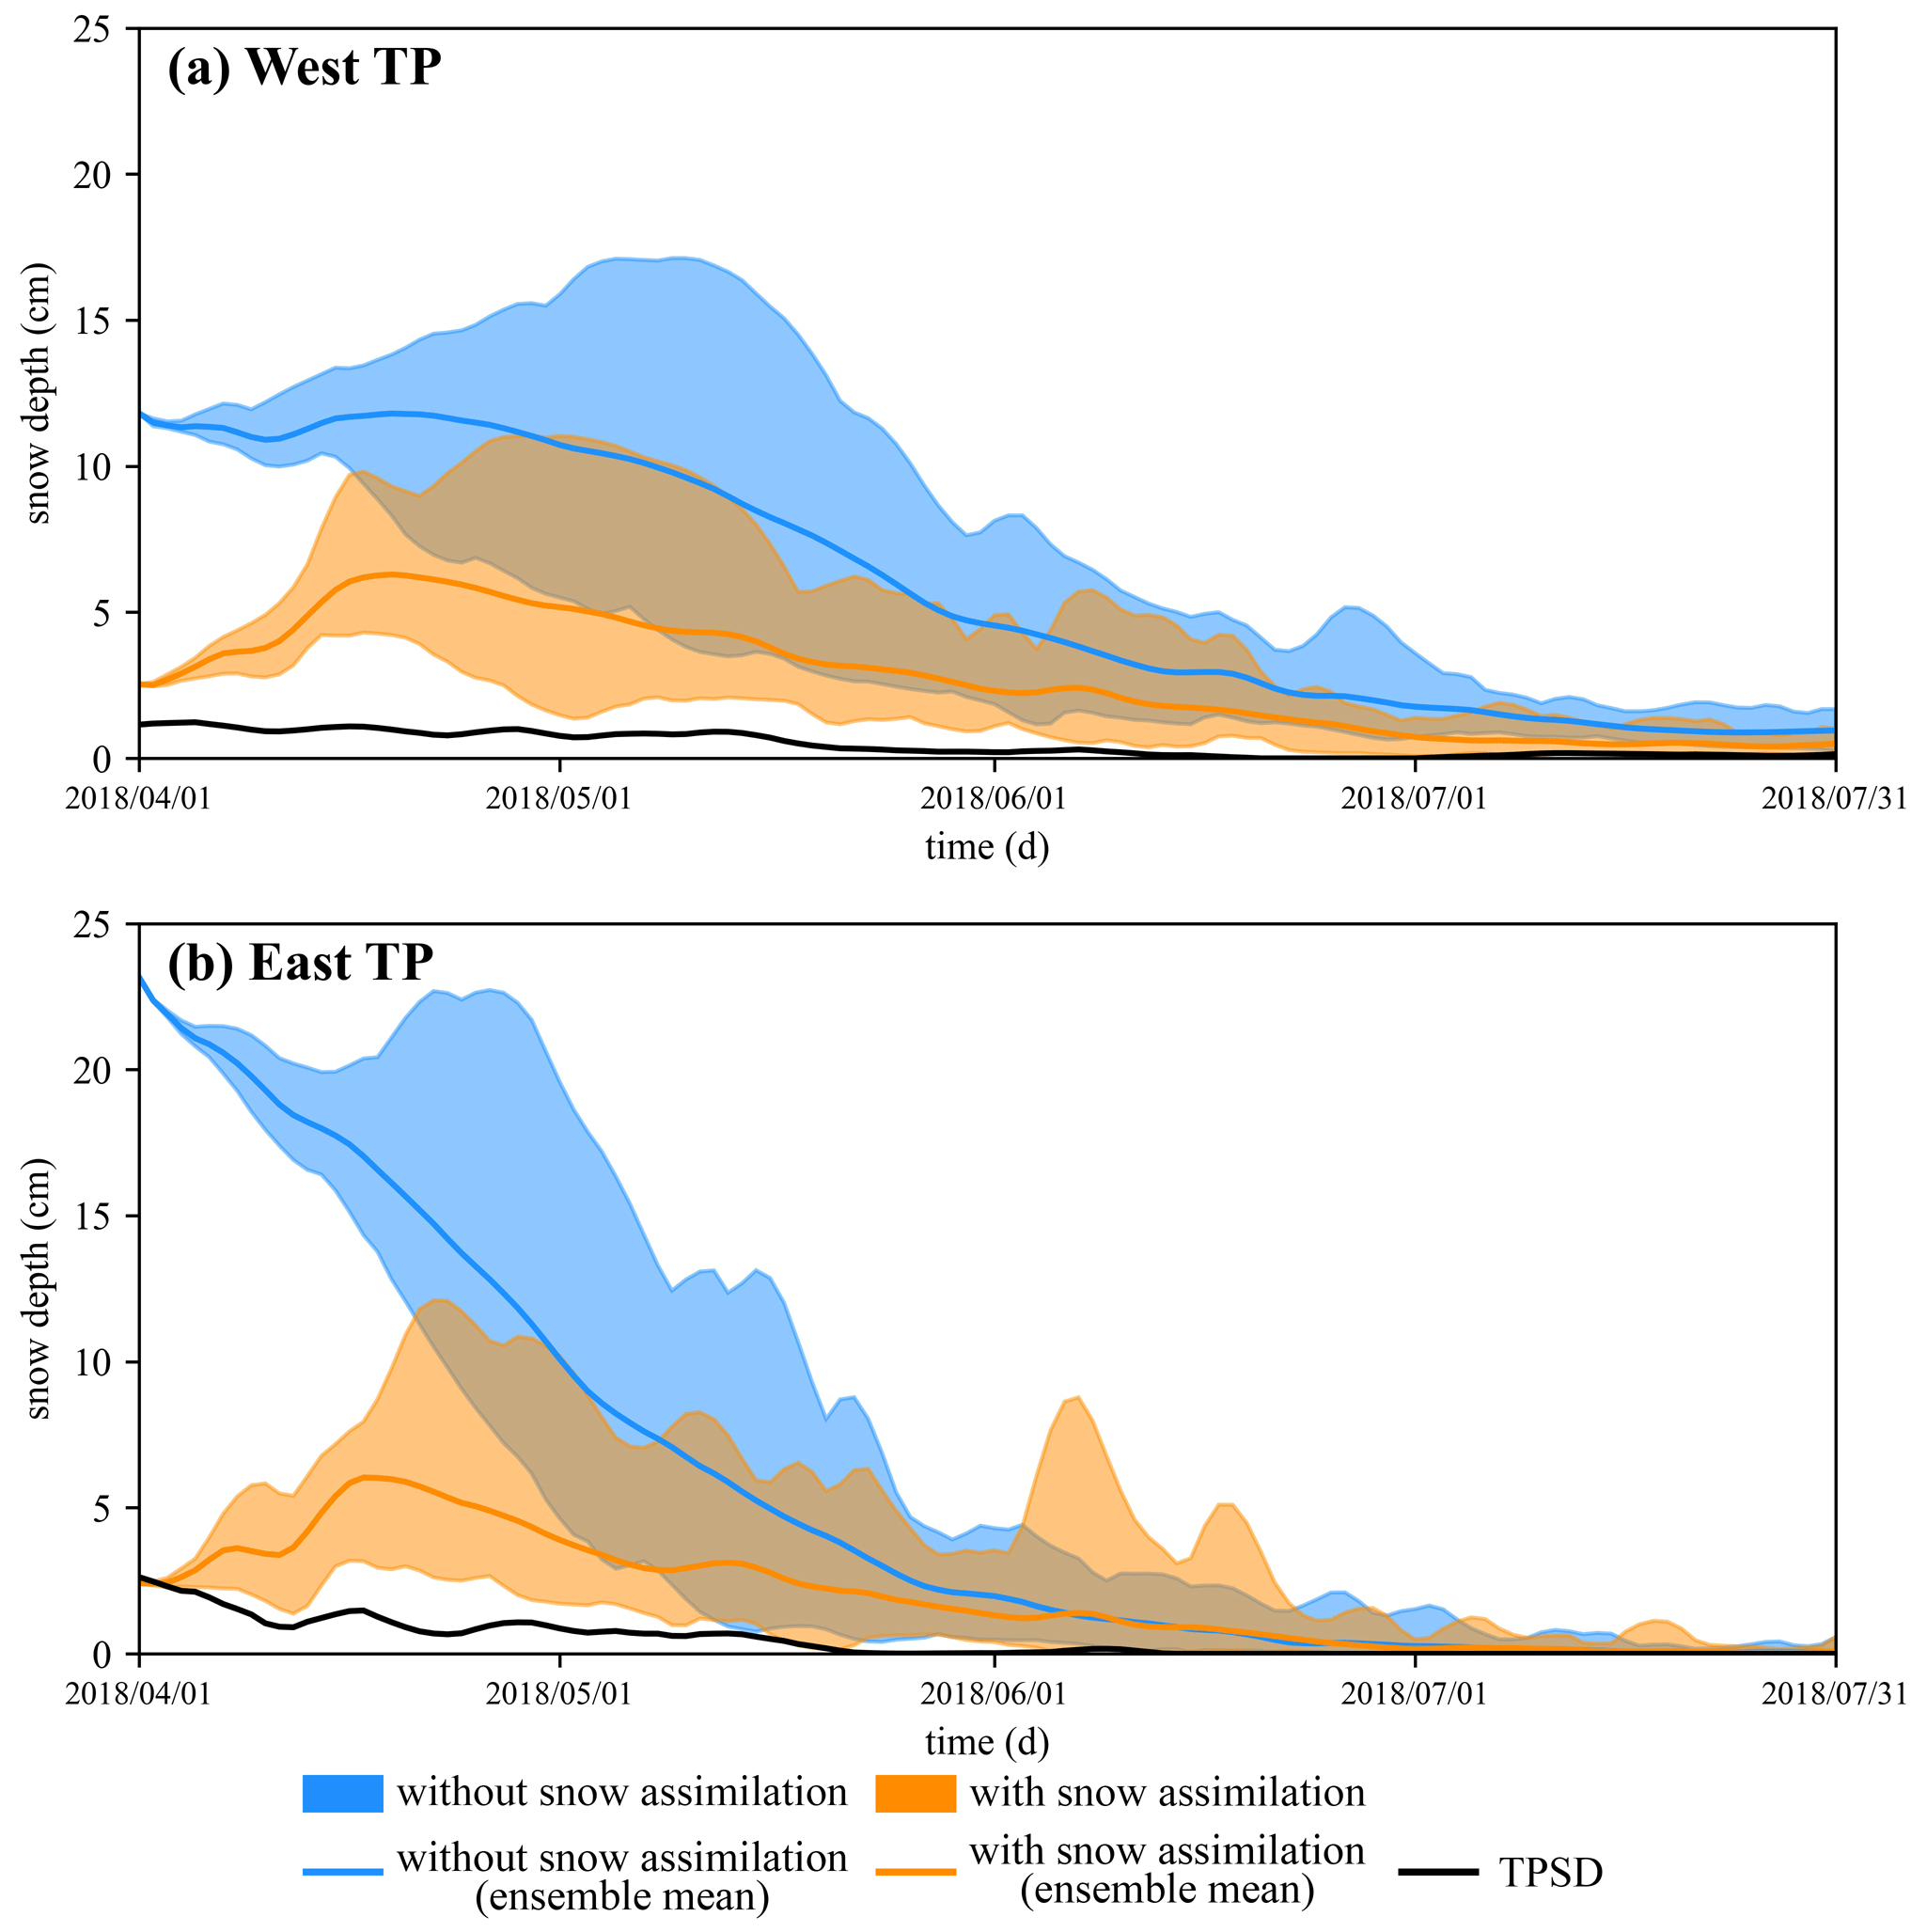
Figure 3The time series of snow depth averaged over the domain from 1 April to 31 July for the two ensemble reforecasts and TPSD data in the (a) western Tibetan Plateau and (b) eastern Tibetan Plateau.
Figure 4 presents the spatial differences in snow depth between the ensemble reforecasts and TPSD and between the two reforecasts. The spatial differences in snow depth are similar with those in snow cover fraction in spring. Generally, the snow depths of the two reforecasts are higher than the TPSD snow depth for most places of the TP. However, in both the spring and the whole period, the snow depth of the control reforecasts is significantly higher than the TPSD snow depth around the boundary of the WTP and ETP in the southern TP. The differences in snow depth between the two reforecasts (the DA reforecasts minus the control reforecasts) range from −60 to 6 cm. The positive bias in snow depth is also much reduced in the DA reforecasts, which is consistent with the decreases in snow cover fraction due to the added assimilation of IMS snow cover. The snow depth of the DA reforecasts is less than that of the control reforecasts at the 5 % significance level for most places on the TP, especially for the ETP and around the boundary of the WTP and ETP in the southern TP. As for summer, the spatial distributions of snow depth are similar between the two reforecasts. The differences between the two reforecasts range from −6 to 6 cm for most places of the TP.
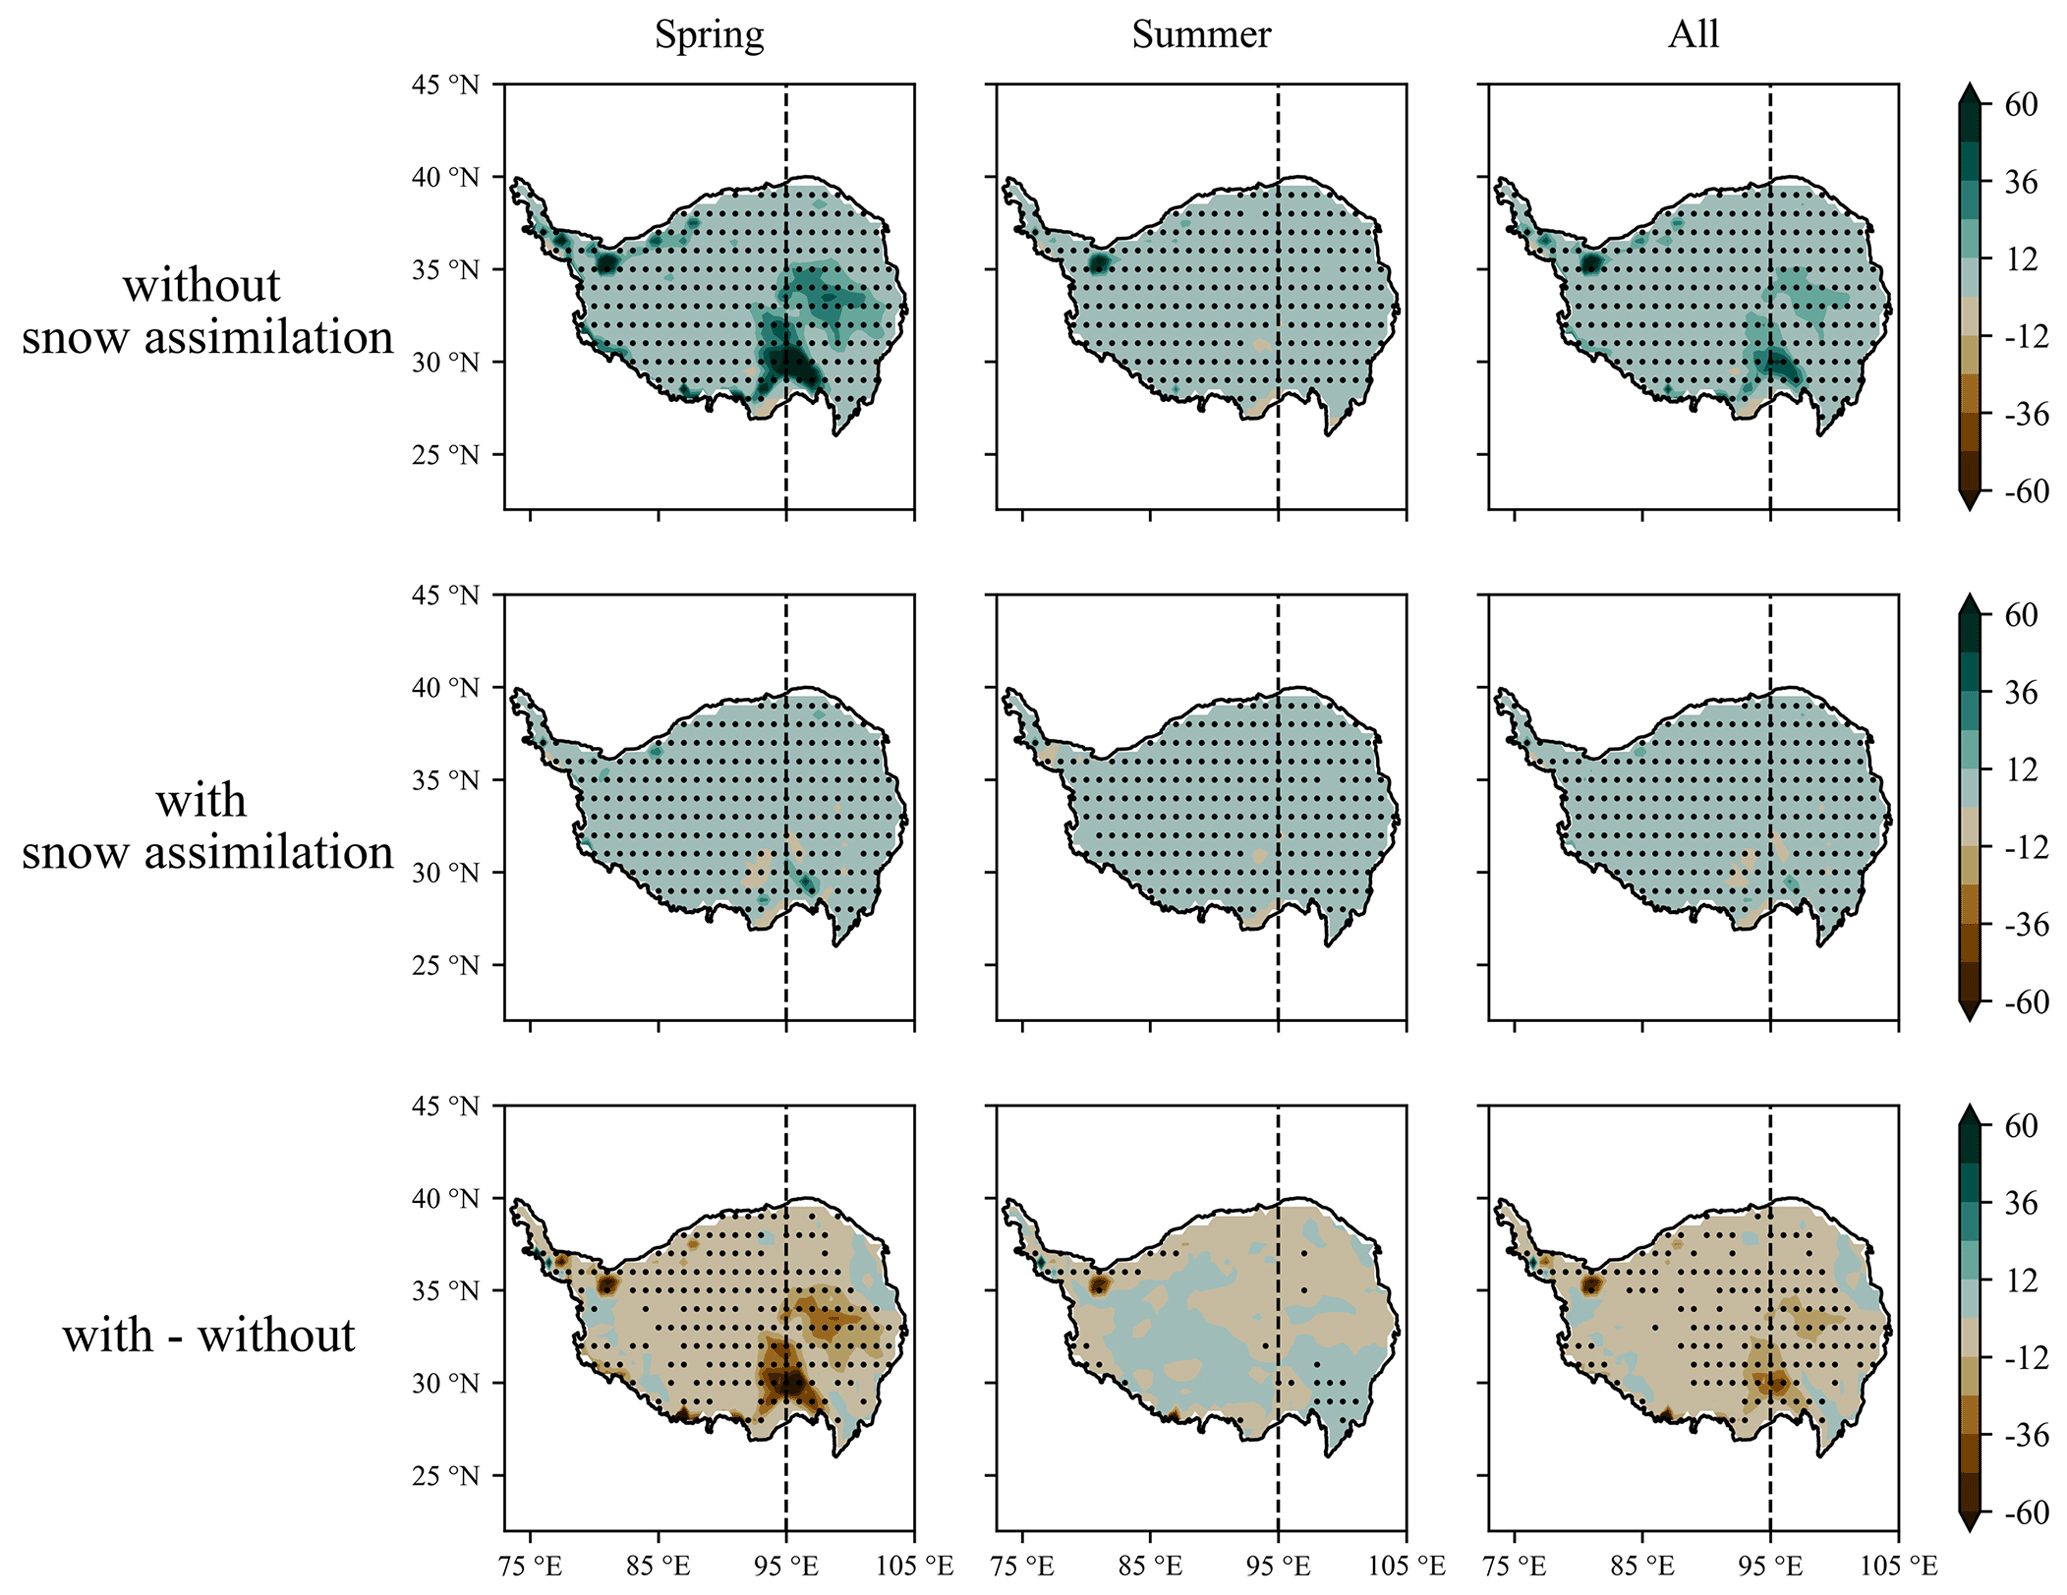
Figure 4The spatial differences in snow depth (cm) between the ensemble reforecasts and TPSD (top and middle rows) and between the two reforecasts (bottom row). The stippled regions show the statistical significance of the differences identified by the t test at a 5 % significance level.
Since the changes in snow cover lead to changes in land surface albedo after snow assimilation, Fig. 5 (top row) presents the spatial differences in land surface albedo between the two ensemble reforecasts. In either the spring or the whole period, the land surface albedo of the DA reforecasts is smaller than that of the control reforecasts for most places of the TP, especially for the ETP and around the boundary of the WTP and ETP in the southern TP. The differences in land surface albedo between the two reforecasts (the DA reforecasts minus the control reforecasts) range from −0.2 to 0.04 for most places on the TP. The significant differences in land surface albedo between the two reforecasts are mainly observed in regions where the absolute differences are larger than 0.04. While in summer, the differences in land surface albedo after snow assimilation range from −0.04 to 0.04 for most places of the TP.

Figure 5The spatial differences in land surface albedo (top row) and snowfall (bottom row; mm w.e. – millimeters of water equivalent) between the two ensemble reforecasts (the DA reforecasts minus the control reforecasts). The stippled regions show the statistical significance of the differences identified by the t test at a 5 % significance level.
Considering that the snow depth of the reforecasts changes significantly after snow assimilation, the spatial differences in snowfall between the two ensemble reforecasts are also analysed (Fig. 5, bottom row). In either the spring or the whole period, the snowfall of the DA reforecasts is more than that of the control reforecasts in the southeastern TP, especially around the boundary of the WTP and ETP, while the results are reversed in the WTP. Moreover, the differences in snowfall between the two reforecasts range from −0.2 to 0.8 mm w.e., and the spatial differences are statistically significant at the 5 % significance level mainly for regions where the differences are larger than 0.3 mm w.e. In summer, the snowfall of the DA reforecasts is more than that of the control reforecasts in the southwestern TP, while the results are reversed in the northeastern TP. The differences in snowfall between the two reforecasts range from −0.2 to 0.2 mm w.e. for most places on the TP.
In summary, the main points are that snow assimilation reduces the positive biases of the snow cover fraction and snow depth in spring over most areas of the TP, while its impact is limited in the summer, and all the snow variables change significantly after snow assimilation for the ETP and around the boundary of the WTP and ETP in the southern TP. The reduced snow cover fraction leads to a diminished surface albedo.
4.2 Evaluation of the temperature and wind reforecasts
4.2.1 Evaluation of the temperature reforecasts
Figure 6 presents the daily temperature time series from 1 April to 31 July for the two ensemble reforecasts and CN05.1 data. The temperature reforecasts were averaged over the domain (i.e. the WTP and ETP), and the time series was smoothed by a 5 d moving window. The black line represents CN05.1 data. In the WTP (Fig. 6a), the ensemble means of the temperature reforecasts are lower than the CN05.1 temperature. However, the DA reforecasts are in excellent agreement with the CN05.1 temperature at the initial time (thereby reducing the large initial bias as expected from a decreased snowpack) and are slightly closer to CN05.1 in the first month and a half. In the ETP (Fig. 6b), the initial bias reduction is even larger (about 5 K), and while the ensemble means of temperature reforecasts are lower than the CN05.1 temperature for most of the time, they remains closer to the CN05.1 temperature for about 1.5 months. The temperatures show little change between both reforecast ensemble means after June, which is consistent with the lack of change in the snowpack in summer.
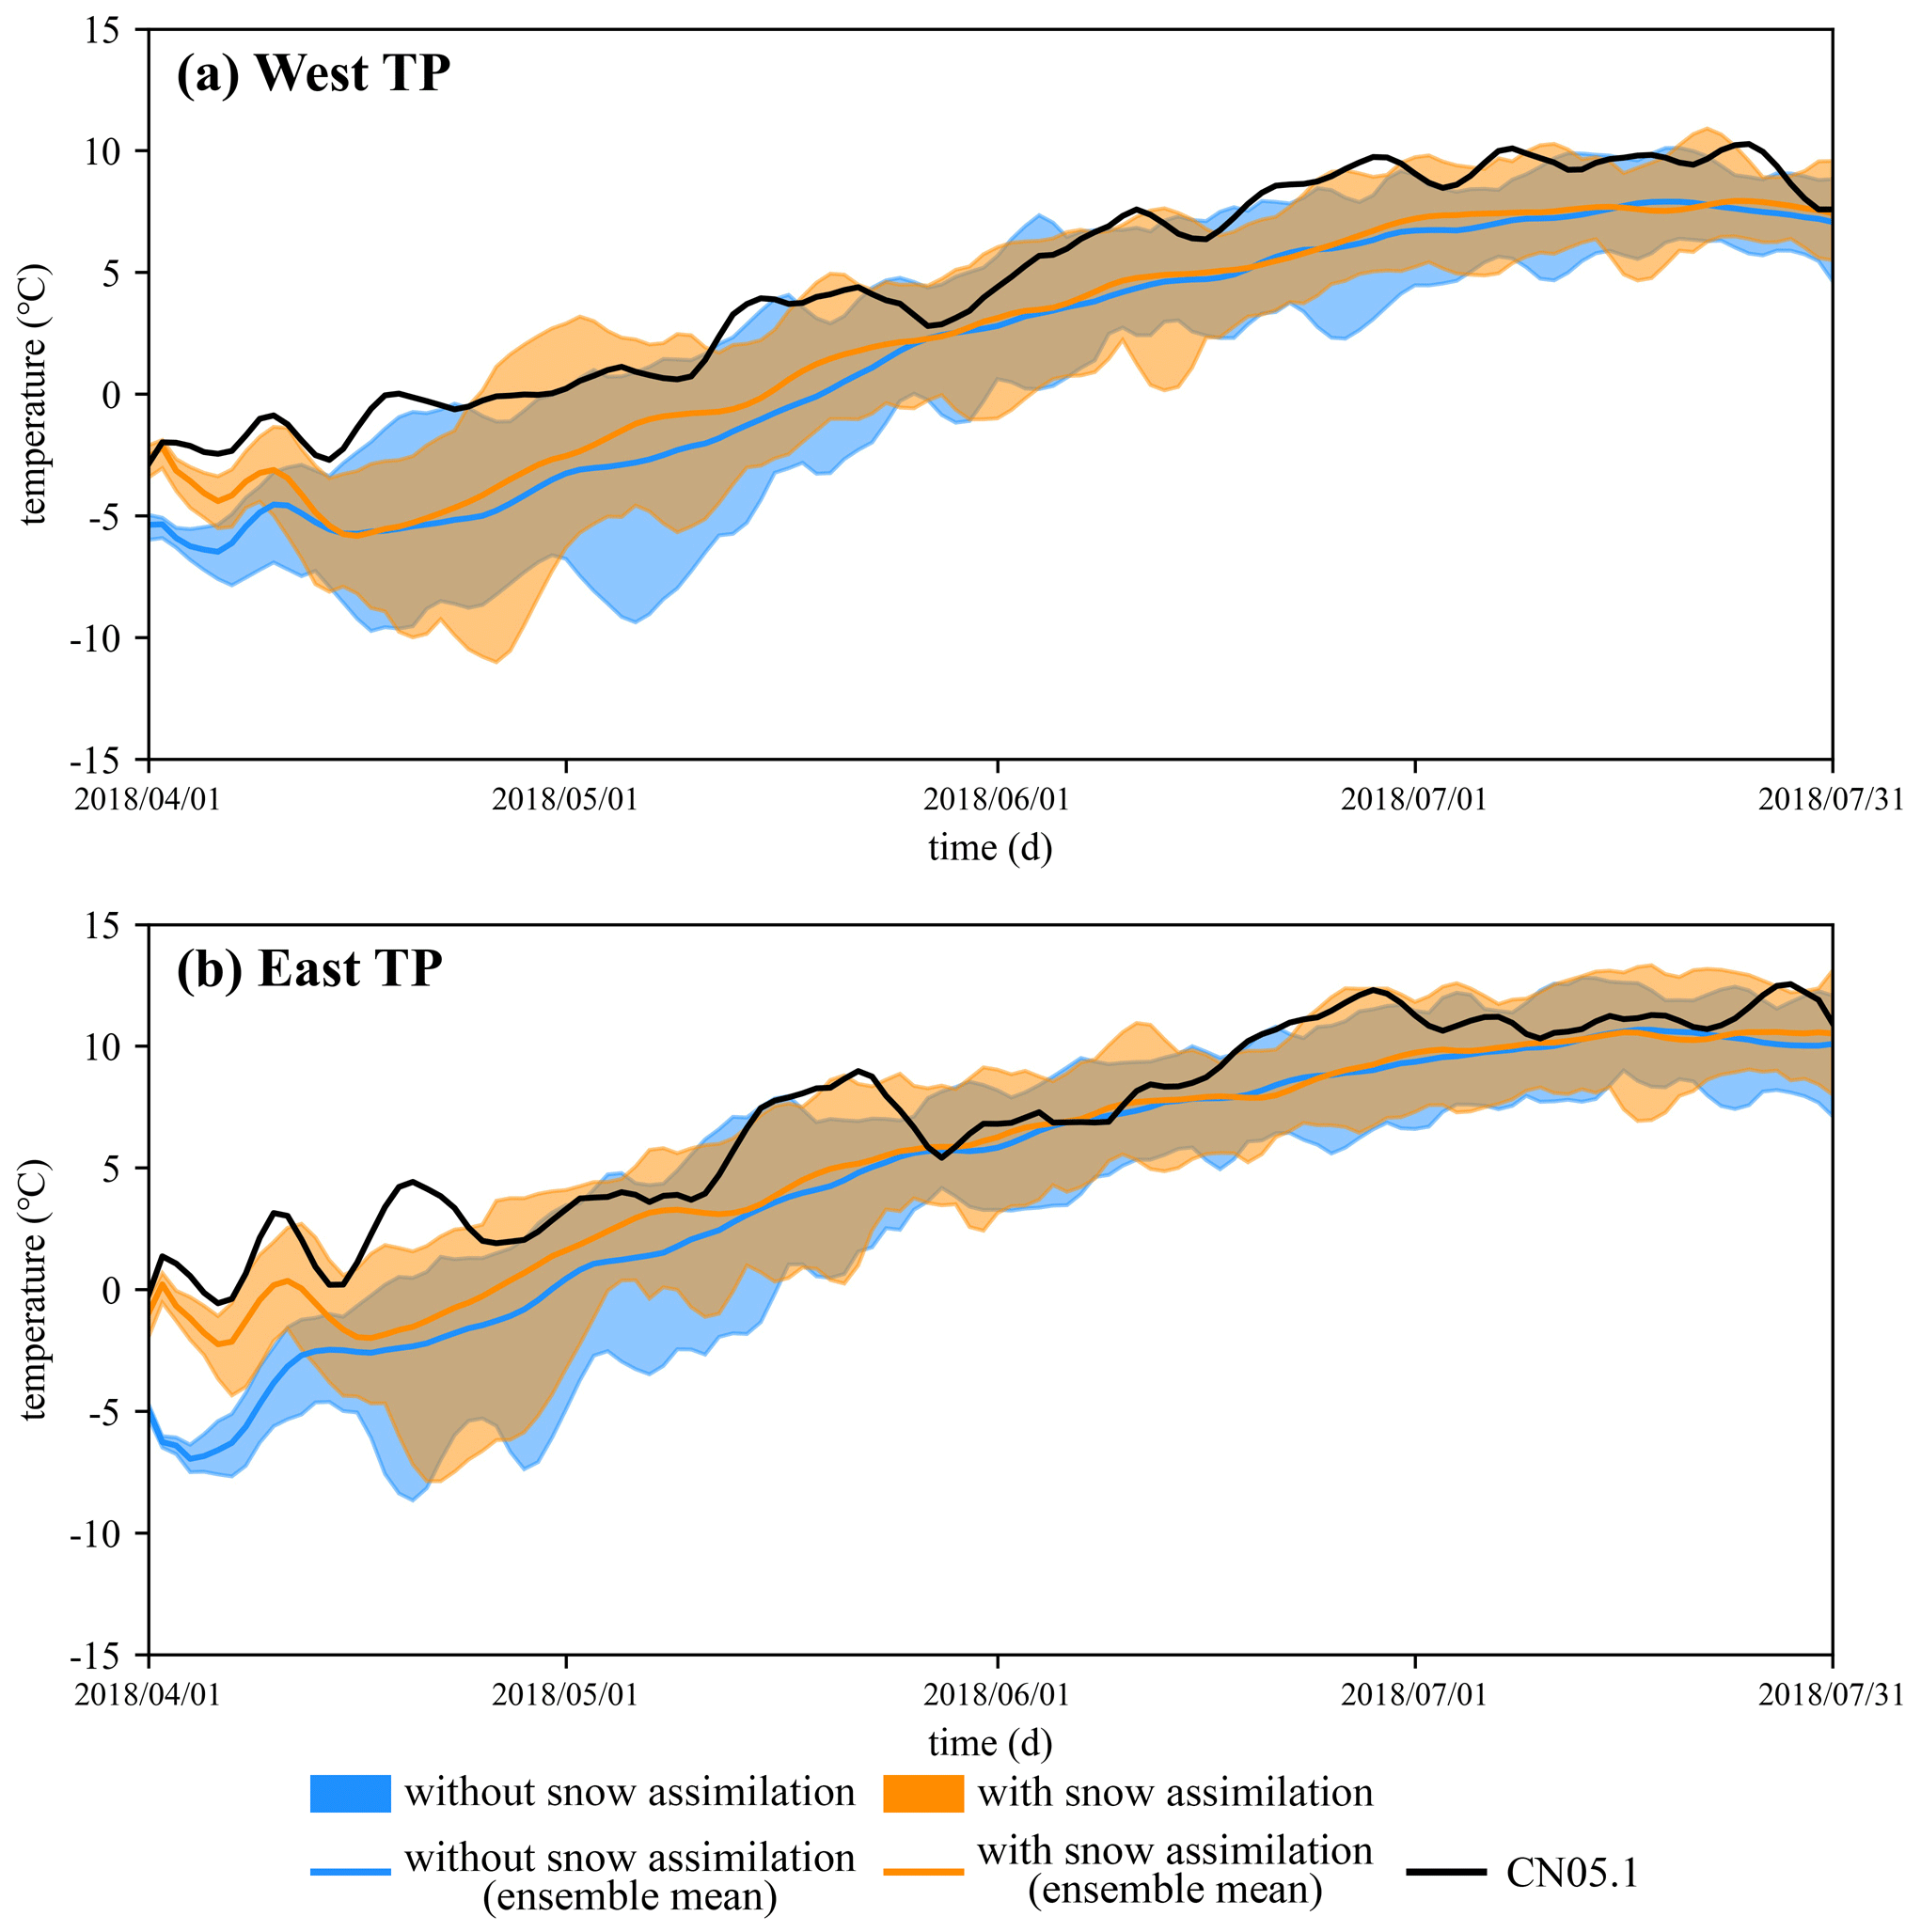
Figure 6The daily temperature time series averaged over the domain from 1 April to 31 July for the two ensemble reforecasts and CN05.1 data in the (a) western Tibetan Plateau and (b) eastern Tibetan Plateau.
The basin-averaged Spearman's correlation coefficients (CCs) and mean absolute errors (MAEs) of daily temperature between the two ensemble reforecasts and CN05.1 data are presented in Fig. 7. The CCs here are calculated for temporal correlations. The plus sign in the figure represents the outlier when calculating the metrics. In the WTP, the CCs of temperature are higher than 0.80, and the MAEs are smaller than 4.2 ∘C. After snow assimilation, the median and mean values of the CCs and MAEs are smaller. In the ETP, the CCs are higher than 0.78, and the MAEs are smaller than 3.6 ∘C. As for the WTP, the MAEs of the DA reforecasts are smaller than those of the control reforecasts, indicating that the snow assimilation improves the temperature forecasts. Furthermore, the correlations and mean error in daily temperature between the temperature reforecasts and CN05.1 temperature are lower in the ETP than in the WTP.
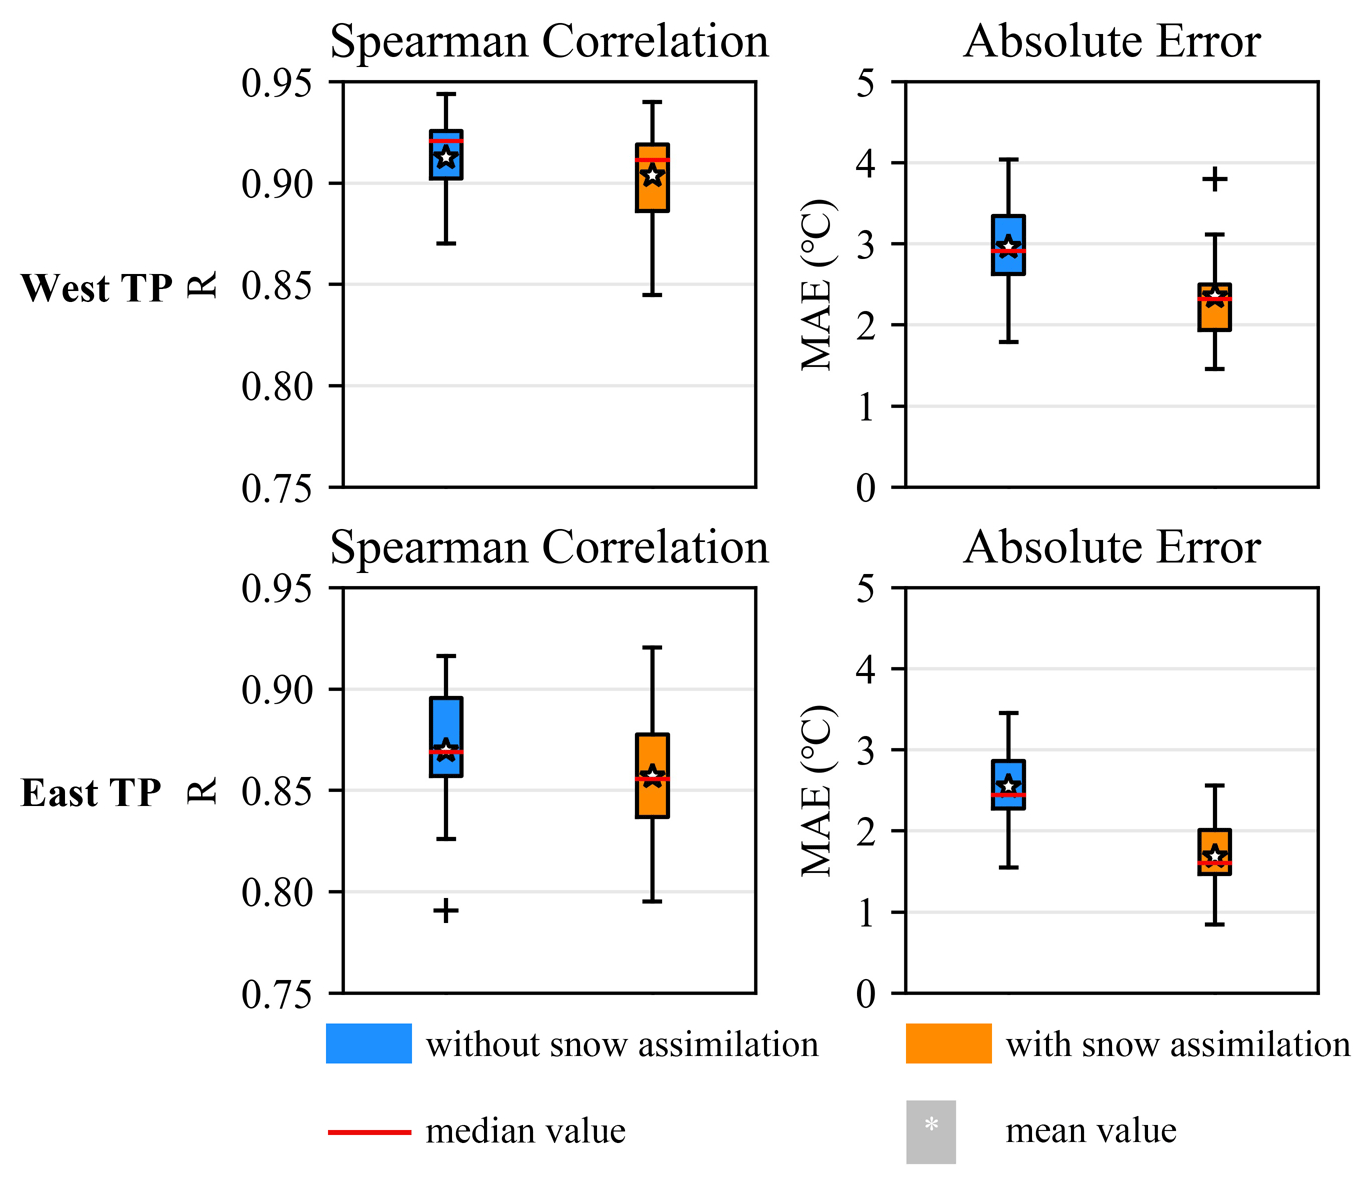
Figure 7The Spearman's correlation coefficient and mean absolute error in daily temperature between the two ensemble reforecasts and CN05.1 data.
Figure 8 presents the spatial differences in daily temperature between the ensemble reforecasts and CN05.1 data and between the two reforecasts. In spring, the temperature reforecasts are lower than the CN05.1 temperature for most places of the TP. After snow assimilation, the reforecasts become closer to the CN05.1 temperature, especially for the ETP and around the boundary of the WTP and ETP. In summer, for most places of the TP, the temperature reforecasts are lower than the CN05.1 temperature, and the spatial differences in daily temperature between the two reforecasts range from −0.4 to 0.4 ∘C. For the whole period, the spatial differences between the temperature reforecasts and CN05.1 daily temperature are similar to those in spring. The most distinctly spatial characteristic is that the temperature of the DA reforecasts is significantly higher than that of the control reforecasts for the ETP and around the boundary of the WTP and ETP. Moreover, the spatial differences between the temperature reforecasts and CN05.1 daily temperature are statistically significant at the 5 % significance level for places where the absolute differences are larger than 2.0 ∘C, while the statistically significant regions of the spatial differences between the two reforecasts are mainly concentrated in regions where the differences are larger than 1.2 ∘C.
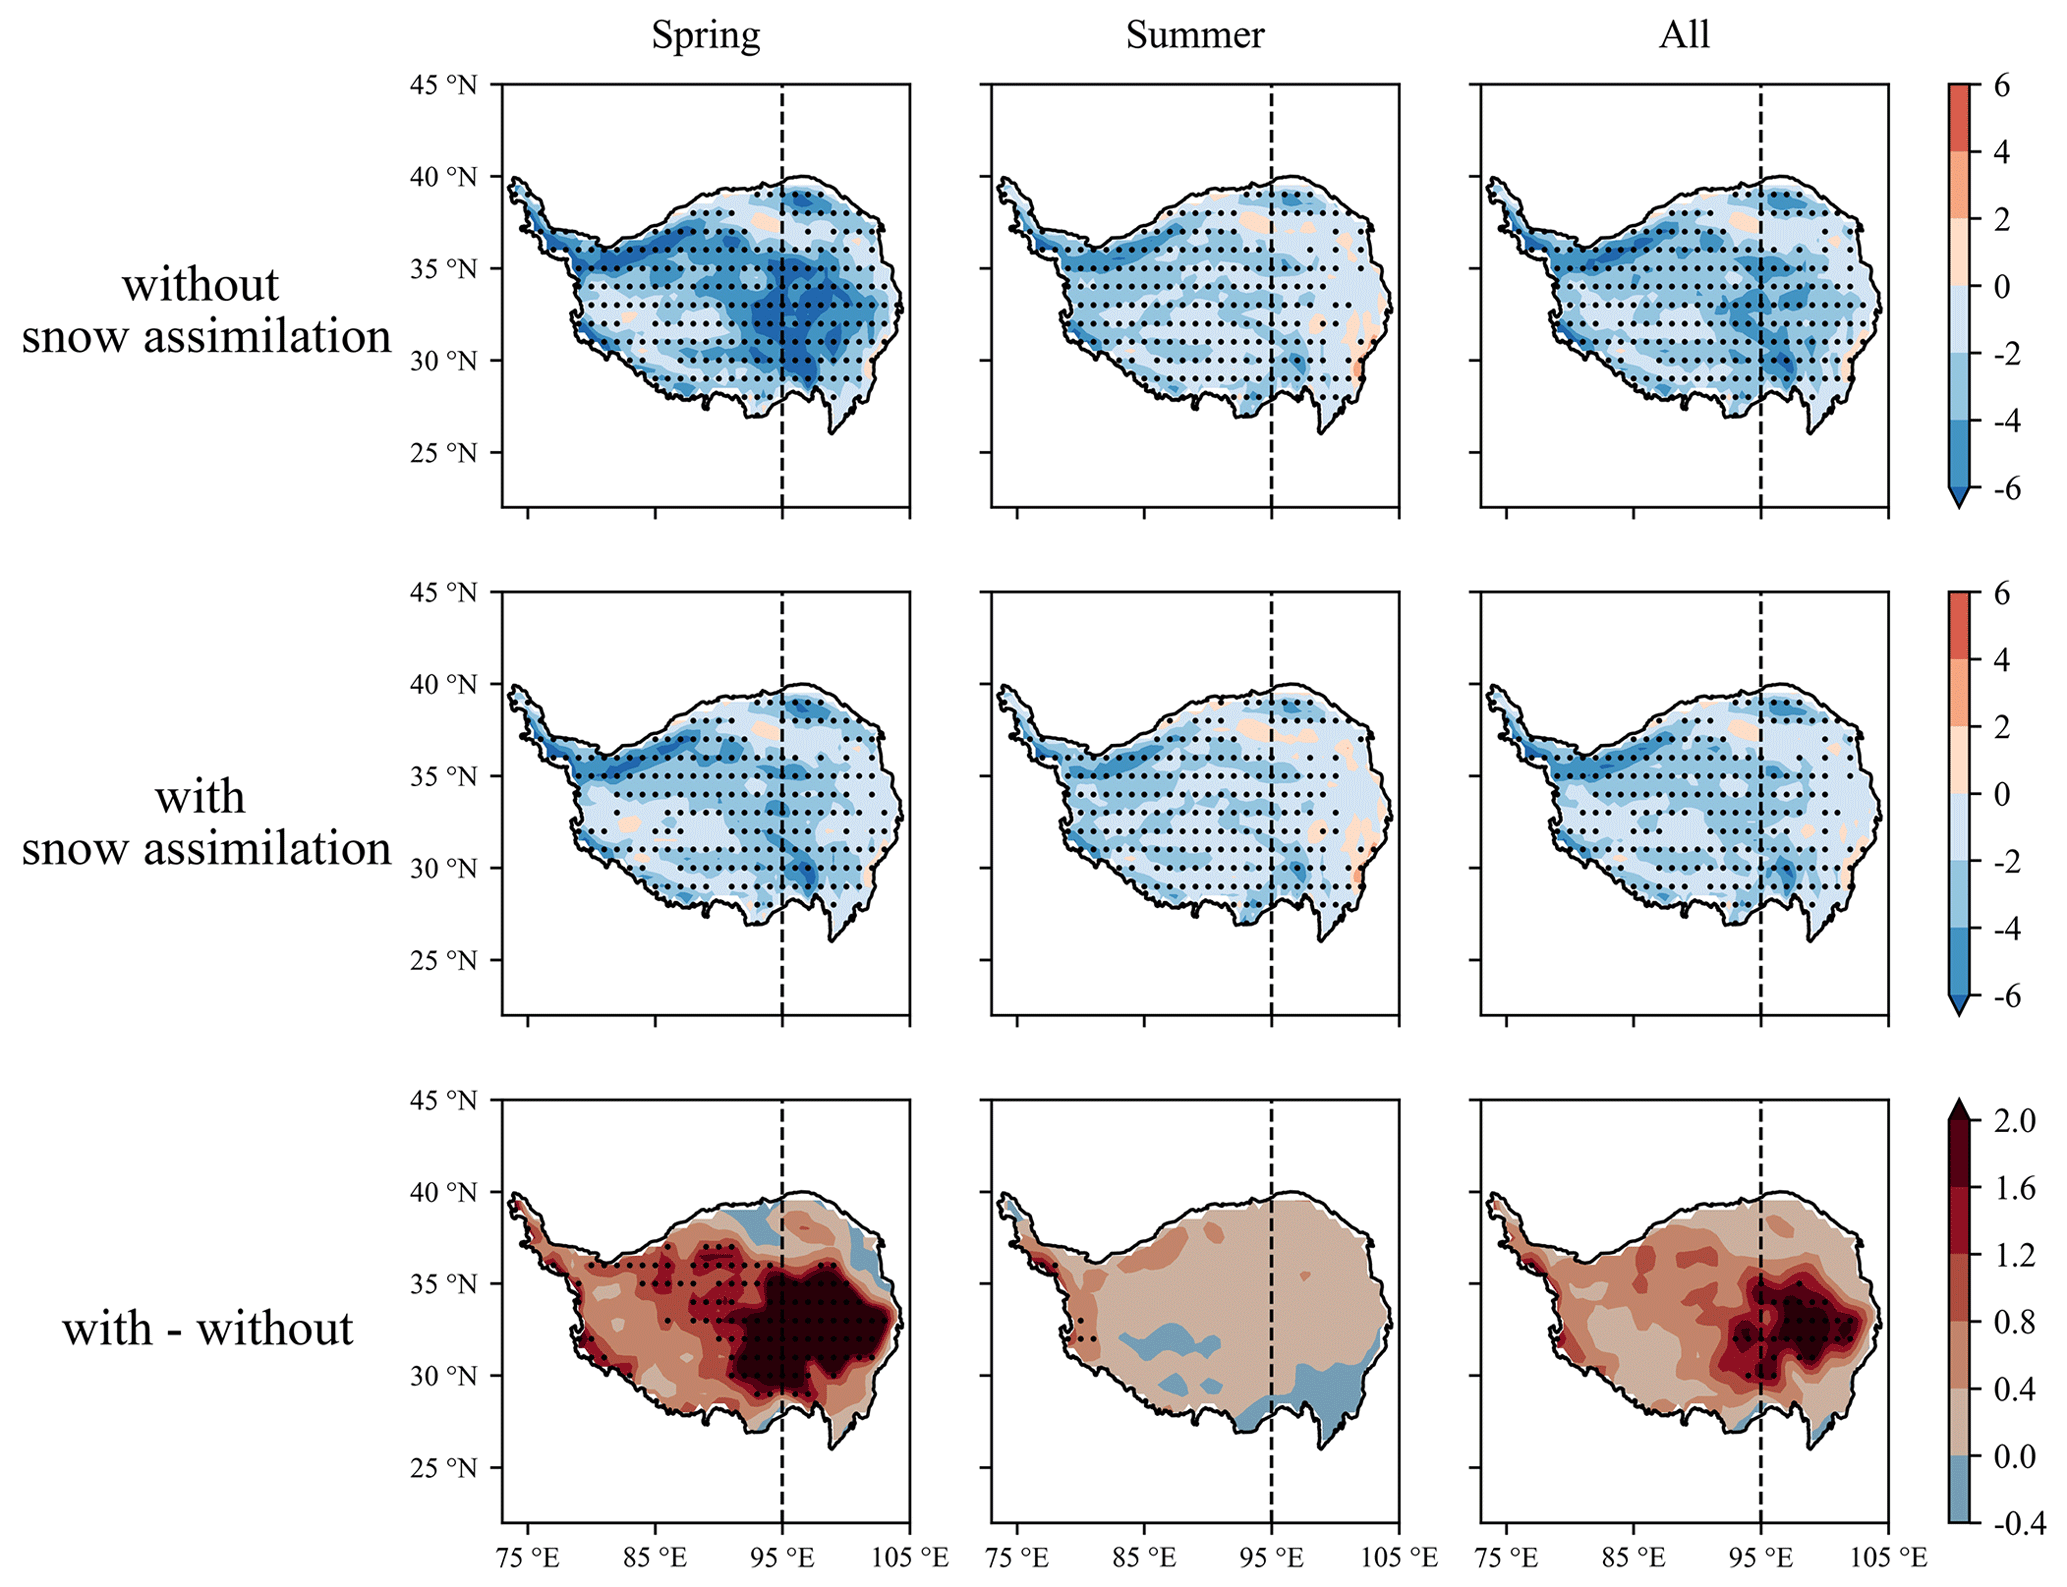
Figure 8The spatial differences in daily temperature (∘C) between the ensemble reforecasts and CN05.1 data (top and middle rows) and between the two reforecasts (bottom row). The stippled regions show the statistical significance of the differences identified by the t test at a 5 % significance level.
4.2.2 Changes in wind field and upper air variables with the snow assimilation
It is noticeable that the significant differences in snow variables between the two reforecasts, while present over most of the TP in the spring, nevertheless maximize for the ETP and around the boundary of the WTP and ETP in the southern TP (Figs. 2, 4 and 5), which is consistent with the spatial changes in temperature (Fig. 8). Furthermore, besides the local impacts of snow assimilation on temperature, the wind field is also influenced by the snow assimilation. Therefore, the changes in 10 m horizontal wind field after snow assimilation are also analysed (Fig. 9). With snow assimilation, the wind speed of the DA reforecasts is much larger than that of the control reforecasts in the ETP in either the spring or the whole period. Moreover, the closer to the centre of the ETP, the larger the wind speed increase. By contrast, the added snow assimilation has little impact on the 10 m wind field in summer as the snowpack state changes little in the meantime.
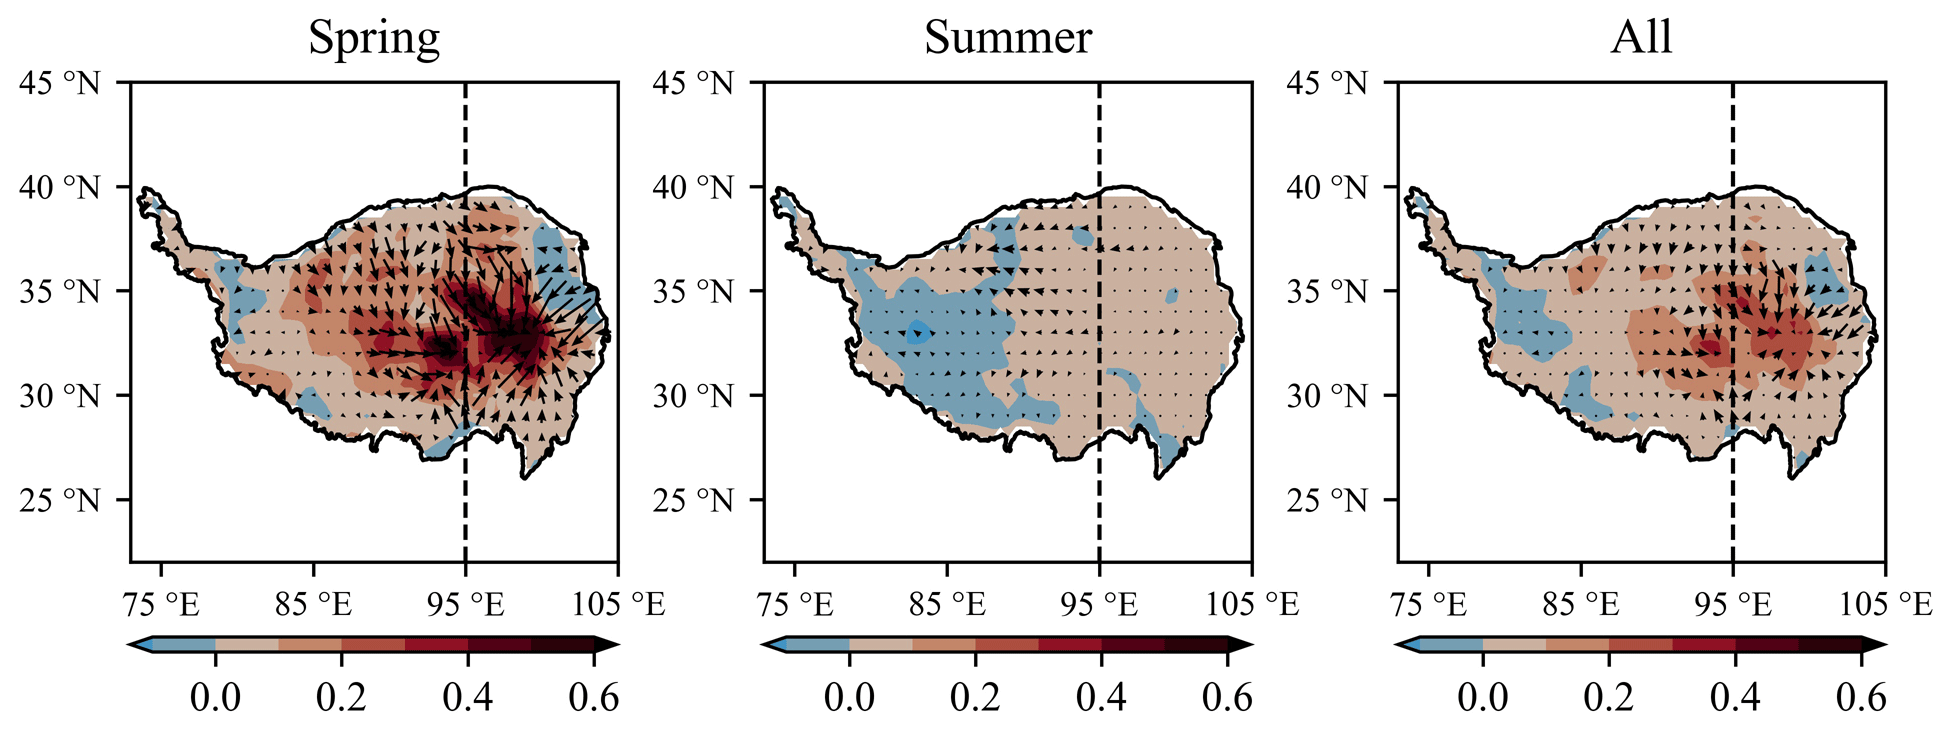
Figure 9The spatial differences in 10 m horizontal wind field (m s−1) between the two ensemble reforecasts (the DA reforecasts minus the control reforecasts). The shaded contours are wind speed.
Figure 10 presents the geopotential height and temperature at 600 hPa. The geopotential height at 600 hPa is used to analyse the cyclonic anomalies with added snow assimilation. In spring or the whole period, the geopotential height at 600 hPa of the DA reforecasts is lower than that of the control reforecasts for the whole TP, especially for the ETP and around the boundary of the WTP and ETP. The significant differences in geopotential height at 600 hPa between the two reforecasts are mainly observed in regions where the absolute differences are larger than 4 gpm (geopotential metres). The results are consistent with convergence and ascent and are also consistent with past results in previous study. Zhang et al. (2021) found that a cyclonic anomaly over TP, i.e. increased low-level convergence and ascent, was in response to decreased snow cover in late spring.
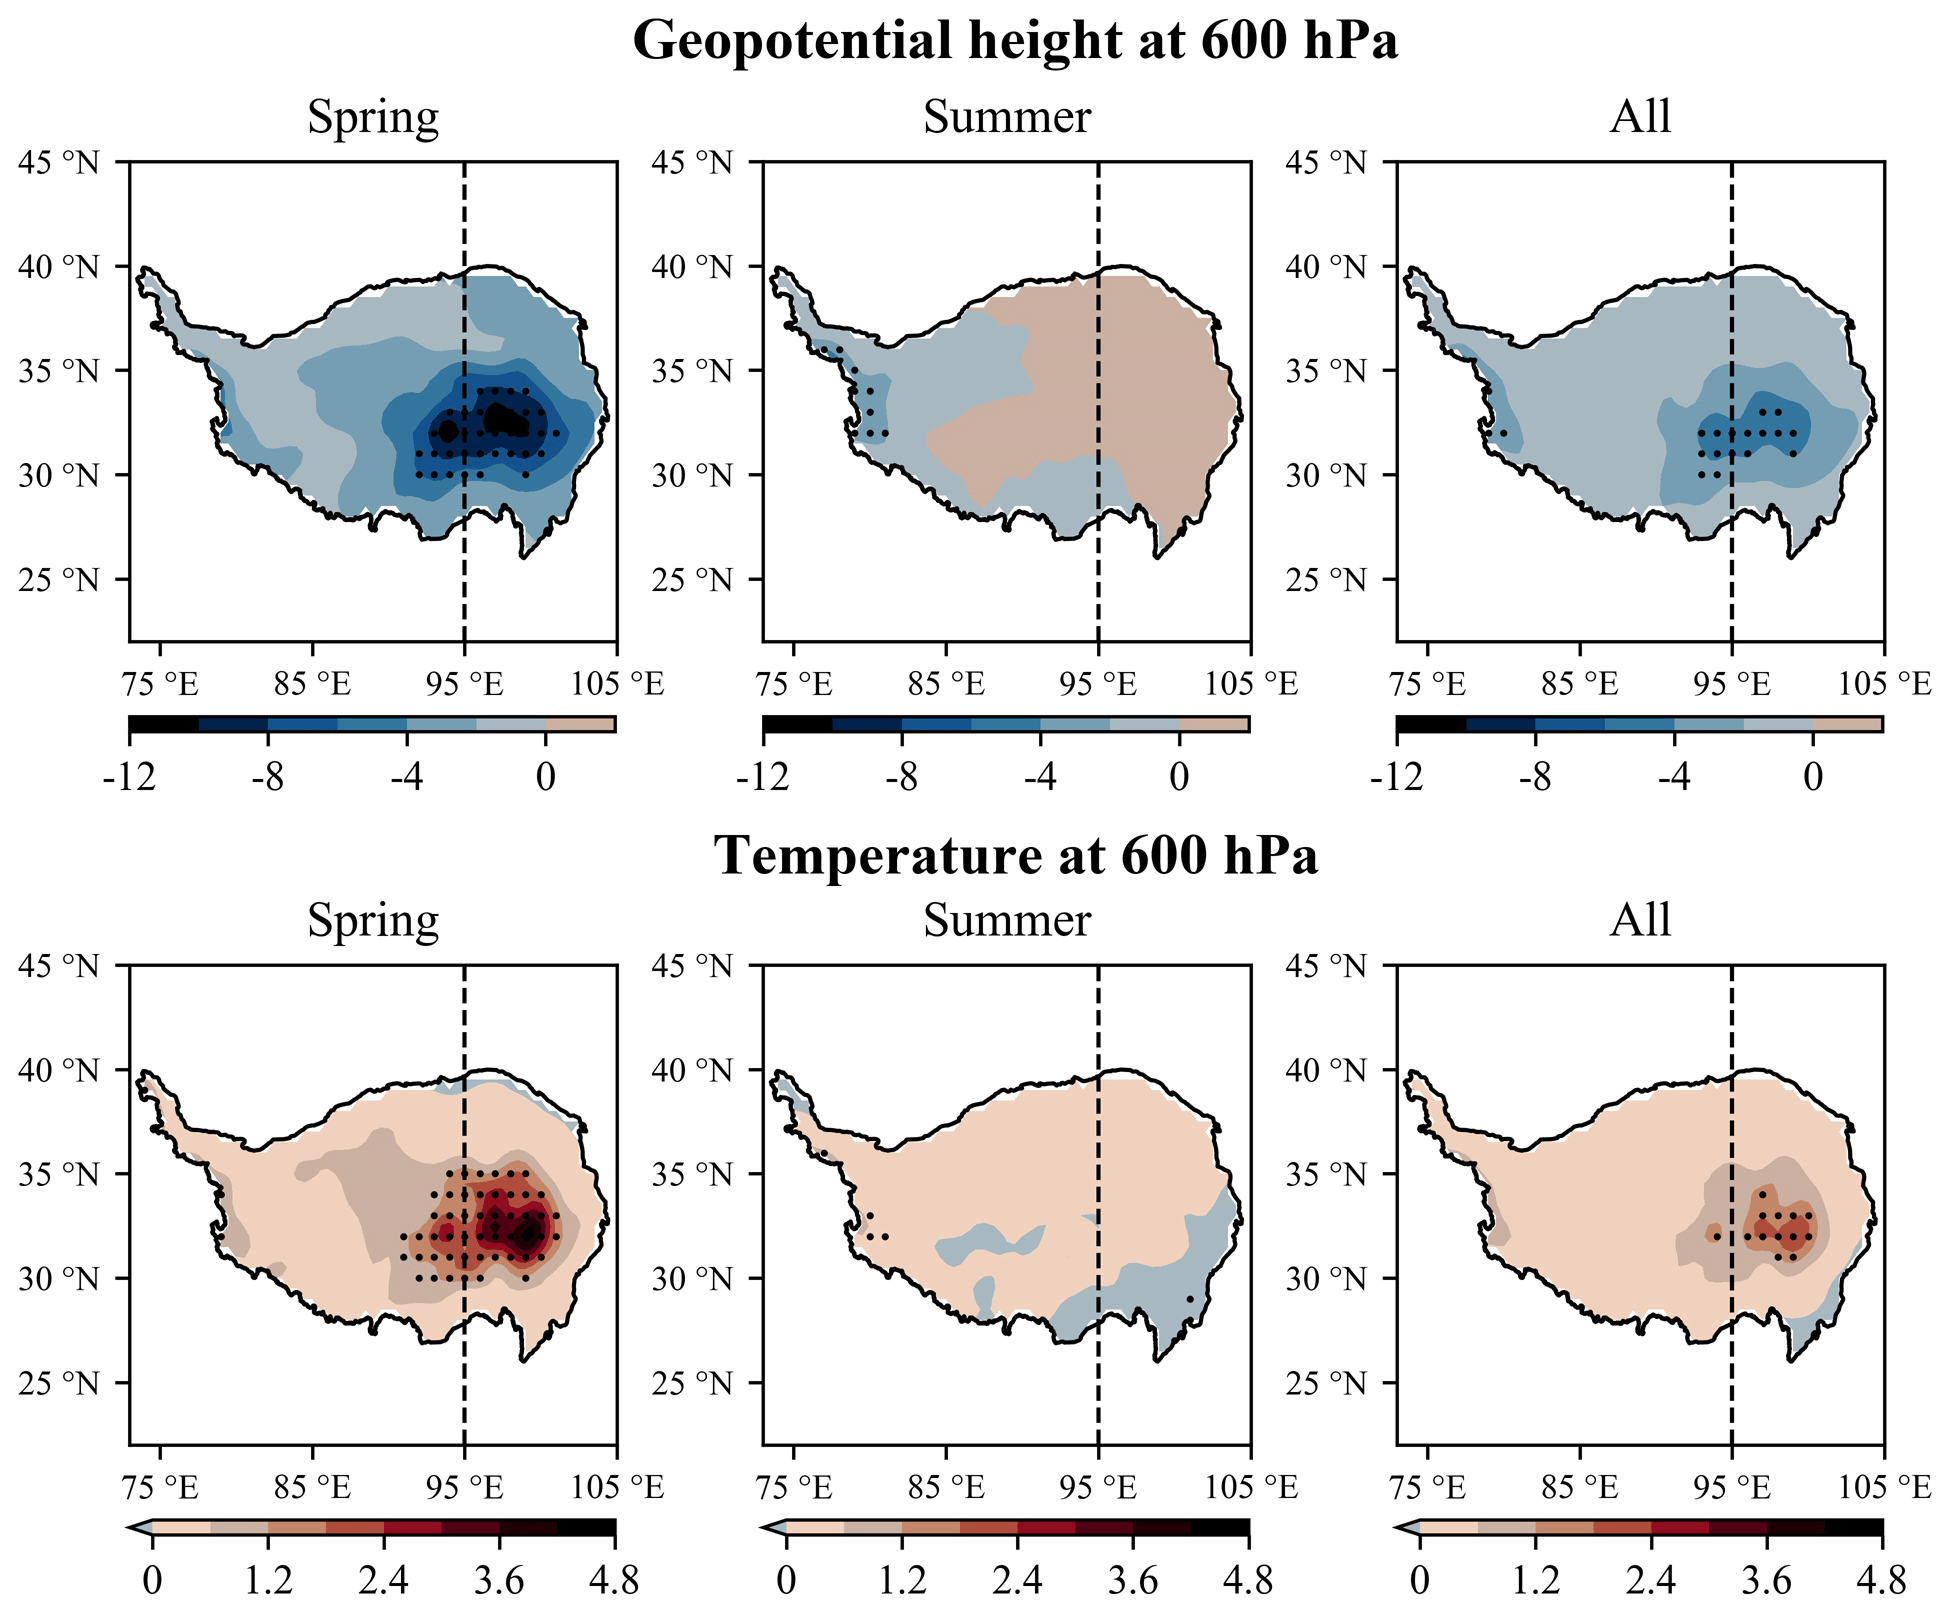
Figure 10The spatial differences in geopotential height (geopotential metres – gpm) and temperature (∘C) at 600 hPa between the two ensemble reforecasts (the DA reforecasts minus the control reforecasts). The stippled regions show the statistical significance of the differences identified by the t test at a 5 % significance level.
The temperature at 600 hPa is also presented to further explain the changes in wind field with added snow assimilation. It can be seen that, in spring and the whole period, the temperature at 600 hPa of the DA reforecasts is higher than that of the control reforecasts for most areas of the TP, especially for the ETP and around the boundary of the WTP and ETP. Hence, the local signal in surface temperature extends throughout the lower troposphere. The spatial differences in temperature at 600 hPa are similar to those of the geopotential height at 600 hPa but reversed, i.e. the temperature increases when the geopotential height decreases. This increase in temperature implies convergence and ascent. The low pressure and convergence are consistent with the increase in horizontal wind speed (Fig. 9).
4.3 Evaluation of the precipitation reforecasts
Despite the notable improvements in the predicting snow and surface temperature in the snow assimilation forecasts, at least in the first month and a half, it remains to be seen if these translate to precipitation. Actual predictability studies with dynamical prediction systems stressed that a more realistic land initialization improves surface temperature forecasts, but the impact on precipitation remains weaker (Koster et al., 2010, 2011). Figure 11 presents the total daily precipitation time series from 1 April to 31 July for the two ensemble reforecasts and the GPM data. As for snow depth and temperature, the precipitation reforecasts were averaged over the domain (i.e. the WTP and ETP), and the time series was smoothed by using a 5 d moving window. The black line represents GPM data. In the WTP, the ensemble mean precipitation for the two ensemble reforecasts generally has the same seasonal tendency as the observations, albeit that the weekly variability is smaller. There is no obvious difference in the ensemble mean precipitation between the two reforecasts. However, in the ETP, the ensemble mean precipitation of the DA reforecasts is higher than that of the control reforecasts, especially during a few episodes occurring mostly before 1 June. This increase could hence be related to the snow and circulation changes which were most pronounced over ETP in the spring. Moreover, the ensemble mean precipitation of the two reforecasts is much more than GPM precipitation before 25 June, which is in line with the excess precipitation in the reanalyses system and climate and forecast models, which has been mentioned in Orsolini et al. (2019) and Su et al. (2013). Although the ranges of two reforecasts are similar, those of the control reforecasts cover the GPM data better in both the WTP and ETP. However, the upper limits of the ranges of the DA reforecasts are pretty high around 3 June, while the GPM precipitation is small.

Figure 11The total daily precipitation time series averaged over the domain from 1 April to 31 July for the two ensemble reforecasts and the GPM data in the (a) western Tibetan Plateau and (b) eastern Tibetan Plateau.
The temporal CCs and mean absolute relative errors (MAREs) of daily precipitation between the two ensemble reforecasts and GPM data are presented in Fig. 12. It can be noticed that the correlations between the precipitation reforecasts and GPM precipitation become lower after snow assimilation, especially for the ETP. However, the median and mean values of the MAREs become smaller after snow assimilation in the WTP, while the results are reversed in the ETP. In general, the temporal correlations are lower, but the relative error is larger in the ETP than in the WTP. The changes in the median and mean values of the MAREs are also larger in the ETP than in the WTP. Furthermore, the variation ranges of the CCs and MAREs are larger for the DA reforecasts than for the control reforecasts.
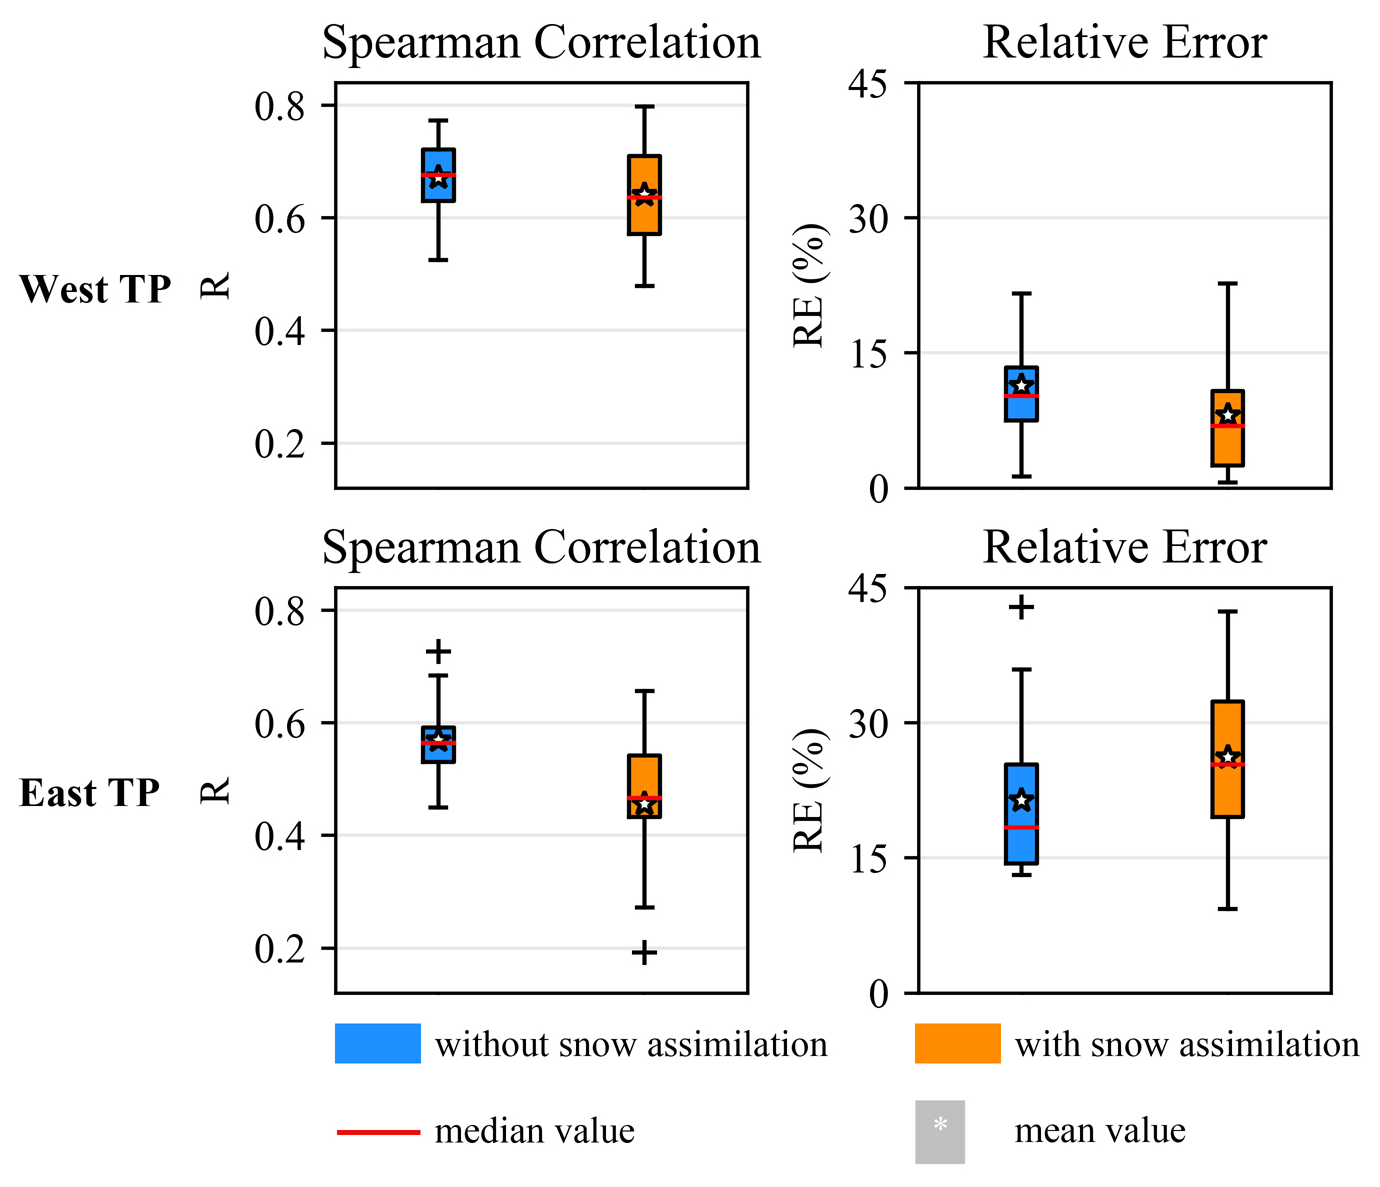
Figure 12The Spearman's correlation coefficients and mean absolute relative error in daily precipitation between the two ensemble reforecasts and GPM data.
The spatial differences in daily precipitation between the ensemble reforecasts and GPM data and between the two reforecasts are displayed in Fig. 13. In spring, the reforecasts underestimate daily precipitation in the ETP, while they overestimate daily precipitation in the WTP. The precipitation of the DA reforecasts is more than that of the control reforecasts in the southeastern TP, especially around the boundary of the WTP and ETP. In summer, the spatial distributions for the two reforecasts are quite similar. The two ensemble reforecasts underestimate daily precipitation in the central TP, while overestimating daily precipitation in other regions, especially in the southern TP. Moreover, the precipitation of the DA reforecasts is more abundant than that of the control reforecasts in the WTP, while it is less in the ETP. As for the whole period, the spatial differences between the precipitation reforecasts and GPM daily precipitation are similar to those in spring. The most significant spatial characteristic is that the precipitation of the DA reforecasts is larger than that of the control reforecasts around the boundary of the WTP and ETP in the southern TP. In addition, the spatial differences between the precipitation reforecasts and GPM daily precipitation are statistically significant at the 5 % significance level over the whole TP, while those between two reforecasts are only statistically significant for regions where the differences are larger than 0.3 mm.

Figure 13The spatial differences in total daily precipitation (mm) between the ensemble reforecasts and GPM data (top and middle rows) and between the two reforecasts (bottom row). The stippled regions show the statistical significance of the differences identified by the t test at a 5 % significance level.
Twin reforecasts with and without snow assimilation above 1500 m over the TP were conducted in this case study in spring 2018 to investigate how snow assimilation influences the long-range prediction of snow, temperature and precipitation over the TP. Three snow variables (i.e. snow cover fraction, snow depth and snowfall) and land surface albedo were firstly analysed. The results indicate that the snow cover fraction and snow depth of the two ensemble reforecasts are larger than the observations, i.e. the TPSCF snow cover fraction and TPSD snow depth, for most places on the TP. However, the snow cover fraction and snow depth of the DA reforecasts are less than those of the control reforecasts for most places of the TP, especially for the ETP and around the boundary of the WTP and ETP, which means that the snow cover fraction and snow depth for the DA experiment are closer to the observations. Because of the more realistic, reduced snow cover fraction for the DA experiment, the land surface albedo is also smaller for most places of the TP, especially for the ETP and around the boundary of the WTP and ETP in the southern TP. However, the snowfall of the DA reforecasts is larger than that of the control reforecasts for the ETP and around the boundary of the WTP and ETP in the southern TP, leading to an increase in the time series of snow depth in spring both in the WTP and ETP for the DA experiment.
For temperature, the two ensemble reforecasts can capture the seasonal tendencies of the observed temperature. The temporal correlations of the reforecasts are higher than 0.78 over the TP when compared with the CN05.1 temperature. Usually, it is difficult to have high correlations in seasonal forecasting; here, the results probably come from the marked seasonal cycle. However, the reforecasts tend to underestimate daily temperature. The snow assimilation improves mean error but decreases correlations of the temperature reforecasts when comparing with the CN05.1 data. As the data assimilation is performed for snow variables rather than temperature directly, the decrease in correlations of temperature reforecasts might be attributed to the changes in complex regional thermodynamics processes. Moreover, the temperature of the DA reforecasts is considerably higher than that of the control reforecasts, especially for the ETP and around the boundary of the WTP and ETP. It is worth noting that, in regions where the snow cover fraction, snow depth and land surface albedo are smaller, the temperature is higher. The decreased snowpack of the DA reforecasts means that less heat is required for snowmelt (Datt et al., 2008; Duffy and Bennartz, 2018), and the smaller land surface albedo means that more heat is absorbed by the Earth, which together lead to the higher temperature. The two reforecasts converge in the average daily temperature time series after a month or so, possibly resulting from the additional snowfall and cooling in the DA reforecasts.
When using the GPM precipitation as a benchmark, the precipitation reforecasts perform better in the WTP than in the ETP, with higher temporal correlations and smaller mean error in the WTP. With the snow assimilation, the biases between the precipitation reforecasts and GPM precipitation become larger in the ETP while smaller in the WTP, and the temporal correlations between the precipitation reforecasts and GPM precipitation become smaller. The smaller correlations and larger biases of the precipitation reforecasts in the ETP after snow assimilation may be partly caused by the uncertainties in observations. The bulk of the precipitation over the TP falls as snow in winter and spring, but the GPM products tend to underestimate snowfall which may result in underestimation of total precipitation (Behrangi et al., 2014; Immerzeel et al., 2015). However, the snowfall reforecasts become larger after snow assimilation, especially in the ETP and around the boundary of the WTP and ETP, which may further lead to the smaller correlations and larger biases between the precipitation reforecasts and GPM precipitation. In addition, the precipitation of the DA reforecasts is significantly larger than that of the control reforecasts in the southeastern TP, especially around the boundary of the WTP and ETP, which is similar to the spatial changes in temperature reforecasts. With the higher temperature, the evaporation intensity becomes higher, and more moisture is carried to the atmosphere (Zhang et al., 2019; Yong et al., 2021), providing conditions for the more precipitation. Moreover, it can be noticed that the largest differences in snowfall between the two reforecasts (the DA reforecasts minus the control reforecasts) reach 0.8 mm w.e., while those in precipitation reach 1.8 mm, meaning that most of the increased precipitation is in the form of rainfall.
Although a comprehensive assessment of the impacts of added snow assimilation above 1500 m over the TP on the long-range prediction of snow, temperature and precipitation was conducted, some issues remain. For example, the impacts of snow assimilation on the circulation (including upper air) on the subseasonal to seasonal timescale, i.e. on the subtropical jet and downstream wave train and monsoon development remains to be investigated. This study focuses on surface level and explores how the snow assimilation influences snow, temperature and precipitation predictions through the relations among snow, temperature and precipitation. Future studies will be done on pressure levels and further investigate the impacts of snow assimilation on the circulation. Moreover, bias-correction methods (e.g. quantile mapping) are usually applied to improve temperature and precipitation predictions (Themeßl et al., 2011; Chen et al., 2013). As this study puts more emphasis on the impacts of snow assimilation, bias-correction methods can be considered in future studies to further improve the skill of seasonal forecasts.
Twin reforecasting experiments for spring and summer 2018 with IMS snow DA below 1500 m globally, while the other had additional IMS snow DA above 1500 m over the TP, were used to investigate the impacts of snow assimilation on seasonal snow and meteorological forecasts over the TP. The main conclusions can be drawn, as follows:
-
The snow cover fraction and snow depth of the two ensemble reforecasts are larger than the observations for most places of the TP. With the snow assimilation, the snow cover fraction and snow depth of the reforecasts are closer to the observations. With snow assimilation, the snow cover fraction and snow depth are less for the ETP and around the boundary of the WTP and ETP than that from the control reforecasts, and the land surface albedo of the DA reforecasts is also smaller than that of the control reforecasts for the regions where the snow cover fraction reduces. However, the snowfall of the DA reforecasts is more than that of the control reforecasts for the ETP and around the boundary of the WTP and ETP in the southern TP.
-
When using the CN05.1 temperature as benchmark, the two ensemble reforecasts can capture the seasonal tendencies of the observed temperature. However, the reforecasts tend to underestimate daily temperature. The added snow assimilation improves the mean error but decreases correlations of the temperature reforecasts when comparing with the CN05.1 data. The temperature of the DA reforecasts is significantly higher than that of the control reforecasts for the ETP and around the boundary of the WTP and ETP due to the decreased snowpack and smaller land surface albedo after snow assimilation. Given its feedback on snowfall and snow depth, it appears important for the forecast models to capture the effect of land–atmosphere interaction upon precipitation to receive all the benefits of improved land–surface initial conditions. Besides, the increase in surface temperature extends throughout the lower troposphere, triggering ascent, convergence and higher wind speed.
-
When using the GPM precipitation as benchmark, the precipitation reforecasts perform better in the WTP than in the ETP. With the snow assimilation, the biases between the precipitation reforecasts and GPM precipitation become larger in the ETP and smaller in the WTP, which may partly be because of the uncertainty from the GPM observations. The precipitation of the DA reforecasts is significantly larger than that of the control reforecasts for the ETP and around the boundary of the WTP and ETP, as the higher temperature in these regions enables more moisture to be carried to the atmosphere. Moreover, most of the increased precipitation is in the form of rainfall.
The Interactive Multisensor Snow and Ice Mapping System snow data can be found at https://doi.org/10.7265/N52R3PMC (last access: 16 November 2022; U.S. National Ice Center, 2008). The daily snow cover fraction dataset for Tibetan Plateau (TPSCF) is available at https://doi.org/10.11922/sciencedb.457 (Qiu et al., 2017). The daily snow depth dataset for Tibetan Plateau (TPSD) produced by Yan et al. (2021) can be found in https://doi.org/10.11888/Snow.tpdc.271743. The CN05.1 dataset is provided by Wu et al. (2017). The global precipitation measurement (GPM) can be found at ftp://arthurhouftps.pps.eosdis.nasa.gov/gpmdata/ (last access: 16 November 2022, Huffman et al., 2014).
The supplement related to this article is available online at: https://doi.org/10.5194/tc-16-4985-2022-supplement.
YJO, RS and PdR designed the experiments and carried them out. WL prepared the paper, with contributions from JC and LL. YX provided the station data. All co-authors participated in the analyses.
The contact author has declared that none of the authors has any competing interests.
Publisher’s note: Copernicus Publications remains neutral with regard to jurisdictional claims in published maps and institutional affiliations.
This work has been partially supported by the Natural Science Foundation of China (grant no. 52079093), the Hubei Provincial Natural Science Foundation of China (grant no. 2020CFA100), the Overseas Expertise Introduction Project for Discipline Innovation (111 Project) funded by the Ministry of Education and State Administration of Foreign Experts Affairs, P. R. China (grant no. B18037), and the Fast-Track Initiative (FTI) project of “Contributions to the CORDEX Flaghip Pilot Study over the Tibetan Plateau Region” funded by the Centre For Climate Dynamics (SKD) at the Bjerknes Centre for Climate Research (BCCR). We thank Xuejie Gao for providing the CN05.1 gridded daily meteorological forcing dataset. Yvan J. Orsolini, Retish Senan and Patricia de Rosnay also acknowledge the support of the International Space Science Institute in Beijing, through the working team “Snow reanalysis over the Himalaya–Tibetan Plateau region and the monsoons” over the years 2016–2018 (Team leaders are Yvan Orsolini and Gianpaolo Balsamo). Yvan J. Orsolini has been also partially supported by the Research Council of Norway (project SNOWDEPTH; grant no. 325519).
This research has been supported by the National Natural Science Foundation of China (grant no. 52079093), the Natural Science Foundation of Hubei Province (grant no. 2020CFA100), the Overseas Expertise Introduction Project for Discipline Innovation (grant no. B18037), the Fast-Track Initiative (FTI) project of “Contributions to the CORDEX Flagship Pilot Study over the Tibetan Plateau Region”, funded by the Centre For Climate Dynamics (SKD) at the Bjerknes Centre for Climate Research (BCCR), the International Space Science Institute in Beijing, through the working team “Snow reanalysis over the Himalaya–Tibetan Plateau region and the monsoons”, and the Research Council of Norway (project SNOWDEPTH; grant no. 325519).
This paper was edited by Chris Derksen and reviewed by three anonymous referees.
Balsamo, G., Viterbo, P., Beljaars, A., van den Hurk, B., Hirschi, M., Betts, A. K., and Scipal, K.: A Revised Hydrology for the ECMWF Model: Verification from Field Site to Terrestrial Water Storage and Impact in the Integrated Forecast System, J. Hydrometeorol., 10, 623–643, https://doi.org/10.1175/2008jhm1068.1, 2009.
Behrangi, A., Tian, Y., Lambrigtsen, B. H., and Stephens, G. L.: What does CloudSat reveal about global land precipitation detection by other spaceborne sensors?, Water Resour. Res., 50, 4893–4905, https://doi.org/10.1002/2013wr014566, 2014.
Ceglar, A., Toreti, A., Prodhomme, C., Zampieri, M., Turco, M., and Doblas-Reyes, F. J.: Land-surface initialisation improves seasonal climate prediction skill for maize yield forecast, Sci. Rep., 8, 1322, https://doi.org/10.1038/s41598-018-19586-6, 2018.
Chen, F., Zhang, J., Liu, J., Cao, X., Hou, J., Zhu, L., Xu, X., Liu, X., Wang, M., Wu, D., Huang, L., Zeng, T., Zhang, S., Huang, W., Zhang, X., and Yang, K.: Climate change, vegetation history, and landscape responses on the Tibetan Plateau during the Holocene: A comprehensive review, Quaternary Sci. Rev., 243, 106444, https://doi.org/10.1016/j.quascirev.2020.106444, 2020.
Chen, J., Brissette, F. P., Chaumont, D., and Braun, M.: Performance and uncertainty evaluation of empirical downscaling methods in quantifying the climate change impacts on hydrology over two North American river basins, J. Hydrol., 479, 200–214, https://doi.org/10.1016/j.jhydrol.2012.11.062, 2013.
Chevuturi, A., Turner, A. G., Johnson, S., Weisheimer, A., Shonk, J. K. P., Stockdale, T. N., and Senan, R.: Forecast skill of the Indian monsoon and its onset in the ECMWF seasonal forecasting system 5 (SEAS5), Clim. Dynam., 56, 2941–2957, https://doi.org/10.1007/s00382-020-05624-5, 2021.
Clark, R. T., Bett, P. E., Thornton, H. E., and Scaife, A. A.: Skilful seasonal predictions for the European energy industry, Environ. Res. Lett., 12, 119602, https://doi.org/10.1088/1748-9326/aa94a7, 2017.
Curio, J. and Scherer, D.: Seasonality and spatial variability of dynamic precipitation controls on the Tibetan Plateau, Earth Syst. Dynam., 7, 767–782, https://doi.org/10.5194/esd-7-767-2016, 2016.
Datt, P., Srivastava, P. K., Negi, P. S., and Satyawali, P. K.: Surface energy balance of seasonal snow cover for snow-melt estimation in N–W Himalaya, J. Earth Syst. Sci., 117, 567–573, https://doi.org/10.1007/s12040-008-0053-7, 2008.
Dee, D. P., Uppala, S. M., Simmons, A. J., Berrisford, P., Poli, P., Kobayashi, S., Andrae, U., Balmaseda, M. A., Balsamo, G., Bauer, P., Bechtold, P., Beljaars, A. C. M., van de Berg, L., Bidlot, J., Bormann, N., Delsol, C., Dragani, R., Fuentes, M., Geer, A. J., Haimberger, L., Healy, S. B., Hersbach, H., Hólm, E. V., Isaksen, L., Kållberg, P., Köhler, M., Matricardi, M., McNally, A. P., Monge-Sanz, B. M., Morcrette, J. J., Park, B. K., Peubey, C., de Rosnay, P., Tavolato, C., Thépaut, J. N., and Vitart, F.: The ERA-Interim reanalysis: configuration and performance of the data assimilation system, Q. J. Roy. Meteor. Soc., 137, 553–597, https://doi.org/10.1002/qj.828, 2011.
de Rosnay, P., Balsamo, G., Albergel, C., Muñoz-Sabater, J., and Isaksen, L.: Initialisation of Land Surface Variables for Numerical Weather Prediction, Surv. Geophys., 35, 607–621, https://doi.org/10.1007/s10712-012-9207-x, 2014.
Duffy, G. and Bennartz, R.: The Role of Melting Snow in the Ocean Surface Heat Budget, Geophys. Res. Lett., 45, 9782–9789, https://doi.org/10.1029/2018gl079182, 2018.
Dutra, E., Balsamo, G., Viterbo, P., Miranda, P. M. A., Beljaars, A., Schär, C., and Elder, K.: An Improved Snow Scheme for the ECMWF Land Surface Model: Description and Offline Validation, J. Hydrometeorol., 11, 899–916, https://doi.org/10.1175/2010jhm1249.1, 2010.
ECMWF: IFS Documentation CY45R1 – Part II: Data assimilation, in: IFS Documentation CY45R1, IFS Documentation, ECMWF, https://www.ecmwf.int/en/elibrary/80893-ifs-documentation-cy45r1-part-ii-data-assimilation (last access: 16 November 2022), 2018.
Ehsan, M. A., Tippett, M. K., Kucharski, F., Almazroui, M., and Ismail, M.: Predicting peak summer monsoon precipitation over Pakistan in ECMWF SEAS5 and North American Multimodel Ensemble, Int. J. Climatol., 40, 5556–5573, https://doi.org/10.1002/joc.6535, 2020.
Gubler, S., Sedlmeier, K., Bhend, J., Avalos, G., Coelho, C. A. S., Escajadillo, Y., Jacques-Coper, M., Martinez, R., Schwierz, C., de Skansi, M., and Spirig, C.: Assessment of ECMWF SEAS5 Seasonal Forecast Performance over South America, Weather Forecast., 35, 561–584, https://doi.org/10.1175/waf-d-19-0106.1, 2020.
Guo, H., Chen, S., Bao, A., Behrangi, A., Hong, Y., Ndayisaba, F., Hu, J., and Stepanian, P. M.: Early assessment of Integrated Multi-satellite Retrievals for Global Precipitation Measurement over China, Atmos. Res., 176–177, 121–133, https://doi.org/10.1016/j.atmosres.2016.02.020, 2016.
Hansen, J. W.: Realizing the potential benefits of climate prediction to agriculture: issues, approaches, challenges, Agr. Syst., 74, 309–330, https://doi.org/10.1016/S0308-521X(02)00043-4, 2002.
Hou, A. Y., Kakar, R. K., Neeck, S., Azarbarzin, A. A., Kummerow, C. D., Kojima, M., Oki, R., Nakamura, K., and Iguchi, T.: The Global Precipitation Measurement Mission, B. Am. Meteorol. Soc., 95, 701–722, https://doi.org/10.1175/bams-d-13-00164.1, 2014.
Huffman, G., Bolvin, D., Braithwaite, D., Hsu, K., Joyce, R., and Xie, P.: Integrated Multi-satellite Retrievals for GPM (IMERG), version 4.4, NASA's Precipitation Processing Center [data set], ftp://arthurhouftps.pps.eosdis.nasa.gov/gpmdata/ (last access: 16 November 2022), 2014.
Immerzeel, W. W., van Beek, L. P., and Bierkens, M. F.: Climate change will affect the Asian water towers, Science, 328, 1382–1385, https://doi.org/10.1126/science.1183188, 2010.
Immerzeel, W. W., Wanders, N., Lutz, A. F., Shea, J. M., and Bierkens, M. F. P.: Reconciling high-altitude precipitation in the upper Indus basin with glacier mass balances and runoff, Hydrol. Earth Syst. Sci., 19, 4673–4687, https://doi.org/10.5194/hess-19-4673-2015, 2015.
Johnson, S. J., Stockdale, T. N., Ferranti, L., Balmaseda, M. A., Molteni, F., Magnusson, L., Tietsche, S., Decremer, D., Weisheimer, A., Balsamo, G., Keeley, S. P. E., Mogensen, K., Zuo, H., and Monge-Sanz, B. M.: SEAS5: the new ECMWF seasonal forecast system, Geosci. Model Dev., 12, 1087–1117, https://doi.org/10.5194/gmd-12-1087-2019, 2019.
Koster, R. D., Mahanama, S. P. P., Yamada, T. J., Balsamo, G., Berg, A. A., Boisserie, M., Dirmeyer, P. A., Doblas-Reyes, F. J., Drewitt, G., Gordon, C. T., Guo, Z., Jeong, J. H., Lawrence, D. M., Lee, W. S., Li, Z., Luo, L., Malyshev, S., Merryfield, W. J., Seneviratne, S. I., Stanelle, T., van den Hurk, B. J. J. M., Vitart, F., and Wood, E. F.: Contribution of land surface initialization to subseasonal forecast skill: First results from a multi-model experiment, Geophys. Res. Lett., 37, L02402, https://doi.org/10.1029/2009gl041677, 2010.
Koster, R. D., Mahanama, S. P. P., Yamada, T. J., Balsamo, G., Berg, A. A., Boisserie, M., Dirmeyer, P. A., Doblas-Reyes, F. J., Drewitt, G., Gordon, C. T., Guo, Z., Jeong, J. H., Lee, W. S., Li, Z., Luo, L., Malyshev, S., Merryfield, W. J., Seneviratne, S. I., Stanelle, T., van den Hurk, B. J. J. M., Vitart, F., and Wood, E. F.: The Second Phase of the Global Land–Atmosphere Coupling Experiment: Soil Moisture Contributions to Subseasonal Forecast Skill, J. Hydrometeorol., 12, 805–822, https://doi.org/10.1175/2011jhm1365.1, 2011.
Kuang, X. and Jiao, J. J.: Review on climate change on the Tibetan Plateau during the last half century, J. Geophys. Res.-Atmos., 121, 3979–4007, https://doi.org/10.1002/2015jd024728, 2016.
Li, D., Yang, K., Tang, W., Li, X., Zhou, X., and Guo, D.: Characterizing precipitation in high altitudes of the western Tibetan plateau with a focus on major glacier areas, Int. J. Climatol., 40, 5114–5127, https://doi.org/10.1002/joc.6509, 2020.
Li, W., Guo, W., Qiu, B., Xue, Y., Hsu, P.-C., and Wei, J.: Influence of Tibetan Plateau snow cover on East Asian atmospheric circulation at medium-range time scales, Nat. Commun., 9, 4243, https://doi.org/10.1038/s41467-018-06762-5, 2018.
Li, W., Chen, J., Li, L., Chen, H., Liu, B., Xu, C.-Y., and Li, X.: Evaluation and Bias Correction of S2S Precipitation for Hydrological Extremes, J. Hydrometeorol., 20, 1887–1906, https://doi.org/10.1175/jhm-d-19-0042.1, 2019.
Li, W., Hu, S., Hsu, P.-C., Guo, W., and Wei, J.: Systematic bias of Tibetan Plateau snow cover in subseasonal-to-seasonal models, The Cryosphere, 14, 3565–3579, https://doi.org/10.5194/tc-14-3565-2020, 2020.
Lin, Q., Chen, J., Chen, D., Wang, X., Li, W., and Scherer, D.: Impacts of Bias-corrected ERA5 Initial Snow Depth on Dynamical Downscaling Simulations for the Tibetan Plateau, J. Geophys. Res.-Atmos., 126, e2021JD035625, https://doi.org/10.1029/2021jd035625, 2021.
Orsolini, Y., Wegmann, M., Dutra, E., Liu, B., Balsamo, G., Yang, K., de Rosnay, P., Zhu, C., Wang, W., Senan, R., and Arduini, G.: Evaluation of snow depth and snow cover over the Tibetan Plateau in global reanalyses using in situ and satellite remote sensing observations, The Cryosphere, 13, 2221–2239, https://doi.org/10.5194/tc-13-2221-2019, 2019.
Palmer, T. N.: Towards the probabilistic Earth-system simulator: a vision for the future of climate and weather prediction, Q. J. Roy. Meteor. Soc., 138, 841–861, https://doi.org/10.1002/qj.1923, 2012.
Prakash, S., Mitra, A. K., AghaKouchak, A., Liu, Z., Norouzi, H., and Pai, D. S.: A preliminary assessment of GPM-based multi-satellite precipitation estimates over a monsoon dominated region, J. Hydrol., 556, 865–876, https://doi.org/10.1016/j.jhydrol.2016.01.029, 2018.
Qian, Y. F., Zheng, Y. Q., Zhang, Y., and Miao, M. Q.: Responses of China's summer monsoon climate to snow anomaly over the Tibetan Plateau, Int. J. Climatol., 23, 593–613, https://doi.org/10.1002/joc.901, 2003.
Qiu, J.: China: The third pole, Nature, 454, 393–396, https://doi.org/10.1038/454393a, 2008.
Qiu, Y., Wang, X., and Han, L.: Daily Fractional Snow Cover (FSC) Data set over High Asia, Science Data Bank [data set], https://doi.org/10.11922/sciencedb.457, 2017.
Schiemann, R., Lüthi, D., and Schär, C.: Seasonality and Interannual Variability of the Westerly Jet in the Tibetan Plateau Region, J. Climate, 22, 2940–2957, https://doi.org/10.1175/2008jcli2625.1, 2009.
Shafiee-Jood, M., Cai, X., Chen, L., Liang, X.-Z., and Kumar, P.: Assessing the value of seasonal climate forecast information through an end-to-end forecasting framework: Application to U.S. 2012 drought in central Illinois, Water Resour. Res., 50, 6592–6609, https://doi.org/10.1002/2014wr015822, 2014.
Su, F., Duan, X., Chen, D., Hao, Z., and Cuo, L.: Evaluation of the Global Climate Models in the CMIP5 over the Tibetan Plateau, J. Climate, 26, 3187–3208, https://doi.org/10.1175/jcli-d-12-00321.1, 2013.
Tan, M. and Duan, Z.: Assessment of GPM and TRMM Precipitation Products over Singapore, Remote Sensing, 9, 720, https://doi.org/10.3390/rs9070720, 2017.
Themeßl, M. J., Gobiet, A., and Heinrich, G.: Empirical-statistical downscaling and error correction of regional climate models and its impact on the climate change signal, Climatic Change, 112, 449–468, https://doi.org/10.1007/s10584-011-0224-4, 2011.
U.S. National Ice Center: IMS Daily Northern Hemisphere Snow and Ice Analysis at 1 km, 4 km, and 24 km Resolutions, Version 1, Boulder, Colorado USA, National Snow and Ice Data Center [data set], https://doi.org/10.7265/N52R3PMC, 2008.
Wang, Q. J., Shao, Y., Song, Y., Schepen, A., Robertson, D. E., Ryu, D., and Pappenberger, F.: An evaluation of ECMWF SEAS5 seasonal climate forecasts for Australia using a new forecast calibration algorithm, Environm. Modell. Softw. 122, 104550, https://doi.org/10.1016/j.envsoft.2019.104550, 2019.
Wang, X., Tolksdorf, V., Otto, M., and Scherer, D.: WRF-based dynamical downscaling of ERA5 reanalysis data for High Mountain Asia: Towards a new version of the High Asia Refined analysis, Int. J. Climatol., 41, 743–762, https://doi.org/10.1002/joc.6686, 2020.
Wu, J., Gao, X., Giorgi, F., and Chen, D.: Changes of effective temperature and cold/hot days in late decades over China based on a high resolution gridded observation dataset, Int. J. Climatol., 37, 788–800, https://doi.org/10.1002/joc.5038, 2017.
Xu, Y., Gao, X., Shen, Y., Xu, C., Shi, Y., and Giorgi, F.: A daily temperature dataset over China and its application in validating a RCM simulation, Adv. Atmos. Sci., 26, 763–772, https://doi.org/10.1007/s00376-009-9029-z, 2009.
Yan, D., Ma, N., and Zhang, Y.: A daily, 0.05∘ Snow depth dataset for Tibetan Plateau (2000–2018), National Tibetan Plateau Data Center [data set], https://doi.org/10.11888/Snow.tpdc.271743, 2021.
Yang, K., Wu, H., Qin, J., Lin, C., Tang, W., and Chen, Y.: Recent climate changes over the Tibetan Plateau and their impacts on energy and water cycle: A review, Global Planet. Change, 112, 79–91, https://doi.org/10.1016/j.gloplacha.2013.12.001, 2014.
Yang, M., Wang, X., Pang, G., Wan, G., and Liu, Z.: The Tibetan Plateau cryosphere: Observations and model simulations for current status and recent changes, Earth-Sci. Rev., 190, 353–369, https://doi.org/10.1016/j.earscirev.2018.12.018, 2019.
Yao, T., Thompson, L., Yang, W., Yu, W., Gao, Y., Guo, X., Yang, X., Duan, K., Zhao, H., Xu, B., Pu, J., Lu, A., Xiang, Y., Kattel, D. B., and Joswiak, D.: Different glacier status with atmospheric circulations in Tibetan Plateau and surroundings, Nat. Clim. Change, 2, 663–667, https://doi.org/10.1038/nclimate1580, 2012.
Yong, Z., Xiong, J., Wang, Z., Cheng, W., Yang, J., and Pang, Q.: Relationship of extreme precipitation, surface air temperature, and dew point temperature across the Tibetan Plateau, Climatic Change, 165, 41, https://doi.org/10.1007/s10584-021-03076-2, 2021.
Zhang, H., Wu, C., Chen, W., and Huang, G.: Effect of urban expansion on summer rainfall in the Pearl River Delta, South China, J. Hydrol., 568, 747–757, https://doi.org/10.1016/j.jhydrol.2018.11.036, 2019.
Zhang, J., Ma, Q., Chen, H., Zhao, S., and Chen, Z.: Increasing warm-season precipitation in Asian drylands and response to reducing spring snow cover over the Tibetan Plateau, J. Climate, 34, 3129–3144, https://doi.org/10.1175/JCLI-D-20-0479.1, 2021.
Zuo, H., Balmaseda, M. A., Tietsche, S., Mogensen, K., and Mayer, M.: The ECMWF operational ensemble reanalysis–analysis system for ocean and sea ice: a description of the system and assessment, Ocean Sci., 15, 779–808, https://doi.org/10.5194/os-15-779-2019, 2019.