the Creative Commons Attribution 4.0 License.
the Creative Commons Attribution 4.0 License.
 | 30 Nov 2022
Drainage and refill of an Antarctic Peninsula subglacial lake reveal an active subglacial hydrological network
Tom A. Jordan
Neil Ross
Teal R. Riley
Peter T. Fretwell
The presence of subglacial lakes and subglacial hydrological networks under the East and West Antarctic ice sheets is now relatively well understood, whilst their influence on ice dynamics is the subject of ongoing research. In contrast, little is known about subglacial lakes and hydrological networks under the Antarctic Peninsula Ice Sheet and how these are influencing glacier behaviour. Here we describe the rapid drainage and slow refill of a subglacial lake under Mars Glacier using remote sensing and aerogeophysics. Results suggest drainage of the subglacial lake occurred prior to 2011, resulting in the collapse of the overlying ice into the newly formed subglacial cavity. The cavity has been refilling since this time, with peak rates of infilling associated with seasonal surface meltwater activity. We review evidence for similar features elsewhere in the Antarctic Peninsula and discuss whether their appearance marks a threshold shift in glacier thermal regimes and the activation or enhancement of their subglacial hydrological networks by surface meltwater. Collectively, these features show coupling of climate processes and the bed of the region's glaciers highlighting their ongoing vulnerability to climate change.
- Article
(9720 KB) - Full-text XML
- BibTeX
- EndNote


Changes in glacial and subglacial hydrology can result in significant impacts on glacier and ice sheet dynamics (Ashmore and Bingham, 2014), including decreases in basal friction and short-term accelerations in ice flow (Bartholomew et al., 2012). Active subglacial hydrological networks have been revealed from changes in ice surface elevation detected by satellite altimetry and GPS (Willis et al., 2015; Joughin et al., 2016; Siegfried and Fricker, 2018; Neckel et al., 2021; Livingstone et al., 2022). Radio echo sounding has been used to identify subglacial lakes (Siegert et al., 2005), and over-snow seismic surveys have been used to characterise their water column and sediment properties (Rivera et al., 2015; Smith et al., 2018). Much of this work has been carried out on large subglacial lakes under the East and West Antarctic ice sheets, while small lakes and hydrological networks under the valley glaciers of the Antarctic Peninsula Ice Sheet have received comparatively little attention (compare, for example, with the study of Alaskan “alpine subglacial lakes” by Capps et al., 2010). In a recent global inventory of subglacial lakes, only one is included on the Antarctic Peninsula (Livingstone et al., 2022) beneath Crane Glacier in northeast Graham Land (Scambos et al., 2011, location shown in Fig. 1). Another has previously been described and directly sampled on southern Alexander Island (Hodgson et al., 2009a, b; Pearce et al., 2013).
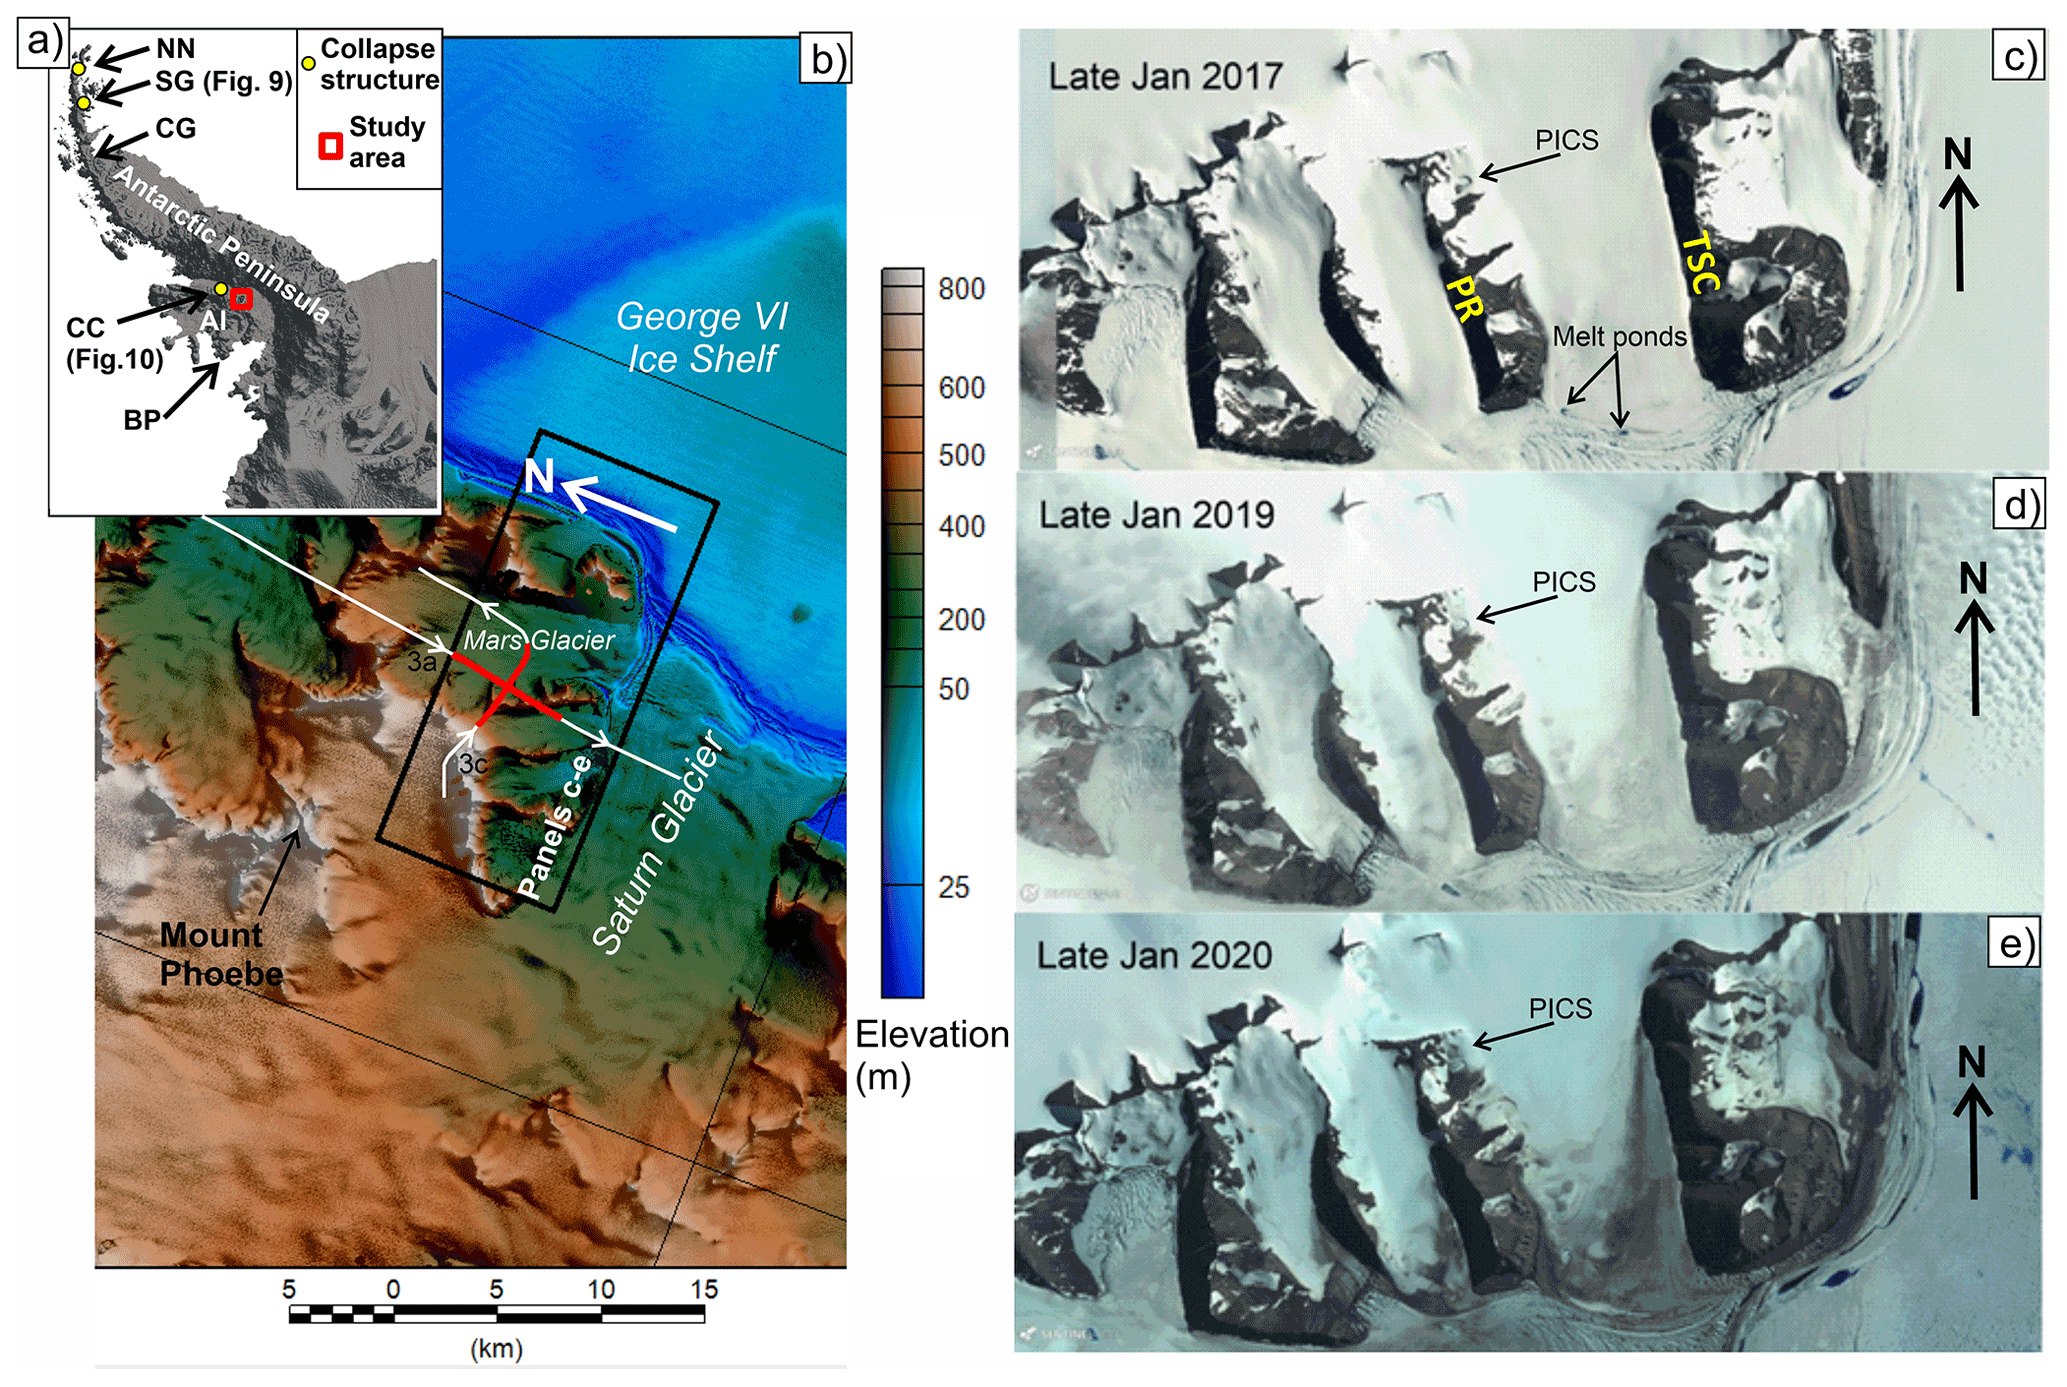
Figure 1Location of Phobos ice collapse structure (PICS). (a) Location of Alexander Island (AI) and the PICS (red box) on the Antarctic Peninsula. Yellow dots mark other ice collapse structures on the northern Antarctic Peninsula at Nobby Nunatak (NN) (Koerner, 1964) and near Sjögren Glacier (SG) (Aitkenhead, 1963), as well as on the southern Antarctic Peninsula at Callisto Cliffs (CC) on Alexander Island. Other named features include Crane Glacier (CG) where satellite altimetry indicated draining of a subglacial lake between September 2004 and September 2005 (Scambos et al., 2011), and the Beethoven Peninsula volcanic field (BP). (b) REMA digital elevation model of the study area (Howat et al., 2019). Thin white lines with arrows mark the 2019 lidar flights over the PICS, and red flight segments locate the radar sections in Fig. 4. The black box locates satellite images in panels (c)–(e). (c–e) Sentinel satellite images showing Mars Glacier and the PICS in 2017, 2019 and 2020. Mars Glacier is bounded by Phobos Ridge (PR) to the west and Two Step Cliffs (TSC) to the east. Note evidence for extensive surface meltwater on George VI Ice Shelf (right of images), at the shear zone of Saturn Glacier (bottom of images) and George VI Ice Shelf, and at the terminus of Mars Glacier in all years, as well as the increase in dust on the surface of the glacier in 2019 and 2020. Copernicus Sentinel data 2021, processed by ESA.
Rapid warming of the Antarctic Peninsula region over the last 5 decades has led to its ice caps and valley glaciers losing mass at an average rate of 24 Gt a−1, contributing 2.5±0.4 mm sea-level rise since 1979 (Rignot et al., 2019). Associated with this mass loss there has been widespread accumulation of seasonal surface meltwater, which models predict will double in volume by 2050 (Trusel et al., 2015). This meltwater is particularly widespread at lower altitudes, for example on ice shelves (Kingslake et al., 2017), in glacier ablation zones, and at glacier margins and shear zones (e.g. Fig. 1c, d and e), and in areas where proximity to overland meltwater, increased radiative melt from low-albedo rock outcrops and the supply of surface dust act to increase meltwater volume. In some years, sustained positive air temperatures have resulted in exceptional ice shelf meltwater accumulations (Banwell et al., 2021). This water refreezes in winter, percolates into fractures, or drains into the underlying ocean through moulins or ice dolines (see Bindschadler et al., 2002; Lenaerts et al., 2017; Warner et al., 2021). These processes have contributed to ice shelf collapse due to meltwater-driven fracture (Van Den Broeke, 2005; Lai et al., 2020).
Whilst the presence of seasonal meltwater on Antarctic Peninsula ice shelves is well-documented and monitored, the role of water on the surface and within and at the base of the region's glaciers is less well studied (Tuckett et al., 2019), which limits our understanding of regional glacier dynamics. In this paper we use remote sensing and aerogeophysical data to report and describe the rapid drainage of a previously unknown subglacial lake under Mars Glacier on Alexander Island which caused the collapse of the overlying ice into a subglacial cavity. We review evidence for similar features elsewhere in the Antarctic Peninsula and Antarctica and discuss whether their appearance marks a shift in the thermal regime of (some) Antarctic glaciers and the activation or enhancement of their subglacial hydrological networks.
Site description
The main study site is an ice depression located on the western side of Mars Glacier, southeastern Alexander Island (71∘51′01′′ S, 68∘28′36′′ W) (Figs. 1–3). The depression is situated within a broader cirque occupied by ice, snow and bedrock outcrops at the northern end of Phobos Ridge. It appears to be the result of a vertical collapse of the ice surface, and we refer to it here as the Phobos ice collapse structure (PICS). Mars Glacier is 15 km long and 3–4 km wide and lies between Two Step Cliffs and Phobos Ridge. It feeds into the lower reaches of Saturn Glacier which discharges into George VI Ice Shelf across an ice shelf shear zone (Fig. 1b). Phobos Ridge consists of sandstones and shales and has three small west–east-oriented ice-filled valleys or cirques which are part of Mars Glacier. The study site is in the northernmost valley, situated at an altitude of ca. 270 m above the WGS-1984 datum. This valley has an enclosed surface hydrological catchment of 1.36 km2 draining into the PICS.
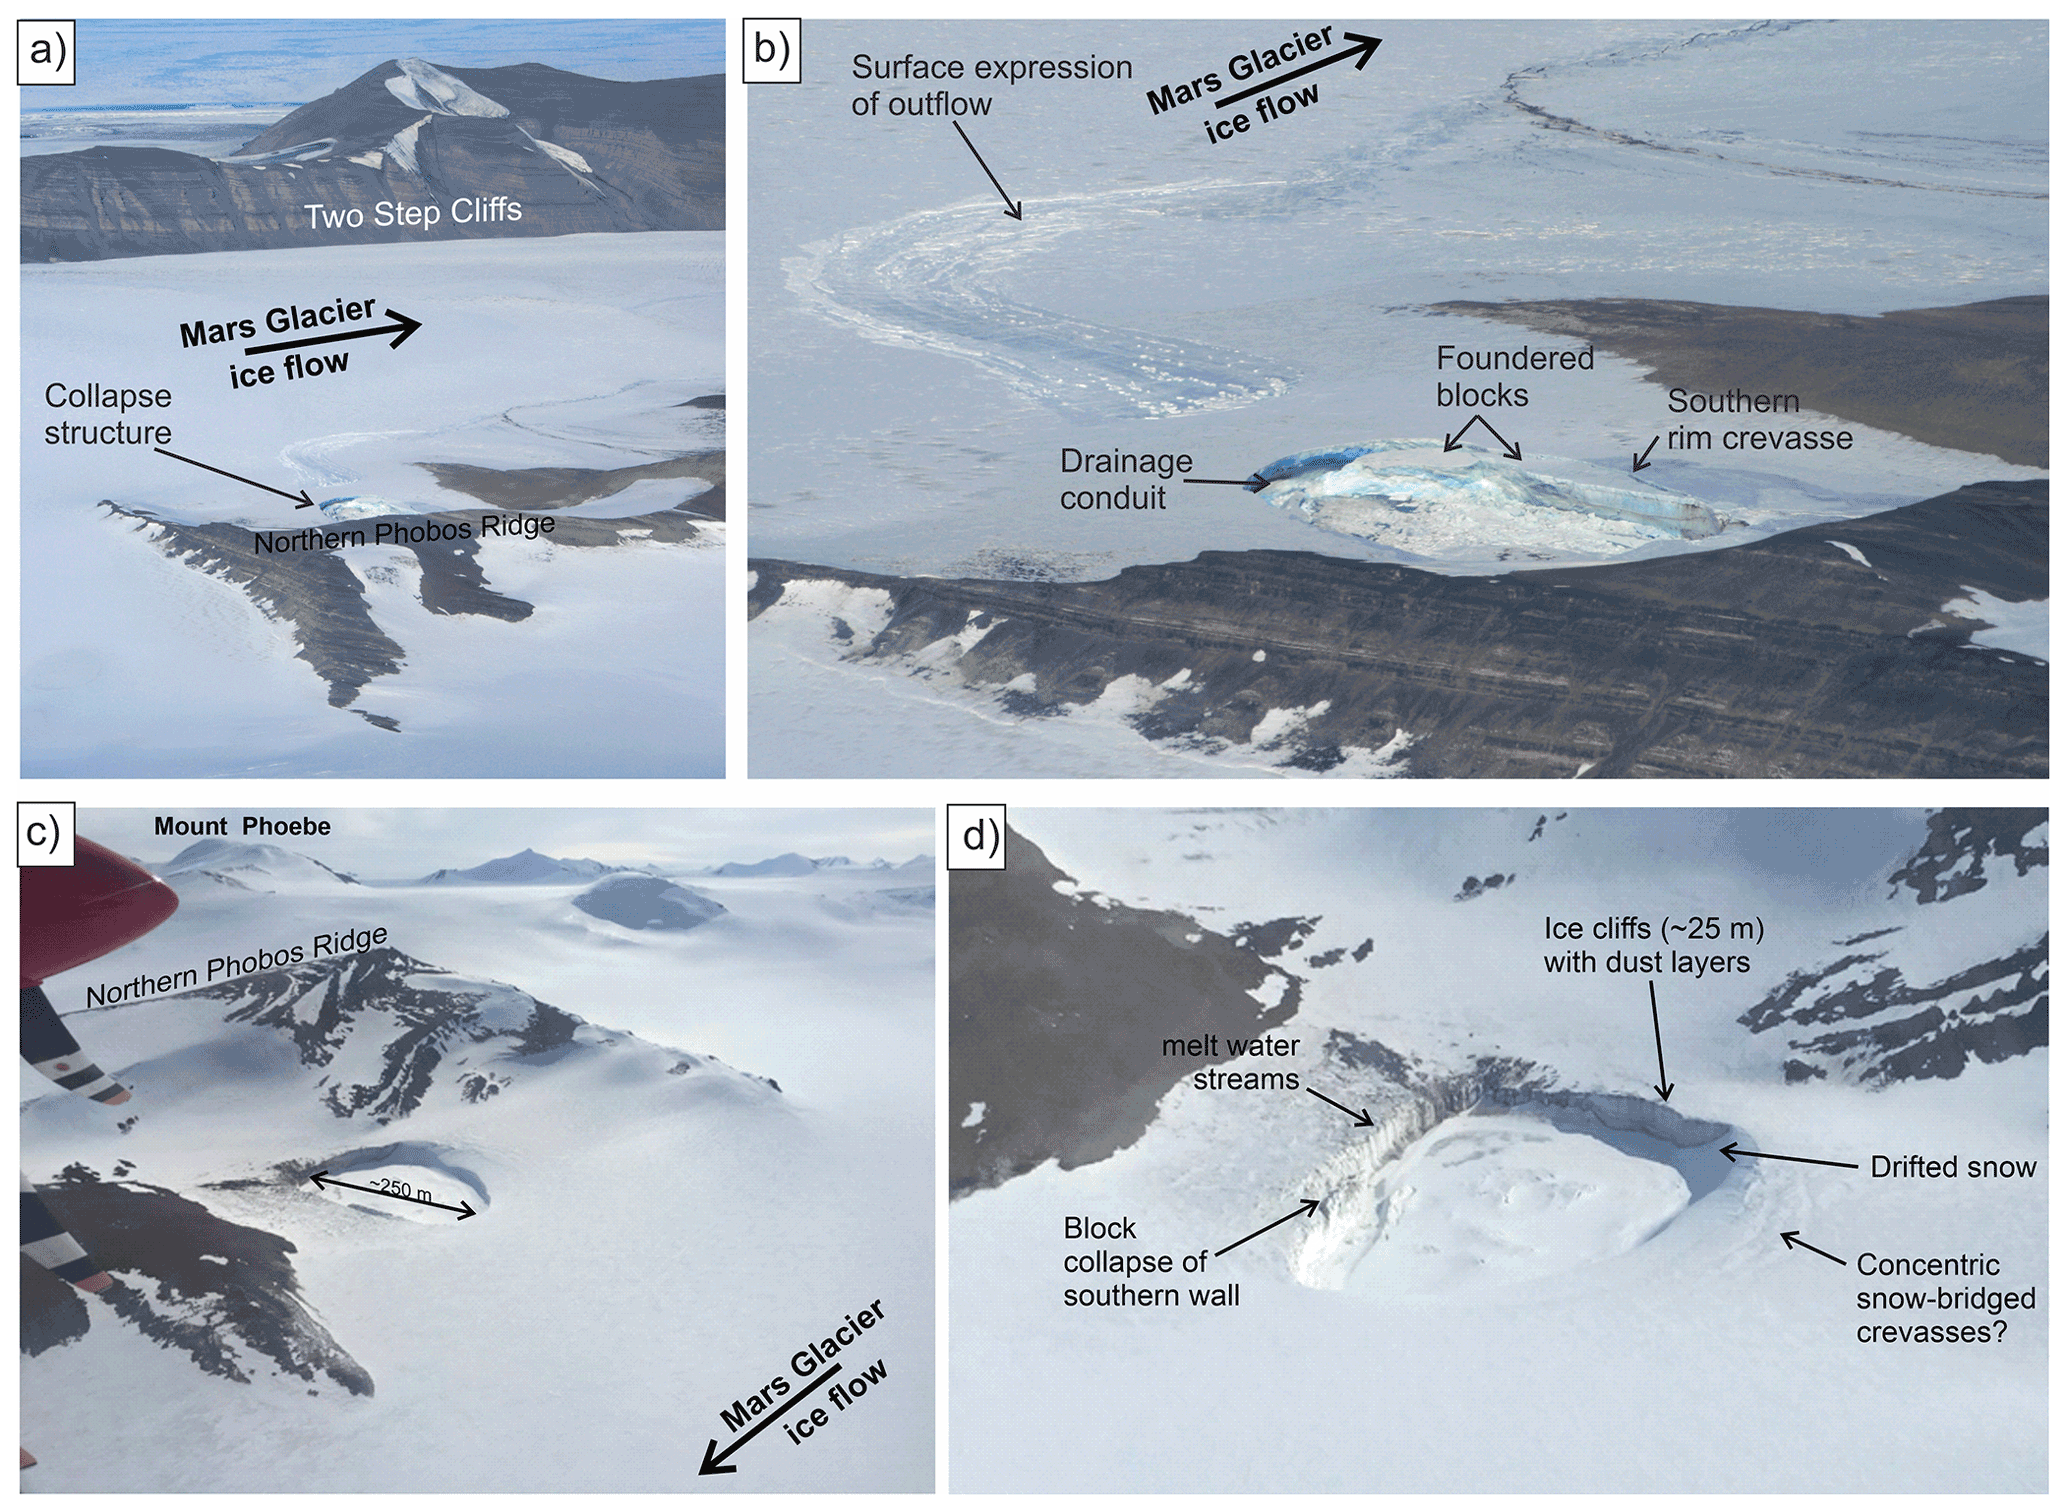
Figure 2Oblique aerial photographs of the PICS. (a) Overview of northern Phobos Ridge, Mars Glacier and Two Step Cliffs showing the location of the PICS on 14 January 2011. (b) A closer view of PICS on the same date showing blocks of ice collapsing into the cavity forming ice cliffs, undercutting of the ice cliff in the (presumed) location of the subglacial drainage conduit, and the surface expression of the subglacial outflow channel heading down-glacier. Note the intact glacier ice between the assumed location of the PICS drainage conduit and the surface expression of the subglacial outflow channel on Mars Glacier. (c) PICS on 3 December 2018 looking northwest from Mars Glacier towards Phobos Ridge and Mount Phoebe beyond and (d) a closer view on the same date looking approximately southwest. Note the expansion of the feature (further block collapse on the southern side, formation of concentric crevasses on the northern side; left and right of image respectively), the presence of meltwater streams flowing into PICS via the ice cliffs and the absence of the surface expression of the subglacial outflow channel on Mars Glacier. Authors' photographs (Neil Ross and Dominic A. Hodgson).
The PICS site cannot easily be accessed overland so all analyses were based on remote sensing (see, for example, Warner et al., 2021). Initial characterisation was carried out using oblique aerial photographs taken from a British Antarctic Survey (BAS), de Havilland Twin Otter aircraft in January 2011 and December 2018 (Fig. 2). Subsequent detailed assessment of the site was made during two overflights by the BAS aerogeophysically equipped Twin Otter VP-FBL on 22 and 30 December 2019 during transits to and from survey tasking for the International Thwaites Glacier Collaboration (ITGC).

Figure 3Lidar imaging of PICS. (a) Lidar elevation from flight on 22 December 2019. Dashed black and white line outlines the area of bedrock used as a reference elevation to correct elevation of satellite strip images in Figs. 5 and 6. (b) Lidar surface elevation from flight on 30 December 2019. (c) Lidar reflection intensity from 22 December 2019 flight. (d) Lidar reflection intensity from 30 December 2019 flight. Note the catchment depression extending southward from the PICS imaged on 22 December (bottom right of images) had a low/absent reflection intensity on 30 December due to the presence of numerous supraglacial meltwater streams.
The survey aircraft was equipped with a Riegl Q240i scanning lidar. The lidar data were processed by Terratec, who integrated the raw scanning lidar data, Global Navigation Satellite System (GNSS) positional data and Inertial Navigation System (INS) attitude data, and carried out boresight calibration based on repeat passes over Rothera Research Station on Adelaide Island (67∘34′06′′ S, 68∘07′33′′ W). The resulting point cloud provided accurate measurements of surface elevation on 22 and 30 December 2019 (∼10 cm standard deviation) across the study area (Fig. 3a and b). The aircraft survey altitude meant that a point density of 0.2 to 0.4 points per square metre was achieved. These elevation data were interpolated onto a 1 m mesh raster to allow visualisation and comparison between survey dates. The resulting very high-resolution data reveal how the surface elevation changed in the short (8 d) period between overflights.
In addition to raw elevation values, the lidar also returns reflection intensity – the strength of the lidar reflection at every point (Kashani et al., 2015). We carried out two simple adjustments to the raw intensity values: first, we corrected for the reduction in intensity due to the scan angle by fitting a second-order polynomial to a plot of scan angle vs. intensity over a local area of approximately flat white snow. Second, the amplitude was normalised to simplify comparison between the two flights. These corrections were not rigorously calibrated between flights, and additional corrections for range to ground and aircraft attitude have not been carried out. However, the general pattern of intensity with these basic adjustments provides useful data (Fig. 3c and d), with low-intensity returns reflecting rough or wet regions, while higher-intensity returns indicate a simple and more reflective surface (Kashani et al., 2015).

Figure 4Radar sections along the red flight lines shown in Fig. 1b. (a) North to south section crossing Mars Glacier and Phobos Ridge (PR). Note ice-bed reflection ∼350 m below the surface of Mars Glacier. (b) Detail of the north to south section over PICS (located by the blue box in panel a). Note potential ice-bed reflection between 35 and 50 m beneath the ice surface. (c) West to east section. (d) Detail of PICS on the west to east section (located by the blue box in panel c). Image brightness indicates strength of the returned reflection on a log scale.
To assess the geomorphology of the subglacial bed we utilised data from a CReSIS 600–900 MHz accumulation radar (Arnold et al., 2020). This radar system was mounted on the survey aircraft during the December 2019 survey flights and collected data simultaneously with the lidar. The data from the accumulation radar has an along-track resolution of 20 to 30 m, depending on aircraft speed, and a depth resolution of ca. 50 cm (Arnold et al., 2020). The data are plotted as the amplitude of the radar reflections on a log scale (Fig. 4). The vertical elevation was calculated assuming radar velocities of 300 and 168 m µs−1 in air and ice respectively.
Longer-term changes in PICS surface elevation were determined from the Reference Elevation Model of Antarctica (REMA; https://www.pgc.umn.edu/data/rema/, last access: 27 May 2020) using data from 2012 to 2017 (Howat et al., 2019). REMA is a high-resolution, time-stamped digital elevation model (DEM) of Antarctica at 8 m spatial resolution. The REMA dataset includes both an average mosaic DEM assembled from multiple strip DEMs and the underlying time-stamped “strip” files. The strip files were generated by applying fully automated, stereo auto-correlation techniques to overlapping pairs of high-resolution optical satellite images, using the open-source Surface Extraction from TIN-based Searchspace Minimization (SETSM) software (Howat et al., 2019). The strip files are not registered to satellite altimetry, meaning that although relative elevation within a strip is robust they have lower absolute accuracy. To counter this issue and allow assessment of long-term local changes in elevation, we used lidar data from an area of exposed rock as a fixed elevation reference (marked in Fig. 3a). Each satellite DEM was shifted to have approximately zero mean offset in this reference area. Elevation strips were available in the study area for 12 September 2013, 10 February 2014, 14 February 2016 and 17 January 2017.
3.1 Aerial photographs and regional setting
Oblique aerial photographs taken on 14 January 2011 show the PICS during, or shortly after, its initial formation (Fig. 2a and b). It consists of a depression in the glacier surface bounded by shear ice cliffs formed by the ongoing collapse of large blocks of ice around its margins (Fig. 2b). On the down-glacier side, the ice cliffs undercut intact glacier ice. Further down-glacier there is a curvilinear deformation of the ice surface which continues southwards towards the glacier terminus (see surface expression of outflow, Fig. 2b). Later photographs of the PICS taken on 3 December 2018 show further calving of blocks of ice have resulted in ongoing retreat of the bounding ice cliffs, expanding the size of the depression (see block collapse, Fig. 2d). Drifting snow has partially obscured the cliffs on the northern side, but several concentric bridged crevasses oriented towards the PICS show further cliff failures in progress (Fig. 2d). Lidar data show that the PICS had reached a size of ∼280 by 350 m by 2019 (Fig. 3). There is no evidence in the 2018 photographs (Fig. 2c and d) of the down-glacier deformation of the ice surface apparent in 2011. Other features present in 2018 include supraglacial meltwater streams forming multiple incisions in the ice cliffs on the southern side and rock debris on the snow surface to the southwest where the supraglacial streams are concentrated. (Fig. 2d). A number of horizontal dust or rock layers can be seen within the ice cliff face in both the 2011 and 2018 images.
3.2 Lidar geomorphology and reflectivity
The 2019 lidar data show the base of PICS is ∼245 m above the WGS-1984 datum, and the surrounding ice surface is >270 m (Fig. 3a), indicating the PICS is currently ∼25 m deep. The area of the PICS, enclosed by the ice cliffs, is 0.067 km2. The base of PICS includes an assortment of ∼2–3 m topographic highs particularly towards the centre. The deepest parts of the PICS (243.5 to 244 m) are immediately adjacent to the ice cliffs, forming an internal “moat”. The ice cliffs are steepest to the south and west, with the 20 m high ice block calving from the southern ice cliffs (Fig. 2d) clearly resolved in the lidar data (Fig. 3a and b). The detailed structures within the PICS were generally consistent between the two flights on 22 and 30 December 2019 (Fig. 3a and b). However, the approximately 100 m wide 10 m deep catchment depression that extends southward from the PICS (between 260 and 270 m attitude, indicated by the shading of the topography on the 22 December flight in Fig. 3a) is not well resolved on 30 December (Fig. 3b) despite elevation values being recovered at similar angles from the centre-line further along the lidar swath. This is a result of a decline in lidar reflection intensity in this area between the two flights (Fig. 3c and d) with the area of low reflection intensity expanding along the entire southern margin of the PICS (Fig. 3d). This zone of low/absent reflectivity corresponds to the area traversed by numerous supraglacial streams observed in the December 2018 aerial photographs (Fig. 2d) and is likely a result of an increase in the amount of supraglacial meltwater in this area between the two flights. The patches of distinct high and low reflectivity with abrupt linear edges south of the PICS on the 30 December 2019 flight correspond to areas of exposed rock (Fig. 3d).
3.3 Subsurface geomorphology
Radar transects flown in orthogonal directions across the depression (Fig. 1b) show significant clutter likely associated with off-axis reflections and multiple reflections between the aircraft and the ice surface (Fig. 4). Shallow reflectors 35–50 m below the ice surface indicate that the PICS overlies a broad topographic bowl in the subglacial bed (Fig. 4b). However, a significant bedrock dam is not imaged on the down-glacier side of the PICS (Fig. 4d). Bright reflectors at depths of 30–50 m directly beneath the PICS are hard to interpret and may be due to the ice sheet bed, englacial water or off-axis reflectors. The base of Mars Glacier is imaged beneath ∼400 m of ice (Fig. 4a and c).
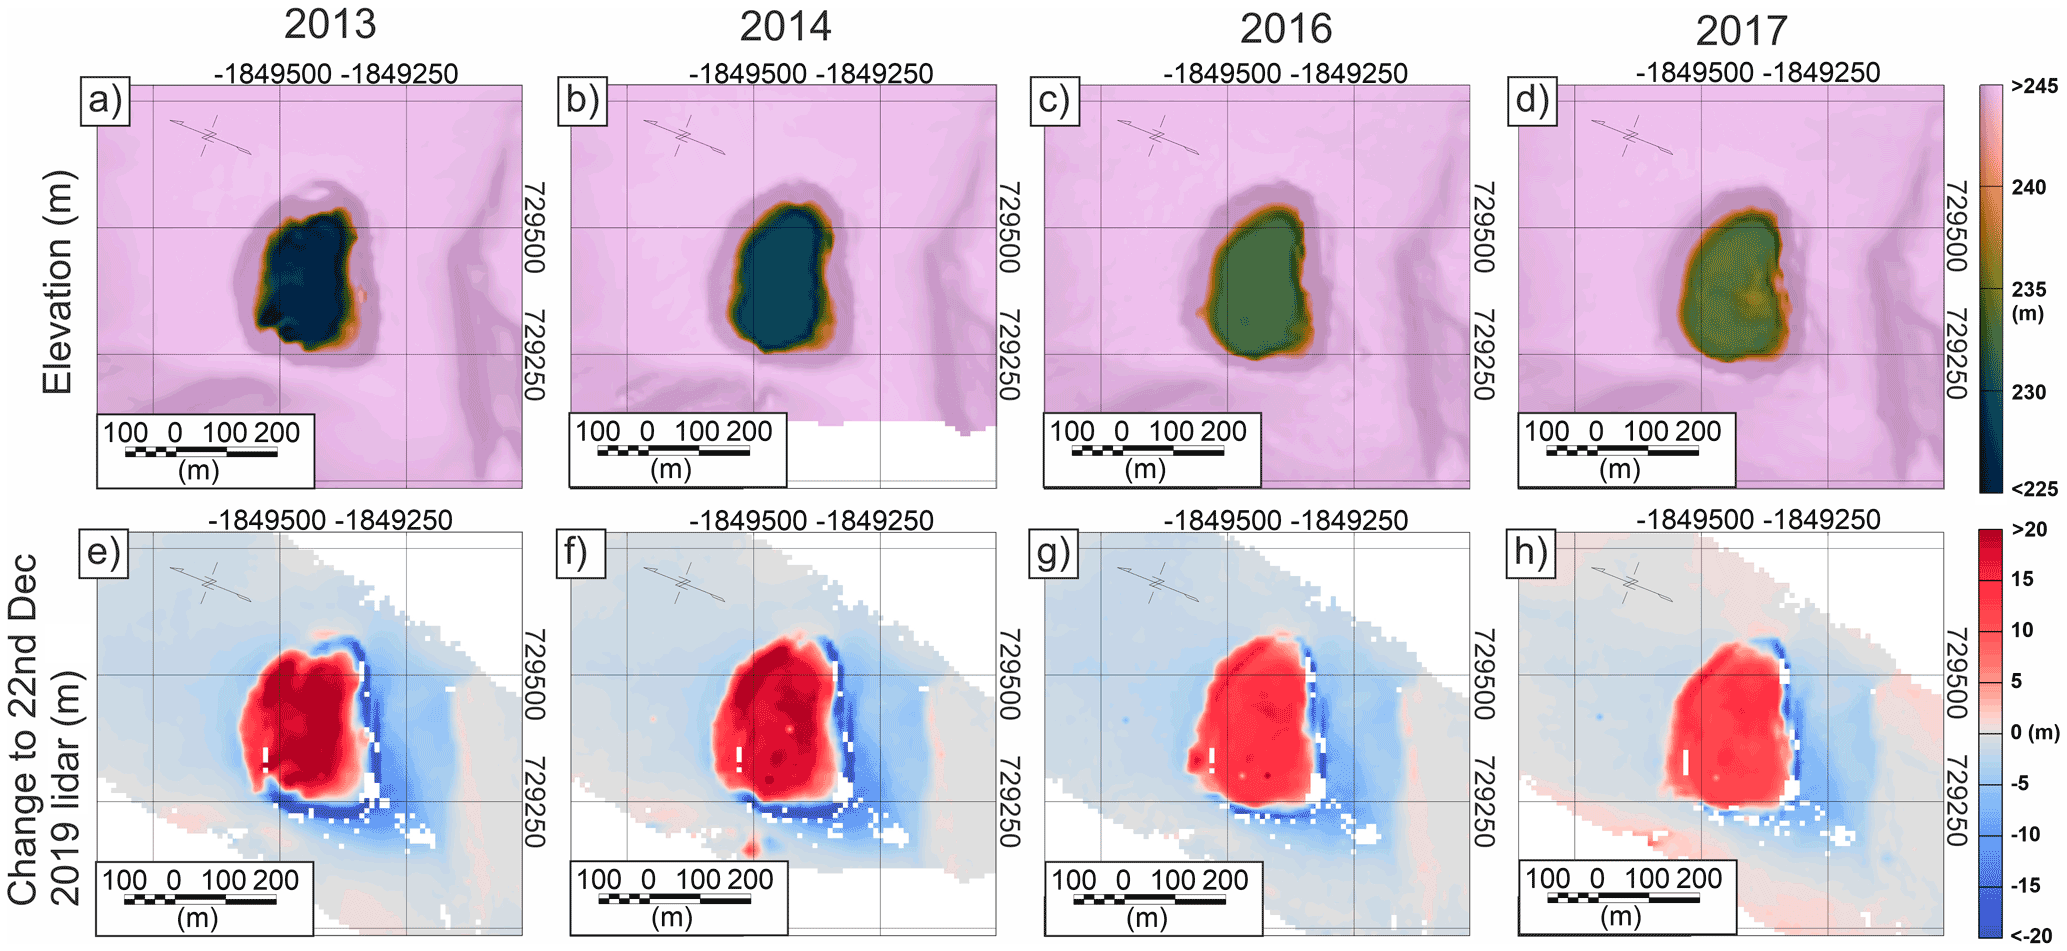
Figure 5Long-term surface elevation changes from REMA strip DEMs over the PICS. Panels (a)–(d) show REMA DEMs from 2013 to 2017, corrected to the area of reference elevation shown in Fig. 3a. Note uniform colour scale, clipped to accentuate variations in the elevation of the PICS floor. Panels (e)–(h) show elevation difference between strip DEMs and 22 December lidar elevation grid – positive values show areas where elevation has increased with time as the cavity has refilled, and negative values show areas of the catchment where elevation has decreased as a (likely) result of surface melt. Note deep and more rugged floor of the PICS in 2013 which suggests either that drainage may have been complete, allowing the basal topography to show through, or more likely that the raised features are fragments of a collapsed ice cliff or ice blisters (Moore, 1993). The very flat base of the PICS in subsequent years would be consistent with progressive filling of the cavity and floatation of ice off the bed or the melting or incorporation of these features.
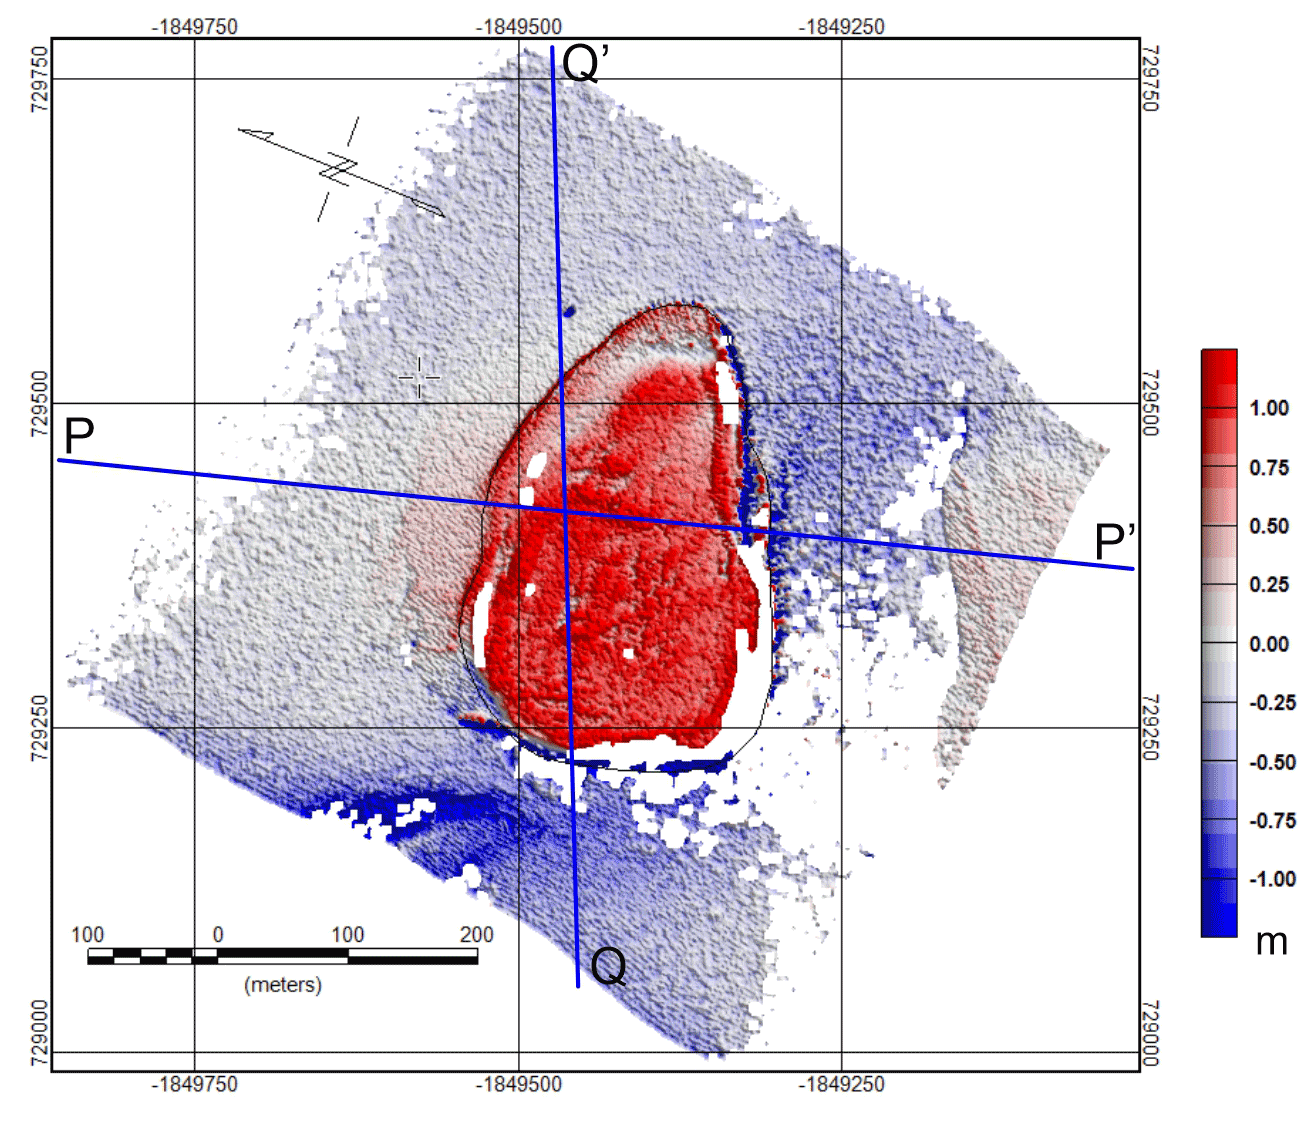
Figure 6Change in surface elevation between 22 and 30 December 2019 lidar surveys. Blue lines locate section profiles shown in Fig. 7.
3.4 Surface elevation changes
The REMA surface elevation measurements from 2013, 2014, 2016 and 2017 (Fig. 5) and lidar from 22 and 30 December 2019 (Fig. 3) show that the PICS has undergone dynamic changes in depth. In 2013 it had a maximum observed depth of ∼44 m and a volume of ∼2 796 000 m3 (Fig. 5). Since 2013 the base of the PICS has been rising in all surveyed years, with ∼1 405 000 m3 of material infilling the PICS between 2013 and 2019. The closely spaced lidar observations on 22 and 30 December 2019 show the PICS floor rose by ∼1.18 m; equivalent to ∼71 000 m3 of meltwater input in just 8 d. As the PICS floor rose, ice in the surrounding catchment fell by 10 to >80 cm (Fig. 6), with the losses concentrated on the steep slopes to the west and south, including areas traversed by active supraglacial meltwater streams in the December 2018 aerial photographs (Fig. 2d). Local surface melting, if spread across the catchment, may account for a large part of the observed infilling of the PICS. This would require ∼7 cm of surface melt across the local catchment in 8 d.

Figure 7Profiles of surface elevation changes over the PICS structure (locations of P–P′ and Q–Q′ shown in Fig. 6). The reference elevation area (Fig. 3a) was used to calibrate the mean vertical shift applied to each satellite-derived REMA strip DEM (2013 +1.93 m, 2014 +0.87 m, 2016 +3.12 m, 2017 +1.39 m). The 2019 lidar profiles are un-adjusted. The “PICS floor” region was used to calculate the mean elevation of the base of PICS plotted in Fig. 8. Note the block collapse in the 2019 lidar data (a) and the formation of a new ice cliff.
Cross sections of surface elevation changes in the depression (marked by blue lines in Fig. 6 and shown in Fig. 7), show the infilling of PICS since 2013. The north–south line shows the development of the drifting snow infill on the northern side of the depression and the collapse of the ice cliff on the southern side forming an ice block between the 2017 REMA and the 2019 lidar surveys, which has become detached and sunk into the depression. The west–east line also shows the snow infill on the northern side of the depression and the continued retreat and steepening of the ice cliffs to the west. It also crosses one of the raised features which are 2–3 m above the PICS floor. A plot of the mean elevation change extracted from the two profiles crossing the PICS shows a more or less linear PICS infill rate of 3.18 m a−1 between 2013 and 2019 (Fig. 8). A substantially greater increase in elevation of 1.18 m recorded between the 22 and 30 December 2019 lidar surveys equates to a short-lived PICS infill rate of 53 m a−1.
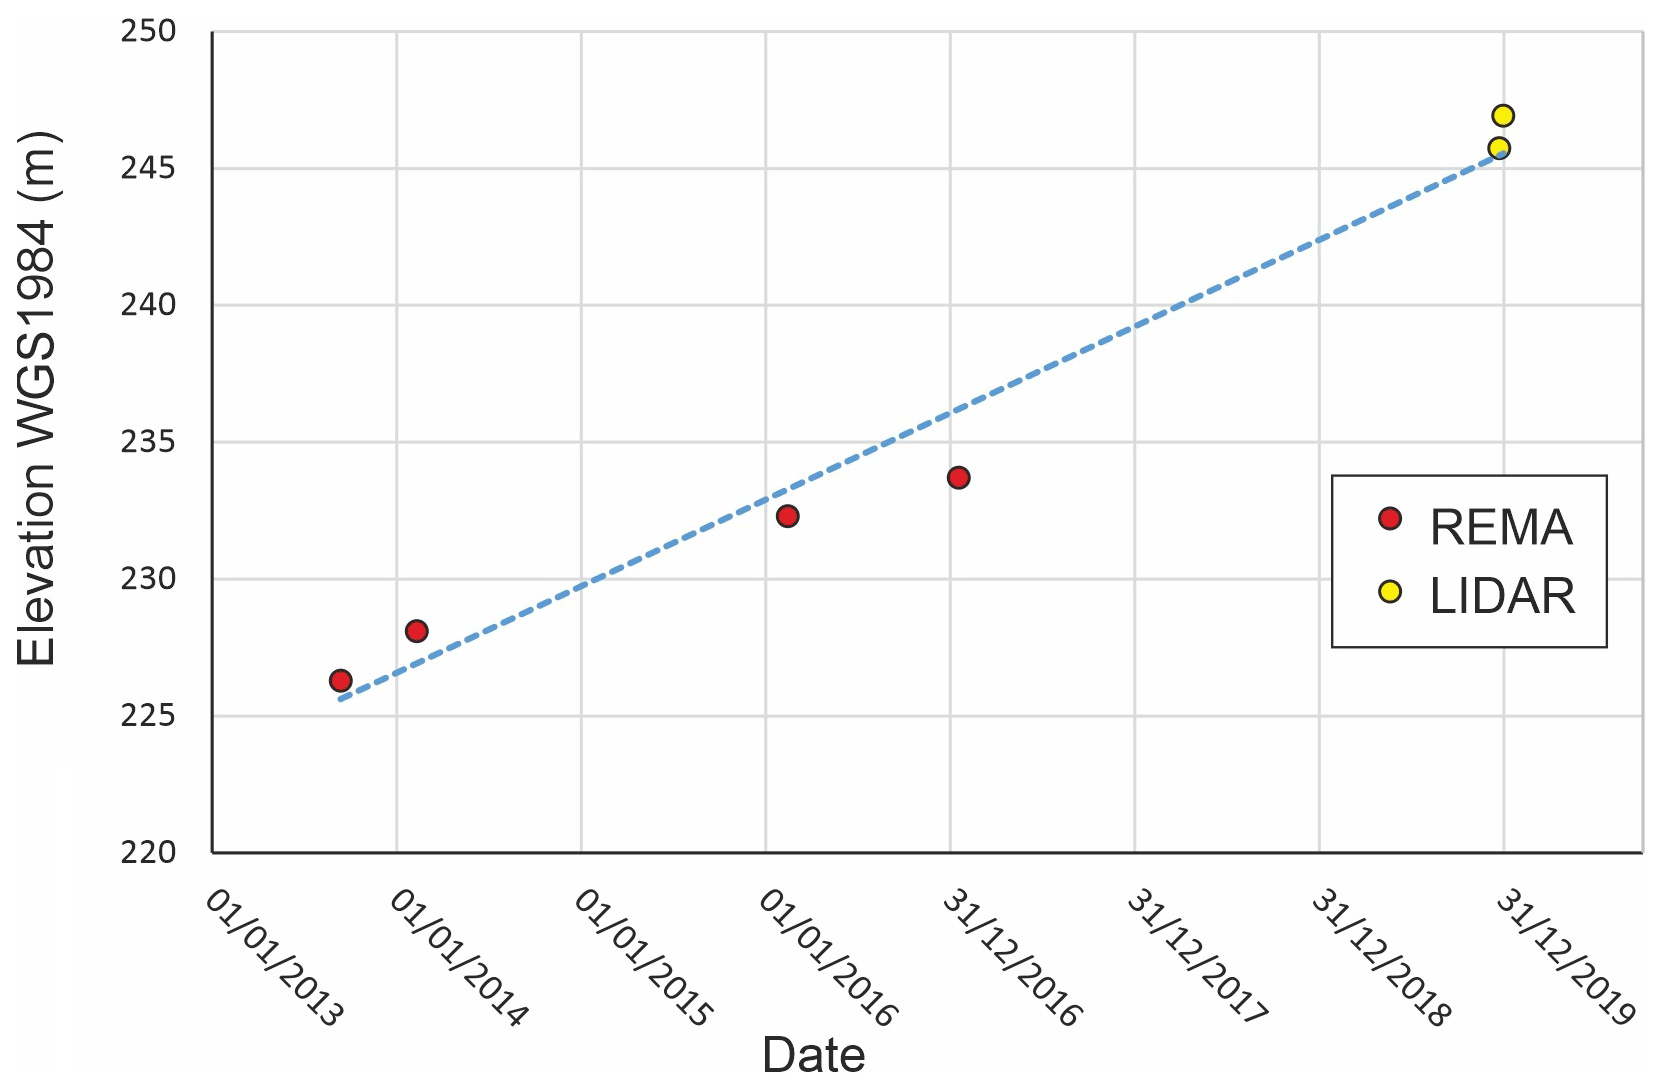
Figure 8Mean elevation of PICS floor with time, based on profiles of REMA and lidar DEMs in Fig. 7. Slope of best-fit line indicates a mean increase of 3.18 m per year.
4.1 Subglacial lake drainage and formation of PICS
Collectively, the evidence presented here is consistent with PICS being the result of rapid drainage of a subglacial lake and collapse of the overlying ice during, or before, January 2011. Collapse was via a subglacial drainage conduit under Mars Glacier which caused partial collapse or deformation of the glacier surface showing the path of the outflow channel (Fig. 2b). Although we cannot rule it out, this deformation of the glacier surface is unlikely to have been formed by an outburst of supraglacial meltwater from the PICS as undeformed glacier ice remains between the assumed site of the subglacial drainage conduit and onset of the down-glacier surface expression of the outflow (Fig. 2b). The radar transects identify a broad bedrock depression in orthogonal transects which could retain subglacial water (Fig. 4).
The rapid nature of the drainage event is supported by the presence of the steep bounding ice cliffs which suggest loss of hydraulic support for the overlying ice and its collapse into a subsurface void following drainage of the subglacial lake. This ice cliff formation has been an ongoing process shown by the detachment of a block of ice and formation of a new ice cliff on the southern side of the depression between the 2017 REMA and the 2019 lidar surveys (Fig. 7), as well as the formation of the concentric crevasses which mark similar ongoing, or partial, structural failures of the ice on the northern side (Fig. 2d). The lake occupying the subglacial cavity must have been at least 46 m deep, using the maximum height of the ice cliffs in 2013 as a proxy for water depth. This adds to the inventory of deep subglacial water bodies under Antarctic Peninsula glaciers including Hodgson Lake with a water depth of 93.4 m (Hodgson et al., 2009b) and the subglacial lake under Crane Glacier with a water depth in “the order of 100 m” (Scambos et al., 2011). However, unlike Hodgson Lake and the subglacial lake under Crane Glacier, the depth of the ice column between the surface depression and the underlying rock cavity is not known.
As the subglacial cavity is not constrained by a bedrock dam (Fig. 4d), its rapid drainage is consistent with the failure of a grounded ice dam at its lowest point, with water able to break through the seal and escape beneath Mars Glacier. This could occur as a result of a cold-based ice dam being eroded by surface meltwater reaching the bed (this process has also been described in volcanic and hydrothermal systems in Iceland; Björnsson, 2003), with water level or pressure increases in the cavity exerting hydrostatic pressure on the ice, or floatation of an ice dam causing it to break contact with the bed, triggering drainage. Glen's (1954) observations of glacier lake drainage events in British Columbia showed that this process can be asymmetric, with enlargement of the lake under the ice in the downhill direction causing increased pressure there relative to the other points, the opening of conduits to the subglacial hydrological network, and rapid emptying. Subglacial lake outburst flood models refer to this as “super flotation water pressures”, in which excess water pressure exceeds the ice overburden pressure and drives water along the ice–bed interface, creating conduits linking into pre-existing subglacial drainage paths (Clarke, 2003).
As with conceptual models of (subaerial) glacial lake outburst floods, frictional heat dissipated by the escaping water can enlarge subglacial conduits, allowing continued drainage (p. 92, Benn and Evans, 2010). In these models, water pressure eventually falls to the extent that closure of the conduit by ice creep exceeds melting rates, and the seal is reformed, allowing the lake to refill. If this mechanism is correct, we can assume that full, or at least partial, resealing had occurred during, or before, 2013 when the lake began to refill, decreasing the depth of PICS by ∼30 m in 6 years (Figs. 7 and 8). At some time between 2011 (Fig. 2a and b) and 2018 (Fig. 2c and d) the surface expression of the subglacial outflow conduit disappeared, which may indicate that it was no longer active.
The 1.18 m decrease in the depth of the PICS between 22 and 30 December 2019 substantially exceeds the overall infill trend (Fig. 8) and coincides with a 32-year record-high surface melt in 2019/2020 recorded on the northern George VI Ice Shelf (Banwell et al., 2021). This suggests a dominant contribution from seasonal surface meltwater, whilst the relative contributions of englacial hydrological processes and snow accumulation remain unknown. The accumulation of blowing snow is considered minor as it is focused on the northern side of PICS (Fig. 2d). This pattern of rapid drainage and slow recharge has been described in subglacial lakes in Greenland (Willis et al., 2015; Livingstone et al., 2019; Liang et al., 2022).
Overall, the PICS feature conforms to Livingstone et al's (2022) descriptions of “water-filled cavities that drain rapidly beneath valley glaciers” (Fig. 7c in Livingstone et al., 2022; Willis et al., 2015; Liang et al., 2022). However, topographically analogous circular ice depressions, referred to as “ice cauldrons” (or “ice caldera”) have also been recognised in areas of volcanic or geothermal activity, for example in Iceland (e.g. Reynolds et al., 2019). Volcanic ice cauldrons are caused by ice melting at their base and are likely to be linked to minor subglacial eruptions. They often occur in clusters that may trace the caldera margin, dyke or rift features. We consider a volcanic origin unlikely for the PICS. There is no evidence of local volcanism around Phobos Ridge or Mars Glacier, although the Beethoven Peninsula volcanic field (Fig. 1a) may extend towards the southeastern margins of Alexander Island (Smellie and Hole, 2021). Late Neogene post-subduction volcanism has been identified elsewhere on Alexander Island and southwest Palmer Land, likely related to the ascent and decompressional melting of mantle through slab windows. This encompasses widely scattered and isolated outcrops of the Late Neogene Bellingshausen Sea Volcanic Group between 8–2.5 Ma (Smellie et al., 1988). Thermal wavelength imagery of 700 000-year-old volcanic rocks at Gluck Peak (148 km west of PICS) indicate elevated heat flow, which may be attributable to ongoing geothermal activity on Alexander Island (Smellie and Hole, 2021), although no primary volcanic landforms have been identified.

Figure 9Analogous ice collapse structures on the northeastern Antarctic Peninsula. (a) The “ice caldera” at Nobby Nunatak, Hope Bay, in July 1958 (Koerner, 1964). This was approximately 30–50 m in diameter with 20 m high ice cliffs and partially filled with water when the photograph was taken. The feature had disappeared by 1960. (b) The ice caldera (marked by dotted blue line) 2.8 km west of Mount Wild near Sjögren and Boydell glaciers in February 1957 (Aitkenhead, 1963). This feature was a 380 m diameter feature with 20 m ice cliffs. (c) The same feature in 2015 (shortly before the retreat of the Boydell Glacier). With the loss of Prince Gustav Channel Ice Shelf between 1989 and 1995 (Cooper, 1997) the bounding glaciers have retreated, and the feature is now part of an extensively deglaciated nunatak adjacent to the coast of Sjögren Inlet. © Google Earth Imagery date 1 January 2015, Maxar Technologies.
4.2 Evidence elsewhere in Antarctica
The feature described here is not unique. A similar but smaller 50 m diameter, 20 m deep feature within a wider 300 m depression was described in 1958 at Nobby Nunatak (63∘25′ S, 56∘59′ W) near Hope Bay at the northeastern end of the Antarctic Peninsula (Koerner, 1964) (Figs. 1 and 9a). Another 380 m diameter, 35 m deep depression was described in 1957 near Mount Wild and the Sjögren and Boydell glaciers on the eastern Antarctic Peninsula (64∘12′ S, 58∘58′ W) (Aitkenhead, 1963) (Figs. 1 and 9b). Both features were referred to as ice caldera, but no link to volcanic activity was proposed. They occur in areas warmed by local föhn winds, raising temperatures above the freezing point, leading to the formation of surface meltwater. Subsequent observations of the feature near Mount Wild showed a rapid lake drainage event occurred between June 1961 and 2 August 1961 following a period of “unusually warm temperature” resulting in the surface of the feature falling by ca. 20 m and causing slabs of ice to collapse and form new ice cliffs around the rim. The author proposed that meltwater had accumulated both at the surface and in a subglacial bedrock basin and that drainage occurred via a subglacial channel.
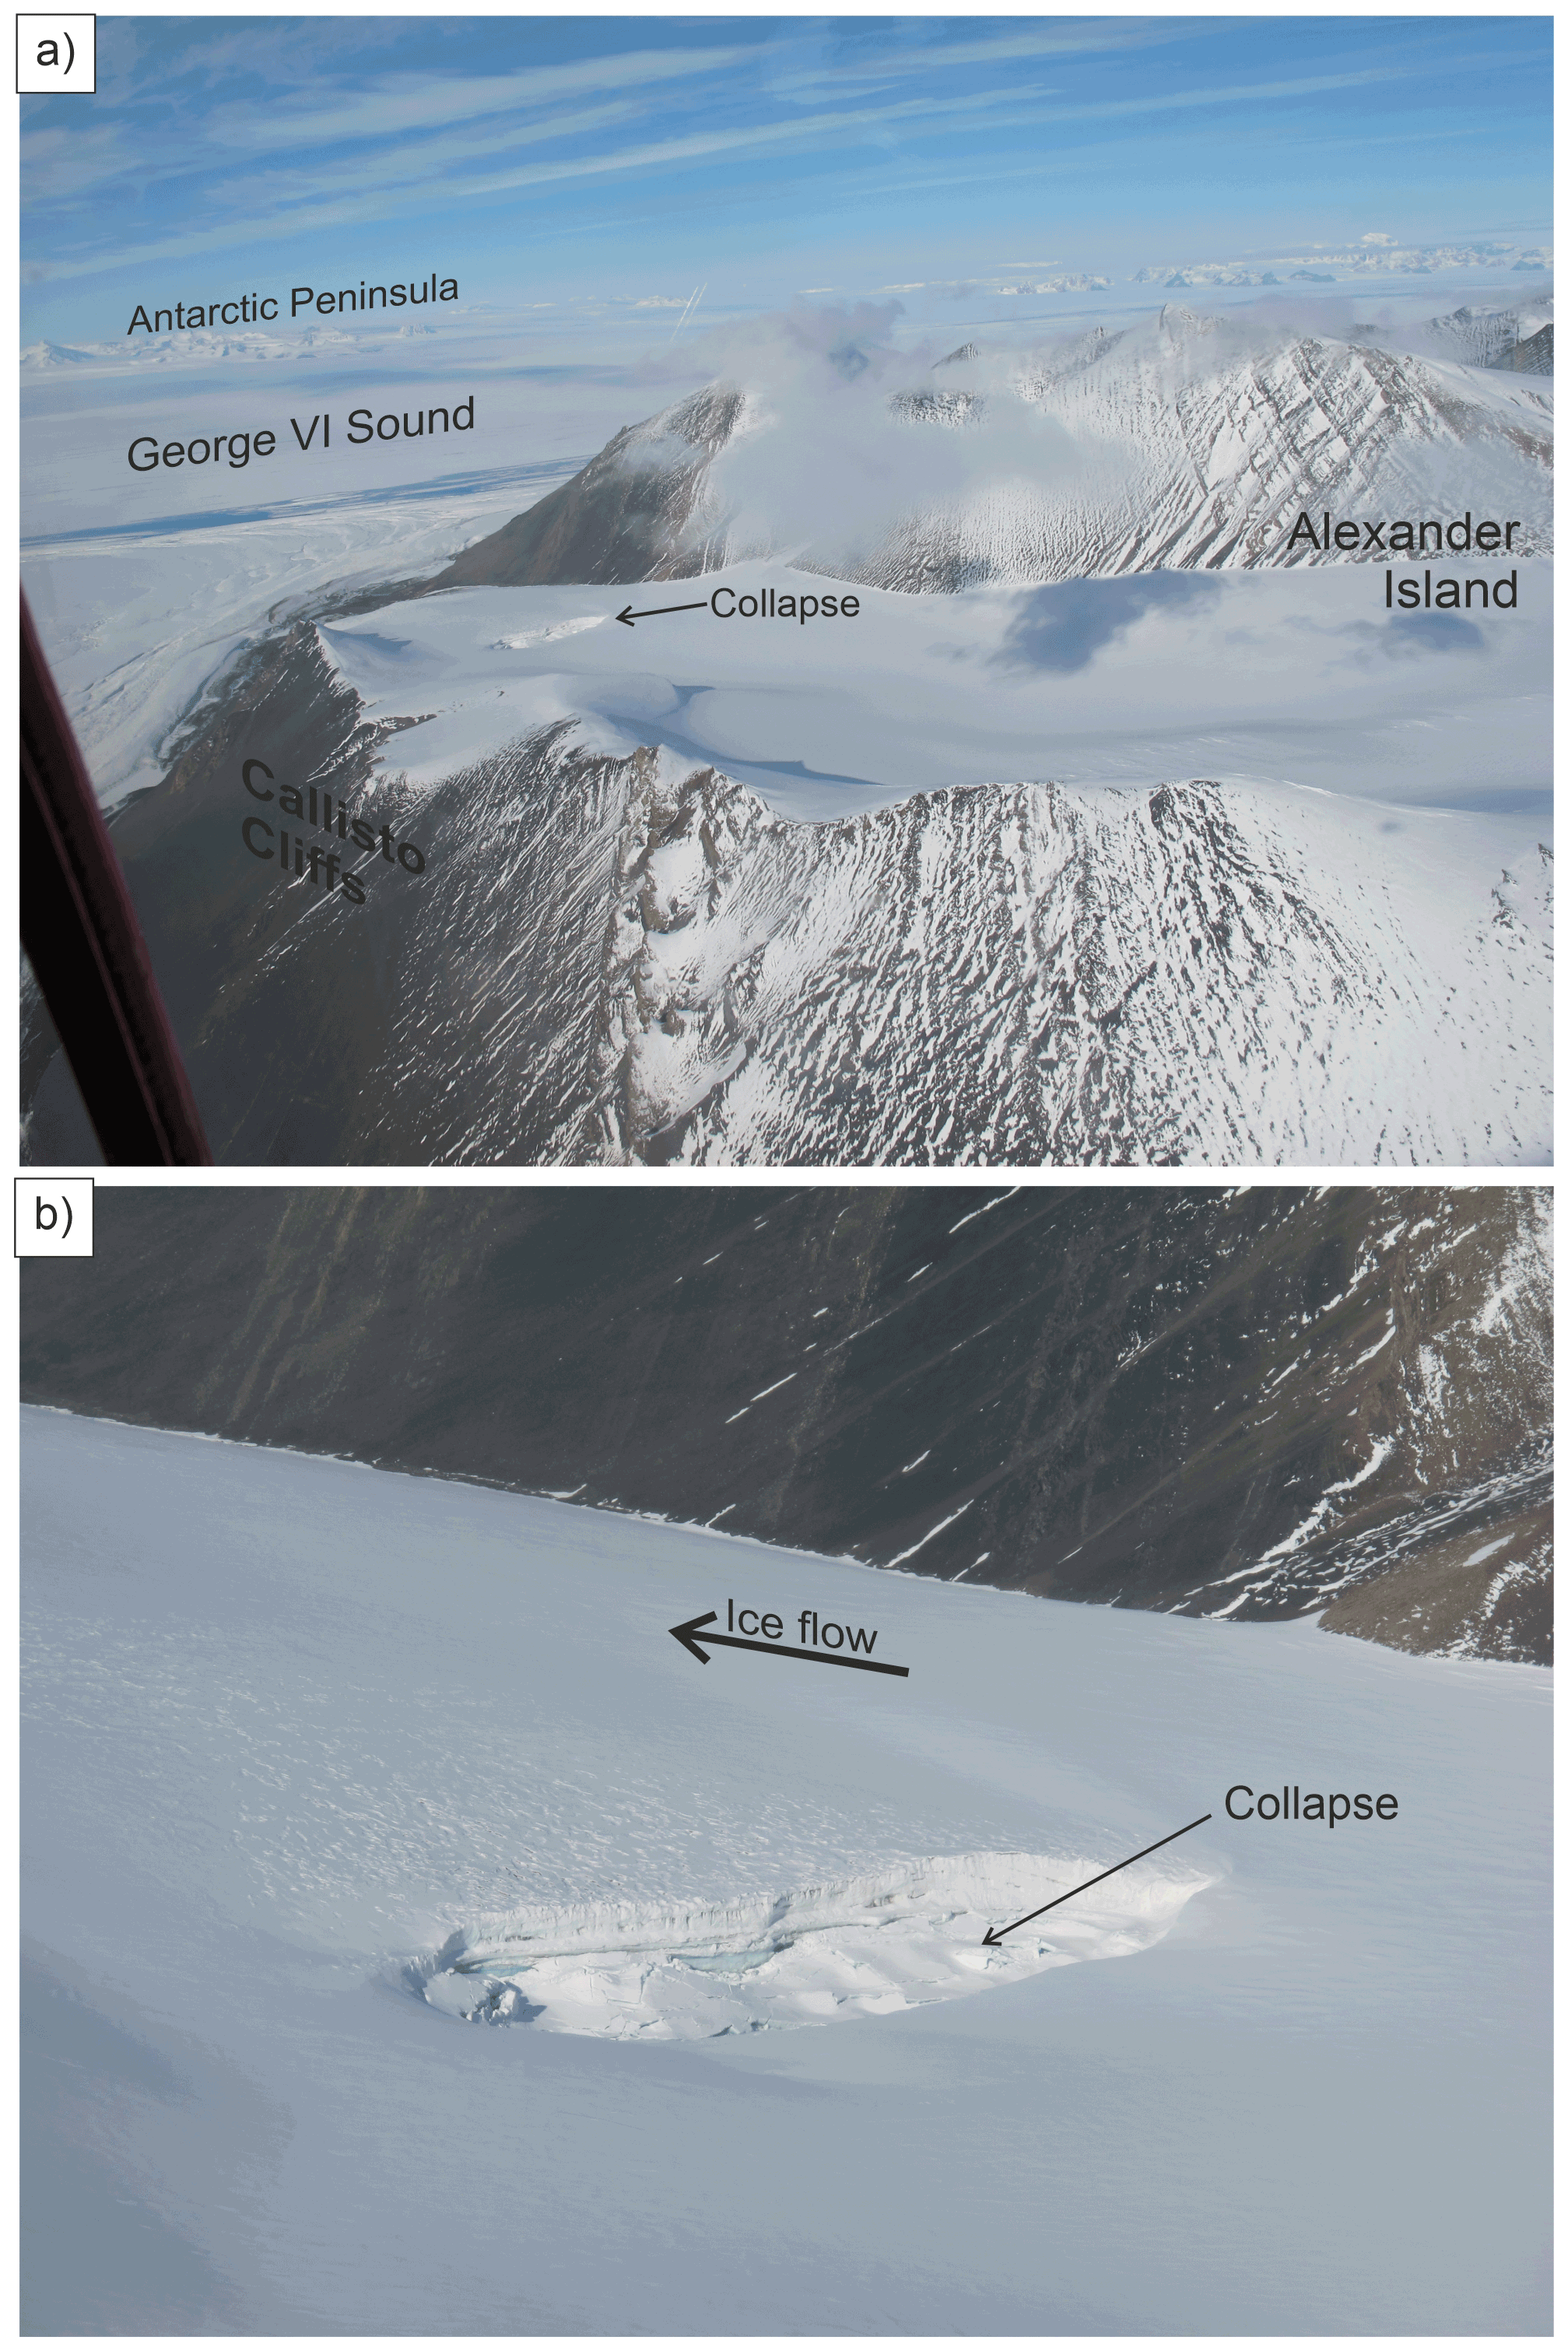
Figure 10Ice collapse structure at Callisto Cliffs on Alexander Island first observed in March 2022. (a) View looking approximately southeast towards George VI Sound. (b) Zoom on collapse structure. Note extensive surface crevassing on the downstream side of the structure which may be the result of supraglacial meltwater or deformation of the surface over an outflow conduit.
More recently, in March 2022 and ca. 1000 km further south an analogous ice collapse structure was photographed at Callisto Cliffs (71∘01′ S, 68∘20′ W; 92 km north of PICS on Alexander Island) (Figs. 1 and 10). This has characteristics consistent with drainage of another subglacial water body, including collapse of the overlying ice and deformation of the glacier surface showing the down-glacier path of the subglacial drainage conduit or surface meltwater (Fig. 10). Elsewhere in Antarctica, a 183 m × 220 m depression bounded by ice cliffs has been described in the Larsemann Hills (East Antarctica), although in this case the collapse of the overlying ice was caused by drainage of supraglacial water and nearby epiglacial lakes into an englacial cavity in 2017 causing its overfill and outburst (Boronina et al., 2021).
4.3 Wider implications
Whilst this feature and its analogues may simply be interesting glaciological anomalies, similar surface collapse features resulting from subglacial lake drainage events have been described from Greenland (Palmer et al., 2015; Willis et al., 2015; Howat et al., 2015). These examples all exhibit a hydraulic connection delivering supraglacial meltwater to the bed of the ice sheet. Willis et al. (2015) suggest that this meltwater would be both warmer and have a lower viscosity which, combined with sporadic lake drainage events, could modulate and possibly accelerate downstream ice flow, with implications for ice sheet mass balance. Observational evidence of this has been provided by Liang et al. (2022) who measured a transient 3-fold increase in glacier flow rates downstream of a lake discharge event in 2019. For subglacial lakes under the East Antarctic Ice Sheet, which are isolated from surface meltwater inputs, rapid drainage (and refilling) has been linked to a 10 % acceleration (and subsequent deceleration) in ice flow (Stearns et al., 2008).
Our hypothesis is that these relatively rare subglacial lake drainage events, and the resulting ice collapse features, mark a threshold in the development of polythermal glacier behaviour. On the Antarctic Peninsula they provide a first surface expression of supraglacial meltwater reaching the bed, bringing about changes in basal hydrology in areas of regional warming. The two ice caldera reported in the northeastern Antarctic Peninsula (Fig. 9) were first described in the late 1950s (Aitkenhead, 1963; Koerner, 1964). This followed the regional intensification of the Southern Hemisphere westerly winds from the 1920s (Perren et al., 2020) which likely increased the frequency of the föhn winds that cause rapid surface melt events in northeast Graham Land (Laffin et al., 2022) and coincides with the onset of regional warming of the northeastern Antarctic Peninsula (data from Esperanza Station shown in Turner et al., 2016).
The spatial and temporal distribution of these features has not been systematically mapped and may therefore be underreported. However, the observation of these features in the northern Antarctic Peninsula in the late 1950s and the apparent recent appearance of similar features ca. 1000 km further south on Alexander Island at the PICS and Callisto Cliffs may indicate a southward extension of this glacier response to regional warming. If delivery of supraglacial and englacial meltwater is responsible for the failure of the ice dam, followed by lake drainage through subglacial conduits and subsequent refill, it would indicate the activation or enhancement of hydrological networks. This would be consistent with work by Bowling et al. (2019) in Greenland which shows a shift from stable subglacial lakes above the equilibrium line altitude (ELA) to hydrologically active lakes near the ELA recharged by surface meltwater. Regional increases in Antarctic Peninsula surface melting have been reported by Abram et al. (2013), and Tuckett et al. (2019) show that delivery of surface meltwater to the bed of Antarctic Peninsula outlet glaciers triggers increased basal water pressure resulting in rapid seasonal ice flow accelerations (up to 100 % greater than the annual mean). For glaciers discharging into ice shelves, ocean forcing has also been shown to influence seasonal flow rates at, and immediately inland of, the grounding line (Boxall et al., 2022).
The rapid drainage of the PICS subglacial lake and its subsequent refilling (largely) by surface meltwater provides a mechanism for transferring the impacts of a warming atmosphere and increased surface melting to the base of the ice sheet (see Willis et al., 2015). Under future +3 ∘C climate change scenarios (DeConto et al., 2021), enhanced volumes of supraglacial and englacial meltwater will be delivered to the bed of the region's glaciers, further coupling surface climate processes to the bed. This will enhance subglacial hydrological activity, and seasonal accelerations in ice flow can be anticipated for longer periods (see Hewitt, 2013), potentially influencing the deglaciation of the Antarctic Peninsula Ice Sheet.
Our detailed analysis of the changing geometry of a ∼280 to 350 m wide circular, steep-sided depression in the surface of Mars Glacier is consistent with the drainage of a ca. 46 m deep subglacial lake and the collapse of the overlying ice. The collapse structure formed during, or prior to, 2011 and has been refilling ever since, reducing its depth from 45 to 25 m between 2013 and 2019. Although the long-term filling trend is approximately linear, repeat lidar observations separated by just 8 d in 2019 show the base of PICS floor rose by ∼1.18 m, equating to ∼71 000 m3 of meltwater input from a catchment just 1.36 km2. This coincides with the 32-year record-high surface melt in 2019/2020 recorded on the northern George VI Ice Shelf. The data therefore suggest that the subglacial hydrological networks in this region are immediately responding to changes in surface climate. As subglacial hydrological networks have been linked to changes in glacier flow rates and grounding line retreat, this close coupling between the surface climate and the bed of the region's glaciers shows their ongoing vulnerability to regional warming.
Data are published in the NERC Polar Data Centre: https://doi.org/10.5285/6909792B-FADF-4DE6-AC2A-D32FA76A8339 (Jordan and Robinson, 2022).
DAH and TAJ contributed equally to this paper. DAH conceived the study from aerial photography, and NR provided and interpreted earlier aerial photographs of the collapse event. TAJ carried out the remote sensing acquisition and analysis. PTF sourced satellite images, and TRR provided the geological expertise. All authors contributed to the writing.
The contact author has declared that none of the authors has any competing interests.
Publisher's note: Copernicus Publications remains neutral with regard to jurisdictional claims in published maps and institutional affiliations.
We thank the British Antarctic Survey (BAS) Operations Team and Air Unit for facilitating the photography of the PICS site. We also acknowledge the NERC–NSF International Thwaites Glacier Collaboration, which facilitated collection of the aerogeophysical data, including the radar data processing by CReSIS (grant NSFPLR-NERC-1739003). Stephen Livingstone, the anonymous reviewer and the handling editor were generous with their knowledge, providing constructive advice and additional references which strengthened our manuscript.
This research has been supported by the Natural Environment Research Council (grant no. bas0100030).
This paper was edited by Reinhard Drews and reviewed by Stephen Livingstone and one anonymous referee.
Abram, N. J., Mulvaney, R., W.Wolff, E., Triest, J., Kipfstuhl, S., Trusel, L. D., Vimeux, F., Fleet, L., and Arrowsmith, C.: Acceleration of snow melt in an Antarctic Peninsula ice core during the twentieth century, Nat. Geosci., 6, 404–411, 2013.
Aitkenhead, N.: An Ice Caldera in North-east Graham Land, Brit. Antarct. Surv. B., 1, 9–15, 1963.
Arnold, E., Leuschen, C., Rodriguez-Morales, F., Li, J., Paden, J., Hale, R., and Keshmiri, S.: CReSIS airborne radars and platforms for ice and snow sounding, Ann. Glaciol., 61, 58–67, https://doi.org/10.1017/aog.2019.37, 2020.
Ashmore, D. W. and Bingham, R. G.: Antarctic subglacial hydrology: current knowledge and future challenges, Antarct. Sci., 26, 758–773, 10.1017/S0954102014000546, 2014.
Banwell, A. F., Datta, R. T., Dell, R. L., Moussavi, M., Brucker, L., Picard, G., Shuman, C. A., and Stevens, L. A.: The 32-year record-high surface melt in 2019/2020 on the northern George VI Ice Shelf, Antarctic Peninsula, The Cryosphere, 15, 909–925, https://doi.org/10.5194/tc-15-909-2021, 2021.
Bartholomew, I., Nienow, P., Sole, A., Mair, D., Cowton, T., and King, M. A.: Short-term variability in Greenland Ice Sheet motion forced by time-varying meltwater drainage: Implications for the relationship between subglacial drainage system behavior and ice velocity, J. Geophys. Res.-Earth Surf., 117, F03002, https://doi.org/10.1029/2011JF002220, 2012.
Benn, D. and Evans, D. J. A.: Glaciers and Glaciation, 2nd Routledge, https://doi.org/10.4324/9780203785010, 2010.
Bindschadler, R., Scambos, T. A., Rott, H., Skvarca, P., and Vornberger, P.: Ice dolines on Larsen Ice Shelf, Antarctica, Ann. Glaciol., 34, 283–290, https://doi.org/10.3189/172756402781817996, 2002.
Björnsson, H.: Subglacial lakes and jökulhlaups in Iceland, Global Planet. Change, 35, 255–271, https://doi.org/10.1016/S0921-8181(02)00130-3, 2003.
Boronina, A., Popov, S., Pryakhina, G., Chetverova, A., Ryzhova, E., and Grigoreva, S.: Formation of a large ice depression on Dålk Glacier (Larsemann Hills, East Antarctica) caused by the rapid drainage of an englacial cavity, J. Glaciol., 67, 1121–1136, https://doi.org/10.1017/jog.2021.58, 2021.
Bowling, J. S., Livingstone, S. J., Sole, A. J., and Chu, W.: Distribution and dynamics of Greenland subglacial lakes, Nat. Commun., 10, 2810, https://doi.org/10.1038/s41467-019-10821-w, 2019.
Boxall, K., Christie, F. D. W., Willis, I. C., Wuite, J., and Nagler, T.: Seasonal land-ice-flow variability in the Antarctic Peninsula, The Cryosphere, 16, 3907–3932, https://doi.org/10.5194/tc-16-3907-2022, 2022.
Capps, D. M., Rabus, B., Clague, J. J., and Shugar, D. H.: Identification and characterization of alpine subglacial lakes using interferometric synthetic aperture radar (InSAR): Brady Glacier, Alaska, USA, J. Glaciol., 56, 861–870, https://doi.org/10.3189/002214310794457254, 2010.
Clarke, G. K. C.: Hydraulics of subglacial outburst floods: new insights from the Spring–Hutter formulation, J. Glaciol., 49, 299–313, https://doi.org/10.3189/172756503781830728, 2003.
Cooper, A. P. R.: Historical observations of Prince Gustav Ice Shelf, Polar Record, 33, 285–294, https://doi.org/10.1017/S0032247400025389, 1997.
DeConto, R. M., Pollard, D., Alley, R. B., Velicogna, I., Gasson, E., Gomez, N., Sadai, S., Condron, A., Gilford, D. M., Ashe, E. L., Kopp, R. E., Li, D., and Dutton, A.: The Paris Climate Agreement and future sea-level rise from Antarctica, Nature, 593, 83–89, https://doi.org/10.1038/s41586-021-03427-0, 2021.
Glen, J. W.: The Stability of Ice-Dammed Lakes and other Water-Filled Holes in Glaciers, J. Glaciol., 2, 316–318, https://doi.org/10.3189/S0022143000025132, 1954.
Hewitt, I. J.: Seasonal changes in ice sheet motion due to melt water lubrication, Earth Planet. Sc. Lett., 371–372, 16–25, https://doi.org/10.1016/j.epsl.2013.04.022, 2013.
Hodgson, D. A., Roberts, S. J., Bentley, M. J., Carmichael, E. L., Smith, J. A., Verleyen, E., Vyverman, W., Geissler, P., Leng, M. J., and Sanderson, D. C. W.: Exploring former subglacial Hodgson Lake. Paper II: Palaeolimnology, Quaternary Sci. Rev., 28, 2310–2325, https://doi.org/10.1016/j.quascirev.2009.04.014, 2009a.
Hodgson, D. A., Roberts, S. J., Bentley, M. J., Smith, J. A., Johnson, J. S., Verleyen, E., Vyverman, W., Hodson, A. J., Leng, M. J., Cziferszky, A., Fox, A. J., and Sanderson, D. C. W.: Exploring former subglacial Hodgson Lake. Paper I: Site description, geomorphology and limnology, Quaternary Sci. Rev., 28, 2295–2309, https://doi.org/10.1016/j.quascirev.2009.04.011, 2009b.
Howat, I. M., Porter, C., Noh, M. J., Smith, B. E., and Jeong, S.: Brief Communication: Sudden drainage of a subglacial lake beneath the Greenland Ice Sheet, The Cryosphere, 9, 103–108, https://doi.org/10.5194/tc-9-103-2015, 2015.
Howat, I. M., Porter, C., Smith, B. E., Noh, M.-J., and Morin, P.: The Reference Elevation Model of Antarctica, The Cryosphere, 13, 665–674, https://doi.org/10.5194/tc-13-665-2019, 2019.
Jordan, T. and Robinson, C.: Rectified airborne Lidar data over Thwaites Glacier catchment between 1st January and 30th December 2019 (Version 1.0), NERC EDS UK Polar Data Centre [data set], https://doi.org/10.5285/6909792B-FADF-4DE6-AC2A-D32FA76A8339, 2022.
Joughin, I., Shean, D. E., Smith, B. E., and Dutrieux, P.: Grounding line variability and subglacial lake drainage on Pine Island Glacier, Antarctica, Geophys. Res. Lett., 43, 9093–9102, https://doi.org/10.1002/2016GL070259, 2016.
Kashani, A. G., Olsen, M. J., Parrish, C. E., and Wilson, N.: A Review of LIDAR Radiometric Processing: From Ad Hoc Intensity Correction to Rigorous Radiometric Calibration, Sensors (Basel), 15, 28099–28128, https://doi.org/10.3390/s151128099, 2015.
Kingslake, J., Ely, J. C., Das, I., and Bell, R. E.: Widespread movement of meltwater onto and across Antarctic ice shelves, Nature, 544, 349–352, https://doi.org/10.1038/nature22049, 2017.
Koerner, R. M.: An ice caldera near Hope Bay, Trinity Peninsula, Graham Land, Brit. Antarct. Surv. B., 3, 37–39, 1964.
Laffin, M. K., Zender, C. S., van Wessem, M., and Marinsek, S.: The role of föhn winds in eastern Antarctic Peninsula rapid ice shelf collapse, The Cryosphere, 16, 1369–1381, https://doi.org/10.5194/tc-16-1369-2022, 2022.
Lai, C.-Y., Kingslake, J., Wearing, M. G., Chen, P.-H. C., Gentine, P., Li, H., Spergel, J. J., and van Wessem, J. M.: Vulnerability of Antarctica's ice shelves to meltwater-driven fracture, Nature, 584, 574–578, https://doi.org/10.1038/s41586-020-2627-8, 2020.
Lenaerts, J. T. M., Lhermitte, S., Drews, R., Ligtenberg, S. R. M., Berger, S., Helm, V., Smeets, C. J. P. P., van d. Broeke, M. R., van de Berg, W. J., van Meijgaard, E., Eijkelboom, M., Eisen, O., and Pattyn, F.: Meltwater produced by wind–albedo interaction stored in an East Antarctic ice shelf, Nat. Clim. Change, 7, 58–62, https://doi.org/10.1038/nclimate3180, 2017.
Liang, Q., Xiao, W., Howat, I., Cheng, X., Hui, F., Chen, Z., Jiang, M., and Zheng, L.: Filling and drainage of a subglacial lake beneath the Flade Isblink ice cap, northeast Greenland, The Cryosphere, 16, 2671–2681, https://doi.org/10.5194/tc-16-2671-2022, 2022.
Livingstone, S. J., Sole, A. J., Storrar, R. D., Harrison, D., Ross, N., and Bowling, J.: Brief communication: Subglacial lake drainage beneath Isunguata Sermia, West Greenland: geomorphic and ice dynamic effects, The Cryosphere, 13, 2789–2796, https://doi.org/10.5194/tc-13-2789-2019, 2019.
Livingstone, S. J., Li, Y., Rutishauser, A., Sanderson, R. J., Winter, K., Mikucki, J. A., Björnsson, H., Bowling, J. S., Chu, W., Dow, C. F., Fricker, H. A., McMillan, M., Ng, F. S. L., Ross, N., Siegert, M. J., Siegfried, M., and Sole, A. J.: Subglacial lakes and their changing role in a warming climate, Nat. Rev. Earth Environ., 3, 106–124, https://doi.org/10.1038/s43017-021-00246-9, 2022.
Moore, J.: Ice blisters and ice dolines, J. Glaciol., 39, 714–716, https://doi.org/10.3189/S002214300001666X, 1993.
Neckel, N., Franke, S., Helm, V., Drews, R., and Jansen, D.: Evidence of Cascading Subglacial Water Flow at Jutulstraumen Glacier (Antarctica) Derived From Sentinel-1 and ICESat-2 Measurements, Geophys. Res. Lett., 48, e2021GL094472, https://doi.org/10.1029/2021GL094472, 2021.
Palmer, S., McMillan, M., and Morlighem, M.: Subglacial lake drainage detected beneath the Greenland ice sheet, Nat. Commun., 6, 8408, https://doi.org/10.1038/ncomms9408, 2015.
Pearce, D. A., Hodgson, D. A., Thorne, M. A. S., Burns, G., and Cockell, C. S.: Preliminary Analysis of Life within a Former Subglacial Lake Sediment in Antarctica, Diversity, 5, 680–702, https://doi.org/10.3390/d5030680, 2013.
Perren, B. B., Hodgson, D. A., Roberts, S. J., Sime, L., Van Nieuwenhuyze, W., Verleyen, E., and Vyverman, W.: Southward migration of the Southern Hemisphere westerly winds corresponds with warming climate over centennial timescales, Commun. Earth Environ., 1, 58, https://doi.org/10.1038/s43247-020-00059-6, 2020.
Reynolds, H. I., Gudmundsson, M. T., Högnadóttir, T., and Axelsson, G.: Changes in Geothermal Activity at Bárdarbunga, Iceland, Following the 2014–2015 Caldera Collapse, Investigated Using Geothermal System Modeling, J. Geophys. Res.-Sol. Ea., 124, 8187–8204, https://doi.org/10.1029/2018JB017290, 2019.
Rignot, E., Mouginot, J., Scheuchl, B., Broeke, M. V. D., Wessem, M. J. V., and Morlighem, M.: Four decades of Antarctic Ice Sheet mass balance from 1979–2017, P. Natl. Acad. Sci. USA, 116, 1095–1103, https://doi.org/10.1073/pnas.1812883116, 2019.
Rivera, A., Uribe, J., Zamora, R., and Oberreuter, J.: Subglacial Lake CECs: Discovery and in situ survey of a privileged research site in West Antarctica, Geophys. Res. Lett., 42, 3944–3953, https://doi.org/10.1002/2015GL063390, 2015.
Scambos, T. A., Berthier, E., and Shuman, C. A.: The triggering of subglacial lake drainage during rapid glacier drawdown: Crane Glacier, Antarctic Peninsula, Ann. Glaciol., 52, 74–82, https://doi.org/10.3189/172756411799096204, 2011.
Siegert, M. J., Carter, S., Tabacco, I., Popov, S., and Blakenship, D.: A revised inventory of Antarctic subglacial lakes, Antarct. Sci., 17, 453–460, 2005.
Siegfried, M. R. and Fricker, H. A.: Thirteen years of subglacial lake activity in Antarctica from multi-mission satellite altimetry, Ann. Glaciol., 59, 42–55, https://doi.org/10.1017/aog.2017.36, 2018.
Smellie, J. L. and Hole, M. J.: Chapter 4.1a Antarctic Peninsula: volcanology, Geological Society, London, Memoirs, 55, 305–325, https://doi.org/10.1144/m55-2018-59, 2021.
Smellie, J. L., Pankhurst, R. J., Hole, M. J., and Thomson, J. W.: Age, distribution and eruptive conditions of late Cenozoic alkaline volcanism in the Antarctic Peninsula and eastern Ellsworth Land: a review, Brit. Antarct. Surv. B., 80, 21–49, 1988.
Smith, A. M., Woodward, J., Ross, N., Bentley, M. J., Hodgson, D. A., Siegert, M. J., and King, E. C.: Evidence for the long-term sedimentary environment in an Antarctic subglacial lake, Earth Planet. Sc. Lett., 504, 139–151, https://doi.org/10.1016/j.epsl.2018.10.011, 2018.
Stearns, L. A., Smith, B. E., and Hamilton, G. S.: Increased flow speed on a large East Antarctic outlet glacier caused by subglacial floods, Nat. Geosci., 1, 827–831, https://doi.org/10.1038/ngeo356, 2008.
Trusel, L. D., Frey, K. E., Das, S. B., Karnauskas, K. B., Kuipers Munneke, P., van Meijgaard, E., and van den Broeke, M. R.: Divergent trajectories of Antarctic surface melt under two twenty-first-century climate scenarios, Nat. Geosci., 8, 927–932, https://doi.org/10.1038/ngeo2563, 2015.
Tuckett, P. A., Ely, J. C., Sole, A. J., Livingstone, S. J., Davison, B. J., Melchior van Wessem, J., and Howard, J.: Rapid accelerations of Antarctic Peninsula outlet glaciers driven by surface melt, Nat. Commun., 10, 4311, https://doi.org/10.1038/s41467-019-12039-2, 2019.
Turner, J., Lu, H., White, I., King, J. C., Phillips, T., Hosking, J. S., Bracegirdle, T. J., Marshall, G. J., Mulvaney, R., and Deb, P.: Absence of 21st century warming on Antarctic Peninsula consistent with natural variability, Nature, 535, 411–415, https://doi.org/10.1038/nature18645, 2016.
van den Broeke, M.: Strong surface melting preceded collapse of Antarctic Peninsula ice shelf, Geophys. Res. Lett., 32, L12815, https://doi.org/10.1029/2005GL023247, 2005.
Warner, R. C., Fricker, H. A., Adusumilli, S., Arndt, P., Kingslake, J., and Spergel, J. J.: Rapid Formation of an Ice Doline on Amery Ice Shelf, East Antarctica, Geophys. Res. Lett., 48, e2020GL091095, https://doi.org/10.1029/2020GL091095, 2021.
Willis, M. J., Herried, B. G., Bevis, M. G., and Bell, R. E.: Recharge of a subglacial lake by surface meltwater in northeast Greenland, Nature, 518, 223–227, https://doi.org/10.1038/nature14116, 2015.