the Creative Commons Attribution 4.0 License.
the Creative Commons Attribution 4.0 License.
 | 13 Sep 2022
Variability in sea ice carbonate chemistry: a case study comparing the importance of ikaite precipitation, bottom-ice algae, and currents across an invisible polynya
Brent G. T. Else
Araleigh Cranch
Richard P. Sims
Samantha Jones
Laura A. Dalman
Christopher J. Mundy
Rebecca A. Segal
Randall K. Scharien
Tania Guha
The carbonate chemistry of sea ice is known to play a role in global carbon cycles, but its importance is uncertain in part due to disparities in reported results. Variability in physical and biological drivers is usually invoked to explain differences between studies. In the Canadian Arctic Archipelago, “invisible polynyas” – areas of strong currents, thin ice, and potentially high biological productivity – are examples of extreme spatial variability. We used an invisible polynya as a natural laboratory to study the effects of inferred initial ice formation conditions, ice growth rate, and algal biomass on the distribution of carbonate species by collecting enough cores to perform a statistical comparison between sites located within, and just outside of, a polynya near Iqaluktuttiaq (Cambridge Bay, Nunavut, Canada). At both sites, the uppermost 10 cm ice horizon showed evidence of CO2 off-gassing, while carbonate distributions in the middle and bottommost 10 cm horizons largely followed the salinity distribution. In the polynya, the upper ice horizon had significantly higher bulk total inorganic carbon (TIC), total alkalinity (TA), and salinity potentially due to freeze-up conditions that favoured frazil ice production. The middle ice horizons were statistically indistinguishable between sites, suggesting that ice growth rate is not an important factor for the carbonate distribution under mid-winter conditions. The thicker (non-polynya) site experienced higher algal biomass, TIC, and TA in the bottom horizon. Carbonate chemistry in the bottom horizon could largely be explained by the salinity distribution, with the strong currents at the polynya site potentially playing a role in desalinization; biology appeared to exert only a minor control, with some evidence that the ice algae community was net heterotrophic. We did see evidence of calcium carbonate precipitation but with little impact on the TIC:TA ratio and little difference between sites. Because differences were constrained to relatively thin layers at the top and bottom, vertically averaged values of TIC, TA, and especially the TIC:TA ratio were not meaningfully different between sites. This provides some justification for using a single bulk value for each parameter when modelling sea ice effects on ocean chemistry at coarse resolution. Exactly what value to use (particularly for the TIC:TA ratio) likely varies by region but could potentially be approximated from knowledge of the source seawater and sea ice salinity. Further insights await a rigorous intercomparison of existing data.
- Article
(3328 KB) - Full-text XML
-
Supplement
(635 KB) - BibTeX
- EndNote


Polar seas typically act as strong sinks for atmospheric CO2. Recent estimates of the Arctic CO2 sink suggest an uptake on the order of 150–200 TgC yr−1 or about 10 %–14 % of the global ocean sink (Bates and Mathis, 2009; Yasunaka et al., 2016; Manizza et al., 2019). This sink is significantly larger than one might expect given the relatively small surface area (about 3 % of the global surface ocean). Carbon dioxide uptake for the sea ice zone of the Southern Ocean has been estimated at 56 TgC yr−1 or about 4 % of the global sink (Takahashi et al., 2009), slightly exceeding its relative surface area (3 %).
The carbon sink in these polar regions is thought to be enhanced by some combination of the solubility pump (CO2 is more soluble in cold water and thus can be transported to depth by convection events), the biological pump (CO2 sequestered in organic material is exported out of the surface ocean by sinking), and the “sea ice pump”. The sea ice pump was first proposed by Rysgaard et al. (2007), who observed elevated total alkalinity (TA) relative to total inorganic carbon (TIC) in melted sea ice samples. The hypothesized cause of this TA enrichment was the precipitation of ikaite, a calcium carbonate crystal form that has since been positively identified in Antarctic (Dieckmann et al., 2008) and Arctic (Dieckmann et al., 2010) sea ice. The theory posits that as sea ice grows and rejects impurities, ikaite crystals are formed and preferentially trapped in the sea ice matrix relative to brine. Ikaite is a form of particulate inorganic carbon, but its precipitation lowers the TIC concentration of the source brine by only 1 mol while lowering TA by 2 mol. Brine that drains out of the ice during the desalination process (Notz and Worster, 2009) is therefore relatively enriched in dissolved inorganic carbon, leaving the bulk sea ice enriched in TA. If brines rich in dissolved inorganic carbon sink to sufficient depths, this sequesters carbon from the surface ocean, while the subsequent ice melt in spring releases TA to the surface ocean, lowering pCO2 and driving higher atmospheric CO2 uptake during the open water season.
The fundamental parameter driving this pump is the TA:TIC ratio in sea ice, which if only affected by ikaite should range from 2:1 (the theoretical maximum ratio) to approximately 1:1 (seawater typically has a ratio near 1:1, which should be reflected in sea ice if brine is rejected conservatively). Published results have reported ratios spanning 0.9 to 2.2 from a variety of different Arctic and Antarctic field sites (Rysgaard et al., 2007, 2009; Miller et al., 2011a, b; Geilfus et al., 2012; Brown et al., 2015; Findlay et al., 2015). The absolute concentration values of TIC and TA in sea ice also span a significant range: for the above-listed studies, these values range from <100 to >700 µmol kg−1 for both species. This observed variability suggests not only that ikaite precipitation is a variable process but that other biogeochemical factors impact TIC and TA in sea ice.
Ice growth conditions are one set of factors that may affect sea ice carbonate chemistry. The physical process of sea ice formation depends in part on turbulence (Martin and Kauffman, 1981; Savel'yev 1958, 1963). During initial ice formation, turbulent areas (driven by wind or tidal currents) generate large amounts of frazil ice in a thicker mixed layer, leading to a collision and bonding process that results in faster formation of floes (Martin and Kauffman, 1981; Chalmers and Williamson, 1965; Savel'yev 1958, 1963). In contrast, calmer areas develop thinner frazil ice layers (Petrich and Eicken, 2010). Once the surface ice (approximately the first 30 cm or less) is consolidated, congelation (columnar) ice growth dominates, and the rate of growth strongly impacts brine rejection. Faster crystallization during sea ice formation typically results in increased retention of salts, including TIC. A laboratory study by König et al. (2018) found the amount of TIC trapped in sea ice almost doubled for sea ice grown at −40 ∘C compared to ice grown at −15 ∘C. In the natural environment, ice growth rates are controlled not only by atmospheric forcing but also by snow depth (deep snow insulates the ice and lowers the growth rate) and under-ice seawater temperature and currents (strong currents enhance ocean heat flux and lower the ice growth rate).
Gas exchange between the sea ice and the overlying atmosphere can also play a role in sea ice carbonate chemistry, at least in the upper layers of the ice. During ice formation, some brine is rejected upwards, allowing CO2 to off-gas to the atmosphere (Geilfus et al., 2013; Nomura et al., 2014). In the frazil crystal structures of surface ice, the high brine fraction creates high enough permeability (relative to layers immediately below it) for this outgassing to occur over a layer several centimetres thick (Moreau et al., 2015). Laboratory estimates have found that the amount of carbon released to the atmosphere via this process is a small fraction (<1 %) of the total inorganic carbon redistributed by ice formation (Rysgaard et al., 2009; König et al., 2018). While gas exchange may not impact the entire ice column, it may be important in determining the vertical distribution of TIC in the surface horizon of the sea ice.
Biological processes are also likely to affect the vertical distribution of TIC and TA in sea ice. Miller et al. (2011a) found evidence for the production of CO2 throughout the sea ice column in winter, likely as a result of respiration within brine inclusions. In the spring, algal blooms occur within the bottom of sea ice in many Arctic locations (Leu et al., 2015) and throughout the ice profile in Antarctic regions (e.g., Meiners et al., 2012, 2018), resulting in observed decreases in TIC in the lower horizons of sea ice cores (Delille et al., 2007; Miller et al., 2011a; Brown et al., 2015). The spatial distribution of ice algae is known to be highly heterogeneous (Leu et al., 2015), contributing to high heterogeneity in other biogeochemical properties, including carbonate chemistry (Miller et al., 2015). In general, ice algal biomass is controlled by light availability (largely a function of snow cover, with thick snow reducing light transmission and ice algae production; e.g., Campbell et al., 2014) and nutrient availability (potentially a function of seawater nutrient concentration and turbulence, with strong currents enhancing nutrient supply and ice algal production; e.g., Dalman et al., 2019).
The horizontal and vertical variability in sea ice TIC and TA that results from these processes may impact the efficiency of the sea ice carbon pump. In an early study, Rysgaard et al. (2011) used a simple box model and estimated its impact on air–sea CO2 uptake to be 31 TgC yr−1 in the Arctic and 52 TgC yr−1 in the Antarctic. However, subsequent efforts using coupled three-dimensional general circulation models produced much lower estimates. Grimm et al. (2016) found an enhancement of only 2–14 TgC yr−1 for the Arctic and Antarctic sea ice zones combined, while Moreau et al. (2016) attributed only a 4 TgC yr−1 uptake globally to the sea ice pump. Using a one-dimensional model with more detailed biogeochemical processes, Mortenson et al. (2018) similarly found that ikaite precipitation and dissolution did not have a large impact on annual air–sea CO2 flux budgets due to a lack of deep convection at their study site. However, both Grimm et al. (2016) and Moreau et al. (2016) concluded that the sea ice carbon pump is important in specific polar regions (most notably in deep water formation areas) and could be important on long timescales (e.g., during the glacial–interglacial transitions).
In sensitivity analyses, both Mortenson et al. (2018) and Grimm et al. (2016) found that the strength of the sea ice pump responds strongly to the prescribed TA:TIC ratio. Furthermore, Grimm et al. (2016) found that the absolute concentration of TA and TIC had a significant impact. It is also important to consider that all these studies were working from limited field data. Despite this sensitivity and the observed variability in sea ice carbonate chemistry described above, the central results of most modelling studies use a single value for TIC, typically around 400 µmol kg−1, and a single TA:TIC ratio, typically 2:1 (Rysgaard et al., 2011; Grimm et al., 2016; Mortenson et al., 2018).
If the biogeochemical processes responsible for variability in sea ice carbon system parameters can be constrained by field measurements, that variability could conceivably be included in biogeochemical models, leading to better estimates of the role of the sea ice carbon pump in regional and global models. Accordingly, this paper describes field measurements of TA and TIC in landfast first-year sea ice cores collected at two sites in the Canadian Arctic Archipelago. The sites (separated by only 7 km) were chosen based on prior knowledge of significantly different physical and biological conditions due to the presence of an “invisible polynya” (Dalman et al., 2019) – a region of distinctly thinner ice within the landfast icescape (Melling et al., 2015). This paper seeks to contrast the two sites with objectives to characterize how differing physical and biological processes impact both horizontal and vertical distributions of carbonate properties in sea ice and determine if these processes affect the bulk estimates of TA and TIC commonly ingested into models of the sea ice carbon pump.
2.1 Study area
This study was conducted in Dease Strait, a narrow channel that is part of the southern limb of the Northwest Passage in the Canadian Arctic Archipelago. In the winter, Dease Strait is covered by landfast first-year sea ice that typically consolidates in early November and breaks up in mid-July (Galley et al., 2012; Xu et al., 2021). The strait is relatively shallow (max depth ∼100 m), and surface waters are somewhat less saline (∼29) than most of the Archipelago due to high river discharge and bounding sills to the east and west (Williams et al., 2018; Xu et al., 2021). The region is severely nutrient limited, with nitrate concentrations amongst the lowest measured anywhere in the Arctic (1.0–1.2 µmol L−1 beneath the pycnocline in summer; Back et al., 2021; 1.3 µmol L−1 beneath sea ice; Dalman et al., 2019). However, a modest bottom-ice algae bloom still occurs in the spring, peaking in late May (Campbell et al., 2016).
Our sites were located near the Finlayson Islands, a chain of rocky outcrops about 30 km west of Cambridge Bay (Nunavut, Canada) that bisect Dease Strait in a north–south direction (Fig. 1). These islands create narrow constrictions where localized currents can be much stronger than is typical for the region. Our study builds on work conducted by Dalman et al. (2019), who described an invisible polynya between the islands. Their study found patterns whereby areas with stronger under-ice currents experienced thinner ice (by approximately 20 cm or 10 %) and higher bottom-ice algae biomass (about 2–6 times greater Chlorophyll a, Chl a, biomass). Dalman et al. (2019) concluded that stronger current velocities reduce the ice growth rate by enhancing ocean heat flux to the bottom of the ice and stimulate ice algal growth through turbulent resupply of nutrients. To study the effect of these conditions on the sea ice carbonate system, we selected two level ice sites (Fig. 1) based on Dalman et al. (2019): one approximately 5 km to the east of the islands, outside of the polynya where we expected weaker currents and thick first-year ice (TFYI; within 100 m of their site 5), and one directly between the islands, in the polynya where we expected strong currents and thin first-year ice (POLY; within 100 m of their site 2).
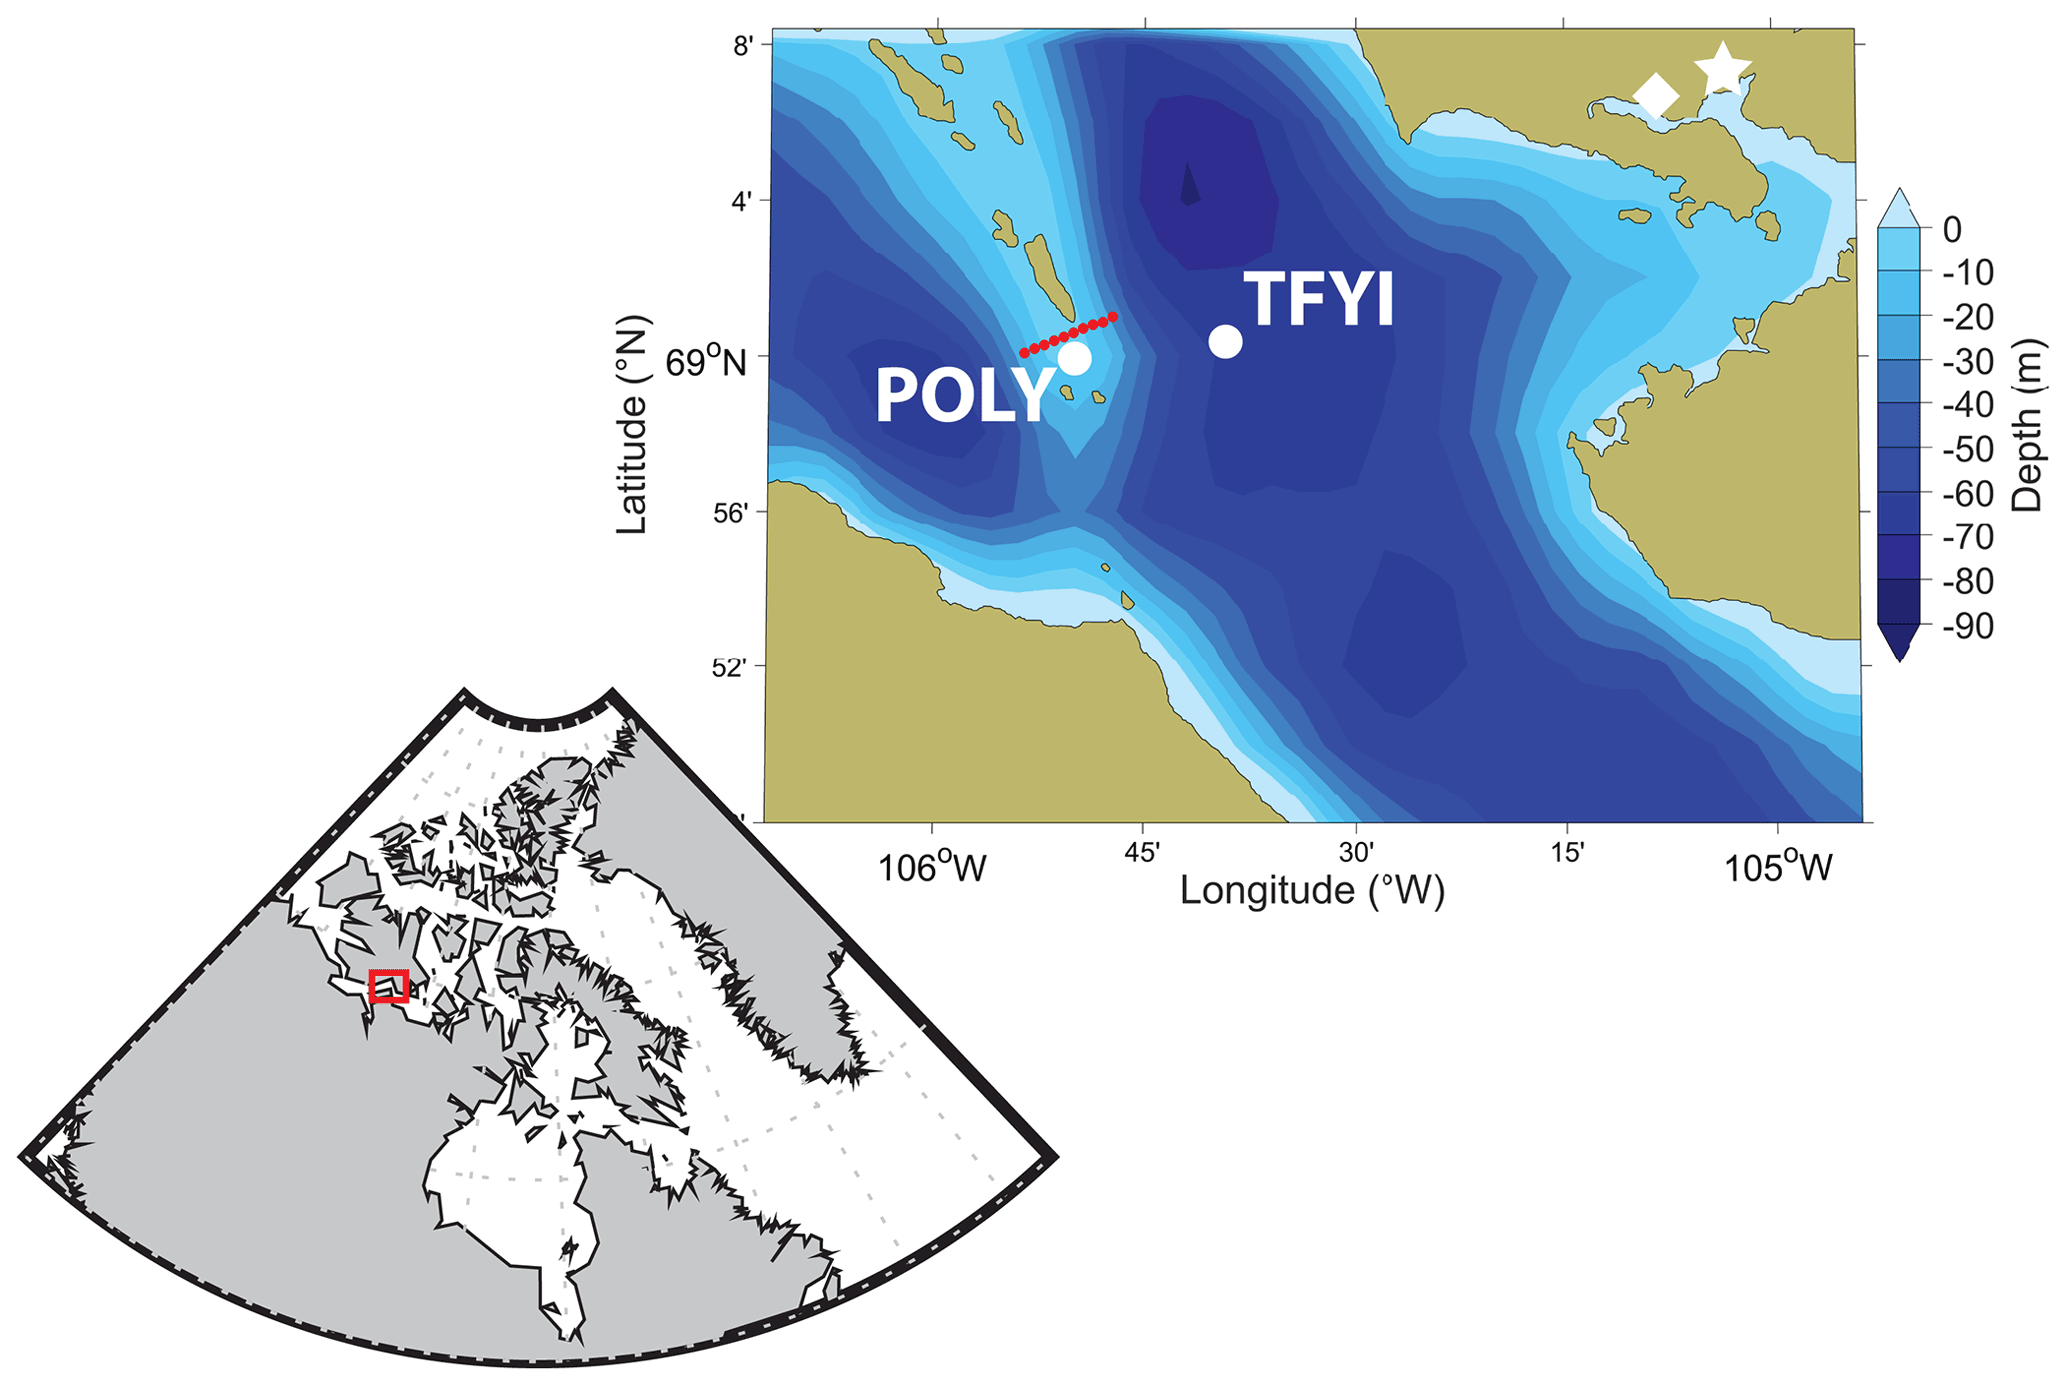
Figure 1Study area (including bathymetry), showing the location of the two sampling sites. The thick first-year ice site (TFYI) was located at 69.01∘ N, 105.66∘ W. The polynya site (POLY) was located at 68.99∘ N, 105.84∘ W. The proximity to Cambridge Bay (white star), the nearest Environment Canada weather station (white diamond), and the snow depth and ice thickness transect (red circles) are also shown.
2.2 Field methods
Sampling was conducted over a 6 d period between 4 and 10 May 2019, with both sites visited on 3 d (4, 7, and 10 May). On the first sampling date, inverted tilt current meters (Lowell Instruments TCM-1 current meter) were installed at both sites 30 cm below the bottom of the ice. The current meters recorded velocity and temperature for 20 s of each minute at a frequency of 16 Hz, which was averaged to 1 min intervals in post-processing. The instruments were removed on 10 May, producing a 6 d record of under-ice current velocities.
Sea ice sampling was conducted at the sites using a Kovacs Mark II 9 cm diameter coring system. The following general considerations were observed for all cores: snow depth was measured with a metre stick prior to collection; ice thickness was measured after core collection using a Kovacs measuring tape; when removing cores, the bottoms were pointed away from the sun and shaded to minimize exposure of the ice algal community; and equipment that produced exhaust (snowmobiles, generators) were positioned downwind of the sampling site. One core was collected at each site on each day for temperature and salinity profiles. Temperature was measured using a Thermapen Mk4 temperature probe inserted into holes drilled at 10 cm intervals. The core was cut into 10 cm sections, which were sealed in plastic bags and transported back to the field lab where they were melted and analyzed for salinity using a YSI multiparameter probe.
For sea ice carbonate sampling we followed the procedure and materials of Hu et al. (2018). After collecting a core, 10 cm sections were cut in the field, placed into a gas-tight bag, and immediately vacuum sealed using a commercial meat sealer. The sealed samples were transported back to the field lab and allowed to melt in the dark at room temperature for 15–20 h. Meltwater was then transferred to 160 mL borosilicate bottles using a peristaltic pump. The pump was operated at low speed, and water was pumped from the bottom of the bag to the bottom of the bottle. The sample bottles were triple rinsed and overflown during filling as per Dickson et al. (2007). Samples were then fixed with 80 µL of saturated mercuric chloride (0.05 % of the total sample volume, as per Dickson et al., 2007) to prevent biological activity and sealed using chlorobutyl-isoprene rubber stoppers and aluminium caps (Jiang et al., 2008). Samples were stored in the dark until analysis, which occurred within 3 months of collection.
At each site, we obtained one “high-resolution” core for TIC and TA (10 May), in which sections were collected every 10 cm from top to bottom. The purpose of the high-resolution core was to qualitatively compare the vertical distribution of TIC and TA between the two sites. But as described in Miller et al. (2015), the inherent heterogeneity of sea ice makes it difficult to quantitatively compare single samples between two sites. To address this, we designed a statistical sampling method in which on each date, five locations were randomly selected within a 10 m radius of the centre point of each site. At each of these locations a core was extracted, and we collected the top, bottom, and middle 10 cm for TIC and TA analysis. The middle horizon was determined by measuring the length of each core before sectioning and then collecting a section that spanned the centre of the core. The rest of the core volume was discarded. This yielded a total of 15 samples for each horizon (top, middle, bottom) for each site.
To obtain enough sample volume for a bottom-ice Chl a measurement at both sites, the bottom 5 cm of three additional cores were combined (“pooled”) in an opaque jug. At each site we collected duplicate samples following this procedure, except on the final sampling day when a single pooled sample was collected at each site. Following Dalman et al. (2019), the cores were melted in the cooler jug with filtered seawater added at a 3:1 ratio to reduce osmotic stress on the algae. The melted samples were filtered onto 25 mm GFF filters in a dark room within 48 h of collection. The filter papers were then packaged in light-impenetrable foil, frozen, and transported to the University of Manitoba for Chl a analysis.
During our study, we did not collect under-ice seawater samples for carbon system analysis. In past studies, under-ice seawater samples have been used as a reference to compare against sea ice chemistry. Instead, we relied on seawater carbonate system measurements we collected in summer from a small research vessel stationed in Cambridge Bay (see, for example, Williams et al., 2018). To develop a seawater reference, we averaged all salinity, TA, and TIC samples collected annually below the summer halocline from 2016 to 2019 (n=5) at station R3 (68.97∘ N, 105.47∘ W) which is within 15 km of the sampling sites. This yielded a seawater reference (or “endmember”) of Sref=28.8 (±0.4), TAref=2058 µmol kg−1 (±42), and TICref=1970 µmol kg−1 (±16).
A complementary survey of snow and ice conditions at the polynya was conducted separately from our primary study by a collaborating research team. On 12 May, 10 sites at 500 m spacing were visited across the northern end of the polynya, approximately 1 km north of POLY (Fig. 1). Snow depth was measured at every site, and ice thickness was measured every second site. We use those results in this paper to examine the spatial extent of the invisible polynya.
2.3 Laboratory methods
Sea ice melt samples were analyzed at the University of Calgary. TIC was determined through acid extraction using an automated sample preparation system (AIRICA by Marianda) that quantifies released CO2 using an infrared gas analyzer (LI-COR LI-7000). Four TIC replicates of 1.5 mL were analyzed for each sample; the replicate with the highest coefficient of variation was discarded, and the average of the three remaining replicates was calculated. TA was measured by modified Gran titration (Grasshoff et al., 1999) using a semi-automated open-cell titration system (AS-ALK2 Apollo SciTech) (Cai et al., 2010). Replicates were conducted until two measurements with a coefficient of variation of less than 0.002 were obtained and then averaged. Both instruments were calibrated prior to measurement using certified reference material (CRM batch no. 177) from the Scripps Institution of Oceanography of the University of California, San Diego. Precision better than ±1.5 µmol kg−1 was obtained for TIC and better than ±3.2 µmol kg−1 for TA. Remaining sample water was then analyzed for salinity using an Orion Star A222 conductivity meter paired with a 013010MD conductivity cell, calibrated daily to a NIST traceable standard.
Chl a concentration was determined by fluorometry. Frozen filters were placed in scintillation vials with 10 mL of 90 % acetone in the dark, briefly agitated on a vortex mixer, and then kept at 4 ∘C for 24 h to extract pigment. Chl a fluorescence was then measured (Turner Designs Trilogy fluorometer) before and after acidifying with 5 % HCl following Parsons et al. (1984). From these measurements, the concentration of Chl a was calculated following equations of Holm-Hansen et al. (1965) and a correction for filtered seawater dilution. Concentrations were converted to biomass (e.g., Chl a expressed as mg m−2) by multiplying by the length of the core section collected (in this case, 5 cm or 0.05 m).
2.4 Statistical and remote sensing analysis
Due to the number of samples collected for TIC and TA at the three horizons and for snow depth and ice thickness, we were able to test for statistically significant differences between sites using analysis of variance (ANOVA). ANOVA tests whether the variance between sample groups (i.e., the two sites) is greater than the variance within the sample group (i.e., at a single site). In our application, it tests the null hypothesis that the mean value of any given variable (TIC, TA, snow depth, ice thickness) at the polynya site (POLY) is equal to the mean at the thick ice site (TFYI). A p value is generated, which communicates the probability of incorrectly rejecting the null hypothesis due to sampling error. ANOVA is a useful method for relatively small sample sizes (in this case, n∼15) because it is robust against modest departures from normally distributed and homoscedastic sample groups (Burt et al., 2009).
The evolution of sea ice cover during freeze-up was reconstructed from high-resolution (6.25 km resolution) AMSR2 (Advanced Microwave Scanning Radiometer 2) imagery. Daily sea ice concentration data from October to November 2018 were obtained from the Universität Bremen open-access server (Comiso et al., 2003). The imagery was georeferenced and followed the threshold of 10 % sea ice concentration as the boundary between sea ice and open ocean (Spreen et al., 2008).
3.1 Physical and biological conditions at the sites
The polynya site, POLY, experienced considerably higher under-ice currents, with peak velocities an order of magnitude higher (20 to 40 cm s−1 vs. 2 to 4 cm s−1) than outside the polynya, TFYI (Fig. 2 and Table 1). Current velocities at POLY increased throughout the deployment but remained constant at TFYI. The increase in currents at POLY was likely due to a spring tide, but this was difficult to confirm with the Cambridge Bay tidal stage predictions (Fig. S1 in the Supplement) in which amplitudes are low due to the wide geometry of the bay.

Table 1Mean (), standard deviation (σ), and range (max–min) of the measured physical and biological conditions at the two sampling sites. Sample size for snow depth and ice thickness was n=15 except for TFYI ice thickness (n=14). Sample size for Chl a was n=3; therefore standard deviation is not displayed.
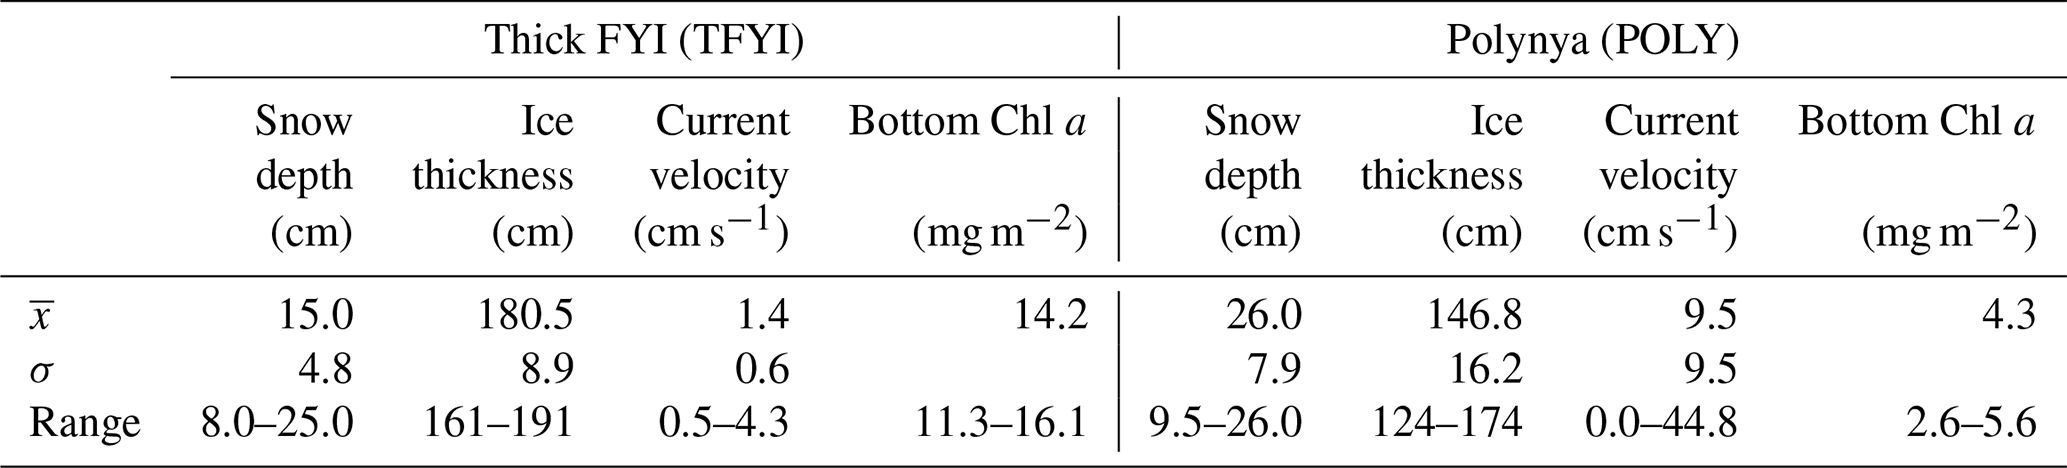
Snow and ice conditions also appeared to be different at the two sites (Table 1) with the mean ice thickness at TFYI about 33 cm (20 %) thicker than at POLY. Conversely, the polynya site experienced deeper snow by an average of 11 cm or about 40 %. Ice temperature profiles (Fig. 3) show that on the first 2 sampling days (4, 7 May) the ice in the polynya was warmer than the thick FYI by about 2 ∘C at most depths. The temperature at both sites increased on the final sampling day – by 2 to 3 ∘C at the surface and 1 to 1.5 ∘C in the middle of the ice – relative to the first sampling day. This observation is consistent with air temperatures recorded at the Environment Canada weather station in Cambridge Bay, which showed daytime highs increasing from −13 to −3 ∘C and nighttime lows increasing from −22 to −13 ∘C (Fig. S2) during the study period. Ice surface temperatures remained below −6 ∘C on all dates (Fig. 2), and we made no visual observations of melt onset in the snowpack.
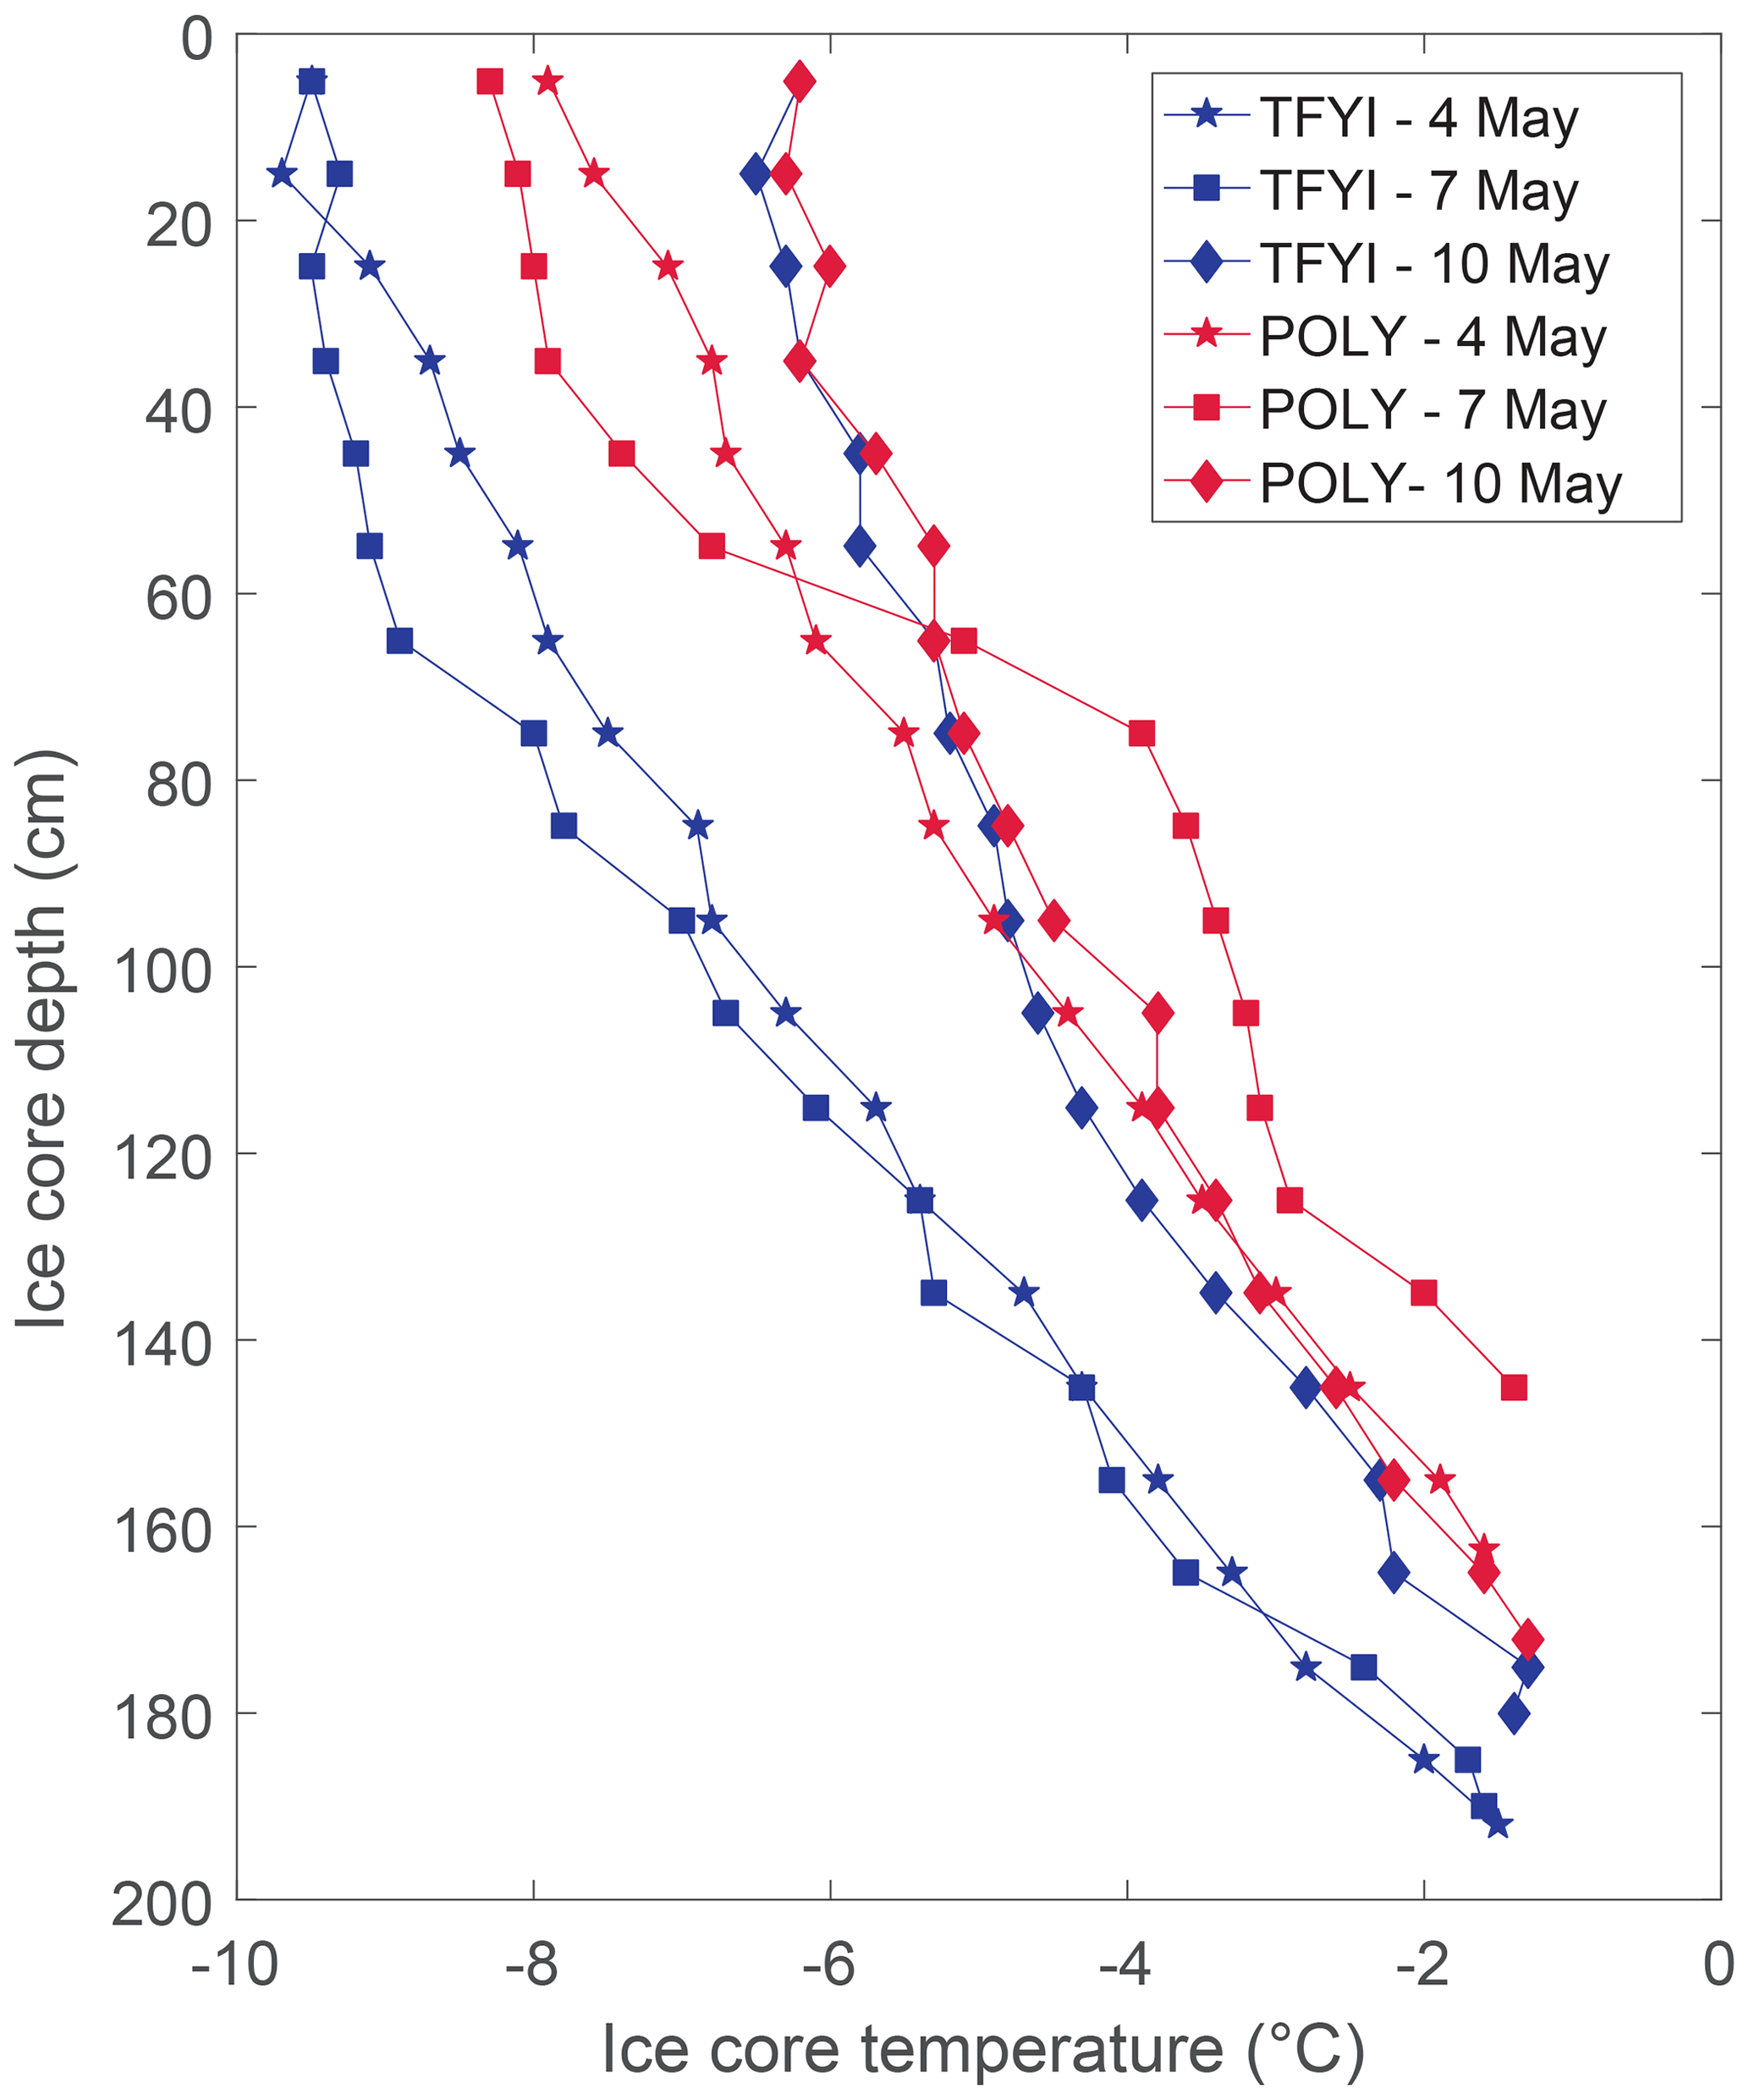
Figure 3Ice temperature profiles at both sites from each of the daily temperature and salinity cores.
In contrast to the results of Dalman et al. (2019), bottom-ice algal biomass was about 3 times higher at TFYI than at POLY (Table 1). Although we did not collect nearly as many ice algal samples compared to other variables, the range and standard deviations reported in Table 1 show consistency between dates. These results match well with our field observations of much higher visible ice algae at the TFYI site on essentially all the cores we extracted.
3.2 Carbonate chemistry at the sites
Results from the high-resolution cores collected on 10 May are shown in Fig. 4. The polynya site was characterized by “c-shaped” profiles for TIC, TA, and salinity, with relatively higher values at the top and bottom of the core compared to the middle. The TFYI site did not have elevated values at the top of the ice but did display an increase in all parameters in the lowest horizon. The profiles show divergence between sites in the upper and lower ice horizons but consistency throughout most of the ice volume.
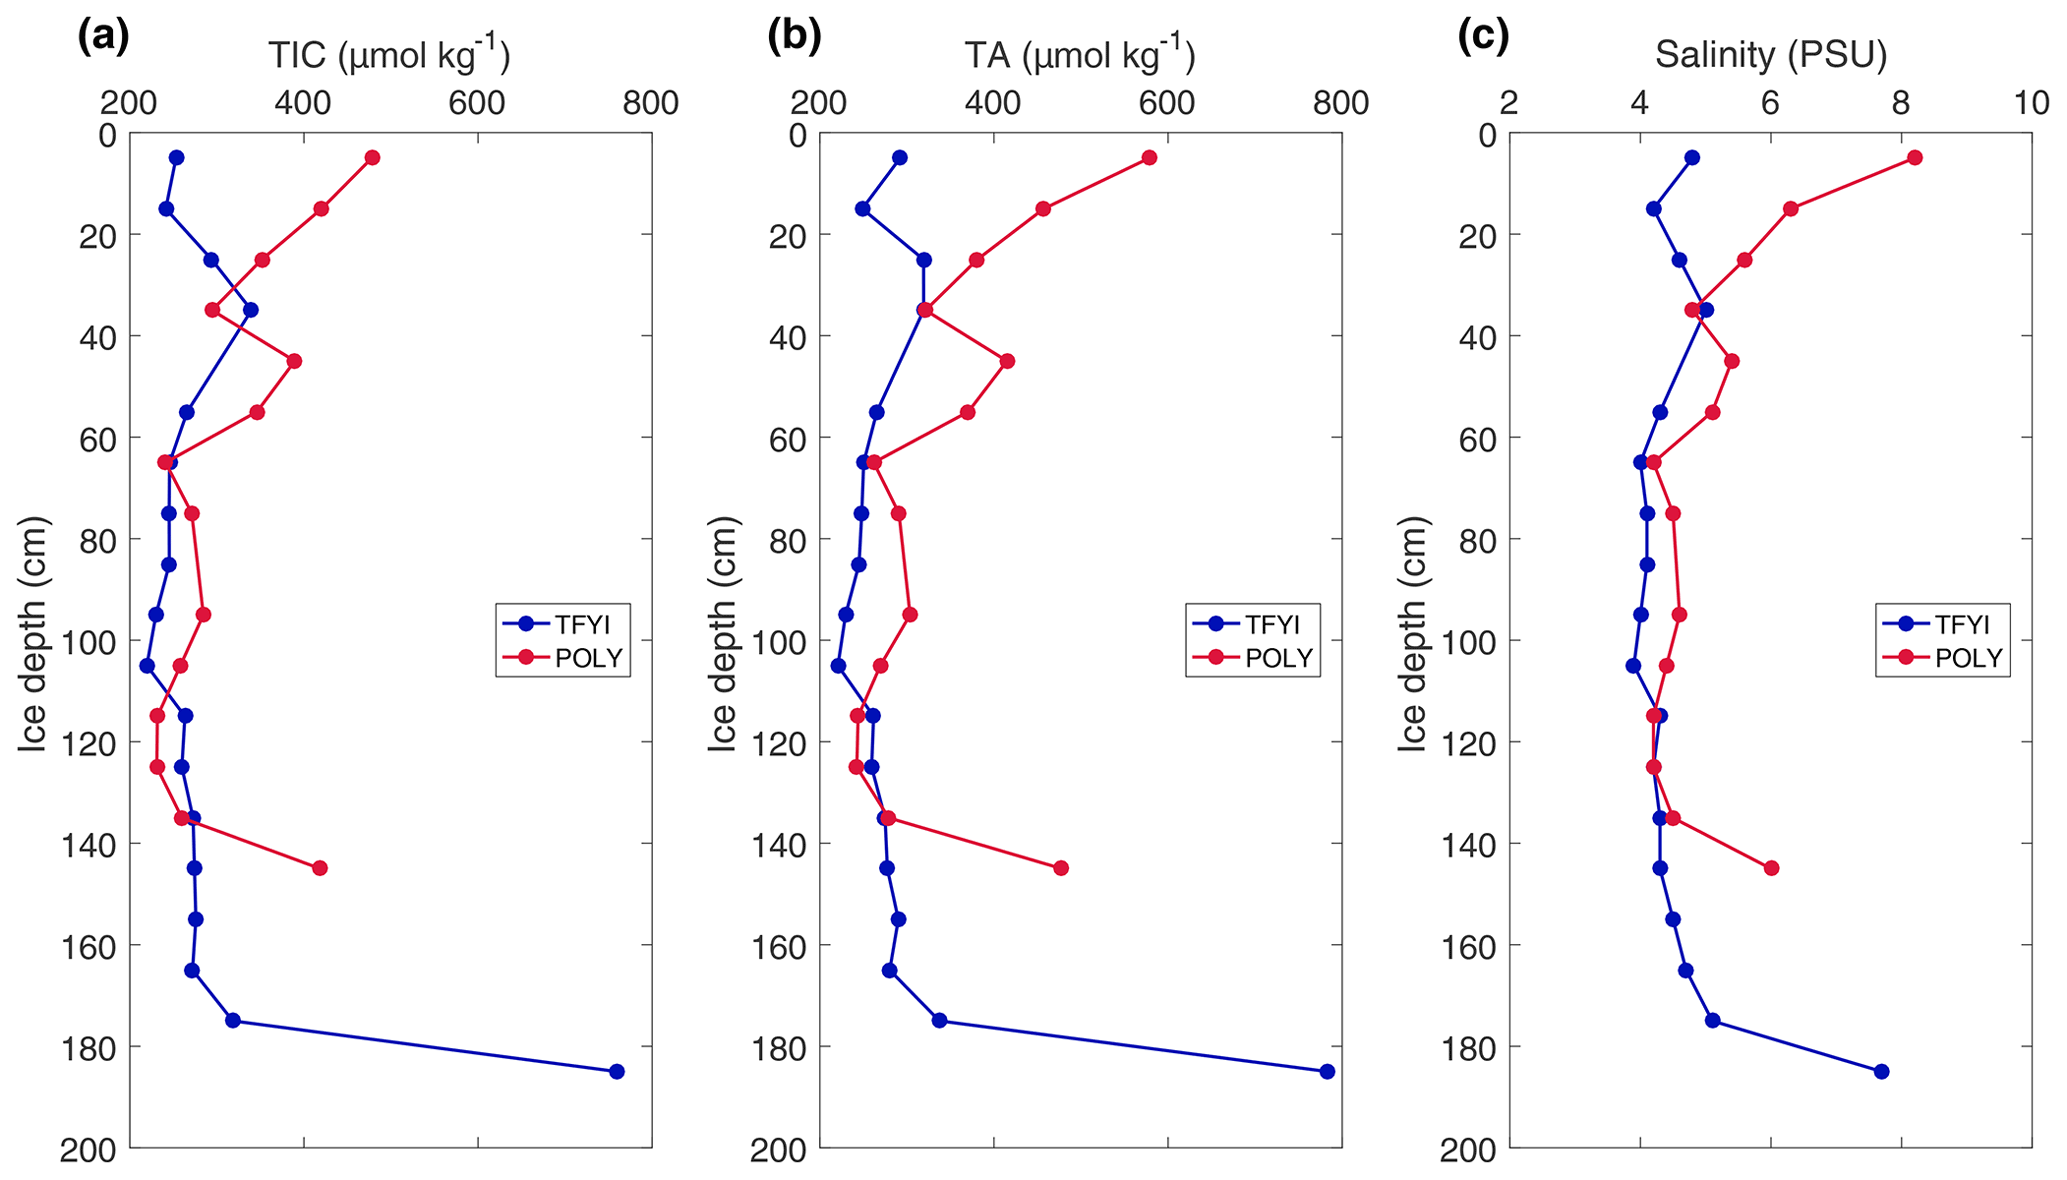
Figure 4TIC (a), TA (b), and salinity (c) results of the high-resolution (10 cm interval) cores collected on the final sampling day.
The results from the statistical sampling approach are shown in Tables 2 and 3, and they confirm the general patterns observed in Fig. 4. In the upper ice horizon TIC, TA, and salinity were significantly higher (by 62, 70, and 1.3 µmol kg−1, respectively) at POLY compared to TFYI. The middle horizon was statistically indistinguishable between the two sites for all three parameters. In the bottom ice horizon, the POLY site experienced significantly lower TIC, TA, and salinity (by 87, 73, and 1.1 µmol kg−1, respectively) than the TFYI site. TA:TIC ratios are also displayed in Tables 2 and 3. These ratios were not statistically different in the top or middle ice horizons but were significantly different in the bottom horizon.
Table 2Summary of biogeochemical variables measured at the two sites across the three horizons. Mean () and standard deviation (σ) are presented. Sample depth is the mid-point of the core sections collected for each horizon. For each horizon, at each site, n=15.
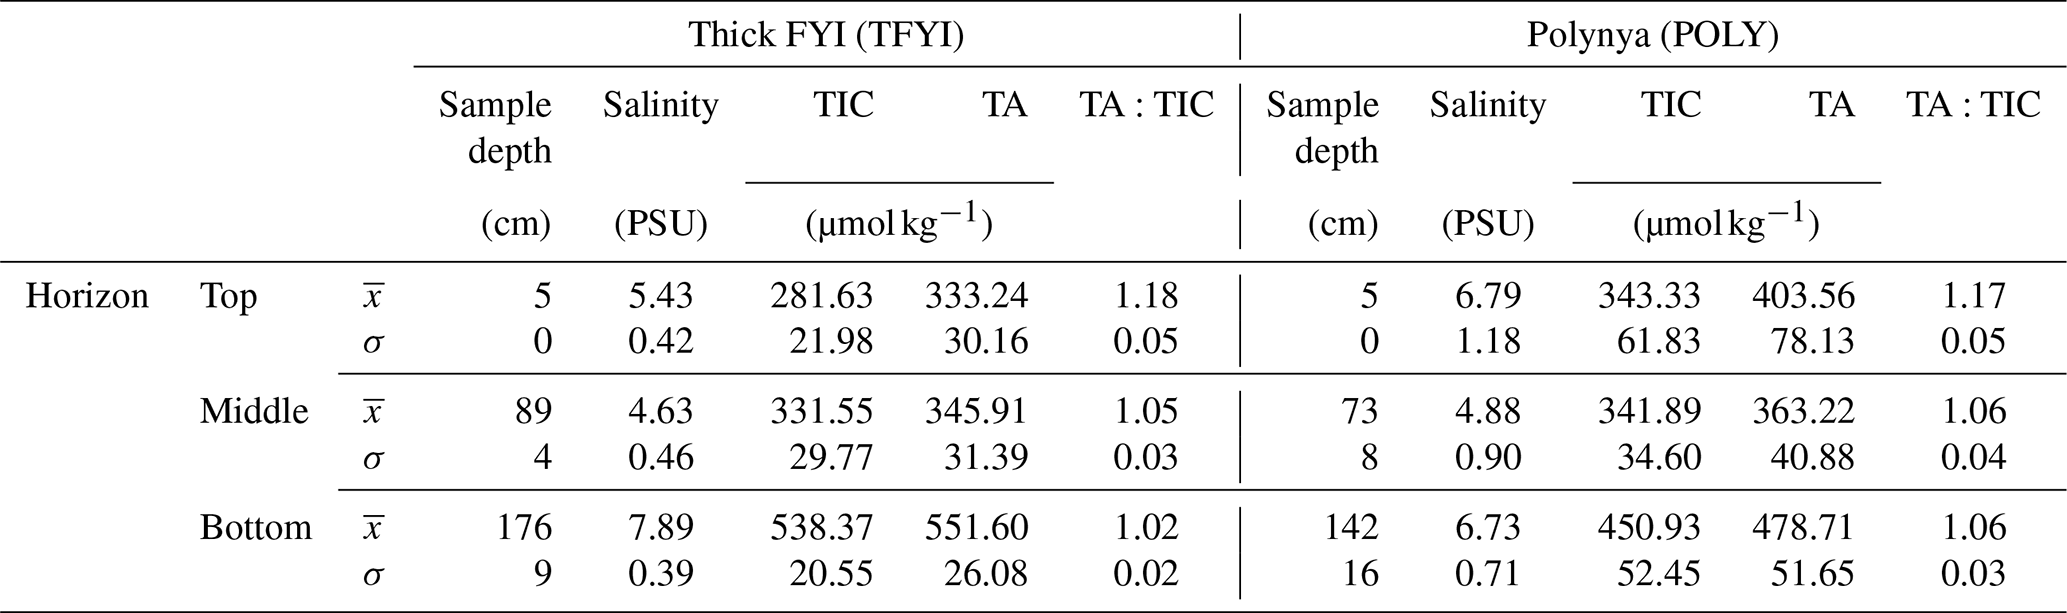
Table 3Results of the ANOVA analysis for parameters measured at the two sites.
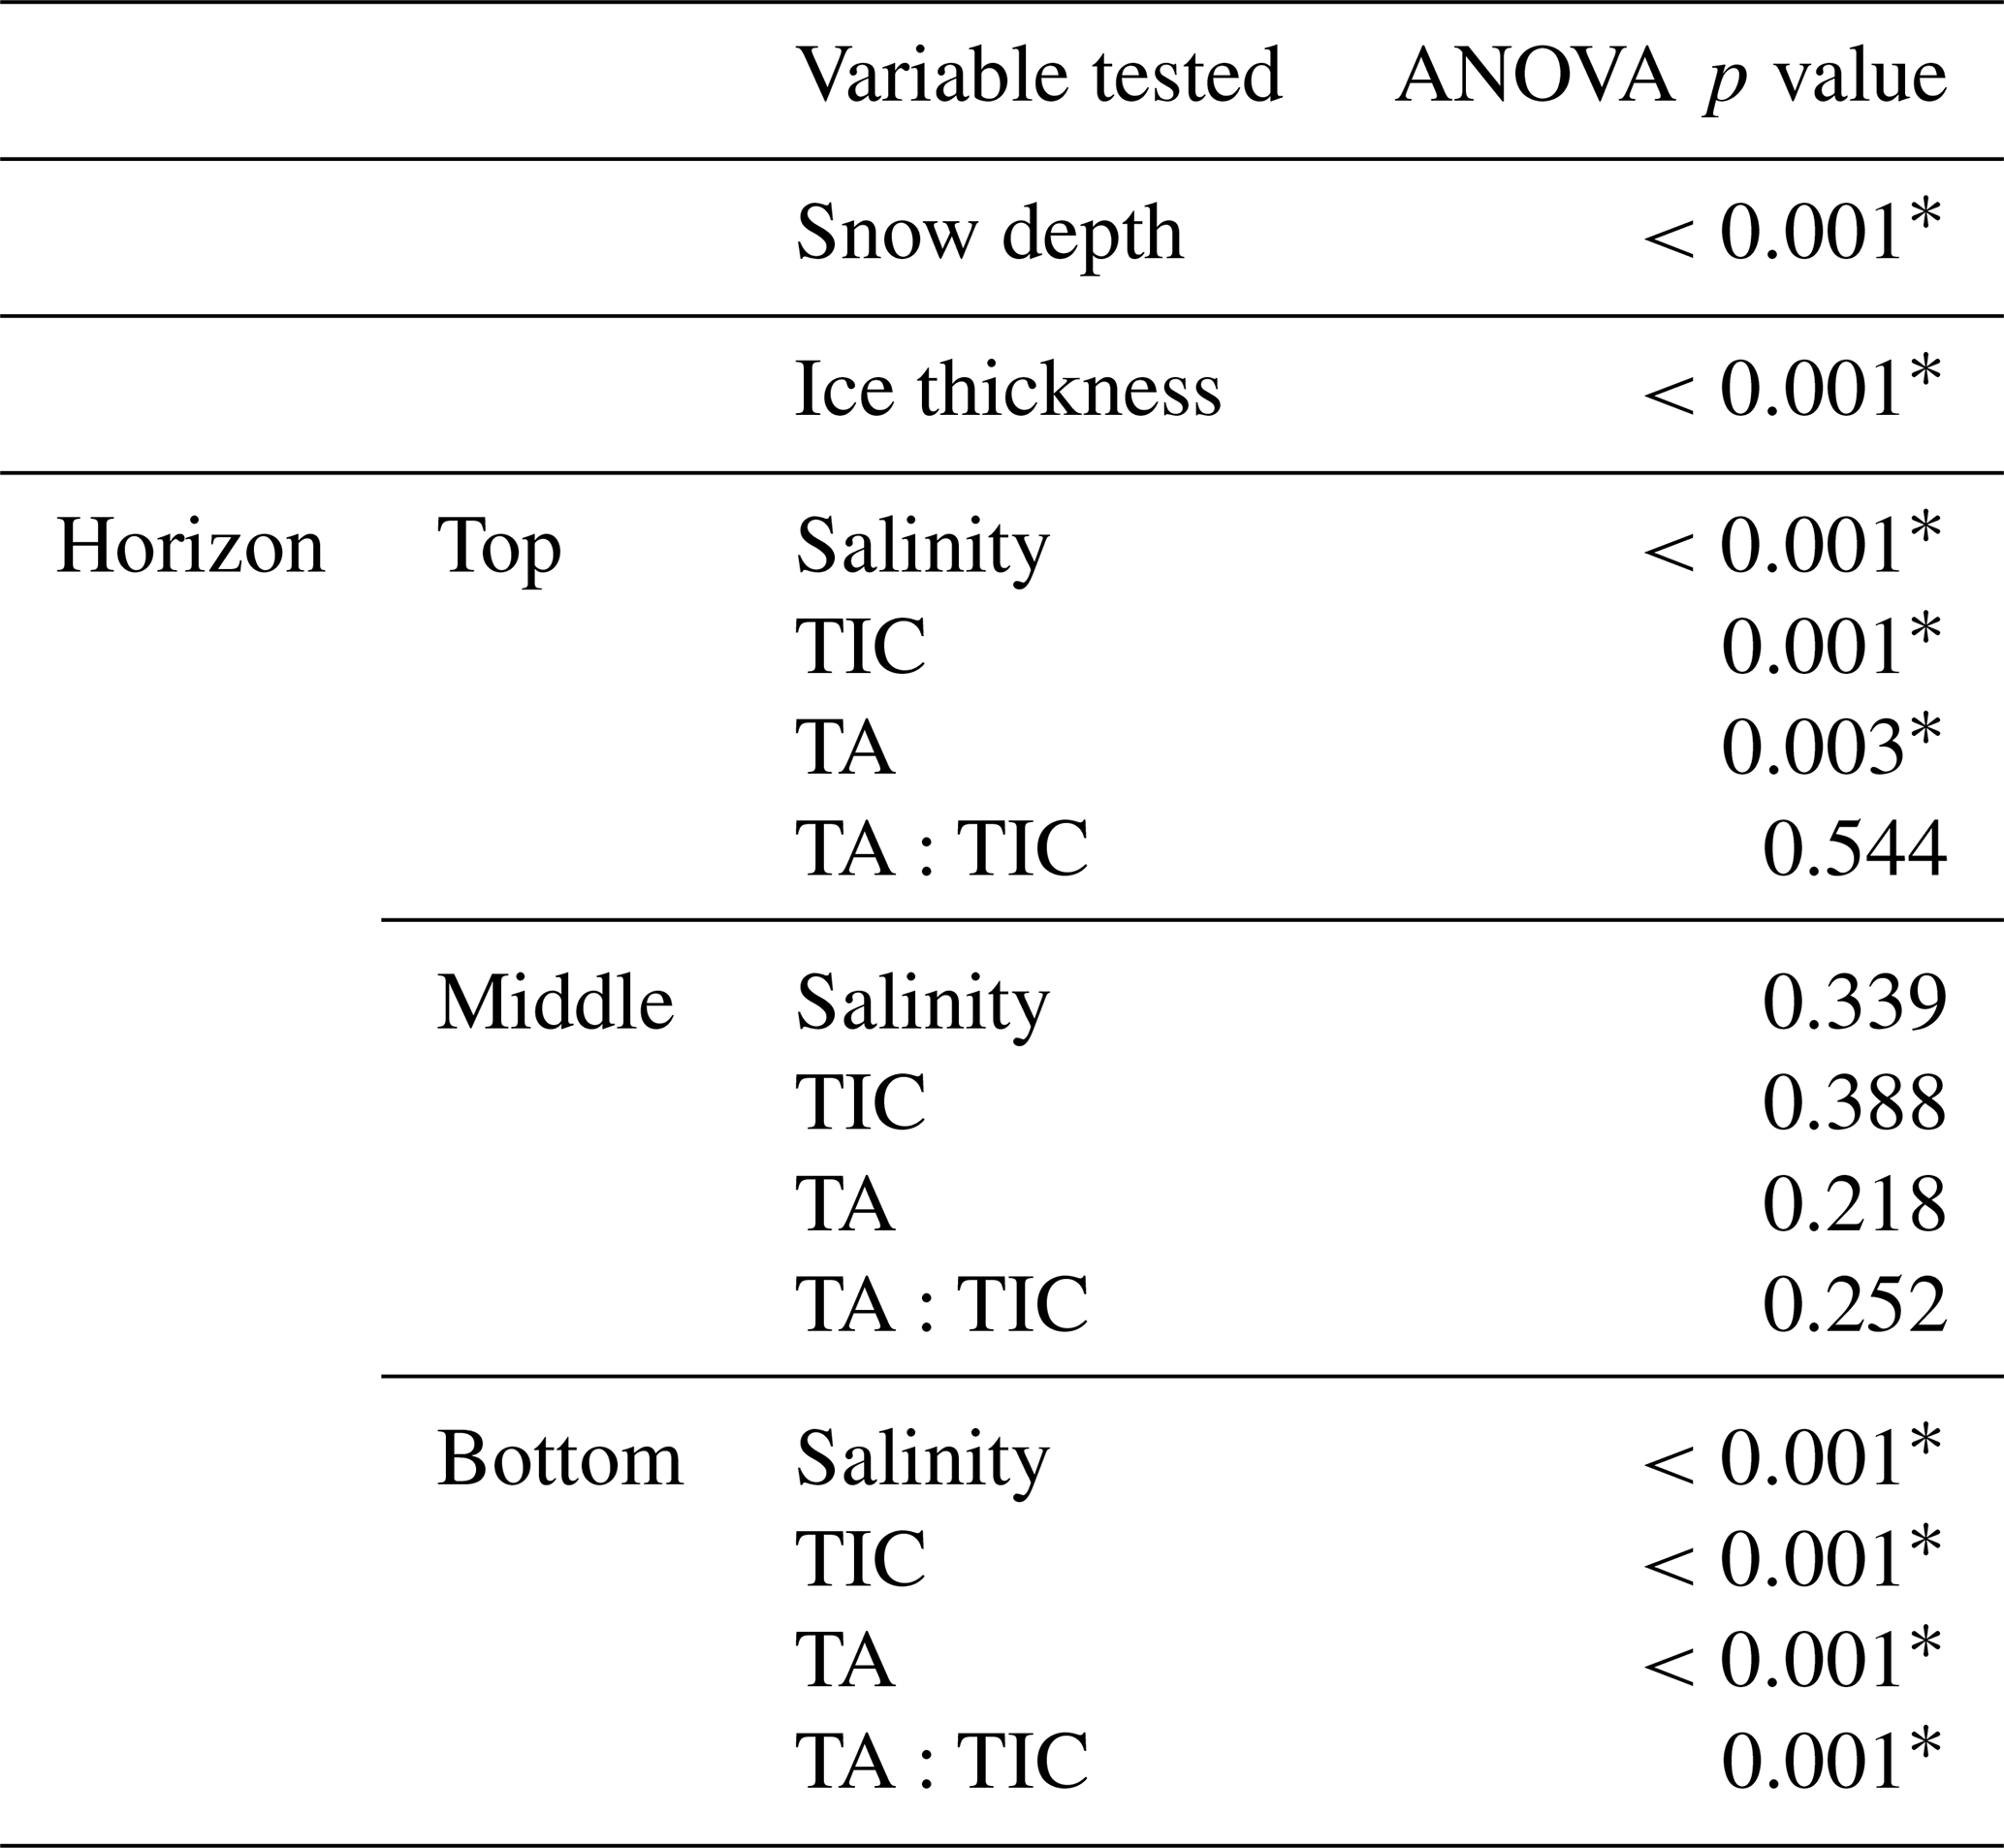
* Cells indicate a statistically significant (p<0.01) difference in the mean value between the two sites.
4.1 Physical and biological differences between sites
Table 3 shows that the polynya site had statistically thinner ice and thicker snow than the non-polynya site. The strong currents we observed are consistent with a polynya formation mechanism related to enhanced ocean heat flux, as detailed in Melling et al. (2015). Melling et al. (2015) also hypothesized deep snow as a potential cause of invisible polynyas but noted that variations in snow depth usually occur over scales too large (i.e., hundreds of kilometres) or too small (snow drifts) to be considered polynyas. For our dataset, we cannot rule out snow depth as a contributing factor to the invisible polynya; however, Dalman et al. (2019) demonstrated ice thickness was significantly different between sites when snow depth was controlled for during site selection. Sea ice thermodynamic models (e.g., Flato and Brown, 1996) predict that maximum ice thickness should vary by about 10 % for the difference in snow accumulation that was observed at the two sites. Such differences are supported by observational studies (e.g., Howell et al., 2016). In our study, the 33 cm (20 %) thinner ice at the polynya site is probably too great to be explained by snow depth alone, but it is not unreasonable to estimate that snow may have been responsible for about half of the difference.
Of course, snow depth is spatially variable over many scales, and the differences we observed between the two sites could have been due to small-scale drifting. However, the long transect conducted on 12 May (Fig. 5) shows a consistent pattern of deeper snow and thin ice in the vicinity of the island to the north (Fig. 1). Local knowledge shared with us by guides is that prevailing winds in this area are from the northeast. It is possible that large-scale drifts form on the downwind side of the island (Fig. 1), contributing to the thinner ice. The timing of ice consolidation is also important as ice that forms earlier in the season has longer to accumulate snow. Maps of sea ice concentration that we acquired for the freeze-up season show that ice at the two sites consolidated at roughly the same time (Fig. 6).
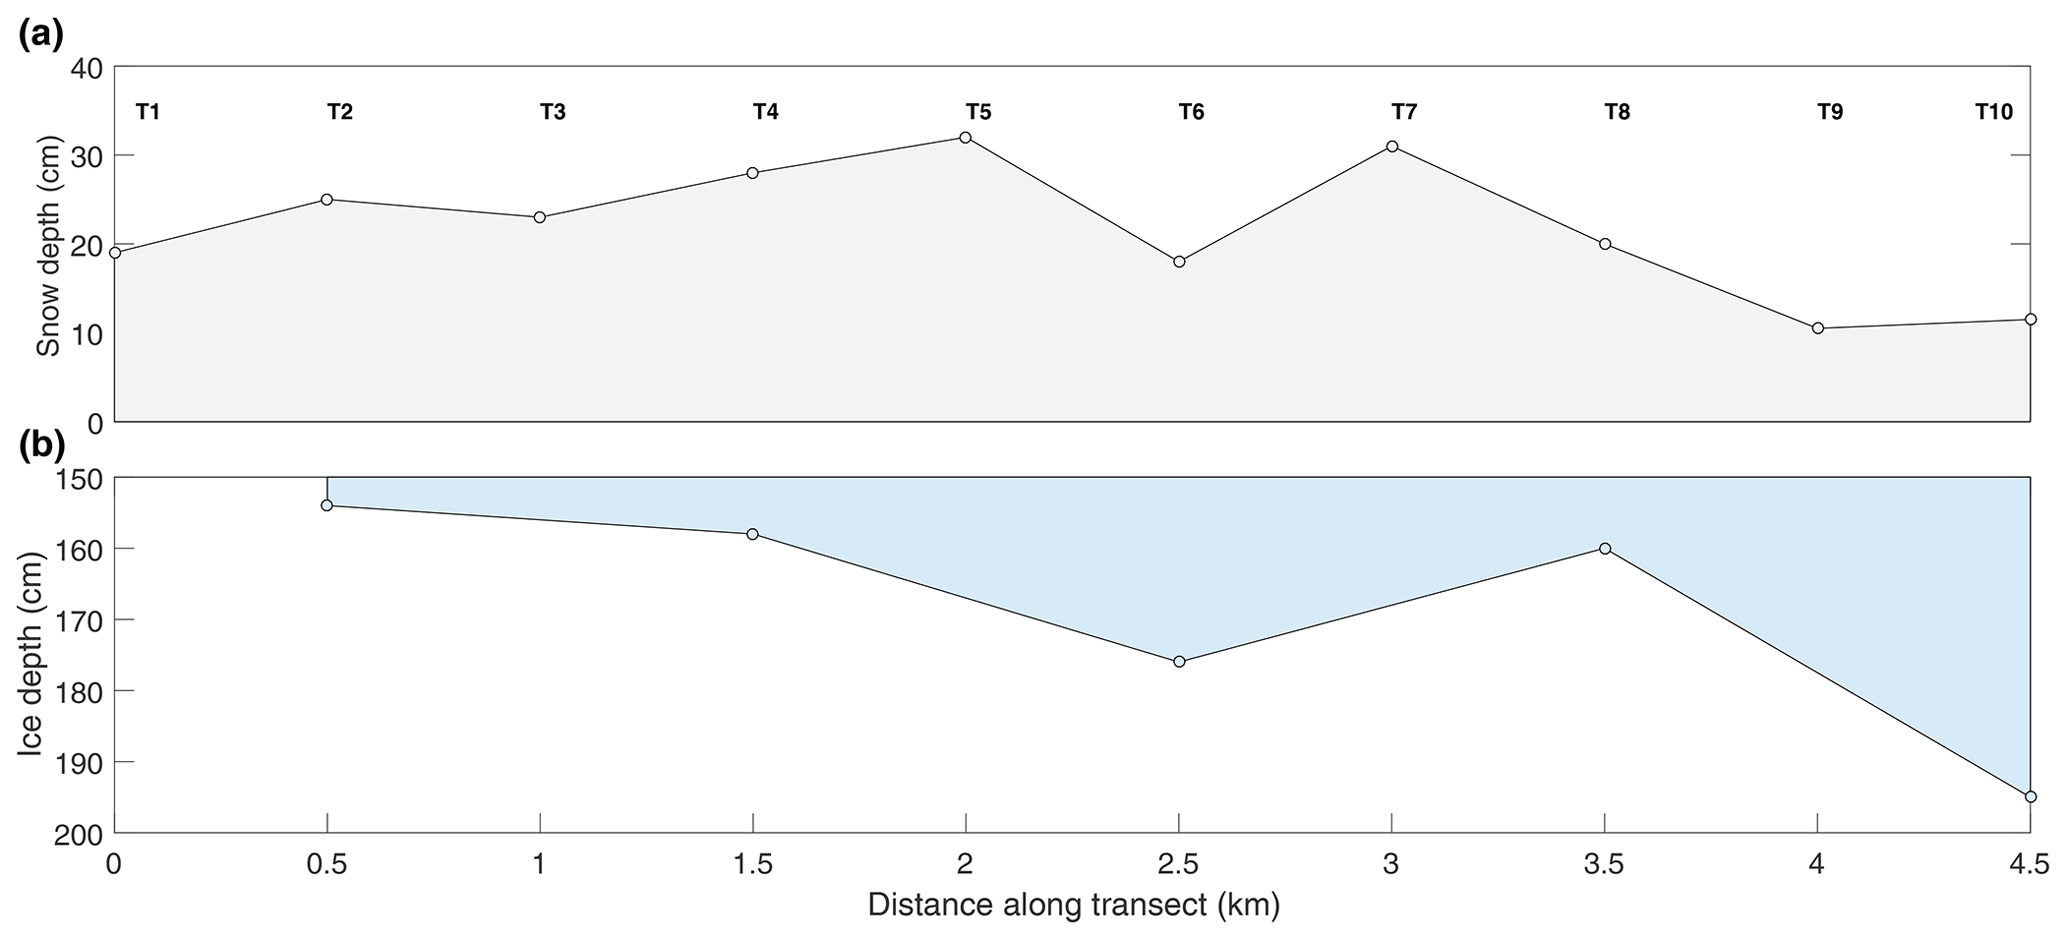
Figure 5Results of the snow depth and ice thickness survey conducted just north of our sampling sites on 12 May.
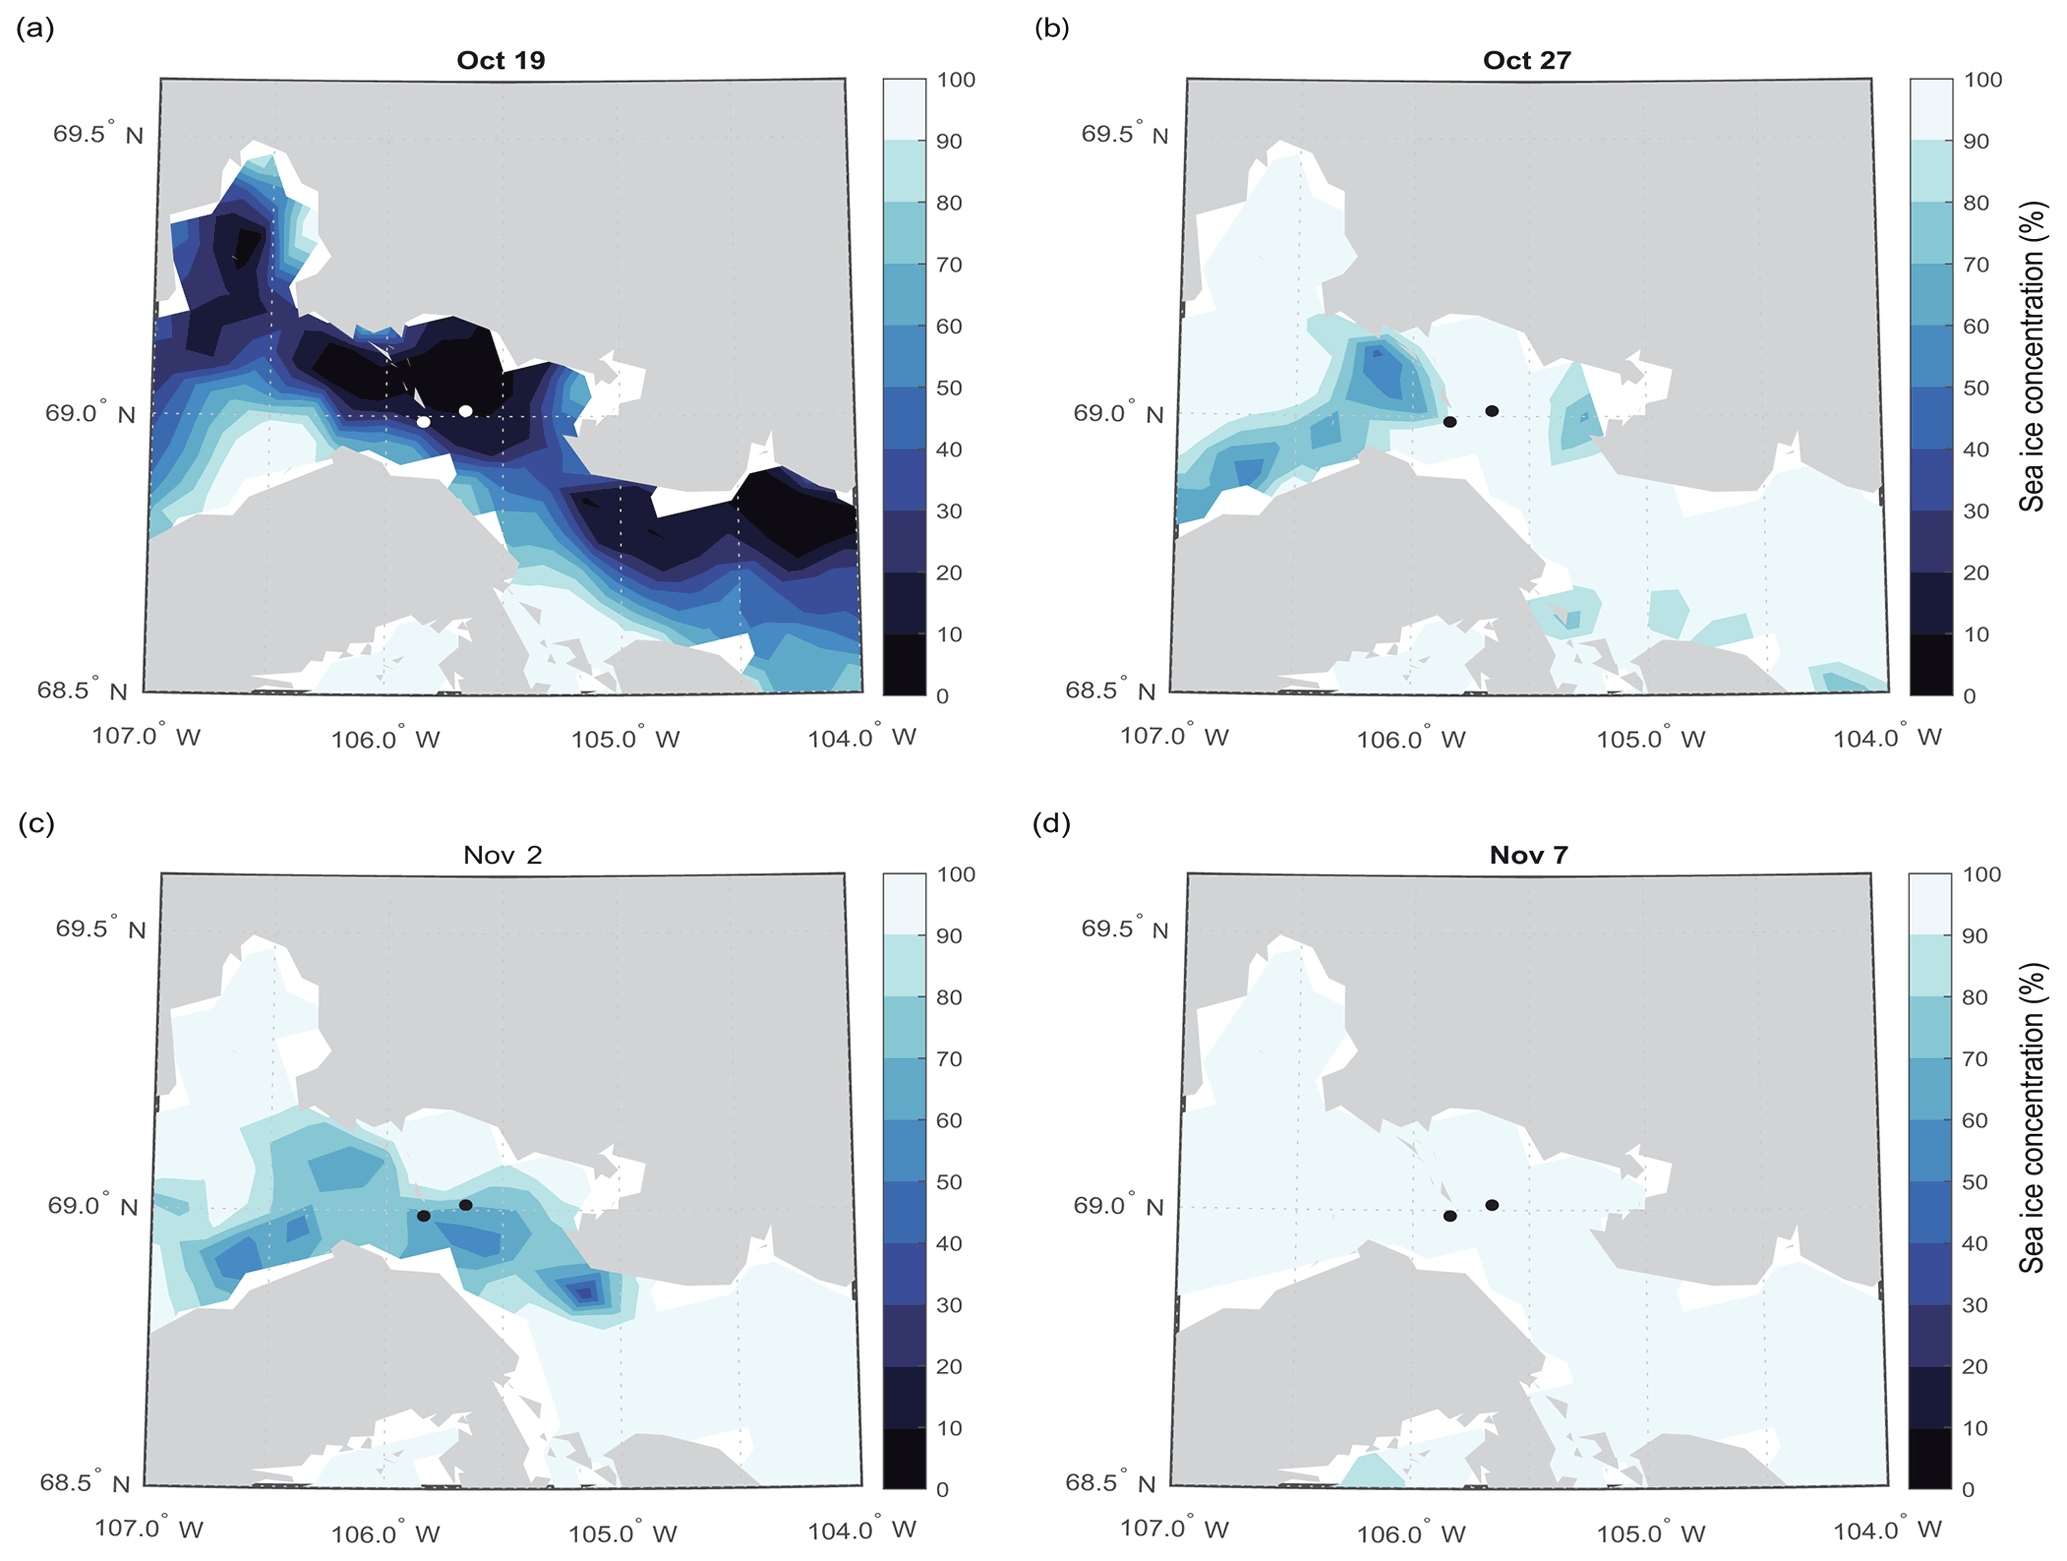
Figure 6Sea ice concentration of the study area during sea ice freeze-up on (a) 19 October, (b) 27 October, (c) 2 November, and (d) 7 November 2018. The sampling sites are noted (see also Fig. 1) with black or white dots depending on contrast.
The distribution of ice algal biomass we observed was different from that reported in Dalman et al. (2019) who reported Chl a biomass averaging 9.3 mg m−2 at the polynya site and 1.4 mg m−2 at the thick ice site (cf. Table 2) with an average snow thickness of 2.8±0.5 cm. Not only did we observe higher bottom-ice Chl a at TFYI relative to POLY, but we also observed higher average biomass there than at any of the sites reported in Dalman et al. (2019). Snow depth is the dominant limiting factor influencing local ice algal distribution in the Arctic during early spring (e.g., Welch and Bergmann, 1989; Mundy et al., 2005; Campbell et al., 2015; Lange et al., 2019), with snow depths >25 cm limiting ice algal accumulation well into the spring season (Leu et al., 2015). Therefore, it is most likely that light limitation under thick snow at the polynya site overshadowed any potential boost in production from current-driven nutrient supply. It is unclear why Dalman et al. (2019) observed lower Chl a biomass under a thinner snow cover in a previous year. Photoacclimation (e.g., Campbell et al., 2015) is one possibility, but with limited data it is difficult to know what the role of interannual variability is on ice algae biomass.
4.2 The upper ice horizon
Significantly higher salinity in the top 10 cm at the polynya site compared to the thick FYI (Table 3) is likely a result of initial ice formation conditions. Typically, higher salinity is associated with faster ice growth rates (Cox and Weeks, 1974). Sea ice in this region began to form around 15 October and did not fully consolidate until 7 November (Fig. 6). Due to the redistribution of drifting ice early in the fall, it is possible the ice that eventually consolidated in the polynya region did experience a different (potentially faster) initial growth rate. However, another explanation is that ice formation at the two sites occurred under different turbulence conditions, with the polynya site experiencing greater turbulence due to strong tidal currents. As reviewed in Weeks (2010), turbulent ice formation conditions promote frazil ice production, while calm conditions favour congelation growth. In an extensive analysis of sea ice texture in the Canadian Arctic, Carnat et al. (2013) found the depth of surface frazil to vary between 0 and 15 cm due to different turbulence regimes. It is possible that the frazil ice layer was thicker at POLY than TFYI, although confirmation would have required thin section analysis. The randomly oriented nature of frazil crystals could act to trap more salts and thus yield higher bulk salinity (as we observed at POLY), but this has not been extensively studied. In a study of Antarctic ice, Eicken (1992) did observe slightly higher salinities in ice cores characterized by frazil ice but not high enough to be considered statistically significant. Another potential cause of differences at the surface between sites is flooding, the process that occurs when relatively thick snow covers depress the ice surface below the freeboard level, allowing seawater to flow over the ice. Flooding is less common in the Arctic than the Antarctic due to relatively thinner snowpacks and thicker ice (Provost et al., 2017), and during our study period we observed positive freeboard at all sites. But given the deeper snowpack at POLY, it is possible that flooding occurred earlier in the season when the ice was still quite thin. As described by Eicken (1992), this would lead to higher surface salinity.
The standard deviation of salinity may be a better indication of ice formation conditions; Weeks and Lee (1962) found the standard deviation of salinity in pancake ice to be greater than 1.0, while congelation ice had a standard deviation greater than 0.3–0.5. Table 2 shows that the standard deviation of salinity we observed was indeed much higher at the polynya site (1.2) than the thick first-year ice site (0.4). Pancake ice typically forms under significant ocean swell, which we would not expect in these narrow coastal passages. However, the general concept that turbulent growth conditions lead to higher variability holds for frazil ice (Weeks, 2010) and provides support for the interpretation that salinity variations between sites in the upper ice horizon was caused by different turbulence regimes. Weeks and Lee (1962) also noted that brine drained much more slowly from pancake ice, which could explain the higher salinity we observed at the polynya site.
At first glance, the statistically higher TIC and TA in surface ice at the polynya site (Table 3) appear to be explainable in the context of bulk salinity and brine rejection. Salinity is a conservative tracer of brine rejection, and if sea ice carbonate chemistry were only impacted by brine rejection, we would expect bulk TIC and TA to be higher when bulk salinity is higher. Hence the observations between the two sites make sense, and the preceding discussion about processes controlling salinity apply to the carbonate system as well: TIC and TA were probably higher in the surface ice at the polynya due to ice formation under different turbulence conditions.
However, more nuances become apparent in Fig. 7, which compares the sea ice carbonate system and salinity measurements to a mixing line between a pure ice endmember (salinity, TIC, TA =0) and our reference seawater endmember (see Sect. 2.2). Figure 7 shows that while the bottom and middle samples collected at both sites follow the mixing line, the top core sections are substantially lower (for both TIC and TA) than the mixing line. The average differences (Δ) between the core samples in the top horizon and the mixing line were µmol kg−1 and µmol kg−1 at POLY and µmol kg−1 and µmol kg−1 at TFYI. This indicates a process (or processes) other than brine rejection that affected TA and TIC at the top of the ice.
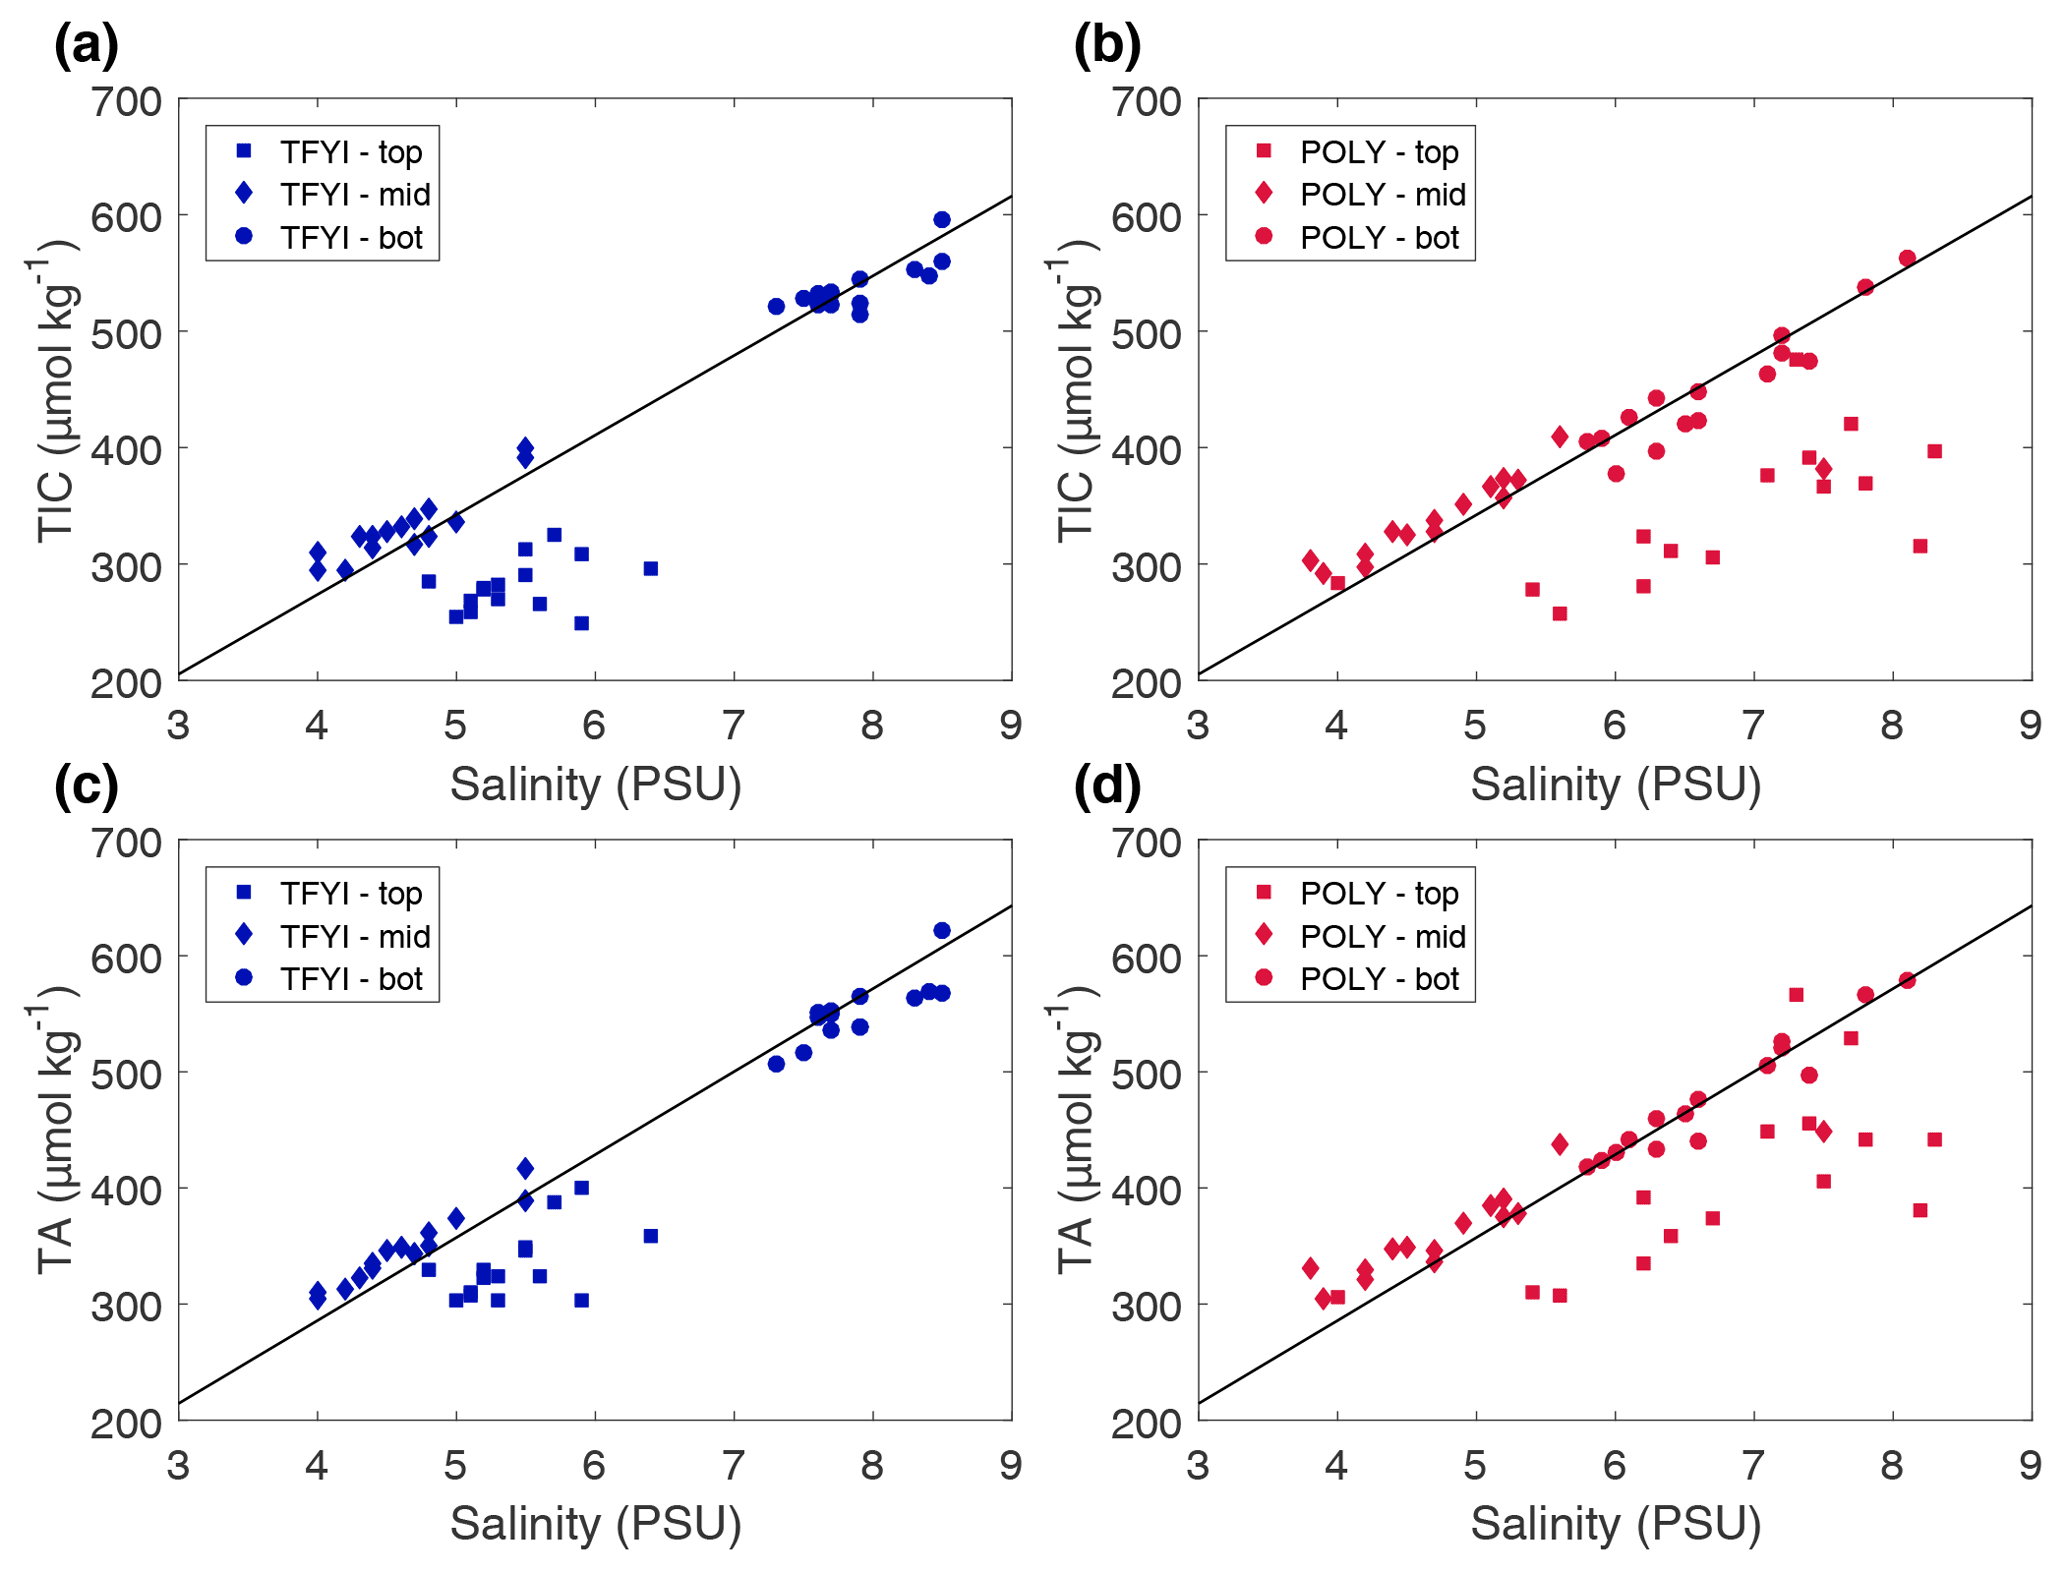
Figure 7Bulk sea ice TIC and TA from the statistical samples (i.e., top, middle, bottom) plotted against bulk salinity for both sites and on all dates. The solid line is the slope of a theoretical mixing line between a pure ice endmember (S, TIC, TA =0) and a source seawater endmember (Sref=28.8, TAref=2058 µmol kg−1, TICref=1970 µmol kg−1).
Calcium carbonate (i.e., ikaite) precipitation lowers both TIC and TA, which can help explain the observed depletions in the surface ice. However, precipitation alone would result in TA being twice as depleted as TIC, and what we observed is the opposite (TIC was depleted at about twice the rate of TA). Gas evasion is a strong candidate for explaining large depletions in TIC and is consistent with past measurements of CO2 off-gassing by sea ice (e.g., Nomura et al., 2006, 2010) and observations of TIC loss in the surface layer of bulk ice samples (Miller et al., 2011a). The larger reduction in TIC at the polynya site suggests that ice texture (e.g., frazil vs. congelation ice) may have an impact on CO2 release potential, but to our knowledge this has not been investigated in any detail in past studies. It is still possible that ikaite formation occurred in these upper layers and is the most logical explanation for depleted TA relative to the mixing line. For ikaite production to cause a depletion in bulk sea ice TA the crystals must not have been retained in the ice matrix, being instead transported to lower ice horizons or the underlying ocean during the rapid brine drainage that occurs in new ice (Vancoppenolle et al., 2006).
4.3 The middle ice horizon
Observations and modelling studies have emphasized a strong relationship between ice growth rate and bulk salinity (e.g., Cox and Week, 1975; Vancoppenolle et al., 2006). Rapidly growing ice tends to trap more brine, resulting in higher bulk salinity. We therefore anticipated lower salinity and perhaps lower TA and TIC in the polynya ice where enhanced ocean heat flux (and thicker snow cover) reduced the ice growth rate. Furthermore, Feltham et al. (2002) proposed that strong under-ice currents might enhance brine drainage by inducing pressure variations at the ocean–ice interface, in which case salinity at the polynya site might be even lower. Table 3 shows that our expectations were not met, with no statistical difference in salinity, TA, or TIC observed in the middle horizons. Figure 7 shows that the carbonate species closely followed the conservative mixing line in the middle ice horizon and that salinity at both sites fell within a well-defined band of approximately 4–5.5. Due to the strength of this salinity relationship and the similar salinity between sites, we did not observe a significant difference in carbonate system parameters.
Salinity (and hence TA and TIC) may have been similar because the growth rates are not so dramatically different between sites for this portion of the ice volume. Much of the observational and modelling work relating salinity to ice growth rates has focused on resolving the C-shaped profile of sea ice (e.g., Fig. 4c), which reflects high brine retention during fast initial ice growth (creating higher salinity in the top horizon than the middle horizon), followed by brine drainage (creating lower salinity in the middle horizons compared to the bottom horizon). Under typical Arctic conditions, the top 20 cm of sea ice can grow in approximately 15 d, for a growth rate of 1.3 cm d−1 (e.g., Nakawo and Sinha, 1981). If we assume sea ice formed in the study area around 15 October (Fig. 6) and the first 20 cm grew by 30 October, that would imply an average “middle-horizon” growth rate of about 0.6 cm d−1 for the polynya site and 0.7 cm d−1 for the thick FYI site from the end of October to the sampling date. We hypothesize that large differences in initial growth rates compared to later winter growth rates are enough to produce significant vertical variations in salinity, but the small differences in growth rates between the two sites were not enough to produce noticeable differences in salinity, nor in TIC or TA.
4.4 The bottom ice horizon
Past studies have shown low TIC in the bottom sections of bulk ice melts (Brown et al., 2015) and in brine collected from lower ice horizons (Brown et al., 2015; Delille et al., 2007) in spring sea ice. These lower values are typically attributed to biological drawdown caused by the bottom-ice algal bloom. In our results, we saw significantly higher TIC and TA (Table 3) at the site with higher Chl a (TFYI, Table 1). This counterintuitive result is explained again by salinity: TFYI had significantly higher salinity than POLY at the bottom (Tables 2, 3), and Fig. 7 shows that the bottom ice horizons largely followed the conservative mixing line. It is interesting to note that lower salinity at the site with high current velocity follows the Feltham et al. (2002) prediction that strong under-ice currents drive easier replacement of high-salinity brine with (relatively) lower-salinity seawater. But as noted previously, this is not reflected in the middle ice horizon. Notz and Worster (2009) found that the majority of salt is lost from sea ice through gravity drainage and not at the growing front. Once out of direct contact with the seawater, variables other than current velocity (e.g., thickness, temperature gradient, and brine salinity) may determine salinity (Notz and Worster, 2009). If these factors are relatively consistent between sites, we would expect salinity (and hence TIC and TA) to also be similar. Nevertheless, it is clear that physical processes (brine rejection) and not biological processes (i.e., the ice algae bloom) were most responsible for carbonate system differences between the two sites in the bottom layer.
To further check for the impact of primary production on the bottom ice horizon (and any of the other horizons) we normalized TIC and TA values to the estimated seawater endmember salinity (Sref=29) using , where nX is the normalized parameter (TIC or TA), Xmeas is the bulk ice measurement, and Smeas is the measured bulk salinity. This is the appropriate normalization equation for a system where the S=0 endmember is expected to have a TA and TIC equal to 0 µmol kg−1 (Friis et al., 2003), which is the case for pure ice. If primary production were significantly affecting any of the ice horizons, we would expect points on a graph of nTA (normalized bulk TA) vs. nTIC (normalized bulk TIC) (Fig. 8) to fall along the photosynthesis/respiration line. Although statistically significant linear trends (p<0.01) are apparent at both sites and in all horizons, they do not follow the photosynthesis line, even in the bottom ice horizon (Table 4). The slopes that we observed of nTA vs. nTIC all fell within the range of 0.50–1.03, with an overall slope of 0.65 at TFYI and 0.81 at POLY (Fig. 8). In their study of landfast sea ice in the Canadian Arctic Archipelago (Franklin Bay), Miller et al. (2011a) did see a few samples from May that fell along a photosynthesis line, but most followed a very similar slope to the ones presented in Fig. 8.
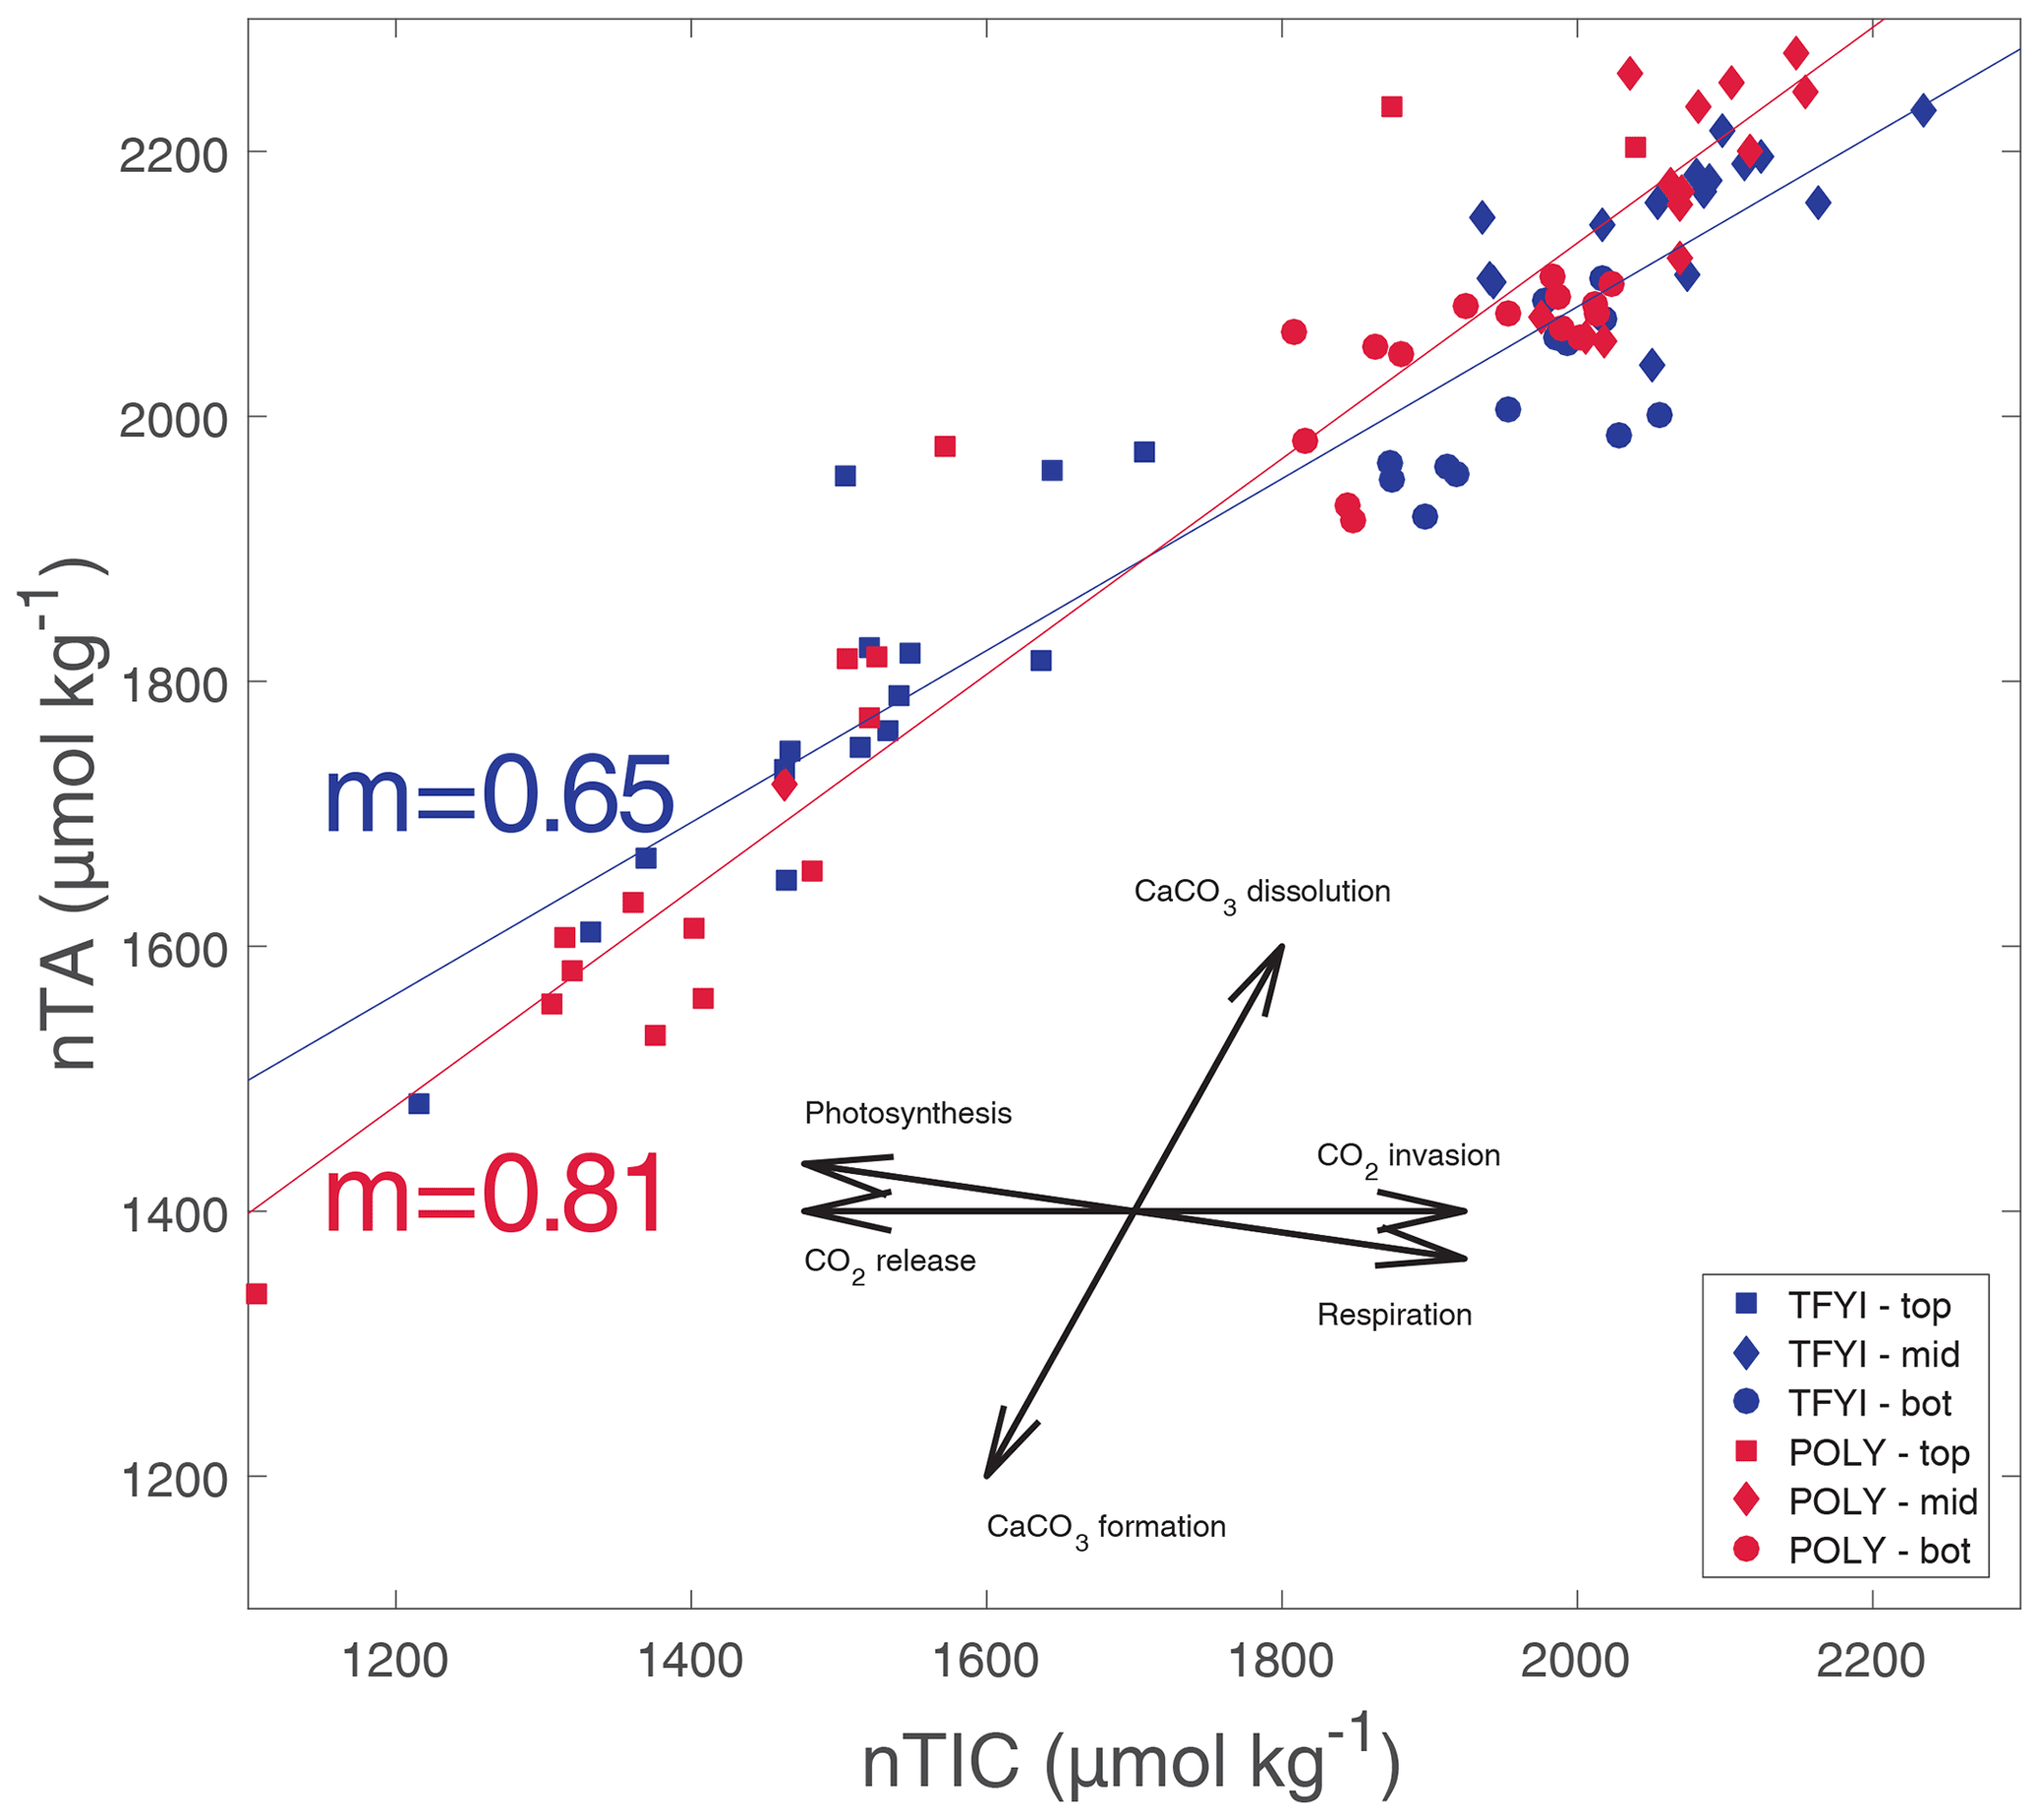
Figure 8Normalized bulk TIC (nTIC) plotted against normalized bulk TA (nTA). Solid lines are the regression relationship for all TFYI statistical samples (slope noted with blue text) and for all POLY statistical samples (slope noted with red text). The rosette diagram shows the theoretical slopes that would occur if only one process was occurring: photosynthesis/respiration (nTA/nDIC ; nDIC signifies normalized dissolved inorganic carbon), CaCO3 dissolution/formation (nTA/nDIC ), and gas exchange (nTA/nDIC ).
Table 4Slope values of nTA/nDIC (i.e., Fig. 8) for each of the horizons at each site and for all samples at each site. Also reported is the r2 value for each regression line, as well as the p value testing the significance of each slope.
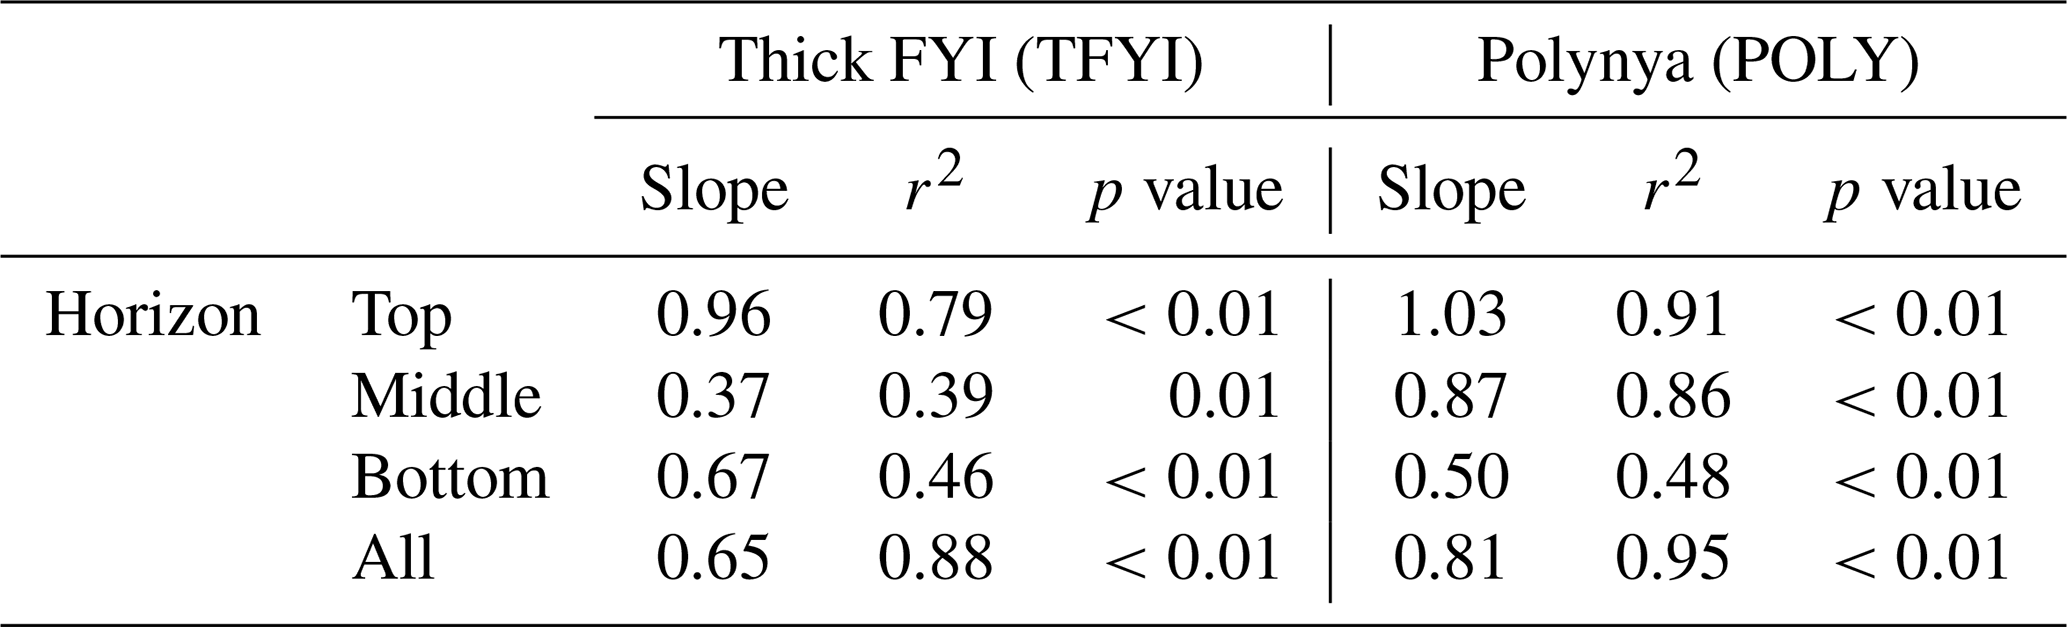
It may, however, be more instructive to consider the slope of the bottom horizon alone (Table 4), as the overall slopes are biased by the high number of samples collected at the surface and bottom despite representing only a small portion of the overall ice volume. In the bottom horizon, we do see lower slope values (0.67 at TFYI, 0.50 at POLY), suggesting a shift towards the net respiration line, consistent with past studies that have found net heterotrophy in ice algae communities during the bloom (Campbell et al., 2017, 2022; Rysgaard and Glud, 2004). In the 2014 spring, Campbell et al. (2017) observed net heterotrophic conditions in the bottom ice of Dease Strait during a period of carbon accumulation before switching to autotrophic conditions around 8 May. In a study near Resolute Bay, Brown et al. (2015) found substantial TIC drawdown near the beginning of an ice algae bloom, but that region experiences bottom-ice Chl a values about 10 times higher than either of our sites (Leu et al., 2015). It is possible that the rate of ice algal production in Dease Strait is simply too low to have a noticeable impact on carbonate chemistry or that primary production at our site was balanced or exceeded by respiration, highlighting that sea ice algae communities may have a complex role in carbon cycling in sea ice.
4.5 Implications for understanding ikaite in sea ice
The carbonate chemistry of sea ice has garnered significant attention due to questions surrounding ikaite precipitation and dissolution. Our preceding analysis of the three ice horizons only invoked ikaite precipitation to explain patterns observed in the top horizon, where it seemed a secondary process to gas exchange. So, is ikaite precipitation apparent (or important) in our samples?
The primary evidence presented by Rysgaard et al. (2007, 2009) to support the hypothesis of ikaite precipitation was the observation of TA:TIC ratios greater than 1:1 and approaching 2:1 in some samples. The only relatively high TA:TIC ratios that we observed were in the upper ice horizon (Table 2), which other studies (Miller et al., 2011a; Geilfus et al., 2013) have observed and attributed primarily to outgassing from the ice surface. But average TA:TIC ratios in our samples were close to 1.05 in the bottom and middle ice horizons (Table 1) and not meaningfully different from our estimate of the source seawater TA:TIC ratio (1.04). While the original formulation of the sea ice pump hypothesis (Rysgaard et al., 2007) reported bulk TA:TIC ratios approaching 2:1, the majority of studies since have reported values close to 1:1 below the surface ice layers (Miller et al., 2011a, b; Geilfus et al., 2012; Brown et al., 2015; Findlay et al., 2015).
Of course, the TA:TIC ratio is not the only available evidence of ikaite precipitation in sea ice. There is microscopic evidence (e.g., Rysgaard et al., 2013), and crystals extracted from sea ice have been positively identified by X-ray diffraction (Dieckmann et al., 2008). We did not have access to such techniques, but Fig. 8 provides evidence that ikaite precipitation did occur in our study. At both sites, linear relationships between nTIC and nTA with slopes between 0.5 and 1.0 (Table 4) were observed through all horizons. These slopes are similar to those observed by Miller et al. (2011a), who hypothesized that such a relationship is the result of combined ikaite precipitation and respiration in the ice. Similar slope values were observed by Geilfus et al. (2012) and Brown et al. (2015) in brine. The differences we observed in slopes between horizons are likely the result of specific processes occurring near the surface (i.e., outgassing, see Sect. 4.2) and the bottom (net respiration, see Sect. 4.4) but with a strong tendency towards the carbonate precipitation/dissolution line in all horizons. Therefore, ikaite precipitation certainly seems to be occurring in our study area; our contention is simply that at this location (and apparently at several others) the amount of ikaite precipitation is not enough to result in a large fractionation of TA and TIC within the sea ice, or perhaps more precisely, ikaite crystals are lost to the underlying seawater at a similar rate to brine rejection.
The well-known spatial heterogeneity of sea ice has often been invoked to explain differences between studies, including differences in the TA:TIC ratio (compare, for example, Rysgaard et al., 2007, and Miller et al., 2011a). Due to the scale of brine channels and the size of the standard core barrel, it is not uncommon for two ice cores sampled essentially side by side to produce remarkably different results for any biogeochemical variable (Miller et al., 2015). To our knowledge, the present study is the first attempt to employ a statistical sampling approach to compare sea ice carbonate chemistry between two sites. What our results show is that despite large differences in the physical and biological characteristics between two locations, when small-scale heterogeneity is accounted for by averaging, the results can be surprisingly similar. Table 5 shows that when a weighted vertical average of the two sites is calculated, the carbonate chemistry (particularly the TA:TIC ratio) is not meaningfully different; the statistically significant differences in the thin top and bottom layers are outweighed by the thick middle layer. Our study, designed to examine extremes in spatial variability, suggests that we should perhaps be looking at other factors (perhaps methodologies) to explain divergent reports of sea ice carbonate chemistry.
Table 5Vertically weighted average TIC and TA for the two sites. Weighting calculated attributing top and bottom horizon values (Table 2) to the surface and bottom 10 cm of ice and the middle-horizon values to the mean ice thickness subtracting the 20 cm accounted for by the top and bottom measurements.
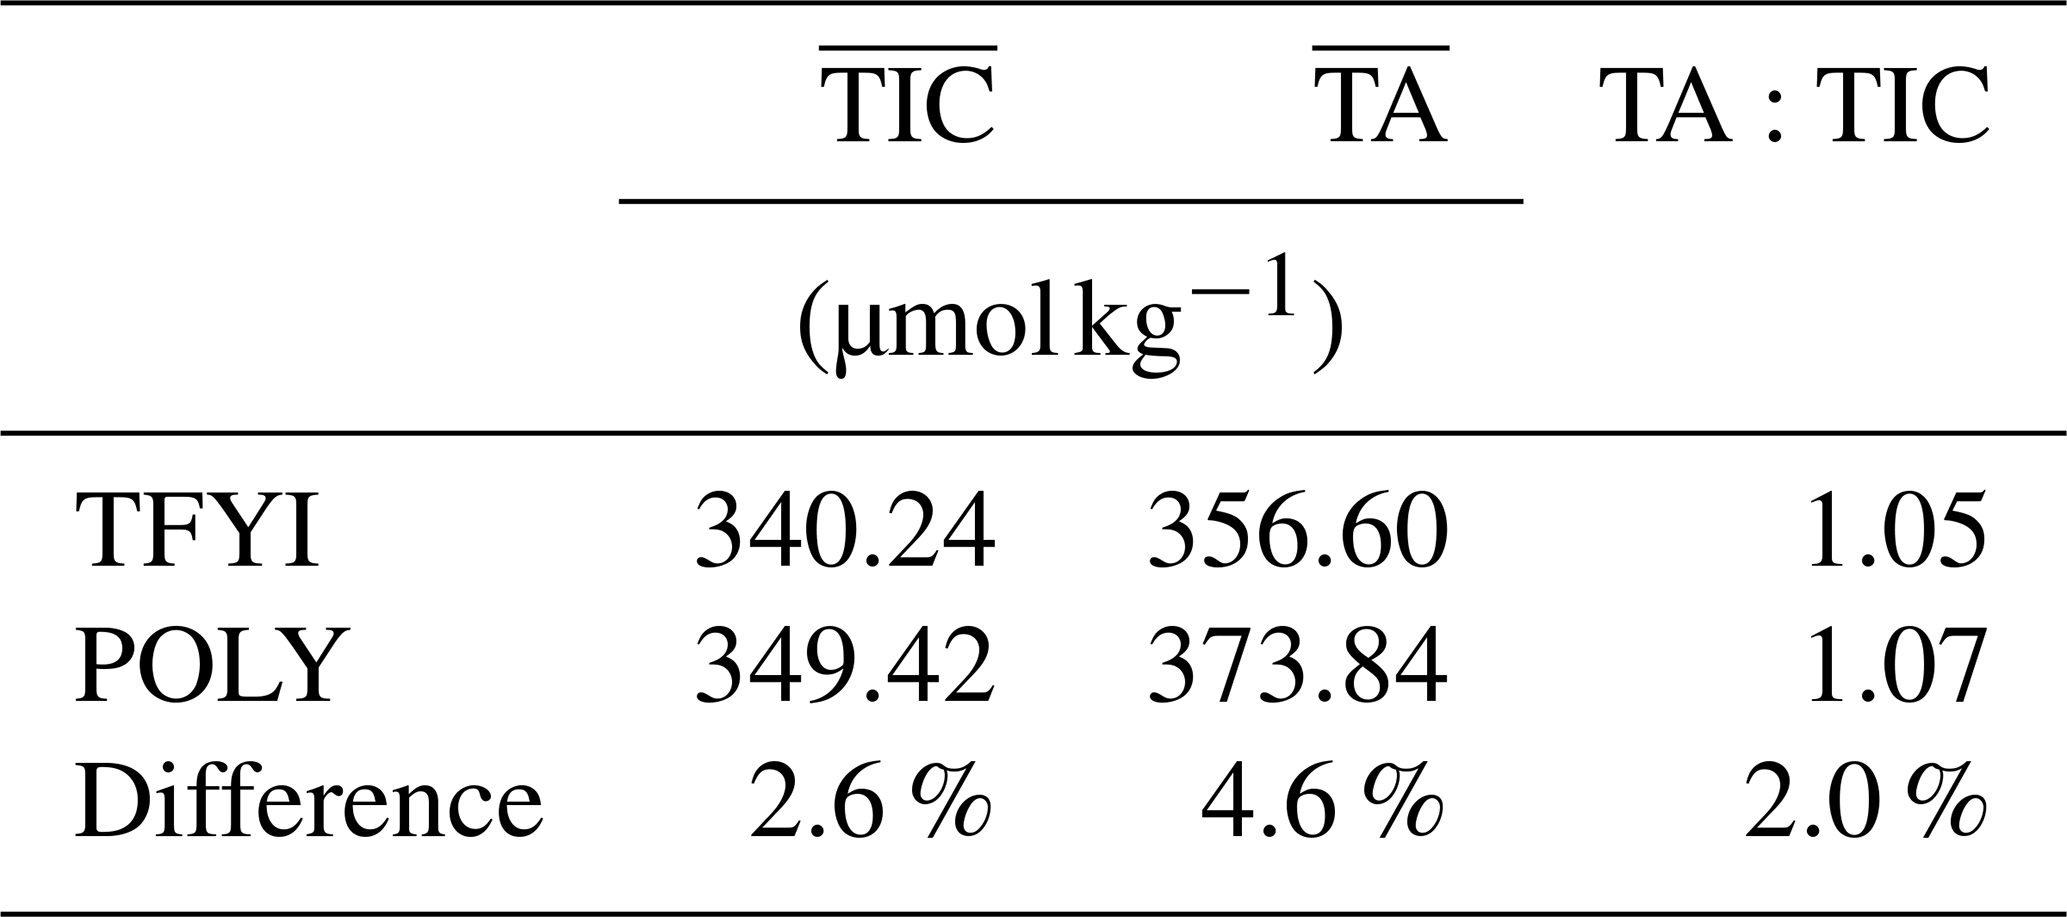
Setting aside the TA:TIC ratio, the actual values of bulk ice TIC and TA (Table 5) that we observed are fairly consistent with other measurements from the Canadian Arctic Archipelago. Rysgaard et al. (2009), Miller et al. (2011a), Findlay et al. (2015), and Brown et al. (2015) all report values between ∼ 300 and 400 µmol kg−1 for TA and 350 and 450 µmol kg−1 for TIC. Higher values (up to ∼700 µmol kg−1 for both TIC and TA) have been reported in deep Arctic basins and around Greenland (Rysgaard et al., 2009). Salinity and hence carbonate species concentrations tend to be lower in the Canadian Arctic Archipelago due to the large volume of river run-off that impacts the region. It is therefore likely that the source water from which sea ice grows plays a significant role in winter sea ice carbonate concentrations.
We contrasted the bulk sea ice carbonate chemistry of an invisible polynya site (strong currents, thin ice, thick snow, lower algal Chl a) with a nearby site outside of the polynya (weak currents, thick ice, thin snow, higher algal Chl a). Statistically significant differences in chemistry were noted between the two locations but only in thin surface and bottom layers. The middle ice horizons – which represent about 85 % of the ice volume – had statistically indistinguishable salinity, TIC, and TA concentrations. The observation that two sites with such different physical and biological characteristics could yield such similar carbonate system chemistries suggests that processes known to modify the sea ice carbonate system are either less impactful or less variable than expected. While our results do show evidence of some combination of gas evasion, respiration, and ikaite precipitation impacting chemistry, these processes were dominated by brine drainage processes as evidenced by strong relationships with salinity. Although considerable regional variability in bulk ice TIC and TA concentrations are evident when comparing our results to other studies, strong salinity relationships are a consistent result. Therefore, it may be possible to derive an empirical relationship between sea ice salinity and the source seawater chemistry to predict sea ice carbonate chemistry – an outcome which may have utility in modelling studies. It is important to note, however, that the geographical areas currently represented in the literature are fairly limited in scope. We expect regional variability to play an important role; for example the differences we measured in ice algae biomass are considerably lower that the difference between our sites and somewhere like Resolute Bay. An ongoing effort by the Biogeochemical Exchange Processes at Sea–Ice Interfaces (BEPSII) working group to compile published and unpublished data may reveal complexities that we cannot capture in a single Arctic region. Such an effort may also shed light on the important (and unresolved) question of how best to characterize the TA:TIC ratio in sea ice.
The data used in this paper have been made publicly available on the Polar Data Catalogue (https://doi.org/10.5884/13263, Polar Data Catalogue, 2019). Source code for producing many of the figures is available at https://github.com/Richard-Sims/Else_2022_Variability_in_sea_ice_carbonate_chemistry (last access: 12 August 2022) (DOI: https://doi.org/10.5281/zenodo.7045044, Sims, 2022).
The supplement related to this article is available online at: https://doi.org/10.5194/tc-16-3685-2022-supplement.
AC conceived of the study, led the field data collection, analyzed laboratory samples, organized data, and made significant contributions to manuscript writing. BGTE contributed to study conception, secured funding, supervised and participated in fieldwork, conducted the data analysis, and led the manuscript writing. RPS participated in fieldwork, contributed to laboratory analysis, produced most of the figures, and contributed to overall manuscript writing. SJ contributed to fieldwork planning, supervised laboratory work, provided expertise in carbonate system analysis, and provided input on manuscript drafts. LAD provided field equipment and field sampling expertise, completed laboratory analysis, and contributed to writing sections on ice algae production. CJM secured funding for laboratory analysis, personnel, and equipment and contributed to written sections on ice algae. RAS and RKS performed remote sensing analyses on sea ice formation and roughness, provided expertise on sea ice geophysics, and contributed to written sections on sea ice properties. TG contributed to laboratory techniques and statistical analyses, provided input on manuscript drafts, and assisted with manuscript preparation.
The contact author has declared that neither they nor their co-authors have any competing interests.
Publisher’s note: Copernicus Publications remains neutral with regard to jurisdictional claims in published maps and institutional affiliations.
Thanks to Shawn Marriott, Zoe Walker, and the staff of the Canadian High Arctic Research Station who assisted with fieldwork. Alexandre Langois provided the long snow depth and sea ice thickness transect data. We acknowledge the ongoing logistical support of Polar Knowledge Canada and the Arctic Research Foundation. This paper is a contribution to the SCOR Working Group 152 – Measuring Essential Climate Variables in Sea Ice (ECV-Ice) and the Biogeochemical Exchange Processes at Sea–Ice Interfaces network. Thank you to Sebastien Moreau and Eric Mortenson for reviewing this paper and providing valuable suggestions.
This research has been supported by the Marine Environmental Observation Prediction and Response (MEOPAR) Network of Centres of Excellence, the ArcticNet Network of Centres of Excellence, the Canada Foundation for Innovation (John R. Evans Leaders Fund), the Natural Sciences and Engineering Research Council of Canada (NSERC), and the University of Calgary. Araleigh Cranch was supported by a scholarship from the Northern Science Training Program (NSTP).
This paper was edited by Delphine Lannuzel and reviewed by Sebastien Moreau and Eric Mortenson.
Back, D.-Y., Ha, S.-Y., Else, B., Hanson, M., Jones, S. F., Shin, K.-H., Tatarek, A., Wiktor, J. M., Cicek, N., Alam, S., and Mundy, C. J.: On the impact of wastewater effluent on phytoplankton in the Arctic coastal zone: A case study in the Kitikmeot Sea of the Canadian Arctic, Sci. Total Environ., 759, 143861, https://doi.org/10.1016/j.scitotenv.2020.143861, 2021.
Bates, N. R. and Mathis, J. T.: The Arctic Ocean marine carbon cycle: evaluation of air-sea CO2 exchanges, ocean acidification impacts and potential feedbacks, Biogeosciences, 6, 2433–2459, https://doi.org/10.5194/bg-6-2433-2009, 2009.
Brown, K. A., Miller, L. A., Mundy, C. J., Papakyriakou, T., Francois, R., Gosselin, M., Carnat, G., Swystun, K., and Tortell, P. D.: Inorganic carbon system dynamics in landfast Arctic Sea ice during the early-melt period, J. Geophys. Res.-Oceans, 120, 3542–3566, https://doi.org/10.1002/2014JC010620, 2015.
Burt, J. E., Barber, G. M., and Rigby, D. L.: Elementary Statistics for Geographers, 3rd edn., The Guilford Press, New York, 653 pp., ISBN-13: 978-1572304840, 2009.
Cai, W.-J., Hu, X., Huang, W.-J., Jiang, L.-Q., Wang, Y., Peng, T.-H., and Zhang, X.: Alkalinity distribution in the western North Atlantic Ocean margins, J. Geophys. Res., 115, C08014, https://doi.org/10.1029/2009JC005482, 2010.
Campbell, K., Mundy, C. J., Barber, D. G., and Gosselin, M.: Remote Estimates of Ice Algae Biomass and Their Response to Environmental Conditions during Spring Melt, Arctic, 67, 375–387, https://doi.org/10.14430/arctic4409, 2014.
Campbell, K., Mundy, C. J., Barber, D. G., and Gosselin, M.: Characterizing the sea ice algae chlorophyll a–snow depth relationship over Arctic spring melt using transmitted irradiance, J. Marine Syst., 147, 76–84, https://doi.org/10.1016/j.jmarsys.2014.01.008, 2015.
Campbell, K., Mundy, C. J., Landy, J. C., Delaforge, A., Michel, C., and Rysgaard, S.: Community dynamics of bottom-ice algae in Dease Strait of the Canadian Arctic, Prog. Oceanogr., 149, 27–39, https://doi.org/10.1016/j.pocean.2016.10.005, 2016.
Campbell, K., Mundy, C. J., Gosselin, M., Landy, J. C., Delaforge, A., and Rysgaard, S., Net community production in the bottom of first-year sea ice over the Arctic spring bloom, Geophys. Res. Lett., 44, 8971–8978, https://doi.org/10.1002/2017GL074602, 2017.
Campbell, K., Lange, B. A., Landy, J. C., Katlein, C., Nicolaus, M., Anhaus, P., Matero, I., Gradinger, R., Charette, J., Duerksen, S., Tremblay, P., Rysgaard, S., Tranter, M., Haas, C., and Michel, C.: Net heterotrophy in High Arctic first-year and multi-year spring sea ice, Elementa: Science of the Anthropocene, 10, 00040, https://doi.org/10.1525/elementa.2021.00040, 2022.
Carnat, G., Papakyriakou, T., Geilfus, N., Brabant, F., Delille, B., Vancoppenolle, M., Gilson, G., Zhou, J., and Tison, J.: Investigations on physical and textural properties of Arctic first-year sea ice in the Amundsen Gulf, Canada, November 2007–June 2008 (IPY-CFL system study), J. Glaciol., 59, 819–837, https://doi.org/10.3189/2013JoG12J148, 2013.
Chalmers, B. and Williamson, R. B.: Crystal Multiplication without Nucleation, Science, 148, 1717–1718, https://doi.org/10.1126/science.148.3678.1717, 1965.
Comiso, J. C., Cavalieri, D. J., and Markus, T.: Sea ice concentration, ice temperature and snow depth using AMSR-E data, IEEE Geosci. Remote S., 41, 243–252, https://doi.org/10.1109/TGRS.2002.808317, 2003.
Cox, G. F. N. and Weeks, W. F.: Salinity Variations in Sea Ice, J. Glaciol., 13, 109–120, https://doi.org/10.3189/S0022143000023418, 1974.
Cox, G. F. N. and Weeks, W. F.: Brine drainage and initial salt entrapment in sodium chloride ice, CRREL Res. Rep. 345, U.S. Army Cold Reg. Res. and Eng. Lab., Hanover, NH, 1975.
Dalman, L. A., Else, B. G. T., Barber, D., Carmack, E., Williams, W. J., Campbell, K., Duke, P. J., Kirillov, S., and Mundy, C. J.: Enhanced bottom-ice algal biomass across a tidal strait in the Kitikmeot Sea of the Canadian Arctic, Elementa: Science of the Anthropocene, 7, 22, https://doi.org/10.1525/elementa.361, 2019.
Delille, B., Jourdain, B., Borges, A. V., Tison, J.-L., and Delille, D.: Biogas (CO2, O2, dimethylsulfide) dynamics in Spring Antarctic fast ice, Limnol. Oceanogr., 52, 1367–1379, https://doi.org/10.4319/lo.2007.52.4.1367, 2007.
Dickson, A. G., Sabine, C. L., and Christian, J. R. (Eds.): Guide to Best Practices for Ocean CO2 Measurements, Sidney, British Columbia, North Pacific Marine Science Organization, PICES Special Publication, 3, 191 pp., https://doi.org/10.25607/OBP-1342, 2007.
Dieckmann, G. S., Nehrke, G., Papadimitriou, S., Göttlicher, J., Steininger, R., Kennedy, H., Wolf-Gladrow, D., and Thomas, D. N.: Calcium carbonate as ikaite crystals in Antarctic Sea ice, Geophys. Res. Lett., 35, L08501, https://doi.org/10.1029/2008GL033540, 2008.
Dieckmann, G. S., Nehrke, G., Uhlig, C., Göttlicher, J., Gerland, S., Granskog, M. A., and Thomas, D. N.: Brief Communication: Ikaite (CaCO3⋅6H2O) discovered in Arctic sea ice, The Cryosphere, 4, 227–230, https://doi.org/10.5194/tc-4-227-2010, 2010.
Eicken, H.: Salinity profiles of Antarctic Sea ice: Field data and model results, J. Geophys. Res., 97, 15545–15557, https://doi.org/10.1029/92JC01588, 1992.
Feltham, D. L., Worster, M. G., and Wettlaufer, J. S.: The influence of ocean flow on newly forming sea ice, J. Geophys. Res., 107, 1-1–1-9, https://doi.org/10.1029/2000JC000559, 2002.
Findlay, H. S., Edwards, L. A., Lewis, C. N., Cooper, G. A., Clement, R., Hardman-Mountford, N., Vagle, S., and Miller, L. A.: Late winter biogeochemical conditions under sea ice in the Canadian High Arctic, Polar Res., 34, 24170, https://doi.org/10.3402/polar.v34.24170, 2015.
Flato, G. M. and Brown, R. D.: Variability and climate sensitivity of landfast Arctic Sea ice, J. Geophys. Res., 101, 25767–25777, https://doi.org/10.1029/96JC02431, 1996.
Friis, K., Körtzinger, A., and Wallace, D. W. R.: The salinity normalization of marine inorganic carbon chemistry data, Geophys. Res. Lett., 30, 1085, https://doi.org/10.1029/2002GL015898, 2003.
Galley, R. J., Else, B. G. T., Howell, S. E. L., Lukovich, J. V., and Barber, D. G.: Landfast Sea Ice Conditions in the Canadian Arctic: 1983–2009, Arctic, 65, 133–144, https://www.jstor.org/stable/41638586 (last access: 10 June 2022), 2012.
Geilfus, N.-X., Carnat, G., Papakyriakou, T., Tison, J.-L., Else, B., Thomas, H., Shadwick, E., and Delille, B.: Dynamics of pCO2 and related air-ice CO2 fluxes in the Arctic coastal zone (Amundsen Gulf, Beaufort Sea), J. Geophys. Res., 117, C00G10, https://doi.org/10.1029/2011JC007118, 2012.
Geilfus, N.-X., Galley, R. J., Cooper, M., Halden, N., Hare, A., Wang, F., Søgaard, D. H., and Rysgaard, S.: Gypsum crystals observed in experimental and natural sea ice, Geophys. Res. Lett., 40, 6362–6367, https://doi.org/10.1002/2013GL058479, 2013.
Grasshoff, K., Kremling, K., and Ehrhardt, M.: Methods of Seawater Analysis, 3rd edn., Wiley-VCH, Weinheim, 632 pp., ISBN: 9783527295890, 1999.
Grimm, R., Notz, D., Glud, R. N., Rysgaard, S., and Six, K. D.: Assessment of the sea-ice carbon pump: Insights from a three-dimensional ocean-sea-ice-biogeochemical model (MPIOM/HAMOCC), Elementa: Science of the Anthropocene, 4, 000136, https://doi.org/10.12952/journal.elementa.000136, 2016.
Holm-Hansen, O., Lorenzen, J., Holmes, R. W., and Strickland, J. D.: Fluorometric determination of chlorophyll, ICES J. Mar. Sci., 30, 3–15, https://doi.org/10.1093/icesjms/30.1.3, 1965.
Howell, S. E. L., Laliberté, F., Kwok, R., Derksen, C., and King, J.: Landfast ice thickness in the Canadian Arctic Archipelago from observations and models, The Cryosphere, 10, 1463–1475, https://doi.org/10.5194/tc-10-1463-2016, 2016.
Hu, Y., Wang, F., Boone, W., Barber, D., and Rysgaard, S..: Assessment and improvement of the sea ice processing for dissolved inorganic carbon analysis, Limnol. Oceanogr.-Meth., 16, 83–91, https://doi.org/10.1002/lom3.10229, 2018.
Jiang, L.-Q., Cai, W.-J., and Wang, Y.: A comparative study of carbon dioxide degassing in river- and marine-dominated estuaries, Limnol. Oceanogr., 53, 2603–2615, https://doi.org/10.4319/lo.2008.53.6.2603, 2008.
König, D., Miller, L. A., Simpson, K. G., and Vagle, S.: Carbon Dynamics During the Formation of Sea Ice at Different Growth Rates, Front. Earth Sci., 6, 234, https://doi.org/10.3389/feart.2018.00234, 2018.
Lange, B. A., Haas, C., Charette, J., Katlein, C., Campbell, K., Duerksen, S., Coupel, P., Anhaus, P., Jutila, A., Tremblay, P. O. G., Carlyle, C. G., and Michel, C.: Contrasting Ice Algae and Snow-Dependent Irradiance Relationships Between First-Year and Multiyear Sea Ice, Geophys. Res. Lett., 46, 10834–10843, https://doi.org/10.1029/2019GL082873, 2019.
Leu, E., Mundy, C. J., Assmy, P., Campbell, K., Gabrielsen, T. M., Gosselin, M., Juul-Pedersen, T., and Gradinger, R.: Arctic spring awakening – Steering principles behind the phenology of vernal ice algal blooms, Prog. Oceanogr., 139, 151–170, https://doi.org/10.1016/j.pocean.2015.07.012, 2015.
Manizza, M., Menemenlis, D., Zhang, H., and Miller, C. E.: Modeling the Recent Changes in the Arctic Ocean CO2 Sink (2006–2013), Global Biogeochem. Cy., 33, 420–438, https://doi.org/10.1029/2018GB006070, 2019.
Martin, S. and Kauffman, P.: A Field and Laboratory Study of Wave Damping by Grease Ice, J. Glaciol., 27, 283–313, https://doi.org/10.3189/S0022143000015392, 1981.
Meiners, K. M., Vancoppenolle, M., Thanassekos, S., Dieckmann, G. S., Thomas, D. N., Tison J.-L., Arrigo, K. R., Garrison, D. L., McMinn, A., Lannuzel, D., van der Merwe, P., Swadling, K. W., Smith Jr., W. O., Melnikov, I., and Raymond, B.: Chlorophyll a in Antarctic sea ice from historical ice core data, Geophys. Res. Lett., 39, L21602, https://doi.org/10.1029/2012gl053478, 2012.
Meiners, K. M., Vancoppenolle, M., Carnat, G., Castellani, G., Delille, B., Delille, D., Dieckmann, G. S., Flores, H., Fripiat, F., Grotti, M., Lange, B. A., Lannuzel, D., Martin, A., McMinn, A., Nomura, D., Peeken, I., Rivaro, P., Ryan, K. G., Stefels, J., Swadling, K. M., Thomas, D. N., Tison, J.-L., van der Merwe, P., van Leeuwe, M. A., Weldrick, C., and Yang, E. J.: Chlorophyll-a in Antarctic landfast sea ice: A first synthesis of historical ice core data, J. Geophys. Res.-Oceans, 123, 8444–8459, https://doi.org/10.1029/2018JC014245, 2018.
Melling, H., Haas, C., and Brossier, E.: Invisible polynyas: Modulation of fast ice thickness by ocean heat flux on the Canadian polar shelf, J. Geophys. Res.-Oceans, 120, 777–795, https://doi.org/10.1002/2014JC010404, 2015.
Miller, L., Papakyriakou, T., Collins, R., Deming, J., Ehn, J., Macdonald, R., Mucci, A., Owens, O., Raudsepp, M., and Sutherland, N.: Carbon dynamics in Sea Ice: A Winter Flux Time Series, J. Geophys. Res., 116, C02028, https://doi.org/10.1029/2009JC006058, 2011a.
Miller, L. A., Carnat, G., Else, B. G. T., Sutherland, N., and Papakyriakou, T. N.: Carbonate system evolution at the Arctic Ocean surface during autumn freeze-up, J. Geophys. Res., 116, C00G04, https://doi.org/10.1029/2011JC007143, 2011b.
Miller, L. A., Fripiat, F., Else, B. G. T., Bowman, J. S., Brown, K. A., Collins, R. E., Ewert, M., Fransson, A., Gosselin, M., Lannuzel, D., Meiners, K. M., Michel, C., Nishioka, J., Nomura, D., Papadimitriou, S., Russell, L. M., Sørensen, L. L., Thomas, D. N., Tison, J.-L., van Leeuwe, M. A., Vancoppenolle, M., Wolff, E. W., and Zhou, J.: Methods for biogeochemical studies of sea ice: The state of the art, caveats, and recommendations, Elementa: Science of the Anthropocene, 3, 000038, https://doi.org/10.12952/journal.elementa.000038, 2015.
Moreau, S., Vancoppenolle, M., Delille, B., Tison, J.-L., Zhou, J., Kotovitch, M., Thomas, D. N., Geilfus, N.-X., and Goosse, H.: Drivers of inorganic carbon dynamics in first-year sea ice: A model study, J. Geophys. Res.-Oceans, 120, 471–495, https://doi.org/10.1002/2014JC010388, 2015.
Moreau, S., Vancoppenolle, M., Bopp, L., Aumont, O., Madec, G., Delille, B., Tison, J.-L., Barriat, P.-Y., and Goosse, H.: Assessment of the sea-ice carbon pump: Insights from a three-dimensional ocean-sea-ice biogeochemical model (NEMO-LIM-PISCES), Elementa: Science of the Anthropocene, 4, 000122, https://doi.org/10.12952/journal.elementa.000122, 2016.
Mortenson, E., Steiner, N., Monahan, A. H., Miller, L. A., Geilfus, N.-X., and Brown, K.: A Model-Based Analysis of Physical and Biogeochemical Controls on Carbon Exchange in the Upper Water Column, Sea Ice, and Atmosphere in a Seasonally Ice-Covered Arctic Strait, J. Geophys. Res.-Oceans, 123, 7529–7549, https://doi.org/10.1029/2018JC014376, 2018.
Mundy, C. J., Barber, D. G., and Michel, C.: Variability of snow and ice thermal, physical and optical properties pertinent to sea ice algae biomass during spring, J. Marine Sys., 58, 107–120, https://doi.org/10.1016/j.jmarsys.2005.07.003, 2005.
Nakawo, M. and Sinha, N. K.: Growth Rate and Salinity Profile of First-Year Sea Ice in the High Arctic, J. Glaciol., 27, 315–330, https://doi.org/10.3189/S0022143000015409, 1981.
Nomura, D., Yshikawa-Inoue, H., and Toyota, T.: The effect of sea ice growth on air-sea CO2 flux in a tank experiment, Tellus B, 58, 418–426, 2006.
Nomura, D., Yoshikawa-Inoue, H., Toyota, T., and Shirasawa, K.: Effects of snow, snowmelting and refreezing processes on air-sea ice CO2 flux, J. Glaciol., 56, 262–270, 2010.
Nomura, D., Yoshikawa-Inoue, H., Kobayashi, S., Nakaoka, S., Nakata, K., and Hashida, G.: Winter-to-summer evolution of pCO2 in surface water and air–sea CO2 flux in the seasonal ice zone of the Southern Ocean, Biogeosciences, 11, 5749–5761, https://doi.org/10.5194/bg-11-5749-2014, 2014.
Notz, D. and Worster, M. G.: Desalination processes of sea ice revisited, J. Geophys. Res., 114, C05006, https://doi.org/10.1029/2008JC004885, 2009.
Parsons, T. R., Maita, Y., and Lalli, C. M.: A manual of chemical and biological methods for seawater analysis, Pergamon Press, New York, https://doi.org/10.1002/iroh.19850700634, 1984.
Petrich, C. and Eicken, H.: Growth, Structure and Properties of Sea Ice, in: Sea Ice, edited by: Thomas, D. N. and Dieckmann, G. S., Jonn Wiley & Sons, United Kingdom, 23–79, ISBN: 1405185805, 2010.
Polar Data Catalogue: Study of Sea Ice Biogeochemistry (snow depth, ice thickness, ice salinity, dissolved inorganic carbon, total alkalinity, biomass, under ice currents) Comparing a Thick First Year Ice Site, and a Thinner Polynya Site Near Cambridge Bay, Polar Data Catalogue [data set], https://doi.org/10.5884/13263, 2019.
Provost, C., Sennéchael, N., Miguet, J., Itkin, P., Rösel, A., Koenig, Z., Villacieros-Robineau, N., and Granskog, M. A.: Observations of flooding and snow-ice formation in a thinner Arctic sea-ice regime during the N-ICE2015 campaign: Influence of basal ice melt and storms, J. Geophys. Res.-Oceans, 122, 7115–7134, https://doi.org/10.1002/2016JC012011, 2017.
Rysgaard, S. and Glud, R. N.: Anaerobic N2 production in Arctic sea ice, Limnol. Oceanogr., 49, 86–94, 2004.
Rysgaard, S., Glud, R. N., Sejr, M. K., Bendtsen, J., and Christensen, P. B.: Inorganic carbon transport during sea ice growth and decay: A carbon pump in polar seas, J. Geophys. Res., 112, C03016, https://doi.org/10.1029/2006JC003572, 2007.
Rysgaard, S., Bendtsen, J., Pedersen, L. T., Ramløv, H., and Glud, R. N.: Increased CO2 uptake due to sea ice growth and decay in the Nordic Seas, J. Geophys. Res., 114, C09011, https://doi.org/10.1029/2008JC005088, 2009.
Rysgaard, S., Bendtsen, J., Delille, B., Dieckmann, G. S., Glud, R. N., Kennedy, H., Mortensen, J., Papadimitriou, S., Thomas, D. N., and Tison, J.-L.: Sea ice contribution to the air–sea CO2 exchange in the Arctic and Southern Oceans, Tellus B, 63, 823–830, https://doi.org/10.1111/j.1600-0889.2011.00571.x, 2011.
Rysgaard, S., Søgaard, D. H., Cooper, M., Pućko, M., Lennert, K., Papakyriakou, T. N., Wang, F., Geilfus, N. X., Glud, R. N., Ehn, J., McGinnis, D. F., Attard, K., Sievers, J., Deming, J. W., and Barber, D.: Ikaite crystal distribution in winter sea ice and implications for CO2 system dynamics, The Cryosphere, 7, 707–718, https://doi.org/10.5194/tc-7-707-2013, 2013.
Savel'yev, B. A.: Study of ice in the region of the drift of the station SP-4 during melt and breakup in 1955, Problemy Severa, 2, 47–79, 1958.
Savel'yev, B. A.: Structure, composition and properties of the ice cover of sea and fresh waters, Moscow, Izdatel'stvo Moskovskogo Universiteta, 1963.
Sims, R.: Richard-Sims/Else_2022_Variability_in_sea_ice_carbonate_chemistry: v1.0.0 Publication, v1.0.0-Else-2022, Zenodo [data set], https://doi.org/10.5281/zenodo.7045044, 2022.
Spreen, G., Kaleschke, L., and Heygster, G.: Sea ice remote sensing using AMSR-E 89-GHz channels, J. Geophys. Res., 113, C02S03, https://doi.org/10.1029/2005JC003384, 2008.
Takahashi, T., Sutherland, S. C., Wanninkhof, R., Sweeney, C., Feely, R. A., Chipman, D. W., Hales, B., Friederich, G., Chavez, F., Sabine, C., Watson, A., Bakker, D. C. E., Schuster, U., Metzl, N., Yoshikawa-Inoue, H., Ishii, M., Midorikawa, T., Nojiri, Y., Körtzinger, A., Steinhoff, T., Hoppema, M., Olafsson, J., Arnarson, T. S., Tilbrook, B., Johannessen, T., Olsen, A., Bellerby, R., Wong, C. S., Delille, B., Bates, N. R., and de Baar, H. J. W.: Climatological mean and decadal change in surface ocean pCO2, and net sea–air CO2 flux over the global oceans, Deep-Sea Res. Pt. II, 56, 554–577, https://doi.org/10.1016/j.dsr2.2008.12.009, 2009.
Vancoppenolle, M., Fichefet, T., and Bitz, C. M.: Modeling the salinity profile of undeformed Arctic Sea ice, Geophys. Res. Lett., 33, L21501, https://doi.org/10.1029/2006GL028342, 2006.
Weeks, W. F.: On Sea Ice,: University of Alaska Press, Fairbanks, 664 pp., ISBN 978-1-60223-079-8, 2010.
Weeks, W. F. and Lee, O. S.: The Salinity Distribution in Young Sea-Ice, Arctic, 15, 92–108, https://doi.org/10.14430/arctic3562, 1962.
Welch, H. E. and Bergmann, M. A.: Seasonal development of ice algae and its prediction from environmental factors near Resolute, N.W.T., Canada, Can. J. Fish. Aquat. Sci., 46, 1793–1804, https://doi.org/10.1139/f89-227, 1989.
Williams W. J., Brown, K. A., Bluhm, B. A., Carmack, E. C., Dalman, L., Danielson, S. L., Else, B. G. T., Fredriksen, R., Mundy, C. J., Rotermund, L. M., and Schimnowski, A.: Stratification in the Canadian Arctic Archipelago's Kitikmeot Sea: biological and geochemical consequences, Polar Knowledge, Aqhaliat 2018, Polar Knowledge Canada, 46–52, https://doi.org/10.35298/pkc.2018.06, 2018.
Xu, C., Mikhael, W., Myers, P. G., Else, B., Sims, R. P., and Zhou, Q.: Effects of seasonal ice coverage on the physical oceanographic conditions of the Kitikmeot Sea in the Canadian Arctic Archipelago, Atmos.-Ocean, 59, 214–234, https://doi.org/10.1080/07055900.2021.1965531, 2021.
Yasunaka, S., Murata, A., Watanabe, E., Chierici, M., Fransson, A., Heuven, S. van, Hoppema, M., Ishii, M., and Johannssen, T., Kosugi, N., Lauvset, S. K., Mathis, J. T., Nishino, S., Omar, A. M., Olsen, A., Sasano, D., Takahashi, T., and Wanninkhof, R.: Mapping of the air–sea CO2 flux in the Arctic Ocean and its adjacent seas: Basin-wide distribution and seasonal to interannual variability, Polar Sci., 10, 323–334, https://doi.org/10.1016/j.polar.2016.03.006, 2016.