the Creative Commons Attribution 4.0 License.
the Creative Commons Attribution 4.0 License.
 | 14 Jul 2022
Contribution of ground ice melting to the expansion of Selin Co (lake) on the Tibetan Plateau
Lingxiao Wang
Huayun Zhou
Shibo Liu
Erji Du
Guangyue Liu
Guojie Hu
Chong Wang
Zhe Sun
Zhibin Li
Yongping Qiao
Tonghua Wu
Chengye Li
Xubing Li
Selin Co, located within permafrost regions surrounded by glaciers, has exhibited the greatest increase in water storage among all the lakes on the Tibetan Plateau over the last 50 years. Most of the increased lake water volume has been attributed to increased precipitation and the accelerated melting of glacier ice, but these processes are still not sufficient to close the water budget with the expansion of Selin Co. Ground ice meltwater released by thawing permafrost due to continuous climate warming over the past several decades is regarded as another source of lake expansion. This study presents the first attempt to quantify the water contribution of ground ice melting to the expansion of Selin Co by evaluating the ground surface deformation. We monitored the spatial distribution of surface deformation in the Selin Co basin using the small baseline subset (SBAS) interferometric synthetic aperture radar (InSAR) technique and compared the results with the findings of field surveys. Then, the ground ice meltwater volume in the watershed was calculated based on the cumulated settlement. Finally, this volume was compared with the lake volume change during the same period, and the contribution ratio was derived. SBAS-InSAR monitoring during 2017–2020 illustrated widespread and large subsidence in the upstream section of the Zhajiazangbu subbasin, where widespread continuous permafrost is present. The terrain subsidence rate was normally between 5 and 20 mm a−1, indicating rapid ground ice loss in the region. The ground ice meltwater was released at a rate of m3 a−1, and the rate of increase in lake water storage was m3 a−1 during the same period, with ground ice meltwater contributing ∼12 % of the lake volume increase. This study contributes to explaining the rapid expansion of Selin Co and equilibrating the water balance at the watershed scale. More importantly, the proposed method can be extended to other watersheds underlain by permafrost and help in understanding the hydrological changes in these watersheds.
- Article
(33089 KB) - Full-text XML
- Companion paper
- BibTeX
- EndNote


More than 1200 lakes on the Tibetan Plateau (TP) span an area exceeding 1 km2, and the total lake area is greater than 46 000 km2 (Zhang et al., 2021b). The water in most of these lakes is more or less connected with widely distributed glaciers and permafrost. Recent studies have indicated that most of the lakes on the TP have manifested extensive changes (Qiao et al., 2019; Zhang et al., 2020). In particular, Selin Co (also known as Siling Co; co is lake in Tibetan) exhibited the greatest increases in both lake area and water storage: its lake area expanded by ∼40 % from ∼1700 km2 in 1972 to ∼2400 km2 in 2020, and its water storage increased by 80 % from 309.4×10⁸ m3 in 1972 to 558.4×10⁸ m3 in 2017 (Zhu et al., 2019a; Zhang et al., 2021b). Its area surpassed that of Nam Co in the early 2000s (Zhang et al., 2021b; Bian et al., 2010), and Selin Co is now the second-largest saltwater lake in China. Such rapid changes in Selin Co have significantly affected the regional environment and have thus attracted substantial interest within the scientific community.
The entire Selin Co watershed covers a drainage area of 4.4×10⁴ km2, 18 times the lake surface. Accordingly, a lake water level increase of ∼0.2 m a−1 corresponds to at least 1 cm a−1 of water collected uniformly over the whole watershed area (neglecting evaporation). The entire watershed hosts 299 glaciers with a total area of 369.7 km2 (Guo et al., 2015; S. Liu et al., 2012) and an ice volume of 21.8 km3 (Farinotti et al., 2019). Zou et al. (2017) mapped the permafrost distribution on the Qinghai–Tibet Plateau (QTP) based on freezing and thawing indices from Moderate Resolution Imaging Spectroradiometer (MODIS) land surface temperatures and validated their map using various ground-based datasets; according to this permafrost map, the permafrost area covers km2, accounting for 30.2 % of the watershed. Continuous permafrost and seasonally frozen ground exist, with the former being widespread mainly in the northern part of the watershed (Zou et al., 2017). Zhao and Sheng (2019) estimated the ground ice storage on the QTP based on the ice content distribution characteristics from 164 drill core records deeper than 15 m, the above-permafrost distribution map, a map of the Quaternary sedimentary types, and a permafrost thickness map; based on their map, the ground ice volume in the watershed reaches 132.3 km3 (Zhao and Sheng, 2019), approximately 5 times the glacier ice volume in the Selin Co watershed.
To reveal the potential reasons for the abovementioned rapid expansion of lakes on the TP, an accurate estimation of the basin water balance is urgently needed (Lei et al., 2014; Zhang et al., 2017; Li et al., 2014; Song et al., 2014). Glacial meltwater, the thawing of permafrost, precipitation (including snow), and changes in evapotranspiration all contribute to lake recharge. A model simulation of endorheic basins on the TP showed that increased net precipitation contributed the majority of the water supply (∼70 %) to the increased lake volume (Zhang et al., 2017). In addition, recent research has revealed that glacial meltwater has contributed ∼10 % of the total water input to Selin Co since the 1970s (Lei et al., 2013; Tong et al., 2016; Brun et al., 2020; Zhang et al., 2021a). The weakening of lake evaporation during 1972–2010 due to decreasing wind speeds also contributed to the accelerated expansion of Selin Co to some extent, but this contribution was reported to be very small (Guo et al., 2019).
Significant permafrost degradation has been observed on the TP under the impacts of the warming climate. The monitoring of 10 boreholes on the TP revealed that from 1981 to 2018, the active layer thickened at an average rate of 19.5 cm per decade; moreover, this thickening trend has been accelerating in recent years (Zhao et al., 2020). In the meantime, different permafrost regions across the TP experienced thaw settlements (Daout et al., 2017; Chen et al., 2022). The ice content within the uppermost layer of permafrost is typically higher than the saturated water content after this permafrost layer thaws; hence, the thawing of this layer might result in terrain settlement (Streletskiy et al., 2016; Shiklomanov et al., 2013; Günther et al., 2015; Lantuit and Pollard, 2008; Kokelj and Jorgenson, 2013). The terrain settlement was attributed to the melting of ground ice from the ice-rich permafrost layer just below the permafrost table and the further release of this water into the hydrological cycle (Zhao et al., 2019).
The melting of ground ice released water into the hydrological cycle (Zhao et al., 2019; Jin et al., 2022); hence permafrost degradation might be a possible source of the water that is causing lakes to expand (Li et al., 2014), but this contribution has yet to be quantified. By separating hydrographs using isotopes, some researchers have calculated the contributions of meltwater from ground ice to surface water runoff and have found that the contribution ranges from 13.2 % to 16.7 % in the source region of the Yellow River (Yang et al., 2019) and that of nearby thermokarst lakes in the Beiluhe region reaches ∼61.3 % (Yang et al., 2016). The amount of meltwater from permafrost degradation was also modeled by multiplying the active-layer thickening rate and the average ground ice content (Zhang et al., 2017).
Interferometric synthetic aperture radar (InSAR) analysis can exploit the phase changes in synthetic aperture radar (SAR) signals to determine relative surface displacements on the order of millimeters to centimeters. Accordingly, InSAR monitoring can detect the terrain subsidence triggered by the thawing of ice-rich permafrost (e.g., Daout et al., 2020; Zwieback and Meyer, 2021; Chen et al., 2018; Lu et al., 2020; L. Liu et al., 2012). Permafrost regions with higher ground ice contents have been shown to produce greater terrain subsidence on the TP (Wu et al., 2018; Daout et al., 2017; Chen et al., 2018). The subsidence rate is less than 5 mm a−1 in the northwestern TP, where the climate is cold and dry (Daout et al., 2017), while it is up to 30 mm a−1 on the ice-rich Eboling Mountain in the northeastern region of the TP (Chen et al., 2018).
In this study, we conducted the first attempt to quantify the contribution of ground ice melting to the expansion of the Selin Co watershed through surface settlement. It is well known that the permafrost layer just below the permafrost table always contains ground ice higher than 50 % in volume (Cheng, 1983; Mackay, 1983; French and Harbor, 2013; Zhao and Sheng, 2019). Therefore, we assumed that the amount of surface settlement would release the same amount of ground ice caused by compressing the thawing ice-rich permafrost layer. The spatial distribution of surface deformation was derived through InSAR analysis and compared with the findings of field surveys. Finally, the ground ice meltwater volume in the watershed was compared with the Selin Co volume increase, and the contribution ratio was determined.
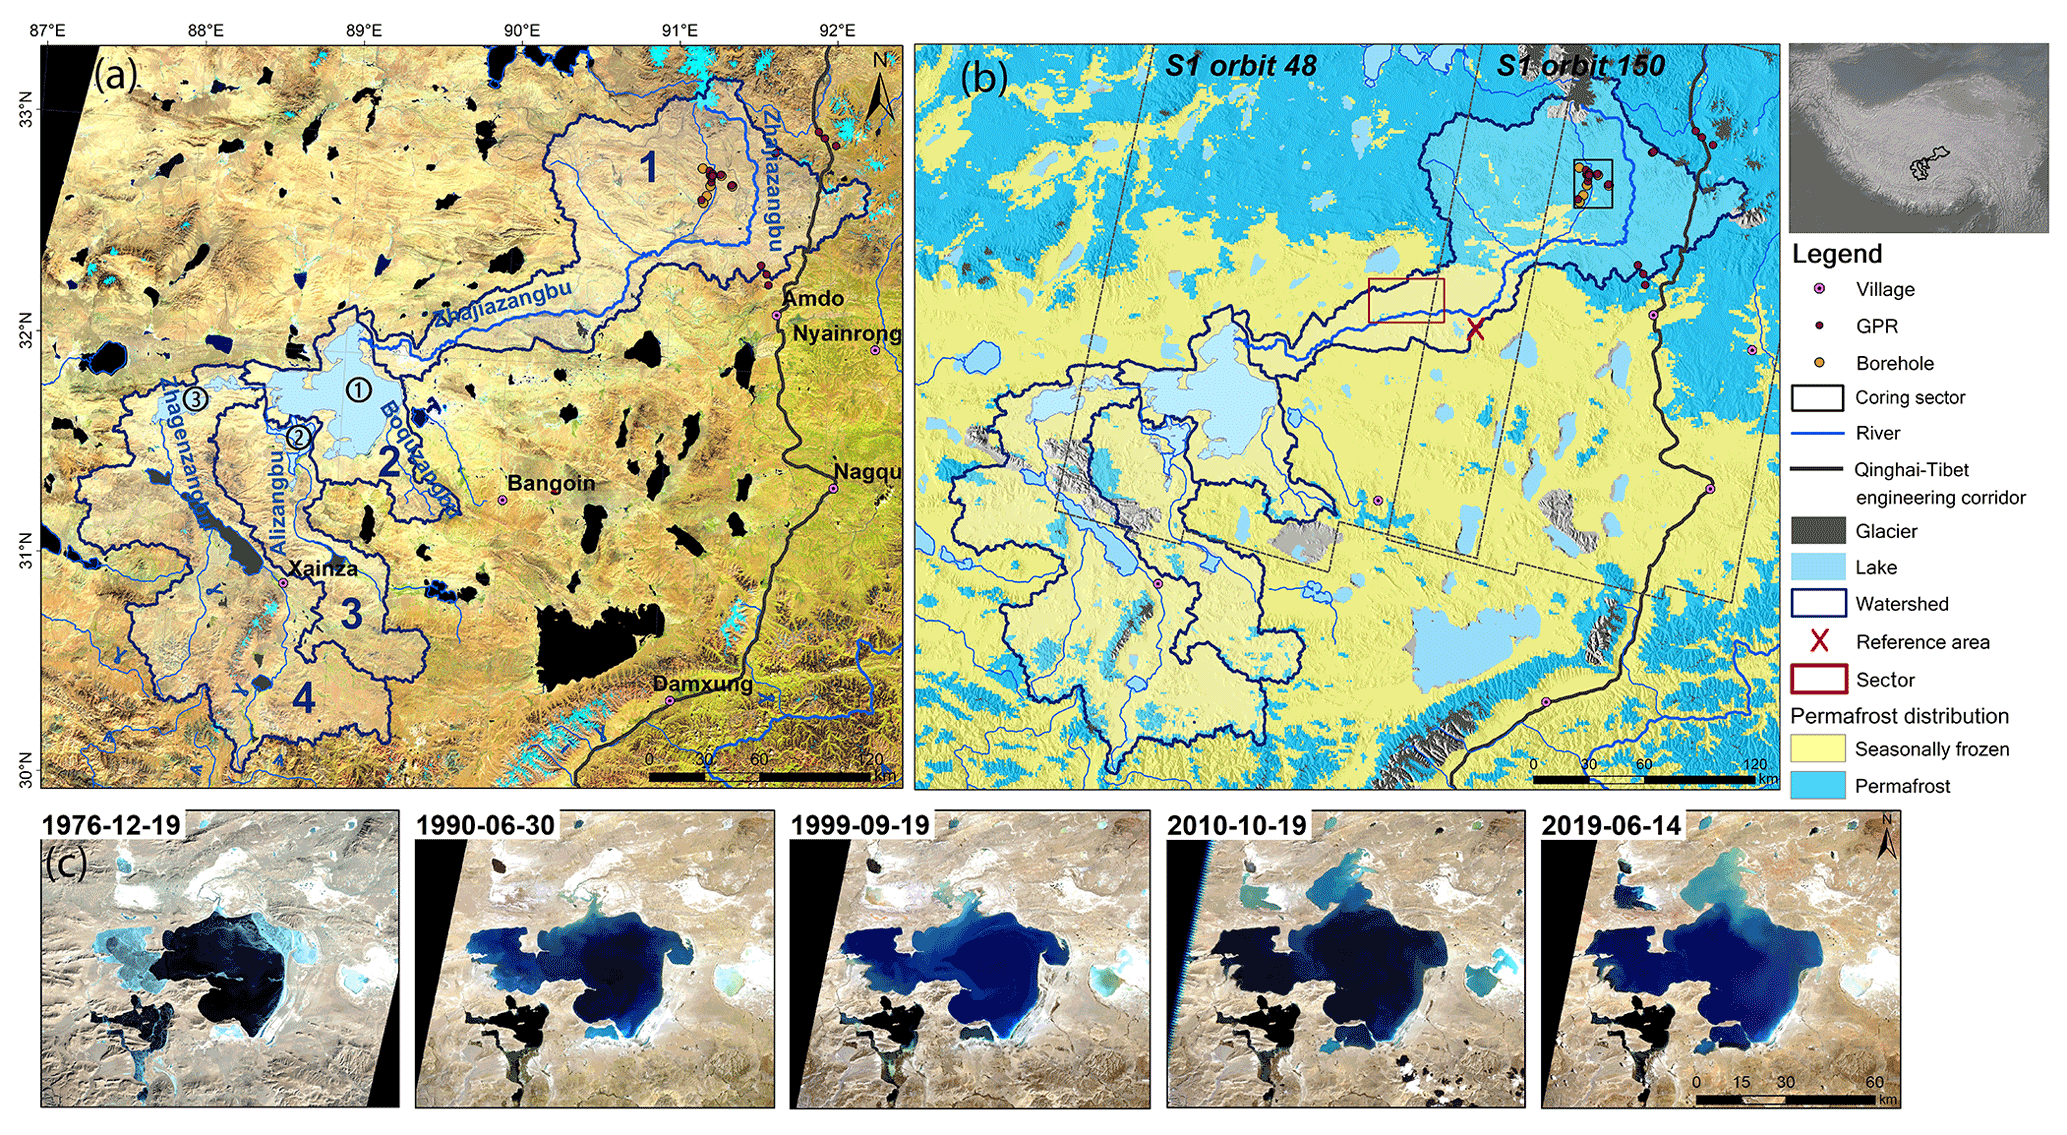
Figure 1Study area. The base map in (a) is a Landsat 8 image acquired in October 2020 (red: SWIR1, green: NIR, blue: red). The base map in (b) is a permafrost map (Zou et al., 2017); the hillshade is calculated using a 1 arcsec SRTM DEM with the Sentinel-1 incidence angle and azimuth angle. The dashed grey lines delineate two tracks of Sentinel-1 used in this study. The red cross marks the position of our InSAR reference point. The locations of the GPR surveys and boreholes are shown with dots. Panel (c) shows the lake areas from 1976 to 2019 on Landsat optical images (date format yyyy-mm-dd).
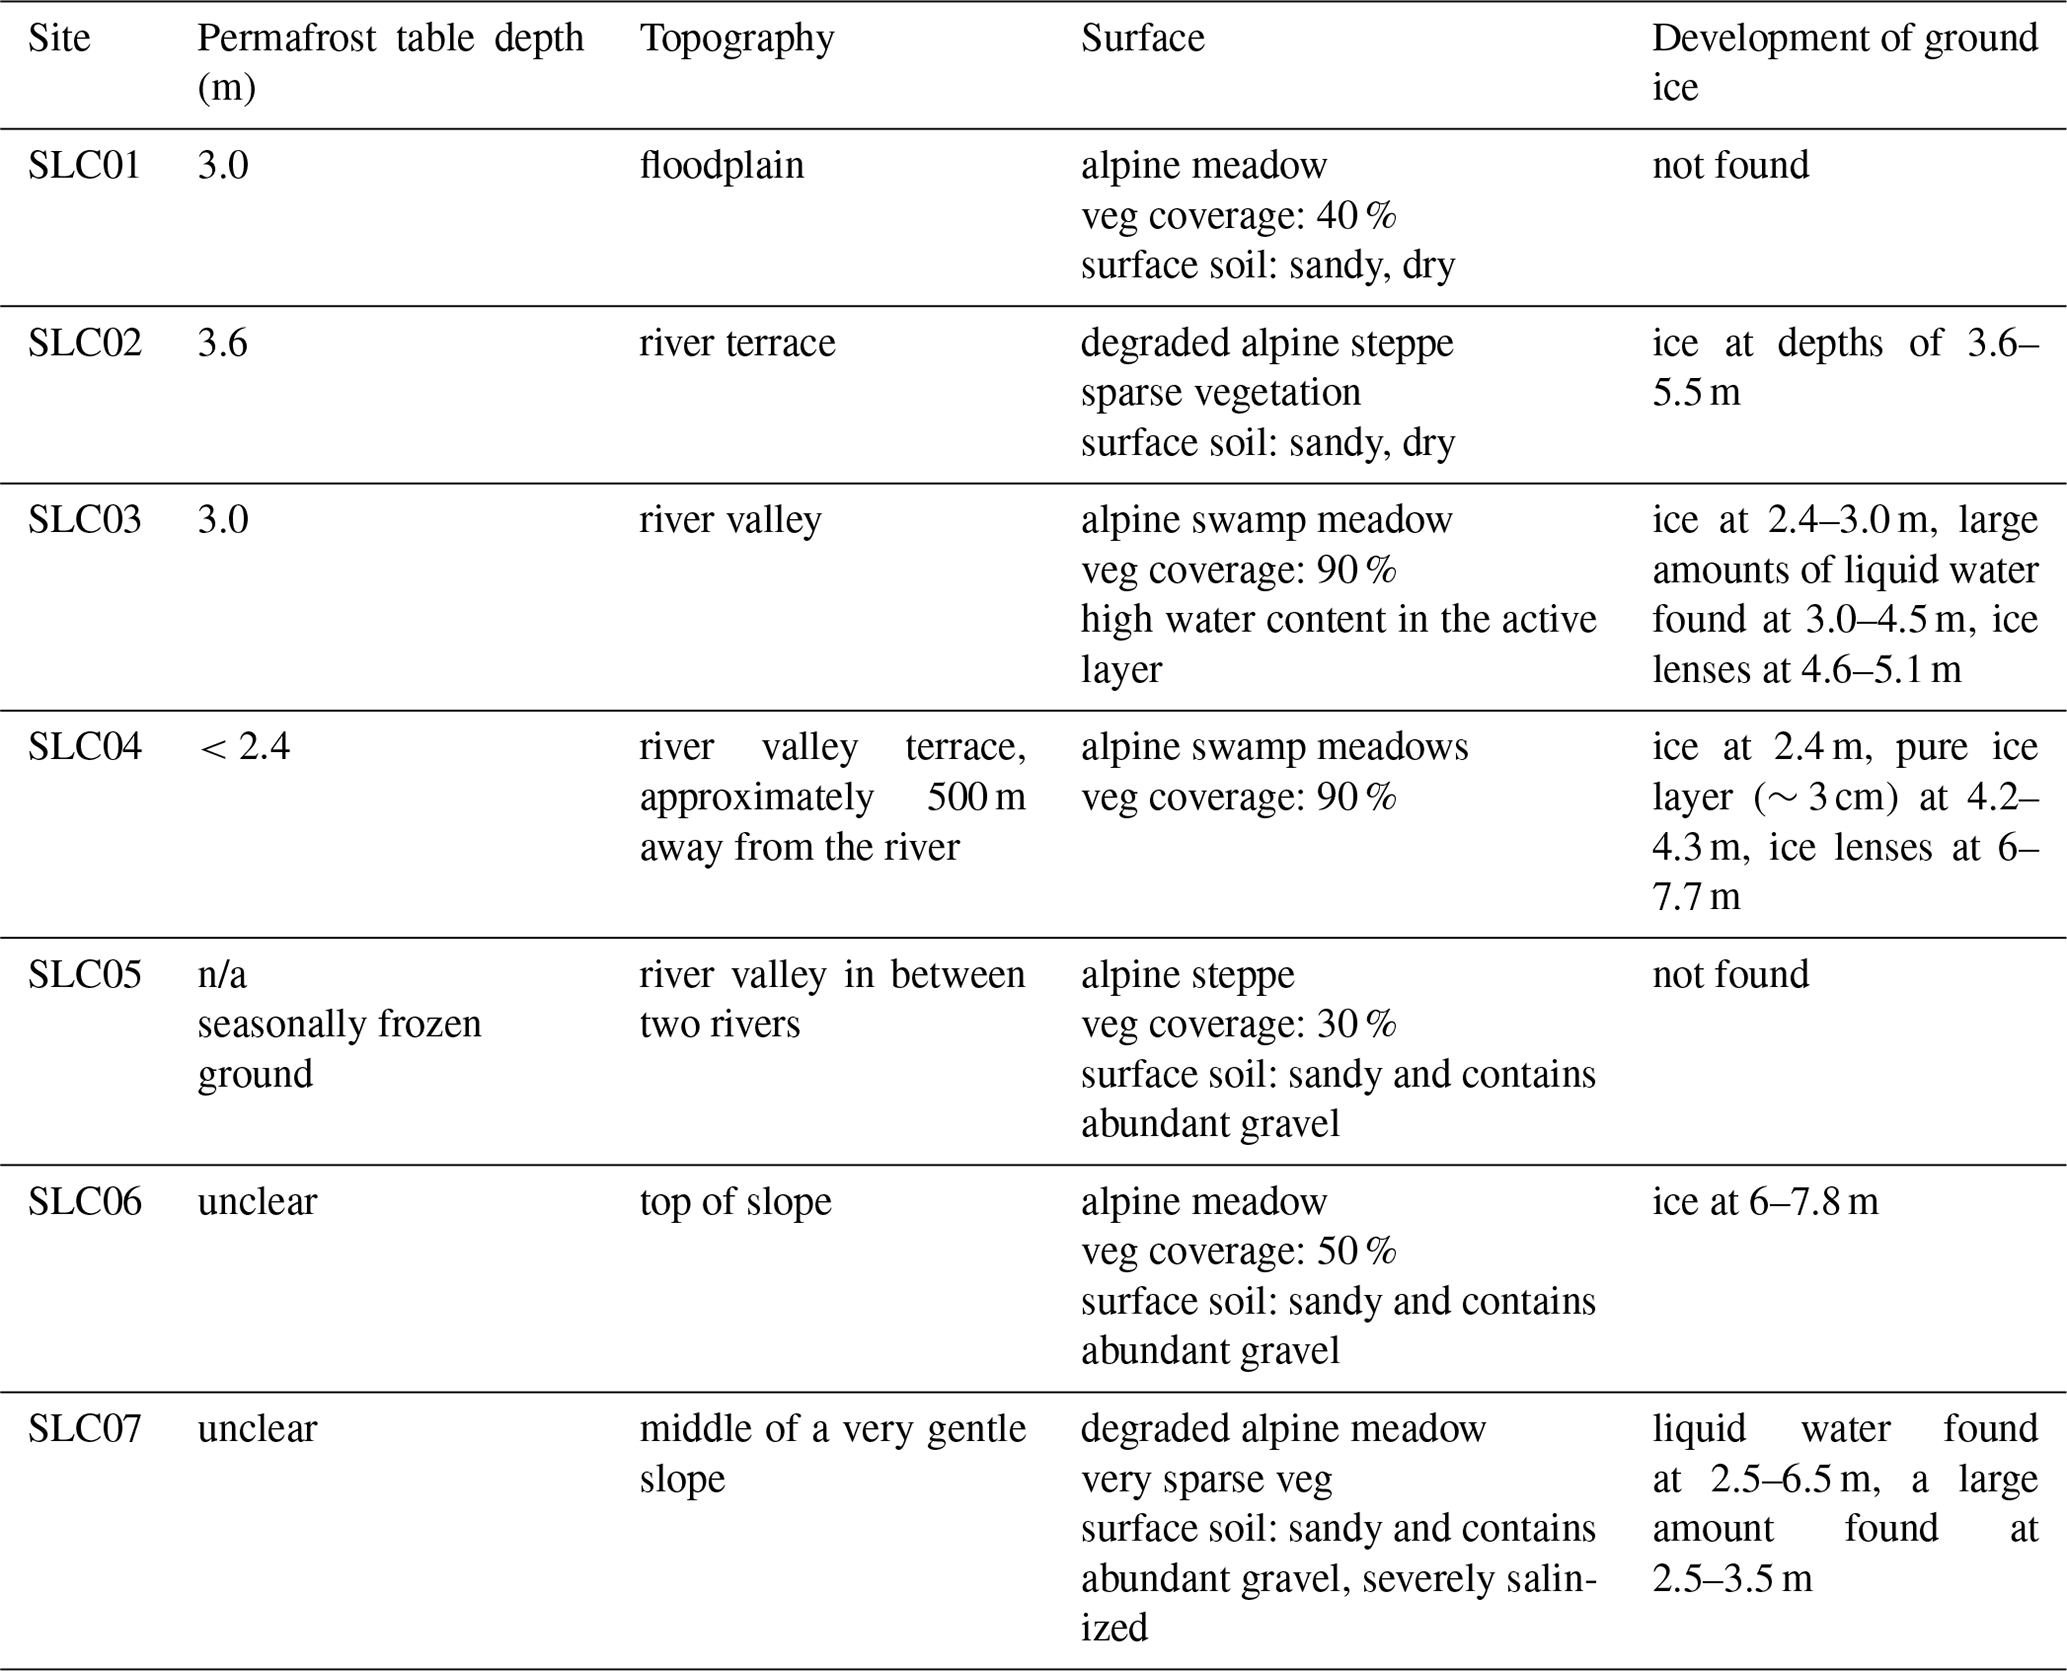
Table 1Characteristics of the Selin Co basin. The glacier coverage information is from the second Chinese glacier inventory (Guo et al., 2015; S. Liu et al., 2012), and the permafrost coverage information is from Zou et al. (2017).

2.1 Study area
The Selin Co watershed, which is in the transitional zone between the Indian monsoon and the westerlies over the TP, is characterized by a cold semiarid monsoon climate with a mean annual temperature of approximately 0 ∘C and average precipitation of ∼350 mm (Tong et al., 2016). From 1979 to 2017, the average annual temperature increased at a rate of 0.049 ∘C a−1 and the average annual precipitation increased at a rate of 4.65 mm a−1, with the main increase occurring after the mid-1990s (Zhu et al., 2019a).
This watershed basin extends over a total area of approximately 4.4×10⁴ km2, and the rivers and lakes within the basin are connected, forming an inland lake group. Co Ngoin is located south of Selin Co, while Wuru Co (alternately Lake Urru) and Qiagui Co are located west of Selin Co; their locations are marked as (2) and (3), respectively, in Fig. 1. The main rivers draining into the lake are the Zhajiazangbu (from the north), the Zhagenzangbu and Alizangbu (from the west), and the Boquzangbu (from the east) (Tong et al., 2016), as shown in Fig. 1. The details of the four major subbasins and the inflows of the runoff from these rivers into the lake are listed in Table 1. The Zhajiazangbu River, with a length of 409 km, originates from the Tanggula Mountains and enters Selin Co from the north. Widespread continuous permafrost occurs mainly in the northern part of the basin, whereas sporadic permafrost and seasonally frozen ground are found in the central and southern parts of the watershed. Among the four subbasins, the Zhajiazangbu has the largest permafrost distribution (10 667 km2 or 66.2 % of the subbasin area), followed by the Zhagenzangbu (1967 km2 or 12.3 % of the subbasin area) (Zou et al., 2017).
2.2 Field data
We conducted a field investigation of the permafrost in the study area in October 2019. Seven boreholes deeper than 20 m were drilled, and ground-penetrating radar (GPR) surveys were carried out in the upstream section of the Zhajiazangbu subbasin (locations are marked in Fig. 1). The survey was performed at the end of the thawing period, allowing us to estimate the maximum thawing depth and the location of the permafrost table. The permafrost table was estimated from the cores of the boreholes, and the development of ground ice was described as well. Descriptions of the boreholes are provided in Table 2, and field photographs of the cores at borehole sites SLC01 and SLC04 are shown in Fig. 2.
Twenty 50 m long GPR profiles were recorded within or around the catchment, 14 of which were within the basin. Based on the 14 GPR profiles recorded within the basin, the permafrost table was at a maximum depth of 4.1 m, a minimum depth of 2.0 m, and an average depth of 3.2 m. The volumetric soil water content in the active layer ranged from a maximum of 46.4 % to a minimum of 14.7 %, with an average of 22.6 % based on our interpretation of the GPR data.
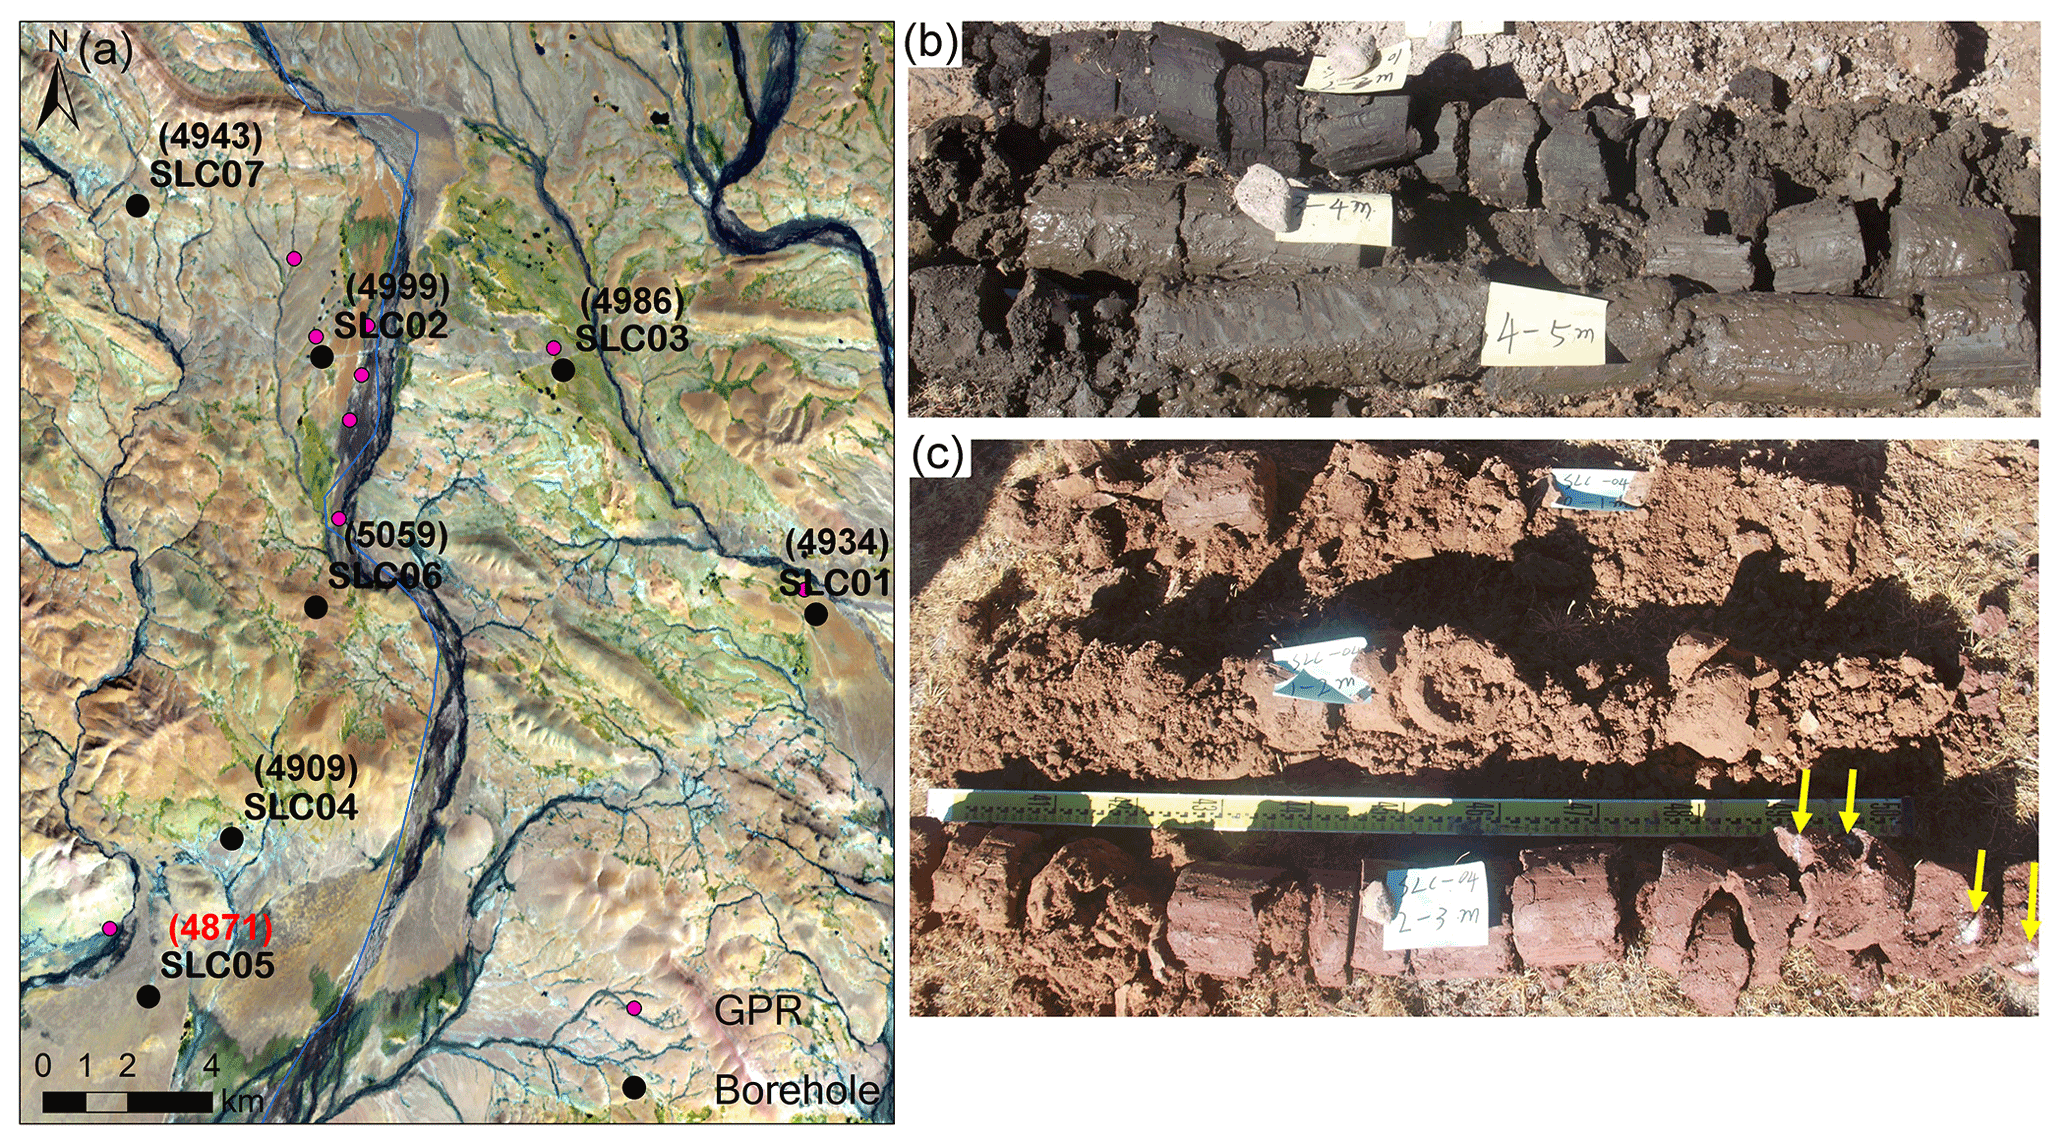
Figure 2(a) Locations of surveyed sites. The base map is a Landsat 8 image acquired in October 2020. For borehole sites, their elevations (m a.s.l.) are labeled in parentheses. Site SLC05 has no permafrost. Cores from borehole SLC01 at depths of 2–5 m (b) and SLC04 at depths of 0–3 m (c). Ice blocks were found in SLC04 at a depth of 2.4 m, as indicated by the arrows in (c).
2.3 Sentinel-1 SAR images
Sentinel-1 (S1) C-band SAR images (https://scihub.copernicus.eu/, last access: 9 July 2022) were used to monitor the surface deformation. S1, a constellation comprising two satellites launched in 2014 (S1A) and 2016 (S1B) that orbit the Earth, is a C-band SAR mission that was developed and is operated by the European Space Agency (ESA) as part of the Copernicus program. VV-polarized Level-1 single-look complex (SLC) images acquired in interferometric wide-swath (IW) mode in descending orbit were used in the study. The study area is covered by two orbits of S1 acquisitions, the details of which are listed in Table A1. In total, 95 acquisition dates for descending orbit 48 and 100 acquisition dates for descending orbit 150 from September 2017 to December 2020 were processed.
2.4 SRTM DEM, ICESat-2 dataset, and Landsat 8 Operational Land Imager (OLI) images
A 1 arcsec grid (∼30 m) Shuttle Radar Topography Mission (SRTM) digital elevation model (DEM) was used to calculate the slope, remove the topographic phase, and implement geocoding during InSAR processing.
Laser altimetry data from the ICESat-2 ATL13 product (https://nsidc.org/data/atl13, last access: 9 July 2022) were applied to extract the water surface elevations of the lakes.
Optical Landsat 8 OLI images (https://glovis.usgs.gov/, last access: 9 July 2022) were used to detect changes in the lake extents. Cloud-free images acquired during autumn or summer were selected, and the acquisition date and track of each image are listed in Table A2.
3.1 Workflow
An overview of the methodology employed in this study is illustrated in Fig. 3. The main steps are summarized as (i) retrieval of lake water storage changes, (ii) retrieval of deformation time series, (iii) estimation of the ground ice meltwater volume from the long-term deformation rate, and (iv) calculation of the ratio of the water volume contributed by permafrost ground ice melting to the increase in lake water storage. The processing steps are described in detail in the following subsections.
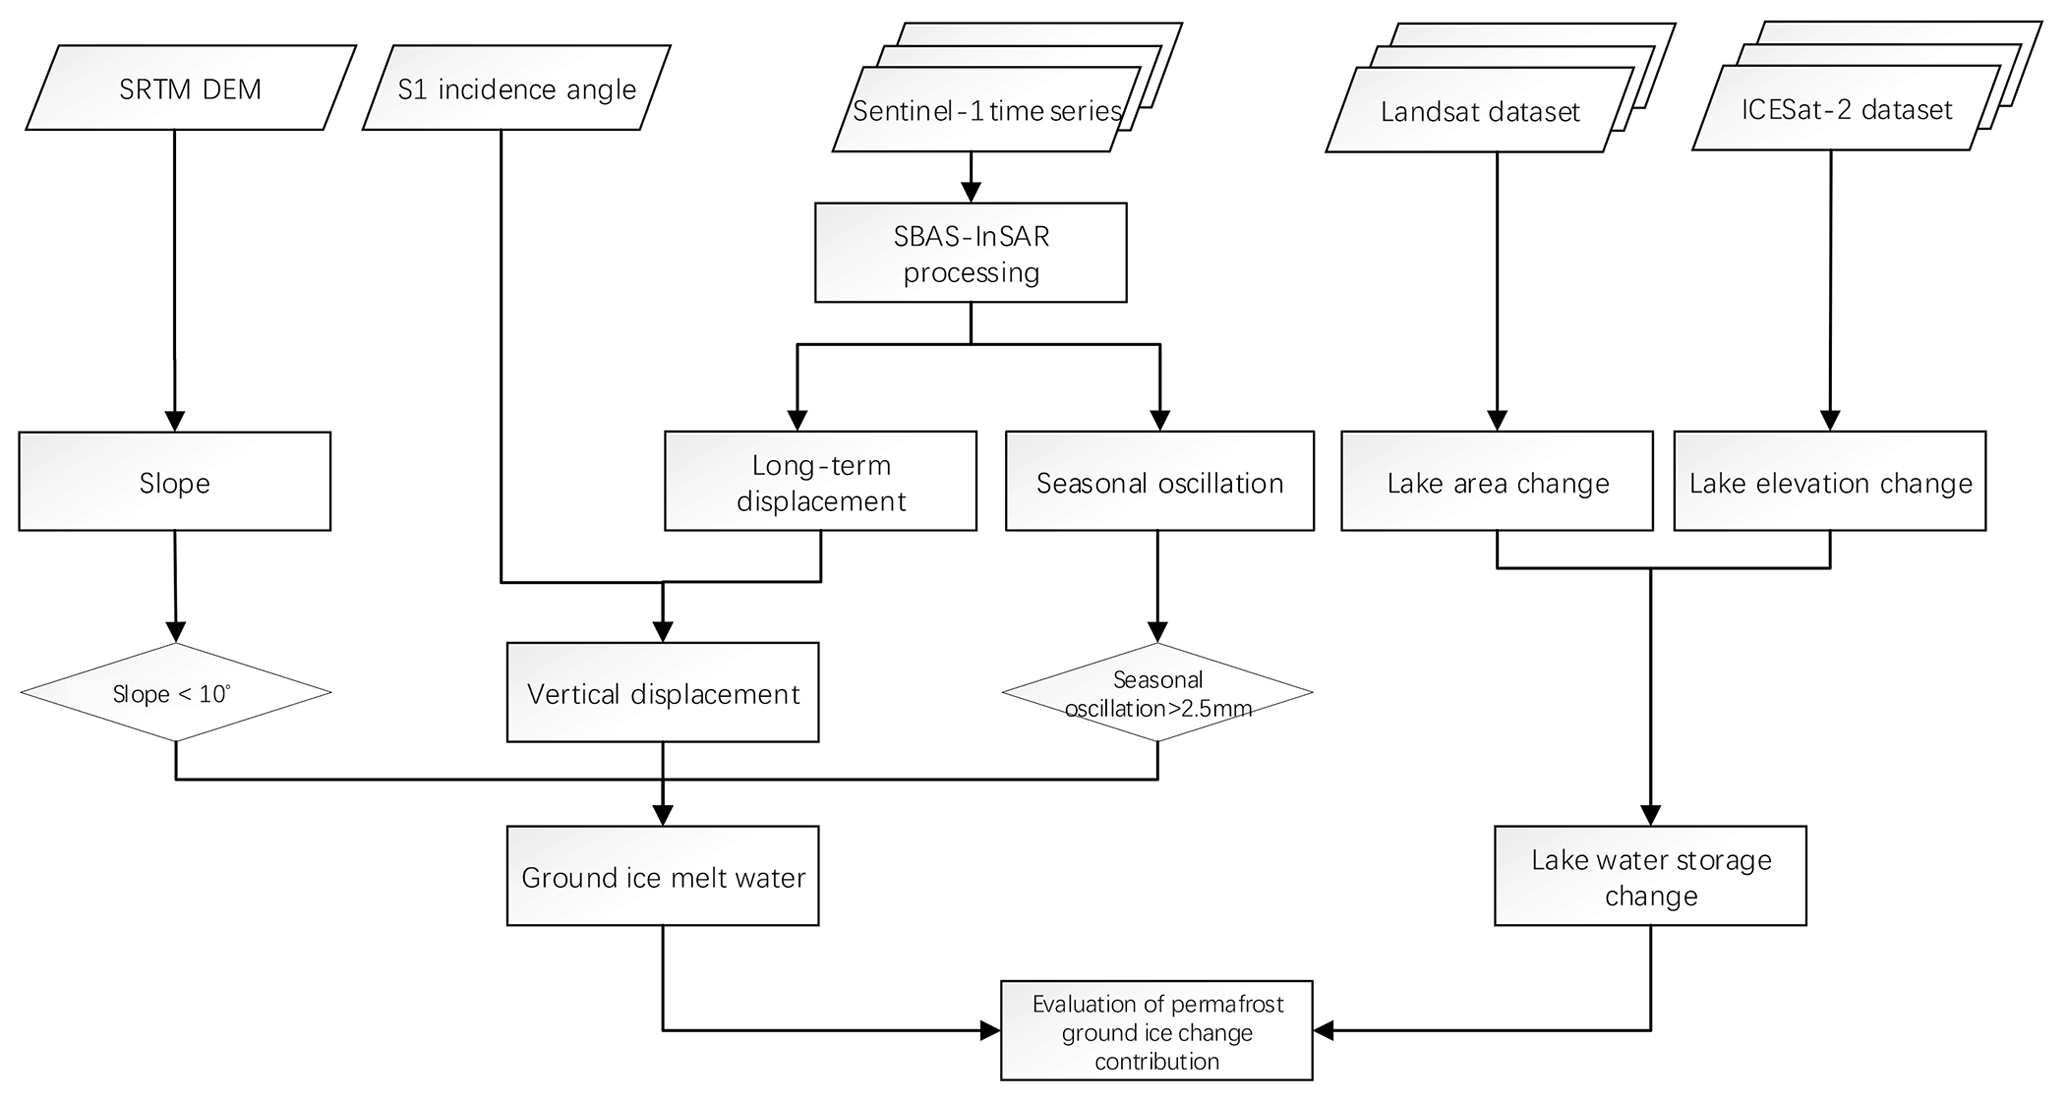
Figure 3Workflow of estimating the water contribution by permafrost ground ice melting to the expansion of Selin Co.
3.2 Lake water storage changes
First, we retrieved water surface elevations through the ICESat-2 ATL13 laser altimetry product by extracting data values within each lake's area from 13 October 2018 to the end of 2020. For each year, the mean annual elevation was calculated from all data acquisitions during the year. The lake water level change rate was then estimated by a linear trend model.
Then, we extracted the lake area extent using Landsat 8 OLI images in 2018, 2019, and 2020. Three bands (NIR, SWIR1, and SWIR2) were stacked to extract the lake area because lake water has extremely low reflectance in these bands and thus is easily separated from other land cover types. k-means clustering was then applied to classify the land cover types in the stacked image into two classes: water and other. After that, a 3×3 window size majority filtering was applied as a postprocessing step, and we then converted the classified image into a shapefile and eliminated the spots outside the inlet and outlets of the lakes. The lake areas in 2015, 2016, and 2017 were obtained from a previous study (Zhang, 2019); we also modified the lakes to have the same inlets and outlets. For lakes with irregular areas, their storage was approximately calculated according to the volume of a circular platform; thus, the change in the volume of the lake was calculated from the difference between the volumes of two circular platforms (G. Zhang et al., 2019), as described in Eq. (1):
where ΔV is the change in lake water storage, S1 and S2 represent the lake areas during two periods (i.e., the lake areas in 2018 and 2020), and (H2−H1) represents the water surface elevation change between the two periods.
3.3 Deformation monitoring
3.3.1 SBAS-InSAR processing
In this study, we implemented the small baseline subset (SBAS) time series InSAR analysis (SBAS-InSAR) technique, which deploys multiple master datasets to minimize the effects of spatiotemporal decorrelation (Berardino et al., 2002; Lanari et al., 2004; Usai, 2003) by selecting interferograms with small spatial and temporal baselines. Thus, this technique is suitable for permafrost environments prone to strong spatiotemporal decorrelation.
The Selin Co basin is covered by two orbits of S1 images. We processed the SBAS-InSAR analysis individually for each orbit. SBAS-InSAR processing in this study contains three main steps: (i) InSAR processing of the images, including interferogram network selection, coregistration, differential interferogram phase generation, and phase unwrapping; (ii) deformation time series estimation; and (iii) reference point refinement and geocoding.
The main processing steps are described in detail as follows.
- (i)
InSAR processing.
To overcome the decorrelation caused by changes in the permafrost landscape (e.g., freeze–thaw transitions and vegetation phenology), we generated interferograms with only short time intervals. The precision state vectors obtained from ESA were applied to reduce the effects of inaccurate baselines. All the SLC images were coregistered to the stack reference of 20180807 acquisition for orbit 150 and 20180801 acquisition for orbit 48. After generating a coregistered stack of SLC images, interferograms were generated by each SAR image with its two sequential acquisitions. The temporal baselines of the individual interferograms ranged from 12 to 36 d, and the perpendicular baseline of all the interferometric pairs was <200 m. Multilooking with 3 pixels in the azimuth and 13 pixels in the range was then performed to form a square pixel (∼40 m) and reduce noise. The topographic phase was simulated using the SRTM DEM and subtracted from the interferogram. Next, we applied an adaptive spectral filter to produce differential interferograms. To unwrap the differential phase, the SNAPHU minimum cost flow (MCF) phase-unwrapping algorithm (Chen and Zebker, 2002) was applied. Two orbits covering an area of approximately 450 km × 500 km were processed using ISCE software (https://github.com/isce-framework/isce2, last access: 9 July 2022). To facilitate the processing of data over such a large area, coregistration and conversion between radar coordinates and geometric coordinate systems were accelerated by the aid of a graphics processing unit (GPU) under the Compute Unified Device Architecture (CUDA) framework.
- (ii)
Deformation time series estimation.
In this step, the network of unwrapped interferograms was inverted to construct a timeline of line-of-sight (LOS) displacement maps. A 2-by-2 multilook was applied to interferograms to reduce the dataset size. Before the network inversion, we applied unwrapping-error corrections by bridging reliable regions (Y. Zhang et al., 2019). The interferograms, generated by each SAR image with its two sequential acquisitions, all have averaged interferometric coherence above 0.7. Figure A1 presents an overview of the interferogram network and the averaged interferometric coherence. We applied a weighted least squares (WLS) estimator to invert the network of interferograms into a time series. During the inversion, interferograms were weighted by the inverse of the phase variance of the whole interferogram (Y. Zhang et al., 2019). Differently from some studies conducted in permafrost environments that have presupposed deformation models to help solve the phase time series (Li et al., 2015; Chen et al., 2018), we did not preset any deformation and instead obtained the raw-phase time series by minimizing the phase residual. The time series of LOS displacements are relative to the first scene of the datasets and spatially relative to the reference point. The reference point was first set by selecting pixels with extremely high temporal coherence greater than 0.99.
After the raw-phase time series were obtained, tropospheric delay correction, phase deramping, and topographic residual correction were applied. The tropospheric delay was estimated in the satellite LOS direction using European Centre for Medium-Range Weather Forecasts (ECMWF) fifth-generation reanalysis (ERA5) data. The processing was conducted in PyAPS software (Jolivet et al., 2014). The phase ramps, which might be caused by residual tropospheric and ionospheric delays, were estimated by a 2-D quadratic model based on reliable pixels and removed from the displacement time series at each acquisition. The systematic topographic phase residuals caused by DEM errors were estimated based on the proportionality with the perpendicular baseline time series (Y. Zhang et al., 2019). The processing described above was implemented by MintPy (Y. Zhang et al., 2019) (https://github.com/insarlab/MintPy, last access: 9 July 2022).
Two indicators evaluated the quality of unwrapped phases and inverted raw-phase time series: the phase closure of interferogram triplets and temporal coherence. The phase-unwrapping algorithms add an integer number of 2π phase jumps to recover the unwrapped phase. Interferometric phase noise and discontinuities among different coherent regions may lead to the wrong 2π jumps added to the phase field, which is known as unwrapping error. Unwrapping errors can bias the estimated time series. For an interferogram triplet (Δϕij, Δϕjk, and Δϕik), unwrapping errors introduce a nonzero integer component into the closure phase Cijk. Therefore, the number of interferogram triplets with nonzero integer ambiguity Tint can be used to detect unwrapping errors:
where Δφij, Δφjk, and Δφik are the three unwrapped interferometric phases generated from the SAR acquisitions at ti, tj, and tk, respectively; wrap is an operator that wraps each input number into ; and T is the number of interferogram triplets. A triplet without unwrapping errors has .
The second index, temporal coherence, represents the consistency of the time series with the network of interferograms (Pepe and Lanari, 2006):
where (for N SAR images and M interferograms) Δϕ is the unwrapped interferometric phase, A is the design matrix indicating the acquisition pairs used for interferogram generation (consisting of −1, 0, and 1 for each row with −1 for the reference acquisition, 1 for the secondary acquisition, and 0 for all other acquisitions; Berardino et al., 2002), denotes the estimated time series, H is an M×1 all-ones column vector, and j is the imaginary unit.
Temporal coherence varies from 0 to 1: pixels with values closer to 1 are considered reliable, whereas pixels with values closer to zero are considered unreliable. A threshold of 0.7 is recommended for a dense network of interferograms. In this study, we used a threshold of 0.85; the pixels with temporal coherence below this threshold were masked from the final result.
- (iii)
Reference point refinement and geocoding.
In the natural environment, exposed bedrock in flat terrain is normally selected as the reference point; however, because such exposed bedrock is scarce in the study area, we took great care in the selection of reference points. We selected a reference point near the boundary of the Selin Co watershed not affected by permafrost in dry and flat terrain. The residual phases from atmospheric distortions and tectonic movements on the TP are difficult to remove completely in such a large-scale extent. However, the effect could be reduced by setting the reference near the study area. The reference area was homogeneous and had interferometric coherence close to 1. Thus, we adjusted the displacements relative to this reference area; the location of the reference area is marked in Fig. 1. Finally, we geocoded the deformation time series to the WGS 84 coordinate system with a grid spacing of 0.0009∘ × 0.0009∘ and then reprojected it onto the Albers equal-area conic system with a 100 m × 100 m grid size. To minimize the effects of extreme values, we also applied 3-size moving-window filtering to the deformation time series.
3.3.2 Extraction of periodic (seasonal) amplitudes and inter-annual deformation rates
The surface deformation in permafrost terrain exhibits the characteristics of both long-term linear deformation and seasonal oscillations (uplift in winter and spring and subsidence in summer and autumn) (Daout et al., 2017; Li et al., 2015). Therefore, we applied a sinusoidal (seasonal) function plus a linear (inter-annual) trend to the displacement time series of each image pixel using Eq. (6).
where t is the time interval with respect to the first SAR image acquisition date, a is the long-term deformation rate, A is the periodic (seasonal) amplitude, T is the period of the seasonal undulation (assumed to be 1 year), φ is the initial phase, and c is the residual term. a, A, φ, and c are the coefficients to be determined. The peak-to-peak periodic (seasonal) deformation is twice the periodic amplitude of A. The seasonal amplitude shown in this work refers to the amount of A, not the peak-to-peak deformation amount of 2A.
For each orbit, we extracted the LOS periodic (seasonal) amplitude and long-term deformation rate pixel by pixel from the deformation time series and then mosaicked the results from the two orbits together. The spatial grids of the incidence angles from the two orbits were mosaicked as well.
3.3.3 Deformation from the LOS direction to the vertical direction
For flat terrain, deformation is caused mainly by freeze–thaw cycles within the permafrost layer and occurs predominantly in the vertical direction. Hence, assuming no horizontal displacement, the observed deformation in the line-of-sight (LOS) direction was converted into the vertical direction using Eq. (7) by dividing the deformation value by the cosine of the incidence angle (the incidence angle ranges of orbit 48 and orbit 150 of the S1 satellites are listed in Table A1):
where dLOS is the observed deformation along the LOS direction, dv is the deformation in the vertical direction, and θ is the incidence angle of the sensor.
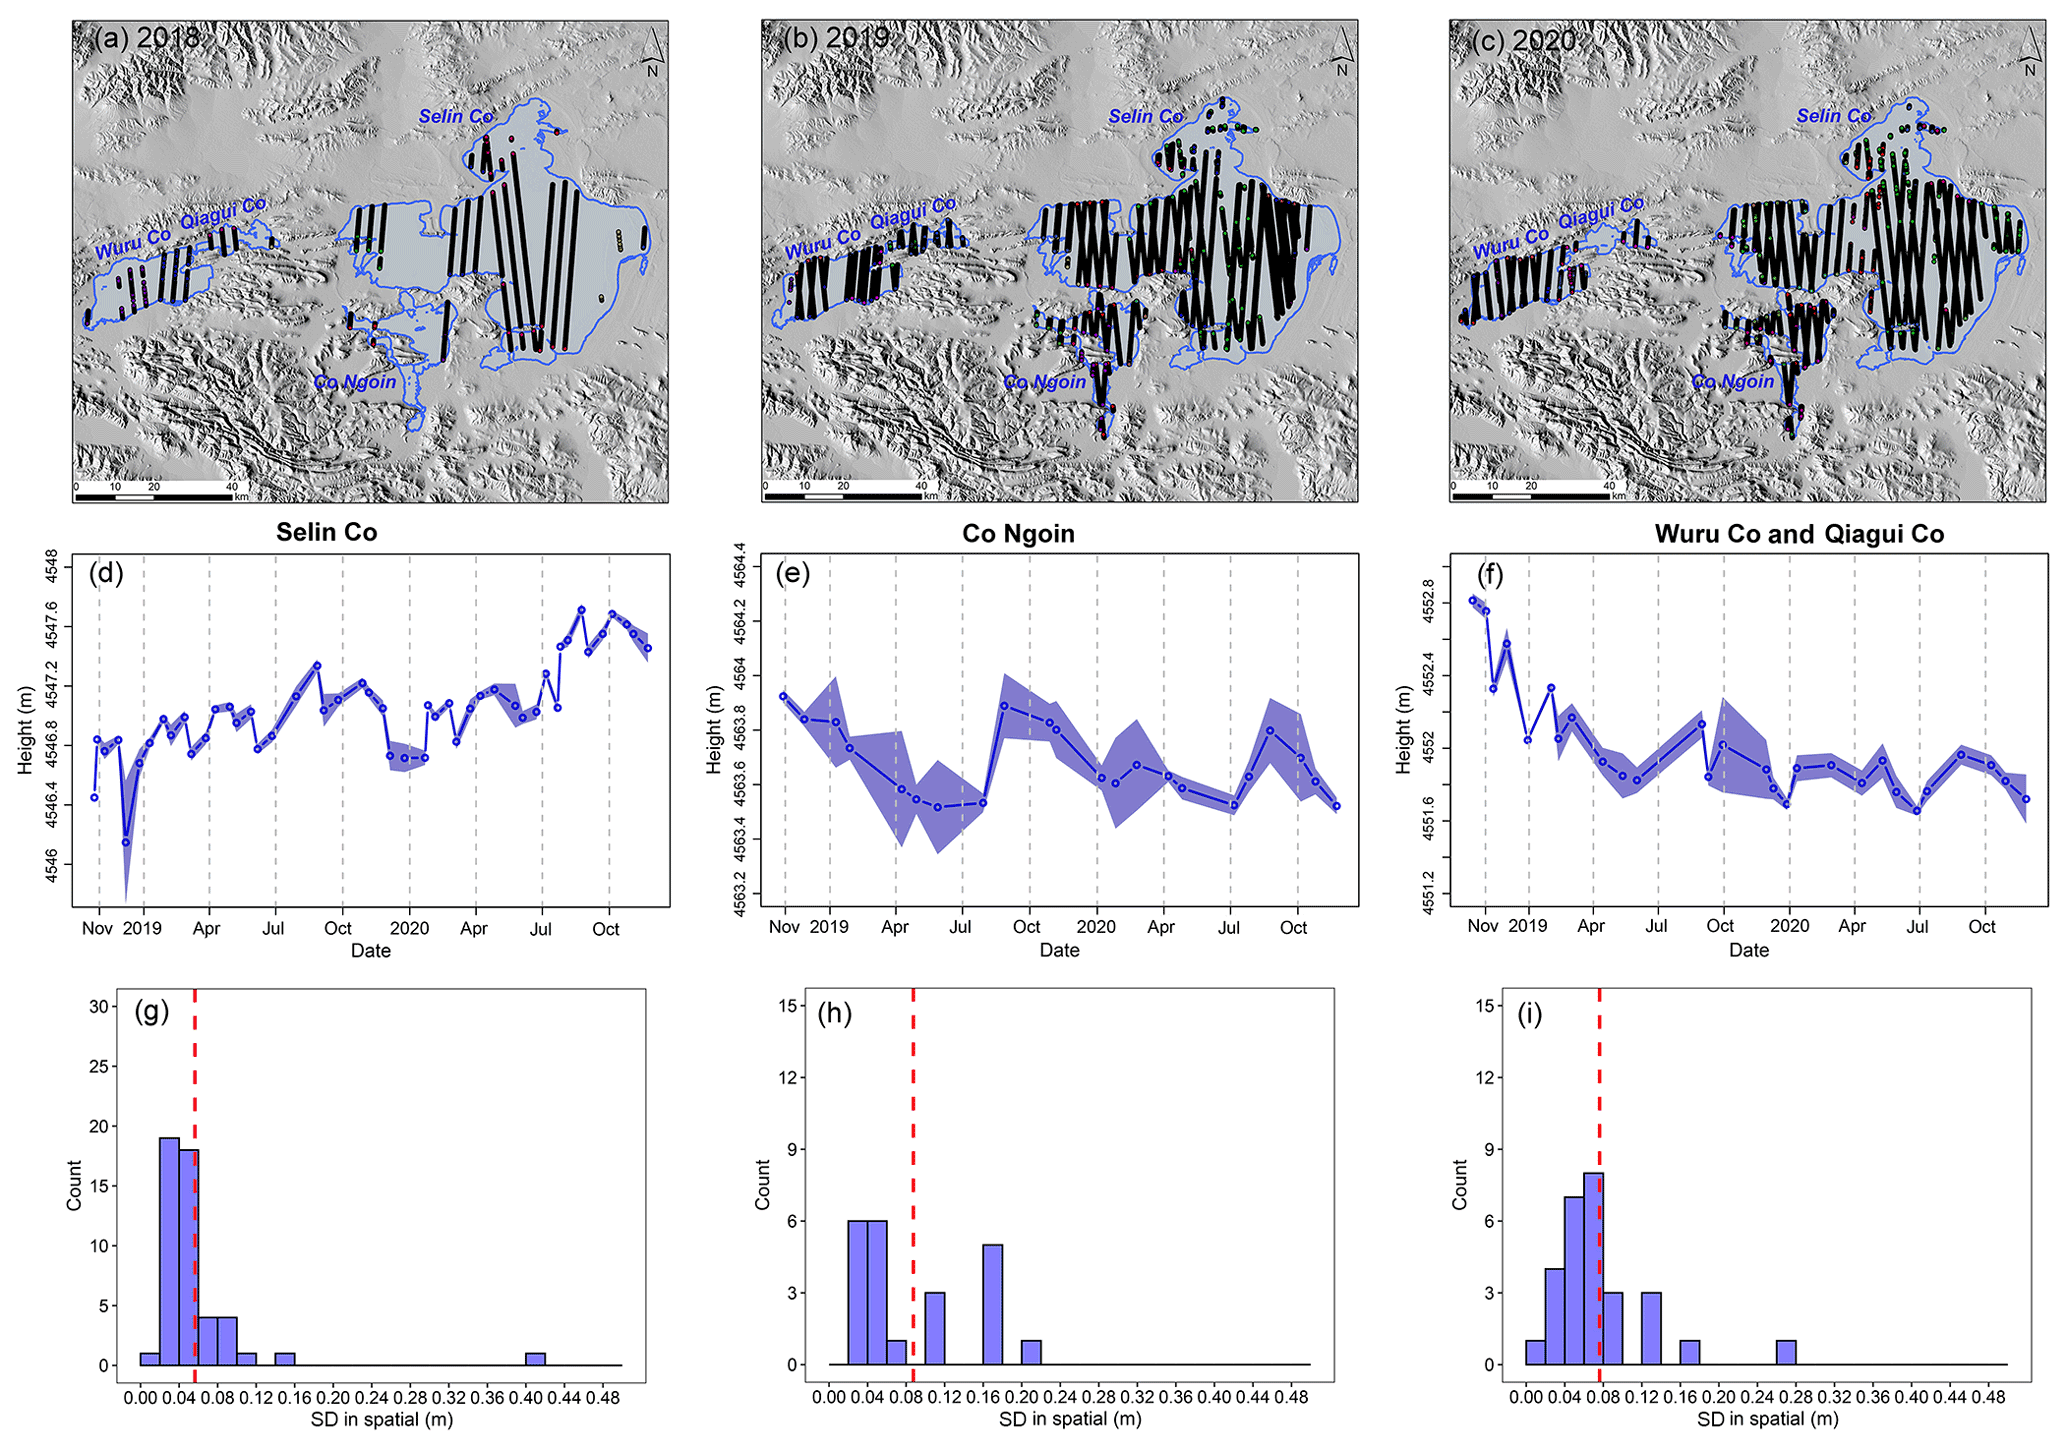
Figure 4Water surface elevations of the three lakes. Panels (a)–(c) show tracks of the elevation measurements for each year. Panels (d)–(f) show the ICESat-2-derived elevations. The solid lines indicate the average values of all elevation measurements within the lake on a given date. The light-colored areas show the mean ± 1 standard deviation. Panels (g)–(i) further show histograms of the standard deviations of the water surface elevation of the lake from all acquisition dates. The dashed red line indicates the mean value.
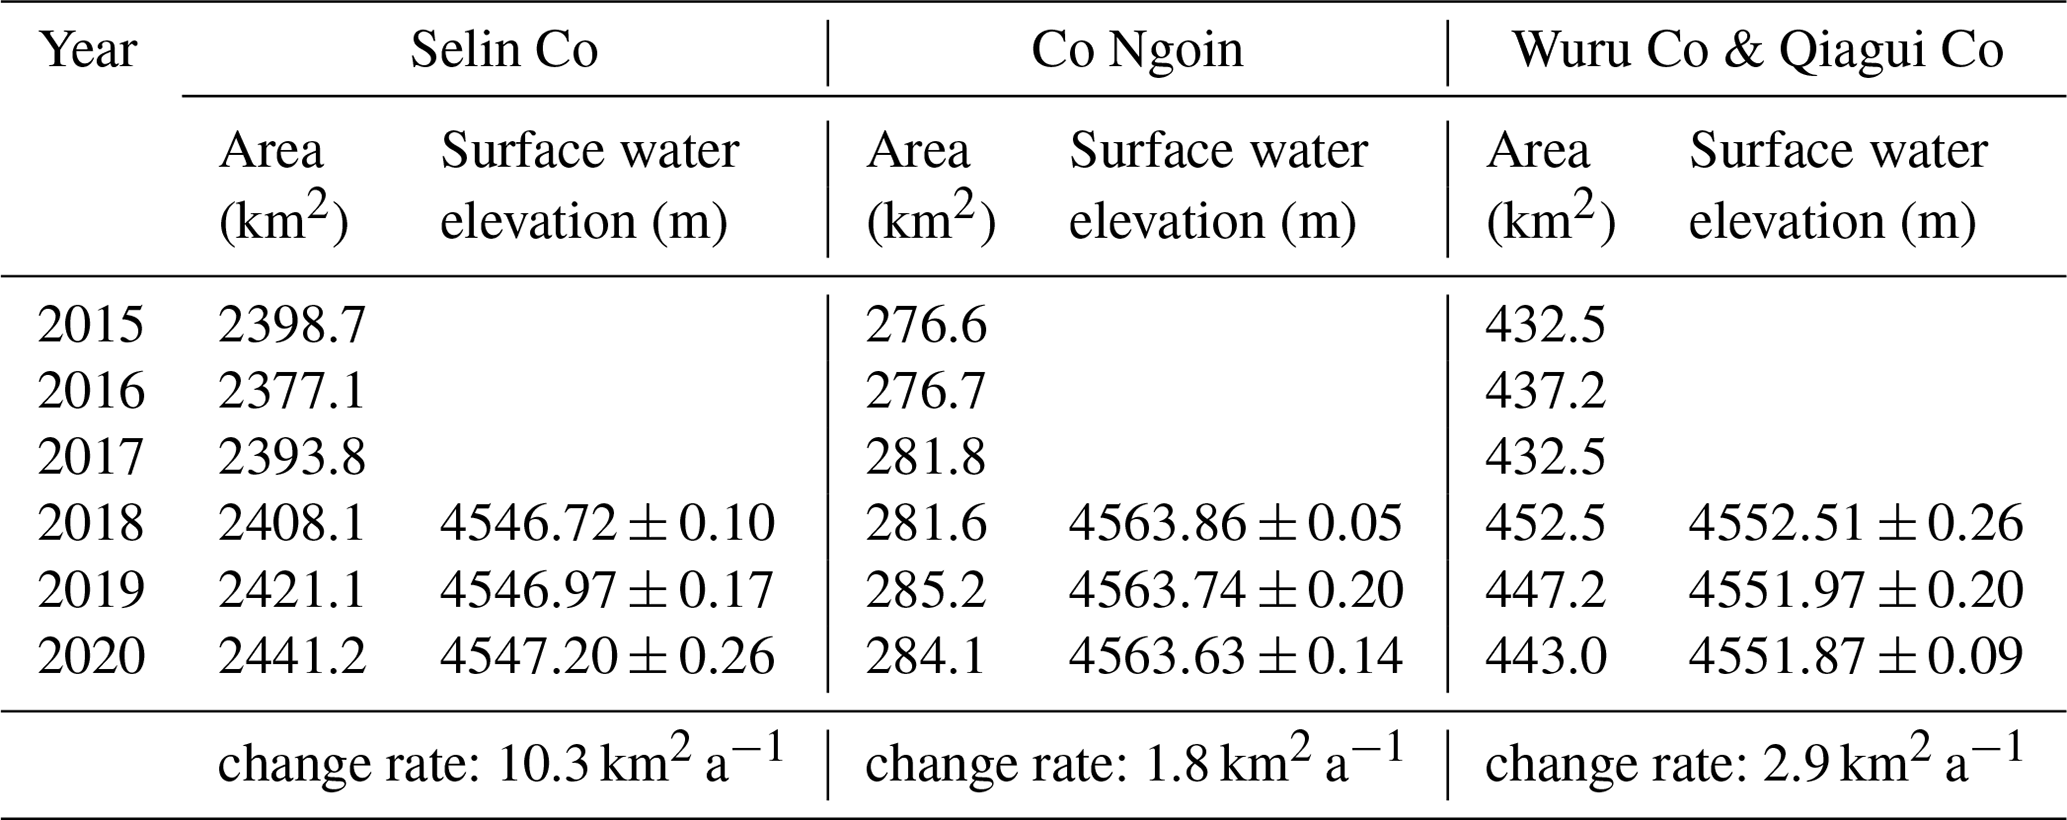
Table 3Lake areas and surface water elevations. Lake elevations are presented as the mean ± 1 standard deviation of all elevation measurements of the lake within the year. The tracks of the ICESat-2 elevation measurements are shown in Fig. 4a–c.
3.4 Conversion from surface deformation into ground ice meltwater contributions
A considerable amount of ground ice is always buried in permafrost regions, especially just below the permafrost table (Cheng, 1983; Mackay, 1983; French and Harbor, 2013). Thawing of the uppermost permafrost layer is always accompanied by the compaction of sediment and subsidence of the ground surface due to the melting of super-saturated ground ice (French, 2017). Hence, the higher the ice content in permafrost, the larger the surface subsidence that occurred as it was thawed. In this study, we assume that the cumulated long-term settlement is equal to the thickness of ground ice melted and then released to the hydrological cycle. We converted the deformation rate into the ground ice meltwater via the following steps.
- (i)
Masking areas with slope angles >10∘.
On steep slopes, deformation occurs mainly as downslope movements are driven by gravity (Buckel et al., 2021; Reinosch et al., 2020); thus, we considered only areas with slope angles below 10∘. This threshold of 10∘ was adopted based on previous works (Reinosch et al., 2020; Buckel et al., 2021).
- (ii)
Masking areas with the LOS periodic (seasonal) amplitudes ≤1.5 mm or long-term velocities ≤2.5 mm a−1.
These thresholds were similarly set based on previous works (Daout et al., 2017; Buckel et al., 2021) and field surveys. The periodic seasonal threshold was used to mask areas that were unaffected by permafrost activity (because they do not experience periodic frost heave and thaw subsidence) but exhibited continuous surface uplift or subsidence. Areas with periodic (seasonal) amplitudes below 1.5 mm and long-term (inter-annual) velocities less than 2.5 mm a−1 were likely unmoving considering distortions in the InSAR phase and DEM error.
- (iii)
Conversion from surface deformation into ground ice meltwater.
Selin Co is located in the lowest area of the watershed, and the water released from thawing permafrost eventually enters the lake. The long-term deformation represents the elevation changes produced by ground ice change. Using Eq. (8), by multiplying the grid cell size, we can obtain the ice volume change for each grid cell and then sum all the cells to estimate the total ice volume contribution. Because the density of water is ∼1.0 g cm−3 and that of ice is ∼0.91 g cm−3, the ice volume is then multiplied by a factor of 0.91 to convert to the corresponding water volume:
where ΔVice is the change in the ground ice volume, Δh is the elevation change produced by the ice change, Cgrid is the area of a grid cell, and dv is the long-term deformation rate in the vertical direction.
4.1 Lake water storage changes
We analyzed the changes in the lake water storage of three large lakes within the Selin Co watershed: Selin Co, Co Ngoin, and the combination of Wuru Co and Qiagui Co. Figure 4 illustrates the water surface elevation time series of the investigated lakes derived by ICESat-2 during October 2018 and 2020. The tracks of the elevation measurements in these years are plotted in Fig. 4a–c. Table 3 lists the surface areas of the investigated lakes on the Landsat acquisition dates and summarizes the averaged water surface elevation from each lake, considering all the elevation measurements within each year. Selin Co expanded at a rate of 10.3 km2 a−1 from 2015 to 2020, and its surface water elevation increased at a rate of ∼0.2 m a−1 from 2018 to 2020.
To calculate the changes in the lake water storage of Selin Co, Eq. (1) was applied, taking the areas of 2408.1 km2 in 2018 and 2441.2 km2 in 2020 and taking the water surface elevation change of ∼0.4 m between these years; then, the change in lake volume from 2018 to 2020 was estimated, and finally, the annual volume change rate was obtained by dividing the results of 2018 and 2020. The annual rate of change in the lake volume of Selin Co during 2018–2020 was m3 a−1.
4.2 Ground surface deformation
4.2.1 Deformation at the borehole and GPR survey sites
The deformation time series at the seven borehole sites are shown in Fig. 5. The detected deformation properties are highly consistent with the field surveys. Sites SLC03 and SLC04 displayed the largest seasonal amplitudes of 13.8 and 16.6 mm, respectively; among all the borehole sites, these sites are the wettest and have the most developed vegetation cover, i.e., alpine swamp meadows with coverage higher than 90 %. These seasonal amplitudes are, to a large extent, caused by the water–ice phase changes in the freeze–thaw cycle and are thus extremely sensitive to the water content in the active layer (Chen et al., 2020). Permafrost can hold more water in the active layer than seasonally frozen ground; this is why site SLC05 in seasonally frozen ground displayed the smallest seasonal oscillation of 0.5 mm. Excess ice was found in the SLC04 borehole; correspondingly, the largest subsidence velocity of 18.9 mm a−1 was observed at this site. Likewise, SLC02 and SLC03, in which ground ice was found, showed different levels of subsidence. Site SLC05, which is seasonally frozen and located in a river valley between two rivers, exhibited an uplift of 3.2 mm a−1, which might be because of sedimentation.
We also examined the deformation characteristics at the GPR survey sites. Among the 20 GPR segments where permafrost existence was confirmed, the seasonal amplitudes were all larger than 2.0 mm, with a maximum amplitude of 16.2 mm and an average of 8.2 mm.
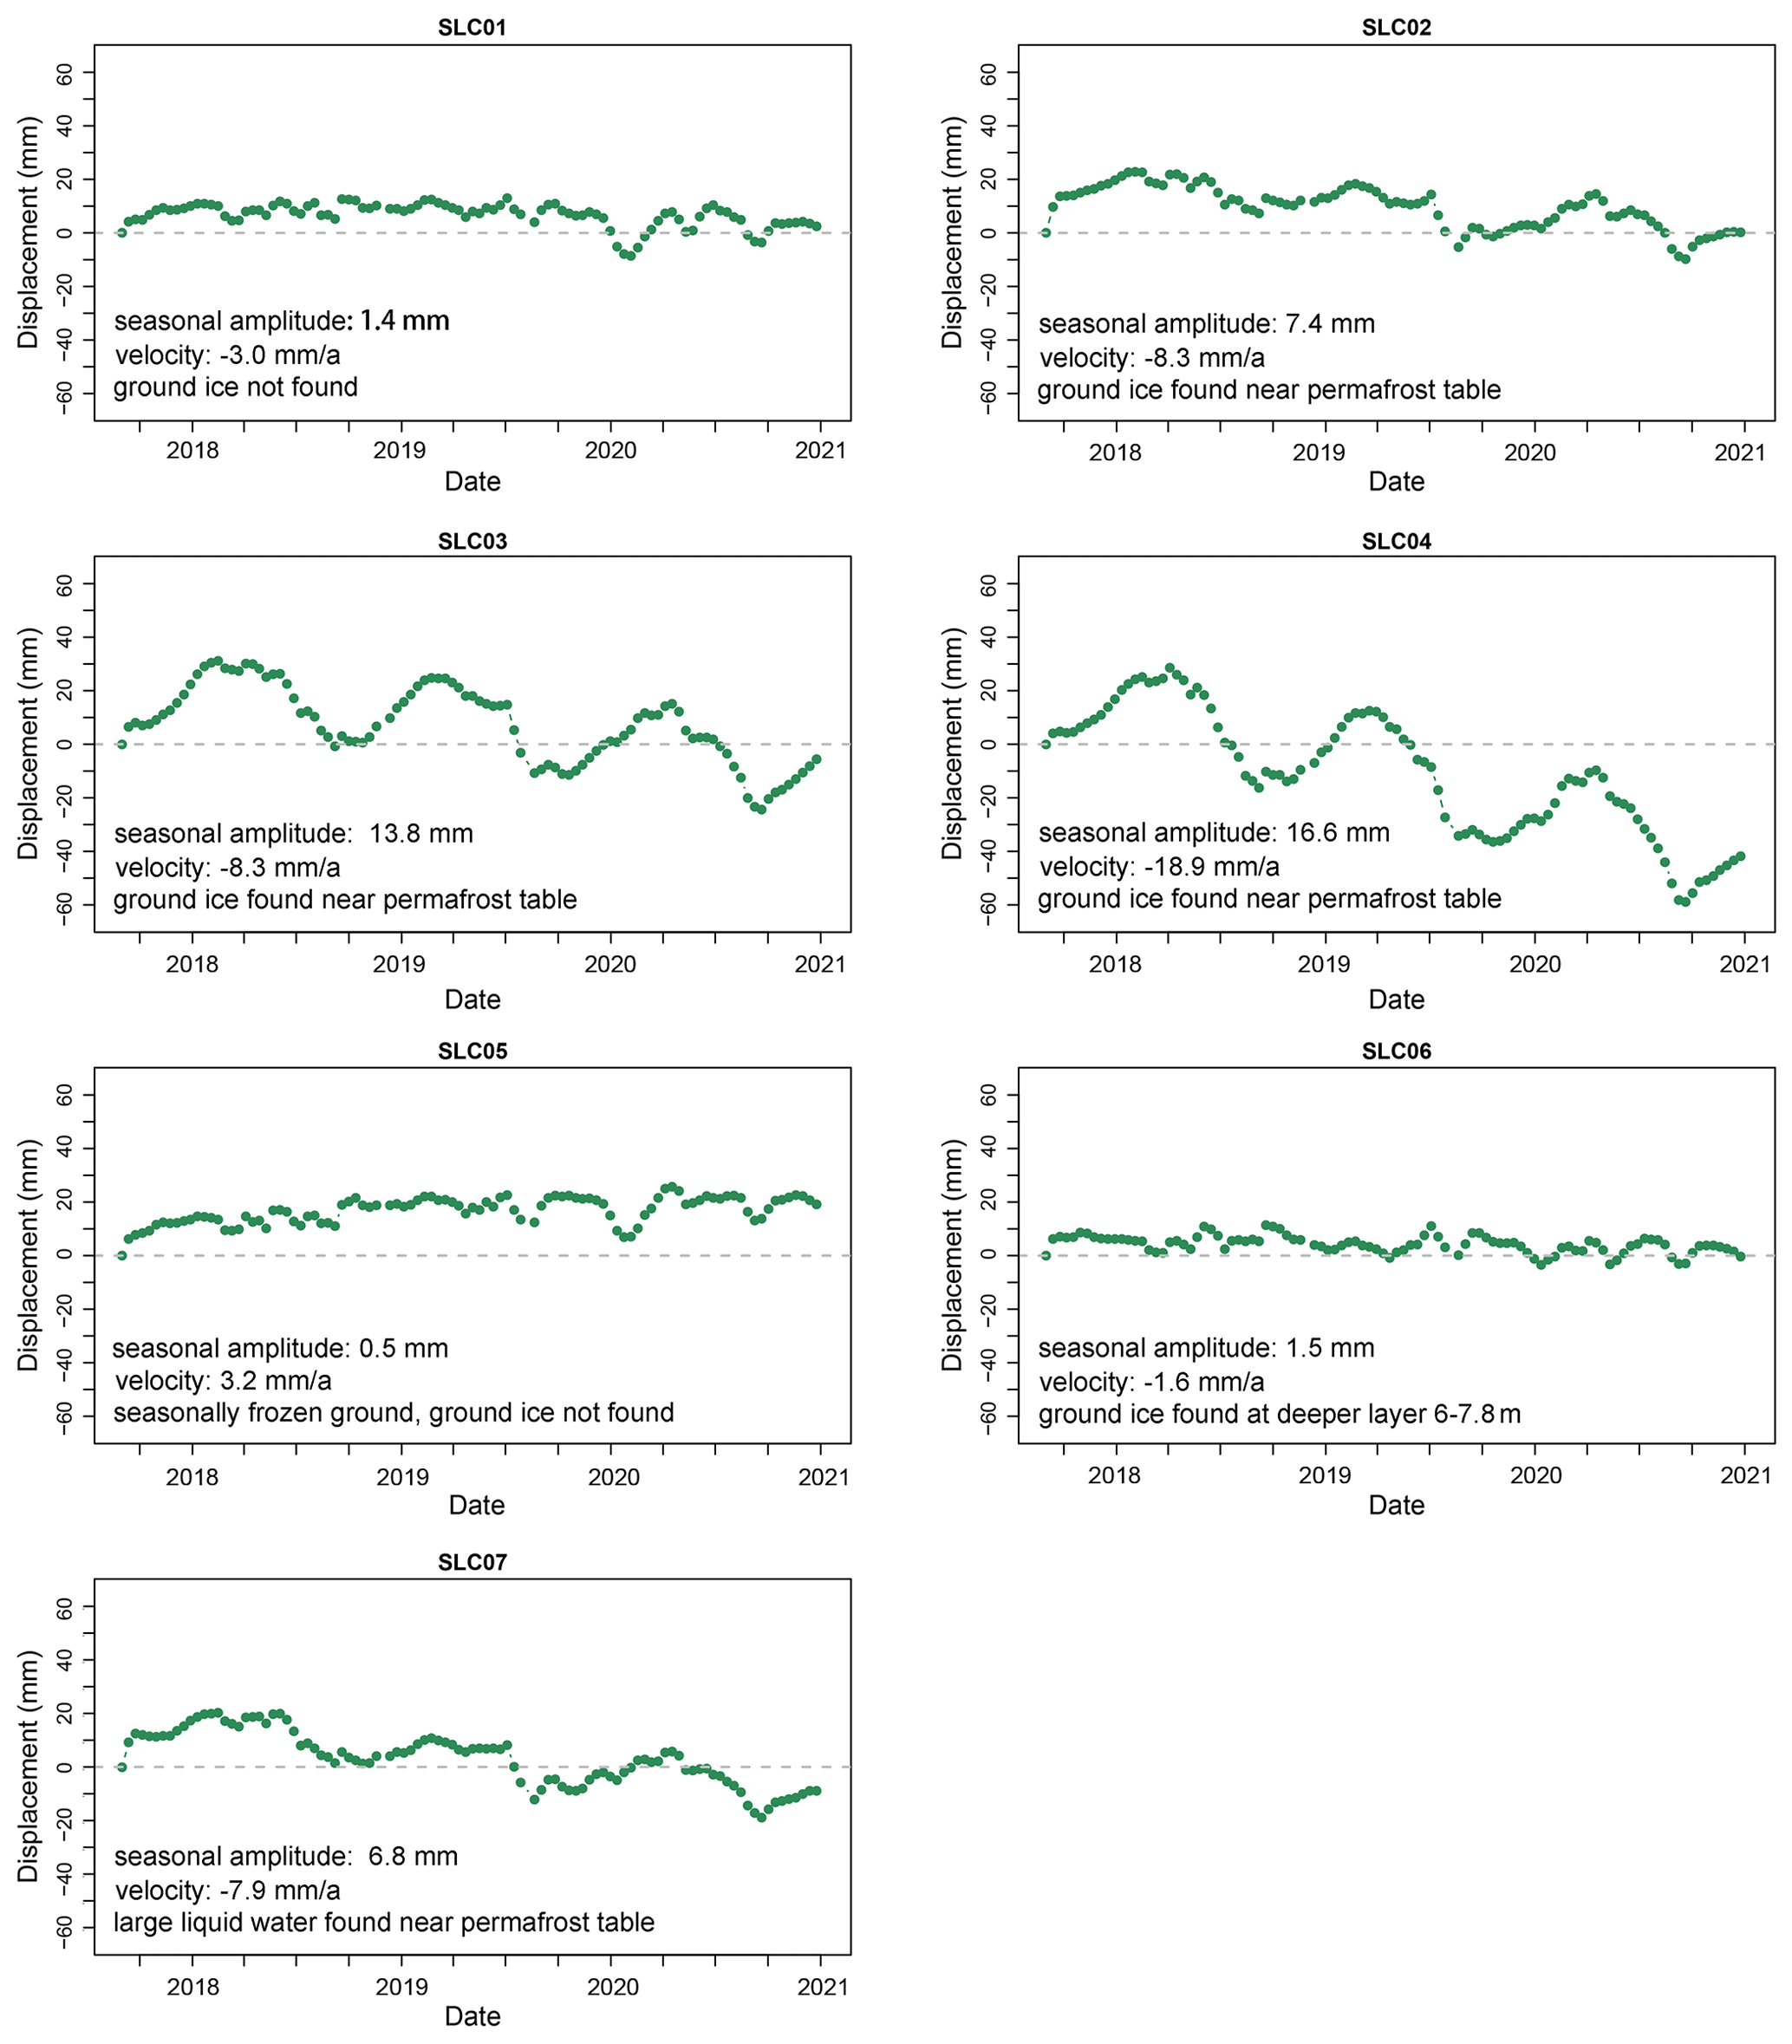
Figure 5LOS deformation time series at the seven borehole sites. Positive values represent uplift, and negative values represent subsidence relative to the first scene of the S1 datasets.
4.2.2 Spatial distributions of the seasonal amplitude and long-term deformation rate
Figure 6 shows the spatial distributions of the periodic (seasonal) amplitude and long-term (inter-annual) deformation rate, both of which are in accordance with the permafrost distribution map (Fig. 1). The boundary in Fig. 1 differentiating continuous permafrost from seasonally frozen ground exactly matches the boundaries observed for the seasonal amplitudes in Fig. 6a and b and the long-term deformation rates in Fig. 6c and d. As shown in Fig. 6, widespread and large subsidence and large seasonal amplitudes are located in the upstream portion of the Zhajiazangbu subbasin southeast of Mt. Geladandong (alternately Mt. Geladaindong), where widespread continuous permafrost is present. Figure A2 provides the deformation map covering the field investigation region.
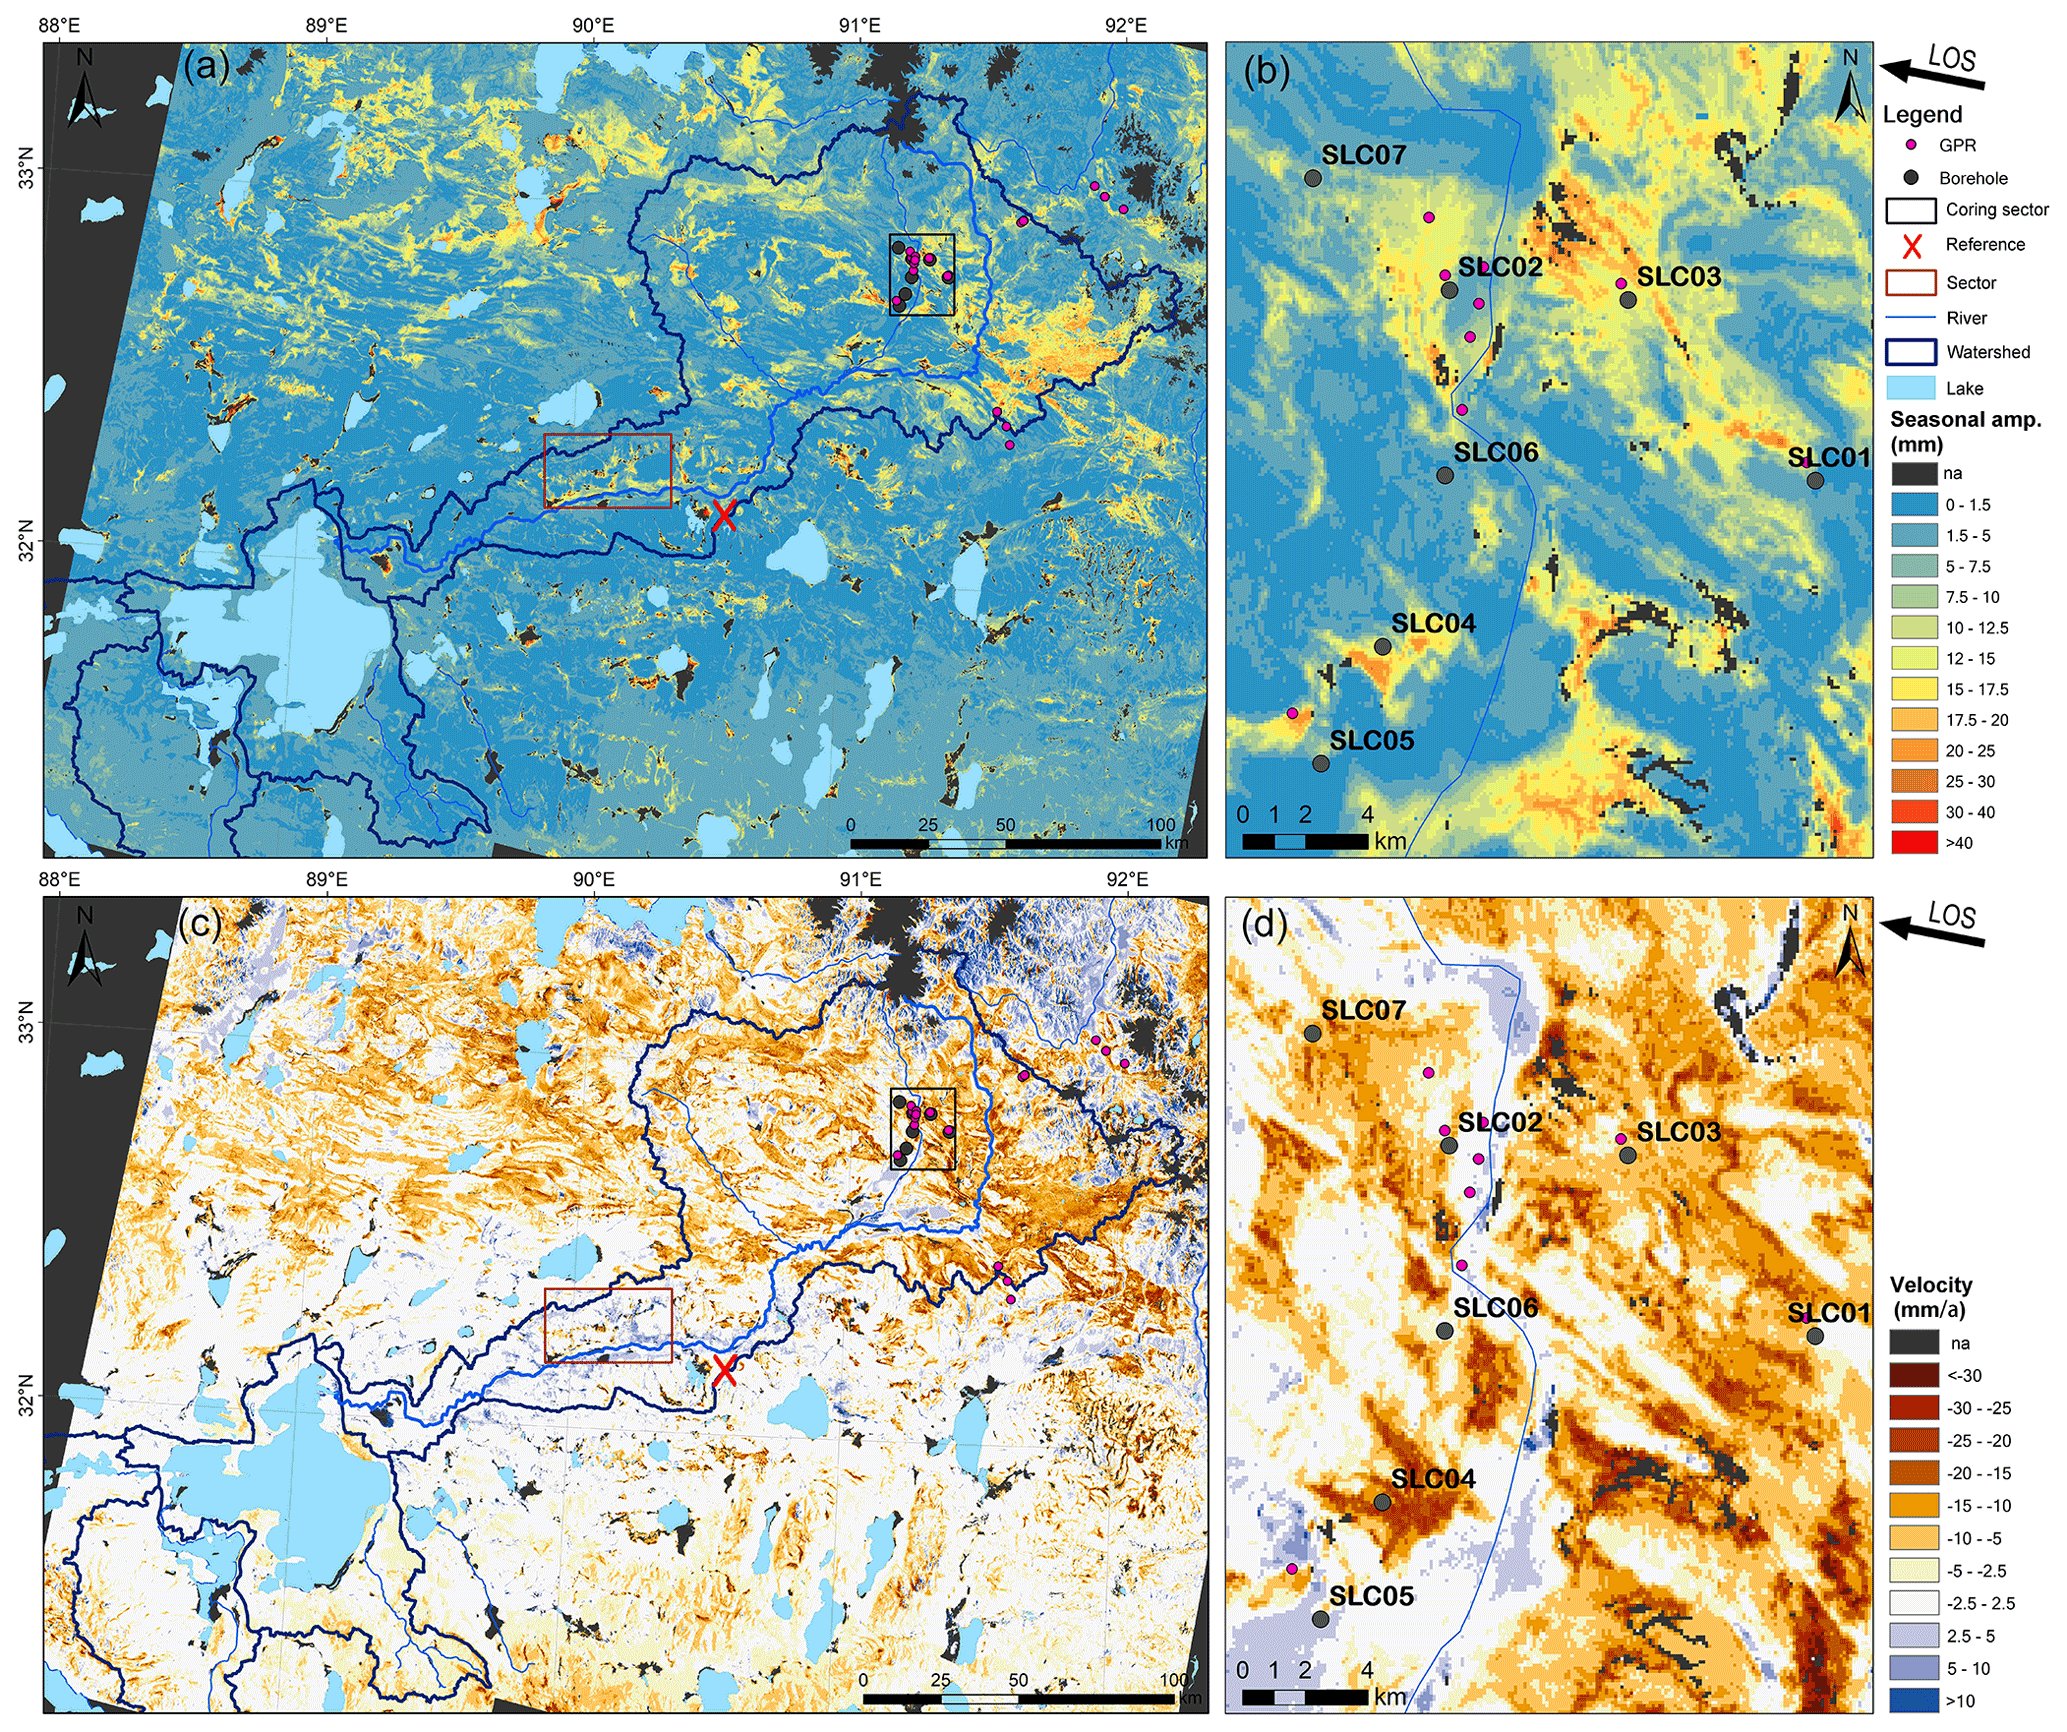
Figure 6(a, b) Maps of the periodic (seasonal) amplitude and (c, d) maps of inter-annual deformation velocity, all in the satellite LOS direction. Panels (b) and (d) show an enlarged view of the coring area (black sector in panels a and c). Dark-grey-colored “na” means the information could not be retrieved because of no data or decorrelation.
Figure 7 shows a density plot of the seasonal amplitude versus the deformation rate. Subsidence in the Selin Co watershed was normally between 5 and 20 mm a−1 (see the statistical details in Table 4) but reached 50 mm a−1 in certain regions, reflecting highly excessive volumes of ice and rapid ice loss in this region. The seasonal amplitude ranged between 0 and 60 mm within the watershed area. In the Zhajiazangbu subbasin with extensive permafrost, among the areas with deformation rates greater than 2.5 mm a−1, 0.1 % of them had seasonal amplitudes greater than 30 mm, 2.2 % had amplitudes between 20 and 30 mm, 24.1 % had amplitudes between 10 and 20 mm, 23 % had amplitudes between 5 and 10 mm, and 50.6 % had amplitudes of less than 5 mm; overall, the average seasonal amplitude was 6.9 mm.
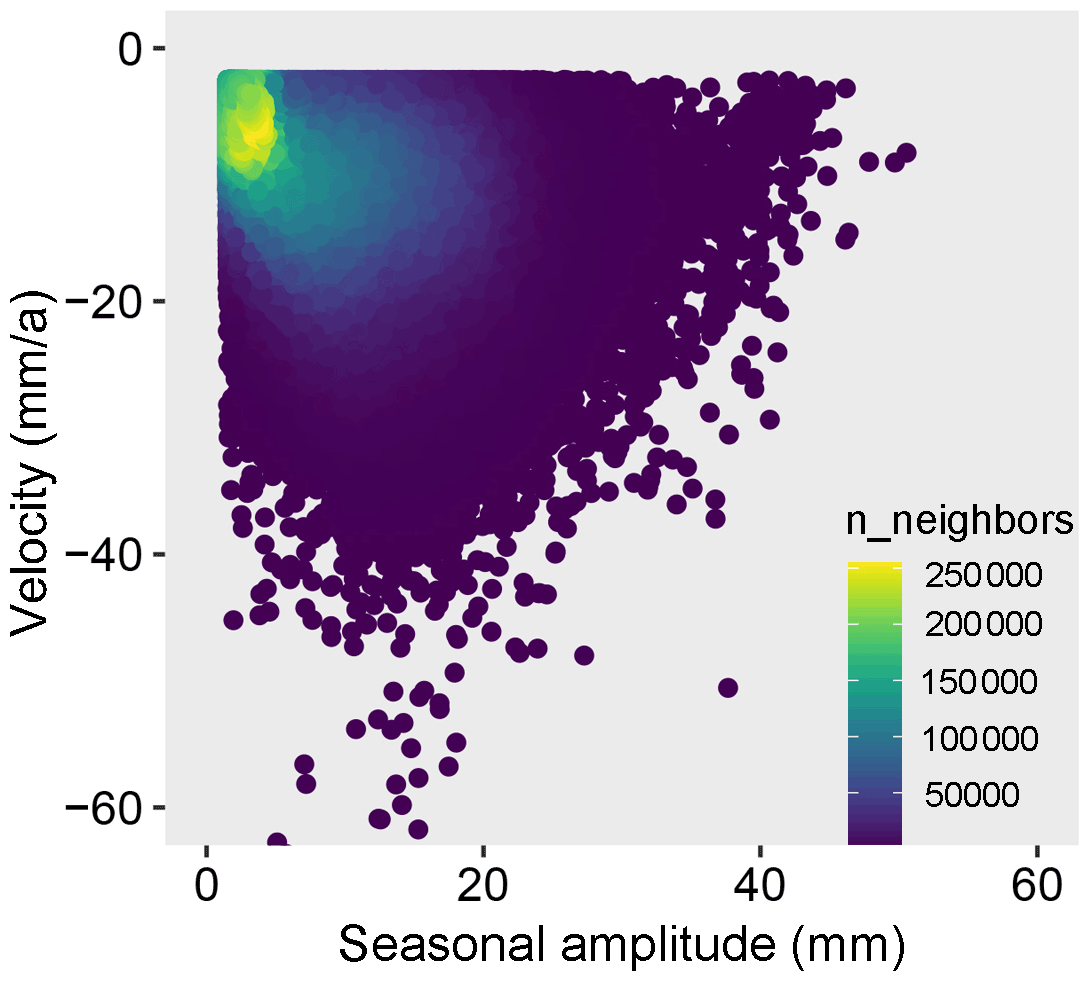
Figure 7Distribution of the LOS seasonal amplitude versus the LOS deformation velocity within the Selin Co watershed, in all 6.57×10⁵ valid pixels.
Table 4Characteristics of terrain subsidence in the Selin Co basin.

4.3 Water contributed by ground ice melting
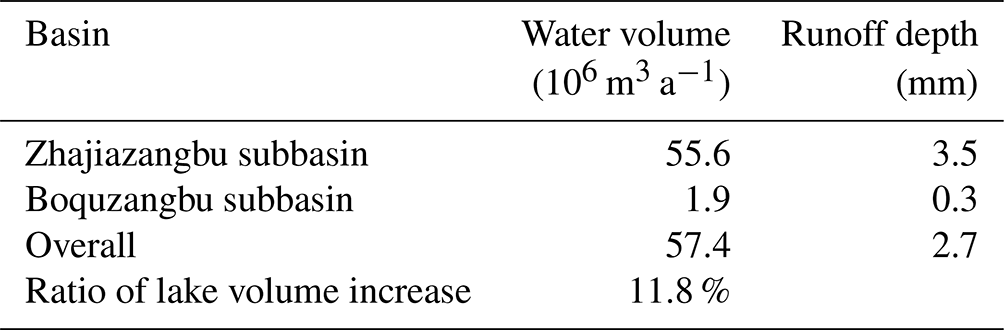
Figure 8 shows a map of the potential volume of water contributed by changes in permafrost ground ice. Table 5 lists the statistics of the potential water contribution volume for the Selin Co basin. The main contribution comes from the Zhajiazangbu subbasin, where the permafrost coverage is 66.2 %, whereas the contribution from the Boquzangbu subbasin is limited. The potential rate of ground ice meltwater generation was 55.6×10⁶ m3 a−1 in the Zhajiazangbu subbasin and 1.9×10⁶ m3 a−1 in the Boquzangbu subbasin, and the overall rate was 57.4×10⁶ m3 a−1. Compared to the rate of change in the lake water storage of Selin Co (485×106 m3 a−1), we obtained a ground ice meltwater contribution ratio of 11.8 %. Converting the potential water contribution volume into the runoff depth within the watershed yields a 2.7 mm a−1 increase in the runoff depth.
4.4 Uncertainty analysis
4.4.1 Uncertainties in and accuracies of lake volume changes
Figure 4d clearly shows that the water surface elevation of Selin Co has increased gradually, although seasonal fluctuations are evident as well. Selin Co has 49 ICESat-2 acquisitions during the investigation period (Fig. 4g), and 69.4 % of these acquisitions correspond to elevation measurements with a standard deviation smaller than 0.05 m within the lake. This means that the average values of all elevation measurements within the lake could represent the lake's elevation on a given date. To evaluate the accuracy of the resulting lake area extent, we validated the classification results by randomly selecting 1000 pixels from the Landsat images and visually examining the classification results. The classification accuracy reached approximately 0.98.
4.4.2 Uncertainties in and accuracies of deformation
Two indicators evaluated the quality of unwrapped phases and inverted raw-phase time series: the phase closure of interferogram triplets and temporal coherence. Figure 9 shows the spatial distribution of the number of interferogram triplets with nonzero integer ambiguity Tint (Eq. 4), with the histogram illustrating the distribution of Tint values within the Selin Co watershed excluding glaciers and waterbodies. The areas with Tint smaller than 3 comprise 95 % of the watershed, while 72.3 % of the watershed has a Tint value of zero (no wrapping error on all the interferograms). Tint evaluated the quality of original interferometric unwrapped phases; the unwrapping errors could be further reduced by bridging reliable regions before network revision (Y. Zhang et al., 2019).
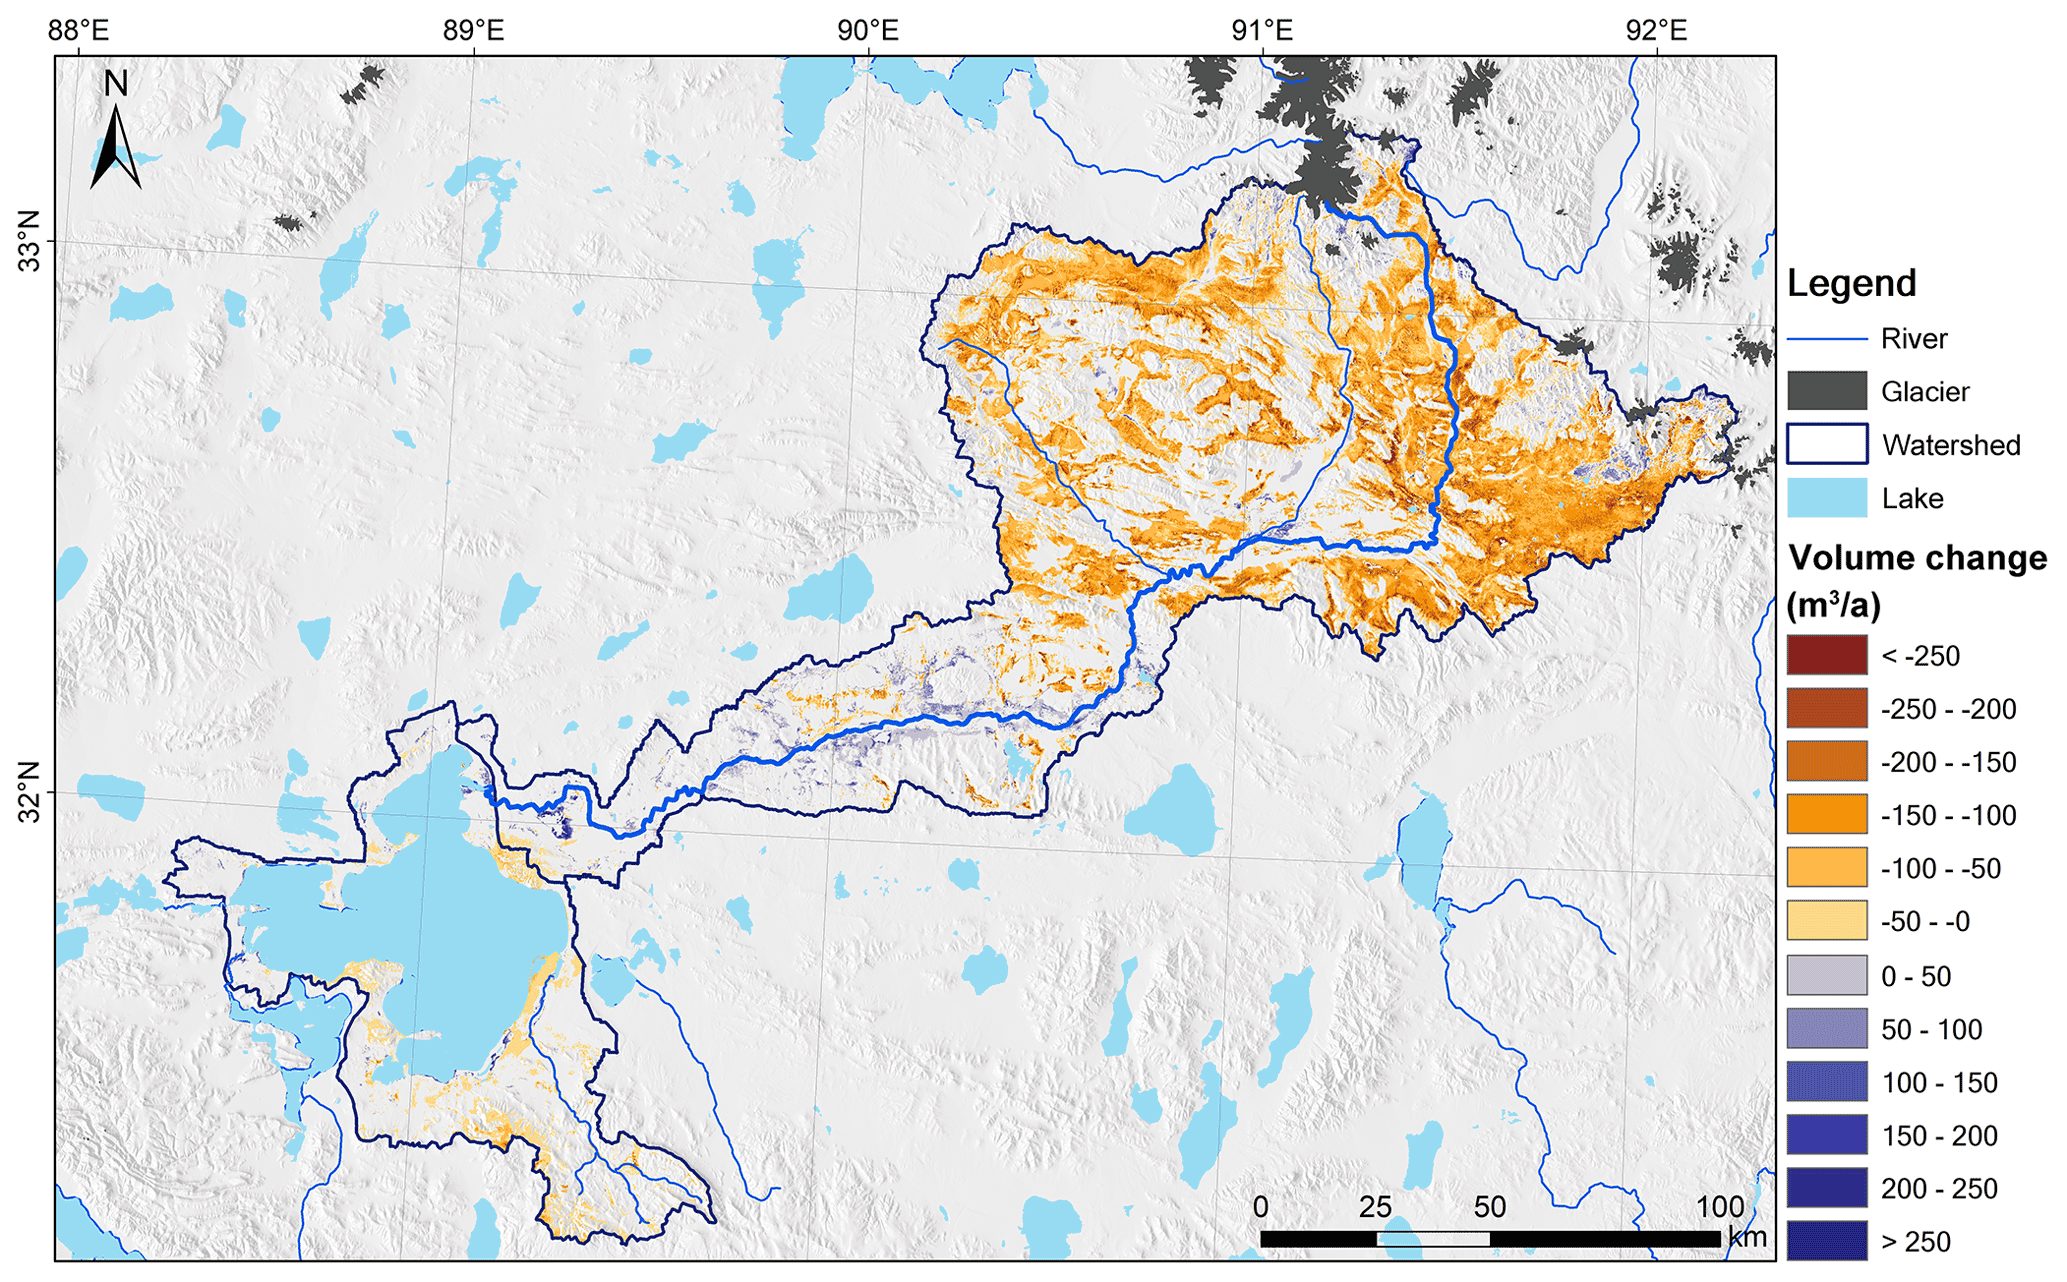
Figure 8Map of the potential ground ice melting water supply. The grid color represents the grid cell's yearly ground ice melting water supply volume, with negative values indicating ground ice loss and meltwater release.
Figure 10 shows the spatial distribution of temporal coherence (Eq. 5), which is used to evaluate the quality of raw-phase time series. Of the watershed, 99.0 % has temporal coherence higher than 0.8, 98.1 % has temporal coherence higher than 0.85, 96.0 % has temporal coherence higher than 0.9, and 89.1 % has temporal coherence higher than 0.95.
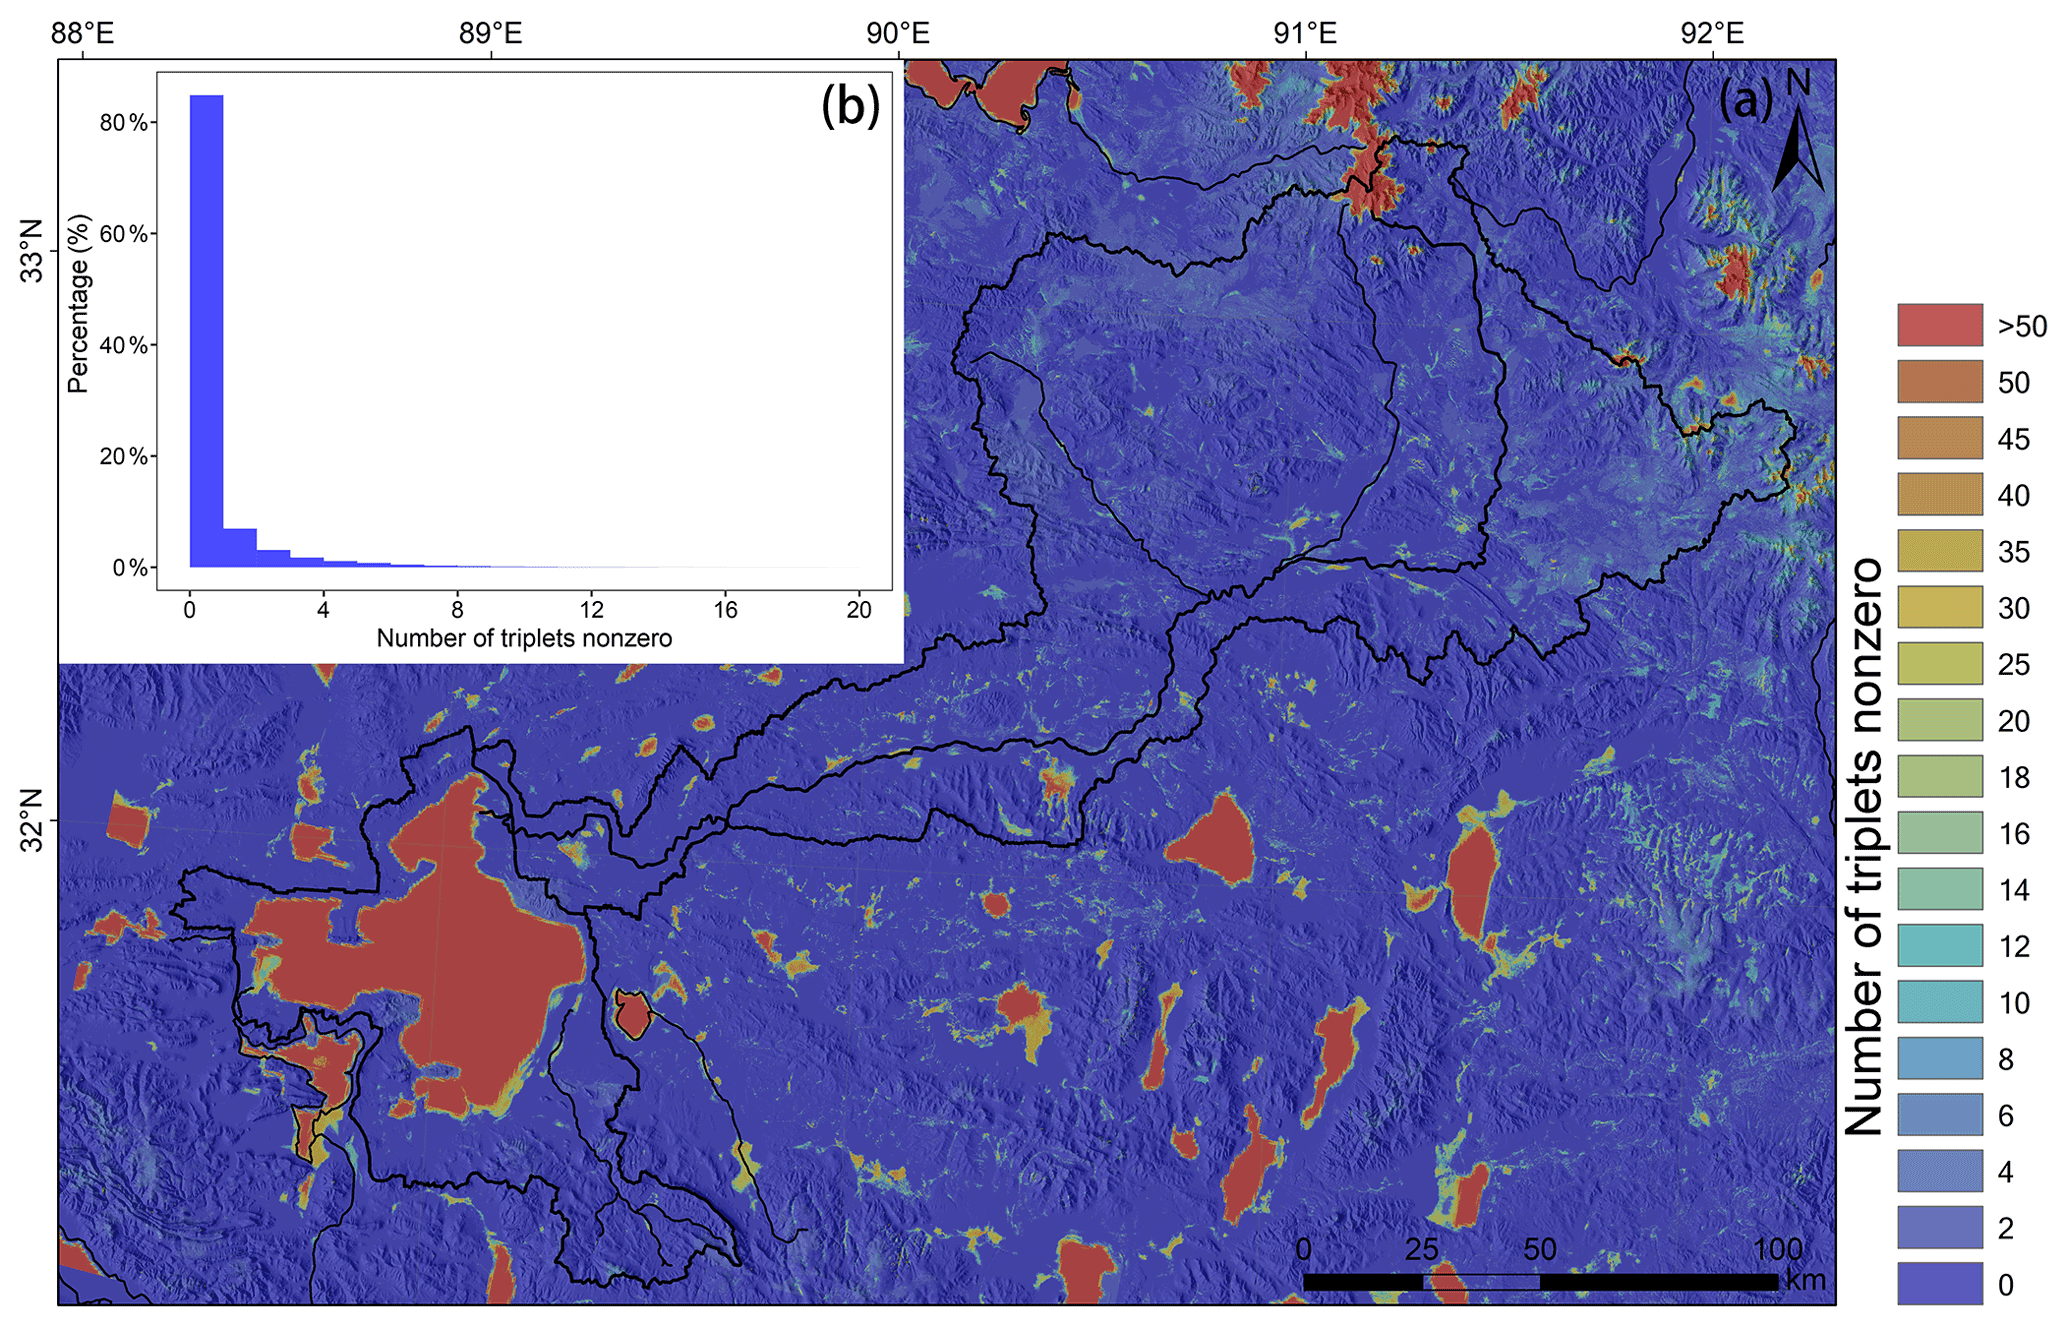
Figure 9(a) Map of the number of interferogram triplets with nonzero integer ambiguity Tint (Eq. 4), (b) histogram illustrating the distribution of Tint values within the Selin Co watershed excluding glaciers and waterbodies.
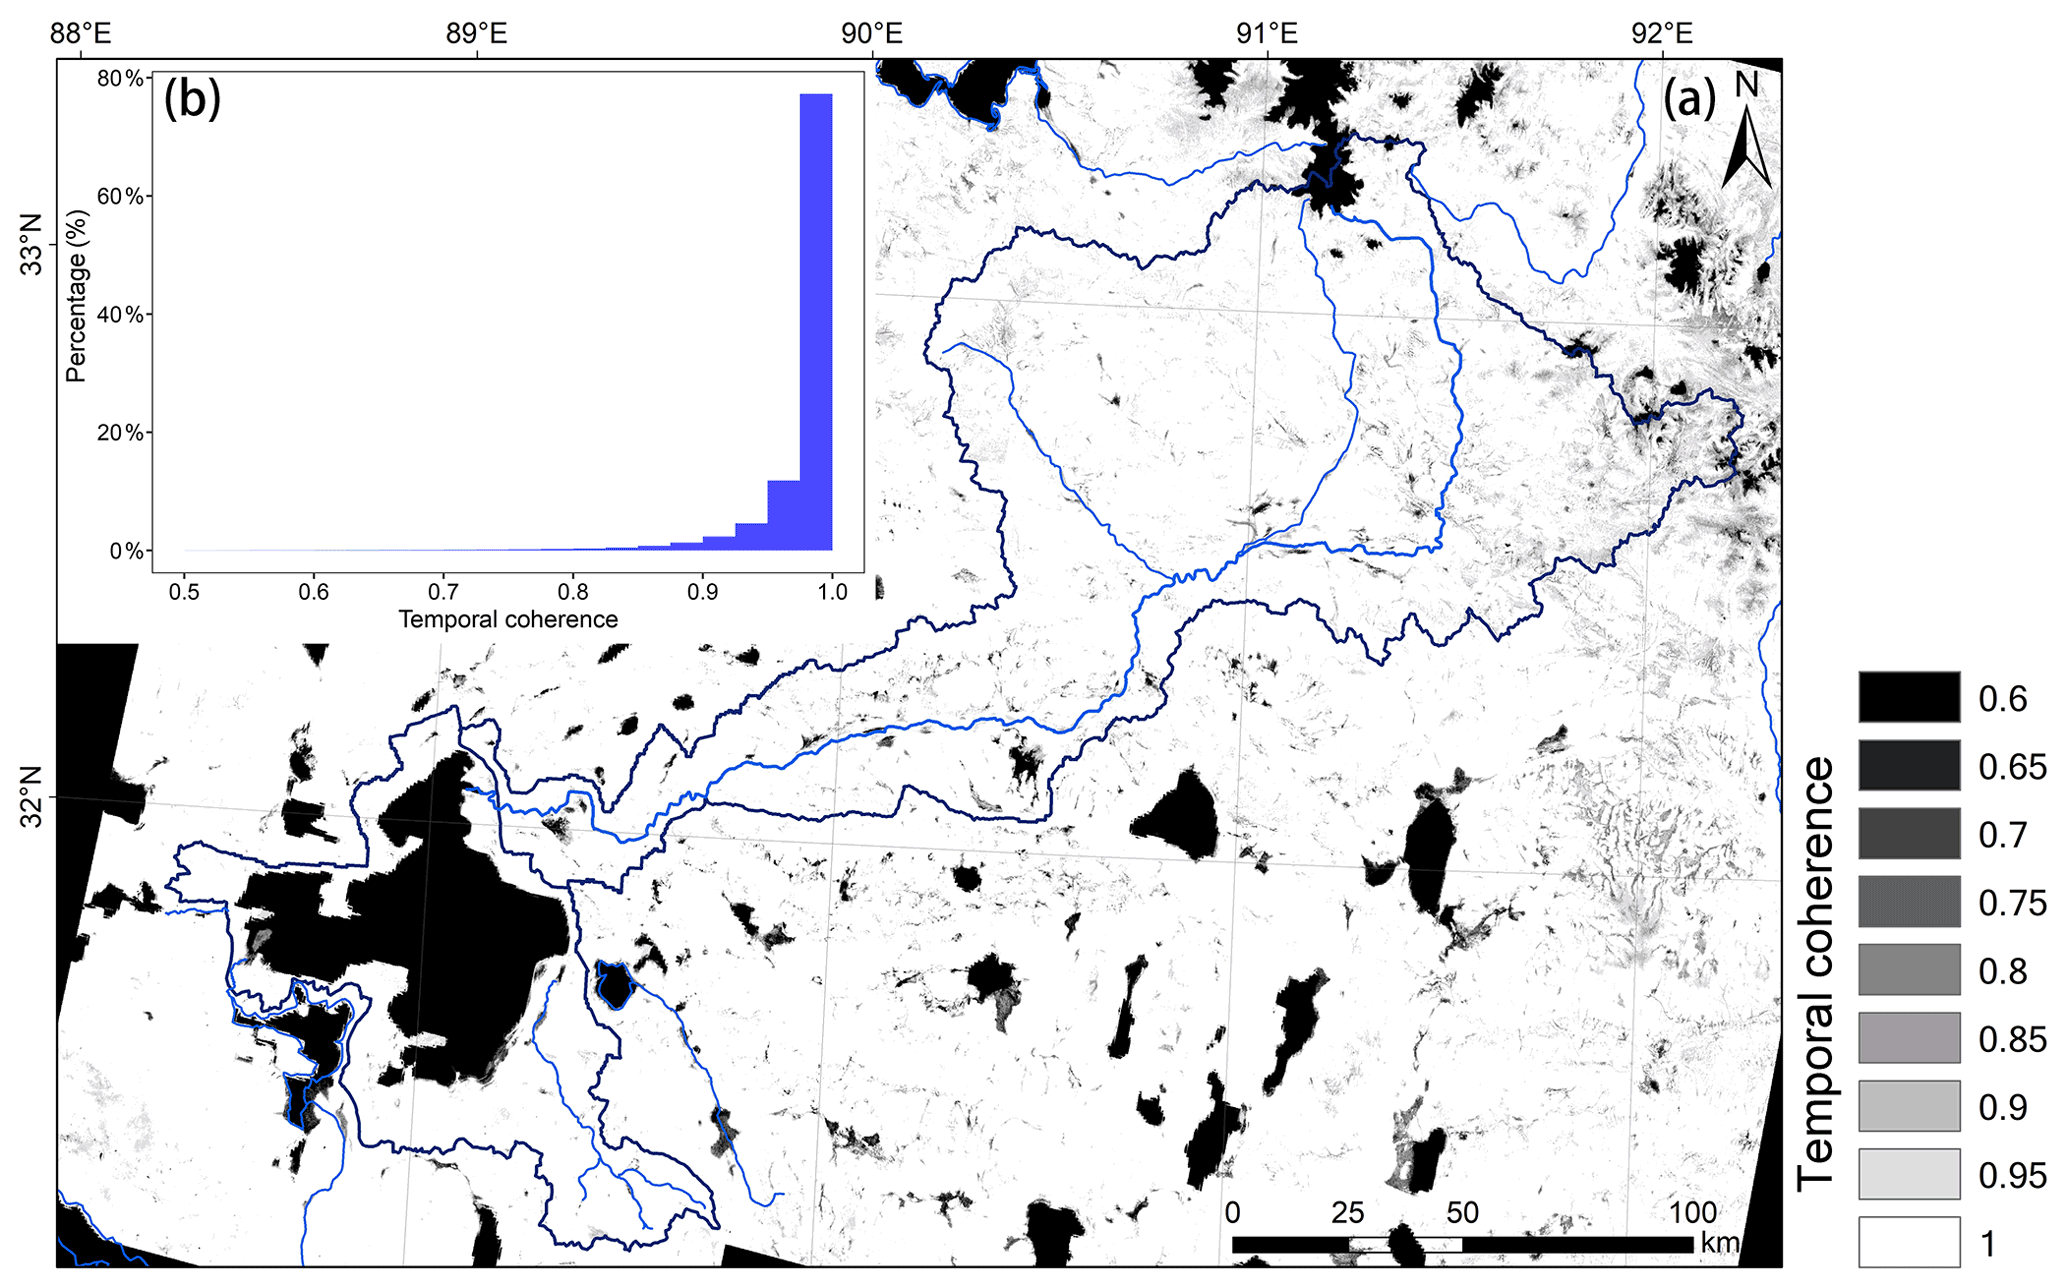
Figure 10(a) Map of temporal coherence (Eq. 5). (b) Histogram illustrating the distribution of temporal coherence values within the Selin Co watershed excluding glaciers and waterbodies.
The Selin Co basin was covered by two orbits of S1 images: orbit 48 and orbit 150. Figure A3 presents the amplitude and long-term velocity retrieved from orbit 48 and orbit 150, respectively. Figure A4 shows the velocity distributions in the overlapping area. In the large overlapping area covering 250 km × 50 km, the results from orbit 150 and orbit 48 reveal almost the same deformation characteristics and value ranges (for long-term velocity, mm a−1 for orbit 48 and mm a−1 for orbit 150). This confirms that the seasonal amplitudes and deformation rates extracted from the two orbits are robust even though the acquisitions from the two orbits are not identical (Table A1).
In addition, the deformation characteristics were compared with the observations from the boreholes, and excellent agreement was achieved. We also validated the SBAS-InSAR-derived deformation (which has the same processing flow as applied in this study) with the in situ leveling measurements at the Wudaoliang site on the TP; the relative error was found to be 14.8 % regarding the long-term deformation rate (Zhou et al., 2019). Furthermore, we are currently operating an automatic deformation monitoring device in the watershed, and it is expected to provide an independent validation reference.
4.4.3 Uncertainties in the slope angle threshold in the estimation of ground ice meltwater
During the estimation process, we masked regions with slopes steeper than the threshold of 10∘. We also tested the impact of setting slope thresholds of 15 and 20∘ on the results. When using the 15 or 20∘ threshold, the volume of meltwater released changed by less than 1 %. Hence, the setting of the threshold does not greatly influence the final prediction.
Table 5Yearly volume of ground ice meltwater contribution in the Selin Co watershed.
5.1 Uplift displacement signal
In addition to widespread subsidence detected upstream of Zhajiazangbu in the continuous-permafrost environment, the uplift signal was also observed in the sporadic permafrost environment in the middle stream of the Zhajiazangbu subbasin, also near some drained ponds. Figure 11 shows a sector (location marked in red rectangle in Figs. 1b and 6) in which both subsidence and uplift signals are detected. The mean annual air temperature is −2.0 ∘C, calculated based on ERA5-Land air temperature hourly reanalysis data during 2017–2020. For a better interpretation, Landsat optical imagery and elevation overlaid on hillshade are also presented. The spatial distribution pattern of deformation aligns with landscape and topography very well. Large seasonal amplitude only appears in the vegetated and wet area, which indicates the water storage in the active layer in a certain way. Uplift signals are generally at the slope feet. Figure 11e–h display the deformation time series of four sites, s1–s4, from high elevation to low elevation. Site s2 is stable, in terms of seasonal amplitude and long-term deformation velocity. The subsidence of site s3 is the result of ground ice melting, confirmed by the large periodic seasonal amplitude caused by frost heave and thaw subsidence in the active layer. The uplift signals of site s1 and site s4 are worth exploring, especially site s4. Site s4 has the possibility of being related to ground ice aggradation since it also exhibits moderate seasonal amplitude, but it is more likely related to sediment accumulation or groundwater table rise regarding its location.
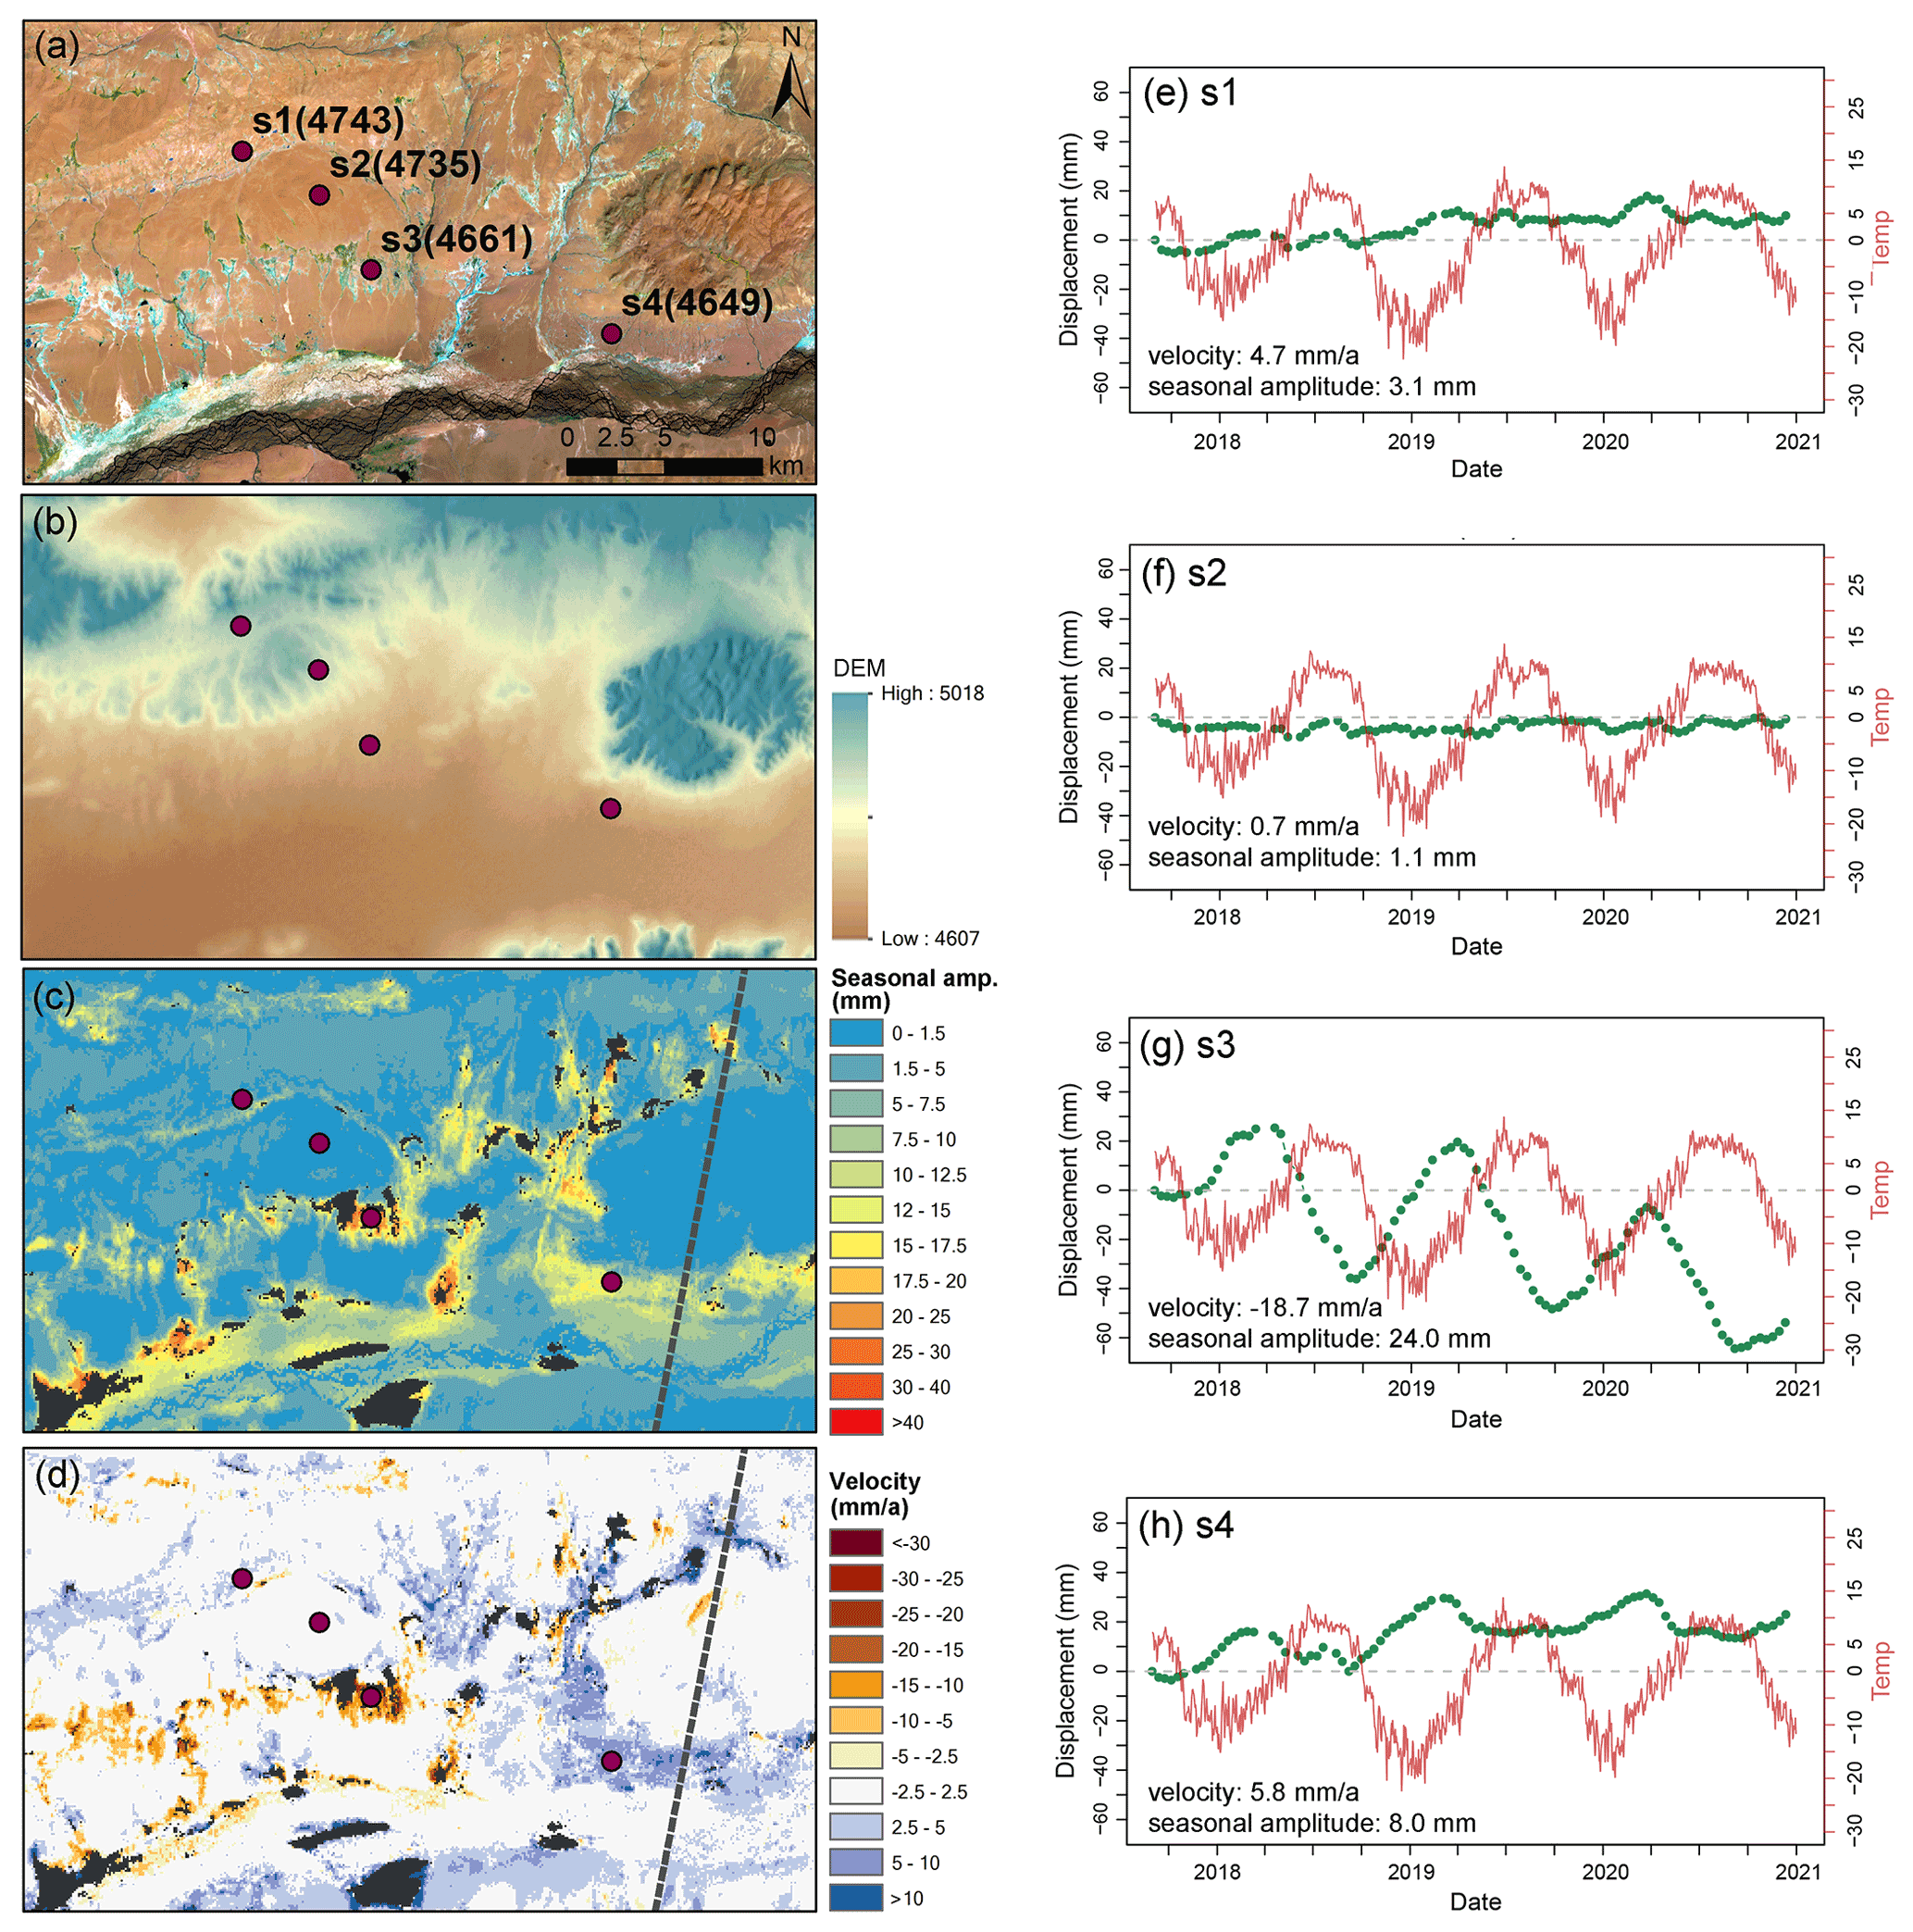
Figure 11Deformation characteristics. This sector is marked with the red rectangle in Figs. 1 and 7–8. (a) Landsat 8 image (red: SWIR1, green: NIR, blue: red). (b) The DEM overlapped on the hillshade, which is calculated using the DEM with the Sentinel-1 incidence angle and azimuth angle. Panels (c) and (d) are seasonal deformation amplitude and long-term deformation velocity, respectively. The dashed grey line delineates the track boundary of orbit 150. Panels (e)–(h) are deformation time series of marked sites. The sites' elevations (m a.s.l.) are labeled in parentheses in panel (a). Air temperature in a red color is from ERA5-Land air temperature reanalysis data. Deformations are in the LOS direction.
Previous research has normally focused on the thaw subsidence signal on the TP, and less attention has been given to the uplift signal. Some of the uplift signals might be related to deposition or the rise of the groundwater table. Some of the uplift signals might be caused by ground ice aggradation. A sufficient water supply accompanied by strong evaporation (cooling effect, energy is taken away) might facilitate the upward freezing of previously unfrozen (or seasonally frozen) sediment. Ground ice aggradation is slightly surprising in the overall warming climate of the study area. However, the upward freezing of previously unfrozen (or seasonally frozen) sediment is still possible and may occur because of sediment accretion (e.g., deltaic and alluvial sedimentation) (French, 2017). A previous study (Daout et al., 2020) also detected a complex deformation signal in the permafrost on the northeastern TP and hypothesized that the uplift deformation in lowland regions was caused by excess meltwater pooling, which triggered an increase in the segregation of ice near the permafrost table. On the TP, new permafrost forming is detected on the exposed bottom of Zonag Lake (Zhang et al., 2022). Thus, on the TP, it might be common for both degradation and aggradation of ground ice to occur in permafrost environments, with degradation representing the dominant pattern and aggradation existing in local areas. Nevertheless, the uplift signals in the permafrost environment on the TP are worthy of additional research, and further details on the Selin Co basin are expected to be unveiled and supplemented by the next field survey.
5.2 Comparison of Selin Co's expansion during 2018–2020 with historical values
Our analysis shows that the lake area expanded at a rate of 10.3 km2 a−1 during 2015–2020, the water level increased at a rate of ∼0.2 m a−1, and the lake water storage increased at a rate of 485×106 m3 a−1 between 2018 and 2020. These values are compared with those recorded in previous studies in Fig. 12. Lake area change information is from Zhu et al. (2019a), Qiao et al. (2019), Meng et al. (2012), Sun et al. (2020), Zhang et al. (2020), and Deij et al. (2018); water level change information is from Meng et al. (2012), Lei et al. (2013), Doin et al. (2015), Zhang et al. (2013), Sun et al. (2020), Hwang et al. (2019), Zhang et al. (2020), and Zhu et al. (2019b); and water volume information is from Zhu et al. (2019a), Qiao et al. (2019), Treichler et al. (2019), Sun et al. (2020), Zhang et al. (2013), and Li et al. (2019). As illustrated in Fig. 12, the expansion of Selin Co was slow before 2000, with lake area and volume increases of 9.1 km2 a−1 and 368×106 m3 a−1, respectively. Then, in the period 2000–2005, the lake expanded extremely fast, with the water level increasing at an approximate rate of 1.0 m a−1 and the lake area and volume increasing at rates of 60.7 km2 a−1 and 1576×106 m3 a−1, respectively. After 2005, however, these rates of increase slowed down, with those of the lake area and lake water storage slowing to only 12.6 km2 a−1 and 553×106 m3 a−1 during 2005–2017, respectively, and the rate of increase in the water surface elevation slowing to 0.2 m a−1 during 2007–2011 (Doin et al., 2015). Overall, the values retrieved in this study are all within the ranges of the historical values and are closest to the values after the 2010s.
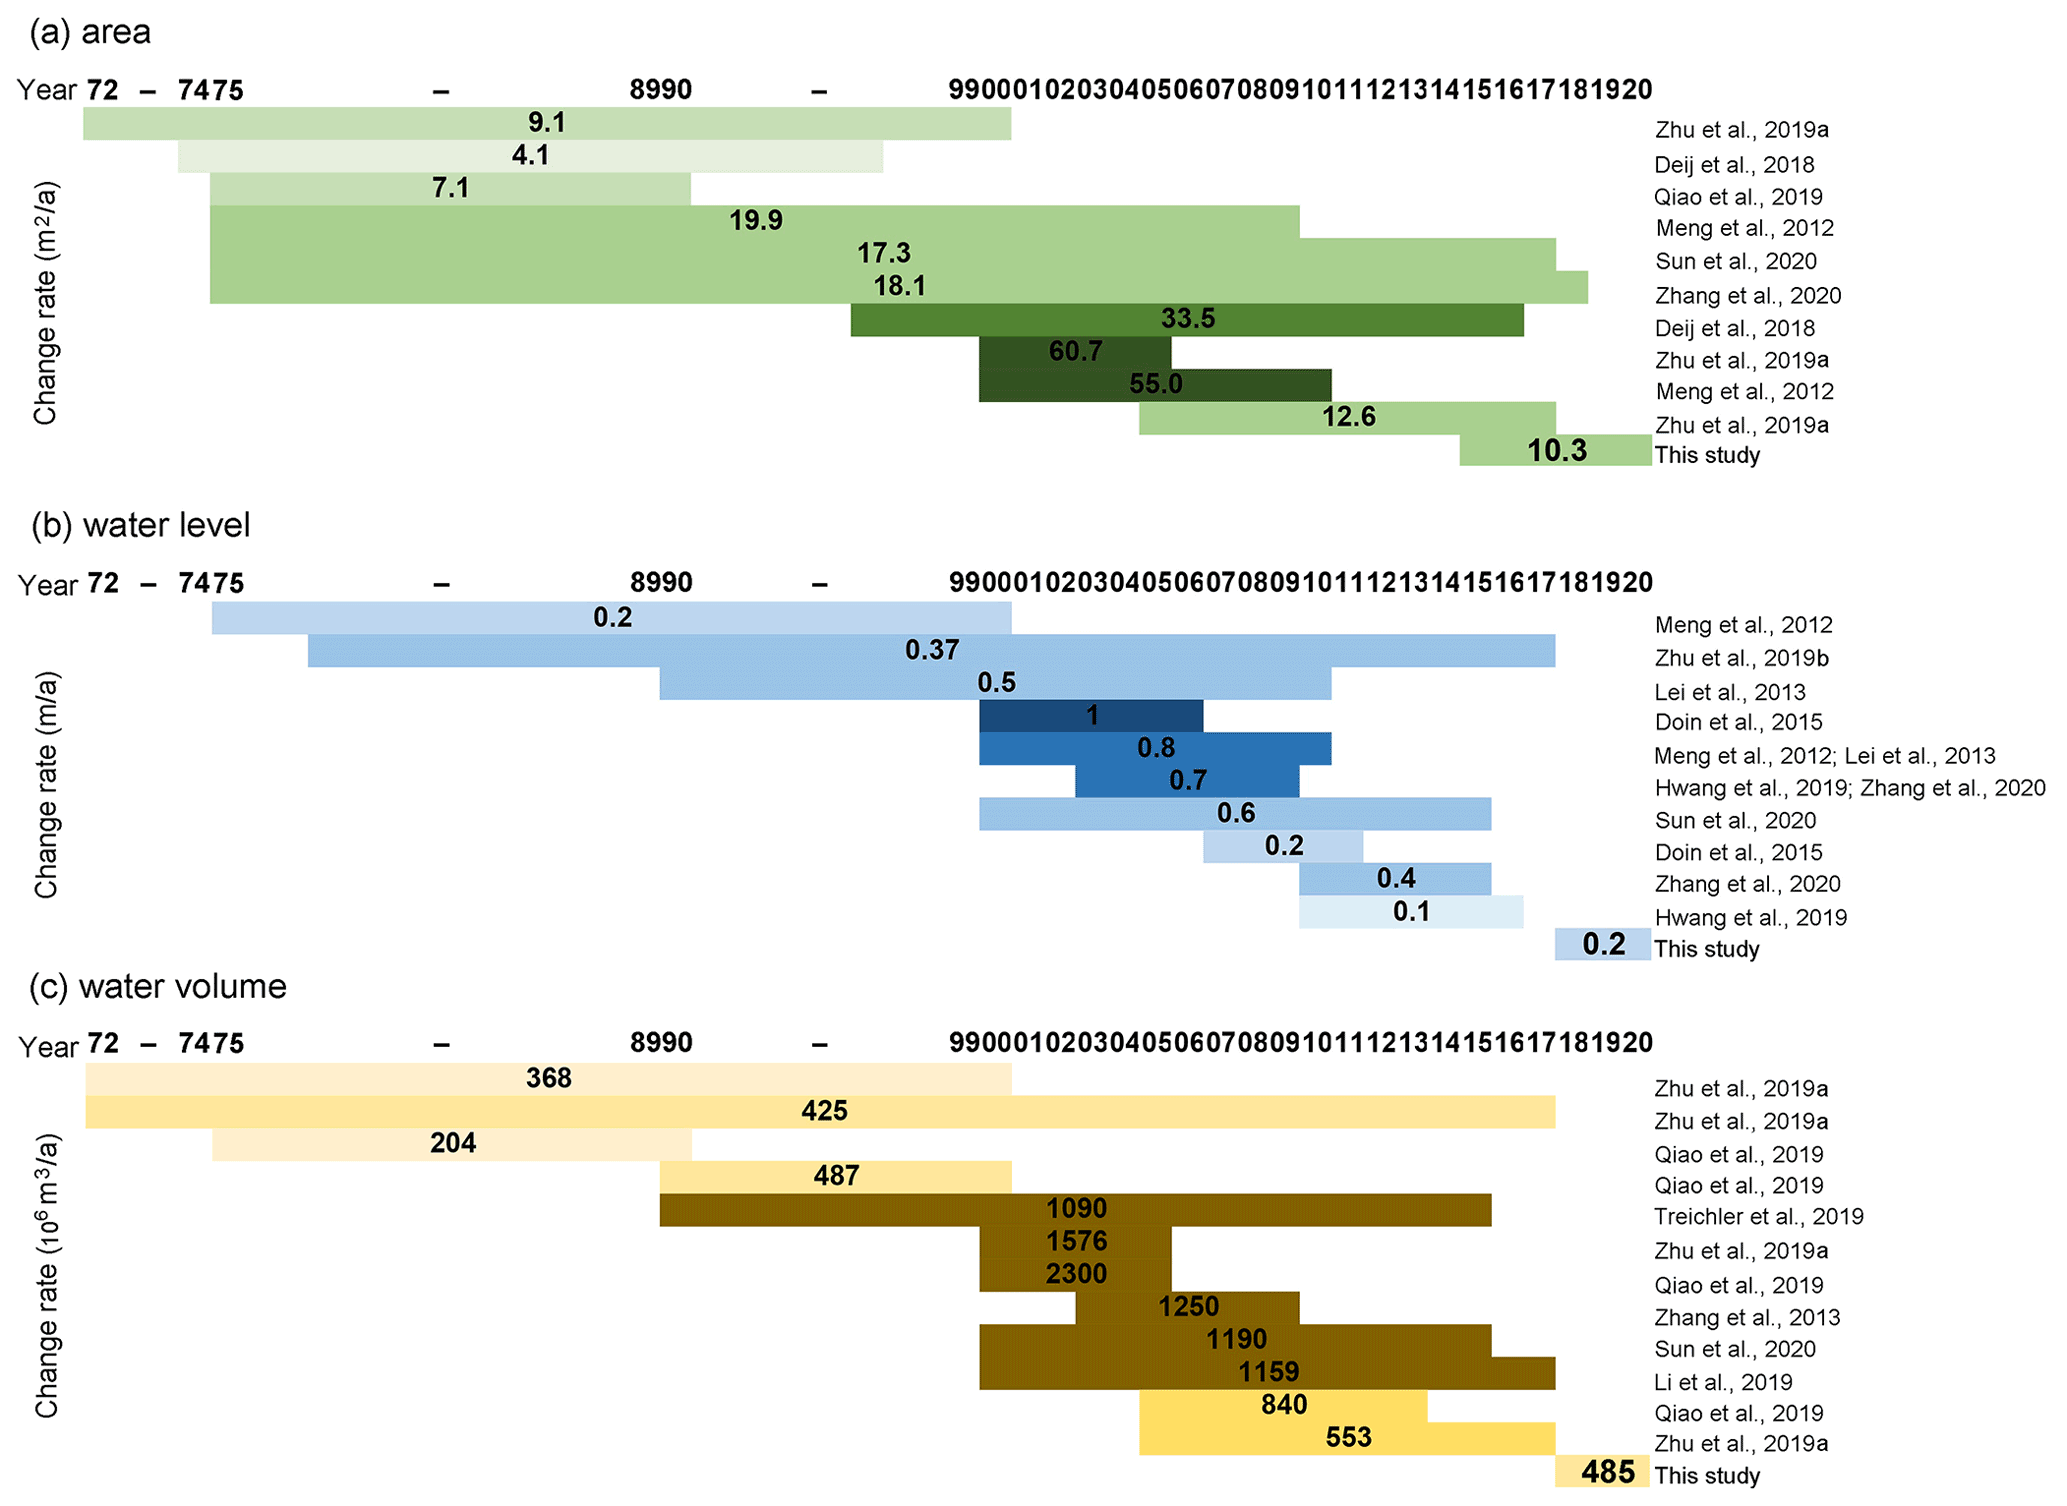
Figure 12Comparisons of the changes in the lake area (a), water surface elevation (b), and lake volume (c) of Selin Co with historical values.
5.3 Water contribution by permafrost ground ice melting in the Selin Co watershed
We assumed that the amount of surface settlement corresponds to the release of the same volume of ground ice as a result of compressing the thawing ice-rich permafrost layer and that the released water eventually enters Selin Co; the potential water contribution volume was estimated accordingly. However, the effect of permafrost degradation on the terrestrial water cycle is complicated (Ma et al., 2020). A gradually thickening active layer may retain more water in the soil layer; thus, endorheic basins may collect more water during the thawing season. Additionally, the increase in the active-layer thickness due to the warming climate could lead to enhanced evaporation. Furthermore, in permafrost terrain, the interactions between groundwater and surface water are restricted. With continued permafrost degradation, the rates of groundwater recharge and discharge are expected to increase since the impermeable barrier provided by permafrost weakens. Ultimately, the melting of ground ice can lead to the infiltration of more surface water into groundwater aquifers in the basin, thereby increasing groundwater storage in the basin (Bense et al., 2012; Zhang et al., 2017).
Based on the detected deformation, we estimated that the volumetric rate of water being released due to the melting of ground ice could reach 57.4×10⁶ m3 a−1 for the Zhajiazangbu and Boquzangbu subbasins. If the Alizangbu and Zhagenzangbu subbasins were included, the volume contributed by ground ice melting could be even larger. According to the permafrost distribution statistics (Table 1), the Zhajiazangbu and Boquzangbu subbasins together have a permafrost area of 10 791 km2, while the other two subbasins, the Alizangbu and Zhagenzangbu, have a combined permafrost area of only 2613 km2, approximately 25 % of the permafrost area in the two northern subbasins. A map of the ground ice distribution on the TP (Zhao and Sheng, 2019) likewise illustrates that the ground ice volumes in the Alizangbu and Zhagenzangbu subbasins are small compared to that in the Zhajiazangbu subbasin. Moreover, the water released from ground ice melting in the Alizangbu and Zhagenzangbu subbasins does not directly supply Selin Co; rather, this meltwater supplies Co Ngoin and Wuru Co–Qiagui Co first. In addition, during 2018–2020, the surface water level slightly dropped in Co Ngoin and Wuru Co–Qiagui Co (Fig. 4 and Table 3). Thus, the water supply from other lakes to Selin Co might be limited considering the circumstances stated above and thus was not incorporated into the calculation in the current study. In addition, there are some wet areas facing strong decorrelation (1.9 % of the watershed area has temporal decorrelation smaller than 0.85 and masked), where deformation information could not be retrieved. However, these areas usually experience very large subsidence. If taking into account these areas, the ground ice meltwater contribution could be higher. If only the retrieved subsidence signal is considered, the ground ice meltwater volume contribution is 57.4×10⁶ m3 a−1, accounting for 11.8 % of the lake volume increase. This result is consistent with a previous model simulation of the water supply of permafrost degradation to the lake volume increase in the endorheic basins on the TP (Zhang et al., 2017), which estimated the water supply by multiplying the active-layer thickening rate and the average ground ice content and revealed that permafrost degradation contributed ∼12 % of the water supply to the lake volume increase.
Our 3-year study period is relatively short compared to the continuous period of the growth of Selin Co from the 1970s to the present. The deformation rate and the lake water storage increasing rate in the other periods might be different from those in 2017–2020. C-band ERS, Envisat, and L-band ALOS PALSAR provide historical SAR data from the 1990s to the 2010s and will be processed and analyzed in a future study.
This is the first study to quantify the contribution of ground ice melting to the expansion of Selin Co. We monitored the surface deformation using the SBAS-InSAR technique over a large area of approximately 450 km × 500 km across the Selin Co basin and then utilized the long-term deformation rates to estimate the potential volume of water being released via ground ice melting. Then, this amount was compared with the lake volume change during the same period, and the contribution ratio was derived. SBAS-InSAR monitoring during 2017–2020 exposed widespread and large subsidence in the upstream section of the Zhajiazangbu subbasin, which is underlain by widespread, continuous permafrost. Subsidence normally occurred at between 5 and 20 mm a−1 (78.6 %), indicating highly excess ice and rapid ice loss in the region. During the same period, the lake water storage increased at a rate of approximately 485×106 m3 a−1, and the potential rate at which water was being released due to ground ice melting reached 57.4×10⁶ m3 a−1, contributing 11.8 % of the lake volume increase. The uplift signals in some lowland areas with a sufficient water supply and in drained ponds are worth noting, and more details will be revealed through future field surveys. This study contributes to explaining the rapid expansion of Selin Co and closing the water balance at the watershed scale. More importantly, the proposed method can be extended to other watersheds underlain by permafrost to help us better understand the hydrological changes in these watersheds.
Table A1Information on the S1 images processed to monitor the surface deformation.
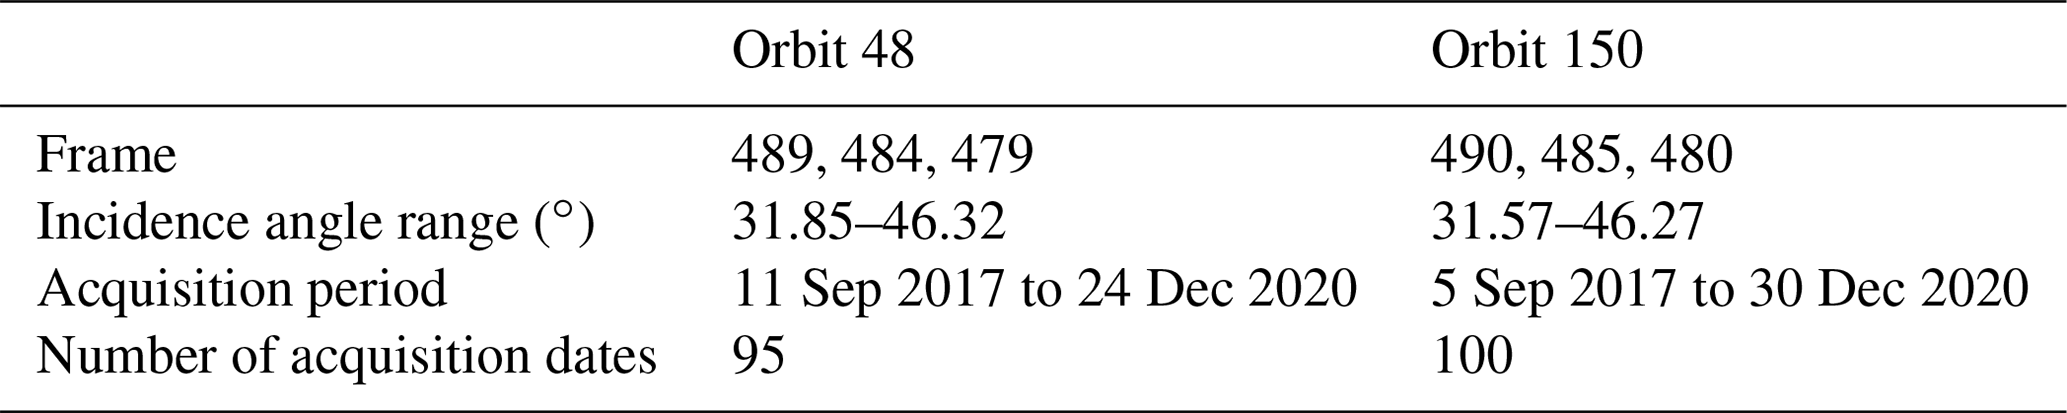
Table A2Information on the Landsat 8 images used.
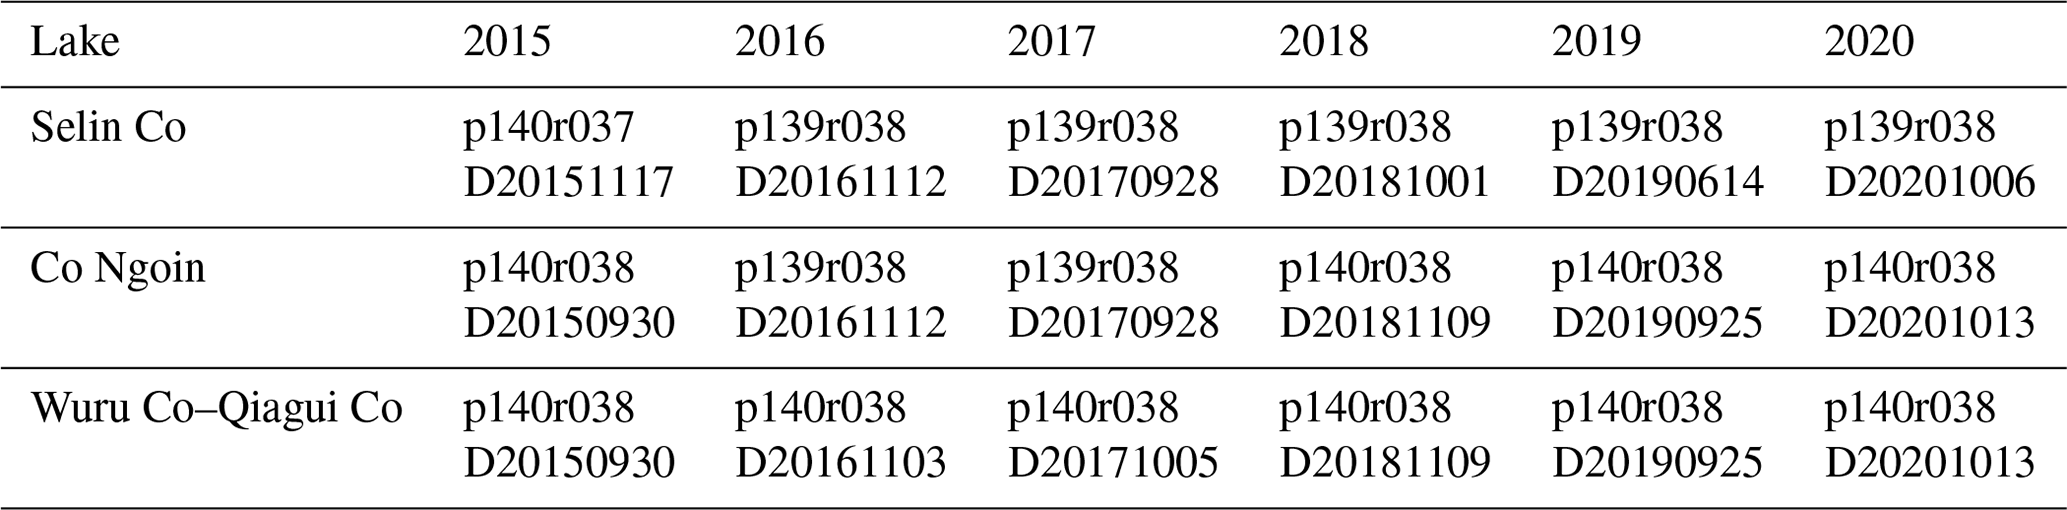
“p” denotes the path; “r” denotes the row of the frame; “D” denotes the acquisition date (yyyymmdd).
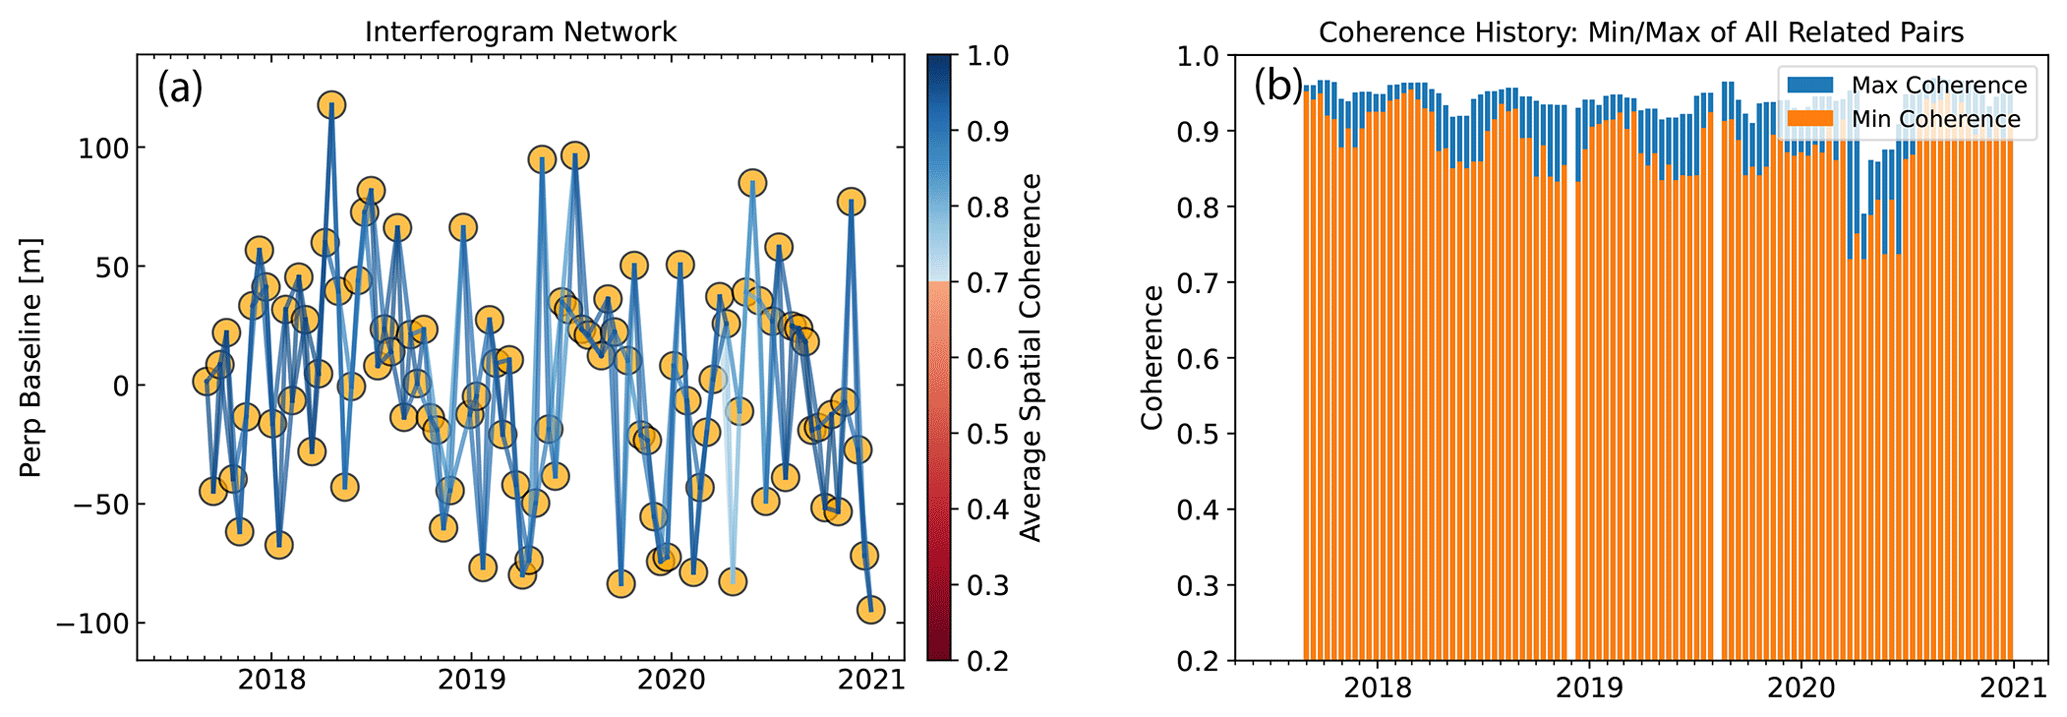
Figure A1(a) Network of interferograms for deformation time series estimation, color-coded by average coherence of the interferograms. Circles represent the acquisition dates, and lines represent the interferograms. (b) Average coherence of all related pairs for each SAR acquisition date. “Perp” denotes perpendicular; “Ifgram” denotes interferogram.
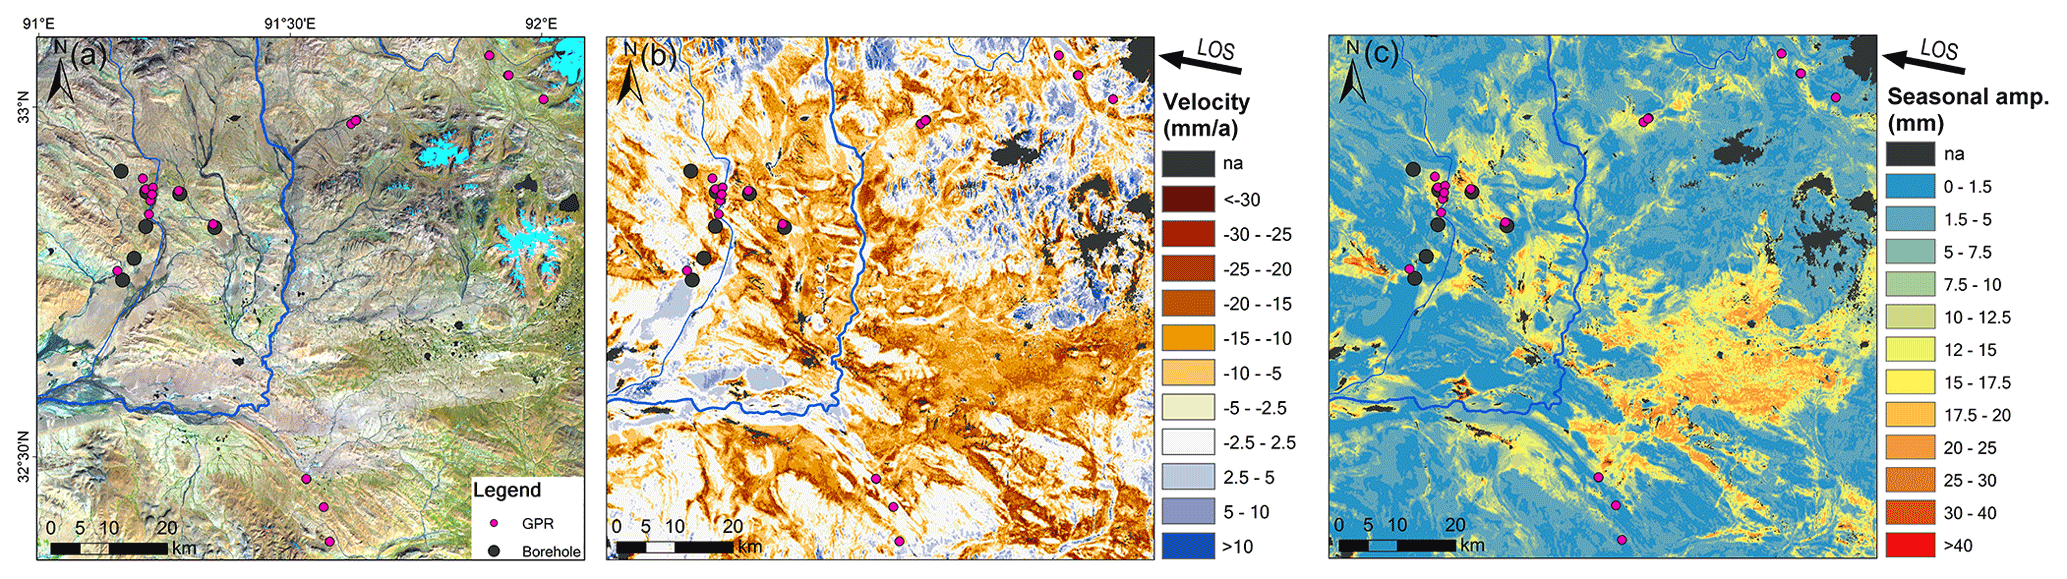
Figure A2Maps of the GPR and borehole regions: (a) Landsat 8 image acquired in October 2020 (red: SWIR1, green: NIR, blue: red), with GPR and borehole sites marked; (b) long-term deformation velocity; (c) seasonal deformation amplitude.
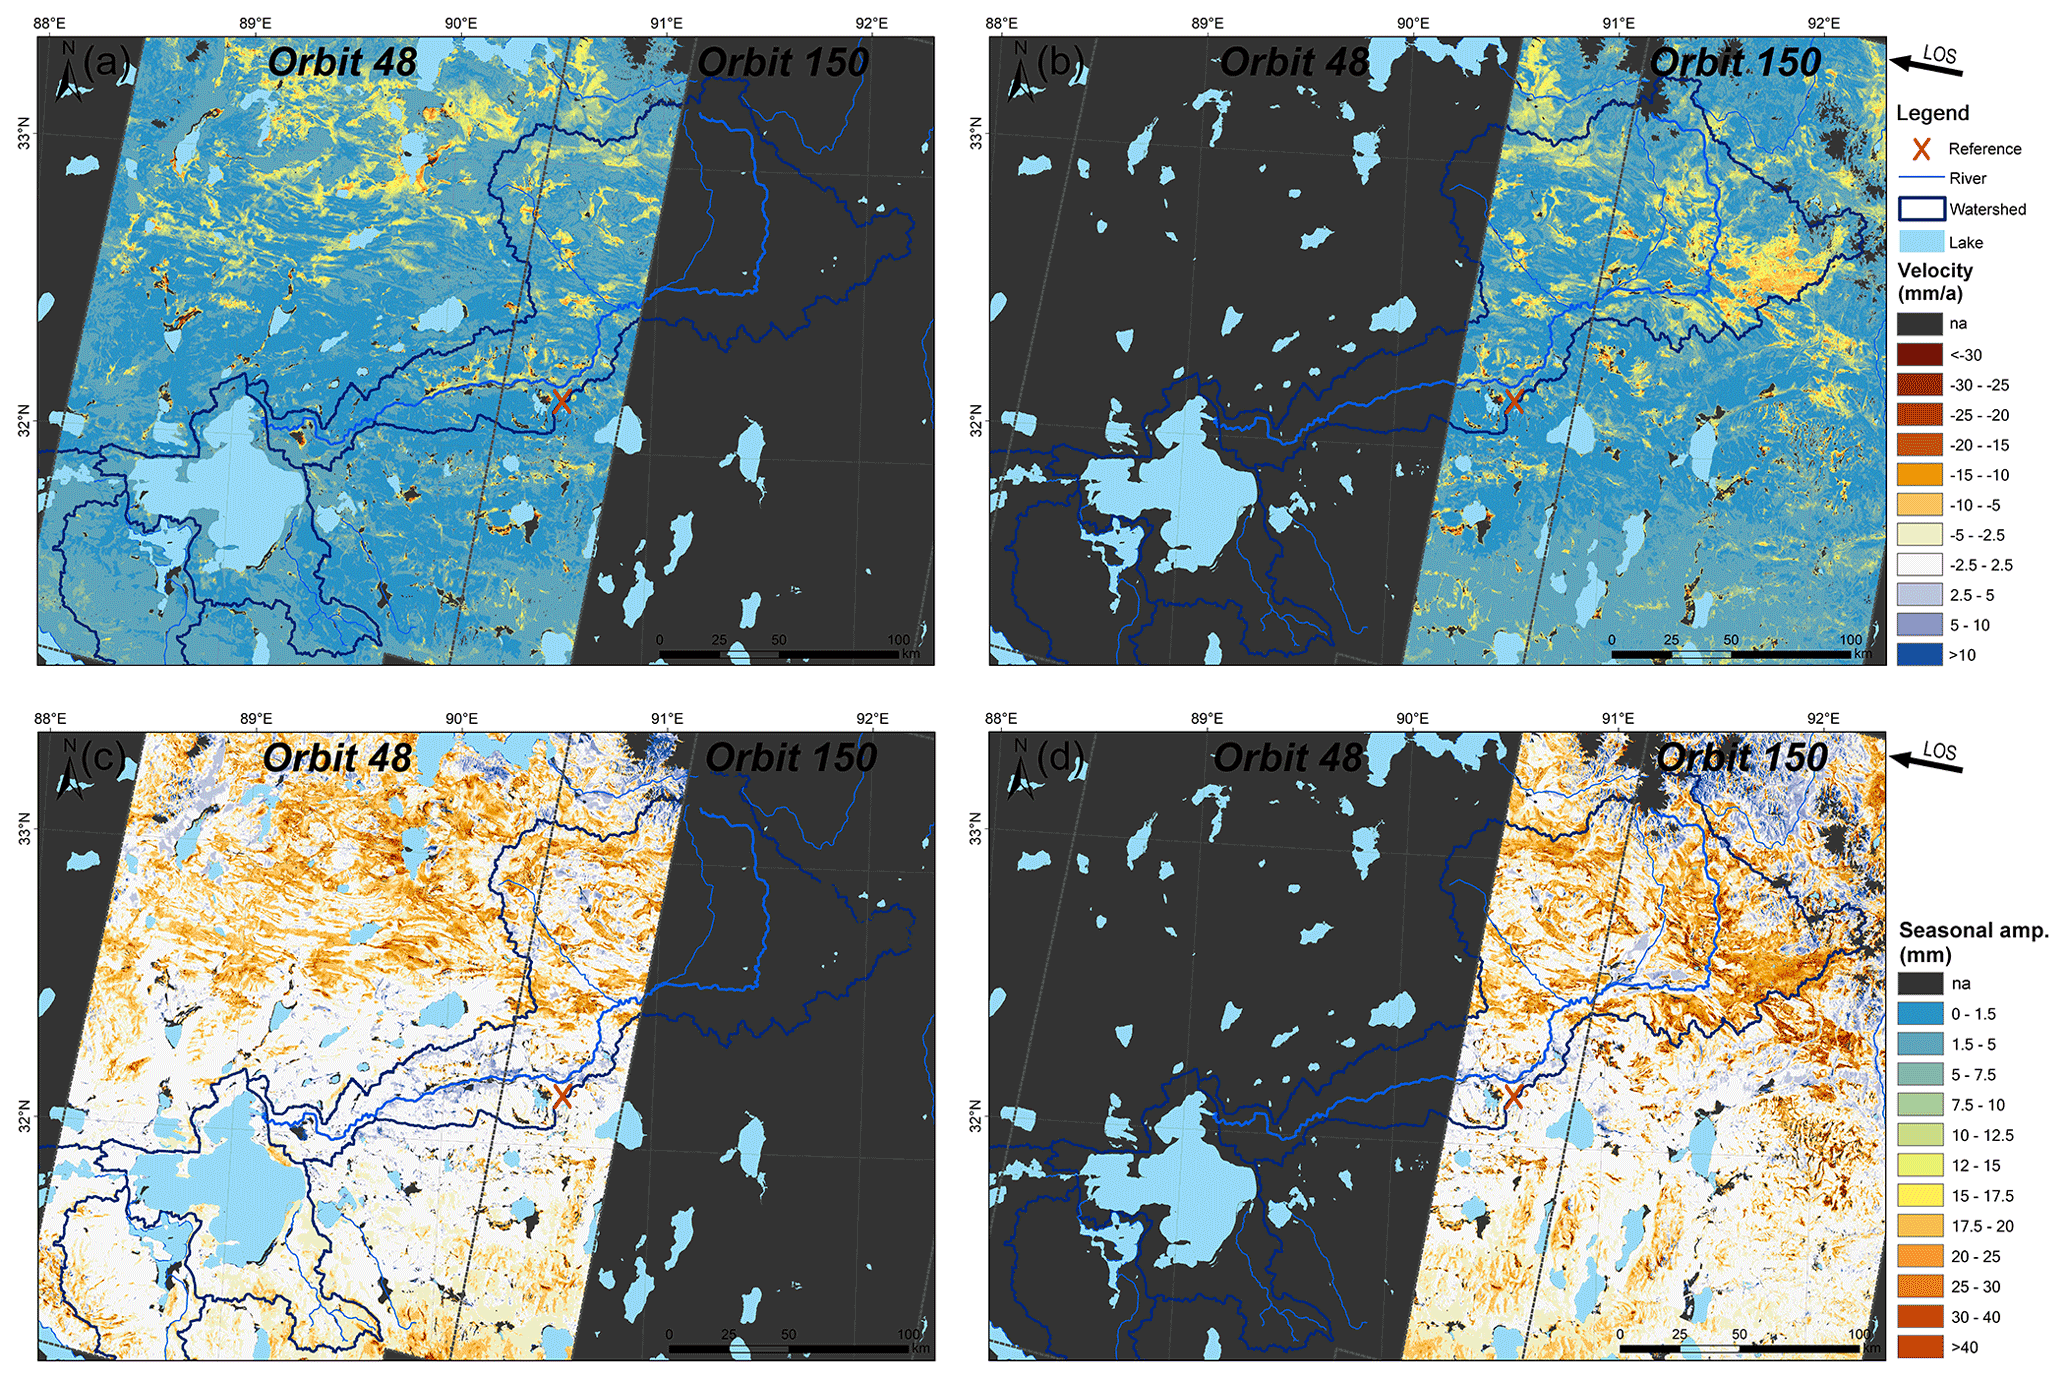
Figure A3Map of the periodic (seasonal) amplitude (a, b) and long-term velocity (c, d) retrieved from orbit 48 (a, c) and orbit 150 (b, d), respectively; all are in the satellite LOS direction.
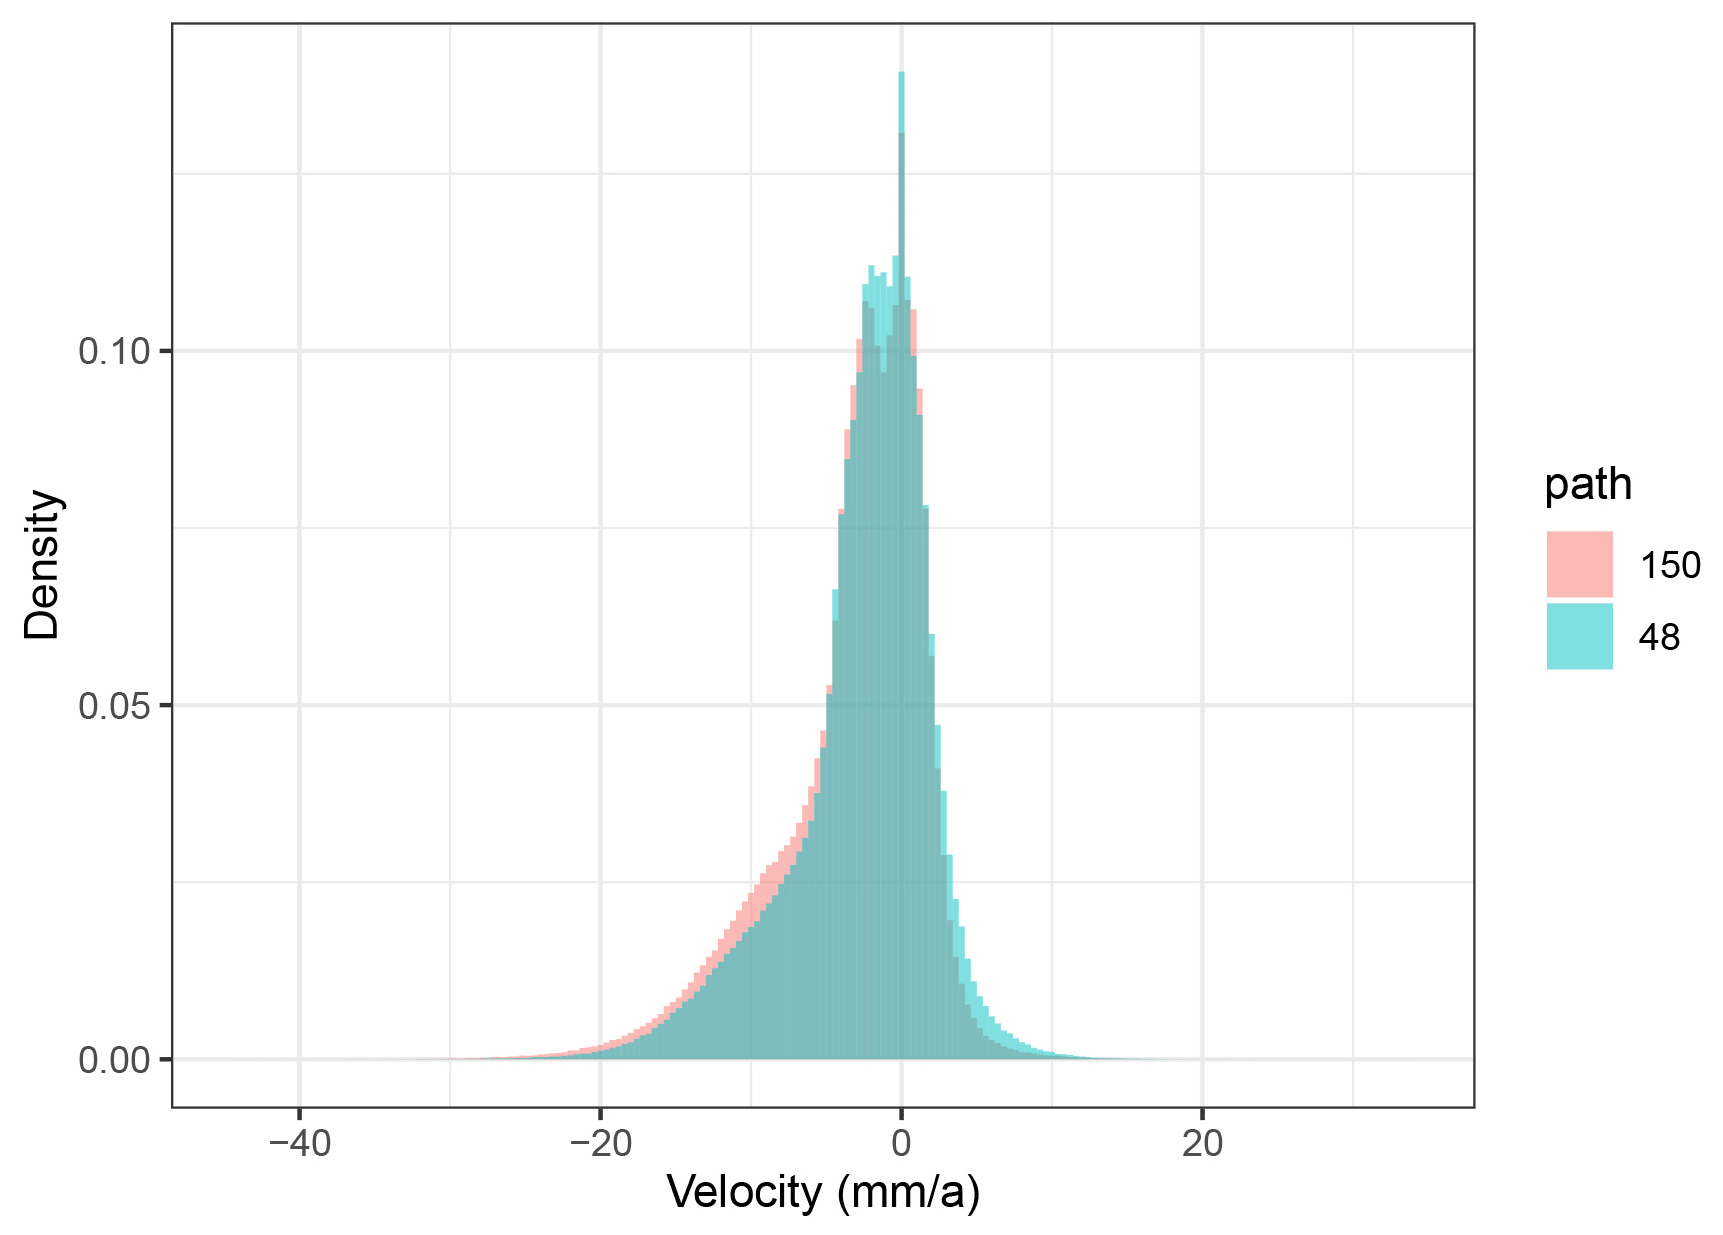
Figure A4The distribution of long-term velocity values in the satellite LOS direction from orbit 48 and orbit 150 in their overlapping area.
Sentinel-1 Level-1 single-look complex (SLC) images can be accessed from the Alaska Satellite Facility (https://search.asf.alaska.edu/, last access: 9 July 2022) or Copernicus Open Access Hub (https://scihub.copernicus.eu/dhus/#/home, last access: 9 July 2022). The lake area extents during 2015–2017 were from the dataset “The lakes larger than 1 km2 in Tibetan Plateau (V2.0)”, provided by the National Tibetan Plateau Data Center.
LW and LZ designed the study and wrote the manuscript. LZ directed the project. LW, HZ, SL, and CL performed the surface deformation analysis; XL performed the lake water level analysis; ED conducted GPR survey and interpretation; LZ, GL, DZ, HZ, ZS, ED, YX, GH, SL, ZL, CW, YQ, and TW conducted the fieldwork and borehole drillings. LW, LZ, HZ, SL, DZ, GL, and ED interpreted and discussed the results.
The contact author has declared that none of the authors has any competing interests.
Publisher's note: Copernicus Publications remains neutral with regard to jurisdictional claims in published maps and institutional affiliations.
We are grateful to the logistics staff who provided tremendous help during the field campaign.
This research has been supported by the National Natural Science Foundation of China (grant nos. 42001054 and 41931180), the Second Tibetan Plateau Scientific Expedition and Research (STEP) program (grant no. 2019QZKK0201), and the Natural Science Foundation of Jiangsu Province (grant no. BK20200828).
This paper was edited by Etienne Berthier and reviewed by two anonymous referees.
Bense, V., Kooi, H., Ferguson, G., and Read, T.: Permafrost degradation as a control on hydrogeological regime shifts in a warming climate, J. Geophys. Res.-Earth Surf., 117, F03036, https://doi.org/10.1029/2011JF002143, 2012.
Berardino, P., Fornaro, G., Lanari, R., and Sansosti, E.: A new algorithm for surface deformation monitoring based on small baseline differential SAR interferograms, Geoscience and Remote Sensing, IEEE Transactions on, 40, 2375–2383, 2002.
Bian, D., Bian, B., La, B., Wang, C., and Chen, T.: The Response of Water Level of Selin Co to Climate Change during 1975–2008, Acta Geographica Sinica, 65, 313–319, 2010 (in Chinese).
Brun, F., Treichler, D., Shean, D., and Immerzeel, W. W.: Limited contribution of glacier mass loss to the recent increase in Tibetan Plateau lake volume, Front. Earth Sci., 8, 582060, https://doi.org/10.3389/feart.2020.582060, 2020.
Buckel, J., Reinosch, E., Hördt, A., Zhang, F., Riedel, B., Gerke, M., Schwalb, A., and Mäusbacher, R.: Insights into a remote cryosphere: a multi-method approach to assess permafrost occurrence at the Qugaqie basin, western Nyainqêntanglha Range, Tibetan Plateau, The Cryosphere, 15, 149–168, https://doi.org/10.5194/tc-15-149-2021, 2021.
Chen, C. W. and Zebker, H. A.: Phase unwrapping for large SAR interferograms: Statistical segmentation and generalized network models, IEEE T. Geosci. Remote, 40, 1709–1719, 2002.
Chen, J., Liu, L., Zhang, T., Cao, B., and Lin, H.: Using persistent scatterer interferometry to map and quantify permafrost thaw subsidence: A case study of Eboling Mountain on the Qinghai–Tibet Plateau, J. Geophys. Res.-Earth Surf., 123, 2663–2676, 2018.
Chen, J., Wu, Y., O'Connor, M., Cardenas, M. B., Schaefer, K., Michaelides, R., and Kling, G.: Active layer freeze-thaw and water storage dynamics in permafrost environments inferred from InSAR, Remote Sens. Environ., 248, 112007, https://doi.org/10.1016/j.rse.2020.112007, 2020.
Chen, J., Wu, T., Zou, D., Liu, L., Wu, X., Gong, W., Zhu, X., Li, R., Hao, J., and Hu, G.: Magnitudes and patterns of large-scale permafrost ground deformation revealed by Sentinel-1 InSAR on the central Qinghai-Tibet Plateau, Remote Sens. Environ., 268, 112778, https://doi.org/10.1016/j.rse.2021.112778, 2022.
Cheng, G.: The mechanism of repeated-segregation for the formation of thick layered ground ice, Cold Reg. Sci. Technol., 8, 57–66, 1983.
Daout, S., Doin, M. P., Peltzer, G., Socquet, A., and Lasserre, C.: Large-scale InSAR monitoring of permafrost freeze–thaw cycles on the Tibetan Plateau, Geophys. Res. Lett., 44, 901–909, 2017.
Daout, S., Dini, B., Haeberli, W., Doin, M.-P., and Parsons, B.: Ice loss in the Northeastern Tibetan Plateau permafrost as seen by 16 yr of ESA SAR missions, Earth Planet. Sc. Lett., 545, 116404, https://doi.org/10.1016/j.epsl.2020.116404, 2020.
Deij, Y., Nima, J., Qianba, O., Zeng, L., and Luosang, Q.: Lake Area Variation of Selin Tso in 1975–2016 and Its Influential Factors, Plateau and Mountain Meteorology Research, 38, 35–41, https://doi.org/10.3969/j.issn.1674-2184.2018.02.006, 2018 (in Chinese).
Doin, M. P., Twardzik, C., Ducret, G., Lasserre, C., Guillaso, S., and Jianbao, S.: InSAR measurement of the deformation around Siling Co Lake: Inferences on the lower crust viscosity in central Tibet, J. Geophys. Res.-Sol. Ea., 120, 5290–5310, 2015.
Farinotti, D., Huss, M., Fürst, J. J., Landmann, J., Machguth, H., Maussion, F., and Pandit, A.: A consensus estimate for the ice thickness distribution of all glaciers on Earth, Nat. Geosci., 12, 168–173, 2019.
French, H. and Harbor, J.: The Development and History of Glacial and Periglacial Geomorphology, Treatise on Geomorphology, Academic Press, https://doi.org/10.1016/B978-0-12-374739-6.00190-1, 2013.
French, H. M.: The periglacial environment, John Wiley & Sons, ISBN 978-1-119-13278-3, 2017.
Günther, F., Overduin, P. P., Yakshina, I. A., Opel, T., Baranskaya, A. V., and Grigoriev, M. N.: Observing Muostakh disappear: permafrost thaw subsidence and erosion of a ground-ice-rich island in response to arctic summer warming and sea ice reduction, The Cryosphere, 9, 151–178, https://doi.org/10.5194/tc-9-151-2015, 2015.
Guo, W., Liu, S., Xu, J., Wu, L., Shangguan, D., Yao, X., Wei, J., Bao, W., Yu, P., and Liu, Q.: The second Chinese glacier inventory: data, methods and results, J. Glaciol., 61, 357–372, 2015.
Guo, Y., Zhang, Y., Ma, N., Xu, J., and Zhang, T.: Long-term changes in evaporation over Siling Co Lake on the Tibetan Plateau and its impact on recent rapid lake expansion, Atmos. Res., 216, 141–150, 2019.
Hwang, C.-W., Cheng, Y. S., Yang, W. H., Zhang, G., Huang, Y. R., Shen, W. B., and Pan, Y.: Lake level changes in the Tibetan Plateau from Cryosat-2, SARAL, ICESat, and Jason-2 altimeters, Terr. Atmos. Ocean. Sci., 30, 1–18, 2019.
Jin, H., Huang, Y., Bense, V. F., Ma, Q., Marchenko, S. S., Shepelev, V. V., Hu, Y., Liang, S., Spektor, V. V., and Jin, X.: Permafrost Degradation and Its Hydrogeological Impacts, Water, 14, 372, https://doi.org/10.3390/w14030372, 2022.
Jolivet, R., Agram, P. S., Lin, N. Y., Simons, M., Doin, M. P., Peltzer, G., and Li, Z.: Improving InSAR geodesy using global atmospheric models, J. Geophys. Res.-Sol. Ea., 119, 2324–2341, 2014.
Kokelj, S. V. and Jorgenson, M.: Advances in thermokarst research, Permafrost Periglac. Process., 24, 108–119, 2013.
Lanari, R., Lundgren, P., Manzo, M., and Casu, F.: Satellite radar interferometry time series analysis of surface deformation for Los Angeles, California, Geophys. Res. Lett., 31, L23613, https://doi.org/10.1029/2004GL021294, 2004.
Lantuit, H. and Pollard, W.: Fifty years of coastal erosion and retrogressive thaw slump activity on Herschel Island, southern Beaufort Sea, Yukon Territory, Canada, Geomorphology, 95, 84–102, 2008.
Lei, Y., Yao, T., Bird, B. W., Yang, K., Zhai, J., and Sheng, Y.: Coherent lake growth on the central Tibetan Plateau since the 1970s: Characterization and attribution, J. Hydrol., 483, 61–67, 2013.
Lei, Y., Yang, K., Wang, B., Sheng, Y., Bird, B. W., Zhang, G., and Tian, L.: Response of inland lake dynamics over the Tibetan Plateau to climate change, Clim. Change, 125, 281–290, 2014.
Li, X., Long, D., Huang, Q., Han, P., Zhao, F., and Wada, Y.: High-temporal-resolution water level and storage change data sets for lakes on the Tibetan Plateau during 2000–2017 using multiple altimetric missions and Landsat-derived lake shoreline positions, Earth Syst. Sci. Data, 11, 1603–1627, https://doi.org/10.5194/essd-11-1603-2019, 2019.
Li, Y., Liao, J., Guo, H., Liu, Z., and Shen, G.: Patterns and potential drivers of dramatic changes in Tibetan lakes, 1972–2010, PloS one, 9, e111890, https://doi.org/10.1371/journal.pone.0111890, 2014.
Li, Z., Zhao, R., Hu, J., Wen, L., Feng, G., Zhang, Z., and Wang, Q.: InSAR analysis of surface deformation over permafrost to estimate active layer thickness based on one-dimensional heat transfer model of soils, Sci. Rep.-UK, 5, 15542, https://doi.org/10.1038/srep15542, 2015.
Liu, L., Schaefer, K., Zhang, T., and Wahr, J.: Estimating 1992–2000 average active layer thickness on the Alaskan North Slope from remotely sensed surface subsidence, J. Geophys. Res.-Earth Surf., 117, F01005, https://doi.org/10.1029/2011JF002041, 2012a.
Liu, S., Guo, W., and Xu, J.: The second glacier inventory dataset of China (version 1.0) (2006–2011), TPDC [data set], https://doi.org/10.3972/glacier.001.2013.db, 2012b.
Lu, P., Han, J., Li, Z., Xu, R., Li, R., Hao, T., and Qiao, G.: Lake outburst accelerated permafrost degradation on Qinghai-Tibet Plateau, Remote Sens. Environ., 249, 112011, https://doi.org/10.1016/j.rse.2020.112011, 2020.
Ma, Q., Jin, H.-J., Bense, V. F., Dong-Liang, L., Marchenko, S. S., Harris, S. A., and Lan, Y.-C.: Impacts of degrading permafrost on streamflow in the source area of Yellow River on the Qinghai-Tibet Plateau, China, Adv. Clim. Change Res., 10, 225–239, https://doi.org/10.1016/j.accre.2020.02.001, 2020.
Mackay, J. R.: Downward water movement into frozen ground, western arctic coast, Canada, Can. J. Earth Sci., 20, 120–134, 1983.
Meng, K., Shi, X., Wang, E., and Liu, F.: High-altitude salt lake elevation changes and glacial ablation in Central Tibet, 2000–2010, Chinese Sci. B., 57, 525–534, 2012.
Pepe, A. and Lanari, R.: On the extension of the minimum cost flow algorithm for phase unwrapping of multitemporal differential SAR interferograms, IEEE T. Geosci. Remote, 44, 2374–2383, 2006.
Qiao, B., Zhu, L., and Yang, R.: Temporal-spatial differences in lake water storage changes and their links to climate change throughout the Tibetan Plateau, Remote Sens. Environ., 222, 232–243, 2019.
Reinosch, E., Buckel, J., Dong, J., Gerke, M., Baade, J., and Riedel, B.: InSAR time series analysis of seasonal surface displacement dynamics on the Tibetan Plateau, The Cryosphere, 14, 1633–1650, https://doi.org/10.5194/tc-14-1633-2020, 2020.
Shiklomanov, N. I., Streletskiy, D. A., Little, J. D., and Nelson, F. E.: Isotropic thaw subsidence in undisturbed permafrost landscapes, Geophys. Res. Lett., 40, 6356–6361, 2013.
Song, C., Huang, B., Richards, K., Ke, L., and Hien Phan, V.: Accelerated lake expansion on the Tibetan Plateau in the 2000s: Induced by glacial melting or other processes?, Water Resour. Res., 50, 3170–3186, 2014.
Streletskiy, D. A., Shiklomanov, N. I., Little, J. D., Nelson, F. E., Brown, J., Nyland, K. E., and Klene, A. E.: Thaw subsidence in undisturbed tundra landscapes, Barrow, Alaska, 1962–2015, Permafrost Periglac. Process., 28, 566–572, 2016.
Sun, F., Ma, R., He, B., Zhao, X., Zeng, Y., Zhang, S., and Tang, S.: Changing Patterns of Lakes on The Southern Tibetan Plateau Based on Multi-Source Satellite Data, Remote Sensing, 12, 3450, https://doi.org/10.3390/rs12203450, 2020.
Tong, K., Su, F., and Xu, B.: Quantifying the contribution of glacier meltwater in the expansion of the largest lake in Tibet, J. Geophys. Res.-Atmos., 121, 11158–11173, https://doi.org/10.1002/2016JD025424, 2016.
Treichler, D., Kääb, A., Salzmann, N., and Xu, C.-Y.: Recent glacier and lake changes in High Mountain Asia and their relation to precipitation changes, The Cryosphere, 13, 2977–3005, https://doi.org/10.5194/tc-13-2977-2019, 2019.
Usai, S.: A least squares database approach for SAR interferometric data, Geoscience and Remote Sensing, IEEE Transactions on, 41, 753–760, 2003.
Wu, Z., Zhao, L., Liu, L., Zhu, R., Gao, Z., Qiao, Y., Tian, L., Zhou, H., and Xie, M.: Surface-deformation monitoring in the permafrost regions over the Tibetan Plateau, using Sentinel-1 data, Sci. Cold Arid Reg., 10, 114–125, 2018.
Yang, Y., Wu, Q., Yun, H., Jin, H., and Zhang, Z.: Evaluation of the hydrological contributions of permafrost to the thermokarst lakes on the Qinghai–Tibet Plateau using stable isotopes, Global Planet. Change, 140, 1–8, 2016.
Yang, Y., Wu, Q., Jin, H., Wang, Q., Huang, Y., Luo, D., Gao, S., and Jin, X.: Delineating the hydrological processes and hydraulic connectivities under permafrost degradation on Northeastern Qinghai-Tibet Plateau, China, J. Hydrol., 569, 359–372, 2019.
Zhang, G.: The lakes larger than 1 km2 in Tibetan Plateau (V3.0) (1970s–2021), National Tibetan Plateau Data Center [data set], https://doi.org/10.11888/Hydro.tpdc.270303, 2019.
Zhang, G., Yao, T., and Kang, S.: Water balance estimates of ten greatest lakes in China using ICESat and Landsat data, Chin. Sci. Bull., 58, 2664–2678, 2013 (in Chinese).
Zhang, G., Yao, T., Shum, C., Yi, S., Yang, K., Xie, H., Feng, W., Bolch, T., Wang, L., and Behrangi, A.: Lake volume and groundwater storage variations in Tibetan Plateau's endorheic basin, Geophys. Res. Lett., 44, 5550–5560, 2017.
Zhang, G., Chen, W., and Xie, H.: Tibetan Plateau's lake level and volume changes from NASA's ICESat/ICESat-2 and Landsat Missions, Geophys. Res. Lett., 46, 13107–13118, 2019.
Zhang, G., Yao, T., Xie, H., Yang, K., Zhu, L., Shum, C., Bolch, T., Yi, S., Allen, S., and Jiang, L.: Response of Tibetan Plateau's lakes to climate changes: trend, pattern, and mechanisms, Earth-Sci. Rev., 208, 103269, https://doi.org/10.1016/j.earscirev.2020.103269, 2020.
Zhang, G., Bolch, T., Chen, W., and Crétaux, J.-F.: Comprehensive estimation of lake volume changes on the Tibetan Plateau during 1976–2019 and basin-wide glacier contribution, Sci. Total Environ., 772, 145463, https://doi.org/10.1016/j.scitotenv.2021.145463, 2021a.
Zhang, G., Ran, Y., Wan, W., Luo, W., Chen, W., Xu, F., and Li, X.: 100 years of lake evolution over the Qinghai–Tibet Plateau, Earth Syst. Sci. Data, 13, 3951–3966, https://doi.org/10.5194/essd-13-3951-2021, 2021b.
Zhang, Y., Fattahi, H., and Amelung, F.: Small baseline InSAR time series analysis: Unwrapping error correction and noise reduction, Comput. Geosci., 133, 104331, https://doi.org/10.1016/j.cageo.2019.104331, 2019.
Zhang, Y., Xie, C., Wu, T., Zhao, L., Wu, J., Wu, X., Li, R., Hu, G., Liu, G., and Wang, W.: New permafrost is forming on the exposed bottom of Zonag Lake on the Qinghai-Tibet Plateau, Sci. Total Environ., 815, 152879, https://doi.org/10.1016/j.scitotenv.2021.152879, 2022.
Zhao, L. and Sheng, Y.: Permafrost and environment changes on the QinghaiTibetan Plateau, Science Press, Beijing, China, ISBN 9787030581334, 2019 (in Chinese).
Zhao, L., Hu, G., Zou, D., Wu, X., Ma, L., Sun, Z., Yuan, L., Zhou, H., and Liu, S.: Permafrost Changes and Its Effects on Hydrological Processes on Qinghai-Tibet Plateau, B. Chinese Acad. Sci., 34, 1233–1246, 2019 (in Chinese).
Zhao, L., Zou, D., Du, E., Hu, G., Pang, Q., Xiao, Y., Li, R., Sheng, Y., Wu, X., Sun, Z., Wang, L., Wang, C., Ma, L., Zhou, H., and Liu, S.: Changing climate and the permafrost environment on the Qinghai-Tibet (Xizang) Plateau, Permafrost Periglac. Process., 31, 396–405, https://doi.org/10.1002/ppp.2056, 2020.
Zhou, H., Zhao, L., Tian, l., Wu, Z., Xie, M., Yuan, L., Ni, J., Qiao, Y., Gao, Z., and Shi, J.: Monitoring and analysis of surface deformation in the permafrost area of Wudaoliang on the Tibetan Plateau based on Sentinel-1 data, J. Glaciol. Geocryol., 41, 525–536, 2019 (in Chinese).
Zhu, L., Wang, J., Ju, J., Ma, N., Zhang, Y., Liu, C., Han, B., Liu, L., Wang, M., and Ma, Q.: Climatic and lake environmental changes in the Serling Co region of Tibet over a variety of timescales, Sci. Bull., 64, 422–424, 2019a.
Zhu, L., Zhang, G., Yang, R., Liu, C., Yang, K., Qiao, B., and Han, B.: Lake Variations on Tibetan Plateau of Recent 40 Years and Future Changing Tendency, B. Chinese Acad. Sci., 34, 1254–1263, 2019b (in Chinese).
Zou, D., Zhao, L., Sheng, Y., Chen, J., Hu, G., Wu, T., Wu, J., Xie, C., Wu, X., Pang, Q., Wang, W., Du, E., Li, W., Liu, G., Li, J., Qin, Y., Qiao, Y., Wang, Z., Shi, J., and Cheng, G.: A new map of permafrost distribution on the Tibetan Plateau, The Cryosphere, 11, 2527–2542, https://doi.org/10.5194/tc-11-2527-2017, 2017.
Zwieback, S. and Meyer, F. J.: Top-of-permafrost ground ice indicated by remotely sensed late-season subsidence, The Cryosphere, 15, 2041–2055, https://doi.org/10.5194/tc-15-2041-2021, 2021.
windowto detect the subsurface ground ice melting. Results reveal that ground ice meltwater contributed ~ 12 % of the lake volume increase during 2017–2020.