the Creative Commons Attribution 4.0 License.
the Creative Commons Attribution 4.0 License.
 | 15 Jun 2022
Chronostratigraphy of the Larsen blue-ice area in northern Victoria Land, East Antarctica, and its implications for paleoclimate
Giyoon Lee
Hyeontae Ju
Florian Ritterbusch
Ikumi Oyabu
Christo Buizert
Songyi Kim
Jangil Moon
Sambit Ghosh
Kenji Kawamura
Zheng-Tian Lu
Sangbum Hong
Chang Hee Han
Soon Do Hur
Wei Jiang
Guo-Min Yang
In blue-ice areas (BIAs), deep ice is directly exposed at the surface, allowing for the cost-effective collection of large-sized old-ice samples. However, chronostratigraphic studies on blue-ice areas are challenging owing to fold and fault structures. Here, we report on a surface transect of ice with an undisturbed horizontal stratigraphy from the Larsen BIA, northern Victoria Land, East Antarctica. Ice layers defined by dust bands and ground-penetrating radar (GPR) surveys indicate a monotonic increase in age along the ice flow direction on the downstream side, while the upstream ice exhibits a potential repetition of ages on scales of tens of meters, which result from a complicated fold structure. Stable water isotopes (δ18Oice and δ2Hice) and components of the occluded air (i.e., CO2, N2O, CH4, δ15N–N2, δ18Oatm (=δ18O-O2), δ, δ, 81Kr, and 85Kr) are analyzed for surface ice and shallow ice core samples. Correlating δ18Oice, δ18Oatm, and CH4 records from the Larsen BIA with ice from previously drilled ice cores indicates that the gas age at various shallow vertical coring sites ranges between 9.2–23.4 kyr BP, while the ice age sampled from the surface ranges from 5.6 to 24.7 kyr BP. Absolute radiometric 81Kr dating for the two vertical cores confirms ages within acceptable levels of analytical uncertainty. A tentative climate reconstruction suggests a large deglacial warming of 15 ± 5 ∘C (1σ) and an increase in snow accumulation by a factor of 1.7–4.6 (from 24.3 to 10.6 kyr BP). Our study demonstrates that BIAs in northern Victoria Land may help to obtain high-quality records for paleoclimate and atmospheric greenhouse gas compositions through the last deglaciation, although in general climatic interpretation is complicated by the need for upstream flow corrections, evidence for strong surface sublimation during the last glacial period, and potential errors in the estimated gas age–ice age difference.
- Article
(7180 KB) - Full-text XML
-
Supplement
(468 KB) - BibTeX
- EndNote


Ice cores serve as very useful archives for paleoclimate and can provide information on, for instance, the relationship between greenhouse gas concentration and Earth's climate (Petit et al., 1999; EPICA Community Members, 2004; Siegenthaler et al., 2005; Lüthi et al., 2008; Bereiter et al., 2015), abrupt climate changes during the last glacial period (Dansgaard et al., 1989; Steffensen et al., 2008), and bipolar seesaw climate links on millennium timescales (Blunier and Brook, 2001; Landais et al., 2015). To date, continuous climate records from ice cores cover the last 800 kyr, while new deep-drilling projects in Antarctica now aim at recovering ice that is more than 1 Myr old (Fischer et al., 2013). However, the use of ice cores obtained from conventional deep-ice-core-drilling projects has some limitations, as many analyses require large amounts of ice, such as trace element isotope and trace gas analyses. In addition, deep-drilling projects incur high economic and labor costs. In contrast, coring in blue-ice areas (BIAs) has emerged as an alternative to obtain large ice samples in a cost-effective manner (Folco et al., 2006; Petrenko et al., 2006; Schaefer et al., 2006; Sinisalo et al., 2007; Korotkikh et al., 2011; Turney et al., 2013; Bauska et al., 2016; Aarons et al., 2017; Baggenstos et al., 2017; Zekollari et al., 2019; Yan et al., 2019; Fogwill et al., 2020).
Over the vast majority of the Antarctic ice sheet surface, ice forms through the compaction of snow. This ice then deforms and, through gravity, flows towards the margin of the ice sheet (Gardner et al., 2018). However, (basal) topographic obstacles in some cases redirect the ice flow towards the surface in some so-called blue-ice areas. In these BIAs, annually more surface snow is ablated than accumulated by katabatic winds and/or sublimation (Bintanja, 1999; Sinisalo and Moore, 2010). Because ice layers of the same age (isochrones) are extended on the surface, large amounts of old ice of a specific age can be obtained at the surface and/or relatively shallow depths, allowing for studying the paleoclimate without constraints related to limited sample sizes (Schaefer et al., 2006; Bauska et al., 2016; Fogwill et al., 2020).
In some BIAs, when ice flow and surface conditions combine favorably, large concentrations of meteorites can accumulate on the surface of the BIAs (Whillans and Cassidy, 1983; Cassidy et al., 1992; Harvey, 2003; Tollenaar et al., 2022). Recently, studies on BIAs have drawn particular attention to the possibility of identifying ice older than 800 kyr BP (to date, the longest continuous ice core record covers the last 800 kyr), which is of particular interest because glacial–interglacial cycles changed from 40 to 100 kyr around this time period, which is referred to as the Mid-Pleistocene Transition (MPT). It has been reported that ice at the Allan Hills BIA has ages of 90–250 kyr BP on the surface (Spaulding et al., 2013), reaching ∼ 2.7 Myr BP near the bedrock at depths of about 150–200 m (Yan et al., 2019). However, the use of ice samples taken from BIAs (hereafter referred to as blue ice) has several drawbacks. In most cases, the stratigraphy of the BIAs is complicated, as shown by the fold and fault structures on the surface (Folco et al., 2006; Petrenko et al., 2006; Curzio et al., 2008; Schaefer et al., 2009; Baggenstos et al., 2017), and the stratigraphy is discontinuous at deep depths near the bedrock where ice ages are similar to or older than the MPT (Higgins et al., 2015; Yan et al., 2019).
BIAs cover about 1.7 % of the Antarctic continent, of which a large fraction is concentrated in Victoria Land, the Transantarctic Mountains, Dronning Maud Land, and the Lambert Glacier basin (Hui et al., 2014) (Fig. 1). Several chronological studies of BIAs have been conducted in southern Victoria Land: on Taylor Glacier (Aciego et al., 2007; Buizert et al., 2014; Baggenstos et al., 2017, 2018; Menking et al., 2019), in the Allan Hills (Spaulding et al., 2013; Higgins et al., 2015; Yan et al., 2019, 2021), on Mullins Glacier (Yau et al., 2015), and in northern Victoria Land on Frontier Mountain blue-ice field (Folco et al., 2006; Curzio et al., 2008; Welten et al., 2008). Studies on Taylor Glacier and Allan Hills have constrained age along several transects and cores. However, chronologies of the other BIAs in Victoria Land remain largely unknown, prohibiting high-resolution paleoclimate studies. In addition, important paleoclimate proxies such as stable water isotopes, greenhouse gases, and isotopic ratios of oxygen gas have, to date, not been analyzed for the BIAs in northern Victoria Land.
Generally, because of the complicated stratigraphy, blue-ice samples are dated by combining multiple methods (Sinisalo and Moore, 2010). In previous studies, ice flow modeling, correlation analysis with stable isotopes of ice, and radiometric analysis of meteorites and tephra in ice have been used, but in most cases the age constraints have not been sufficiently precise to study the paleoclimate (Azuma et al., 1985; Nakawo et al., 1988; Reeh et al., 2002; Folco et al., 2006; Aciego et al., 2007; Curzio et al., 2008; Dunbar et al., 2008). One effective method for dating the gas age is to correlate globally well-mixed atmospheric gas records (e.g., CH4, CO2, and δ18Oatm) with existing well-dated ice core records (Spaulding et al., 2013; Baggenstos et al., 2017; Menking et al., 2019; Yan et al., 2021). Other methods include the use of stable Ar isotopes (Higgins et al., 2015; Yau et al., 2015; Yan et al., 2019) or radioactive 81Kr (Loosli and Oeschger 1969; Buizert et al., 2014; Tian et al., 2019; Crotti et al., 2021), both of which provide independent and absolute age constraints. However, the use of Ar and Kr isotopes has a certain limitation that allows for an accurate age constraint. The age uncertainty in Ar dating is ±180 kyr or 11 % of the age according to a regression line used by Bender et al. (2008). In addition, the ages can be corrupted by the injection of radiogenic 40Ar from the continental crust (Bender et al., 2010). 81Kr is a cosmogenically produced radioactive isotope with a half-life of 229 ± 11 kyr, decaying to 81Br via electron capture. It is mixed in the atmosphere within 1–2 years and has no other significant sources or sinks, making 81Kr an ideal tracer (Oeschger, 1987; Zappala et al., 2020). Oeschger (1987) suggested the potential of 81Kr for radiometric ice core dating. However, at that time, 105–106 kg of ice was required. Owing to the development of Atom Trace Trap Analysis (ATTA), the required ice has continued to decrease (Lu et al., 2014; Tian et al., 2019; Jiang et al., 2020; Crotti et al., 2021). Buizert et al. (2014), for the first time, showed that 81Kr age dating is feasible for blue ice at Taylor Glacier, Antarctica. However, the age uncertainty in 81Kr dating ranges between 5 %–20 % of the age depending on the sample age and sample size (Jiang et al., 2020). It also has a systematic age uncertainty of ∼ 5 % due to the uncertainty in the 81Kr half-life. Given the uncertainties in using Ar and Kr isotopes for direct dating, here we opt to use correlation of atmospheric gas records with existing well-dated ice core records as the primary dating tool.
CH4 and O2 are well mixed in the atmosphere (Blunier et al., 2007), and conducting correlations of both CH4 concentration and δ18O of O2 (δ18Oatm) is a well-known strategy for establishing chronologies of blue ice (Petrenko et al., 2006; Baggenstos et al., 2017; Yan et al., 2021). Variations in continental ice mass are known to be the main factor that controls δ18Oatm during glacial–interglacial cycles (Bender et al., 1985; Sowers et al., 1993). In addition, variations in the Intertropical Convergence Zone (ITCZ) are also known to influence δ18Oatm on millennial and orbital timescales (Severinghaus et al., 2009; Landais et al., 2010; Seltzer et al., 2017; Extier et al., 2018b). Because of the long lifetime of oxygen gas in the atmosphere (∼ 1 kyr), δ18Oatm varies more gradually compared to CH4, limiting synchronization to millennial timescales. In contrast, atmospheric CH4 concentration changes rapidly because of the short lifetime of ∼ 12 years, allowing for precise dating via stratigraphic matching.
For dating ice ages, glaciochemical records (e.g., nss-Ca2+ (nss signifies non-sea-salt), δ18Oice, and δ2Hice) can be used for correlation with existing well-dated ice core records (Baggenstos et al., 2018; Menking et al., 2019). Notably, at a given depth, the ice is older than the gas because the gas is only isolated and stops mixing with the atmospheric air when the firn completely transforms into ice (Schwander and Stauffer, 1984).
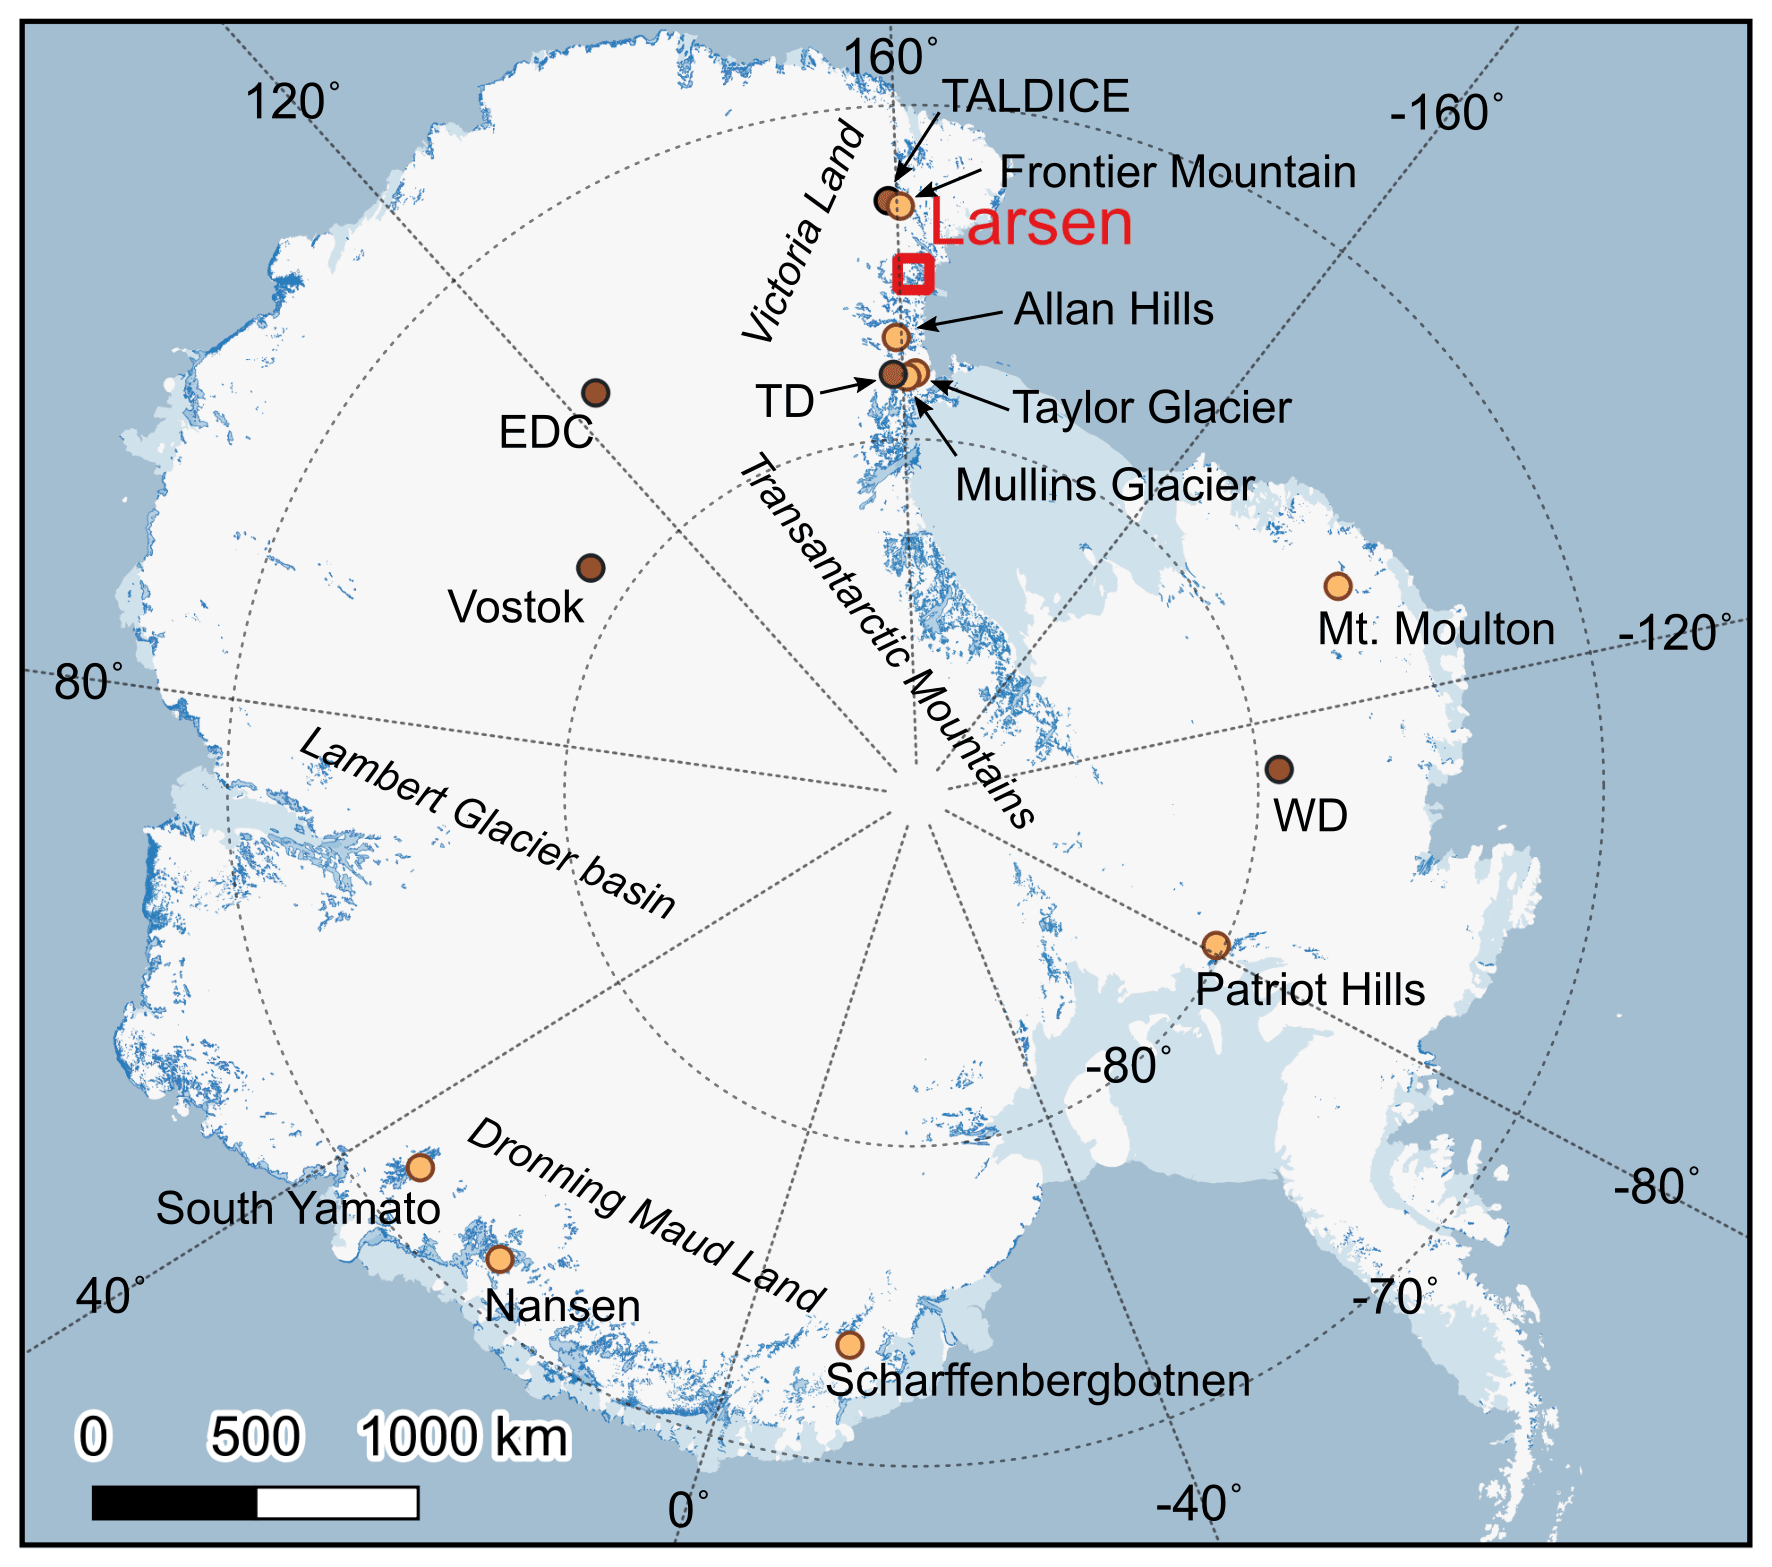
Figure 1Distribution map of BIAs in Antarctica. BIAs are noted in dark blue (Hui et al., 2014). Orange dots represent the BIAs where the chronology has been studied. Deep-ice-core locations with brown dots are labeled as follows: TALos Dome Ice CorE (TALDICE), Taylor Dome (TD), EPICA (European Project for Ice Coring in Antarctica) Dome C (EDC), West Antarctic Ice Sheet (WAIS) Divide (WD), and Vostok. To keep a consistent orientation with the GPR profile in Fig. 3, we flipped the classical map of Antarctica (East Antarctica to the left-hand side). The Antarctic map was obtained from the QGIS (geographic information system) Quantarctica package.
Our study focuses on the chronostratigraphy of ice in the Larsen BIA, with the goal of facilitating future research in this region. We describe the local ice flow and structure of the ice layers using dust bands and ground-penetrating radar (GPR) surveys and assess the alterations of the measured stable water isotopes, greenhouse gases (CH4 and CO2), and gas isotopes (δ15N–N2 and δ18Oatm). To constrain the unknown gas and ice ages, δ18Oatm, CH4, and δ18Oice are correlated with existing ice core records. We also independently confirm the ages using the radiometric 81Kr dating method. Finally, using δ15N–N2 and the Δage (ice and gas age difference) results, we present a record of surface temperature and accumulation rate. For this, in contrast to previous studies, which used the Herron–Langway model (Herron and Langway, 1980; Baggenstos et al., 2018; Menking et al., 2019; Yan et al., 2021), we apply a recently developed analytical framework which does not require stable water isotope values to estimate past surface temperatures and accumulation rates (Buizert, 2021).
2.1 Larsen blue-ice area (BIA)
We sampled ice from the Larsen BIA, an outlet glacier in northern Victoria Land, East Antarctica, during the austral summer of 2018/19. The Larsen BIA is located approximately 85 km southwest of the Korean Jang Bogo Station (Fig. 2a). The mean annual temperature is −24.4 ± 11.7 ∘C (1σ) (for the year 2016; data and information were obtained from the Meteo-Climatological Observatory at MZS – Mario Zucchelli Station – and Victoria Land of PNRA – Programma Nazionale di Ricerche in Antartide; http://www.climantartide.it, last access: 1 February 2019), cold enough to prevent ice melting in the summer. Consequently, the ablation of ice at the surface occurs through sublimation. There were ∼ 20 cm wide dust bands with gentle folding structures in the mid- to downstream part, while we observed severely folded dust bands (e.g., S and Z folds) in the upstream part (Fig. 2b). Dust bands are frequently observed in BIAs in Victoria Land and can be used as isochrons (Sinisalo and Moore, 2010). To obtain ice samples with a simple stratigraphy, we avoided ice coring in areas with complex fold structures and sampled ice in the direction of ice flow identified by the Antarctic ice velocity map in the QGIS Quantarctica package (Rignot et al., 2011; Mouginot et al., 2012; Matsuoka et al., 2018, 2021). In contrast, the stratigraphy of the upstream ice, where we collected surface ice, may be inverted and repeated on a scale of tens of meters. Shallow ice cores were drilled along a 1 km long transect at intervals of 20–30 m (Fig. 2b). Most ice cores had lengths of approximately 2 m, but ice core no. 23 (74.9319∘ S, 161.6018∘ E) was ∼ 10.4 m (Fig. 2c). We also collected near-surface ice samples (∼ 500 g) along a 1.3 km transect at 20 m intervals to measure stable water isotopes of the ice (δ18Oice and δ2Hice) at depths of ∼ 5–10 cm (hereafter referred to as the surface ice sample). The average horizontal spacing of the surface ice samples and ice cores was approximately 10.3 m. The ice core TF (Tarn Flat) (74.93042∘ S, 161.56975∘ E) with a length of ∼ 12 m on the upstream side was sampled in 2016 for a preliminary study, as described by Jang et al. (2017). An imaginary line parallel to the ice flow direction was used to define the horizontal distance, while a perpendicular line from each sampling location to the line parallel to the ice flow direction was projected to identify the intersection point. Each intersection point was then used to measure the horizontal distance from the most upstream sampling site (Fig. S1).
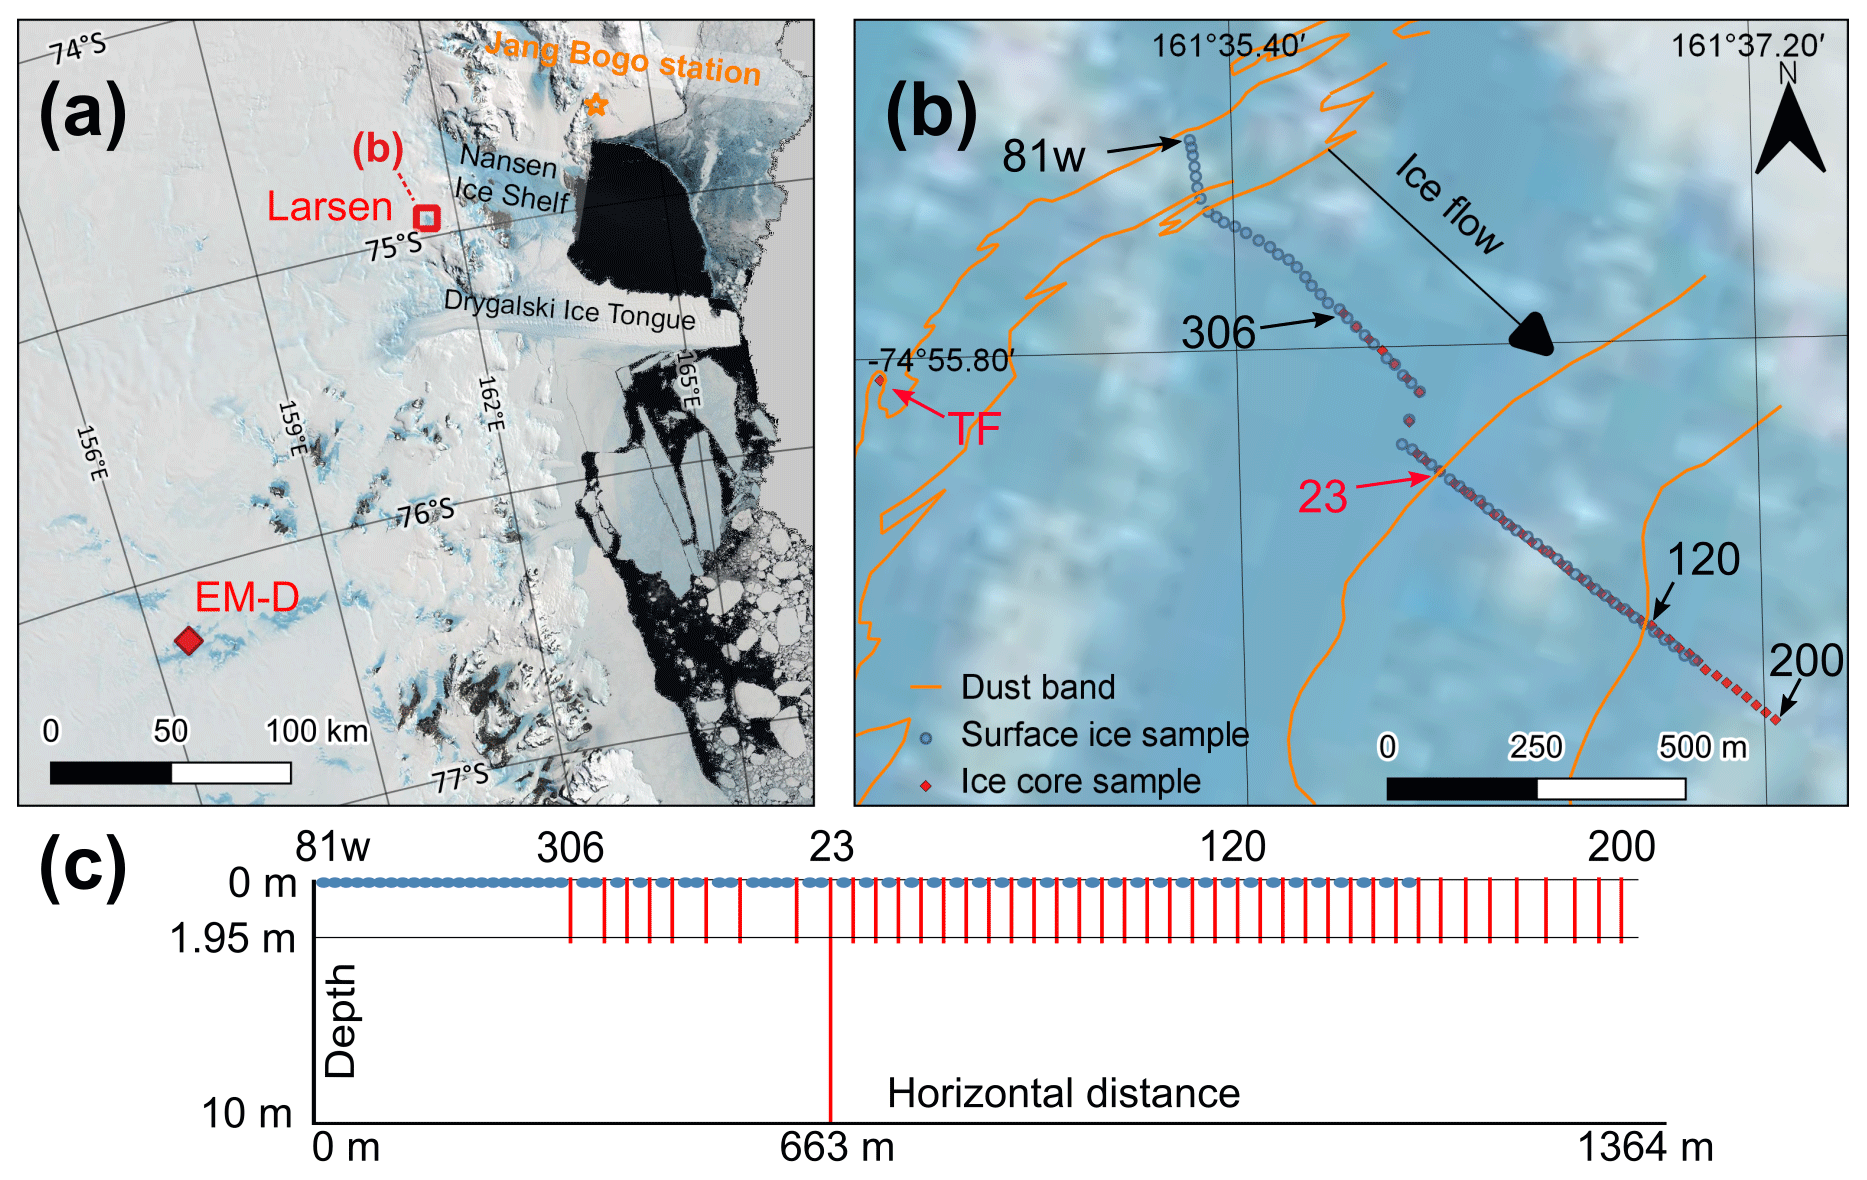
Figure 2Location of the Larsen BIA and sample collection. (a) Location of the Larsen BIA, EM-D (Elephant Moraine) core, and Jang Bogo Station. (b) Magnified map of the Larsen BIA, including sample locations. Orange lines represent dust bands observed in the blue-ice field. The line marks are derived from Google Earth imagery (https://earth.google.com/web/@-74.93,161.58,1080.8673325a,2487.72294087d,49.37163057y,347.89929343h,0t,0r, last access: 2 May 2022). Blue dots represent locations of surface ice samples. Red diamonds are locations of shallow ice cores. Six representative names are shown: red letters are for ∼ 10 m long cores (TF and no. 23), and black letters are for 2 m long cores (no. 306, no. 120, and no. 200) and surface ice (81w). Z and S folds are identified by the dust bands at upstream sites. The total length of the ice sample transect is approximately 1.4 km. (c) Schematized cross-section of the transect. Satellite photo of Antarctica is from the QGIS Quantarctica package (Bindschadler et al., 2008).
2.2 Ground-penetrating radar (GPR) survey
Approximately 17 km of GPR data was collected during 2 d in January 2019 (Fig. S1). A MALÅ ProEx (Professional Explorer) impulse radar system with a 50 MHz unshielded antenna for a larger penetration depth was used for data acquisition. Records were obtained at a sampling frequency of 559.5 MHz, with a time interval 0.1 s, and stacked four times. The survey was conducted at a speed of 2.5–3 km h−1 to minimize noise caused by frictional vibrations between the antenna and the surface of the glacier. The position of traces was recorded using a single-frequency code-phase GPS with an accuracy of <3 m. Data processing was performed in Reflexw v9.5 in the following order: dewow, DC (direct current) filter, band-pass filter, time-zero drift, energy decay correction, background removal, static correction, migration, and stack. As the constant radar signal velocity v in the glacier was 0.17 m ns−1 (Borgorodsky et al., 1985; Reynolds, 1985) and the frequency f of the radar system was 50 MHz, the GPR wavelength λ was about 3.4 m ().
2.3 Stable water isotope measurement
Stable water isotopes (δ18Oice and δ2Hice) were measured simultaneously at the Korea Polar Research Institute (KOPRI) using the cavity ring-down spectroscopy (CRDS) method using a Picarro L2130-i with a vaporizer (A0211). Surface ice samples (∼ 5–10 cm depth) and ice core samples (10–30 and 190–200 cm depths of ice cores) were used for the analyses. Ice from the ∼ 10 m long core no. 23 was measured at 20 cm vertical intervals. Ice samples were kept in Whirl-Pak bags and melted at room temperature. The melted sample was then injected into a 2 mL vial via a disposable syringe with a 0.45 µm filter. One batch of measurements consisted of 5 duplicate samples (10 samples in total) and a working standard. The first and second aliquots of the sample were measured 12 times each, while the working standard was measured 20 times. The last six measurements were used to remove memory effects from the previous samples. The precision was evaluated by measuring the working standard repeatedly (n=67); 1σ (standard deviation) was 0.07 ‰ for δ18Oice and 0.90 ‰ for δ2Hice. The working standards and samples were calibrated against the international standards for water isotopes, VSMOW2 (Vienna Standard Mean Ocean Water 2), SLAP2 (Standard Light Antarctic Precipitation 2), and GISP (Greenland Ice Sheet Precipitation).
2.4 Greenhouse gas (GHG) measurement
The CH4 concentrations in the ice cores (no. 306, no. 23, no. 120, and no. 201) were analyzed at Seoul National University (SNU) using a melt–refreeze technique with a flame ionization detector gas chromatograph (FID-GC) at 10 cm vertical intervals. The CH4 measurement process is described in detail by Yang (2019). Briefly, we trimmed the outermost side and the cracks of the ice samples by approximately 2 mm with a clean band saw to eliminate contamination by ambient air. The mass of the ice used for measurement was about 35–55 g. Then, we placed the ice inside a custom-made flask and evacuated the flask. We used a 740.6 ppb standard air sample from the National Oceanic and Atmospheric Administration (NOAA) Global Monitoring Division (GMD) on the WMO (World Meteorological Organization) X2004A scale to establish a daily calibration line (Dlugokencky et al., 2005). The NOAA standard air was injected into four flasks containing bubble-free ice samples, which served as the control group. The CH4 mixing ratio of the control group was measured, and the daily average offset to the standard value of 740.6 ppb was considered a systematic error; thus, the daily average offset (average of the daily average offsets: 11.4 ± 3.2 ppb (1σ); average of the intra-day standard deviations of the control group: 3.7 ± 1.2 ppb (1σ)) was subtracted from each measurement result. The trapped gas in the ice was liberated by immersing the flask in a hot water and then refreezing the meltwater. In addition, as CH4 is more soluble than the major air components (N2, O2, and Ar), the CH4 concentration of the initially extracted air is lower than the original value. Therefore, a second gas extraction was conducted (refrozen meltwater was melted and refrozen once again) to correct the solubility effect.
The same ice cores (no. 306, no. 23, no. 120, and no. 201) were used for CO2 measurements. Generally, CO2 should be measured using a dry-extraction system rather than wet extraction because of its high solubility in water and the possibility of CO2 production by carbonate–acid reactions in ice melt (Delmas et al., 1980). Therefore, for our measurement, air was collected using a needle-crusher dry-extraction instrument and detected by FID-GC at SNU. The ice was pre-treated in the same manner as that for CH4, as described above, while the required amount of ice was 15–20 g. We placed the ice in the needle-crusher chamber, which was cooled to −35 ∘C during ice preparation. The CO2 results could be affected by adsorption and desorption by the instrument and the sample tube (Ahn et al., 2009). Therefore, before crushing the ice, NOAA standard air was released through the chamber and collected into the sample tube. The CO2 mixing ratio was measured, and the average offset with respect to NOAA standard air (systematic error) was subtracted from each measurement results. The CO2 mixing ratio of the standard air we used for making a daily calibration line was 285.66 ppm or 293.32 ppm (because gas in the tank had been exhausted), which is from NOAA GMD on the WMO X2019 calibration scale (Hall et al., 2021). Trapped air in the ice was collected in a sample tube cooled by a helium closed-cycle refrigerator (He-CCR) (∼ 12 K) after crossing the water trap (approximately −80 ∘C). The entire process is described in detail by Shin (2014).
We also used ice samples from 35 cores at depths of 190–200 cm (hereafter referred to as horizontal measurement) and ice core no. 23 to measure CH4, CO2, and N2O concentrations, along with other gas isotopes (see below), by a wet-extraction method at the National Institute of Polar Research (NIPR) in Japan. For CO2 and CH4, FID-GC was used, and for N2O, an electron capture detector (ECD) GC was used. To determine the concentrations of CH4 and CO2, a calibration line was established using TU-2008 (Tohoku University) scale standard air; for N2O, TU-2006 scale standard air was used. Details on the standard air used in this study (named STD 1, 3, and 5) are described by Oyabu et al. (2020). Three standard airs and a quadratic calibration line were used to determine the GHG concentration at NIPR, while a single standard air and a linear calibration line were used to determine the GHG concentration at SNU. Different calibration scales of standard air (TU and NOAA–WMO) and different calibration methods may contribute to an inter-laboratory offset of GHG concentrations. CO2 was measured again at SNU using the dry-extraction method at 190–195 cm depth for the horizontal measurement (Table S7). The ice preparation process is briefly explained in Sect. 2.5.
Here, we also report CH4 and CO2 measurement results of the EM-D core for comparison (76.253∘ S, 156.562∘ E) (Fig. 2), which was sampled on 13 December 2016 at Elephant Moraine Texas Bowl for a preliminary study (Jang et al., 2017).
2.5 Analyses of δ15N–N2, δ18Oatm, δ, and δ
O2, N2, and Ar isotopes were measured at NIPR using a dual-inlet mass spectrometer (Thermo Fisher Scientific Delta V). The isotope results were evaluated with respect to the modern atmosphere. As mentioned previously, we measured 35 ice cores at depths of 190–200 cm to evaluate how ancient-air compositions change horizontally and also measured gas isotopes using ice core no. 23 at several depths with a range of 0–10 m to compare with the results from the neighboring cores at depths of 190–200 cm. Because gas loss fractionation by molecular diffusion during storage could have affected the isotope results (Ikeda-Fukazawa et al., 2005; Oyabu et al., 2021), we trimmed the surface and the cracks of the ice approximately 3–5 mm and then shaved away some blurry ice surface using a ceramic knife. The weight of the ice obtained was 55–80 g after trimming the surfaces. The ice inside the vessel was evacuated for ∼ 120 min. To extract the gas, each vessel was gradually immersed in a hot-water container. Simultaneously, the released air was collected into a sample tube, which was cooled by an He-CCR. After homogenizing the sample tube overnight, the gas was split into two aliquots, one for isotope analysis (1.5 mL) and the other for greenhouse gas measurement (5 mL). The measurement process is described in more detail by Oyabu et al. (2020).
Obtaining a true δ18O value in the past atmosphere from ice cores requires gravitational, thermal, and gas loss fractionation corrections. The gravitational factor is proportional to the difference in the mass number between isotopes (Craig et al., 1988; Severinghaus et al., 1998). Therefore, δ18O () was affected twice as much as δ15N () by gravity. Hence, each gas isotope was gravity-corrected using Eq. (1):
Following the same principle, δ is more affected than δ15N, by a factor of 4; thus it was corrected using Eq. (2) and used to assess the gas loss fractionation:
Along with gravitational correction, thermal fractionation should also be considered because temperature gradients in the firn column affect the distribution of the isotopes (Severinghaus et al., 1998; Goujon et al., 2003). However, thermal fractionation is typically small in Antarctic ice cores due to the relatively gradual nature of surface climate change (Goujon et al., 2003). Comparing () and δ15N together allows for the discrimination of the contribution of thermal and gravity fractionation (Severinghaus et al., 1998). However, for our samples, thermal fractionation could not be considered because 36Ar interfered with 36O2.
Following Capron et al. (2010), we did not correct for gas loss fractionation in our samples because the 2,gravcorr values were significantly greater than −30 ‰, except for one measurement for sample no. 301 (Tables S4 and S5). 2,gravcorr of around −30 ‰ indicates that the ice is poorly preserved and has experienced considerable gas loss during either drilling or storage (Landais et al., 2003). We did not use the results of no. 301 when constraining the gas age using δ18Oatm. Gravity-corrected 2,gravcorr () is listed in Tables S4 and S5 but was not used in this study.
2.6 81Kr dating
For the 81Kr measurement of ice core no. 23 and TF, 5.3 kg (depth: 711–1040 cm) and 5.4 kg (depth: 798–1192.5 cm) of ice were used, respectively. Air for the 81Kr measurement was extracted at SNU using the instrument provided by the University of Science and Technology of China (USTC). The ice was kept in a tank with an O-ring lid and evacuated using a dry scroll pump with a water trap, then melted by immersing the tank in hot water. The released gas was collected in containers and shipped to the USTC for Kr purification and 81Kr analysis using Atom Trap Trace Analysis (ATTA). The extraction procedure was described in detail by Tian et al. (2019), and the principle of ATTA is described by Jiang et al. (2012).
The anthropogenic 85Kr was measured simultaneously with 81Kr to quantify any contamination with modern air. For both samples, the measured 85Kr activity was below the detection limit; hence no correction for contamination with modern air was necessary. For the calculation of the 81Kr ages, the changes in the past atmospheric 81Kr abundance due to variations in the cosmic ray flux on Earth (Zappala et al., 2020) were considered. The age uncertainty calculation was based on the statistical error in atom counting.
2.7 Development of the WD2014 timescale for TALDICE
When constraining the ice age of the Larsen ice, the TALDICE record was selected to synchronize Larsen δ18Oice because of its proximity to the Larsen BIA. For the TALDICE ice core, we used a timescale that was synchronized to the WAIS Divide (WD) WD2014 chronology (Buizert et al., 2015; Sigl et al., 2016) in the following way: the ice age scales were synchronized using volcanic deposits identified in sulfur/sulfate data from the WD and TALDICE cores (Severi et al., 2012; Buizert et al., 2018). Next, the TALDICE gas age–ice age difference (Δage) was established empirically by matching abrupt changes in atmospheric CH4 to the WD core; at each match point, this provided one discrete Δage constraint. A dynamical firn densification model based on Herron–Langway firn physics (Herron and Langway, 1980) was then used to interpolate between these empirical Δage constraints in order to obtain a TALDICE gas age scale for all depths (Buizert et al., 2021).
3.1 Ground-penetrating radar (GPR) survey
In the GPR survey, we identified ice layers (or isochrones) in the transect parallel to the ice flow direction (Fig. 3). The dips of the ice layers range from 1 to 6∘ with a decreasing trend from the upstream to the downstream direction. The ice layers of the radargram were not clearly visible at a depth of <10 m because of the direct wave signal. We did not observe any stratigraphic folding structure in the ice layers (and associated age inversion) along the ice flow direction in the mid- to downstream areas (from ice cores no. 23 to no. 200). Therefore, we expect monotonic and continuous age changes along the ice flow direction. However, as shown in the dust bands with S and Z folds in the upstream area (Fig. 2b), the upstream stratigraphy might be repeated on a scale of tens of meters (from 81w to ice core no. 23). In addition, the subsurface ice layer in the upstream area (0–800 m from the most upstream side) was not well recognized from the GPR profile (Fig. 3c). It is possible that the noise caused by (subsurface) crevasses, cavities, or cracks obscured the signals. In addition, accurate data acquisition might have been hindered by antenna tremors or low battery power at severely cold temperatures. The basal topography is well defined from the GPR data; we observed an ice thickness variation of 200–380 m (Fig. 3a and b). The results of the bedrock elevation and ice thickness (Fig. 3a) were obtained using a kriging method. The ice thickness decreases as ice flows with increasing bedrock elevation, which is a favorable condition for old ice to be exposed at the surface.
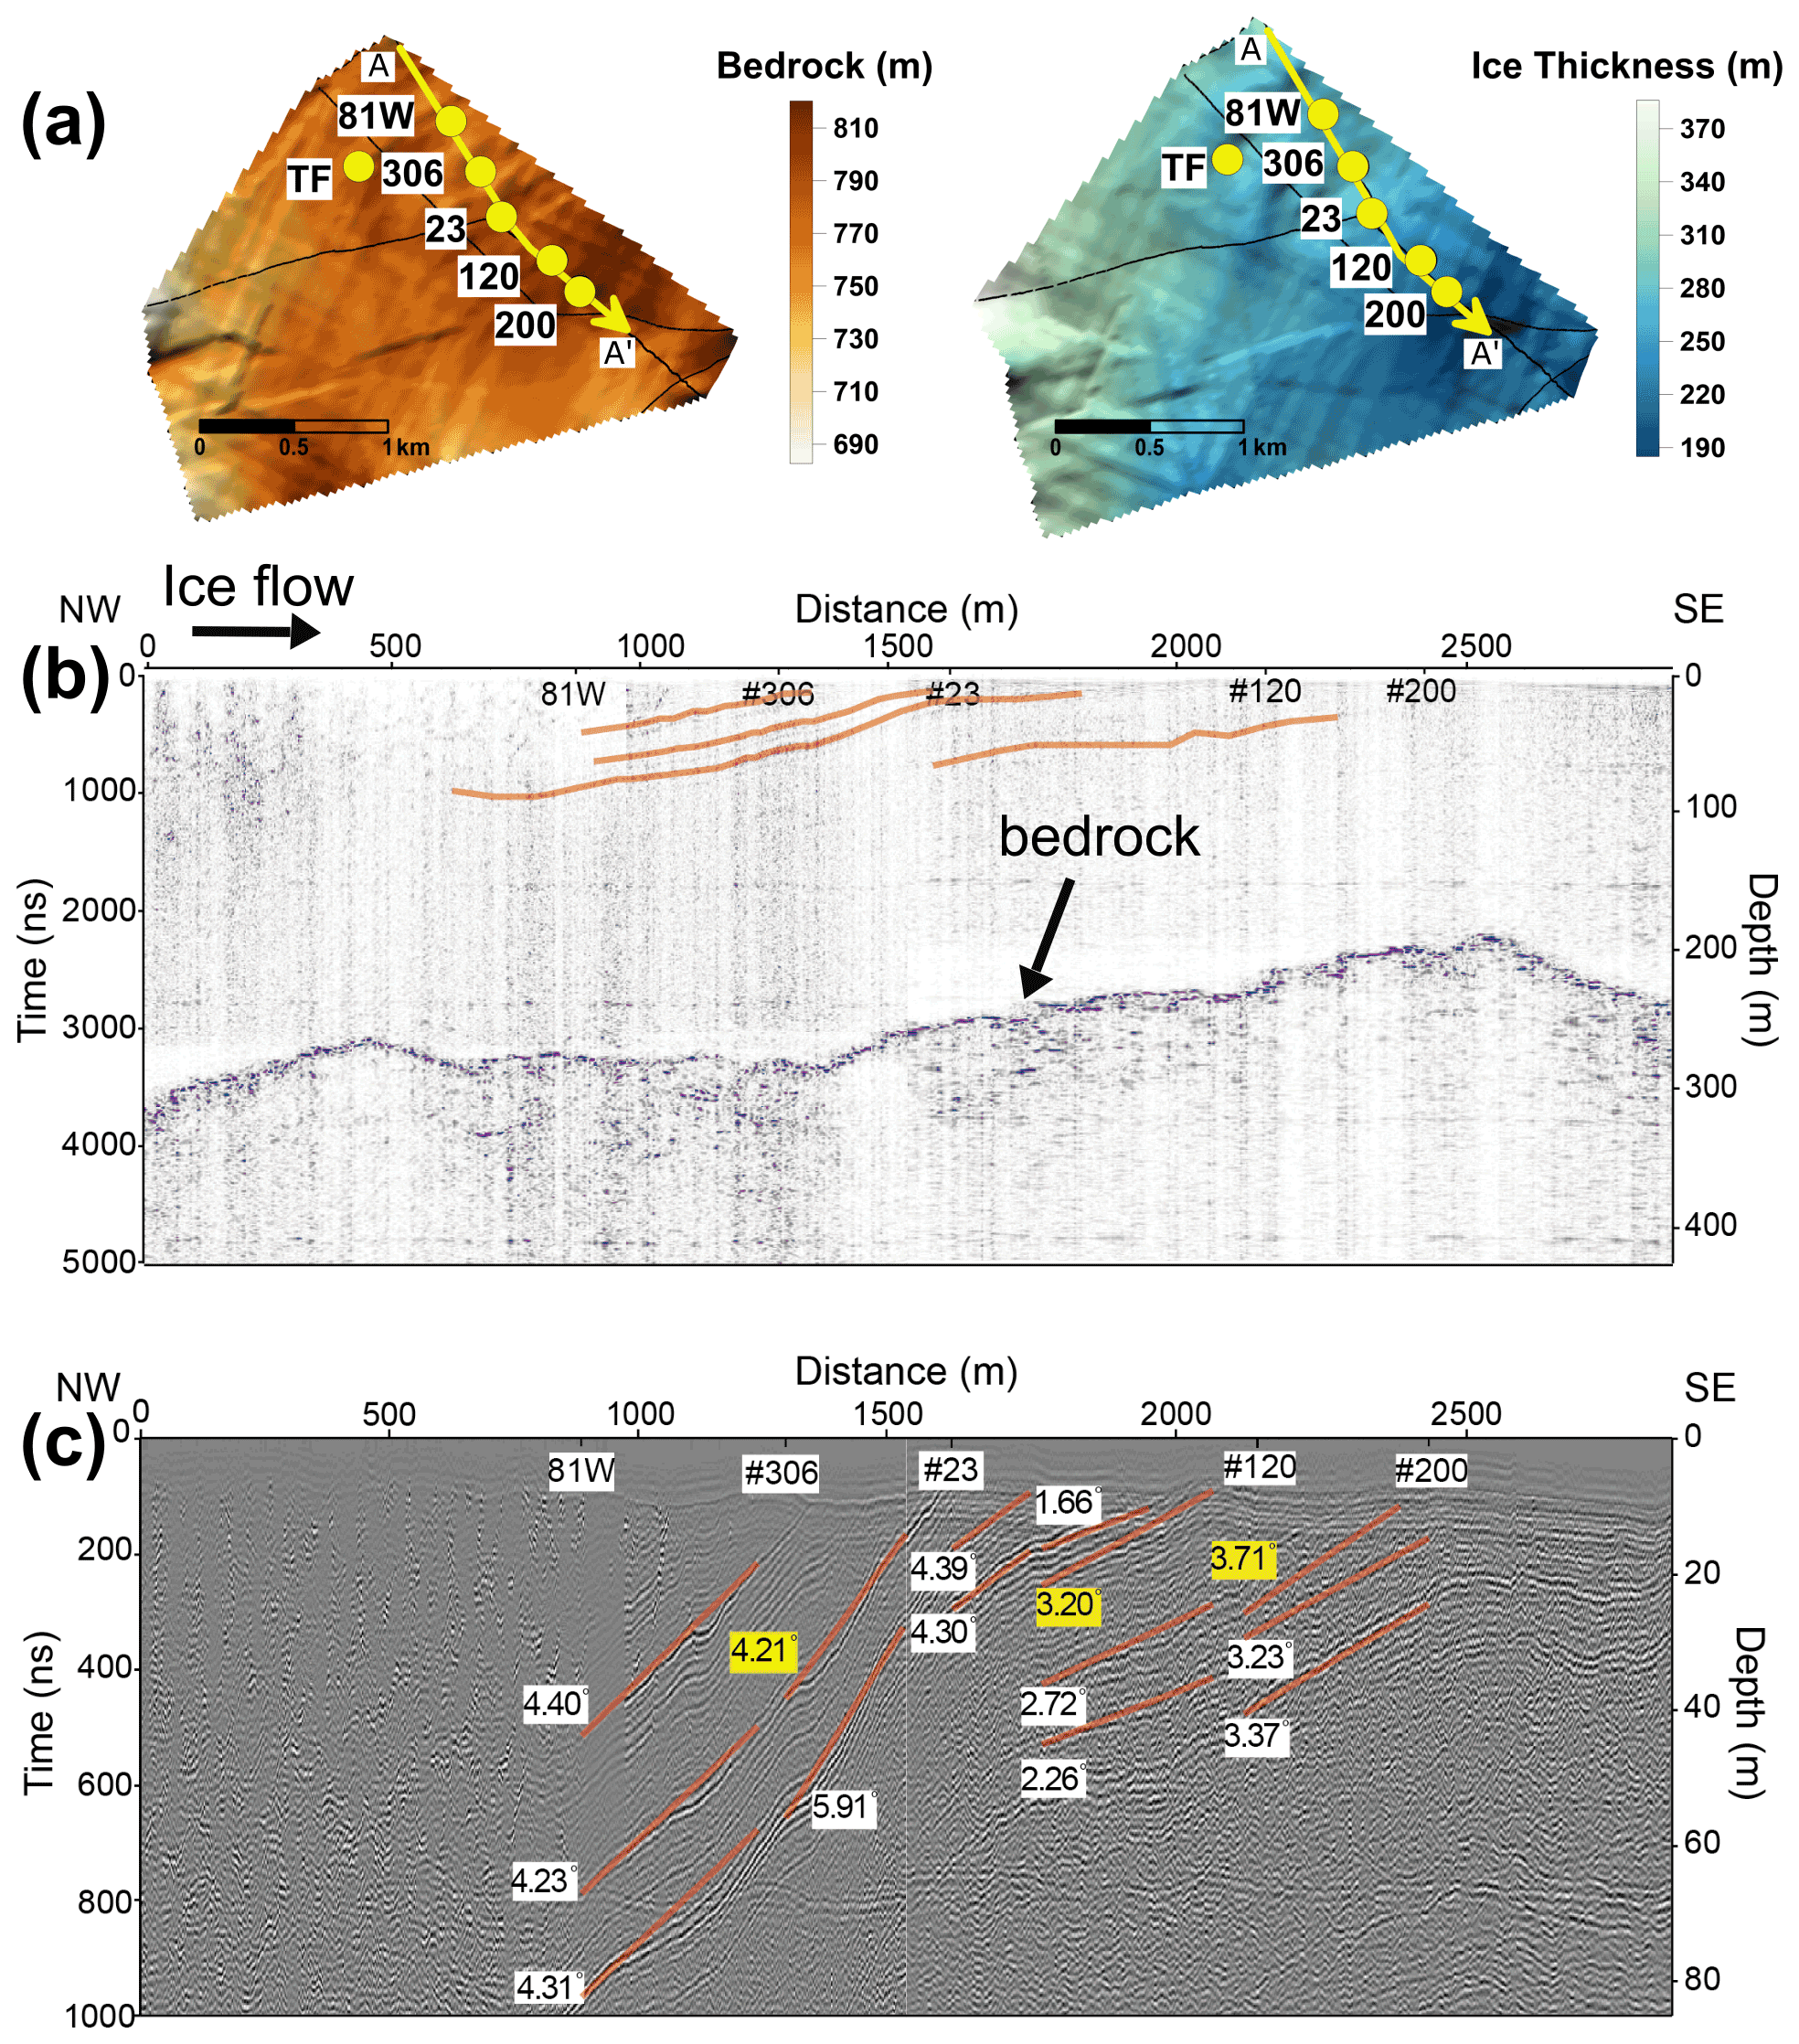
Figure 3Ground-penetrating radar (GPR) survey overview. (a) Bedrock elevation and ice thickness of the Larsen BIA. (b) GPR profile of the transect (A to A′ in a) through the blue-ice field. Identifiable ice layers are indicated in orange lines. Ice layers are not well identified at a distance of <800 m. (c) Enlarged upper 80 m of the GPR profile. Ice layers at a distance of >2500 m have a relatively flat dip. Vertical axis is exaggerated, and the dip of the ice ranges between 1 and 6∘. The average dips used for estimating the ice ages at 1.95 m depth are indicated by yellow boxes.
3.2 Stable water isotopes
Stable water isotopes in ice record surface temperatures of the past at snow deposition sites (Jouzel et al., 1997). The δ18Oice and δ2Hice records of the Larsen BIA are presented in Tables S8, S9, and S10. The horizontal δ2Hice has a distinct local minimum around a horizontal distance of 600–800 m, indicating a transient cold event (Fig. 4b). The δ2Hice of the transient cold event plunges by approximately 70 ‰, heading to the upstream ice. The most downstream sample, ice core no. 200, has a δ2Hice of −369 ‰. Conversely, the most upstream sample, surface ice 81w, has a δ2Hice of −245 ‰. Ice core no. 23, located in the middle of the transect, and the vertical δ2Hice profile range between −353 ‰ and −291 ‰. The water isotope values from the Larsen BIA are scattered over a wider range than most other published ice core records (Petit et al., 1999; EPICA Community Members, 2004; Stenni et al., 2011). A highly variable δ18Oice has also been reported at Taylor Glacier (Baggenstos et al., 2018; Menking et al., 2019). Severe scattering might indicate that the accumulation zone (original source of ice) of the Larsen BIA might have experienced more variability in temperature and/or the vapor source (variability in atmospheric conditions) than other sites. The wider range of water isotope values during the deglaciation as compared to other published ice core records might be due to a higher increase in temperature and/or because of the spatial difference between the original deposition site of upstream and downstream ices. Deuterium excess (d=δ2HOice) shows a wide range (8.44 to −8.69 ‰, Table S8) from the entirety of the near-surface ice samples. The negative d excess likely indicates that isotopic fractionation is attributed to the sublimation of ice in the accumulation zone (Hu et al., 2021). Negative d-excess values were also observed in the Allan Hills BIA (Hu et al., 2021). Meanwhile, sublimation can deplete 16O and 1H in ice, thereby enriching isotopic ratios (δ18Oice and δ2Hice). Thus, a negative value of d-excess results indicates that stable water isotopes are not proper proxies for the changes in temperature and vapor sources.
To match the two δ2Hice profiles (measurement of ice core no. 23 and horizontal measurement of near-surface ice), the depth of ice core no. 23 was converted to the horizontal distances by pinpointing the deepest result of no. 23 to the result of ice core no. 104. The horizontal distances for the rest of core no. 23 were assigned through linear interpolation. The two δ2Hice profiles match well, as indicated by an r2 value of 0.86 (p<0.001) (Fig. 4b). The similarity of δ2Hice between the vertical and horizontal measurements demonstrates that the ice stratigraphy was not disturbed. The average difference in the values of δ2Hice between vertical ice core no. 23 and the horizontal record is 9.8 ‰ and 0.6 ‰ for δ18Oice. We assume that the average difference is the uncertainty (1σ) of stable water isotope values of the Larsen ice. The ∼ 10 m long no. 23 core covers ages that correspond to a surface distance of ∼ 117 m, from which we calculate an average dip of the ice layer of 4.96∘, which is comparable with the average dip derived from the GPR profile (Fig. 3c). This depth–distance relationship is also supported by the comparison of gas isotope values (δ18Oatm and δ15N–N2) from ice core no. 23 to the records from the horizontal measurement at a depth of 1.95 m (Fig. A2).
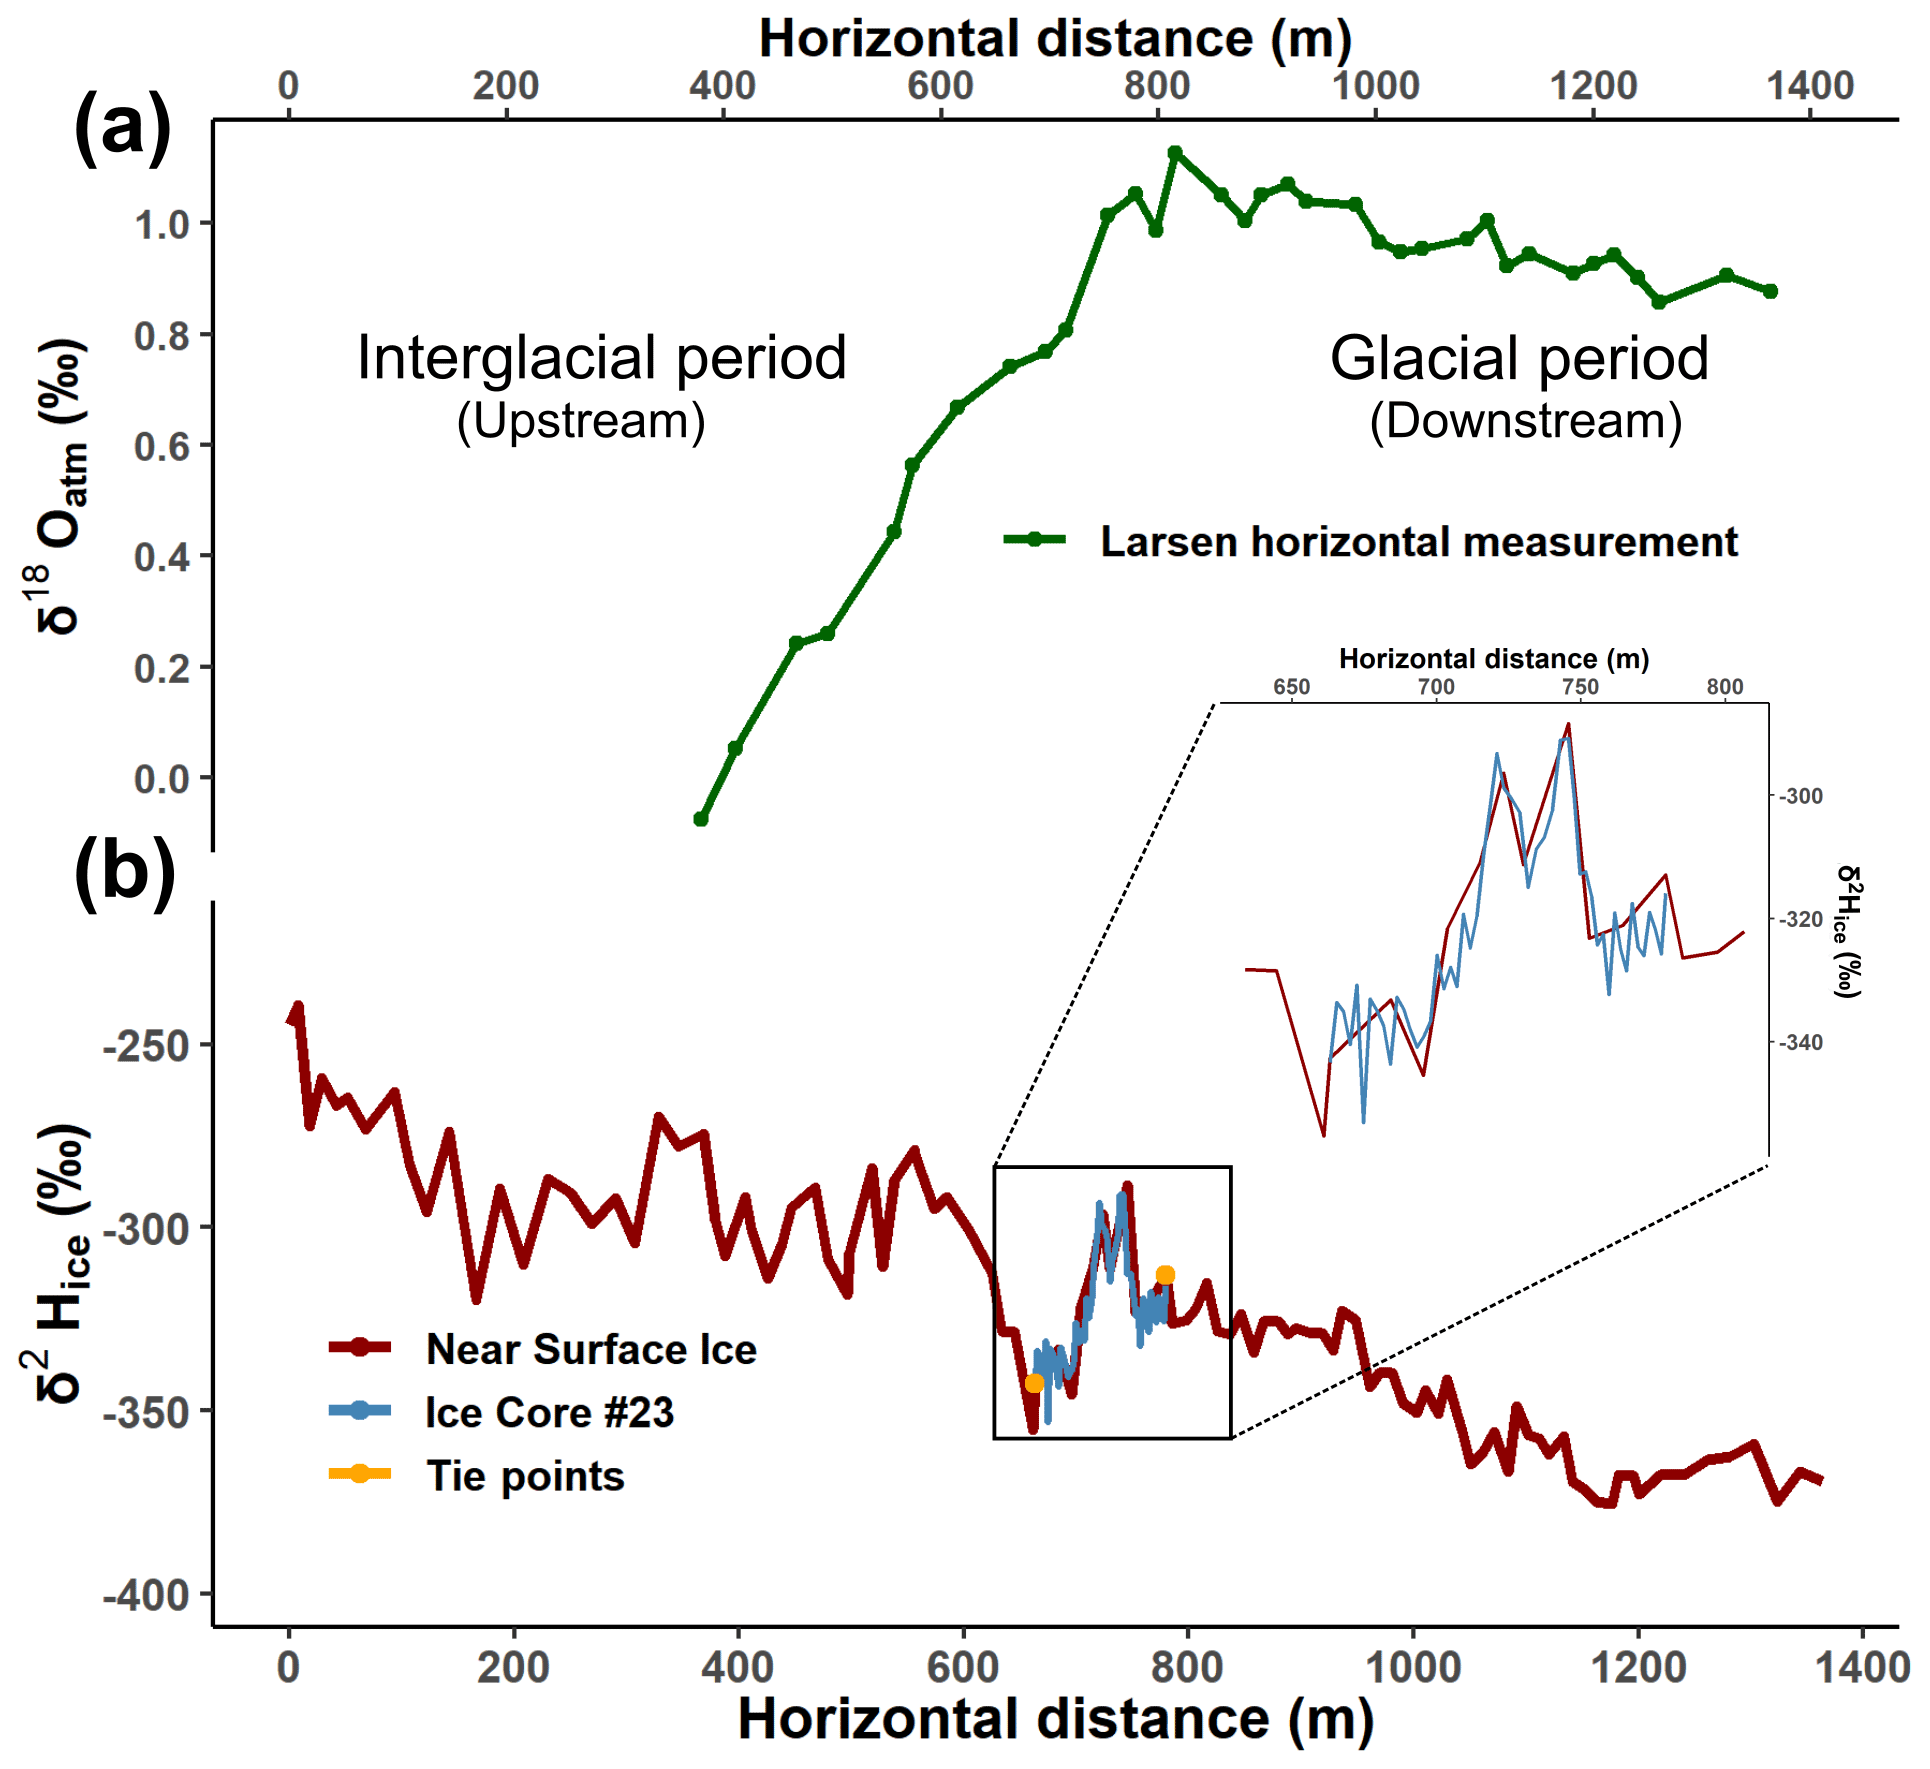
Figure 4δ18Oatm and δ2Hice records from the Larsen BIA. (a) δ18Oatm from each ice core at a 1.95 m depth (horizontal measurement). The δ18Oatm of the horizontal measurement was gravity-corrected using Eq. (1). (b) δ2Hice from near-surface ice (∼ 5–10 cm depth surface ice samples and 10–30 cm depth ice core samples) and ice core no. 23. The surface ice record was matched with core no. 23 using two tie points (orange dots), with a corresponding r2 value of 0.86 (p<0.001).
3.3 Analysis of gas entrapped in the ice
3.3.1 CH4 and CO2 mixing ratios
The measurement results of the CH4 and CO2 concentrations for the vertical cores are presented in Fig. A1. In the shallow ice cores (no. 306, no. 120, and no. 201) greenhouse gases are significantly altered for the top 2 m, showing out-of-range values of the range of natural greenhouse gas concentrations during the last 800 kyr: 340–800 ppb for CH4 and 180–300 ppm for CO2. The CH4 records of no. 23 also fluctuate significantly at 0–4.6 m depth, which is reduced at >4.6 m. CO2 records of no. 23, in contrast, gradually decrease and become steady at a depth of >4.6 m. A comparison of the results from NIPR and SNU for ice core no. 23 shows that the difference in the concentration decreases significantly at depths of >4 m. There are large differences (30–140 ppb) of CH4 at 0–4 m depths, but these decreased considerably (5–10 ppb) at a depth of >4 m. The CO2 difference was 10–20 ppm at <4 m but decreased to 2–10 ppm at a depth of >4 m (Tables S5 and S6). The CO2 mixing ratio of the TF core, reported by Jang et al. (2017), showed that CO2 was scattered even in the deeper part (>4 m) of the ice core. We speculate that this scattering is due to complicated ice stratigraphy, since we observed several folding structures identified by dust bands near the TF core site (Fig. 2b). Altered CH4 in near-surface samples have also been identified at Pakitsoq (Greenland), Taylor Glacier, and Elephant Moraine (Petrenko et al., 2006; Baggenstos et al., 2017). By combining our new measurements with those from the literature, we find the depth at which greenhouse gas concentrations stabilized appears to be inversely proportional to mean annual temperature (Table 1).
Table 1Depth of unaltered greenhouse gas compositions and mean annual temperature of BIAs.

a Depth of unaltered greenhouse gas compositions from Elephant Moraine Texas Bowl remains uncertain due to the lack of data at depth of >10 m. Mean annual temperature of Elephant Moraine: provided by KOPRI's automatic weather station (AWS) record of the years 2020 and 2021. b Allan Hills: not provided by an AWS but by stable water isotopes; c deduced by vertical profile of δ15N–N2 and δ18Oatm values in Allan Hills. d Taylor Glacier: assumed to be comparable with the mean annual temperature of nearby McMurdo Station (∼ 100 km away). e Pakitsoq (Greenland): assumed to be comparable with the mean annual temperature of the nearby town of Ilulissat (∼ 40 km away).
3.3.2 δ15N–N2 and δ18Oatm
As δ15N–N2 and δ18Oatm were measured at very shallow depths (∼ 1.95 m), we compared the horizontal results with the vertical distribution of ice core no. 23. The depths of ice core no. 23 were converted to horizontal distances at a depth of 1.95 m (Fig. A2) using Eq. (3):
where HD1.95 m represents the horizontal distance in meters (at 1.95 m depth) and Dno. 23 represents the depth of ice core no. 23. The length of 663 m reflects the distance between ice core no. 23 and the most upstream sampling site. The average dip of the ice layer (4.96∘) was calculated by matching the δ2Hice of ice core no. 23 with the horizontal records from the neighboring cores (Fig. 4b). The δ15N–N2 and δ18Oatm values obtained from the horizontal record at 1.95 m are comparable to those from ice core no. 23, except those from the very shallow depths of <0.5 m (Fig. A2), confirming that the gas isotope ratios are generally reliable at a depth of 1.95 m. We estimated the uncertainty in δ15N–N2 and δ18Oatm values as ±0.05 ‰ (1σ) because the differences between no. 23 and the horizontal record were approximately 0.05 ‰. Petrenko et al. (2006) also reported for a site in western Greenland that as long as the ice is not affected by surface ice melting, nitrogen and oxygen gas isotopes are not altered even at a depth of 0.3 to 0.4 m. In contrast, δ15N–N2 and δ18Oatm values in the Allan Hills are relatively stable below 7–10 m (Spaulding et al., 2013). No significant gaps, discontinuities, or anomalies were found within the results from horizontal measurements of δ18Oatm, indicating a relatively undisturbed stratigraphy (Fig. 4a).
4.1 Glacial-termination identification in the Larsen ice
The increase in δ2Hice and decrease in δ18Oatm from downstream (older ice) to upstream ice (younger ice) reflects warming atmospheric conditions over time (Fig. 4). More specifically, the δ18Oatm values of the Larsen ice (1.126 ‰ to −0.075 ‰) are typical of a glacial-termination period. Based on satellite imagery of the studied area, the Larsen BIA might have been located directly downstream of an accumulation zone, and the ice might have been originated solely from an accumulation zone because no other BIAs are identified upstream (refer to Fig. 1 in Zekollari et al., 2019). This expectation is supported by the GPR survey profile (Fig. 3b and c) and the δ18Oatm (Fig. 4a), which indicates no complex ice stratigraphy and no discontinuities in the downstream area of the Larsen BIA, respectively. In terms of this ice flow condition, we expect the age of the Larsen BIA corresponds to a relatively young one among the latest glacial terminations.
The maximum δ18Oatm value of >1 ‰ implies that the ice is younger than 800 kyr, as the glacial climate conditions became more extreme following the MPT (Lisiecki and Raymo, 2005; Elderfield et al., 2012; Chalk et al., 2017); values from the literature suggest that the maximum δ18Oatm values were <1.0 ‰ during pre-MPT glacial periods (Yan et al., 2019). The EPICA Dome C (EDC) record shows that Terminations I, II, IV, V, and VII are the only terminations that have both negative δ18Oatm values and values >1.0 ‰ over the last 800 kyr (Landais et al., 2013; Extier et al., 2018a) (Fig. 5). Hence, we exclude Terminations III and VI for the Larsen BIA ages. Among the candidates, Termination V should also be excluded because the maximum δ18Oatm value in the EDC record is ∼ 1.4 ‰, which is significantly higher than that of the Larsen ice. The δ2Hice decrease in the middle of the glacial termination in the Larsen BIA (Fig. 4b) is similar to that during the Antarctic Cold Reversal (ACR, 12.7–14.6 kyr BP), which is a distinct feature only during Termination I among the candidate terminations (i.e., Terminations I, II, IV, and VII) as observed in the EDC δ2Hice record (Fig. A4). To confirm the age of the Larsen ice, we compared the δ18Oatm–CH4 relationship with the ice from core no. 23 at depths of 4.6–10 m with EDC and the WAIS Divide (Fig. 6) and found that the Larsen δ18Oatm–CH4 distribution was well matched only at Termination I. The δ18Oatm of Larsen has a 0.05 ‰ offset with that of the WAIS Divide, which is within the same order of magnitude on the differences observed between core no. 23 and horizontal measurements at a depth of >1.95 m (Fig. A2). Due to the lack of a corresponding δ18Oatm record for the CH4 of core no. 23, the difference may also come from the δ18Oatm records that were estimated by linear interpolation. The δ18Oatm–CO2 and CO2–CH4 relationships do not clearly match with those of Termination I in the EDC and WAIS Divide records. The CO2 concentration of the Larsen ice is typically about 10–20 ppm higher compared to EDC and the WAIS Divide (Fig. A3), warranting further investigations. Finally, we confirmed the ages of the Larsen ice with 81Kr dating, indicating 9–41 and 14–43 ka for ice from the TF and no. 23 cores, respectively (Table 2), and concluded that the Larsen ice covers the Last Glacial Termination (LGT; T1). The ice sample details and krypton dating results are presented in Table 2.
Table 2Results of 81Kr and 85Kr analysis. Errors in the fifth to seventh column have a 1σ confidence level, whereas upper limits in the fourth column have a 90 % confidence level. The 81Kr age in the sixth column is given with the statistic error due to atom counting. The systematic error in the 81Kr age in the seventh column is due to the uncertainty in the half-life of 81Kr (229 ± 11 kyr). pMKr: percent modern krypton; dpm cc−1: decay per minute per cubic centimeter STP (standard temperature and pressure) of Kr. As 85Kr in modern air in Antarctica is around 65 dpm cc−1, the 85Kr of samples indicates that alteration by modern air is negligible.

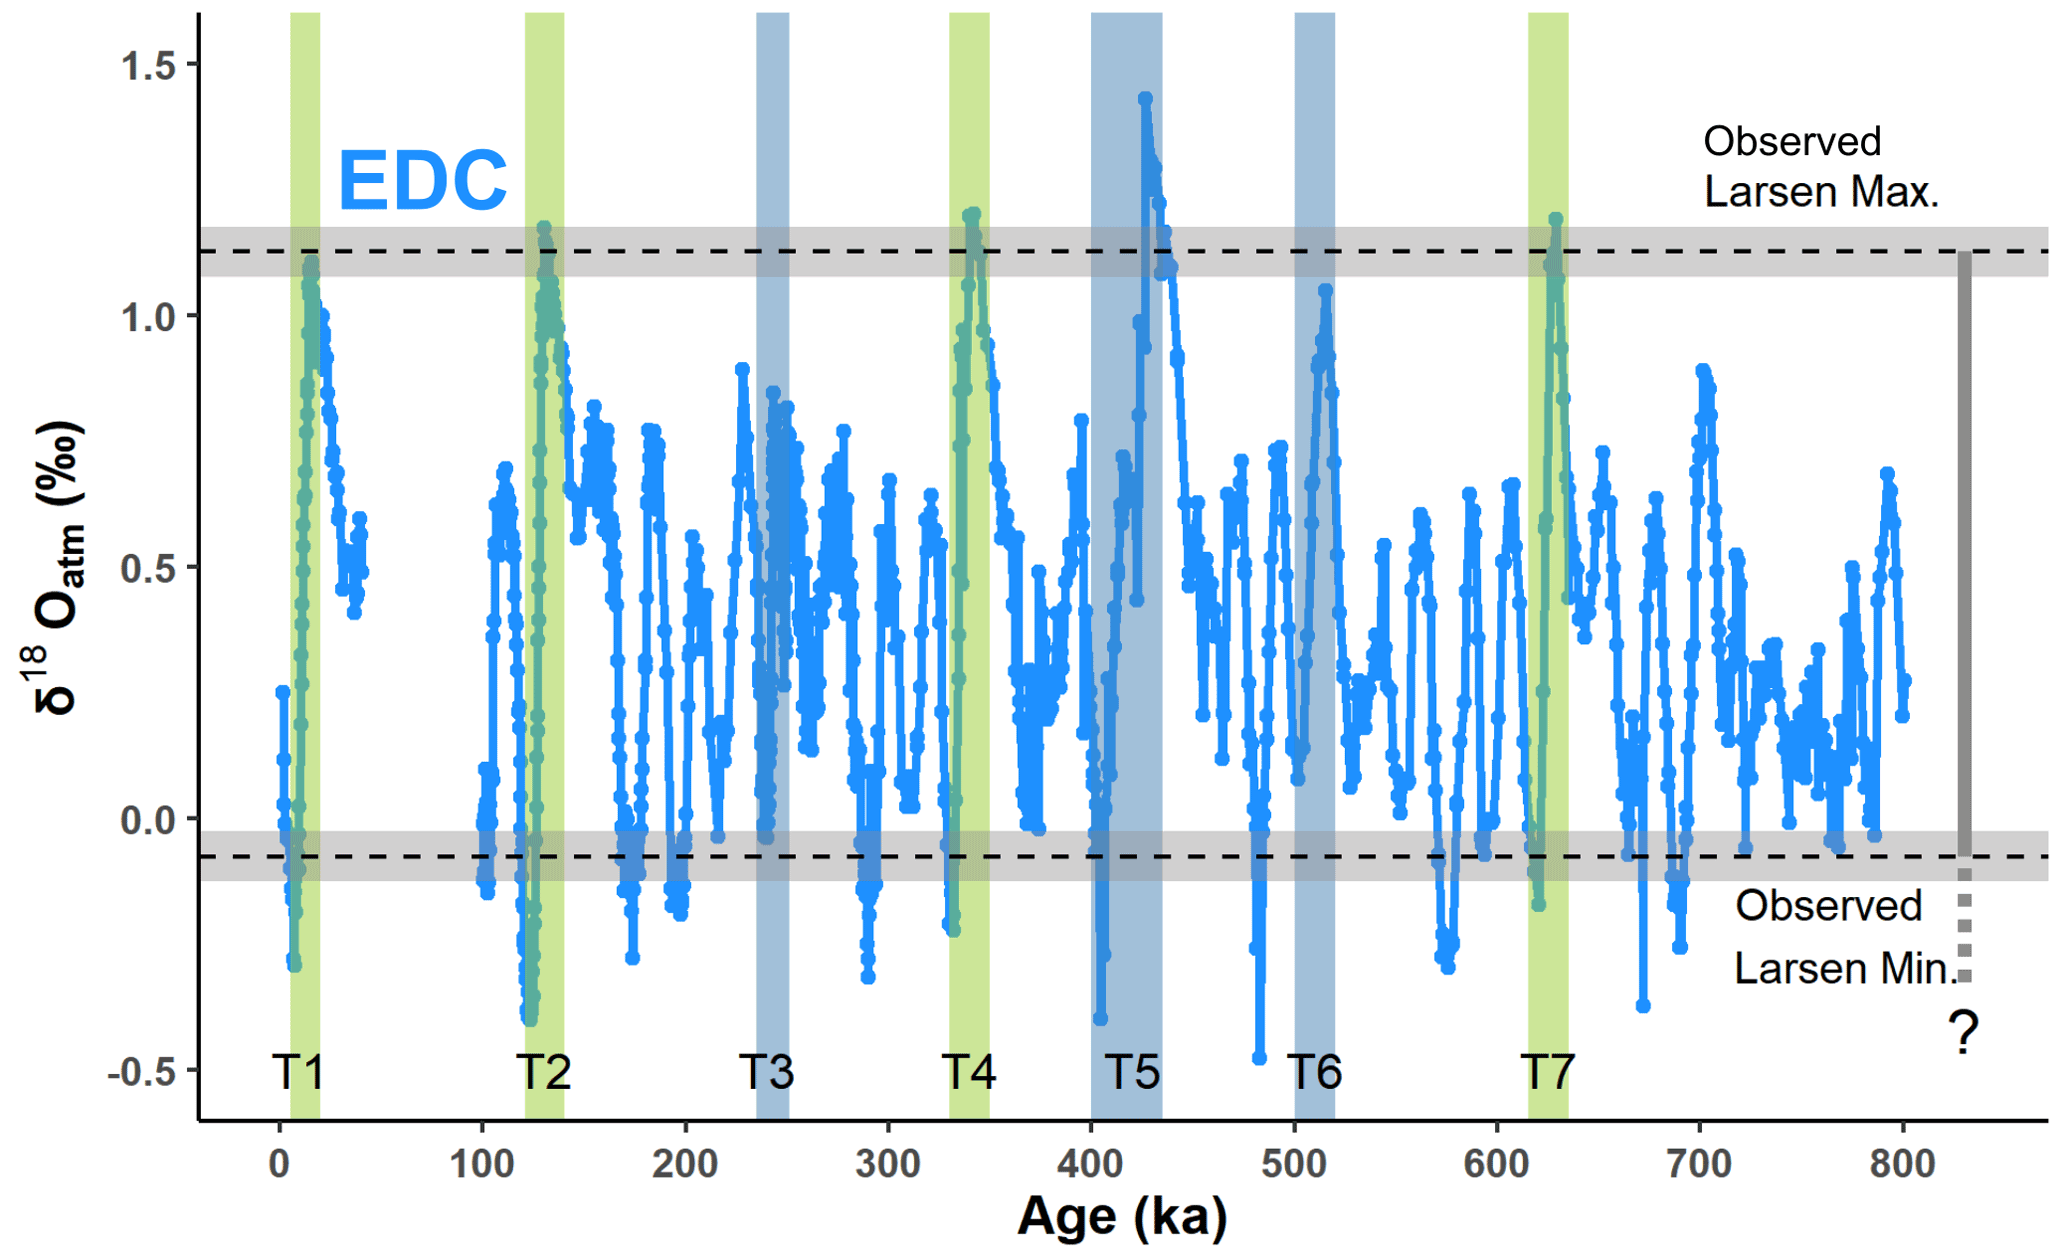
Figure 5Comparison of Larsen δ18Oatm with the EDC record. δ18Oatm records are from Landais et al. (2013) for 0–40 ka and Extier et al. (2018a) for 100–800 ka, respectively. Green vertical bars represent the candidate age intervals for Larsen blue ice. T: termination. The range of Larsen δ18Oatm values is shown as a vertical grey bar. Horizontal grey bars with dashed lines represent the uncertainty in the measured δ18Oatm from the Larsen BIA (Fig. A2).

Figure 6Comparison of the δ18Oatm–CH4 relationship in Larsen ice core no. 23 with existing records over glacial terminations. δ18Oatm and CH4 data of the WAIS Divide are from Severinghaus (2015) and Rhodes et al. (2017), respectively. δ18Oatm of EDC is from Landais et al. (2013) and Extier et al. (2018a). The CH4 record of EDC is from Bazin et al. (2013d). The area within the black box is magnified to compare the Larsen no. 23 record with those from the WAIS Divide T1 and EDC T1.
4.2 Gas ages of the Larsen ice
The CH4 was severely altered at a depth of 1.95 m, and the only available CH4 record was from ice core no. 23 below a depth of 4.6 m. Therefore, we developed the tentative gas age by correlating the horizontal δ18Oatm values to those from the WAIS Divide record on the WD2014 timescale. Then, fine correlation was conducted with the CH4 record from core no. 23, which corresponds to 13.3–14.1 kyr BP at depths of 4.6–10.4 m (Fig. 7d). We used the high-resolution records of CH4 from both Larsen core no. 23 and WAIS Divide ice, which greatly improves the precision of age construction compared to the age construction only based on δ18Oatm.
Spline curves were created for both WAIS Divide and Larsen δ18Oatm records to reduce artifacts from insufficient sampling resolution and/or ice quality at a 1.95 m depth of the Larsen ice (Fig. 7). The spline curve was drawn after interpolating the original records at 5 m horizontal distance intervals. Three points were selected, which divide the upstream part of the Larsen ice into three equal parts to tie with those in the WAIS Divide record (pink dots in Fig. 7a and b). For the downstream side of the Larsen ice, we selected a local maximum and a minimum as the tie points (purple dots in Fig. 7a and b) because the slope of the δ18Oatm spline curve is small. When the horizontal distance was >1280 m, the age was constrained by extrapolation using the age–distance relationship at 18–22 ka. Based on the tentative horizontal gas ages and the depth–distance relationship of core no. 23 (obtained from Fig. 4b), we determined the gas age of core no. 23 (∼ 10 m vertical ice core). A small temporal difference (53.6 ± 38.5 years) existed between the CH4 record of core no. 23 (>4.6 m) and the WAIS Divide record (difference between the red and dark blue lines in Fig. 7d). To eliminate this gap, four tie points (orange dots) were chosen and interpolated (light-blue line). The gas age, corresponding to 13.3–14.1 kyr BP, was obtained more accurately via CH4 correlation. As a result, the gas age for the Larsen ice at 1.95 m depth was estimated to be 9.2–23.4 kyr BP in the WAIS Divide chronology in 2014 (WD2014). The ages on the AICC2012 (Antarctic Ice Core Chronology) scale were estimated to be 9.4–23.4 kyr BP using the depth and the WD2014 age of EDC (Bazin et al., 2013a; Buizert et al., 2021). The age–distance relationship was reasonable (Fig. A6), showing no abrupt change, as supported by the gradual change in the ice layer dip (Fig. 3c). Refer to Sect. S1 in the Supplement for gas age uncertainty.
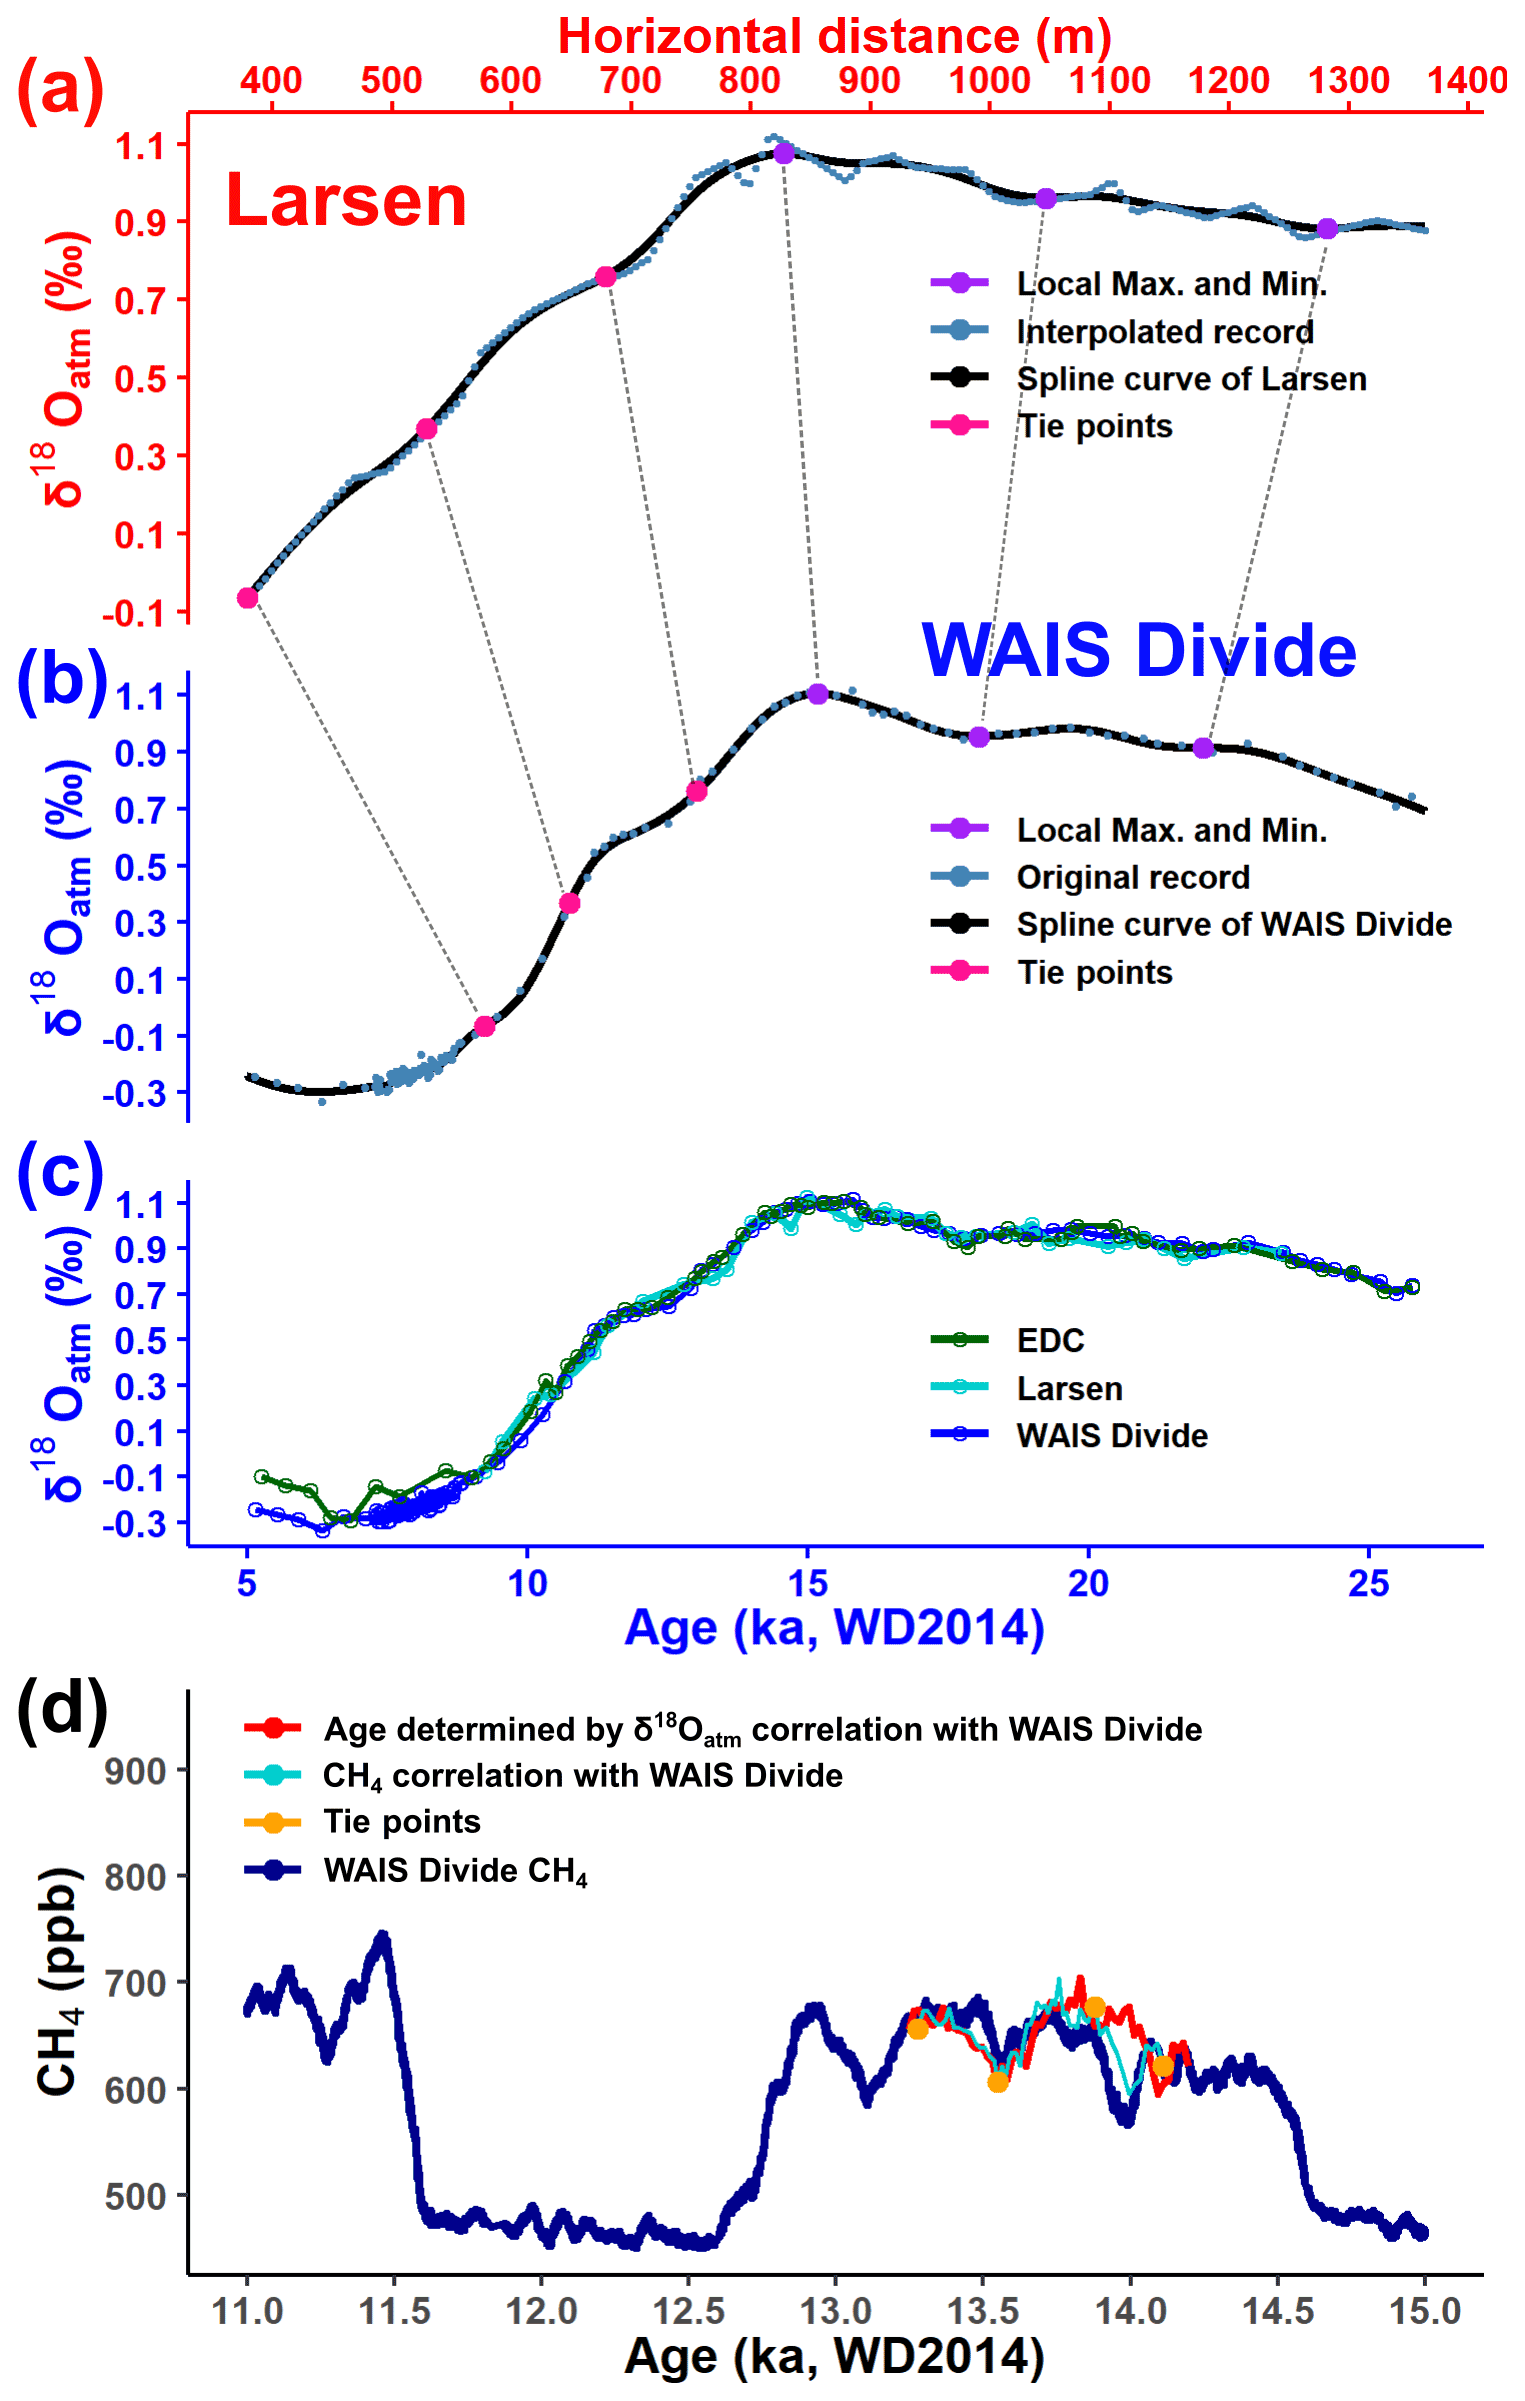
Figure 7Correlation of Larsen δ18Oatm and CH4 records with the WAIS Divide. (a) Interpolated δ18Oatm value at 5 m from the Larsen BIA with a spline curve. (b) δ18Oatm record from the WAIS Divide with a spline curve (Severinghaus, 2015). Six tie points were used to correlate each other. (c) Comparison of synchronized Larsen δ18Oatm with the EDC (Landais et al., 2013) and WAIS Divide records. (d) Comparison of the CH4 record from Larsen no. 23 (>4.6 m depth) with the WAIS Divide (Rhodes et al., 2017). Tentative gas age determined by δ18Oatm correlation with the WAIS Divide is tuned by correlating the CH4 record using four tie points. The WD2014 timescale for the WAIS Divide and EDC is from Sigl et al. (2016) and Buizert et al. (2021), respectively.
4.3 Ice ages of the Larsen ice
The ice ages of the Larsen ice were determined based on the δ18Oice correlation with the TALDICE record (Fig. 9). TALDICE was selected since the coring site is close to the Larsen BIA (∼ 240 km apart) and the direction of the TALDICE site from the Larsen BIA is similar to the ice flow direction of the Larsen ice (Rignot et al., 2011; Mouginot et al., 2012). It is likely that the trend of surface temperature changes in the snow accumulation zone of the Larsen BIA is comparable to that of the TALDICE site. Spline curves were constructed for the horizontal measurement of the surface ice. As described above, the horizontal resolution has been increased by interpolating the original δ18Oice records at 5 m intervals. The correlation was established by visually selecting a similar inflection point. Then, to validate the ice age, we estimated the ice age at a 1.95 m depth (see below) and calculated the Δage; Δage for the Larsen ice is defined as (ice age) − (gas age) at a depth of 1.95 m.
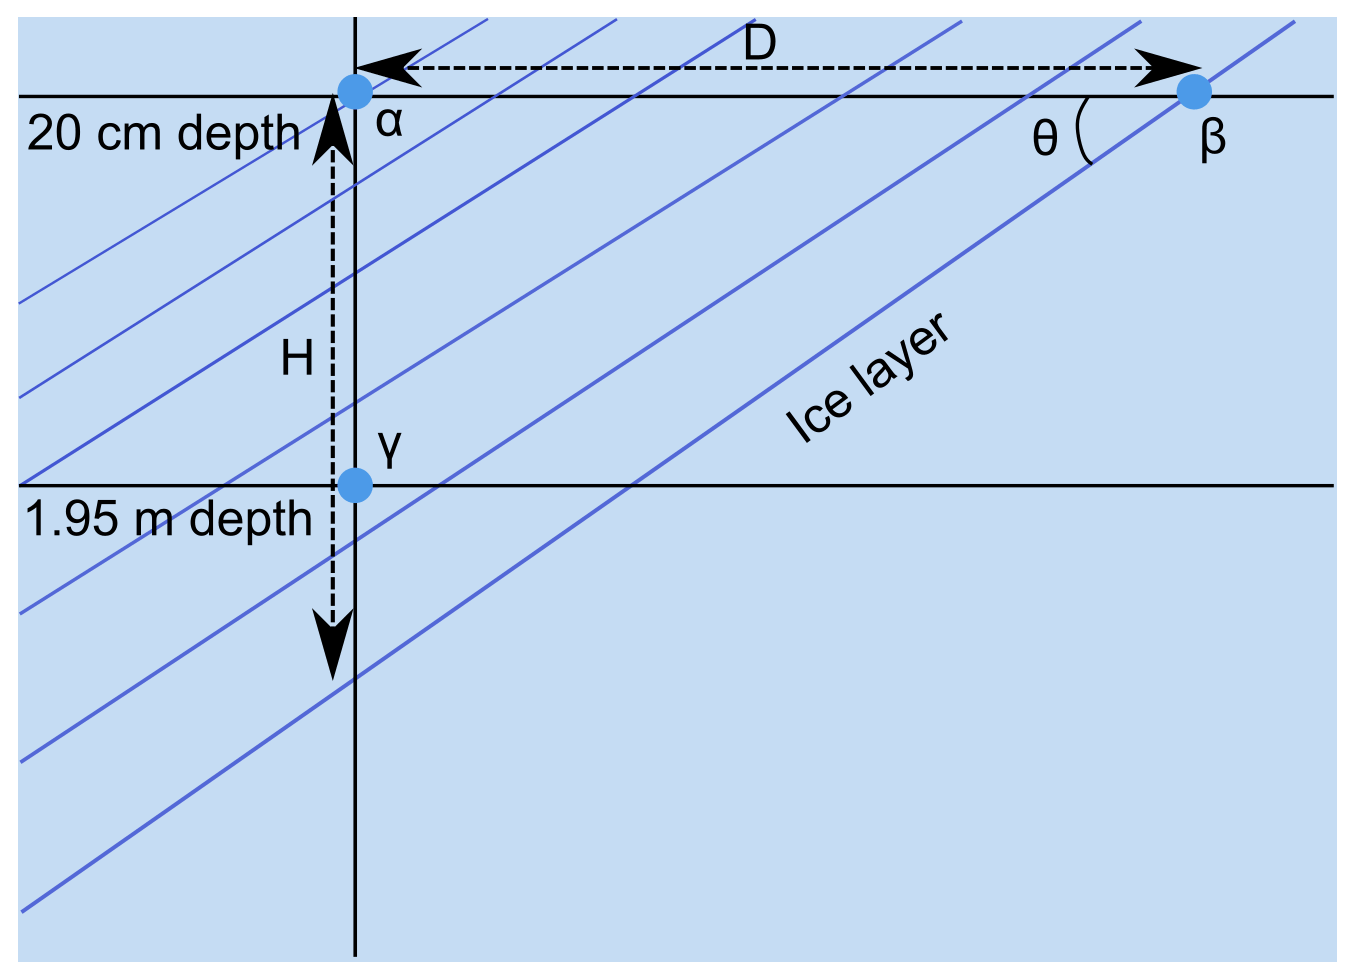
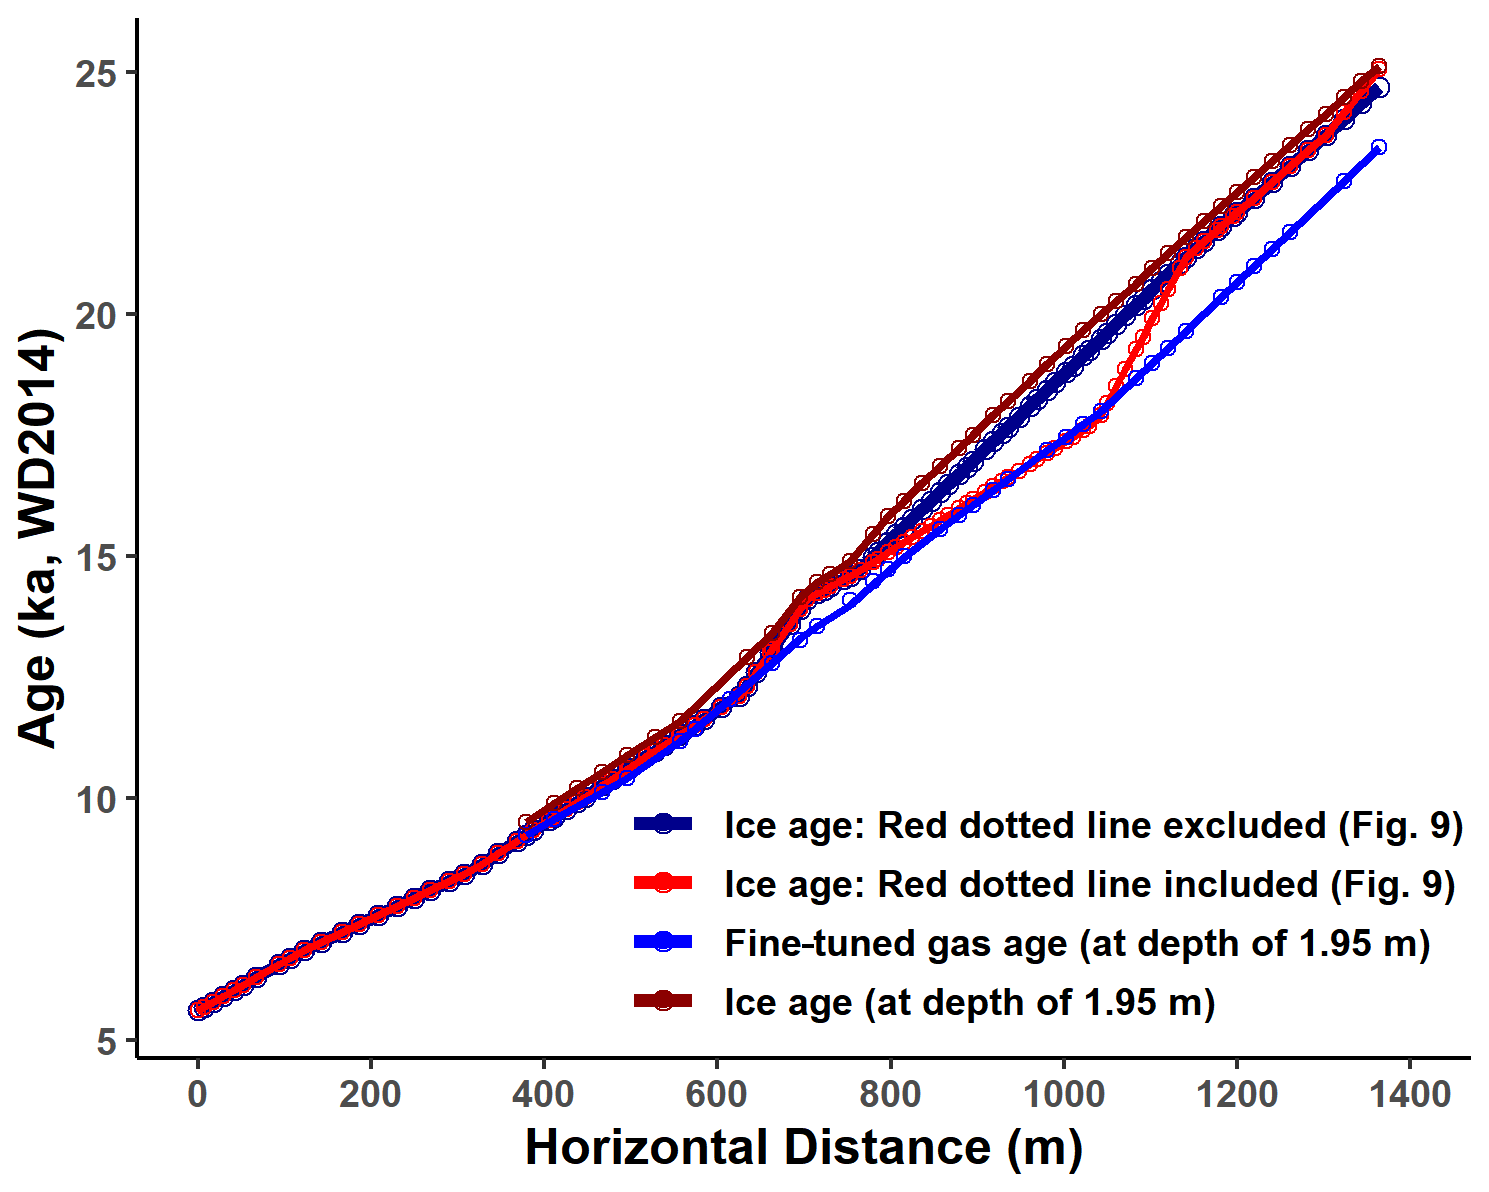
To estimate the ice age at a depth of 1.95 m, the age–depth relationship of each ice core sample must be determined. The relationship was deduced by a simple calculation using Eqs. (4) and (5): α, β, and γ are the ice age at each location; D is the horizontal distance between two surface ice samples (at a depth of 20 cm); θ is the average dip of the ice layer; and H+0.2 m is the depth where the age is the same as β (Fig. 8). The average dip was estimated from the GPR profile (yellow box in Fig. 3c). The average dip of the ice layer located near core no. 23 was 4.96∘, as inferred from Fig. 4b. Then, the ice age at a depth of 1.95 m was calculated using Eq. (6). Refer to Fig. 8 to understand the following equations:
First, eight tie points were selected and linearly interpolated. In this case, Δage showed a minimum value at around 17.5 ka (Fig. A5), which is close to the period of the Last Glacial Maximum (LGM). Since Δage increases when the climate is colder (Schwander et al., 1997), we assumed that either the ice age is undervalued or the gas age is overvalued. Because the δ18Oatm value of the Larsen ice is comparable with the EDC and WAIS Divide records, the gas age seems to be reasonable and not likely to be overvalued (Fig. 7). Hence, we concluded that the ice age should be revised. In addition, the age–distance relationship of ice shows a rapid age increase near ∼ 1000 m (Fig. A6), which is not supported by the average dip of the ice layer deduced from the GPR profile (Fig. 3). As the dip decreases to the downstream ice, no abrupt increase in the slope of the age–distance relationship is expected. However, this is the case only when we assume no abrupt change in the snow accumulation rate.
After excluding one tie point (indicated by the red dotted line in Fig. 9), the Δage of the Larsen ice shows a maximum value at approximately 17.5 kyr BP, which appears more appropriate (Fig. A5). For records with horizontal distances less than 107 and greater than 1310 m, extrapolation was conducted to estimate the ice age using the age–distance relationship at 7–11 and 18–23.8 kyr BP, respectively. In conclusion, the ice age was estimated to be 5.6–24.7 kyr BP (WD2014) for the surface ice. However, as noted above, local age inversion may have occurred in the upstream ice areas. Hence, the age constraint for upstream ice should be considered cautiously. The ice age calculated for a 1.95 m depth also seems reliable because the water isotope record is comparable with the surface ice result when plotted with the ice age (Fig. 9c). Note that ice age synchronization via water isotopes is challenging in climatically stable periods such as the LGM; measurements of dust and ice chemistry could be applied in the future to refine the ice chronology presented here. Refer to Sect. S1 in the Supplement for ice age uncertainty and Δage uncertainty.
The established horizontal ice chronology shows that temporal resolutions of 10 and 17 yr m−1 are available for the Holocene (5.6–12 kyr BP) and for the last deglaciation (12–24.6 kyr BP), respectively, at the surface ice from the Larsen BIA. These estimated resolutions are higher than those of the deep ice core TALDICE covering this time interval (∼ 18 yr m−1) (Masson-Delmotte et al., 2011). In addition, the Larsen BIA allows for collecting large quantities of ice from the surface. Assuming that the average age–depth relationship of ice core no. 23 (∼ 189 yr m−1) is maintained throughout the ice, the ice age may then reach ∼ 60 ka near the bedrock (∼ 240 m of ice), and thus, ice may be obtained for at least ∼ 60 ka via shallow coring at the Larsen BIA.

Figure 9Correlation of Larsen δ18Oice with the TALDICE record. (a) Interpolated δ18Oice value at 5 m from the Larsen BIA with a spline curve. (b) δ18Oice record from TALDICE with a spline curve (Stenni et al., 2011; Bazin et al., 2013c). The ice age of the surface ice from Larsen was estimated by correlating seven inflection points of the spline curve (indicated by black dotted lines) with TALDICE. (c) Comparison of near-surface δ18Oice with those in 1.95 m depth at the Larsen BIA.
4.4 Estimation of past surface temperature and accumulation rate
As discussed in Sect. 3.2, δ18Oice and δ2Hice might have been enriched during the sublimation of ice. Therefore, it is inadequate to use stable water isotopes to estimate past surface temperatures. Instead, the analytical framework developed by Buizert (2021) allows us to estimate the past surface temperature using the δ15N–N2 and Δage. The methods for estimating the surface temperature and accumulation rate are described in detail in the Appendix (Appendix D). The results are presented in Table S11 and Fig. 10. The accumulation rates for TALDICE, EDC, Taylor Dome, and Taylor Glacier are also shown for comparison (Veres et al., 2013; Baggenstos et al., 2018). The youngest three reconstructed values of the Larsen BIA were rejected (red line in Fig. 10) due to the large relative uncertainty in Δage (including the possibility of negative Δage) and because the implied 10.5 ∘C increase is for just ∼ 1200 years. This might be due to a low bias in the reconstructed ice age, which leads to a lower Δage. Hence, the ice age in this part should be more strongly constrained by using dust concentrations in a future study.
During the last deglaciation, the surface temperature increased by approximately 15 ± 5∘C (1σ) (from 24.3 to 10.6 kyr BP), which is greater than those for any other ice core sites including nearby Talos Dome, where a recent reconstruction suggests 7.1 ± 2 ∘C of deglacial warming (Buizert et al., 2021). However, a cautious interpretation is recommended because of the large uncertainty. The large magnitude of the reconstructed temperature change is a consequence of Δage, which is around 300 % larger during the Last Glacial Maximum (LGM) than during the Holocene in our reconstruction. By comparison, most Antarctic sites show only a 60 % to 120 % Δage increase (Buizert et al., 2021). While the Larsen BIA is currently close to the open ocean, during the LGM, the Antarctic ice sheet reached the continental shelf break covering the entire Ross Sea Embayment (Conway et al., 1999). Climate models identified strong cooling over the Ross Sea sector, reflecting the increased elevation and increased albedo of the extended ice sheet (Buizert et al., 2021). We suggest that this enhanced cooling may have affected the original deposition site (upstream accumulation area) of the Larsen BIA. We note that the past ice sheet thickness at Larsen and the upstream distance traveled, since deposition is poorly constrained; both of these impact the magnitude of the reconstructed temperature change. The temporal isotope slope (αT=0.58 ‰ K−1) is lower than that for any other ice core site (Buizert et al., 2021) and smaller than the spatial regression slope of around 0.8 ‰ K−1 (Masson-Delmotte et al., 2008). However, the temporal isotope slope we reconstructed is likely to be a lower bound because the sublimation might have enriched the δ18Oice of the glacial (downstream) part of the Larsen BIA. The reconstructed surface temperature change of 15 ± 5 ∘C assumes that the selected tie points are correct. However, if the δ18Oice features used for the matching are not climatic in origin but rather reflect local effects (such as sublimation intensity and accumulation controls by surface slope), then our tie points would be incorrect. Future measurements of ice chemistry and dust loading may improve our Δage estimates, which will allow for a refined estimate of past glacial cooling.
From 24.3 to 10.6 kyr BP, the accumulation rate increased by a factor of 1.7–4.6 (from 0.033 ± 0.007 to 0.103 ± 0.042 m ice per year). During the same time period, the accumulation rates at the Taylor Dome and TALDICE sites increased by a factor of ∼ 15.4 and ∼ 2.4, respectively (Veres et al., 2013; Baggenstos et al., 2018). Based on the three records (TALDICE, Larsen blue ice, and Taylor Dome), the accumulation rate increased more in southern Victoria Land than northern Victoria Land. The accumulation rate at TALDICE and EDC began to decrease transiently around 14.5 kyr BP following the Antarctic Cold Reversal (ACR), while the reconstructed accumulation rates at the deposition site of the Larsen BIA and Taylor Dome keep increasing across the ACR. We acknowledge that the accumulation rate of the deposition site of the Larsen ice younger than 14 kyr BP remains poorly constrained because of the large uncertainty but is well constrained for the older part (>14 kyr BP). The accumulation rate at the deposition site of the Larsen ice is lower than that of TALDICE during 14–21 kyr BP and exceeds the accumulation rate of TALDICE after 14 kyr BP. The Ross Ice Shelf (RIS) retreated during the last deglaciation (Ship et al., 1999; Yokoyama et al., 2016), and as the RIS retreats, the storm track migrates to southern Victoria Land from the northern part and increases precipitation in southern Victoria Land (Morse et al., 1998; Aarons et al., 2016; Yan et al., 2021). Therefore, we speculate that the storm track affects the original deposition site of the Larsen BIA more than the Talos Dome after 14 kyr BP. The accumulation rate at Taylor Dome (TD) during 14–21 kyr BP shows a lower value than that from TALDICE and the Larsen ice (Fig. 10). However, the accumulation rate increased by a factor of ∼ 5.2 at Taylor Dome, while those at Larsen and TALDICE increased by a factor of ∼ 2.1 and ∼ 1.8, respectively. Overall, it appears that as the RIS retreats, the accumulation rate at southern Victoria Land increases more than northern Victoria Land. This interpretation is in line with the previous studies (Morse et al., 1998; Aarons et al., 2016; Yan et al., 2021) and may help studies for reconstructing past atmospheric circulation associated with the retreat of the RIS. Likewise, a strong accumulation increase across the last deglaciation was seen at the coastal Law Dome site in the Indian Ocean sector (Van Ommen et al., 2004), also attributed to increases in storm-derived precipitation. However, a spatial difference in the original deposition site of the upstream and downstream Larsen ice is not constrained; this must be known to allow for a better interpretation of the accumulation rate.
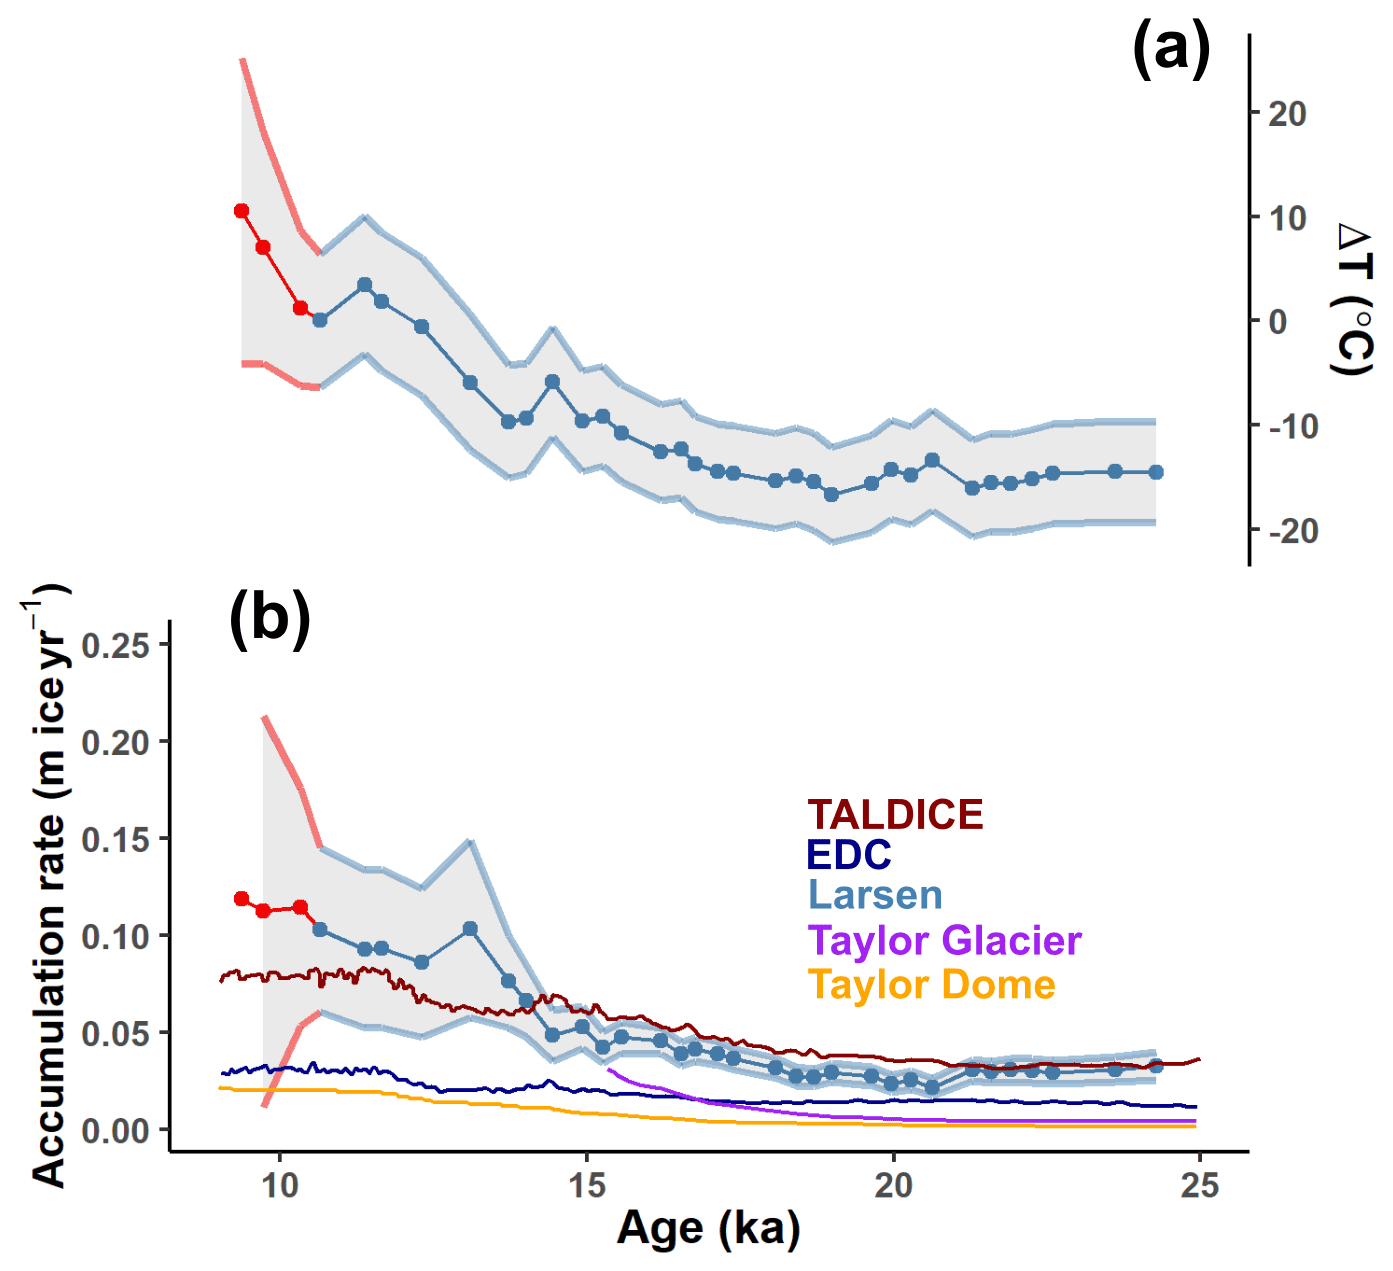
Figure 10Reconstructed surface temperature and accumulation rate over the Last Glacial Termination (Termination I). Accumulation rates of TALDICE and EDC are from Veres et al. (2013). Accumulation rates of Taylor Dome and Taylor Glacier are from Baggenstos et al. (2018). The three youngest values of Larsen blue ice are rejected (red line) due to the large uncertainty in the Δage that translates into the possibility of negative accumulation rates and an unexpected 10.5 ∘C increase in ∼ 1200 years. ΔT is a value relative to 10.6 kyr BP; 10.6 kyr BP is the youngest time period available. The uncertainty for ΔT and the accumulation rate (1σ) was estimated through error propagation.
Based on the shapes of dust bands, GPR profiles, and analytical data (δ18Oatm, δ2Hice, and CH4) we conclude that a large ice section of the ice at the Larsen BIA (the downstream ice, from ice cores no. 23 to no. 200) monotonically increase along the ice flow direction. The vertical profile of δ2Hice in core no. 23 correlated well with the record from the horizontal surface ice samples, showing that the stratigraphy of ice is not significantly disturbed and does not cause an age inversion at the site. The negative d-excess values indicate sublimation of the ice and the possibility of enrichment in the δ2Hice and δ18Oice values during sublimation. CH4 is well preserved at depth in ice cores (>4.6 m for ice core no. 23), and gas isotopes (δ18Oatm and δ15N–N2) are well preserved at 1.95 m depth.
Horizontal δ18Oatm values at a depth of 1.95 m in the Larsen BIA reveal a typical glacial termination (the Larsen δ18Oatm shows both negative and >1.0 values). Along with glaciological ice flow principles, stable water isotopes and the correlation of CH4 concentration and δ18Oatm with existing ice core records, we suggest that the gas ages of the studied Larsen ice cover 9.2–23.4 kyr BP and that ice ages cover 5.6–24.7 kyr BP. This is additionally supported by 81Kr ages from local ice cores (no. 23 and TF). We provide high-precision ages for ice and fossil air trapped in blue ice at the Larsen BIA. Because well-constrained ages and high-quality proxies are essential for paleoclimate studies, our work may help future studies on BIAs across the Antarctic continent. For example, using the ice samples from the Larsen BIA, we suggest a tentative climate reconstruction of surface temperature (15 ± 5 ∘C increase) and accumulation rate (increased by a factor of 1.7–4.6) at the deposition site of the Larsen ice during the last deglaciation.
Combining information derived from ice samples from Taylor Glacier, Allan Hills, and the Larsen BIA may also provide insights regarding the growth and/or retreat of the Ross Ice Shelf. In addition, various sites may be beneficial for studying the paleoclimate, since the ice quality for paleoclimate studies depends on local glaciological conditions. In particular, since a large amount of ice with the same age is exposed at the surface in the BIA, this study may facilitate further research on paleoclimate for which large quantities of ice are required (such as isotope analysis of trace gases or elements in the ice).
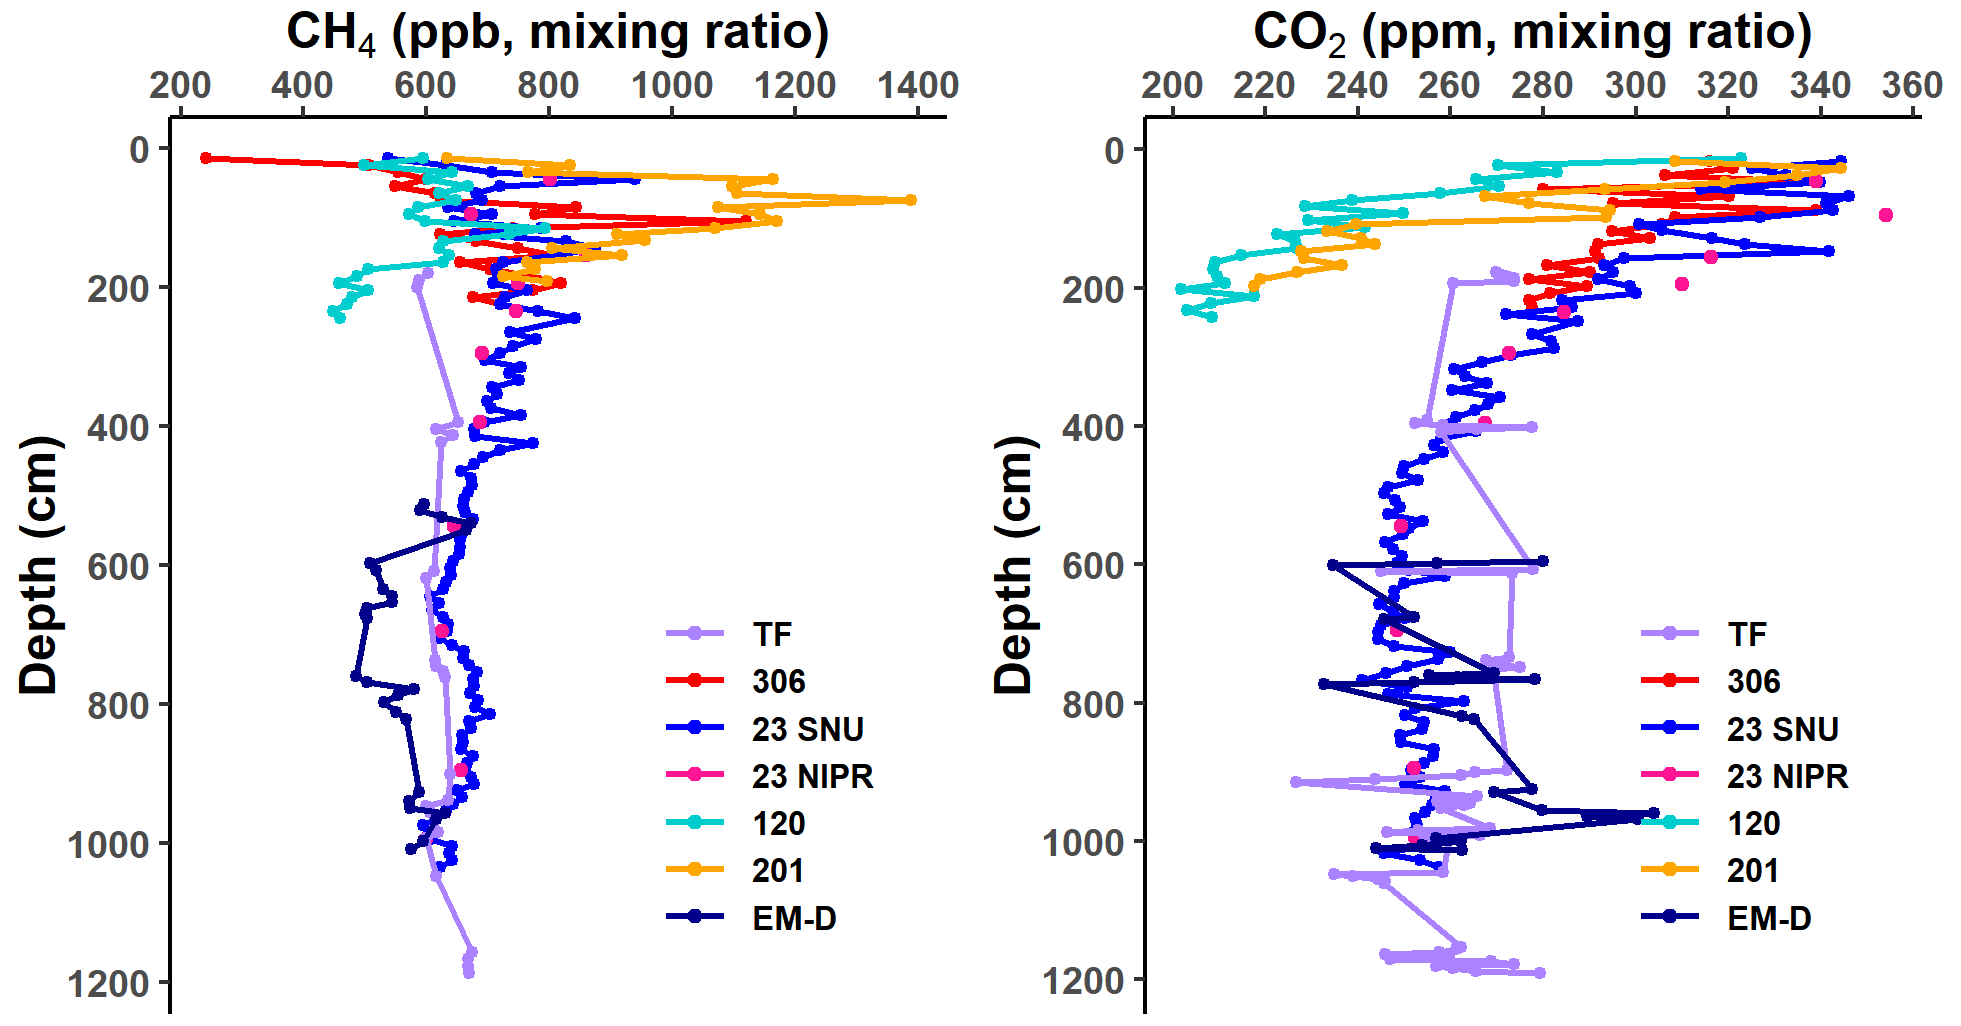
Figure A1Vertical profiles of greenhouse gas concentrations at the Larsen BIA ice cores. (a) CH4 records. (b) CO2 records. CH4 was measured using a wet-extraction method, while CO2 was measured via both dry- and wet-extraction methods at SNU and NIPR, respectively. Results of the TF core are from Jang et al. (2017).
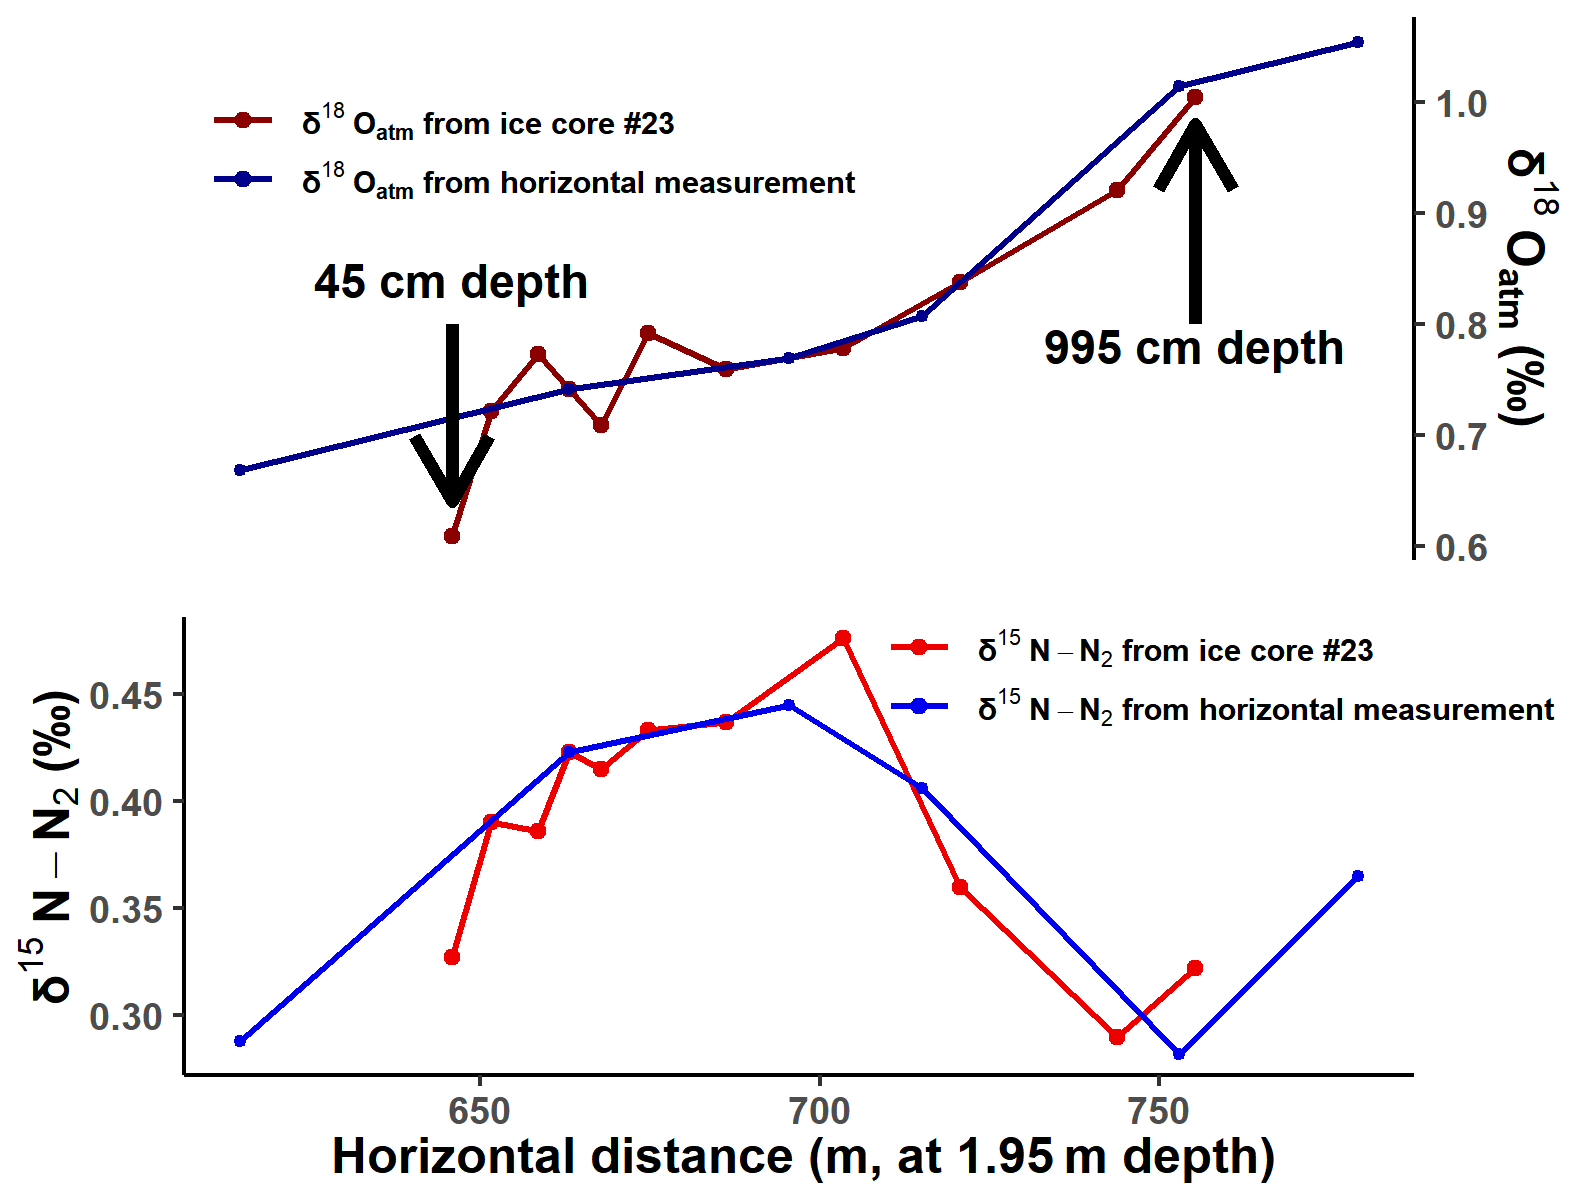
Figure A2Nitrogen and oxygen gas isotope record of ice core no. 23 and horizontal measurement. Horizontal measurement is conducted using ice cores at 1.95 m depth. Depth of ice core no. 23 was converted to horizontal distance at 1.95 m depth by using Eq. (3). The uncertainty in a measured δ18Oatm at a depth of 1.95 m is assumed to be ± 0.05 ‰ (see Sect. 3.3.2).
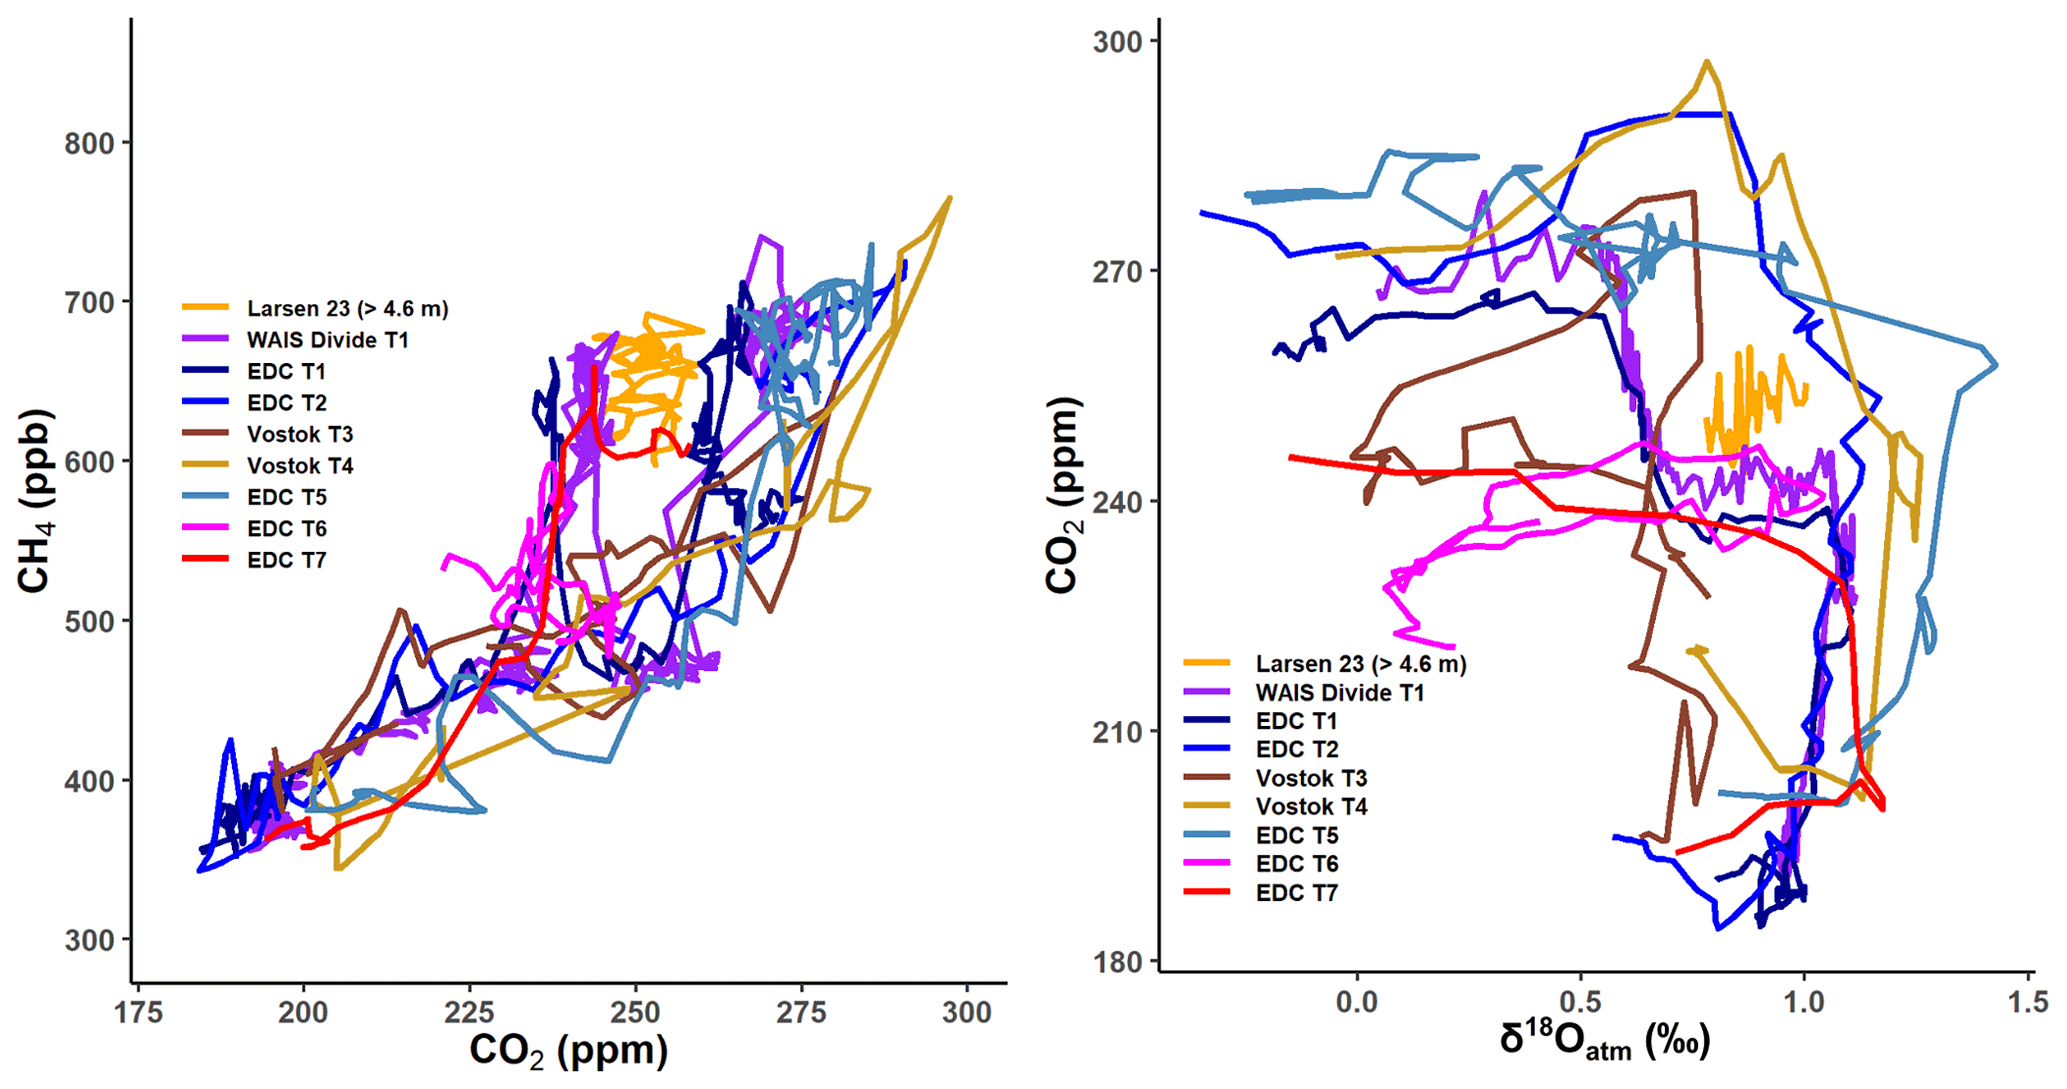
Figure B1Comparison of the CO2–CH4 and δ18Oatm–CO2 relationship in Larsen ice core no. 23 with existing records during glacial terminations. WAIS Divide: Marcott et al. (2014), Severinghaus (2015), and Rhodes et al. (2017). EDC: Bazin et al. (2013d), Monnin et al. (2001, 2004), Siegenthaler et al. (2005), Lourantou et al. (2010), Schmitt et al. (2012), Landais et al. (2013), Bereiter et al. (2015), and Extier et al. (2018a). Vostok: Petit et al. (1999) and Bender (2002).
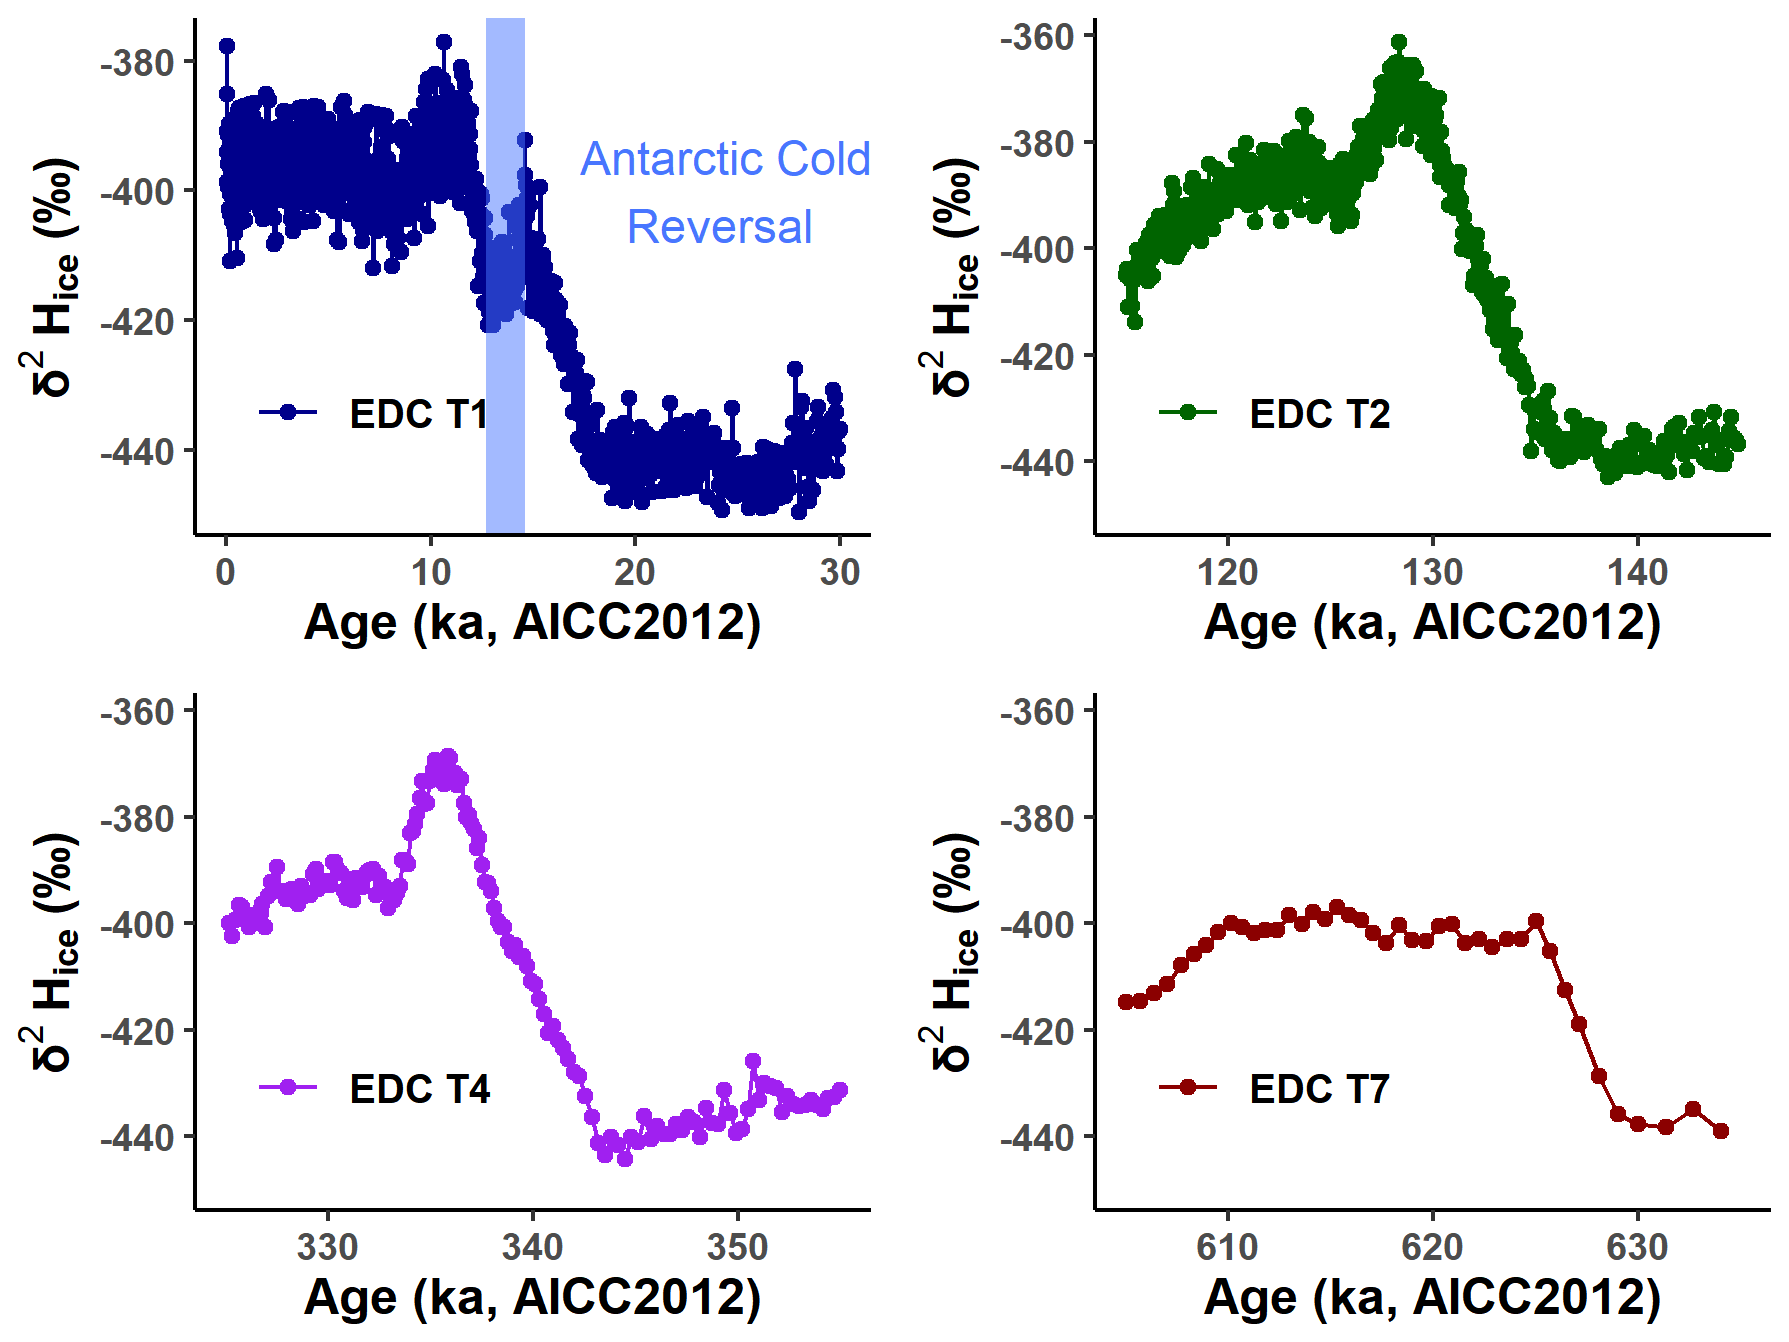
Figure C1δ2Hice records from EDC. δ2Hice records for T1, T2, T4, and T7 on the AICC2012 scale are from Bazin et al. (2013b). The blue vertical bar represents the time interval of the ACR (12.7–14.6 kyr BP).
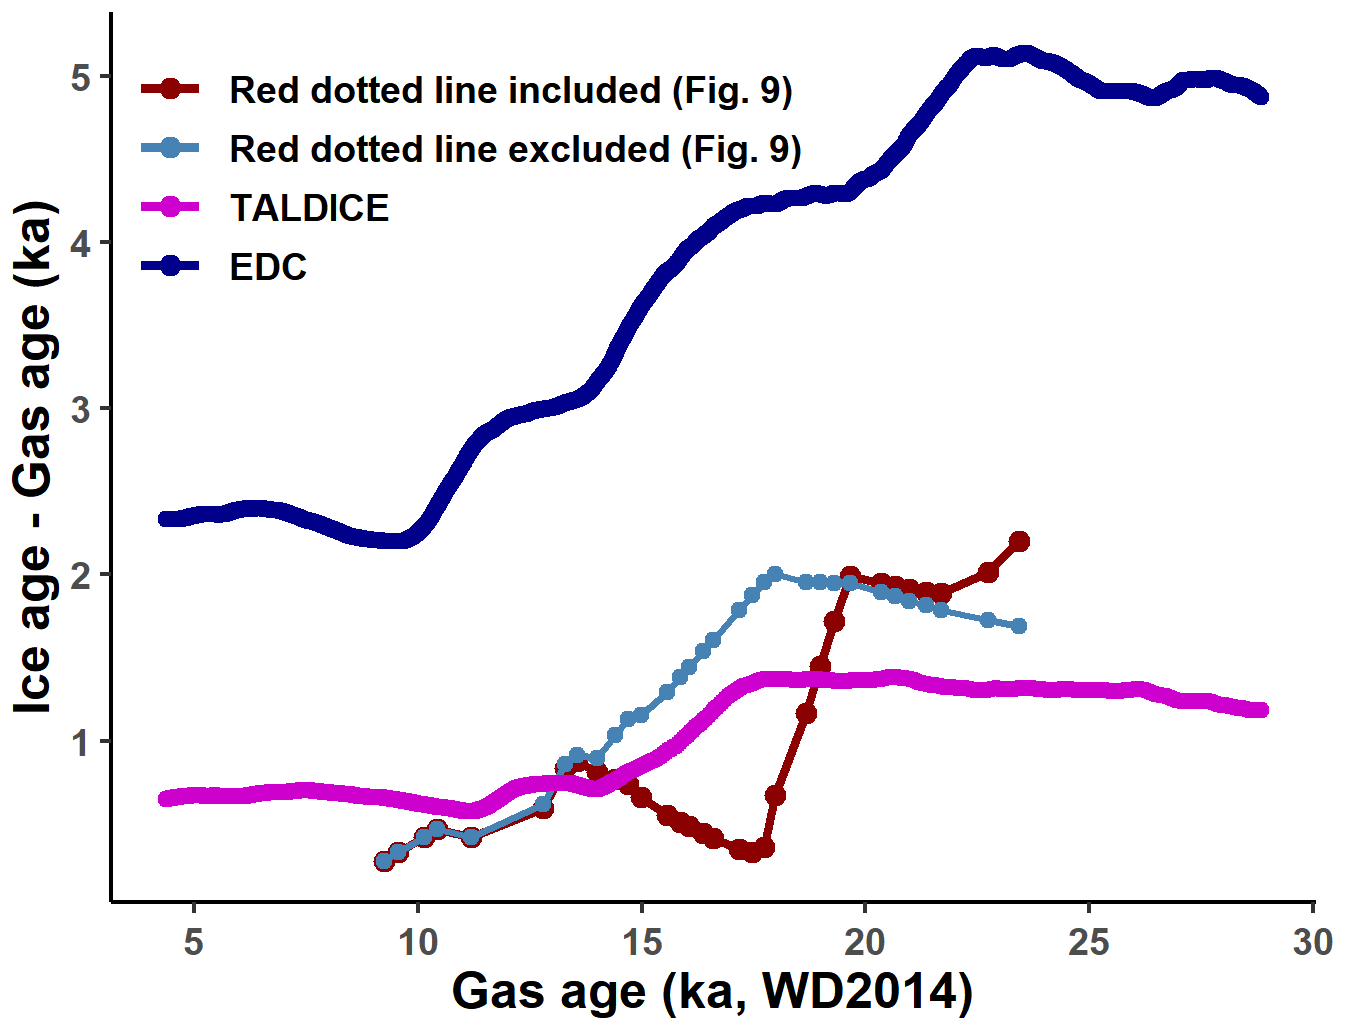
Figure C2EDC, TALDICE, and Larsen BIA Δage. Δage for the Larsen BIA is defined as (ice age) − (gas age) at 1.95 m depth. The EDC WD2014 chronology is from Buizert et al. (2021).
The surface temperature change can be estimated using the following equation (Buizert, 2021), where , R is the ideal gas constant (8.314 J mol−1 K−1), L is the lock-in depth, γ=1, and ET=23.5 kJ mol−1.
To find the lock-in depth L, we first estimated the diffusive column height via the barometric equation (Eq. D2) (Sowers et al., 1992) then added the convective zone of the firn column; we assume the length of the convective zone to be 4 m. In Eq. (D2), Δm is the difference in the molecular weight between 28N2 and 29N2 (0.001 kg mol−1), g is the gravitational acceleration constant (9.82 m s−2), Hdiff is the diffusive column height, R is the ideal gas constant (8.314 J mol−1 K−1), and T is the temperature (K).
We first applied the modern mean annual temperature of the Larsen BIA (−24.4 ∘C) to calculate the lock-in depth at all times. Then we applied Eq. (D1) to calculate T2 and then applied Eq. (D2) again to find the correct lock-in depth. Finally, we applied Eq. (D1) once again to estimate the correct surface temperature.
The ice-equivalent accumulation rate (A) can be estimated by using the following relationship between Δage and ice-equivalent lock-in depth (LIE) (Buizert, 2021). The ratio of is known to be ∼ 0.70 (Parrenin et al., 2012) and was used to find LIE.
All of the uncertainties in the input parameters were assumed to be independent. Then, final uncertainty for the surface temperature and accumulation rate was estimated through error propagation.
All data presented in this study are provided in Supplement tables and will be available at the PANGAEA cryosphere database upon publication.
The supplement related to this article is available online at: https://doi.org/10.5194/tc-16-2301-2022-supplement.
GL and JA conceived the idea of this study, performed experiments, interpreted the data, and wrote the manuscript with contributions from all co-authors. HJ performed ground-penetrating radar surveys and data processing. FR, ZTL, WJ, and GMY carried out 81Kr age dating of Larsen Glacier. IO, SG, and KK assisted with gas measurements at NIPR and interpreted the results. SK and JM measured stable water isotopes of the ice. CB established the WD2014 timescale of TALDICE and helped with climate reconstructions and interpretation. SH, CHH, and SDH helped collecting ice samples and organize the early plans of this study. All authors have discussed and interpreted the results and contributed to the manuscript.
The contact author has declared that neither they nor their co-authors have any competing interests.
Publisher's note: Copernicus Publications remains neutral with regard to jurisdictional claims in published maps and institutional affiliations.
We thank Sang-Young Han, Yoojung Yang, Youngjoon Jang, and Yeongcheol Han for their assistance in collecting ice and organizing data in the early stages of the study. We sincerely thank Gwangjin Lim, Junghwa Hwang, and Jaeyoung Park for their laboratory assistance and technical support. We thank Joohan Lee for providing GPR survey equipment. We also thank the Norwegian Polar Institute for sharing the QGIS Quantarctica package. We also appreciate the Meteo-Climatological Observatory at MZS and Victoria Land of PNRA for annual surface temperature data at Larsen Glacier. We also thank two anonymous reviewers and the editor (Harry Zekollari) for their constructive comments.
This study has been supported by the Korea Polar Research Institute (grant no. PE21100) and the National Research Foundation of Korea (grant no. NRF-2018R1A2B3003256). This work has also received financial support from the National Key Research and Development Program of China (grant no. 2016YFA0302200); the National Natural Science Foundation of China (grant no. 41727901); the Japan Society for the Promotion of Science (JSPS); the Ministry of Education, Culture, Sports, Science and Technology of Japan (MEXT) (Grants-in-Aid for Scientific Research, KAKENHI; grant no. 17K12816 to Ikumi Oyabu; grant nos. 17H06320 and 15KK0027 to Kenji Kawamura); the NIPR International Internship Program for Polar Science (Giyoon Lee); and the US National Science Foundation (grant no. ANT-1643394 to Christo Buizert).
This paper was edited by Harry Zekollari and reviewed by two anonymous referees.
Aarons, S. M., Aciego, S. M., Gabrielli, P., Delmonte, B., Koornneef, J. M., Wegner, A., and Blakowski, M. A.: The impact of glacier retreat from the Ross Sea on local climate: Characterization of mineral dust in the Taylor Dome ice core, East Antarctica, Earth Planet. Sc. Lett., 444, 34–44, https://doi.org/10.1016/j.epsl.2016.03.035, 2016.
Aarons, S. M., Aciego, S. M., Arendt, C. A., Blakowski, M. A., Steigmeyer, A., Gabrielli, P., Sierra-Hernández, M. R., Beaudon, E., Delmonte, B., Baccolo, G., May, N. W., and Pratt, K. A.: Dust composition changes from Taylor Glacier (East Antarctica) during the last glacial-interglacial transition: A multi-proxy approach, Quaternary Sci. Rev., 162, 60–71, https://doi.org/10.1016/j.quascirev.2017.03.011, 2017.
Aciego, S. M., Cuffey, K. M., Kavanaugh, J. L., Morse, D. L., and Severinghaus, J. P.: Pleistocene ice and paleo-strain rates at Taylor Glacier, Antarctica, Quaternary Res., 68, 303–313, https://doi.org/10.1016/j.yqres.2007.07.013, 2007.
Ahn, J., Brook, E. J., and Howell, K.: A high-precision method for measurement of paleoatmospheric CO2 in small polar ice samples, J. Glaciol., 55, 499–506, https://doi.org/10.3189/002214309788816731, 2009.
Azuma, N., Nakawo, A., Higashi, A., and Nishio, F.: Flow pattern near Massif A in the Yamato bare ice field estimated from the structures and the mechanical properites of a shallow ice core, Mem. Natl. Inst. Polar Res., 39, 173–183, 1985.
Baggenstos, D., Bauska, T. K., Severinghaus, J. P., Lee, J. E., Schaefer, H., Buizert, C., Brook, E. J., Shackleton, S., and Petrenko, V. V.: Atmospheric gas records from Taylor Glacier, Antarctica, reveal ancient ice with ages spanning the entire last glacial cycle, Clim. Past, 13, 943–958, https://doi.org/10.5194/cp-13-943-2017, 2017.
Baggenstos, D., Severinghaus, J. P., Mulvaney, R., McConnell, J. R., Sigl, M., Maselli, O., Petit, J. R., Grente, B., and Steig, E. J.: A horizontal ice core from Taylor Glacier, its implication for Antarctic climate history, and an improved Taylor Dome ice core time scale, Paleoceanography and Paleoclimatology, 33, 778–794, https://doi.org/10.1029/2017PA003297, 2018.
Bauska, T., Baggenstos, D., Brook, E. J., Mix, A. C., Marcott, S. A., Petrenko, V. V., Schaefer, H., Severinghaus, J. P., and Lee, J. E.: Carbon isotopes characterize rapid changes in atmospheric carbon dioxide during the last deglaciation, P. Natl. Acad. Sci. USA, 113, 3465–3470, https://doi.org/10.1073/pnas.1513868113, 2016.
Bazin, L., Landais, A., Lemieux-Dudon, B., Toyé Mahamadou Kele, H., Veres, D., Parrenin, F., Martinerie, P., Ritz, C., Capron, E., Lipenkov, V. Y., Loutre, M.-F., Raynaud, D., Vinther, B. M., Svensson, A. M., Rasmussen, S. O., Severi, M., Blunier, T., Leuenberger, M. C., Fischer, H., Masson-Delmotte, V., Chappellaz, J. A., and Wolff, E. W.: AICC2012 chronology for ice core EDC, PANGAEA [data set], https://doi.org/10.1594/PANGAEA.824865, 2013a.
Bazin, L., Landais, A., Lemieux-Dudon, B., Toyé Mahamadou Kele, H., Veres, D., Parrenin, F., Martinerie, P., Ritz, C., Capron, E., Lipenkov, V. Y., Loutre, M.-F., Raynaud, D., Vinther, B. M., Svensson, A. M., Rasmussen, S. O., Severi, M., Blunier, T., Leuenberger, M. C., Fischer, H., Masson-Delmotte, V., Chappellaz, J. A., and Wolff, E. W.: delta Deuterium measured on ice core EDC on AICC2012 chronology, PANGAEA [data set], https://doi.org/10.1594/PANGAEA.824891, 2013b.
Bazin, L., Landais, A., Lemieux-Dudon, B., Toyé Mahamadou Kele, H., Veres, D., Parrenin, F., Martinerie, P., Ritz, C., Capron, E., Lipenkov, V. Y., Loutre, M.-F., Raynaud, D., Vinther, B. M., Svensson, A. M., Rasmussen, S. O., Severi, M., Blunier, T., Leuenberger, M. C., Fischer, H., Masson-Delmotte, V., Chappellaz, J. A., and Wolff, E. W.: δ18O measured on ice core TALDICE on AICC2012 chronology, PANGAEA [data set], https://doi.org/10.1594/PANGAEA.824890, 2013c.
Bazin, L., Landais, A., Lemieux-Dudon, B., Toyé Mahamadou Kele, H., Veres, D., Parrenin, F., Martinerie, P., Ritz, C., Capron, E., Lipenkov, V. Y., Loutre, M.-F., Raynaud, D., Vinther, B. M., Svensson, A. M., Rasmussen, S. O., Severi, M., Blunier, T., Leuenberger, M. C., Fischer, H., Masson-Delmotte, V., Chappellaz, J. A., and Wolff, E. W.: Methane measured on ice core EDC on AICC2012 chronology, PANGAEA [data set], https://doi.org/10.1594/PANGAEA.824883, 2013d.
Bender, M.: Concentration and Isotopic Composition of O2 and N2 in Trapped Gases of the Vostok Ice Core, U.S. Antarctic Program (USAP) Data Center [data set], https://doi.org/10.7265/N5862DCW, 2002.
Bender, M., Labeyrie, L. D., Raynaud, D., and Lorius, C.: Isotopic composition of atmospheric O2 in ice linked with deglaciation and global primary productivity, Nature, 318, 349–352, https://doi.org/10.1038/318349a0, 1985.
Bender, M. L., Barnett, B., Dreyfus, G., Jouzel, J., and Porcelli, D.: The contemporary degassing rate of 40Ar from the solid Earth, P. Natl. Acad. Sci. USA., 105, 8232–8237, https://doi.org/10.1073/pnas.0711679105, 2008.
Bender, M. L., Burgess, E., Alley, R. B., Barnett, B., and Clow, G. D.: On the nature of the dirty ice at the bottom of the GISP2 ice core, Earth. Planet. Sc. Lett., 299, 466–473, https://doi.org/10.1016/j.epsl.2010.09.033, 2010.
Bereiter, B., Eggleston, S., Schmitt, J., Nehrbass-Ahles, C., Stocker, T. F., Fischer, H., Kipfstuhl, S., and Chappellaz, J.: Revision of the EPICA Dome C CO2 record from 800 to 600 kyr before present, Geophys. Res. Lett., 42, 542–549, https://doi.org/10.1002/2014GL061957, 2015.
Bindschadler, R., Vornberger, P., Fleming, A., Fox, A., Mullins, J., Binnie, D., Paulsen, S. J., Granneman, B., and Gorodetzky, D.: The Landsat image mosaic of Antarctica, Remote Sens. Environ., 112, 4214–4226, https://doi.org/10.1016/j.rse.2008.07.006, 2008.
Bintanja, R.: On the glaciological, meteorological, and climatological significance of Antarctic blue ice areas, Rev. Geophys., 37, 337–359, https://doi.org/10.1029/1999RG900007, 1999.
Blunier, T. and Brook, E. J.: Timing of millennial-scale climate change in Antarctica and Greenland during the last glacial period, Science, 291, 109–112, https://doi.org/10.1126/science.291.5501.109, 2001.
Blunier, T., Spahni, R., Barnola, J.-M., Chappellaz, J., Loulergue, L., and Schwander, J.: Synchronization of ice core records via atmospheric gases, Clim. Past, 3, 325–330, https://doi.org/10.5194/cp-3-325-2007, 2007.
Borgorodsky, V. V., Bentley, C. R., and Gudmandsen, P. E.: Radioglaciology, 1st edn., Glaciology and Quaternary Geology, Springer Netherlands, ISBN 978-94-010-8830-5, https://doi.org/10.1007/978-94-009-5275-1, 1985.
Buizert, C.: The ice core gas age-ice age difference as a proxy for surface temperature, Geophys. Res. Lett., 48, e2021GL094241. https://doi.org/10.1029/2021GL094241, 2021.
Buizert, C., Baggenstos, D., Jiang, W., Purtschert, R., Petrenko, V. V., Lu, Z.-T., Müller, P., Kuhl, T., Lee, J., Severinghaus, J. P., and Brook, E. J.: Radiometric 81Kr dating identifies 120,000-year-old ice at Taylor Glacier, Antarctica, P. Natl. Acad. Sci. USA., 111, 6876–6881, https://doi.org/10.1073/pnas.1320329111, 2014.
Buizert, C., Cuffey, K. M., Severinghaus, J. P., Baggenstos, D., Fudge, T. J., Steig, E. J., Markle, B. R., Winstrup, M., Rhodes, R. H., Brook, E. J., Sowers, T. A., Clow, G. D., Cheng, H., Edwards, R. L., Sigl, M., McConnell, J. R., and Taylor, K. C.: The WAIS Divide deep ice core WD2014 chronology – Part 1: Methane synchronization (68–31 ka BP) and the gas age–ice age difference, Clim. Past, 11, 153–173, https://doi.org/10.5194/cp-11-153-2015, 2015.
Buizert, C., Sigl, M., Severi, M., Markle, B. R., Wettstein, J. J., McConnell, J. R., Pedro, J. B., Sodemann, H., Goto-Azuma, K., Kawamura, K., Fuita, S., Motoyama, H., Hirabayashi, M., Uemura, R., Stenni, B., Parrenin, F., He, F., Fudge, T. J., and Steig, E. J.: Abrupt ice-age shifts in southern westerly winds and Antarctic climate forced from the north, Nature, 563, 681–685, https://doi.org/10.1038/s41586-018-0727-5, 2018.
Buizert, C., Fudge, T. J., Roberts, W. H. G., Steig, E. J., Sherriff-Tadano, S., Ritz, C., Lefebvre, E., Edwards, J., Kawamura, K., Oyabu, I., Motoyama, H., Kahle, E. C., Jones, T. R., Abe-Ouchi, A., Obase, T., Martin, C., Corr, H., Severinghaus, J. P., Beaudette, R., Epifanio, J. A., Brook, E. J., Martin, K., Chappellaz, J., Aoki, S., Nakazawa, T., Sower, T. A., Alley, R. B., Ahn, J., Sigl, M., Severi, M., Dunbar, N. W., Svensson, A., Fegyveresi, J. M., He, C., Liu, Z., Zhu, J., Otto-Bliesner, B. L., Lipenkov, V. Y., Kageyama, M., and Schwander, J.: Antarctic surface temperature and elevation during the Last Glacial Maximum, Science, 372, 1097–1101, https://doi.org/10.1126/science.abd2897, 2021.
Capron, E., Landais, A., Leieux-Dudon, B., Schilt, A., Masson-Delmotte, V., Buiron, D., Chappellaz, J., Dahl-Jensen, D., Johnsen, S., Leuenberger, M., Loulergue, L., and Oerter, H.: Synchronising EDML and NorthGRIP ice cores using δ18O of atmospheric oxygen (δ18Oatm) and CH4 measurements over MIS5 (80–123 kyr), Quaternary Sci. Rev., 29, 222–234, https://doi.org/10.1016/j.quascirev.2009.07.014, 2010.
Cassidy, W., Harvey, R., Schutt, J., Delisle, G., and Yanai, K.: The meteorite collection sites of Antarctica, Meteoritics, 27, 490–525, https://doi.org/10.1111/j.1945-5100.1992.tb01073.x, 1992.
Chalk, T. B., Hain, M. P., Foster, G. L., Rohling, E. J., Sexton, P. F., Badger, M. P. S., Cherry, S. G., Hasenfratz, A. P., Haug, G. H., Jaccard, S. L., Martínez-García, A., Pälike, H., Pancost, R. D., and Wilson, P. A.: Causes of ice age intensification across the Mid-Pleistocene Transition, P. Natl. Acad. Sci. USA., 114, 13114–13119, https://doi.org/10.1073/pnas.1702143114, 2017.
Conway, H., Hall, B. L., Denton, G. H., Gades, A. M., and Waddington, E. D.: Past and future grounding-line retreat of the west Antarctic ice sheet, Science, 286, 280–283, https://doi.org/10.1126/science.286.5438.280, 1999.
Craig, H., Horibe, Y., and Sowers, T.: Gravitational Separation of Gases and Isotopes in Polar Ice Caps, Science, 242, 1675–1678, https://doi.org/10.1126/science.242.4886.1675, 1988.
Crotti, I., Landais, A., Stenni, B., Bazin, L, Parrenin, F., Frezzotti, M., Ritterbusch, F., Lu, Z.-T., Jiang, W., Yang, G.-M., Fourré, E., Orsi, A., Jacob, R., Minster, B., Prié, F., Dreossi, G., and Barbante, C.: An extension of the TALDICE ice core age scale reaching back to MIS 10.1, Quaternary Sci. Rev., 266, 107078, https://doi.org/10.1016/j.quascirev.2021.107078, 2021.
Curzio, P., Folco, L., Laurenzi, M. A., Mellini, M., and Zeoli, A.: A tephra chronostratigraphic framework for the Frontier Mountain blue-ice field (northern Victoria Land, Antarctica), Quaternary Sci. Rev., 27, 602–620, https://doi.org/10.1016/j.quascirev.2007.11.017, 2008.
Dansgaard, W., White, J., and Johnsen, S.: The abrupt termination of the Younger Dryas climate event, Nature, 339, 532–534, https://doi.org/10.1038/339532a0, 1989.
Delisle, G. and Sievers, J.: Sub-ice topography and meteorite finds near the Allan Hills and the Near Western ice field, Victoria Land, Antarctica, J. Geophys. Res.-Planet., 96, 15577–15587, https://doi.org/10.1029/91JE01117, 1991.
Delmas, R. J., Ascencio, J.-M, and Legrand, M.: Polar ice evidence that atmospheric CO2 20,000 yr BP was 50 % of present, Nature, 284, 155–157, https://doi.org/10.1038/284155a0, 1980.
Dlugokencky, E. J., Myers, R. C., Lang, P. M., Masarie, K. A., Crotwell, A. M., Thoning, K. W., Hall, B. D., Elkins, J. W., and Steele, L. P.: Conversion of NOAA atmospheric dry air CH4 mole fractions to a gravimetrically prepared standard scale, J. Geophys. Res., 110, D18306, https://doi.org/10.1029/2005JD006035, 2005.
Dunbar, N. W., McIntosh, W. C., and Esser, R. P.: Physical setting and tephrochronology of the summit caldera ice record at Mount Moulton, West Antarctica, Geol. Soc. Am. Bull., 120, 796–812, https://doi.org/10.1130/B26140.1, 2008.
Elderfield, H., Ferretti, P., Greaves, M., Crowhurst, S., McCave, I. N., Hodell, D., and Piotrowski, A. M.: Evolution of Ocean Temperature and Ice Volume Through the Mid-Pleistocene Climate Transition, Science, 337, 704–709, https://doi.org/10.1126/science.1221294, 2012.
EPICA Community Members: Eight glacial cycles from an Antarctic ice core, Nature, 429, 623–628, https://doi.org/10.1038/nature02599, 2004.
Extier, T., Landais, A., Bréant, C., Prié, F., Bazin, L., Dreyfus, G., Roche, D. M., and Leuenberger, M.: δ18Oatm records between 100–800 ka from EPICA Dome C ice core, PANGAEA [data set], https://doi.org/10.1594/PANGAEA.887323, 2018a.
Extier, T., Landais, A., Bréant, C., Prié, F., Bazin, L., Dreyfus, G., Roche, D. M., and Leuenberger, M.: On the use of δ18Oatm for ice core dating, Quaternary Sci. Rev., 185, 244–257, https://doi.org/10.1016/j.quascirev.2018.02.008, 2018b.
Fischer, H., Severinghaus, J., Brook, E., Wolff, E., Albert, M., Alemany, O., Arthern, R., Bentley, C., Blankenship, D., Chappellaz, J., Creyts, T., Dahl-Jensen, D., Dinn, M., Frezzotti, M., Fujita, S., Gallee, H., Hindmarsh, R., Hudspeth, D., Jugie, G., Kawamura, K., Lipenkov, V., Miller, H., Mulvaney, R., Parrenin, F., Pattyn, F., Ritz, C., Schwander, J., Steinhage, D., van Ommen, T., and Wilhelms, F.: Where to find 1.5 million yr old ice for the IPICS “Oldest-Ice” ice core, Clim. Past, 9, 2489–2505, https://doi.org/10.5194/cp-9-2489-2013, 2013.
Fogwill, C. J., Turney, C. S. M., Menviel, L., Baker, A., Weber, M. E., Ellis, B., Thomas, Z. A., Golledge, N. R., Etheridge, D., Rubino, M., Thornton., D. P., Van Ommen, T. D., Moy, A. D., Curran, M. A. J., Davies, S., Bird, M. I., Munksgaard, N. C., Rootes, C. M., Millman, H., Vohra, J., Rivera, A., Mackintosh, A., Pike, J., Hall, I. R., Bagshaw, E. A., Rainsley, E., Bronk-Ramsey, C., Montenari, M., Cage, A. G., Harris, M. R. P., Jones, R., Power, A., Love, J., Young, J., Weyrich, L. S., and Cooper, A.: Southern Ocean carbon sink enhanced by sea-ice feedbacks at the Antarctic Cold Reversal, Nat. Geosci., 13, 489–497, https://doi.org/10.1038/s41561-020-0587-0, 2020.
Folco, L., Welten, K. C., Jull, A. J. T., Nishiizumi, K., and Zeoli, A.: Meteorites constrain the age of Antarctic ice at the Frontier Mountain blue ice field (northern Victoria Land), Earth Planet Sc. Lett., 248, 209–216, https://doi.org/10.1016/j.epsl.2006.05.022, 2006.
Gardner, A. S., Moholdt, G., Scambos, T., Fahnstock, M., Ligtenberg, S., van den Broeke, M., and Nilsson, J.: Increased West Antarctic and unchanged East Antarctic ice discharge over the last 7 years, The Cryosphere, 12, 521–547, https://doi.org/10.5194/tc-12-521-2018, 2018.
Goujon, C., Barnola, J.-M., and Ritz, C.: Modeling the densification of polar firn including heat diffusion: Application to close-off characteristics and gas isotopic fractionation for Antarctica and Greenland sites, J. Geophys. Res., 108, 4792, https://doi.org/10.1029/2002JD003319, 2003.
Hall, B. D., Crotwell, A. M., Kitzis, D. R., Mefford, T., Miller, B. R., Schibig, M. F., and Tans, P. P.: Revision of the World Meteorological Organization Global Atmosphere Watch (WMO/GAW) CO2 calibration scale, Atmos. Meas. Tech., 14, 3015–3032, https://doi.org/10.5194/amt-14-3015-2021, 2021.
Harvey, R.: The Origin and Significance of Antarctic Meteorites, Geochemistry, 63, 93–147, https://doi.org/10.1078/0009-2819-00031, 2003.
Herron, M. M. and Langway, C. C.: Firn densification: An empirical model, J. Glaciol., 25, 373–385, https://doi.org/10.3189/S0022143000015239, 1980.
Higgins, J. A., Kurbatov, A. V., Spaulding, N. E., Brook, E., Introne, D. S., Chimiak, L. M., Yan, Y., Mayewski, P. A., and Bender, M. L.: Atmospheric composition 1 million years ago from blue ice in the Allan Hills, Antarctica, P. Natl. Acad. Sci. USA., 112, 6887–6891, https://doi.org/10.1073/pnas.1420232112, 2015.
Hu, J., Yan, Y., Yeung, L. Y., and Dee, S. G.: Sublimation origin of negative deuterium excess observed in snow and ice samples from McMurdo Dry Valleys and Allan Hills Blue Ice Areas, East Antarctica, J. Geophys. Res.-Atmos. [preprint], https://doi.org/10.1002/essoar.10508105.1, 4 October 2021.
Hui, F., Ci, T., Cheng, X., Scambo, T. A., Liu, Y., Zhang, Y., Chi, Z., Huang H., Wang, X., Wang, F., Zhao, C., Jin, Z., and Wang, K.: Mapping blue-ice areas in Antarctica using ETM+ and MODIS data, Ann. Glaciol., 55, 129–137, https://doi.org/10.3189/2014AoG66A069, 2014.
Ikeda-Fukazawa, T., Fukumizu, K., Kawamura, K., Aoki, S., Nakazawa, T., and Hondoh, T.: Effects of molecular diffusion on trapped gas composition in polar ice cores, Earth Planet. Sc. Lett., 299, 183–192, https://doi.org/10.1016/j.epsl.2004.11.011, 2005.
Jang, Y., Han, Y., Ryu, Y., Moon, J., Ju, H.-T., Yang, J.-W., Lee, H.-G., Jun, S. J., Lee, J., Hur, S. D., Lee, J. I., and Ahn, J.: A preliminary study for blue ice in Victoria Land, East Antarctica, Journal of the Geological Society of Korea, 53, 567–580, https://doi.org/10.14770/jgsk.2017.53.4.567, 2017.
Jiang, W., Bailey, K., Lu, Z.-T., Mueller, P., O'Connor, T. P., Cheng, C.-F., Hu, S.-M., Purtschert, R., Sturchio, N. C., Sun, Y. R., Williams, W. D., and Yang, G.-M.: An atom counter for measuring 81Kr and 85Kr in environmental samples, Geochim. Cosmochim. Ac., 91, 1–6, https://doi.org/10.1016/j.gca.2012.05.019, 2012.
Jiang, W., Hu, S.-M., Lu, Z.-T., Ritterbusch, F., and Yang, G.: Latest development of radiokrypton dating – A tool to find and study paleogroundwater, Quatern. Int., 547, 166–171, https://doi.org/10.1016/j.quaint.2019.04.025, 2020.
Jouzel, J., Alley, R. B., Cuffey, K. M., Dansgaard, W., Grootes, P., Hoffmann, G., Johnsen, S. J., Koster, R. D., Peel, D., Shuman, C. A., Stievenard, M., Stuiver, M., and White, J.: Validity of the temperature reconstruction from water isotopes in ice cores, J. Geophys. Res., 102, 26471–26487, https://doi.org/10.1029/97JC01283, 1997.
Korotkikh, E. V., Mayewski, P. A., Handley, M. J., Sneed, S. B., Introne, D. S., Kurbatov, A. V., Dunbar, N. W., and McIntosh, W. C.: The last interglacial as represented in the glaciochemical record from Mount Moulton Blue Ice Area, West Antarctica, Quaternary Sci. Rev., 30, 1940–1947, https://doi.org/10.1016/j.quascirev.2011.04.020, 2011.
Landais, A., Caillon, N., Severinghaus, J., Jouzel, J., and Masson-Delmotte, V.: Analyses isotopiques à haute précision de l'air piégé dans les glaces polaires pour la quantification des variations rapides de température: méthodes et limites, Notes des activités instrumentales de l'IPSL, 39, https://hal.archives-ouvertes.fr/hal-03263858/document (last access: 6 June 2022), 2003.
Landais, A., Dreyfus, G., Capron, E., Masson-Delmotte, V., Sanchez-Goñi, M. F., Desprat, S., Hoffmann, G., Jouzel, J., Leuenberger, M., and Johnsen, S.: What drives the millennial and orbital variations of δ18Oatm?, Quaternary Sci. Rev., 29, 235–246, https://doi.org/10.1016/j.quascirev.2009.07.005, 2010.
Landais, A., Dreyfus, G. B., Capron, E., Jouzel, J., Masson-Delmotte, V., Roche, D. M., Prié, F., Caillon, N., Chappellaz, J., Leuenberger, M., Lourantou, A., Parrenin, F., Raynaud, D., and Teste, G.: EPICA Dome C Ice Core Terminations I and II Air Isotopes and CO2 Data, NOAA/WDS for Paleoclimatology [data set], https://www.ncei.noaa.gov/pub/data/paleo/icecore/antarctica/epica_domec/edc2013d18oatm.txt (last access: 1 September 2021), 2013.
Landais, A., Masson-Delmotte, V., Stenni, B., Selmo, E., Roche, D.M., Jouzel, J., Lambert, F., Guillevic, M., Bazin, L., Arzel, O., Vinther, B., Gkinis, V., and Popp, T.: A review of the bipolar see–saw from synchronized and high resolution ice core water stable isotope records from Greenland and East Antarctica, Quaternary Sci. Rev., 114, 18–32, https://doi.org/10.1016/j.quascirev.2015.01.031, 2015.
Lisiecki, L. E. and Raymo, M. E.: A Pliocene-Pleistocene stack of 57 globally distributed benthic δ18O records, Paleoceanography, 20, PA1003, https://doi.org/10.1029/2004pa001071, 2005.
Loosli, H. H. and Oeschger, H.: 37Ar and 81Kr in the atmosphere, Earth Planet Sc. Lett., 7, 67–71, https://doi.org/10.1016/0012-821X(69)90014-4, 1969.
Lourantou, A., Chappellaz, J., Barnola J.-M., Masson-Delmotte, V., and Raynaud, D.: Changes in atmospheric CO2 and its carbon isotopic ratio during the penultimate deglaciation, Quaternary Sci. Rev., 29, 1983–1992, https://doi.org/10.1016/j.quascirev.2010.05.002, 2010.
Lu, Z.-T., Schlosser, P., Smethie Jr., W. M., Sturchio, N. C., Fischer, T. P., Kennedy, B. M., Purtschert, R., Severinghaus, J. P., Solomon, D. K., Tanhua, T., and Yokochi, R.: Tracer applications of noble gas radionuclides in the geosciences, Earth-Sci. Rev., 138, 196–214, https://doi.org/10.1016/j.earscirev.2013.09.002, 2014.
Lüthi, D., Floch, M. L., Bereiter, B., Blunier, T., Barnola, J.-M., Siegenthaler, U., Raynaud, D., Jouzel, J., Fischer, H., Kawamura, K., and Stocker, T. F.: High-resolution carbon dioxide concentration record 650,000–800,000 years before present, Nature, 453, 379–382, https://doi.org/10.1038/nature06949, 2008.
Marcott, S. A., Bauska, T. K., Buizert, C., Steig, E. J., Rosen, J. L., Cuffey, K. M., Fudge, T. J., Severinghaus, J. P., Ahn, J., Kalk, M. L., McConnell, J. R., Sowers, T., Taylor K. C., White, J. W. C., and Brook, E. J.: Centennial-scale changes in the global carbon cycle during the last deglaciation, Nature, 514, 616–619, https://doi.org/10.1038/nature13799, 2014.
Masson-Delmotte, V., Hou, S., Ekaykin, A., Jouzel, J., Aristarain, A., Bernardo, R. T., Bromwich, D., Cattani, O., Delmotte, M., Falourd, S., Frezzotti, M., Gallée, H., Genoni, L., Isaksson, E., Landais, A., Helsen, M. M., Hoffmann, G., Lopez, J., Morgan, V., Motoyama, H., Noone, D., Oerter, H., Petit, J. R., Royer, A., Uemura, R., Schmidt, G. A., Schlosser, E., Simões, J. C., Steig, E. J., Stenni, B., Stievenard, M., Van Den Broeke, M. R., Van De Wal, R. S. W., Van De Berg, W. J., Vimeux, F., and White, J. W. C.: A review of Antarctic surface snow isotopic composition: Observations, atmospheric circulation, and isotopic modeling, J. Climate, 21, 3359–3387, https://doi.org/10.1175/2007JCLI2139.1, 2008.
Masson-Delmotte, V., Buiron, D., Ekaykin, A., Frezzotti, M., Gallée, H., Jouzel, J., Krinner, G., Landais, A., Motoyama, H., Oerter, H., Pol, K., Pollard, D., Ritz, C., Schlosser, E., Sime, L. C., Sodemann, H., Stenni, B., Uemura, R., and Vimeux, F.: A comparison of the present and last interglacial periods in six Antarctic ice cores, Clim. Past, 7, 397–423, https://doi.org/10.5194/cp-7-397-2011, 2011.
Matsuoka, K., Skoglund, A., and Roth, G.: Quanarctica, Norwegian Polar Institute [data set], https://doi.org/10.21334/npolar.2018.8516e961, 2018.
Matsuoka, K., Skoglund, A., Roth, G., de Pomereu, J., Griffiths, H., Headland, R., Herried, B., Katsumata, K., Le Brocq, A., Licht, K., Morgan, F., Neff, P. D., Ritz, C., Scheinert, M., Tamura, T., Van de Putte, A., van den Broeke, M., von Deschwanden, A., Deschamps-Berger, C., Van Liefferinge, B., Tronstad, S., and Melvær, Y.: Quantarctica, an integrated mapping environment for Antarctica, the Southern Ocean, and sub-Antarctic islands, Environ. Model. Softw., 140, 105015, https://doi.org/10.1016/j.envsoft.2021.105015, 2021.
Menking, J. A., Brook, E. J., Shackleton, S. A., Severinghaus, J. P., Dyonisius, M. N., Petrenko, V., McConnell, J. R., Rhodes, R. H., Bauska, T. K., Baggenstos, D., Marcott, S., and Barker, S.: Spatial pattern of accumulation at Taylor Dome during Marine Isotope Stage 4: stratigraphic constraints from Taylor Glacier, Clim. Past, 15, 1537–1556, https://doi.org/10.5194/cp-15-1537-2019, 2019.
Monnin, E., Indermühle, A., Dällenbach, A., Flückiger, J., Stauffer, B., Stocker, T. F., Raynaud, D., and Barnola, J.-M.: Atmospheric CO2 concentrations over the last glacial termination, Science, 291, 112–114, https://doi.org/10.1126/science.291.5501.112, 2001.
Monnin, E., Steig, E. J., Siegenthaler, U., Kawamura, K., Schwander, J., Stauffer, B., Stocker, T. F., Morse, D. L., Barnola, J.-M., Bellier, B., Raynaud, D., and Fischer, H.: Evidence for substantial accumulation rate variability in Antarctica during the Holocene, through synchronization of CO2 in the Taylor Dome, Dome C and DML ice cores, Earth Planet Sc. Lett., 224, 45–54, https://doi.org/10.1016/j.epsl.2004.05.007, 2004.
Morse, D. L., Waddington, E. D., and Steig, E. J.: Ice age storm trajectories inferred from radar stratigraphy at Taylor Dome, Antarctica, Geophys. Res. Lett., 25, 3383–3386, https://doi.org/10.1029/98GL52486, 1998.
Mouginot, J., Scheuchl, B., and Rignot, E.: Mapping of Ice Motion in Antarctica Using Synthetic-Aperture Radar Data, Remote Sensing, 4, 2753–2767, https://doi.org/10.3390/rs4092753, 2012.
Nakawo, M., Nagoshi, M., and Mae S.: Stratigraphic record of an ice core from the Yamato meteorite ice field, Antarctica, Ann. Glaciol., 10, 126–129, https://doi.org/10.3189/S0260305500004298, 1988.
Oeschger, H.: Accelerator mass spectrometry and ice core research, Nucl. Instrum. Meth. B., 29, 196–202, https://doi.org/10.1016/0168-583X(87)90235-7, 1987.
Oyabu, I., Kawamura, K., Kitamura, K., Dallmayr, R., Kitamura, A., Sawada, C., Severinghaus, J. P., Beaudette, R., Orsi, A., Sugawara, S., Ishidoya, S., Dahl-Jensen, D., Goto-Azuma, K., Aoki, S., and Nakazawa, T.: New technique for high-precision, simultaneous measurements of CH4, N2O and CO2 concentrations; isotopic and elemental ratios of N2, O2 and Ar; and total air content in ice cores by wet extraction, Atmos. Meas. Tech., 13, 6703–6731, https://doi.org/10.5194/amt-13-6703-2020, 2020.
Oyabu, I., Kawamura, K., Uchida, T., Fujita, S., Kitamura, K., Hirabayashi, M., Aoki, S., Morimoto, S., Nakazawa, T., Severinghaus, J. P., and Morgan, J. D.: Fractionation of and in the Antarctic ice sheet during bubble formation and bubble–clathrate hydrate transition from precise gas measurements of the Dome Fuji ice core, The Cryosphere, 15, 5529–5555, https://doi.org/10.5194/tc-15-5529-2021, 2021.
Parrenin, F., Barker, S., Blunier, T., Chappellaz, J., Jouzel, J., Landais, A., Masson-Delmotte, V., Schwander, J., and Veres, D.: On the gas-ice depth difference (Δdepth) along the EPICA Dome C ice core, Clim. Past, 8, 1239–1255, https://doi.org/10.5194/cp-8-1239-2012, 2012.
Petit, J. R., Jouzel, J., Raynaud, D., Barkov, N. I., Barnola, J.-M., Basile, I., Bender, M., Chappellaz, J., Davis, M., Delaygue, G. Delmotte, M., Kotlyakov, V. M., Legrand, M., Lipenkov, V. Y., Lorius, C., PÉpin, L., Ritz, C., Saltzman, E., and Stievenard, M.: Climate and atmospheric history of the past 420,000 years from the Vostok ice core, Antarctica, Nature, 399, 429–436, https://doi.org/10.1038/20859, 1999.
Petrenko, V. V., Severinghaus, J. P., Brook, E. J., Reeh, N., and Schaefer, H.: Gas records from the West Greenland ice margin covering the Last Glacial Termination: a horizontal ice core, Quaternary Sci. Rev., 25, 865–875, https://doi.org/10.1016/j.quascirev.2005.09.005, 2006.
Reeh, N., Oerter, H., and Thomsen, H. H.: Comparison between Greenland ice-margin and ice-core oxygen-18 records, Ann. Glaciol., 35, 136–144, https://doi.org/10.3189/172756402781817365, 2002.
Reynolds, J. M.: Dielectric Behaviour of Firn and Ice from the Antarctic Peninsula, Antarctica, J. Glaciol., 31, 253–262, https://doi.org/10.3189/S0022143000006584, 1985.
Rhodes, R. H., Brook, E. J., Blunier, T., McConnell, J. R., and Romanini, D.: Experiment-time-integrated CH4 data from all 3 instruments, calibrated and corrected for solubility and gravitational effects of the WAIS-Divide ice core, Antarctica, PANGAEA [data set], https://doi.org/10.1594/PANGAEA.875980, 2017.
Rignot, E., Mouginot, J., and Scheuchl, B.: Ice Flow of the Antarctic Ice Sheet, Science, 333, 1427–1430, https://doi.org/10.1126/science.1208336, 2011.
Schaefer, H., Whiticar, M. J., Brook, E. J., Petrenko, V. V., Ferretti, D. F., and Severinghaus J. P.: Ice record of δ13C for atmospheric CH4 across the Younger Dryas-Preboreal transition, Science, 313, 1109–1112, https://doi.org/10.1126/science.1126562, 2006.
Schaefer, H., Petrenko, V. V., Brook, E. J., Severinghaus, J. P., Reeh, N., Melton, J. R., and Mitchell, L.: Ice stratigraphy at the Pâkitsoq ice margin, West Greenland, derived from gas records, J. Glaciol., 55, 411–421, https://doi.org/10.3189/002214309788816704, 2009.
Schmitt, J., Schneider, R., Elsig, J., Leuenberger, D., Lourantou, A., Chappellaz, J., Köhler, P., Joos, F., Stocker, T. F., Leuenberger, M., and Fischer, H.: Carbon isotope constraints on the deglacial CO2 rise from ice cores, Science, 336, 711–714, https://doi.org/10.1126/science.1217161, 2012.
Schwander, J. and Stauffer, B.: Age difference between polar ice and the air trapped in its bubbles, Nature, 311, 45–47, https://doi.org/10.1038/311045a0, 1984.
Schwander, J., Sowers, T., Barnola, J.-M., Blunier, T., Fuchs, A., and Malaizé B.: Age scale of the air in the summit ice: Implication for glacial-interglacial temperature change, J. Geophys. Res., 102, 19483–19493, https://doi.org/10.1029/97JD01309, 1997.
Seltzer, A. M., Buizert, C., Baggenstos, D., Brook, E. J., Ahn, J., Yang, J.-W., and Severinghaus, J. P.: Does δ18O of O2 record meridional shifts in tropical rainfall?, Clim. Past, 13, 1323–1338, https://doi.org/10.5194/cp-13-1323-2017, 2017.
Severi, M., Udisti, R., Becagli, S., Stenni, B., and Traversi, R.: Volcanic synchronisation of the EPICA-DC and TALDICE ice cores for the last 42 kyr BP, Clim. Past, 8, 509–517, https://doi.org/10.5194/cp-8-509-2012, 2012.
Severinghaus, J. P.: Low-res δ15N and δ18O of O2 in the WAIS Divide 06A Deep Core, U.S. Antarctic Program (USAP) Data Center [data set], https://doi.org/10.7265/N5S46PWD, 2015.
Severinghaus, J. P., Sowers, T., Brook, E. J., Alley, R. B., and Bender, M. L.: Timing of abrupt climate change at the end of the Younger Dryas interval from thermally fractionated gases in polar ice, Nature, 391, 141–146, https://doi.org/10.1038/34346, 1998.
Severinghaus, J. P., Beaudette, R., Headly, M. A., Taylor, K., and Brook, E. J.: Oxygen-18 of O2 Records the Impact of Abrupt Climate Change on the Terrestrial Biosphere, Science, 324, 1431–1434, https://doi.org/10.1126/science.1169473, 2009.
Shin, J.: Atmospheric CO2 variations on millennial time scales during the early Holocene, MS thesis, School of Earth and Environmental Sciences, Seoul National University, South Korea, https://s-space.snu.ac.kr/bitstream/10371/131380/1/000000017635.pdf (last access: 6 June 2022), 2014.
Ship, S., Anderson, J., and Domack, E.: Late Pleistocene–Holocene retreat of the West Antarctic Ice-Sheet system in the Ross Sea: part 1 – Geophysical results, Geol. Soc. Am. Bull., 111, 1486–1516, https://doi.org/10.1130/0016-7606(1999)111<1486:LPHROT>2.3.CO;2, 1999.
Siegenthaler, U., Stocker, T. F., Monnin, E., Lüthi, D., Schwander, J., Staffer, B., Raynaud, D., Barnola, J.-M., Fischer, H., Masson-Delmotte, V., and Jouzel, J.: Stable carbon cycle–climate relationship during the late Pleistocene, Science, 310, 1313–1317, https://doi.org/10.1126/science.1120130, 2005.
Sigl, M., Fudge, T. J., Winstrup, M., Cole-Dai, J., Ferris, D., McConnell, J. R., Taylor, K. C., Welten, K. C., Woodruff, T. E., Adolphi, F., Bisiaux, M., Brook, E. J., Buizert, C., Caffee, M. W., Dunbar, N. W., Edwards, R., Geng, L., Iverson, N., Koffman, B., Layman, L., Maselli, O. J., McGwire, K., Muscheler, R., Nishiizumi, K., Pasteris, D. R., Rhodes, R. H., and Sowers, T. A.: The WAIS Divide deep ice core WD2014 chronology – Part 2: Annual-layer counting (0–31 ka BP), Clim. Past, 12, 769–786, https://doi.org/10.5194/cp-12-769-2016, 2016.
Sinisalo, A., Grinsted, A., Moore, J., Meijer, H., Martma, T., and Van De Wal, R. S. W.: Inferences from stable water isotopes on the Holocene evolution of Scharffenbergbotnen blue-ice area, East Antarctica, J. Glaciol., 53, 427–434, https://doi.org/10.3189/002214307783258495, 2007.
Sinisalo, A. and Moore, J. C.: Antarctic blue ice area – towards extracting palaeoclimate information, Antarct. Sci., 22, 99–115, https://doi.org/10.1017/S0954102009990691, 2010.
Sowers, T., Bender, M., Raynaud, D., and Korotkevich, Y. S.: δ15N of N2 in air trapped in polar ice: A tracer of gas transport in the firn and a possible constraint on ice age-gas age differences, J. Geophys. Res., 97, 15683–15697, https://doi.org/10.1029/92jd01297, 1992.
Sowers, T., Bender, M., Labeyrie, L., Martinson, D., Jouzel, J., Raynaud, D., Pichon, J. J., and Korotkevich, Y. S.: A 135,000-year Vostok-Sepcmap Common temporal framework, Paleoceanography, 8, 737–766, https://doi.org/10.1029/93PA02328, 1993.
Spaulding, N. E., Higgins, J. A., Kurbatov, A. V., Bender, M. L., Arcone, S. A., Campbell, S., Dunbar, N. W., Chimiak, L. M., Introne, D. S., and Mayewski, P. A.: Climate archives from 90 to 250 ka in horizontal and vertical ice cores from the Allan Hills Blue Ice Area, Antarctica, Quaternary Res., 80, 562–574, https://doi.org/10.1016/j.yqres.2013.07.004, 2013.
Steffensen, J. P., Andersen, K. K., Bigler, M., Clausen, H. B., Dahl-Jensen, D., Fischer, H., Goto-Azuma, K., Hansson, M., Johnsen, S. J., Jouzel, J., Masson-Delmotte, V., Popp, T., Rasmussen, S. O., Röthlisberger, R., Ruth, U., Stauffer, B., Siggaard-Andersen, M.-L., Sveinbjörnsdóttir, Á. E., Svensson, A., and White, J. W. C.: High-resolution Greenland ice core data show abrupt climate change happens in few years, Science, 321, 680–684, https://doi.org/10.1126/science.1157707, 2008.
Stenni, B., Buiron, D., Frezzotti, M., Albani, S., Barbante, C., Bard, E., Barnola, J. M., Baroni, M., Baumgartner, M., Bonazza, M., Capron, E., Castellano, E., Chappellaz, J., Delmonte, B., Falourd, S., Genoni, L., lacumin, P., Jouzel, J., Kipfstuhl, S., Landais, A., Lemieux-Dudon, B., Maggi, V., Masson-Delmotte, V., Mazzola, C., Minster, B., Montagnat, M., Mulvaney, R., Narcisi, B., Oerter, H., Parrenin, F., Petit, J. R., Ritz, C., Scarchilli, C., Schilt, A., Schüpbach, S., Schwander, J., Selmo, E., Severi, M., Stocker, T. F., and Udisti, R.: Expression of the bipolar see-saw in Antarctic climate records during the last deglaciation, Nat. Geosci., 4, 46–49, https://doi.org/10.1038/ngeo1026, 2011.
Tian, L., Ritterbusch, F., Gu J.-Q., Hu, S.-M., Jiang, W., Lu, Z.-T., Wang, D., and Yang, G.-M.: 81Kr Dating at the Guliya Ice Cap, Tibetan Plateau, Geohys. Res. Lett., 46, 6636–6643, https://doi.org/10.1029/2019GL082464, 2019.
Tollenaar, V., Zekollari, H., Lhermitte, S., Tax, D. M. J., Debaille, V., Goderis, S., Claeys, P., and Pattyn, F.: Unexplored Antarctic meteorite collection sites revealed through machine learning, Science Advances, 8, eabj8138, https://doi.org/10.1126/sciadv.abj8138, 2022.
Turney, C., Fogwill, C., Van Ommen, T. D., Moy, A. D., Etheridge, D., Rubino, M., Curran, M. A. J., and Rivera, A.: Late Pleistocene and early Holocene change in the Weddell Sea: a new climate record from the Patriot Hills, Ellsworth Mountains, West Antarctica, J. Quaternary Sci., 28, 697–704, https://doi.org/10.1002/jqs.2668, 2013.
Van Ommen, T., Morgan, V., and Curran, M.: Deglacial and Holocene changes in accumulation at Law Dome, East Antarctica, Ann. Glaciol., 39, 359–365, https://doi.org/10.3189/172756404781814221, 2004.
Veres, D., Bazin, L., Landais, A., Toyé Mahamadou Kele, H., Lemieux-Dudon, B., Parrenin, F., Martinerie, P., Blayo, E., Blunier, T., Capron, E., Chappellaz, J., Rasmussen, S. O., Severi, M., Svensson, A., Vinther, B., and Wolff, E. W.: The Antarctic ice core chronology (AICC2012): an optimized multi-parameter and multi-site dating approach for the last 120 thousand years, Clim. Past, 9, 1733–1748, https://doi.org/10.5194/cp-9-1733-2013, 2013.
Welten, K. C., Folco, L., Nishiizumi, K., Caffee, M. W., Grimberg, A., Meier, M. M. M., and Kober, F.: Meteoritic and bedrock constraints on the glacial history of Frontier Mountain in northern Victoria Land, Antarctica, Earth Planet. Sc. Lett., 270, 308–315, https://doi.org/10.1016/j.epsl.2008.03.052, 2008.
Whillans, I. M. and Cassidy, W. A.: Catch a falling star: Meteorites and old ice, Science, 222, 55–57, https://doi.org/10.1126/science.222.4619.55, 1983.
Yan, Y., Bender, M. L., Brook, E. J., Clifford, H. M., Kemeny, P. C., Kurbatov, A. V., Mackay, S., Mayewski, P. A., Ng, J., Severinghaus J. P., and Higgins, J. A.: Two-million-year-old snapshots of atmospheric gases from Antarctic ice, Nature, 574, 663–666, https://doi.org/10.1038/s41586-019-1692-3, 2019.
Yan, Y., Spaulding, N. E., Bender, M. L., Brook, E. J., Higgins, J. A., Kurbatov, A. V., and Mayewski, P. A.: Enhanced moisture delivery into Victoria Land, East Antarctica, during the early Last Interglacial: implications for West Antarctic Ice Sheet stability, Clim. Past, 17, 1841–1855, https://doi.org/10.5194/cp-17-1841-2021, 2021.
Yang, J.-W.: Paleoclimate reconstruction from greenhouse gas and borehole temperature of polar ice cores, and study on the origin of greenhouse gas in permafrost ice wedges, PhD thesis, School of Earth and Environmental Sciences, Seoul National University, South Korea, https://s-space.snu.ac.kr/bitstream/10371/152926/1/000000154664.pdf (last access: 9 June 2022), 2019.
Yau A. M., Bender, M. L., Marchant, D. R., and Mackay, S. L.: Geochemical analyses of air from an ancient debris-covered glacier, Antarctica, Quat. Geochronol., 28, 29–39, https://doi.org/10.1016/j.quageo.2015.03.008, 2015.
Yokoyama, Y., Anderson, J. B., Yamane, M., Simkins, L. M., Miyairi, Y., Yamazaki, T., Koizumi, M., Suga, H., Kusahara, K., Prothro, L., and Hasumi, H.: Widespread collapse of the Ross Ice Shelf during the late Holocene, P. Natl. Acad. Sci. USA, 113, 2354–2359, https://doi.org/10.1073/pnas.1516908113, 2016.
Zappala, J. C., Baggenstos, D., Gerber, C., Jiang, W., Kennedy, B. M., Lu, Z.-T., Masarik, J., Mueller, P., Purtschert, R., and Visser, A.: Atmospheric 81Kr as an Integrator of Cosmic-Ray Flux on the Hundred-Thousand-Year Time Scale, Geophys. Res. Lett., 47, e2019GL086381, https://doi.org/10.1029/2019GL086381, 2020.
Zekollari, H., Goderis, S., Debaille, V., van Ginneken, M., Gattacceca, J., Team, A., Jull, A. J. T., Lenaerts, J. T. M., Yamaguchi, A., Huybrechts, P., and Claeys, P.: Unravelling the high-altitude Nansen blue ice field meteorite trap (East Antarctica) and implications for regional paleo-conditions, Geochim. Cosmochim. Ac., 248, 289–310, https://doi.org/10.1016/j.gca.2018.12.035, 2019.
- Abstract
- Introduction
- Study area and methods
- Results
- Discussion
- Conclusions
- Appendix A: CH4, CO2, δ18Oatm, and δ15N–N2 measurements of the Larsen ice samples
- Appendix B: Gas age estimation for the Larsen BIA
- Appendix C: Ice age estimation for the Larsen BIA
- Appendix D: Surface temperature and accumulation rate estimation
- Data availability
- Author contributions
- Competing interests
- Disclaimer
- Acknowledgements
- Financial support
- Review statement
- References
- Supplement