the Creative Commons Attribution 4.0 License.
the Creative Commons Attribution 4.0 License.
 | 31 May 2022
Glacier–permafrost relations in a high-mountain environment: 5 decades of kinematic monitoring at the Gruben site, Swiss Alps
Isabelle Gärtner-Roer
Nina Brunner
Reynald Delaloye
Wilfried Haeberli
Andreas Kääb
Patrick Thee
Digitized aerial images were used to monitor the evolution of perennially frozen debris and polythermal glacier ice at the intensely investigated Gruben site in the Swiss Alps over a period of about 50 years. The photogrammetric analysis allowed for a compilation of detailed spatio-temporal information on flow velocities and thickness changes. In addition, high-resolution GNSS (global navigation satellite system) and ground surface temperature measurements were included in the analysis to provide insight into short-term changes. Over time, extremely contrasting developments and landform responses are documented. Viscous flow within the warming and already near-temperate rock glacier permafrost continued at a constant average but seasonally variable speed of typically decimetres per year, with average surface lowering limited to centimetres to a few decimetres per year. This constant flow causes the continued advance of the characteristic convex, lava-stream-like rock glacier with its oversteepened fronts. Thawing rates of ice-rich perennially frozen ground to strong climate forcing are very low (centimetres per year) and the dynamic response strongly delayed (timescale of decades to centuries). The adjacent cold debris-covered glacier tongue remained an essentially concave landform with diffuse margins, predominantly chaotic surface structure, intermediate thickness losses (decimetres per year), and clear signs of down-wasting and decreasing flow velocity. The former contact zone between the cold glacier margin and the upper part of the rock glacier with disappearing remains of buried glacier ice embedded on top of frozen debris exhibits complex phenomena of thermokarst in massive ice and backflow towards the topographic depression produced by the retreating glacier tongue. As is typical for glaciers in the Alps, the largely debris-free glacier part shows a rapid response (timescale of years) to strong climatic forcing with spectacular retreat (>10 m a−1) and mass loss (up to >1 m w.e. specific mass loss per year). The system of periglacial lakes shows a correspondingly dynamic evolution and had to be controlled by engineering work for hazard protection.
- Article
(11561 KB) - Full-text XML
-
Supplement
(4129 KB) - BibTeX
- EndNote


High alpine environments are characterized by perennial surface and subsurface ice, typically found in glaciers and permafrost. Glacier- and permafrost-related processes can interact in a number of ways (Haeberli, 2005). Both glaciers and permafrost are important for landscape evolution, the hydrological cycle, the mountain sediment budget, the stability of mountain slopes, and associated natural hazards. Due to their characteristic thermal conditions, close to melting or thawing temperature, the occurrence and preservation of glaciers and permafrost is strongly affected by atmospheric temperature rise (IPCC SROCC, 2019), which appears to be stronger in cold mountain areas than on a global average (UNEP, 2007; MRI, 2015).
Mountain glaciers and their fluctuations are recognized as key indicators of climate change; their mass balance primarily reflects a direct response to changing atmospheric conditions, while their volume and length changes (advance and retreat) represent an indirect, delayed, and filtered signal (Zemp et al., 2015). Debris cover is present on 44 % and prominent (covering >1 km2) on 15 % of the glaciers worldwide (Herreid and Pellicciotti, 2020). Glaciers with a thick debris cover are limited in terms of their use as climatic indicators since the debris cover influences the energy balance, delays the dynamic response, and influences the ablation rate as well as the discharge of meltwater (Nakawo et al., 2000; Reid and Brock, 2010; Ragettli et al., 2015; Ayala et al., 2016). When melting rapidly, glaciers waste down or back to where they have a clean surface, while changes in the debris-covered part typically are significantly smaller and the processes more complex (Benn et al., 2012; Mölg et al., 2020). Corresponding process differences can, for instance, enhance the potential of lake formation in the contact zone of clean and debris-covered ice and may cause glacier lake outburst floods (Kääb et al., 2005; Benn et al., 2012).
Together with long-term measurements of borehole and near-surface temperatures, the monitoring of changes in ice-rich perennially frozen debris and related viscous flow – here called “permafrost creep”, concerning the process, and “rock glacier”, concerning the resulting landform – is a key element within long-term observation programmes for mountain permafrost such as PERMOS (2022a) in the Swiss Alps. In accordance with the IPA Action Group “Rock glacier inventories and kinematics” (RGIK, 2020), rock glaciers as landforms are defined here by their characteristic morphology exhibiting long-term cohesive creep with reduced internal friction, their convex shape with oversteepened fronts resulting from continued advance, their composition of talus or debris with variable but generally high (excess) ice contents, and their complex flow behaviour as affected by negative subsurface temperatures and highly anisotropic material properties (Wahrhaftig and Cox, 1959; Haeberli, 1985; Haeberli et al., 1998; Florentine et al., 2014; Merz et al., 2015, 2016). Typically, rock glaciers creep downslope with velocities of several decimetres up to some metres per year (e.g. Roer, 2007; Bodin et al., 2009; Fleischer et al., 2021; Kääb et al., 2021). This creep behaviour results from internal deformation of the frozen debris and shearing within narrow horizons at typical depths of around 20 m (Arenson et al., 2002; Cicoira et al., 2021). Reliable information on the kinematics of rock glaciers provides insights into the evolution of ice-rich permafrost on mountain slopes and facilitates the analysis of its dynamics (Roer et al., 2005b; Kääb et al., 2007). Therefore, terrestrial as well as remote sensing techniques are applied to quantify the kinematics of permafrost creep, i.e. horizontal surface velocities and vertical surface changes, respectively (Lambiel and Delaloye, 2004; Kääb, 2005; Haeberli et al., 2006; Roer, 2007; Bodin et al., 2009; Strozzi et al., 2020; Cusicanqui et al., 2021; Fleischer et al., 2021; Kääb et al., 2021; Kaufmann et al., 2021).
In regions with moderately continental climatic conditions, contacts between polythermal glaciers and permafrost are widespread. Investigating the full spatio-temporal complexity of relations and interactions between surface and subsurface ice goes far beyond speculative landform interpretation from visual inspection alone. It requires the application of sophisticated quantitative methodologies such as drilling, geophysical soundings, temperature recording, and geodetic and photogrammetric observation in order to define material characteristics, physical conditions, and related processes (e.g. Reynard et al., 2003; Haeberli, 2005; Kneisel and Kääb, 2007; Bosson et al., 2014; Monnier et al., 2014; Janke et al., 2015; Bolch et al., 2019; Kunz and Kneisel, 2020; Falatkova et al., 2019; Kunz et al., 2021; Robson et al., 2022; Vivero et al., 2021). This can become important also for applied purposes in the context of formation and evolution of potentially hazardous periglacial lakes. Due to repeated historical outburst floods from such lakes in an environment with interacting glaciers and permafrost, the Gruben cirque (Fig. 1) in the Saas Valley, Swiss Alps, has been intensely investigated over many years and using numerous comprehensive field measurements, many of them in connection with protective construction work carried out on behalf of the responsible political authorities and the Swiss National Science Foundation (National Research Programme 31; Haeberli and Röthlisberger, 1976; Röthlisberger, 1979; Haeberli et al., 2001; Kääb and Haeberli, 2001).
To monitor the evolution of the formerly hazardous periglacial lakes, special large-scale aerial photographs were taken annually by the Federal Office of Topography swisstopo since 1970. A first detailed aero-photogrammetric analysis of the flow field caused by permafrost creep at Gruben rock glacier and its former contact zone with Gruben glacier was published by Haeberli et al. (1979). A detailed analysis of the vertical and horizontal changes at the rock glacier surface between 1970 and 1995 was given by Kääb et al. (1997). Results from numerous geophysical soundings (seismic refraction, ice-penetrating radar, geo-electrical resistivity, gravimetry), permafrost mapping using the BTS method (bottom temperature of winter snow cover; Haeberli, 1973; Lewkovicz and Ednie, 2004), core drilling, and lichenometric studies all document conditions in the periglacial areas and nearby glacier forefields (Barsch et al., 1979; Haeberli et al., 1979; Haeberli, 1979, 1985; King et al., 1987; Haeberli et al., 2001; see Supplement Figs. S1 and S2). The monitoring of kinematics and ground surface temperatures (GSTs) on the Gruben rock glacier has been systematically documented within the framework of the Swiss Permafrost Monitoring Network (PERMOS, 2022a) since 2012 and 2015, respectively. On the directly adjacent Gruben glacier, radio-echo soundings, numerous hot-water drillings with borehole observations (englacial temperature, glacier bed resistivity, subglacial water pressure), and aerophotogrammetric observations on thickness changes provided rich information reported by Haeberli (1976), Haeberli and Fisch (1984), Haeberli et al. (2001), and Kääb (2001). Comprehensive geophysical and dynamic investigations also concerned the steeper part of Gruben glacier above its flat tongue (Kulessa, 2009).
The purpose of the study presented here is (i) to extend the kinematic monitoring series on the tongue of Gruben glacier and the adjacent Gruben rock glacier by another 21 years to describe the observed horizontal and vertical changes for a 46-year period (1970–2016; additional in situ monitoring on the rock glacier provides information until 2020), (ii) to analyse and compare the creep characteristics of the perennially frozen rock glacier (“periglacial part”) with its striking oversteepened fronts and “organized” surface structure (longitudinal ridges) and the former contact zone with the polythermal Little Ice Age (LIA) glacier (“glacier-affected part”) with its more chaotic surface morphology, and (iii) to analyse and compare the morphological structures and flow of the rock glacier and the debris-covered polythermal glacier adjacent to it in order to differentiate the characteristics of the two landforms and their evolution in time. In sum, our study aims to analyse a 50-year time series of interconnected periglacial, paraglacial, and glacial processes and their morphological expressions in a cold, high-mountain environment.
The polythermal Gruben glacier and the adjacent active rock glacier are situated below the western face of Fletschhorn (3993 m a.s.l.) in the canton of Valais, southern Swiss Alps (46∘10′ N, 7∘58′ E; Fig. 1). The southern Valais, in between the Great St. Bernhard, the Rhone Valley, and the Simplon area, is formed by the St. Bernhard and Monte Rosa Penninic nappes. The Gruben site is characterized by the Siviez–Mischabel sub-nappe, where polymetamorphic rocks dominate (Labhart, 1998). The climate of the study area is predominantly influenced by air masses from the south-west and has an inner-Alpine, moderately continental character. According to meteorological measurements at high elevations in the Swiss Alps (MeteoSwiss) and applying an environmental lapse rate of −0.60 ∘C per 100 m, mean annual air temperature at the site (2700–3000 m a.s.l.) can be estimated at some −2 to −4 ∘C for the time period 1980–2009. Around the end of the Little Ice Age, temperatures have been colder by about 1 ∘C (Ilyashuk et al., 2019), whereas the last decade (2011–2020) warmed by about 0.8 ∘C (in comparison to 1980–2009). Regional precipitation has not been measured on site but is probably around or even slightly below 1000 mm a−1 as the Gruben area is particularly shielded by high-mountain ridges in all directions within a few tens of kilometres.
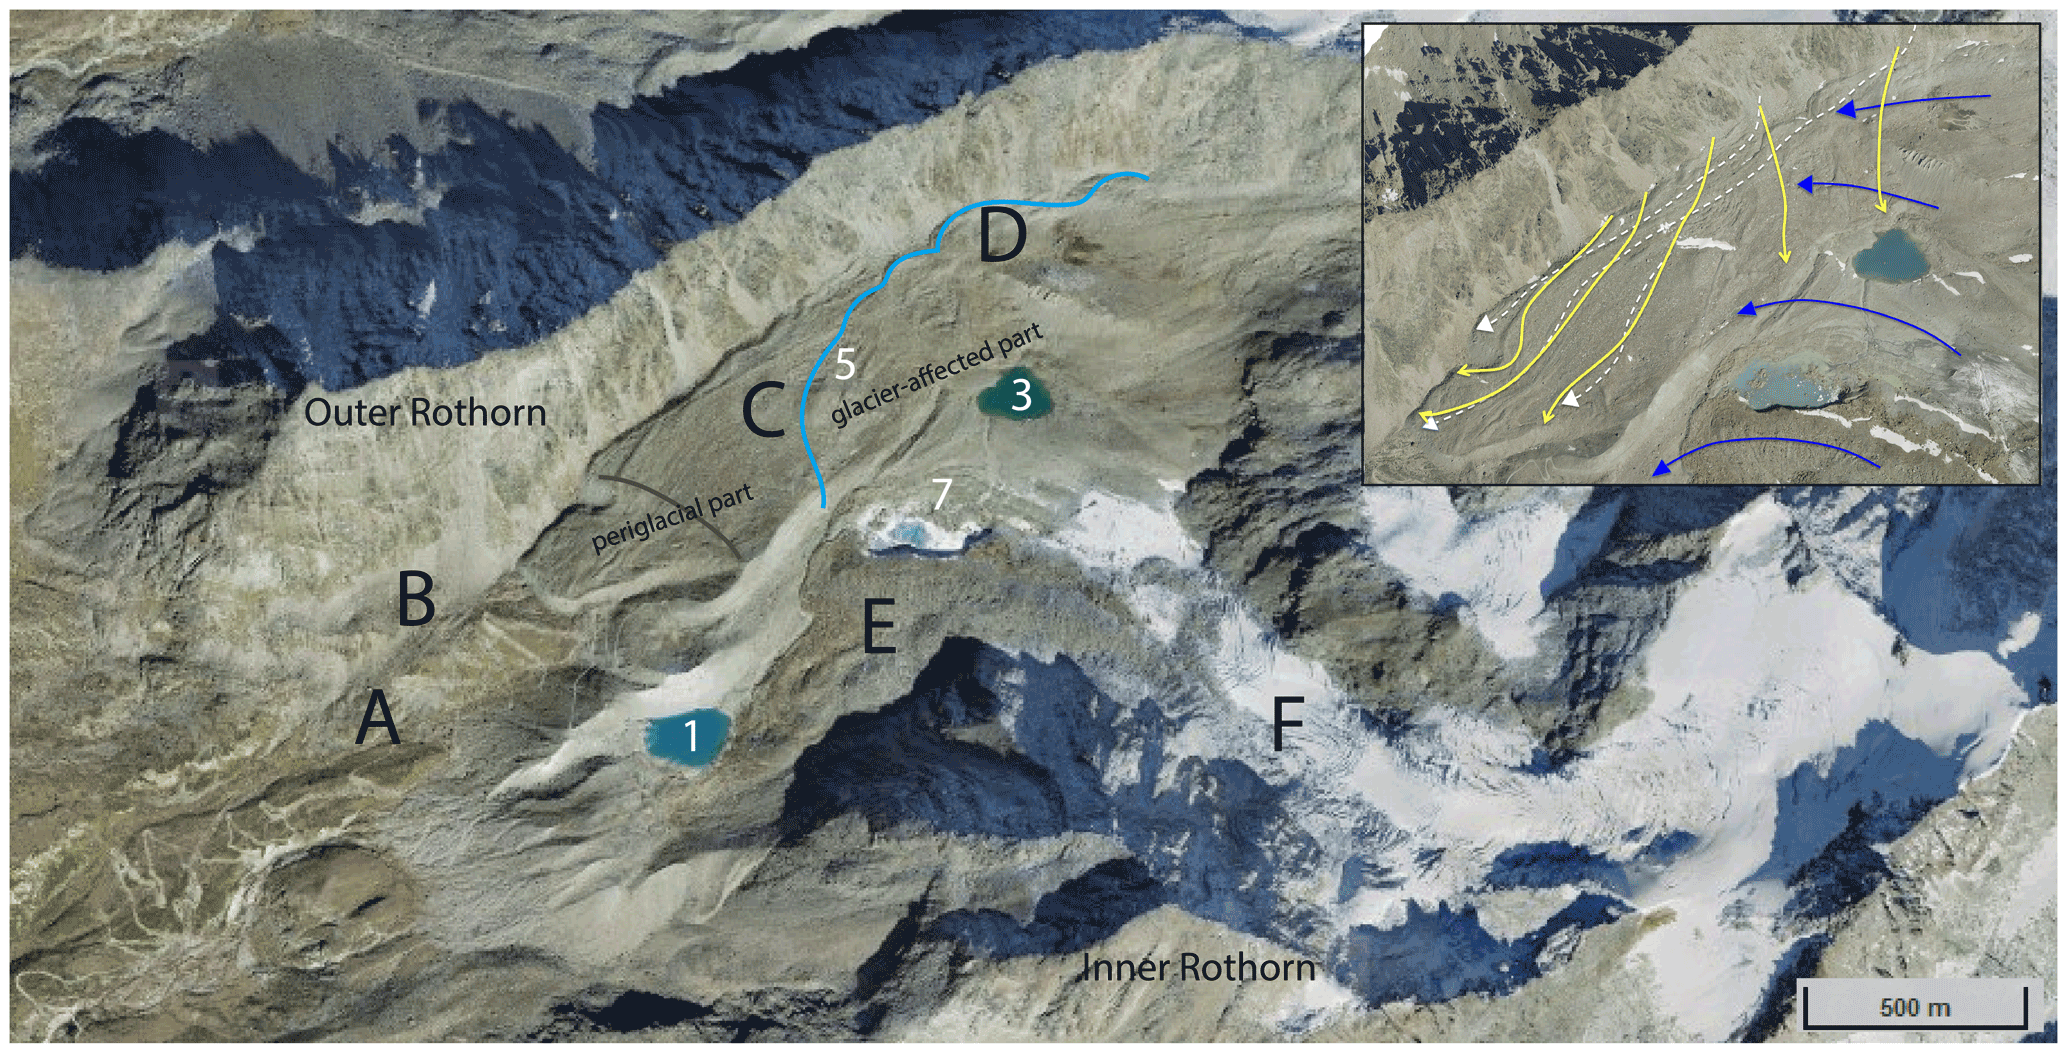
Figure 1Geomorphological description of the Gruben site as shown in an orthophoto from 2017 (© SWISSIMAGE, geodata@swisstopo). The blue line indicates the approximate outline of Gruben glacier in the contact zone with the Gruben rock glacier at the time of the Little Ice Age (LIA). The grey line on the rock glacier indicates the position of a seismically determined subsurface bedrock riegel. Landforms: A = inactive but still frozen rock glacier; B = actively creeping, frozen protalus rampart; C = Gruben rock glacier; D = deformed frozen talus or moraine; E = debris-covered tongue of Gruben glacier; F = Gruben glacier; 1, 3, 7 = existing lakes; 5 = former thermokarst lake (lake numbering follows historical scheme in order to keep lake identities constant over time; see Fig. 4). The inset in the upper right (see full Fig. 1 for scale) shows the flow trajectories in frozen debris as determined by aero-photogrammetry with the yellow lines (see Fig. 14 in Haeberli et al., 1979; see Fig. S3) and flow trajectories in frozen debris (dashed white lines), which follow the surface structures produced by long-term cumulative deformation of the frozen talus. The blue arrows indicate the estimated flow direction of the LIA glacier as derived from the earliest reliable topographic map (1889; see Figs. S4, S5, and S6).
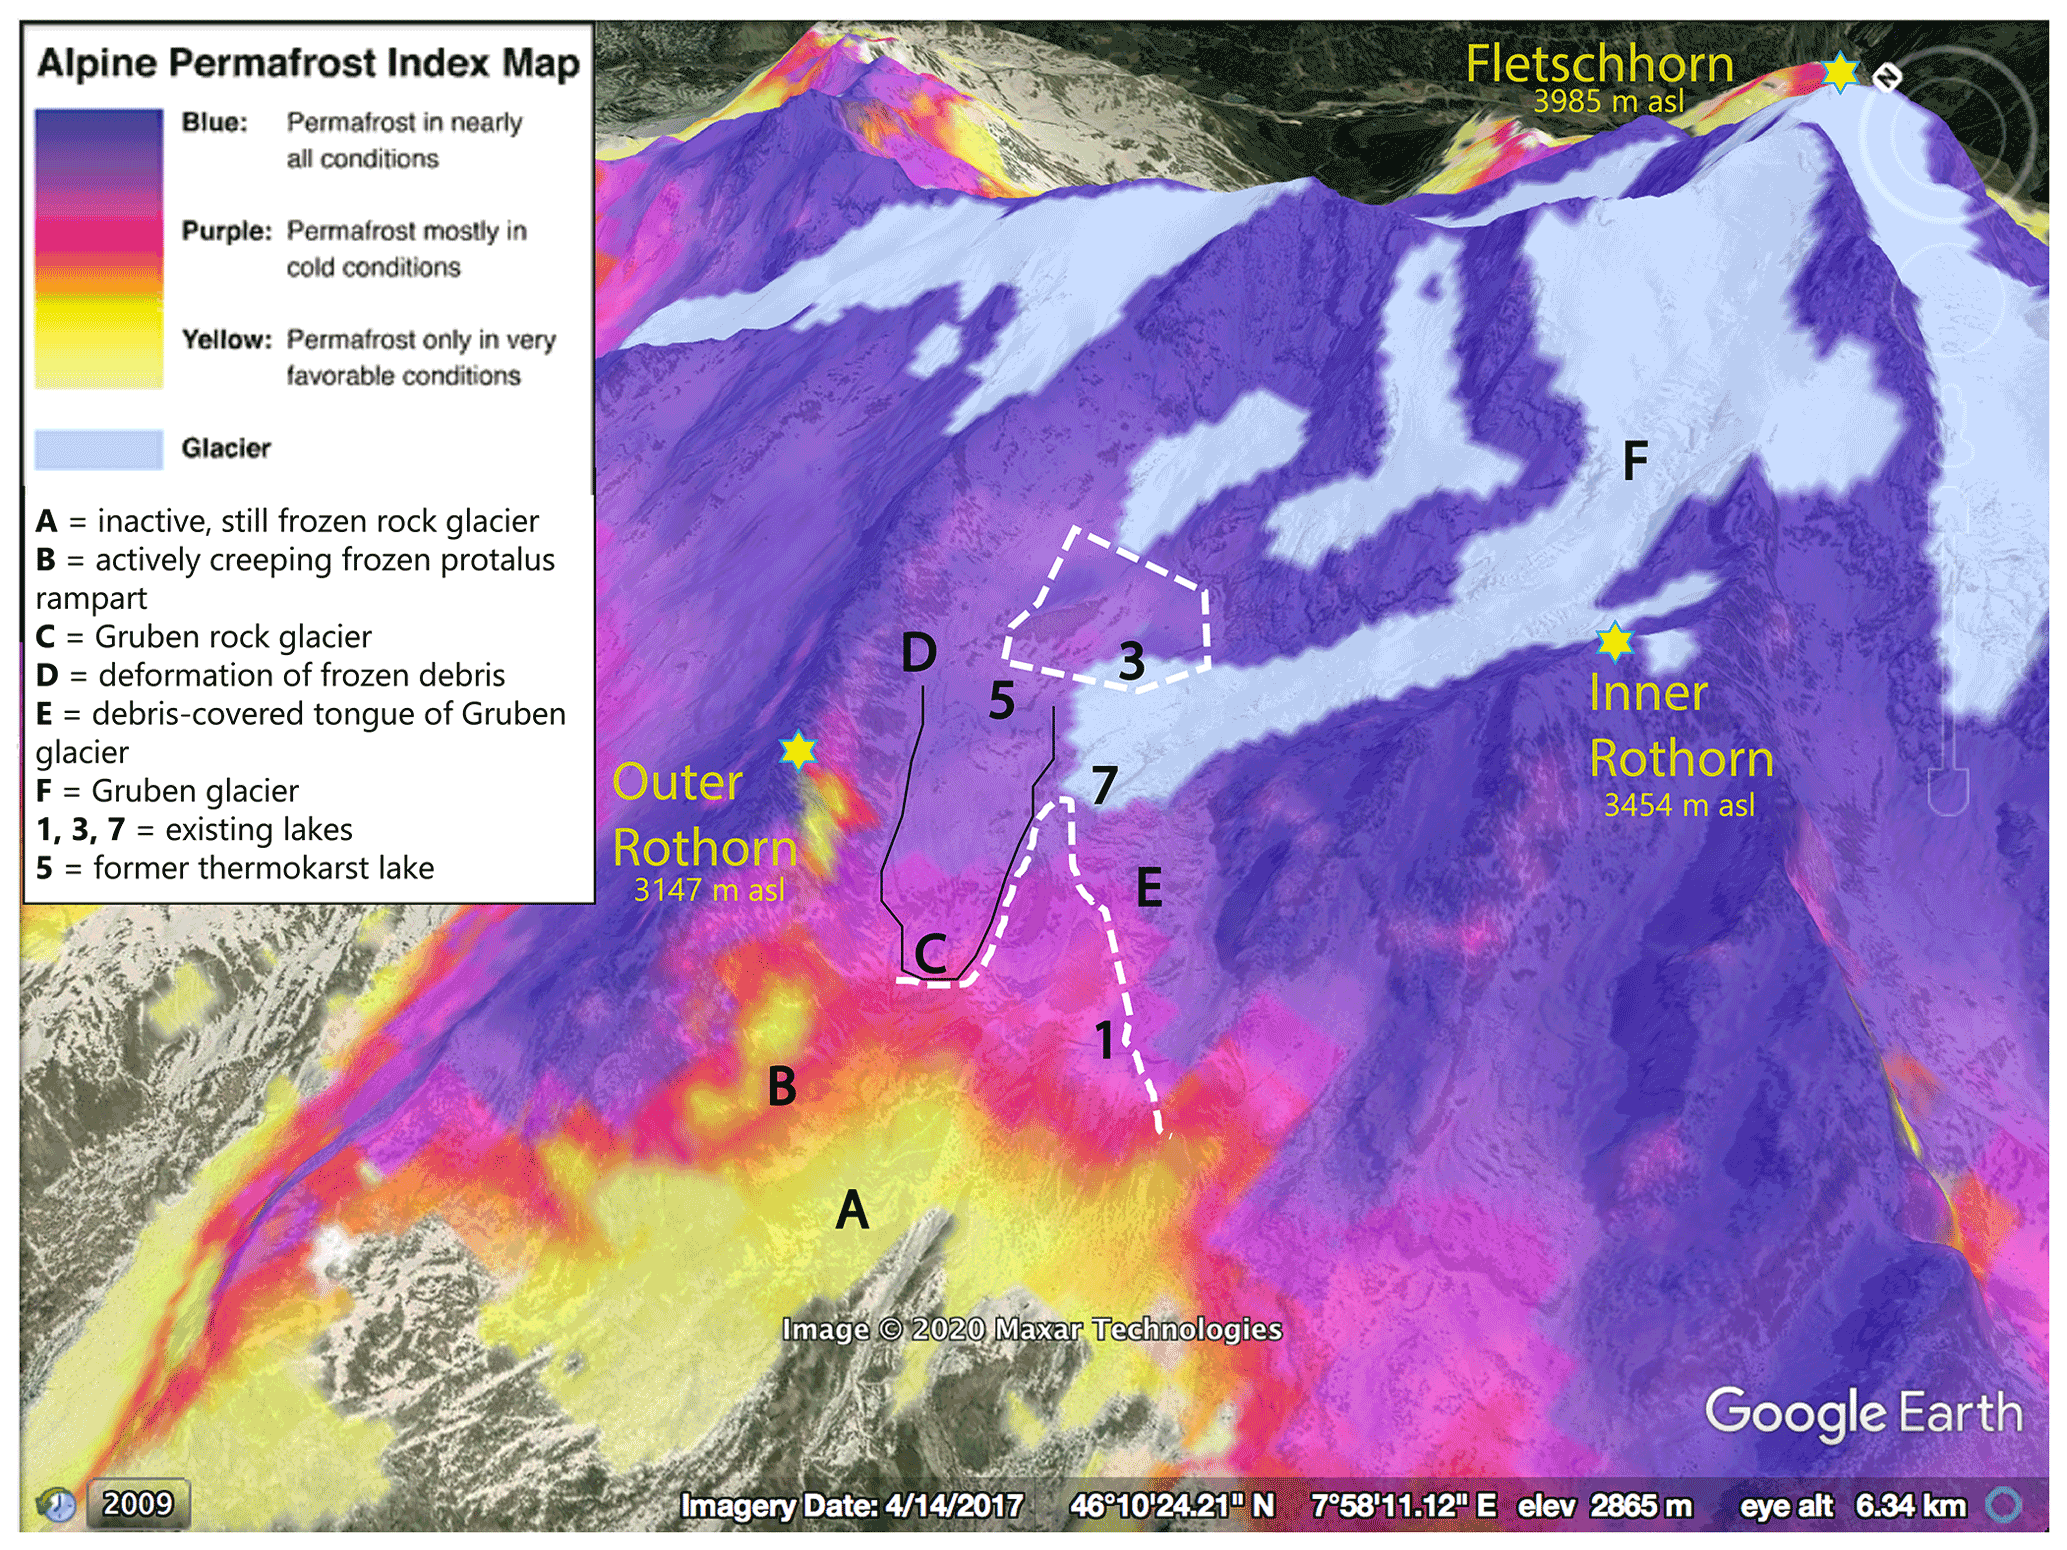
Figure 2Permafrost distribution at the Gruben site as derived from the Alpine Permafrost Index Map (Boeckli et al., 2012), overlaid on GoogleEarth (© Google Earth 2009; see Figs. S7 and S8 for comparison with other spatial permafrost simulations at the site). The thin black line indicates the outline of the rock glacier. Dashed white lines indicate transition to permafrost-free terrain as documented by BTS measurements and geophysical soundings (see Fig. S1).
Under such cold and dry conditions, mountain permafrost is widespread (Fig. 2; see other model results for the site from FOEN, 2005, and Kenner et al., 2019 (Figs. S1 and S2 herein), which are in general agreement with results from field measurements and also with large-scale simulations at 1 km resolution by Obu et al., 2019 (Northern Hemisphere), or Gruber, 2012 (worldwide)). Especially cold local microclimates thereby exist for two situations: (a) in steep rock faces with thin winter snow and exposed away from the sun and (b) below surfaces with large blocks where the advection of latent heat by burial of snow in widely open pore spaces together with efficient convective ventilation in wintertime can locally reduce mean ground temperatures by several degrees centigrade (Hanson and Hoelzle, 2004). Warm conditions relate to more fine-grained surface materials in topographic depressions with thick accumulation of winter snow (e.g. Schneider et al., 2013). Conditions at the Gruben site closely correspond to this differentiation: the forefields of the polythermal but largely warm-based glaciers, with their finer materials and flat to even partly concave topography, are permafrost-free as indicated with dashed white lines in Fig. 2, while the shady north-west-oriented rock faces below the Inner Rothorn and the blocky “foot-of-talus” situations below the Outer Rothorn are perennially frozen. The constituting lithic materials of the rock glacier are derived from the long-term (i.e. Holocene) erosion of the headwall reaching from Outer Rothorn to Senggchuppa and through various sediment transfer processes varying over time. Borehole temperatures at 3 m depth close to but below the permafrost table in the upper part of Gruben rock glacier (see Figs. S2 and S3) were about −1 ∘C from 1977–1982, and BTS values were about −5 ∘C (Haeberli, 1985). Recent GST values at the rock glacier surface (Fig. 3) document that the rock glacier permafrost was still thermally active in 2015–2020, with an active layer regularly freezing through during wintertime as documented by near-consistently cold BTS values.
The surface thermal behaviour at the Gruben rock glacier is well in accordance with the observations at other permafrost sites in the region (Valais, Cervinia, Furka, Gotthard), which show a consistent warming trend by about +0.36 ∘C per decade over the last 20 years (Fig. 3; PERMOS, 2020). With mean annual near-surface temperatures close to and even above 0 ∘C, the thickness of the frozen materials reaching up to about 100 m must be inherited from colder phases of the Holocene and the Little Ice Age (see Haeberli, 1985; Haeberli et al., 2001; Whalley, 2020) and is not in equilibrium with today's climate. In view of pronounced thermal offsets within the active layer (ventilation, Balch effect) and at the permafrost table (latent heat), mean annual permafrost temperatures at the depth of zero annual amplitude (about 15 m) can be expected to be close to thawing conditions but still slightly negative even today.
Viscous creep of perennially frozen talus produces a large number of active rock glaciers in the region (Frauenfelder, 1998; Barboux et al., 2015). Smaller permafrost landforms, such as an actively moving protalus rampart and an inactive but still frozen rock glacier, exist at Gruben down to elevations around 2600 m a.s.l. Cohesive deformation of frozen talus and right-lateral moraine is also indicated in the uppermost part of the cirque (Fig. 1; Haeberli, 1979). From the electrical resistivities (high kΩ m range), the strong attenuation of electromagnetic waves, the high but variable P-wave velocities, frontal advance rates of the rock glacier (Kääb and Reichmuth, 2005), and shallow core drilling (7 m) on top of it, overall volumetric ice contents of the ice-supersaturated frozen talus material are estimated to be within about 60 % to 85 % by volume (see similar values reported from geophysical soundings and core drillings at comparable sites by Florentine et al., 2014; Krainer et al., 2014; Merz et al., 2015, 2016). In the periglacial part of Gruben rock glacier there is no measured evidence of major buried ice bodies (Haeberli, 2021). Extrapolating back in time using the photogrammetrically determined advance rate of 0.15 times the surface velocity at the front, the development of Gruben rock glacier can be estimated to have taken place during major parts of the Holocene, i.e. over millennia (Kääb et al., 1997). This is in accordance with absolute age determinations by exposure, luminescence, or radiocarbon datings at other rock glaciers in the Alps (Haeberli et al., 2003; Fuchs et al., 2013; Krainer et al., 2014; Amschwand et al., 2021; see also Nesje et al., 2021, concerning a low-elevation case in Norway). The Gruben rock glacier front now advances over vegetation-covered, permafrost-free terrain.
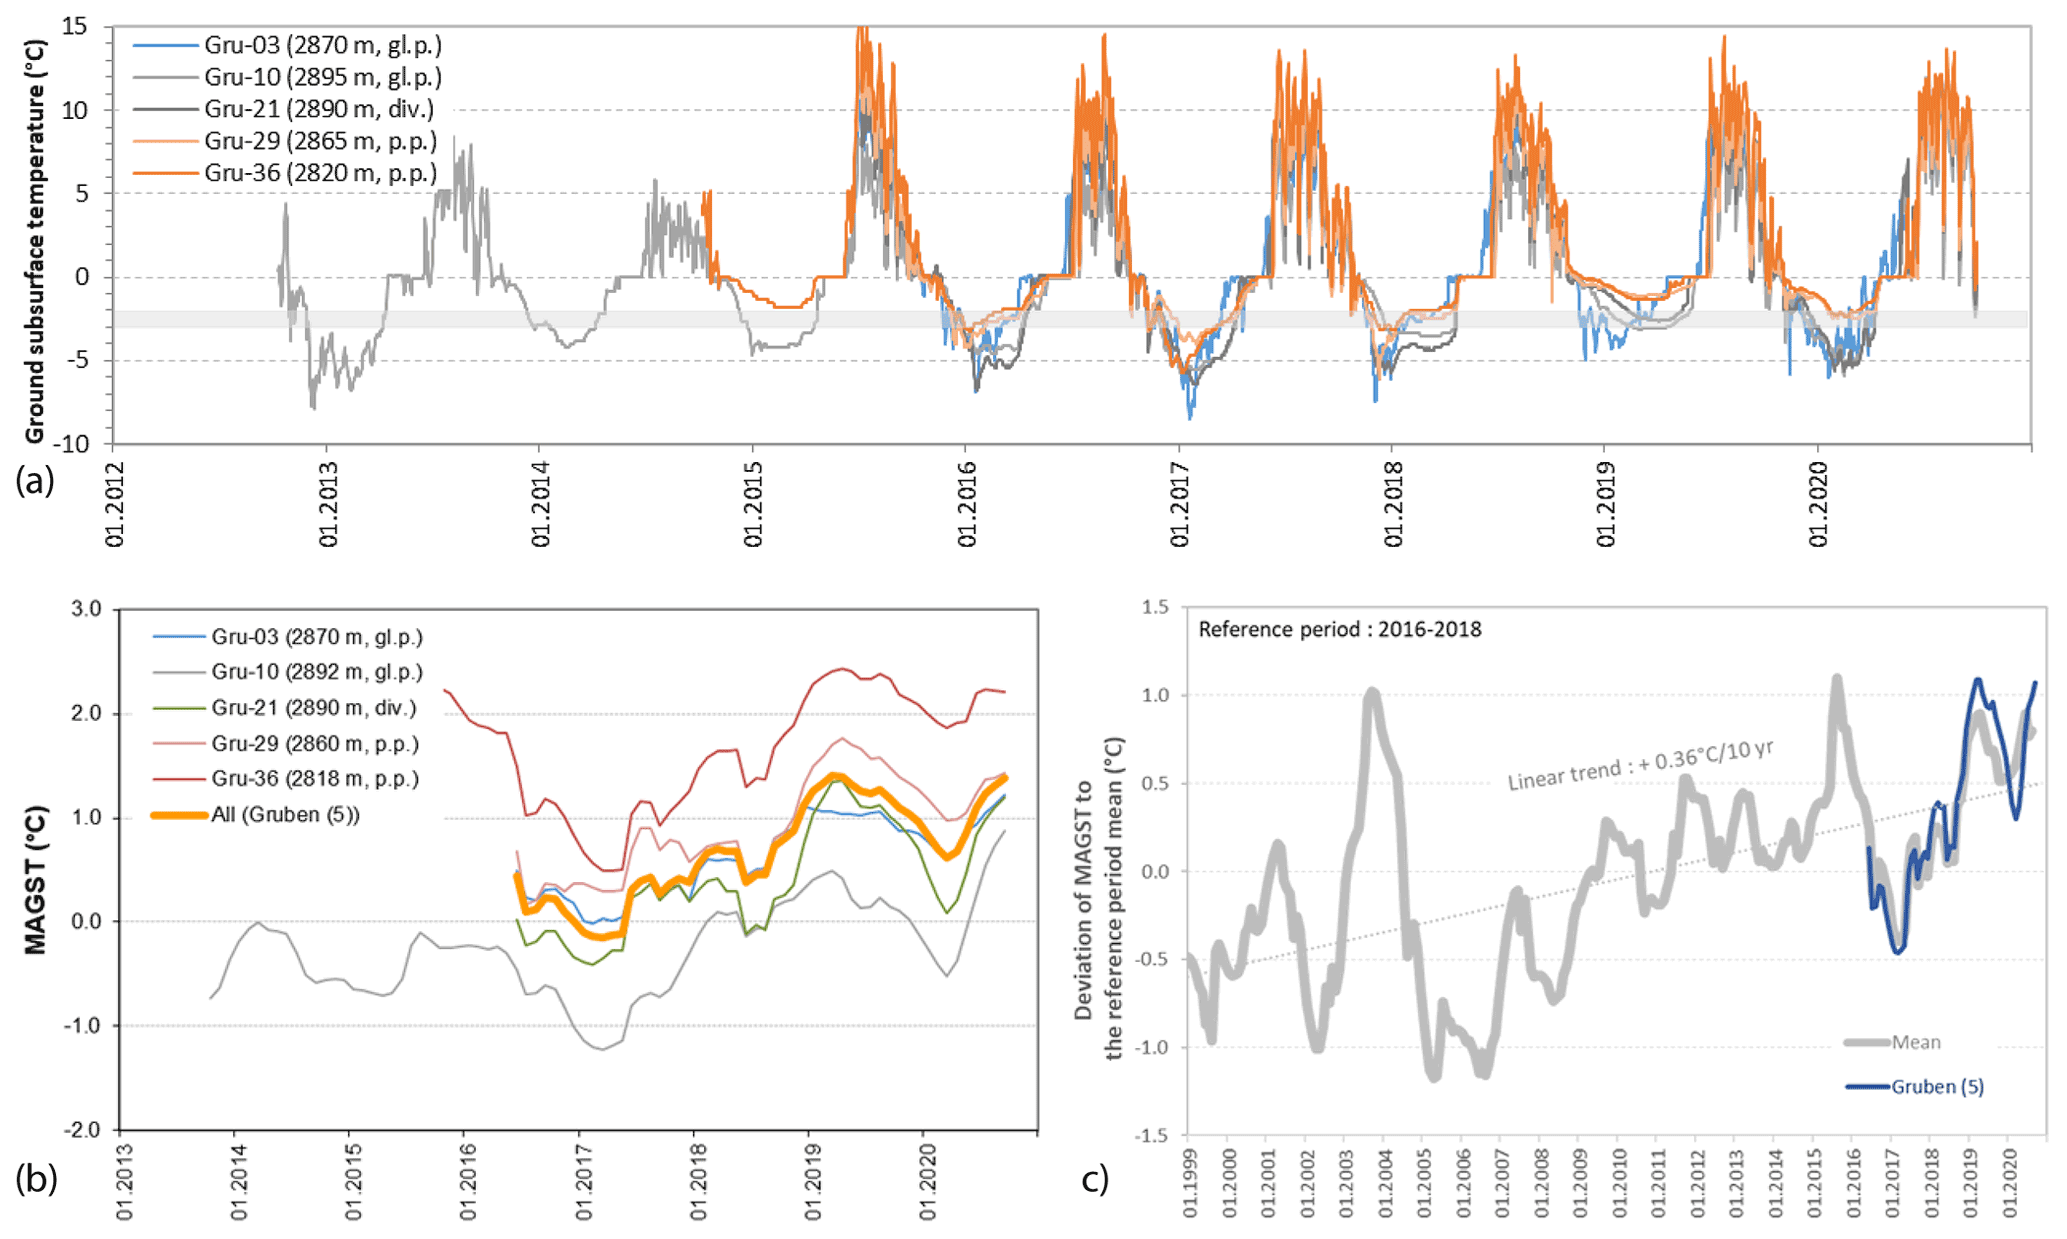
Figure 3Daily ground surface temperature on the Gruben rock glacier (gl.p.: glacier-affected part; p.p.: periglacial part; div.: transition zone) since 2013, with indication of the upper limit of BTS for permafrost conditions (horizontal light-grey bar) (a), mean annual ground surface temperature (MAGST) (b), and deviation to the reference period 2016–2018 in comparison with the overall signal measured on rock glaciers and debris landforms (n=2 to >20) in the surrounding region (c) (data: PERMOS and University of Fribourg).
Gruben glacier flows down from the Fletschhorn in the shape of a mirrored “S” and has its active tongue at about 2880 m a.s.l., while its debris-covered part on the orographic left side reaches down to 2780 m a.s.l. (see Fig. 1). The glacier was polythermal when investigated in the 1970s with borehole temperatures. Firn temperatures were close to −10 ∘C in its highest parts, temperate firn existed in the steep lower accumulation area, and the tongue was partially cold with 10 m temperatures of −1 to −2 ∘C (Haeberli, 1976). The rapidly vanishing flat part of the ablation area was frozen to its bed at the margins but otherwise warm-based; it rested on relatively fine sandy sediments exceeding in places a thickness of 100 m (Haeberli and Fisch, 1984). Artesian water has been observed in hot-water drillings at the transition zone between warm- and cold-based ice (Haeberli et al., 1992, 2001). The artificial tunnel through the cold glacier margin at lake 3 established after the outburst events in 1968 and 1970 for lake-level lowering had been carved into the frozen part of this subglacial bed material. The orographic left part of the tongue can be assumed to be somewhat colder than the rock glacier because it receives more shadow from the Inner Rothorn. It is heavily covered with debris from intense rockfall activity in the rock walls to the south of it, which are affected by strong glacial de-buttressing and probably also by permafrost degradation.
During cold periods of the Holocene, especially during historical advances, the upper part of the rock glacier was partly in contact with the orographic right margin of the polythermal Gruben glacier, which deposited some debris-covered ice (up to about 20 m thick; Kääb and Haeberli, 2001) on top of the permafrost. This complex part of the rock glacier is called the glacier-affected part, whereas the lower part is described as the periglacial part (Kääb et al., 1997; see Figs. 1 and 4), both being separated by a diffuse transition zone without any clear geomorphological limit. The position of this somewhat diffuse contact zone is defined by (a) the clear margin of the debris-free glacier as indicated in the first reliable topographic map (1889; see Figs. S4, S5, and S6); (b) the limits of exposed massive ice as documented in the annually flown aerial photos; and (c) the direction of the flow trajectories, which lead from the talus at Outer Rothorn to the rock glacier front; see Fig. S3. The exposed buried ice on top of permafrost in the former contact zone seems to have vanished during the past years.
Between 1970 and the mid-1990s, changes in geometry and movement have been pronounced for the clean part of Gruben glacier, minimal for the periglacial part of Gruben rock glacier, and intermediate for the glacier-affected part of the rock glacier (Haeberli et al., 2001; Kääb, 2001), indicating different dynamics of glacial, periglacial, and paraglacial processes.
Since the early 20th century, several periglacial lakes had developed and in cases disappeared again in the Gruben cirque at elevations between 2770 and 2900 m a.s.l. (lakes 1, 3, 5, and 6 in Figs. 1 and 4). Lake outbursts and associated floods and debris flows through the Fällbach Creek had repeatedly threatened and damaged the village of Saas Balen (1500 m a.s.l.) in the Saas Valley. Lake 1 is a moraine-dammed lake in front of the debris-covered glacier tongue of Gruben glacier (proglacial lake). In the years 1968 and 1970, outburst floods in combination with the sudden emptying of Lake 3 into Lake 1 formed a deep breach in the large moraine threshold and developed into devastating debris flows. With the construction of a reinforced and controllable outlet structure, Lake 1 was later turned into a retention basin with a capacity of about 100 000 m3 for floods from the upper parts of the cirque (Haeberli et al., 2001). Lake 3 was long situated directly at the cold margin of the glacier tongue at 2860 m a.s.l. Following the outbursts of 1968 and 1970, an artificial outflow tunnel through ice and subglacial permafrost of the glacier margin was constructed for lake-level regulation. This tunnel was replaced in 1996 by an open channel along the retreating glacier margin. In the following year, continued and even enhanced thinning and melting back of the glacier margin eliminated direct ice contact of the remaining water in the lake, the level of which was further lowered in 2003 through a shallow artificial cut in morainic material of the former glacier bed. Lake 5 – a classical thermokarst lake – started developing in the 1960s in buried massive ice on top of the rock glacier in its glacier-affected part. It continually migrated with and grew on top of the slowly creeping permafrost underneath (Kääb and Haeberli, 2001). In autumn 1994 the lake had a surface of about 10 000 m2 and was filled with up to 50 000 m3 of water. Due to its increasing hazard potential, the lake was artificially emptied in 1995, partially by pumping and by draining through an excavated trench. Lakes 2, 4, and 6 were temporary and of less importance with respect to geomorphological and hazard considerations. In 2016, lake 5 was still empty, and lake 3 was also of less concern due to the retreating Gruben glacier. A new proglacial lake (lake 7) formed in the connection zone between the debris-free ice and the debris-covered part of Gruben glacier, building a 20 m high ice cliff at its southern bank (Fig. 4).

Figure 4Geomorphological map of the Gruben site. The moraine ages are taken from Whalley (1979) (age A) and Haeberli et al. (1979) (ages B and C). The numbering of lakes 1 to 9 follows the historical sequence of lake formation and denomination; lakes 2 and 4 are not present anymore. The mapping is conducted on the orthophoto and DTM as of 2016 (© swisstopo). Axes are labelled with Swiss coordinates (in metres; CH 1903).
Geometry changes in Gruben rock glacier and the debris-covered part of Gruben glacier were quantified by the application of digital photogrammetry based on digitized or digital aerial photography. In order to continue the existing kinematic monitoring series (1970–1995) at the Gruben site (Kääb et al., 1997; Kääb, 2001), large-scale aerial images of the years 1994, 2000, 2006, 2010, and 2016 (swisstopo) were selected for this study. Image orientation, automatic generation of digital terrain models (DTMs), and digital orthoprojection were performed within the digital photogrammetry software SocetSet (BAE Systems, UK). DTMs with 1 m spacing and orthophotos with 0.32 m ground resolution were compiled for the 1994, 2000, 2006, and 2010 imagery, while the 2016 data from an aerial digital sensor (ADS) were already processed to DTMs and orthoimages. The accuracy of the DTMs is estimated to lie within the range of 1–3 pixels for moderate high-mountain topography (Kääb, 2005). The DTMs were co-registered according to the procedure by Nuth and Kääb (2011). For the quantification of vertical changes, the DTMs of the respective years were differenced within ArcGIS. Thus, loss of excess permafrost ice and glacier ice as well as the topographic expressions of mass transfer can be quantified. The horizontal velocities were calculated using standard digital cross-correlation as implemented in the software CIAS (Correlation Image Analysis Software; Kääb and Vollmer, 2000; Heid and Kääb, 2012). The error (root mean square) of single displacement measurements is about ±0.3–0.4 m or, in the case of a 5-year interval between two photo missions, about ±0.06–0.08 m a−1, and the error in the vertical changes is estimated to ±1 m or, ±0.17–0.2 m a−1 (Kääb et al., 1997; Brunner, 2020). If a large number of measurements are analysed in combination (as, for example, in Fig. 8), the statement is an order of magnitude more accurate (±0.006–0.008 m a−1). Detailed information on raw data, processing steps, resampling methods, and data accuracy is given in Kääb (2005), Roer et al. (2005a), and Brunner (2020). The horizontal velocities shown in this study are given for values above a maximum correlation coefficient determined as the 30 % quantile, as detailed in Brunner (2020).
In addition, repeated GNSS (global navigation satellite system) measurements were started on the rock glacier in 2012 (Barboux et al., 2015; see Beutel et al., 2021, for additional measurements). At 46 locations, measurements have been taken twice a year around 1 July and 1 October to estimate seasonal as well as annual and decadal changes. The measurement points are distributed over different zones in the periglacial and the glacier-affected part of the rock glacier (Fig. 6). According to the recurrent measurement of four stable control points outside the rock glacier, the accuracy (standard deviation) in positioning is 0.8 cm in horizontal coordinates and 1.0 cm in elevation. The uncertainty in horizontal velocity as well as in vertical displacement rate, without taking into account any tilting or specific movement of the marked boulder, is about 2 cm a−1 over a year but rises to 3 cm a−1 when the velocity is computed over the 9 winter months and 9 cm a−1 over the 3 summer months. Further, permanent GNSS data are available for the Gruben rock glacier from 2012 onwards. The fixed station provides high-resolution data (seasonal to sub-seasonal) on surface deformation (Beutel et al., 2021). Both GNSS data sets can be compared with the multi-annual velocities obtained from cross-correlating repeat orthophotos of the rock glacier.
4.1 Gruben rock glacier – periglacial part
For the period 1970–1995, Kääb et al. (1997) showed horizontal velocities of several decimetres per year for the central part of the rock glacier (upper part of the periglacial part) and maximum values of about 1 m a−1 directly above the rock glacier front. The vector field depicted a uniform pattern over the years and a sharp velocity increase as the rock glacier creeps over a bedrock riegel about 250 m above the front (see Fig. 1) indicated by (unpublished) seismic refraction soundings (Kääb, 2005).
In the following years (1994–2016), as investigated in the present study, the overall pattern of the vector field remained similar (Fig. 5). Towards the rock glacier lateral margins the horizontal velocities are below 0.1 m a−1 and mostly in the range of measurement uncertainty. Especially the orographic left part of the rock glacier seems to be hardly active. As in the previous study, velocities between 0.2–0.4 m a−1 occur in the central part of the rock glacier and higher rates of 0.7–1 m a−1 at and below the bedrock riegel (Fig. 1). Mean horizontal velocities of the periglacial part of the rock glacier for the period 1970 to 2016 are given in Fig. 8a and indicate only little changes (about 0.3 m a−1). The in situ measurements in the last decade (2012–2020) give similar results and show in addition that the rock glacier surface near the front (points 040–043) is moving about 25 % slower than the tongue behind (points 032–039). Only small changes in horizontal velocities are observed over time, with an almost constant trend around which limited seasonal and interannual variations occur, whereas the very terminal part of the rock glacier above its front tends to decelerate by about 2.5 cm a−1 (Fig. 7).
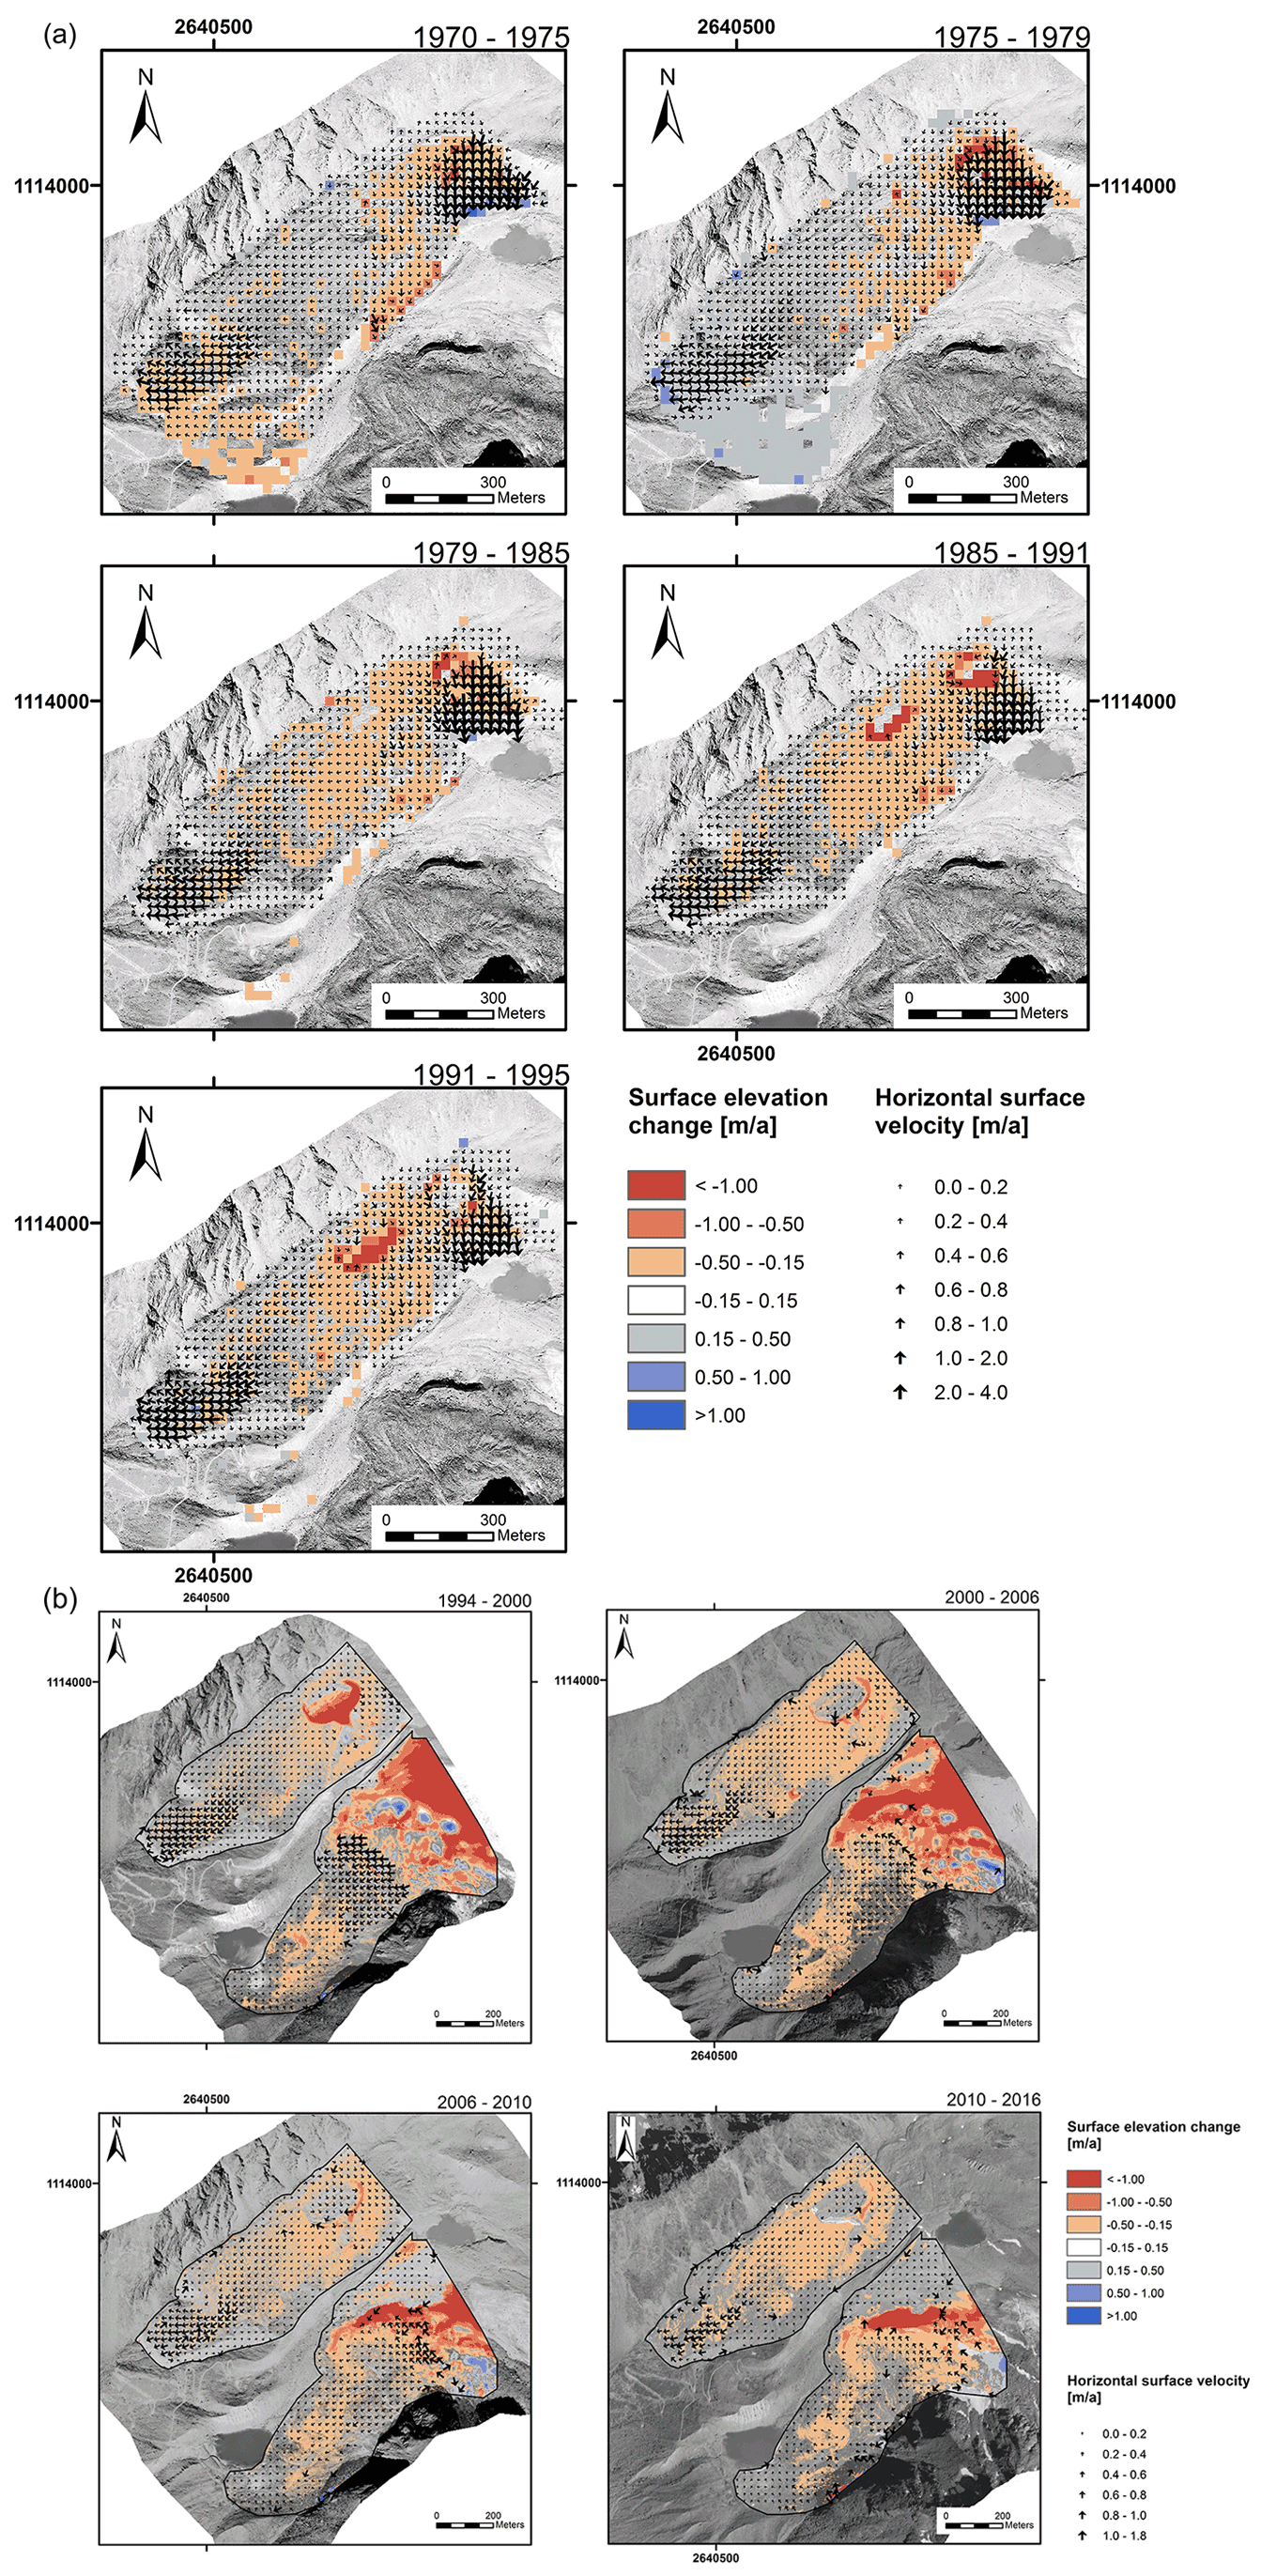
Figure 5Overlay of the horizontal surface velocities (vectors) and the colour-coded changes in surface elevation (a) for the years 1970 to 1975, 1975 to 1979, 1979 to 1985, 1985 to 1991, and 1991 to 1995 for the rock glacier only (from Kääb et al., 1997) and (b) for the years 1994 to 2000, 2000 to 2006, 2006 to 2010, and 2010 to 2016 for the rock glacier and the debris-covered glacier tongue (for each observation period the later orthophoto is used as background: 2000, 2006, 2010, and 2016, respectively). Axes are labelled with Swiss coordinates (in metres; CH 1903).
The vertical changes in the central part of the rock glacier reflect surface lowering (−0.1 to −0.5 m a−1) between 1970 and 1995, whereas the lower tongue seems to remain almost constant in thickness (Kääb, 2005). In the period 1994–2016 the vertical changes show the same pattern and are in about the same range of −0.1 to −0.5 m a−1 (in total between −2 and −10 m). The lower part of the rock glacier shows small vertical changes (Fig. 5). Mean vertical changes for the period 1970 to 2016 are given in Fig. 8a and indicate slow and nearly constant surface lowering.
The GNSS measurements of the period 2012–2020 show that the trajectories of the marked boulders at the rock glacier surface are all inclined 10 to 30∘, what is close, but in most places somewhat steeper than the surface topography (Fig. 7). The trajectories are often steeper in summertime, indicating ice-melt-induced subsidence between 0 and −0.3 m a−1. The absence of a relative height gain caused by the compression related to the slow-down of the creep velocity in the last tens of metres above the front indicates the occurrence of an ice-melt-induced subsidence, which can reach here up to −0.5 m a−1. The data of the permanent GNSS, situated between the bedrock riegel and the rock glacier front, fit well with the data of the photogrammetry and the GNSS and show values between 0.9–1.1 m a−1.
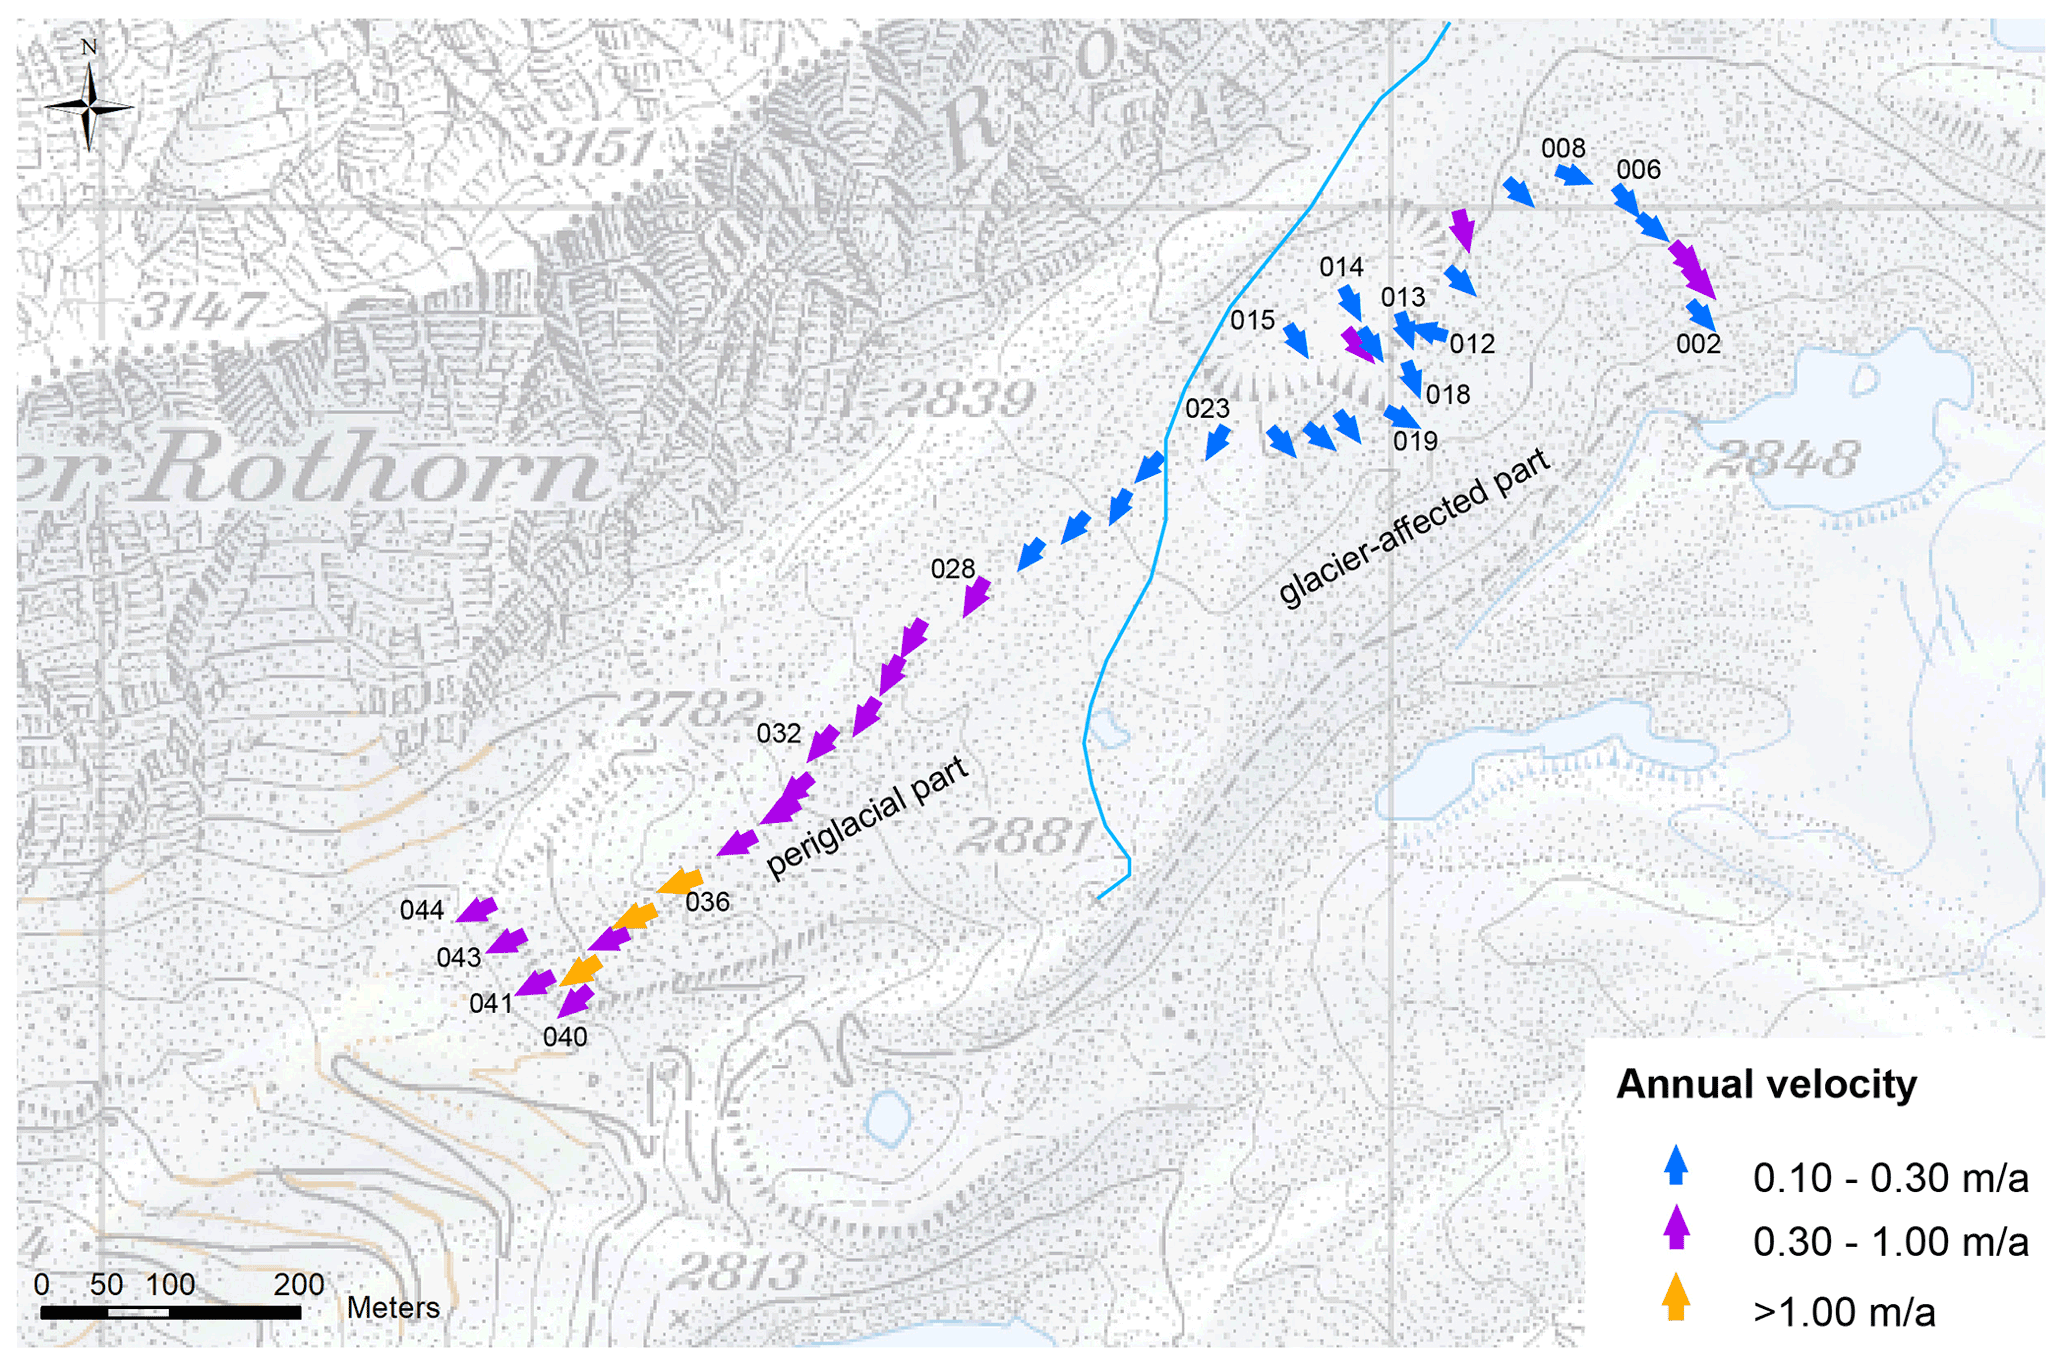
Figure 6Overview of horizontal flow fields on Gruben rock glacier, measured by GNSS for the year 2019/2020. Numbers refer to GNSS measurement items. The blue line separates approximately between the glacier-affected and periglacial parts of the rock glacier (see Fig. 1). Basemap © swisstopo, updated 2005.
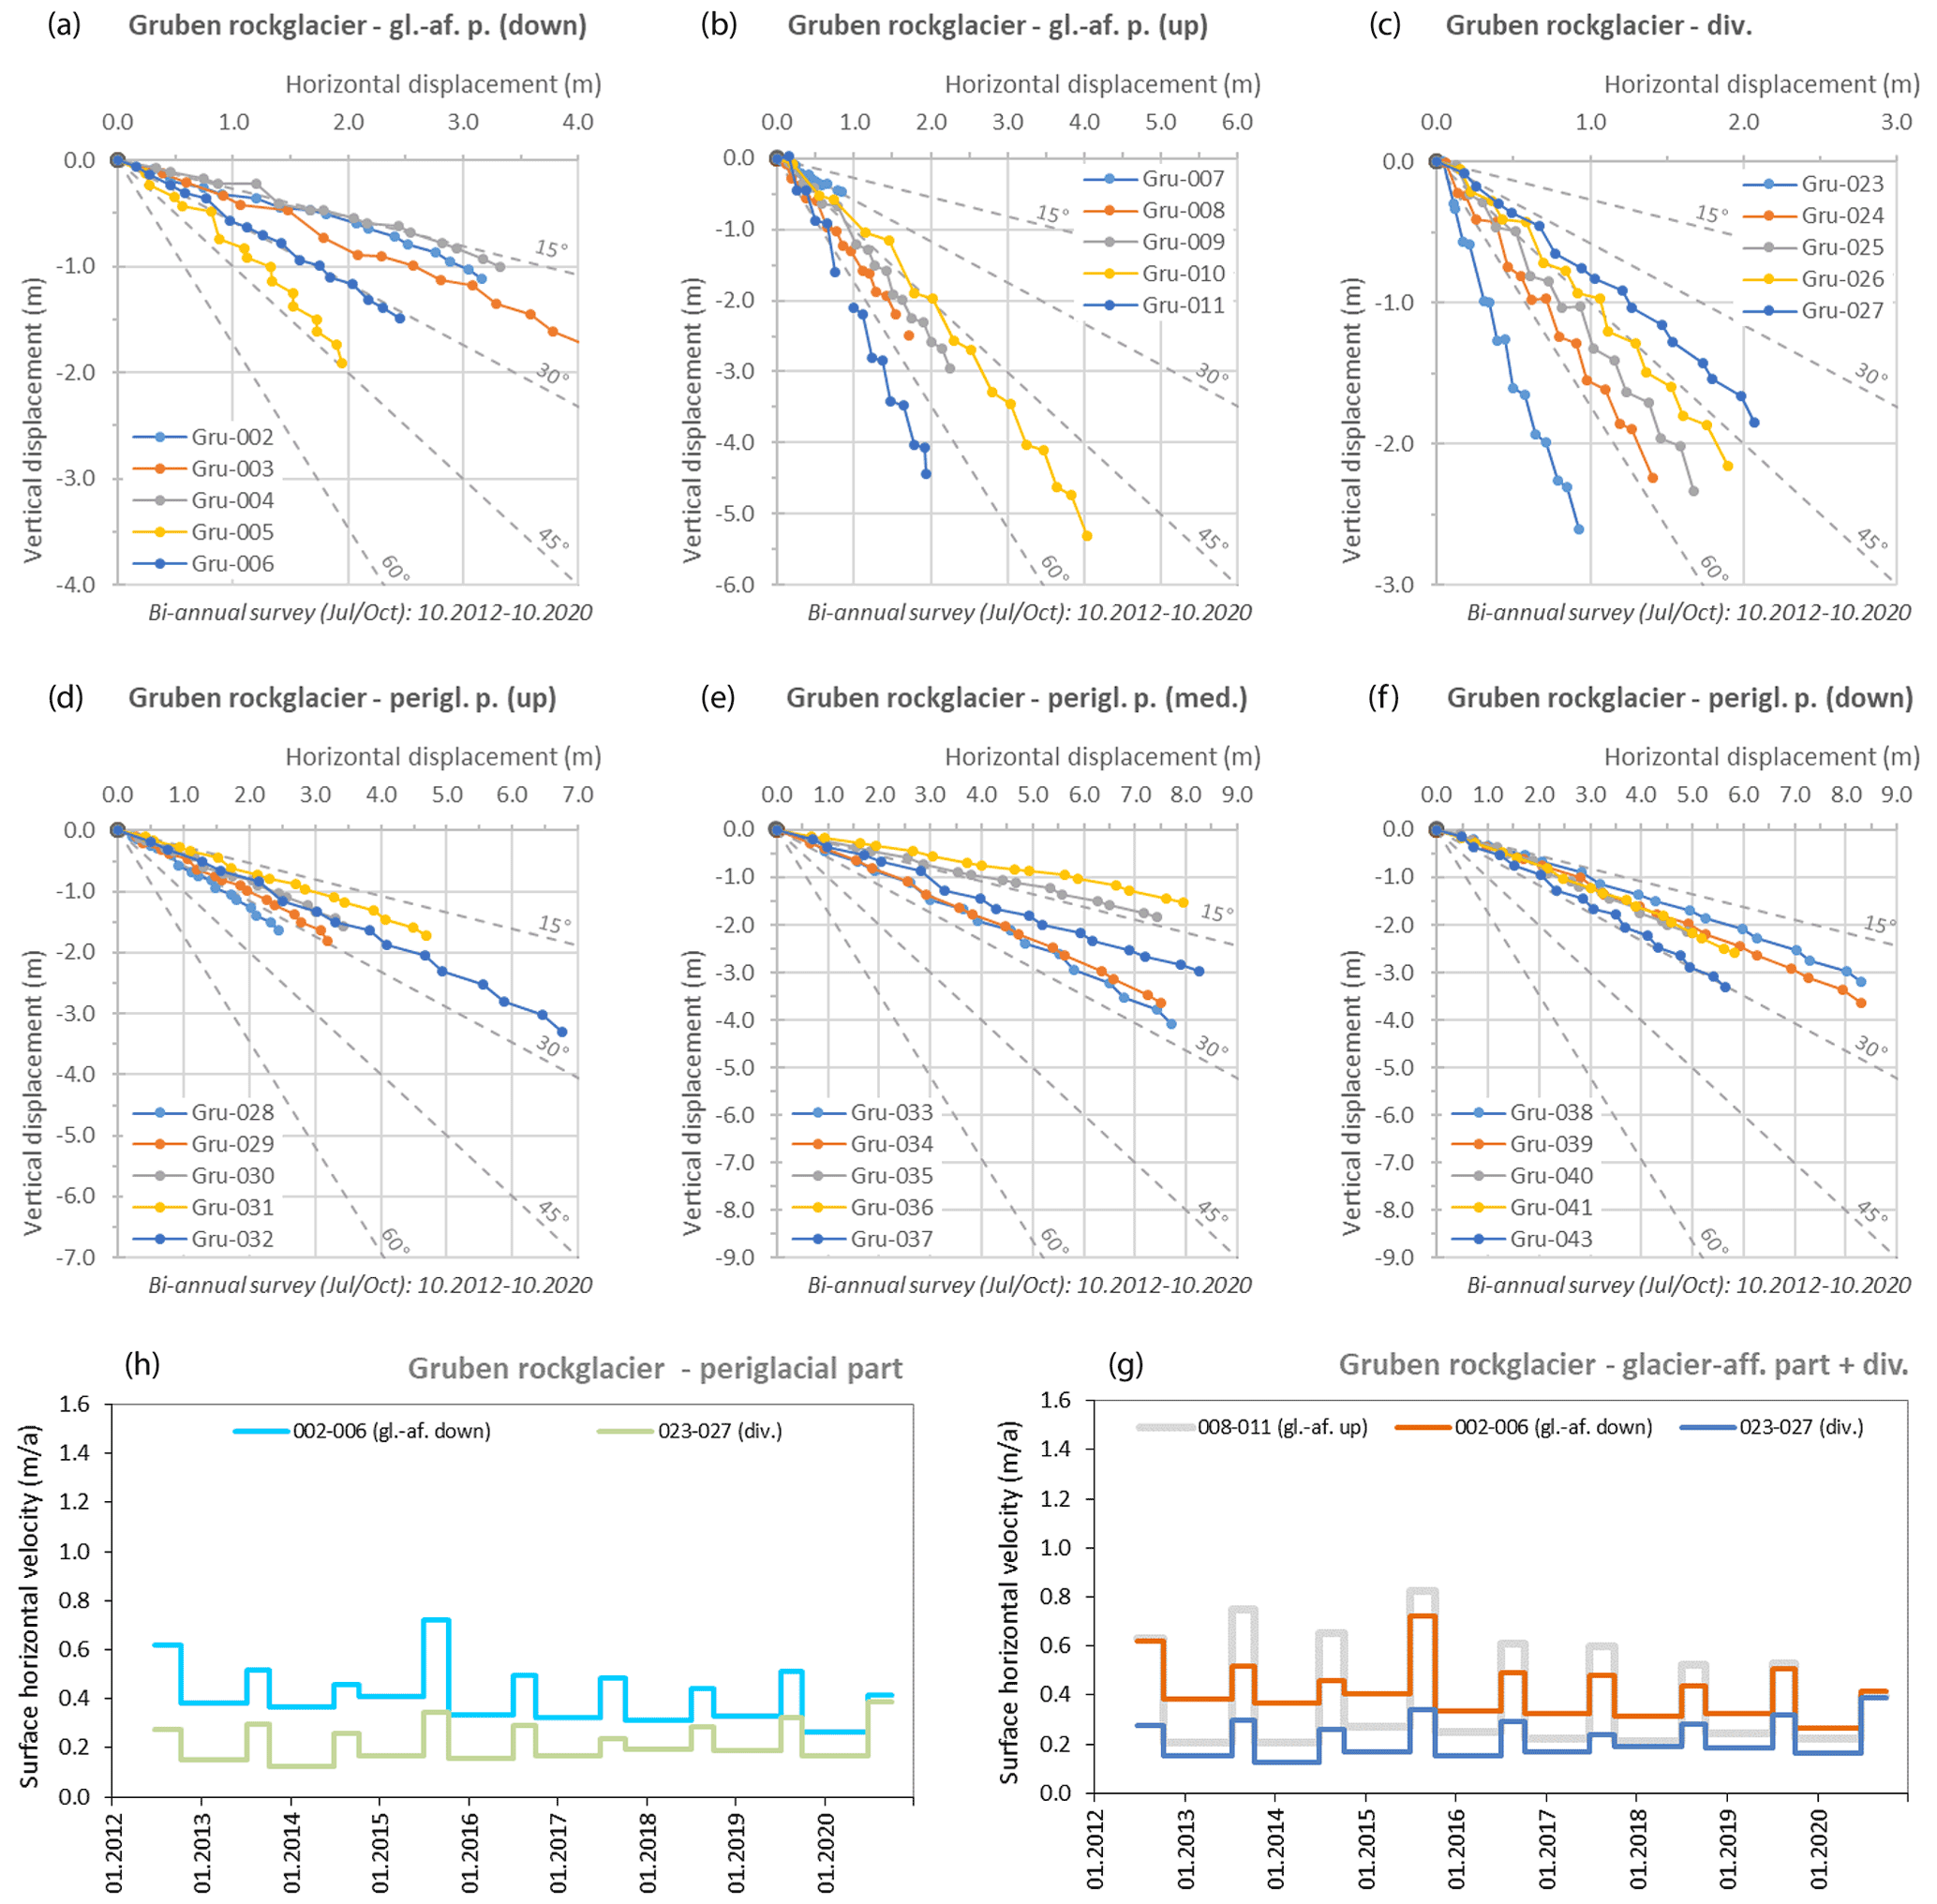
Figure 7GNSS-based kinematic behaviour in both glacier-affected (gl.-af.) and periglacial (perigl.) parts of the Gruben rock glacier as well as in their transition zone (div.). (a–f) Horizontal versus vertical displacement of selected items. (g–h) Seasonal horizontal velocities in specific sections. The numbers or identifiers refer to the GNSS-surveyed items; location in Fig. 6.
4.2 Gruben rock glacier – glacier-affected part
The former contact zone between the polythermal Gruben glacier and the periglacial permafrost of Gruben rock glacier is here called the glacier-affected part. The cold glacier margin most likely pushed the permafrost upslope during its extended Little Ice Age stages, while the changes in slope and stress fields induced by the retreating glacier margin more recently have caused permafrost to creep back into the direction of the topographic depression formerly filled with the glacier tongue. As detailed by Kääb et al. (1997), the horizontal velocities between 1970 and 1995 in this part of the glacier–rock glacier contact were significantly higher than in the periglacial part and reached up to several metres per year near the glacier-dammed lake 3. These high creep rates were accompanied by strong vertical changes resulting from melting of dead ice and the formation and growth of thermokarst lakes. In the former contact zone of the glacier, and the rock glacier (now the proglacial area), the retreat of the glacier caused a strong but decelerating surface lowering over the 25-year period (Kääb et al., 1997; see also Fig. 8).
In the following years (1994–2016), the mean horizontal velocities in the glacier-affected part of the rock glacier remained almost stable at about 0.2 m a−1 (see mean horizontal velocities in Fig. 8b). The flow is still directed towards the debris-free part of the glacier. The vertical changes show the highest mean value of −0.3 m a−1 between 1994 and 2000, followed by a decreasing trend of vertical losses reaching a mean value of −0.14 m a−1. The area of the thermokarst lake 5 (Fig. 1) indicates high vertical losses of up to 25 m between 1994–2016 at the southern lake outlet related to the artificial draining of the lake and the collapse of its former lake margins (Fig. 5). In addition, vertical changes related to the engineering works carried out in 1995 (road construction and trench digging) are clearly visible in the comparison of the 1994 and 2000 DTMs. Due to the former lake surface and the collapse of lake margins, accompanied by a loss in visual coherence, tracking of blocks and quantification of horizontal displacements could not be conducted in this part of the landform (especially between 1994 and 2000).
The GNSS measurements of the period 2012–2020 show that most of the area, except the transition zone toward the periglacial part, is still back-creeping at a mean rate which has tended to decrease from about 0.4 to 0.3 m a−1. The trajectories of the marked surface boulders are inclined 40 to more than 70∘ in the uppermost glacier-affected part (thermokarst lake area) and in the transition zone toward the periglacial part. The steepness of the trajectories is essentially caused by a strong ice-melt-induced subsidence in summertime combined to a low rate of horizontal movement. The subsidence is ranging from 0.25 to more than 0.5 m a−1, thus showing slightly higher values than the photogrammetric analysis. Trajectories in the downstream part of the back-creeping zone (points 002–004) are inclined 15–20∘ (Fig. 7), which is much closer to the topographic slope angle. Steeper trajectories in summertime cannot be evidenced, showing the absence of any significant ice loss at depth.
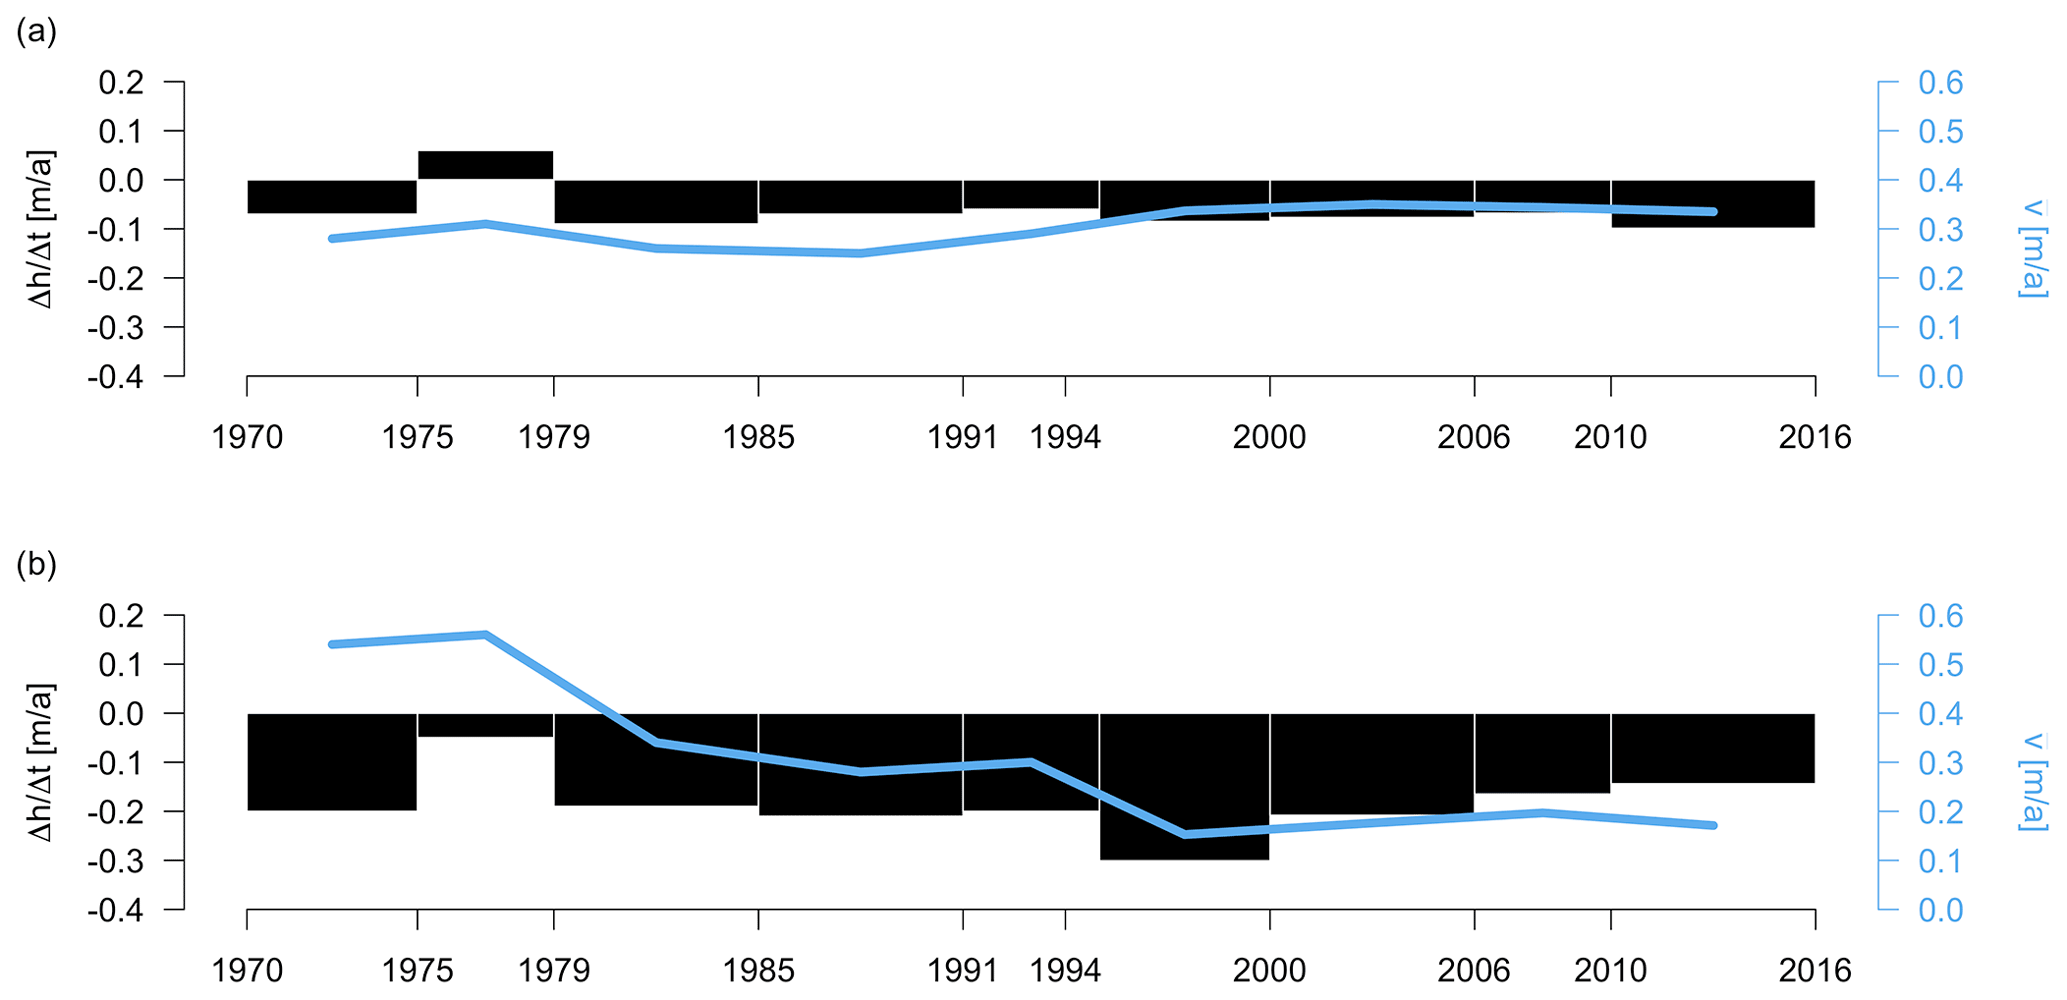
Figure 8Mean vertical changes (black columns) and horizontal velocities (blue line) of the periglacial part of the rock glacier (a) and the glacier-affected part of the rock glacier (b) from 1970 to 2016. The values of the period 1970 to 1995 result from Kääb et al. (1997).
4.3 Gruben glacier – debris-covered tongue
In prior studies, the research focussed on the debris-free tongue of Gruben glacier, on the rock glacier and on the development of lakes. Kääb (2001) compiled measurements on the debris-covered tongue on Gruben glacier. In the study presented here, detailed horizontal velocities were quantified not only for the rock glacier, but also for the entire debris-covered part of Gruben glacier in order to compare spatio-temporal patterns of the different landforms and to analyse the ongoing processes. As becomes apparent in Fig. 1, the debris-covered glacier tongue has the same orientation as the rock glacier as well as a similar altitudinal range but receives much more shadow from the Inner Rothorn. The surface roughness of both landforms is comparable, with a high percentage of large blocks (>1 m in diameter). In relation to the sediment input by rockfalls, the boulders appear to be less sorted on the debris-covered glaciers than on the rock glacier. The surface topography of the debris-covered glacier tongue shows somewhat subdued ridges perpendicular to the flow lines, which are probably related to a combination of compressing flow, thrusting, differential ablation, and down-wasting of the glacier, which consists here of cold ice and is likely frozen to the subglacial sediments. The surface structure strongly contrasts with the striking longitudinal structures of the rock glacier with its predominantly extending flow (Fig. 1; see also Kääb and Weber, 2004). In addition, the terminal part of the debris-covered glacier constitutes a diffuse transition to its foreland at lake 1 and does not exhibit the characteristic sorting of material as is the case for the striking oversteepened fronts produced by creeping masses of frozen talus and debris of actively advancing rock glaciers.
For the debris-covered tongue, a general decrease in velocity from 0.27 (1994–2000) to 0.17 m a−1 (2010–2016) is described by the median horizontal surface displacements (Brunner, 2020). In addition, the vector field depicts a division into two parts. The lower part shows surface velocities of 0.3 m a−1 decreasing towards zero at the lower ice margin, and vectors show a whirl-like orientation, indicating stagnation of flow. The upper part shows much higher but decelerating velocities and has a flow field essentially following the main slope. Vertical changes on the debris-covered tongue lie in the range of −0.1 to −0.8 m a−1 apart from the uppermost part, which is in close connection to the main body of the glacier, where mean surface lowering amounts to up to 17 m between 1994 and 2016 (about −0.77 m a−1) (Brunner, 2020). Here, at the glacier margin, lake 7 with a pronounced ice cliff heavily affected by thermokarst processes recently formed.
4.4 Gruben glacier – debris-free tongue
On the ice tongue of Gruben glacier, only a few horizontal velocities were quantified in this study due to unsuitable temporal resolution of the aerial images with respect to glacier flow. But glacier retreat of about 370 m (on average nearly 20 m a−1) is quantified for the measurement period 1994–2016. In addition, surface changes measured from DTM comparison indicate a lowering of up to 47 m at the glacier margin in this period (on average about 2 m a−1), much more than found for the 1970s–1990s (Kääb, 2001).
This quantification allows for a comparison with earlier studies measuring and modelling ice thickness and analysing the glacier bed, such as Haeberli and Fisch (1984), who applied a combination of thermal drilling and electrical resistivity soundings of subglacial material, documenting an ice thickness between 25 and 80 m along a 400 m profile over the glacier tongue. An about 150 m thick layer of unconsolidated sediments occurs in the glacier bed underneath the tongue (Haeberli and Fisch, 1984). Comparing the ice thickness of about 35–40 m as measured in 1979 at the former glacier tongue with the same area (now ice-free) and the ice loss of more than 40 m between 1994 and 2016 indicates a good coincidence.
5.1 Periglacial processes
The periglacial part of Gruben rock glacier shows a coherent flow field, a thickness remaining nearly constant in time, and a steadily advancing oversteepened front, pointing to continued creep of ice-rich permafrost with its pronounced thermal inertia (Kääb et al., 1997; Kääb, 2005). Consistent movement rates are derived from photogrammetry and GNSS data, which fit well with the data of a permanent GNSS, situated between the bedrock riegel and the rock glacier front (Beutel et al., 2021). With annual velocities of 0.5–1.0 m a−1 it lies within the range of typical rates for permafrost creep in rock glaciers of Switzerland (Delaloye et al., 2010). The advance rate of the front is significantly smaller than the surface velocities (3 m versus 17 m between 1970 and 1995; Kääb et al., 1997), which also resembles a typical pattern and links to a probable shallower shear horizon and/or melting processes at the front. The spatial pattern of its flow field essentially remained constant with only small temporal variations in the last 2 decades. Characteristic rates of surface lowering are in the range of centimetres to a few decimetres per year, remain relatively constant over time (Figs. 5 and 8), and are comparable to observations on other rock glaciers (Bodin et al., 2009; Fey and Krainer, 2020; Cusicanqui et al., 2021; Kääb et al., 2021). The annual in situ measurements allow for an interpretation and distinction of different processes causing vertical changes, such as extension and compression, melt-induced subsidence, or topographic influences (Arenson et al., 2002; Lambiel and Delaloye, 2004). The overall extending-flow regime of the rock glacier is generating a subsidence of a few centimetres along most of the GNSS longitudinal profile, reaching up to 20 cm a−1 above the bedrock riegel, whereas a compression heave of more than 20 cm a−1 should occur close to the front. This rate is proportional to spatial velocity contrasts and, because the flow field is constant over time and the velocity not dramatically changing over the seasons, it is not expected to vary much over the year. The in situ measurements, however, indicate higher rates of vertical motion during the summer months, e.g. in the hot summer of 2015 (Fig. 7), which seem to evidence thaw subsidence in large sections of the periglacial part of the rock glacier. Part of the vertical change must be related to the predominantly extending flow and related mass transfer. In reaction to increasing air and ground temperatures, pronounced flow acceleration and surface lowering or even flow destabilization (Roer et al., 2008) have been observed at a good number of rock glaciers in the Alps (Delaloye et al., 2010; PERMOS, 2020; Fey and Krainer, 2020; Cusicanqui et al., 2021; Kaufmann et al., 2021) and other mountain ranges (Darrow et al., 2016; Eriksen et al., 2018; Kääb et al., 2021). The most plausible reason is that progressive permafrost warming causes subsurface ice to become softer, to contain higher amounts of unfrozen water, and to increase the hydraulic permeability of the ice–rock mixtures (Kääb et al., 2007; Haeberli, 2013; Cicoira et al., 2019). The steady behaviour of Gruben rock glacier over the last 50 years is in contrast with such warming-induced acceleration of viscous creep in perennially frozen debris but resembles long-term developments in the Tien Shan (Kääb et al., 2021). There, marked acceleration is observed for large rock glaciers with the exception of a glacier-affected case (Gorodetsky), where glacier retreat and dead-ice melting may decouple landforms of viscous permafrost creep from debris supply and induce changes in the stress field (unloading). In the case of Gruben, the retreating orographic right part of the largely debris-free glacier never supplied much debris, as is clearly recognizable from Fig. 1 and from old maps publicly available at swisstopo (Swisstopo, 2022; see Fig. S6). Rather, the retreat of the glacier margin induced a south-orientated backflow of the upper rock glacier part towards the now-exposed topographic depression (overdeepening) of the former glacier bed, away from the generally south-western flow direction towards the rock glacier. Other possible influences remain highly speculative and require further investigation or modelling efforts. Thinning of the rock glacier, which can reach up to 3 m per decade in the transition area between the periglacial and glacier-affected parts, is gradually but clearly decreasing the stress at the shear horizon. High ice contents could, in principle, dampen the temperature penetration with depth due to latent heat exchange caused by thaw at depth and hence prevent the warming from reaching shear horizons at depth, where most of the deformation takes place (Kääb et al., 2007). In addition, a high ice content can influence the hydrological system and dampen the water flow and hydraulic and thermal connectivity within the rock glacier, thus making the landform insensitive to seasonal and interannual temperature forcing. The information from the geophysical soundings, however, provides no evidence of extraordinarily high ice contents or even large bodies of massive ice as have been documented from the rock glacier Murtèl (Hoelzle et al., 2002; PERMOS, 2020). The role of the bedrock riegel, which regulates and limits flow depth in the lower rock glacier part, is also difficult to judge. Ultimately, continued atmospheric temperature rise will unavoidably cause progressive permafrost degradation and thaw during the upcoming decades and centuries, accompanied by deceleration and inactivation of rock glaciers as the melting of excess subsurface ice will lead to a loss of cohesion and an increase in internal friction and ultimately slow down and stop movement through viscous flow. Intermittent flow acceleration could occur in a first stage. Continued thermal and kinematic monitoring at this well-documented site and the detailed analysis of high-resolution data from the permanent GNSS (Beutel et al., 2021) can shed more light on the short-term and long-term changes as well as on involved processes.
The periglacial part of the rock glacier shows a striking coincidence of modern flowlines and (longitudinal) structures from long-term cumulative deformation. In strong contrast to this, the former glacier-affected part exhibits a rather extreme divergence between modern flow directions and surface structures from long-term cumulative deformation (Figs. 1, 5, 6). Due to glacier vanishing and unloading with related topographic changes since the Little Ice Age, this part experienced a marked reorientation of the stress and flow fields. During the entire observation and probably much longer, the strikingly convex landform “rock glacier” underwent slow cumulative deformation and advance through viscous creep of the frozen talus material but essentially kept the same appearance. Characteristic features are perfectly preserved such as (i) an “organized” surface structure strikingly reflecting a coherent field of cohesive viscous creep with large-scale stress transmission, here primarily under a regime of longitudinal as well as transversal extension, and (ii) an oversteepened, unstable front of the continuously advancing frozen mass where fresh material from the inner parts of the rock glacier is continuously being exposed. In sharp contrast to this persistent landform evolution, clear signs of down-wasting and collapse characterize the debris-covered, cold part of the Gruben glacier tongue. When directly comparing orthoimages from the 1970s to those from 2016 one can easily track individual rocks or patterns of rocks over time in most areas of the periglacial rock glacier part, something that is more difficult on the glacier-affected part and on the debris-covered glacier tongue only possible over smaller disconnected areas.
5.2 Glacial and proglacial processes
The changes in the debris-free and the debris-covered part of Gruben glacier indicate typical processes in reaction to the changing climate with increasing temperatures (Zemp et al., 2015). The largely debris-free part of Gruben glacier has been thinning by tens of metres and retreating by hundreds of metres. In analogy to Alpine glaciers in general, characteristic thinning rates during the observation period (1970–2016) are several decimetres per year (see Haeberli et al., 2001; Sommer et al., 2020). During its maximum LIA advance, the glacier with its cold margins must have exerted compressive stresses to the upper part of the rock glacier. This may have pushed ice-rich frozen debris upslope, towards the talus at the foot of the Outer Rothorn crest. Flow trajectories in this former contact zone are presently in a near-opposite direction, i.e. from the talus towards the now-ice-free topographic depression (overdeepening) around lake 3. This is likely a consequence of the approximately 180∘ change in slope and corresponding stress reorientation induced by glacier retreat. Where the glacier disappeared, completely new landscapes started forming. The occurrence of fluted moraines in the northern part of the cirque serves as a testimony that the polythermal glaciers had been partially warm-based and largely debris-free. The debris-covered, cold orographic left part of the Gruben glacier shows similar developments to its debris-free part, but strongly lagged and partly hidden due to the protective cover of debris influencing near-surface heat exchange. Similar to the contact zone between the polythermal Gruben glacier and the permafrost of Gruben rock glacier it mainly shows intermediate thinning rates. The uppermost part of the debris-covered glacier tongue, which is still in contact with the active glacier, shows strong signs of down-wasting. Here, the velocities still indicate a coherent flow field with decelerating velocities over the observation period, while the lower part of the debris-covered tongue shows a marked decrease in velocity towards stagnation. This documents the retrogressive influence of the retreating and down-wasting glacier. Despite somewhat vague indications of compression in the debris cover (rather weakly pronounced transverse ridges), the surface structure remains predominantly chaotic, and the margins of the landform remain diffuse to such a degree that judging the exact position of the “ice margin” becomes hardly possible without the use of additional data, such as radar imagery (Fischer et al., 2014). Even under similar thermal conditions (negative annual surface temperatures), the difference between the rock glacier and the debris-covered glacier is striking.
For both parts of the glacier, the retreating and down-wasting ice is the driving process exposing and forming a new landscape. The proglacial area is typically dominated by gravitational and fluvial processes but is still conditioned by the former glaciation. This adjustment from glacial to non-glacial conditions is formulated by the paraglacial concept and describes a transition towards new equilibrium conditions (Ballantyne, 2002; Curry et al., 2006; Slaymaker, 2011). There is a scientific need to observe and quantify geomorphological changes and characteristic successions as well as long-term trends in order to better understand the evolution of proglacial systems during this transition phase (Carrivick and Heckmann, 2017). In our study we provide insights into glacial, periglacial, and paraglacial dynamics over a period of 50 years. One interesting feature of the glacial system is the delayed response of the debris-covered tongue to the atmospheric changes (several decades) and the related deceleration of ongoing geomorphological processes.
The ice in the former contact zone (“glacier-affected part”) between the polythermal Gruben glacier and the permafrost of Gruben rock glacier generally shows intermediate thinning rates. Locally, vertical changes are higher in relation to the artificial emptying of the thermokarst lake and the melting of glacier remains. Horizontal velocities show a marked decrease with time. These observations indicate the fading interaction between glacial and periglacial processes and the rapid stabilization of the ground, as typically found in proglacial systems (Carrivick and Heckmann, 2017). Assuming characteristic mean thicknesses of several tens of metres for both the glacier and the ice-rich frozen ground, the timescale for complete ice loss as derived from such quantitative rates of subsidence and mass loss is decades to centuries for the clean glacier, while it is at least an order of magnitude longer for the rock glacier ice. Subsurface ice in perennially frozen rock glaciers will continue to exist under conditions of continued warming when most surface ice in glaciers will already have disappeared (Haeberli et al., 2017). The creeping permafrost body is thereby most likely far out of thermal equilibrium already today and in its lower part could indeed now be approaching near-isothermal thawing temperatures at depth.
5.3 Future perspectives and related hazard aspects
Since the early 20th century, the complex evolution of glaciers and permafrost in the Gruben cirque has led to the development of an interconnected system of smaller but nevertheless hazardous lakes. Engineering mitigation work combined with thorough scientific investigations and monitoring enabled successful prevention of further damaging incidents after the outburst floods in 1968 and 1970. The situation should nevertheless be carefully kept under observation. In general terms, with the accelerated glacier shrinking and the related destabilization of adjacent slopes, catastrophic mass flows can be triggered (Huggel et al., 2005; Deline et al., 2021; Curry et al., 2006). One challenging aspect thereby concerns the obvious destabilization of the shady rock walls at the Inner Rothorn with strong effects from glacial de-buttressing and permafrost degradation. Activation of rockfalls has been evident during fieldwork for many years already, and future large-volume events cannot be safely excluded. Such events could in principle have the potential to suddenly and entirely displace waterbodies with the dimensions of the lakes at the site (Haeberli et al., 2017). The early transformation of lake 1 into a flood retention basin with a capacity of about 100 000 m3 of water has so far provided protection against floods in the valley, but this retention basin should ideally not be full of water in the case of a large rock avalanche potentially reaching it. Since both the glacial and the periglacial systems are highly dynamic, new lakes may form in future at the immediate foot of the destabilizing rock wall, e.g. between the debris covered part of the glacier and the active glacier tongue assuming an ongoing retreat of the glacier (see Frey et al., 2010). In comparison with such rapid developments, rock glaciers with their creeping frozen materials constitute persistent elements of cold mountain landscapes. Whether current and future warming accelerates or stops, or accelerates and then stops, rock glacier creep remains to be observed. Continued monitoring of lake developments, further down-wasting, and retreat of glacier ice and of permafrost creep in the rock glacier tongue is conducted by national (PERMOS 2022a; GLAMOS, 2022) and local authorities and will allow for assessments (see GAPHAZ, 2017) of future hazard situations, if applicable.
Long-term monitoring of glacial and periglacial processes, materials, and landforms at the Gruben site using modern geomatics methods opens unique insights into past and ongoing climate-related dynamics of complex ice-related system responses to rapid atmospheric temperature rise and corresponding landform evolution under moderately continental climatic conditions. The measurements document that over the past 50 years
-
the polythermal Gruben glacier retreated significantly as a rapid response to climate change and in accordance with Alpine glaciers in general;
-
the cold debris-covered tongue of Gruben glacier degraded gradually from the front backwards and is now containing ice that is far out of equilibrium with the current climate – a situation which is in accordance with other debris-covered glaciers;
-
the creeping perennially frozen talus of the Gruben rock glacier showed a steady behaviour with a coherent flow field and limited subsidence (as a result of the continued viscous flow it advanced at a rate which remained practically constant during the observation time of 5 decades);
-
the striking lack of an acceleration trend in the viscous creep of Gruben rock glacier due to permafrost warming and softening is not easily explained but may most likely be related to unloading (thinning is still ongoing) and reoriented surface inclination and stress fields as a consequence of glacier retreat since the LIA in its upper part;
-
the geomorphological changes affected the hazard potential at the Gruben site, necessitating human intervention and careful observation combined with regular assessments.
Our analysis of glacial and periglacial processes and landforms and their interactions provides a better understanding of landform dynamics, in particular the current responses of cryospheric landforms to climate forcing. It highlights the various response times in relation to material properties, physical conditions, and related process interactions. In addition, it underlines the importance of long-term, integrative monitoring of glacial and periglacial systems, for scientific as well as applied reasons.
GST and GNSS measurements are partly available on the PERMOS data portal (https://newshinypermos.geo.uzh.ch/app/DataBrowser/, PERMOS 2022b). All other data are available upon request.
The supplement related to this article is available online at: https://doi.org/10.5194/tc-16-2083-2022-supplement.
IGR, WH, and AK conceived the study. NB, IGR, and AK analysed the digital terrain models (DTMs) and orthophotos. RD added recent in situ data. WH contributed all his data and knowledge from earlier investigations. PT supported the processing of digital terrain models and orthophotos. IGR and WH wrote the paper, and NB, RD, and IGR produced the figures, with support and contributions from all other co-authors.
The contact author has declared that neither they nor their co-authors have any competing interests.
Publisher’s note: Copernicus Publications remains neutral with regard to jurisdictional claims in published maps and institutional affiliations.
The DTMs and orthoimages of the Gruben area are based on aerial photographs taken by the swisstopo flight service, provided within the Swiss Permafrost Monitoring Network (PERMOS). Special thanks are due to Andreas Bauder (VAW-ETHZ) and Hermann Bösch (VAW-ETHZ) for access to the aerial images. GST and GNSS measurements are undertaken with the support of PERMOS.
This paper was edited by Jürg Schweizer and reviewed by Lukas U. Arenson and two anonymous referees.
Amschwand, D., Ivy-Ochs, S., Frehner, M., Steinemann, O., Christl, M., and Vockenhuber, C.: Deciphering the evolution of the Bleis Marscha rock glacier (Val d'Err, eastern Switzerland) with cosmogenic nuclide exposure dating, aerial image correlation, and finite element modeling, The Cryosphere, 15, 2057–2081, https://doi.org/10.5194/tc-15-2057-2021, 2021.
Arenson, L., Hoelzle M., and Springman, S.: Borehole deformation measurements and internal structure of some rock glaciers in Switzerland, Permafrost Periglac., 13, 117–135, 2002.
Ayala, A., Pellicciotti, F., MacDonell, S., McPhee, J., Vivero, S., Campos, C., and Egli, P.: Modelling the hydrological response of debris-free and debris-covered glaciers to present climatic conditions in the semiarid high-elevation Andes, Hydrol. Process., 30, 4036–4058, https://doi.org/10.1002/hyp.10971, 2016.
Ballantyne, C. K.: Paraglacial geomorphology, Quaternary Sci. Rev., 21, 1935–2017, 2002.
Barboux, C., Strozzi, T., Delaloye, R., Wegmüller, U., and Collet, C.: Mapping slope movements in Alpine environments using TerraSAR-X interferometric methods, ISPRS J. Photogramm., 109, 178–192, 2015.
Barsch, D., Fierz, H., and Haeberli, W.: Shallow core drilling and borehole measurements in permafrost of an active rock glacier near the Grubengletscher, Wallis, Swiss Alps, Arctic Alpine Res., 11, 215–228, 1979.
Benn, D. I., Bolch, T., Hands, K., Gully, J., Luckmann, A., Nicholson, L. I., Quincy, D., Thompson, S., Toumi, R., and Wiseman, S.: Response of debris-covered glaciers in the Mount Everest region to recent warming, and implications for outburst flood hazards, Earth Sci. Rev., 14, 156–174, https://doi.org/10.1016/j.earscirev.2012.03.008, 2012.
Beutel, J., Biri, A., Buchli, B., Cicoira, A., Delaloye, R., Da Forno, R., Gaertner-Roer, I., Gruber, S., Gsell, T., Hasler, A., Lim, R., Limpach, P., Mayoraz, R., Meyer, M., Noetzli, J., Phillips, M., Pointner, E., Raetzo, H., Scapoza, C., Strozzi, T., Thiele, L., Vieli, A., Vonder Mühll, D., Weber, S., and Wirz, V.: Kinematic observations of the mountain cryosphere using in-situ GNSS instruments, Earth Syst. Sci. Data Discuss. [preprint], https://doi.org/10.5194/essd-2021-176, in review, 2021.
Bodin, X., Thibert, E., Fabre, D., Ribolini, A., Schoeneich, P., Francou, B., Reynaud, L., and Fort, M.: Two Decades of Responses (1986–2006) to Climate by the Laurichard Rock Glacier, French Alps, Permafrost Periglac., 20, 331–344, https://doi10.1002/ppp.665, 2009.
Boeckli, L., Brenning, A., Gruber, S., and Noetzli, J.: Permafrost distribution in the European Alps: calculation and evaluation of an index map and summary statistics, The Cryosphere, 6, 807–820, https://doi.org/10.5194/tc-6-807-2012, 2012.
Bolch, T., Rohrbach, N., Kutiusov, S., Robson, B. A., and Osmonov, A.: Occurrence, evolution and ice content of ice-debris complexes in the Ak-Shiirak, Central Tien Shan, revealed by geophysical and remotely-sensed investigations, Earth Surf. Proc. Land., 44, 129–143, https://doi.org/10.1002/esp.4487, 2019.
Bosson, J.-B., Deline, P., Bodin, X., Schoeneich, P., Baron, L., Gardent, M., and Lambiel, C.: The influence of ground ice distribution on geomorphic dynamics since the Little Ice Age in proglacial areas of two cirque glacier systems, Earth Surf. Proc. Land., 40, 666–680, 2014.
Brunner, N.: Gletscher-Blockgletscher Beziehung beim Grubengletscher, Fletschhorngebiet, Wallis, Masterthesis, University of Zurich, 78 pp., 2020.
Carrivick, J. L. and Heckmann, T.: Short-term geomorphological evolution of proglacial systems, Geomorphology, 287, 3–28, 2017.
Cicoira, A., Beutel, J., Faillettaz, J., and Vieli, A.: Water controls the seasonal rhythm of rock glacier flow, Earth Planet. Sc. Lett., 528, 115844, https://doi.org/10.1016/j.epsl.2019.115844, 2019.
Cicoira, A., Marcer, M., Gärtner-Roer, I., Bodin, X., Arenson, L. U., and Vieli, A.: A general theory of rock glacier creep based on in situ and remote sensing observations, Permafrost Periglac., 32, 139–153, 2021.
Curry, A., Cleasby, V., and Zukowskyj, P.: Paraglacial response to steep, sediment-mantled slopes to post-“Little Ice Age” glacier recession in the central Swiss Alps, J. Quaternary Sci., 21, 211–225, 2006.
Cusicanqui, D., Rabatel, A., Vincent, C., Bodin, X., Thibert, E., and Francou, B.: Interpretation of volume and flux changes of the Laurichard rock glacier between 1952 and 2019, French Alps, J. Geophys. Res.-Earth, 126, e2021JF006161, https://doi.org/10.1029/2021JF006161, 2021.
Darrow, M. M., Gyswyt, N. L., Simpson, J. M., Daanen, R. P., and Hubbard, T. D.: Frozen debris lobe morphology and movement: an overview of eight dynamic features, southern Brooks Range, Alaska, The Cryosphere, 10, 977–993, https://doi.org/10.5194/tc-10-977-2016, 2016.
Delaloye, R., Lambiel, C., and Gärtner-Roer, I.: Overview of rock glacier kinematics research in the Swiss Alps, Geogr. Helv., 65, 135–145, https://doi.org/10.5194/gh-65-135-2010, 2010.
Deline, P., Gruber, S., Amann, F., Bodin, X., Delaloye, R., Faillettaz, J., Fischer, L., Geertsema, M., Giardino, M., Hasler, A., Kirkbride, M., Krautblatter, M., Magnin, F., McColl, S., Ravanel, L., Schoeneich, P., and Weber, S.: Ice loss from glaciers and permafrost and related slope instability in high-mountain regions, in: Snow and Ice-Related Hazards, Risks, and Disasters, edited by: Haeberli, W. and Whiteman, C., Elsevier, pp. 501–540, ISBN 978-0-12-394849-6, 2021.
Eriksen, H. Ø., Rouyet, L., Laukness, T. R., Berthling, I., Isaksen, K., Hindberg, H., Larsen, Y., and Corner D. G.: Recent Acceleration of a Rock Glacier Complex, Ádjet, Norway, Documented by 62 Years of Remote Sensing Observations, Geophys. Res. Lett., 45, 8314–8323, https://doi.org/10.1029/2018GL077605, 2018.
Falatkova, K., Šobr, M., Neureiter, A., Schöner, W., Janský, B., Häusler, H., Engel, Z., and Beneš, V.: Development of proglacial lakes and evaluation of related outburst susceptibility at the Adygine ice-debris complex, northern Tien Shan, Earth Surf. Dynam., 7, 301–320, https://doi.org/10.5194/esurf-7-301-2019, 2019.
Federal Office for the Environment (FOEN): Map of potential permafrost distribution, https://www.bafu.admin.ch/bafu/de/home/themen/naturgefahren/fachinformationen/naturgefahrensituation-und-raumnutzung/gefahrengrundlagen/hinweiskarte-der-permafrostverbreitung-in-der-schweiz.html (last access: 22 May 2022), 2005.
Fey, C. and Krainer, K.: Analyses of UAV and GNSS based flow velocity variations of the rock glacier Lazaun (Ötztal Alps, South Tyrol, Italy), Geomorphology, 365, 107261, https://doi.org/10.1016/j.geomorph.2020.107261, 2020.
Fischer, M., Huss, M., Barboux, C., and Hoelzle, M.: The new Swiss Glacier Inventory SGI2010: Relevance of using high-resolution source data in areas dominated by very small glaciers, Arct. Antarct. Alp. Res., 46, 933–945, 2014.
Fleischer, F., Haas, F., Piermattei, L., Pfeiffer, M., Heckmann, T., Altmann, M., Rom, J., Stark, M., Wimmer, M. H., Pfeifer, N., and Becht, M.: Multi-decadal (1953–2017) rock glacier kinematics analysed by high-resolution topographic data in the upper Kaunertal, Austria, The Cryosphere, 15, 5345–5369, https://doi.org/10.5194/tc-15-5345-2021, 2021.
Florentine, C., Skidmore, M., Speece, M., Link, C., and Shaw, C. A.: Geophysical analysis of transverse ridges and internal structure at Lone Peak Rock Glacier, Big Sky, Montana, USA, J. Glaciol., 60, 453–462, https://doi.org/10.3189/2014JoG13J160, 2014.
Frauenfelder, R.: Rock Glaciers, Fletschhorn Area, Valais, Switzerland. Techniques for detecting and quantifying mountain permafrost creep, International Permafrost Association, Data and Information Working Group, NSIDC, University of Colorado at Boulder, Colorado, CD-ROM, 1998.
Frey, H., Haeberli, W., Linsbauer, A., Huggel, C., and Paul, F.: A multi-level strategy for anticipating future glacier lake formation and associated hazard potentials, Nat. Hazards Earth Syst. Sci., 10, 339–352, https://doi.org/10.5194/nhess-10-339-2010, 2010.
Fuchs, M. C., Böhlert, R., Krbetschek, M., Preusser, F., and Egli, M.: Exploring the potential of luminescence methods for dating Alpine rock glaciers, Quat. Geochronol., 18, 17–33, https://doi.org/10.1016/j.quageo.2013.07.001, 2013.
Glacier and Permafrost Hazards in Mountains (GAPHAZ): Assessment of Glacier and Permafrost Hazards in Mountain Regions, Technical Guidance Document, prepared by: Allen, S., Frey, H., Huggel, C., Bründl, M., Chiarle, M., Clague, J. J., Cochachin, A., Cook, S., Deline, P., Geertsema, M., Giardino, M., Haeberli, W., Kääb, A., Kargel, J., Klimes, J., Krautblatter, M., McArdell, B., Mergili, M., Petrakov, D., Portocarrero, C., Reynolds, J., and Schneider, D., Standing Group on Glacier and Permafrost Hazards in Mountains (GAPHAZ) of the International Association of Cryospheric Sciences (IACS) and the International Permafrost Association (IPA), Zurich, Switzerland/Lima, Peru, 72 pp., 2017.
GLAMOS: Homepage, Glacier Monitoring Switzerland, http://www.glamos.ch/, last access: 22 May 2022.
Gruber, S.: Derivation and analysis of a high-resolution estimate of global permafrost zonation, The Cryosphere, 6, 221–233, https://doi.org/10.5194/tc-6-221-2012, 2012.
Haeberli, W.: Die Basis-Temperatur der winterlichen Schneedecke als möglicher Indikator für die Verbreitung von Permafrost in den Alpen, Zeitschrift für Gletscherkunde und Glazialgeologie, IX/1–2, 221–227, 1973.
Haeberli, W.: Eistemperaturen in den Alpen, Zeitschrift für Gletscherkunde und Glazialgeologie, XI/2, 203–220, 1976.
Haeberli, W.: Holocene push-moraines in Alpine permafrost, Geogr. Ann., 61A/1-2, 43–48, 1979.
Haeberli, W.: Creep of mountain permafrost, Mitt. VAW ETHZ, 77, 119 pp., 1985.
Haeberli, W.: Investigating glacier-permafrost relationships in high-mountain areas: historical background, selected examples and research needs, in: Cryospheric Systems: Glaciers and Permafrost, edited by: Harris, C. and Murton, J. B., The Geological Society of London, Special Publication, 242, 29–37, 2005.
Haeberli, W.: Mountain permafrost – research frontiers and a special long-term challenge, Cold Reg. Sci. Technol., 96, 71–76, https://doi.org/10.1016/j.coldregions.2013.02.004, 2013.
Haeberli, W.: Community Comment 1, https://doi.org/10.5194/tc-2021-88-CC1, 2021.
Haeberli, W. and Fisch, W.: Electrical resistivity soundings of glacier beds: a test study on Grubengletscher, Wallis, Swiss Alps, J. Glaciol., 30, 373–376, 1984.
Haeberli, W. and Röthlisberger, H.: Beobachtungen zum Mechanismus und zu den Auswirkungen von Kalbungen am Grubengletscher (Saastal, Schweiz), Zeitschrift für Gletscherkunde und Glazialgeologie, XI/2, 221–228, 1976.
Haeberli, W., King, L., and Flotron, A.: Surface movement and lichen-cover studies at the active rock glacier near the Grubengletscher, Wallis, Swiss Alps, Arctic Alpine Res., 11, 421–441, 1979.
Haeberli, W., Evin, M., Tenthorey, G., Keusen, H. R., Hoelzle, M., Keller, F., Vonder Mühll, D., Wagner, S., Pelfini, M., and Smiraglia, C.: Permafrost research sites in the Alps: excursion of the international workshop on permafrost and periglacial environments in mountain areas, Field Report, Permafrost Periglac., 3, 189–202, 1992.
Haeberli, W., Hoelzle, M. Kääb, A., Keller, F., Vonder Mühll, D., and Wagner, S.: Ten years after drilling through the permafrost of the active rock glacier Murtèl, eastern Swiss Alps: answered questions and new perspectives, in: Proceedings of the Seventh International Conference on Permafrost, Yellowknife, Canada, 23–27 June 1998, Collection Nordicana, 57, 403–410, 1998.
Haeberli, W., Kääb, A., Vonder Mühll, D., and Teysseire, P.: Prevention of debris flows from outbursts of periglacial lakes at Gruben, Valais, Swiss Alps, J. Glaciol., 47, 111–122, 2001.
Haeberli, W., Brandovà, D., Burga, C., Egli, M., Frauenfelder, R., Kääb, A., and Maisch, M.: Methods for absolute and relative age dating of rock-glacier surfaces in alpine permafrost, in: Proceedings of the 8th International Conference on Permafrost 2003, 21–25 July 2003, edited by: Phillips, M., Springman, S., and Arenson, L., Zurich, Swets & Zeitlinger, Lisse, 343–348, 2003.
Haeberli, W., Hallet, B., Arenson, L., Elconin, R., Humlum, O., Kääb, A., Kaufmann, V., Ladanyi, B., Matsuoka, N., Springman, S., and Vonder Mühll, D.: Permafrost creep and rock glacier dynamics. Permafrost Periglac., 17, 189–214, 2006.
Haeberli, W., Schaub, Y., and Huggel, C.: Increasing risks related to landslides from degrading permafrost into new lakes in de-glaciating mountain ranges, Geomorphology, 293, 405–417, https://doi.org/10.1016/j.geomorph.2016.02.009, 2017.
Hanson, S. and Hoelzle, M.: The thermal regime of the active layer at the Murtèl rock glacier based on data from 2002, Permafrost Periglac., 15, 273–282, https://doi.org/10.1002/ppp.499, 2004.
Heid, T. and Kääb, A.: Evaluation of existing image matching methods for deriving glacier surface displacements globally from optical satellite imagery, Remote Sens. Environ., 118, 339–355, 2012.
Herreid, S. and Pellicciotti, F.: The state of rock debris covering Earth's glaciers, Nat. Geosci., 13, 621–627, https://doi.org/10.1038/s41561-020-0615-0, 2020.
Hoelzle, M., Vonder Mühll, D., and Haeberli, W.: Thirty years of permafrost research in the Corvatsch Furtschellas area, Eastern Swiss Alps: A review, Norsk Geogr. Tidsskr., 56, 137–145, https://doi.org/10.1080/002919502760056468, 2002.
Huggel, C., Zgraggen-Oswald, S., Haeberli, W., Kääb, A., Polkvoj, A., Galushkin, I., and Evans, S. G.: The 2002 rock/ice avalanche at Kolka/Karmadon, Russian Caucasus: assessment of extraordinary avalanche formation and mobility, and application of QuickBird satellite imagery, Nat. Hazards Earth Syst. Sci., 5, 173–187, https://doi.org/10.5194/nhess-5-173-2005, 2005.
Ilyashuk, E. A., Heiri, O., Ilyashuk, B. P., Koinig, K. A., and Psenner, R.: The Little Ice Age signature in a 700-year high-resolution chironomid record of summer temperatures in the Central Eastern Alps, Clim. Dynam., 52, 6953–6967, https://doi.org/10.1007/s00382-018-4555-y, 2019.
IPCC: Summary for Policymakers, in: IPCC Special Report on the Ocean and Cryosphere in a Changing Climate, edited by: Pörtner, H.-O., Roberts, D. C., Masson-Delmotte, V., Zhai, P., Tignor, M., Poloczanska, E., Mintenbeck, K., Alegría, A., Nicolai, M., Okem, A., Petzold, J., Rama, B., Weyer, N. M., in press, 2019.
Janke, J. R., Bellisario, A. C., and Ferrando, F. A.: Classification of debris-covered glaciers and rock glaciers in the Andes of central Chile, Geomorphology, 241, 98–121, https://doi.org/10.1016/j.geomorph.2015.03.034, 2015.
Kääb, A.: Photogrammetric reconstruction of glacier mass-balance using a kinematic ice-flow model. A 20-year time-series on Grubengletscher, Swiss Alps, Ann. Glaciol., 31, 45–52, 2001.
Kääb, A.: Remote sensing of mountain glaciers and permafrost creep, Schriftenreihe Physische Geographie, 48, 266 pp., ISBN 3855432449, 2005.
Kääb, A. and Haeberli, W.: Evolution of a high mountain thermokarst lake in the Swiss Alps, Arct. Antarct. Alp. Res., 33, 385–390, 2001.
Kääb, A. and Reichmuth, T.: Advance mechanisms of rock glaciers, Permafrost Periglac., 16, 187–193, 2005.
Kääb, A. and Vollmer, M.: Surface geometry, thickness changes and flow fields on permafrost streams: automatic extraction by digital image analysis, Permafrost Periglac., 11, 315–326, 2000.
Kääb, A. and Weber, M.: Development of transverse ridges on rock glaciers: field measurements and laboratory experiments, Permafrost Periglac., 15, 379–391, 2004.
Kääb, A., Haeberli, W., and Gudmundsson, G. H.: Analysing the creep of mountain permafrost using high precision aerial photogrammetry: 25 years of monitoring Gruben rock glacier, Swiss Alps, Permafrost Periglac., 8, 409–426, 1997.
Kääb, A., Huggel, C., Fischer, L., Guex, S., Paul, F., Roer, I., Salzmann, N., Schlaefli, S., Schmutz, K., Schneider, D., Strozzi, T., and Weidmann, Y.: Remote sensing of glacier- and permafrost-related hazards in high mountains: an overview, Nat. Hazards Earth Syst. Sci., 5, 527–554, https://doi.org/10.5194/nhess-5-527-2005, 2005.
Kääb, A., Frauenfelder, R., and Roer, I.: On the response of rockglacier creep to surface temperature increase, Global Planet. Change, 56, 172–187, 2007.
Kääb, A., Strozzi, T., Bolch, T., Caduff, R., Trefall, H., Stoffel, M., and Kokarev, A.: Inventory and changes of rock glacier creep speeds in Ile Alatau and Kungöy Ala-Too, northern Tien Shan, since the 1950s, The Cryosphere, 15, 927–949, https://doi.org/10.5194/tc-15-927-2021, 2021.
Kaufmann, V., Kellerer-Pirklbauer, A., and Seier, G.: Conventional and UAV-Based Aerial Surveys for Long-Term Monitoring (1954–2020) of a Highly Active Rock Glacier in Austria, Frontiers in Remote Sensing, 2, 732744, https://doi.org/10.3389/frsen.2021.732744, 2021.
Kenner, R., Noetzli, J., Hoelzle, M., Raetzo, H., and Phillips, M.: Distinguishing ice-rich and ice-poor permafrost to map ground temperatures and ground ice occurrence in the Swiss Alps, The Cryosphere, 13, 1925–1941, https://doi.org/10.5194/tc-13-1925-2019, 2019.
King, L., Fisch, W., Haeberli, W., and Waechter, H. P.: Comparison of resistivity and radio-echo soundings on rock-glacier permafrost, Zeitschrift für Gletscherkunde und Glazialgeologie, 23, 77–97, 1987.
Kneisel, C. and Kääb, A.: Mountain permafrost dynamics within a recently exposed glacier forefield inferred by a combined geomorphological, geophysical and photogrammetrical approach, Earth Surf. Proc. Land., 32, 1797–1810, https://doi.org/10.1002/esp.1488, 2007.
Krainer, K., Bressan, D., Dietre, B. Haas, J. N., Hajdas, I., Lang, K., Mair, V., Nickus, U., Reidl, D., Thies, H., and Tonidandel, D.: A 10,300-year-old permafrost core from the active rock glacier Lazaun, southern Ötztal Alps (South Tyrol, northern Italy), Quaternary Res., 83, 324–335, https://doi.org/10.1016/j.yqres.2014.12.005, 2014.
Kulessa, B.: Hydraulic forcing of subglacial sediment properties and impact on glacier dynamics – Final Report, NERC Geophysical Equipment Facility, https://gef.nerc.ac.uk/documents/report/846.pdf (last access: 22 May 2022), 2009.
Kunz, J. and Kneisel, C.: Glacier–permafrost interaction at a thrust moraine complex in the glacier forefield Muragl, Swiss Alps, Geosciences, 10, 205, https://doi.org/10.3390/geosciences10060205, 2020.
Kunz, J., Ullmann, T., and Kneisel, C.: Internal structure and recent dynamics of a moraine complex in an alpine glacier forefield revealed by geophysical surveying and Sentinel-1 InSAR time series, Geomorphology, 398, 108052, https://doi.org/10.1016/j.geomorph.2021.108052, 2021.
Labhart, T. P.: Geologie der Schweiz, Ott Verlag, Thun, ISBN 3-7225-6760-2, 1998.
Lambiel, C. and Delaloye, R.: Contribution of real-time kinematic GPS in the study of creeping mountain permafrost: examples from the Western Swiss Alps, Permafrost Periglac., 15, 229–241, https://doi.org/10.1002/ppp.496, 2004.
Lewkovicz, A. and Ednie, M.: Probability mapping of mountain permafrost using the BTS method, Wolf Creek, Yukon Territory, Canada, Permafrost Periglac., 15, 67–80, https://doi.org/10.1002/ppp.480, 2004.
Merz, K., Green, A. G., Buchli, T., Springman, S. M., and Maurer, H.: A new 3-D thin-skinned rock glacier model based on helicopter GPR results from the Swiss Alps, Geophys. Res. Lett., 42, 4464–4472, https://doi.org/10.1002/2015GL063951, 2015.
Merz, K., Maurer, H., Rabenstein, L., Buchli, T., Springman, S. M., and Zweifel, M.: Multidisciplinary geophysical investigations over an alpine rock glacier, Geophysics, 81, WA147–WA157, https://doi.org/10.1190/GEO2015-0157.1, 2016.
Mölg, N., Ferguson, J., Bolch, T., and Vieli, A.: On the influence of debris cover on glacier morphology: How high-relief structures evolve from smooth surfaces, Geomorphology, 357, 107092, https://doi.org/10.1016/j.geomorph.2020.107092, 2020.
Monnier, S., Kinnard, C., Surazakov, A., and Bossy, W.: Geomorphology, internal structure, and successive development of a glacier foreland in the semiarid Chilean Andes (Cerro Tapado, upper Elqui Valley, 30∘08′ S., 69∘55′ W.), Geomorphology, 207, 126–140, https://doi.org/10.1016/j.geomorph.2013.10.031, 2014.
Mountain Research Initiative (MRI): Elevation-dependent warming in mountain regions of the world. Mountain Research Initiative EDW Working Group, Nat. Clim. Change, 5, 424–430, https://doi.org/10.1038/NCLIMATE2563, 2015.
Nakawo, M., Raymond, F. C., and Fountain, A.: Debris-covered glaciers, IAHS No. 264, IAHS Press, 288 pp., ISBN 1-901502-31-7, 2000.
Nesje, A., Matthews, J. A., Linge, H., Bredal, M., Wilson, P., and Winkler, S.: New evidence for active talus-foot rock glaciers at Øyberget, southern Norway, and their development during the Holocene, Holocene, 31, 1786–1796, https://doi.org/10.1177/09596836211033226, 2021.
Nuth, C. and Kääb, A.: Co-registration and bias corrections of satellite elevation data sets for quantifying glacier thickness change, The Cryosphere, 5, 271–290, https://doi.org/10.5194/tc-5-271-2011, 2011.
Obu, J., Westermann, S. Bartsch, A., Berdnikov, N., Christiansen, H. H., Dashtseren, A., Delaloye, R., Elberling, B., Etzelmüller, B., Kholodov, A., Khomutov, A., Kääb, A., Leibman, M., Lewkowicz, A. G., Panda, S. K., Romanovsky, V., Way, R. G., Westergaard-Nielsen, A., Wu, T., Yamkhin, J., and Zou, D.: Northern Hemisphere permafrost map based on TTOP modelling for 2000–2016 at 1 km2 scale, Earth Sci. Rev., 193, 299–316, https://doi.org/10.1016/j.earscirev.2019.04.023, 2019.
PERMOS: Swiss Permafrost Bulletin 2018/2019, edited by: Pellet, C. and Noetzli, J., 20 p., Swiss Permafrost Monitoring Network, https://doi.org/10.13093/permos-bull-2020, 2020.
PERMOS: PERMOS Homepage, Swiss Permafrost Monitoring Network, Fribourg and Davos, Switzerland, http://www.permos.ch/, last access: 22 May 2022a.
PERMOS: PERMOS Database, Swiss Permafrost Monitoring Network, Fribourg and Davos, Switzerland [data set], https://newshinypermos.geo.uzh.ch/app/DataBrowser/, last access: 22 May 2022b.
Ragettli, S., Pellicciotti, F., Immerzeel, W., Miles, E., Petersen, L., Heynen, M., Shea, J., Stumm, D., Joshi, S., and Shrestha, A.: Unraveling the hydrology of a Himalayan watershed through systematic integration of high resolution in-situ ground data and remote sensing with an advanced simulation model, Adv. Water Resour., 78, 94–111, https://doi.org/10.1016/j.advwatres.2015.01.013, 2015.
Reid, T. and Brock, B.: An energy-balance model for debris-covered glaciers including heat conduction through the debris layer, J. Glaciol., 56, 903–916, https://doi.org/10.3189/002214310794457218, 2010.
Reynard, E., Delaloye, R., Baron, L., Chapellier, D., Devaud, G., Lambiel, C., Marescot, L., and Monnet, R.: Glacier/permafrost relationships in recently deglaciated forefields of small alpine glaciers, Penninic Alps, Valais, Western Switzerland, in: Proceedings of the 8th International Conference on Permafrost, Zurich, 21–25 July 2003, vol. 1, 947–952, 2003.
Robson, B. A., MacDonell, S., Ayala, Á., Bolch, T., Nielsen, P. R., and Vivero, S.: Glacier and rock glacier changes since the 1950s in the La Laguna catchment, Chile, The Cryosphere, 16, 647–665, https://doi.org/10.5194/tc-16-647-2022, 2022.
Rock Glacier Inventories and Kinematics (RGIK): Towards standard guidelines for inventorying rock glaciers: baseline concepts (v. 4.0), IPA Action Group rock glacier inventories and kinematics, 2020.
Roer, I.: Rockglacier kinematics in a high mountain geosystem, Bonner Geographische Abhandlungen, 117, 217 pp., ISBN 978-3-537-87667-6, 2007.
Roer, I., Kääb, A., and Dikau, R.: Rockglacier kinematics derived from small-scale aerial photography and digital airborne pushbroom imagery, Z. Geomorphol., 49, 73–87, 2005a.
Roer, I., Kääb, A., and Dikau, R.: Rockglacier acceleration in the Turtmann valley (Swiss Alps): Probable controls, Norsk Geogr. Tidsskr., 59, 157–163, 2005b.
Roer, I., Haeberli, W., Avian, M., Kaufmann, V., Delaloye, R., Lambiel, C., and Kääb, A.: Observations and considerations on destabilizing active rock glaciers in the European Alps in: Proceedings of the Ninth International Conference on Permafrost, edited by: Kane, D. L. and Hinkel, K. M., Fairbanks, 28 June–3 July 2008, 1505–1510, https://www.permafrost.org/wp-content/uploads/ConferenceMaterials/9th-International-Conference-on-Permafrost-Vol-2.pdf (last access: 22 May 2022), 2008.
Röthlisberger, H.: Glaziologische Arbeiten im Zusammenhang mit den Seeausbrüchen am Grubengletscher, Gemeinde Saas Balen, Wallis, Mitt. VAW ETHZ, 44, 233–256, 1979.
Schneider, S., Daengeli, S., Hauck, C., and Hoelzle, M.: A spatial and temporal analysis of different periglacial materials by using geoelectrical, seismic and borehole temperature data at Murtèl–Corvatsch, Upper Engadin, Swiss Alps, Geogr. Helv., 68, 265–280, https://doi.org/10.5194/gh-68-265-2013, 2013.
Slaymaker, O.: Criteria to distinguish between periglacial, proglacial and paraglacial environments, Quaestiones Geographicae, 30, 85–94, 2011.
Sommer, C., Malz, P., Seehaus, T. C., Lippl, S., Zemp, M., and Braun, M. H.: Rapid glacier retreat and downwasting throughout the European Alps in the early 21st century, Nat. Commun., 11, 3209, https://doi.org/10.1038/s41467-020-16818-0, 2020.
Strozzi, T., Caduff, R., Jones, N., Barboux, C., Delaloye, R., Bodin X., Kääb, A., Mätzler, E., and Schrott, L.: Monitoring Rock Glacier Kinematics with Satellite Synthetic Aperture Radar, Remote Sensing, 12, 559, https://doi.org/10.3390/rs12030559, 2020.
Swisstopo: A journey through time – Maps, https://www.swisstopo.admin.ch/en/maps-data-online/maps-geodata-online/journey-through-time.html, last access: 22 May 2022.
United Nations Environment Programme (UNEP): Global outlook for ice and snow, UNEP/GRID-Arendal, Norway, 235, 2007.
Vivero, S., Bodin, X., Farías-Barahona, D., MacDonell, S., Schaffer, N., Robson, B. A., and Lambiel, C.: Combination of Aerial, Satellite, and UAV Photogrammetry for Quantifying Rock Glacier Kinematics in the Dry Andes of Chile (30∘ S) Since the 1950s, Frontiers in Remote Sensing, 2, 784015, https://doi.org/10.3389/frsen.2021.784015, 2021.
Wahrhaftig, C. and Cox, A.: Rock glaciers in the Alaska Range, Geol. Soc. Am. Bull., 70, 383–436, 1959.
Whalley, W. B.: The relationship of glacier ice and rock glacier at Grubengletscher, Kanton Wallis, Switzerland, Geogr. Ann. A, 61, 49–61, 1979.
Whalley, W. B.: Gruben glacier and rock glacier, Wallis, Switzerland: glacier ice exposures and their interpretation, Geogr. Ann. A, 102, 141–161, https://doi.org/10.1080/04353676.2020.1765578, 2020.
Zemp, M., Frey, H., Gärtner-Roer, I., Nussbaumer, S. U., Hoelzle, M., Paul, F., Haeberli, W., Denzinger, F., Ahlstroem, A. P., Anderson, B., Bajracharya, S., Baroni, C., Braun, L. N., Caceres, B. E., Casassa, G., Cobos, G., Davila, L. R., Delgado Granados, H., Demuth, M. N., Espizua, L., Fischer, A., Fujita, K., Gadek, B., Ghazanfar, A., Hagen, J. O., Holmlund, P., Karimi, N., Li, Z., Pelto, M., Pitte, P., Popovnin, V. V., Portocarrero, C. A., Prinz, R., Sangewar, C. V., Severskiy, I., Sigurdsson, O., Soruco, A., Usubaliev, R., and Vincent, C.: Historically unprecedented global glacier decline in the early 21st century, J. Glaciol., 61, 745–762, https://doi.org/10.3189/2015JoG15J017, 2015.