the Creative Commons Attribution 4.0 License.
the Creative Commons Attribution 4.0 License.
 | 30 May 2022
Geomorphology and shallow sub-sea-floor structures underneath the Ekström Ice Shelf, Antarctica
Astrid Oetting
Jan Erik Arndt
Boris Dorschel
Reinhard Drews
Todd A. Ehlers
Christoph Gaedicke
Coen Hofstede
Johann P. Klages
Gerhard Kuhn
Astrid Lambrecht
Andreas Läufer
Christoph Mayer
Ralf Tiedemann
Frank Wilhelms
Olaf Eisen
The Ekström Ice Shelf is one of numerous small ice shelves that fringe the coastline of western Dronning Maud Land, East Antarctica. Reconstructions of past ice-sheet extent in this area are poorly constrained, due to a lack of geomorphological evidence. Here, we present a compilation of geophysical surveys in front of and beneath the Ekström Ice Shelf, to identify and interpret evidence of past ice-sheet flow, extent and retreat. The sea floor beneath the Ekström Ice Shelf is dominated by an incised trough, which extends from the modern-day grounding line onto the continental shelf. Our surveys show that mega-scale glacial lineations cover most of the mouth of this trough, terminating 11 km away from the continental shelf break, indicating the most recent minimal extent of grounded ice in this region. Beneath the front ∼30 km of the ice shelf measured from the ice shelf edge towards the inland direction, the sea floor is characterised by an acoustically transparent sedimentary unit, up to 45 m thick. This is likely composed of subglacial till, further corroborating the presence of past grounded ice cover. Further inland, the sea floor becomes rougher, interpreted as a transition from subglacial tills to a crystalline bedrock, corresponding to the outcrop of the volcanic Explora Wedge at the sea floor.
Ice retreat in this region appears to have happened rapidly in the centre of the incised trough, evidenced by a lack of overprinting of the lineations at the trough mouth. At the margins of the trough uniformly spaced recessional moraines suggest ice retreated more gradually. We estimate the palaeo-ice thickness at the calving front around the Last Glacial Maximum to have been at least 305 to 320 m, based on the depth of iceberg ploughmarks within the trough and sea level reconstructions.
Given the similarity of the numerous small ice shelves along the Dronning Maud Land coast, these findings are likely representative for other ice shelves in this region and provide essential boundary conditions for palaeo ice-sheet models in this severely understudied region.
- Article
(7956 KB) - Full-text XML
-
Supplement
(102 KB) - BibTeX
- EndNote


In the western Dronning Maud Land (wDML) sector of East Antarctica (see Fig. 1), the area between the Riiser–Larsen and Vigrid ice shelves, ice drains through numerous small ice shelves from a combined drainage area of ∼470 000 km2 (Rignot et al., 2013). Recent studies have shown that ice shelves in this region are underlain by deep glacial troughs (Nøst, 2004; Eisermann et al., 2020; Smith et al., 2020), indicating that grounded ice advanced to the continental shelf in the past. However, a lack of geomorphological evidence prevents the definition of the ice extent, flow regime and pattern of ice retreat in the wDML region during the last glaciation. Consequently, the glacial history of this region is poorly constrained and limits our ability to understand past responses of this sector to climatic and oceanic variations. However, this is essential for evaluating future ice-sheet development in this sector of East Antarctica.
Mapping the continental shelf geomorphology around Antarctica with hydro-acoustic methods (swath bathymetry and sub-bottom profiling) is widely used to infer past ice-sheet evolution (e.g. Jakobsson et al., 2012; Lavoie et al., 2015; Arndt et al., 2017; Greenwood et al., 2018). For the wDML sector, however, such observations are largely absent. Systematic geomorphological surveys have been published in the neighbouring Coats Land region (Hodgson et al., 2018, 2019; Arndt et al., 2020), ∼600 km to the west, and around Mac. Robertson Land (Mackintosh et al., 2011), ∼2900 km to the east. The lack of data in the wDML region is mainly due to limited accessibility. The continental shelf in this area is particularly narrow with 30–150 km (see Arndt et al., 2013) and is largely covered by thick ice shelves, preventing ship-based data acquisition. Autonomous underwater vehicles (AUVs) provide one solution to collect high-resolution bathymetry data of sub-ice-shelf sea floor structures (e.g. Jenkins et al., 2010; Davies et al., 2017). An AUV was used for exploring the cavity beneath Fimbul Ice Shelf (Nicholls et al., 2006) in wDML. However, no high-resolution sea floor bathymetry data were collected since it was aimed to survey the ice shelf base. While AUVs are an effective technology for sub-ice-shelf data acquisition, they are still cost-intensive and also carry a high risk of equipment loss, as documented by the loss of the AUV used under Fimbul Ice Shelf (Dowdeswell et al., 2008). Consequently, AUVs are still rarely used below ice shelves.
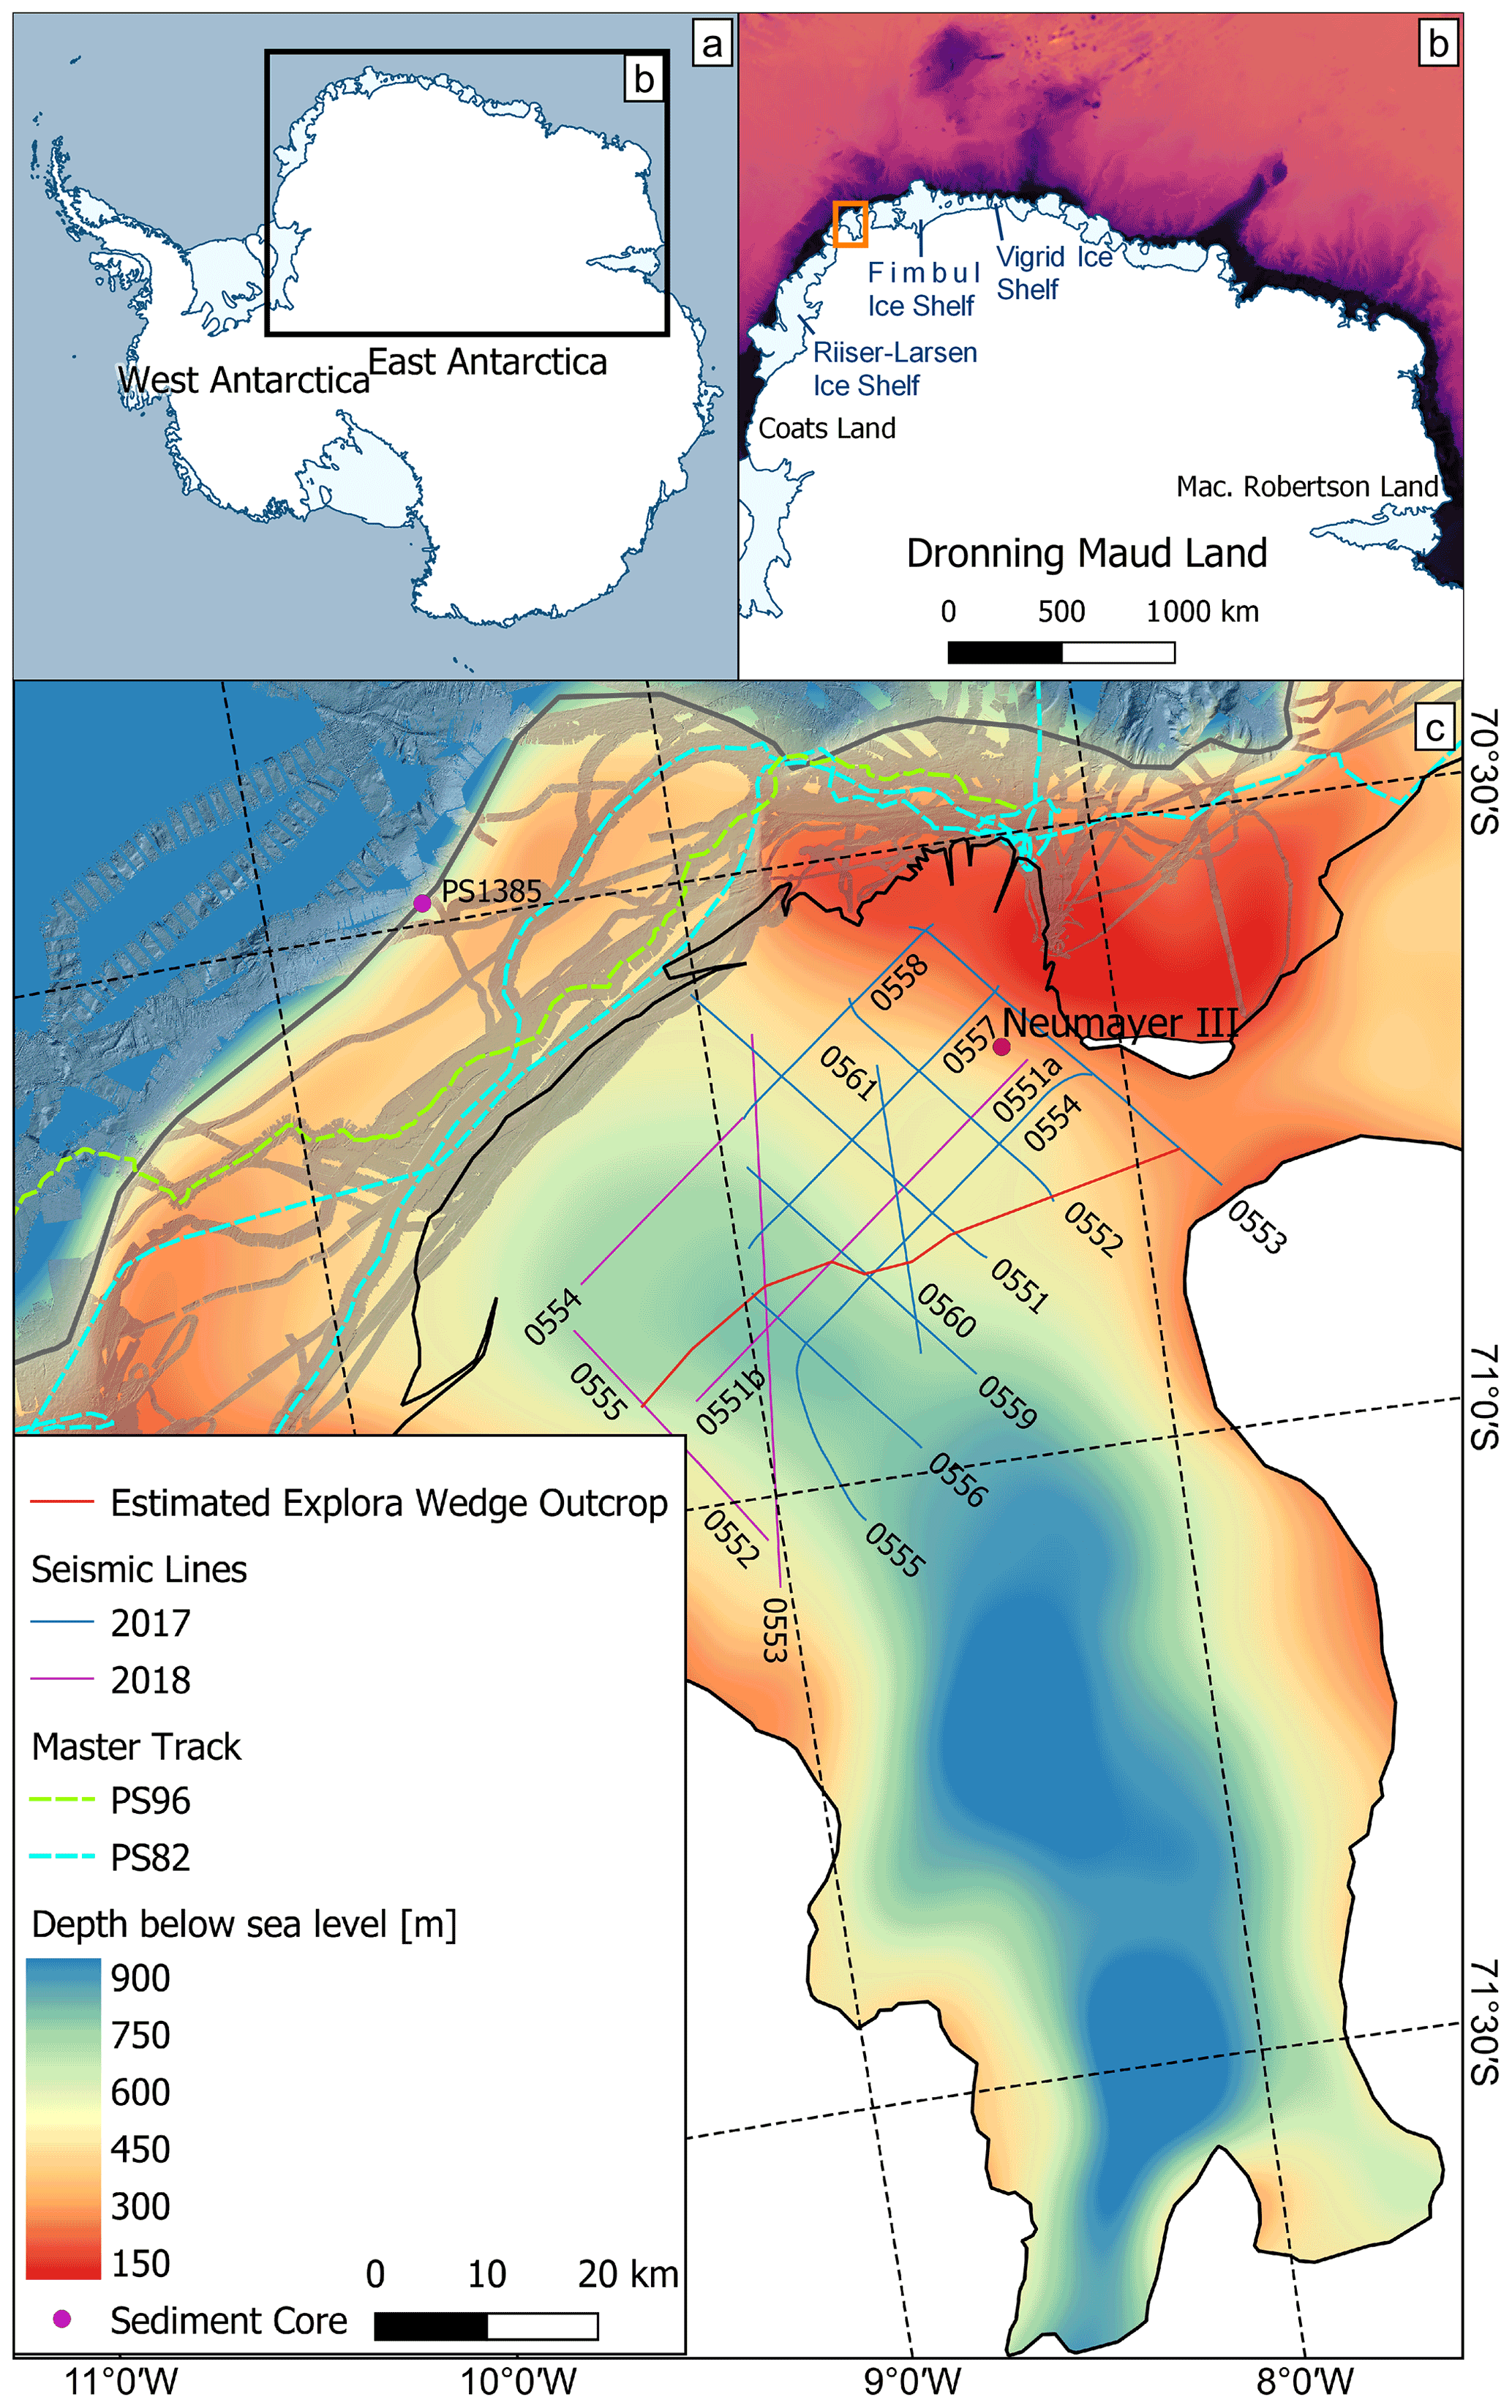
Figure 1(a) Overview of Antarctica and (b) Dronning Maud Land. The study area is highlighted with an orange box. Panel (c) is a map of the study area in front of and beneath Ekström Ice Shelf. The ice-shelf front (thin black line) is located 25 km south of the continental shelf edge (grey line). Ice shelf: sea floor depth is from Eisermann et al. (2020), seismic lines used in this study are indicated by the purple and blue lines, and the line numbers are indicated. The outcrop of the volcanic Explora Wedge (Kristoffersen et al., 2014) at the sea floor is shown as a red line and is based on an interpretation of the seismic profiles detailed here. In front of the ice shelf: colour-coded high-resolution swath bathymetry data give the sea floor depth. Parasound-tracking lines from Knust (2014) and Schröder (2016) are shown as light blue and green dashed lines. The pink dot on the continental shelf edge (grey line) shows the location where Grobe and Mackensen (1992) sampled sediment core PS1385.
Here we present an alternative approach, for which we combined marine geophysical and on-ice reflection seismic data for the Ekström Ice Shelf (EIS) embayment, wDML (Fig. 1). Seawards of the ice shelf we use multibeam echosounder and parametric sub-bottom sediment echosounder (PARASOUND) data, and on the ice shelf we use a grid of vibro-seismic reflection surveys. We provide a joint interpretation of these data sets to better resolve the poorly constrained ice-sheet dynamic history of the wDML, and moreover we discuss advantages, disadvantages and limitations of this approach.
Our study area covers the continental shelf and the sea floor under the first 50 km (measured from the calving front) of the EIS cavity (Fig. 1). The EIS covers an area of 6800 km2 (Neckel et al., 2012) and drains into the Atlantic sector of the Southern Ocean. It is bounded by the ice rises of Sørasen to the west and Halvfarryggen to the east. Geophysical mapping of the sea floor bathymetry beneath the ice shelf (Eisermann et al., 2020; Smith et al., 2020) revealed an incised trough extending around 140 km from the most landward location of the current grounding line (8∘6′W at the southernmost point) to the continental shelf. The distance to the grounding line is measured along the trough axis. The trough has a maximum depth of 1100 m below sea level, 30 km downstream (north) of the current grounding line (Fig. 1c) and shallows to ∼550 m on the continental shelf (Arndt et al., 2013). Smith et al. (2020) concluded a palaeo-ice stream extent towards the continental shelf edge near the current ice-shelf front from where it retreated episodically, indicated by topographic highs along the trough axis.
Schannwell et al. (2020), using the bathymetry of Smith et al. (2020) and Eisermann et al. (2020), modelled the evolution of the ice in the Ekström Ice Shelf embayment over a 40 000-year glacial cycle, investigating the effect of differing bed materials on ice dynamics. They concluded that the ice reached its maximum extent ∼20 000 years before present during the Last Glacial Maximum (LGM: 23–19 ka cal. BP). Significantly, the maximum ice extent was simulated to be located ∼50 km inland of the continental shelf break. Furthermore, this maximum ice extent simulated by Schannwell et al. (2020) was only reached if ice was characterised by a “hard, high-friction” bed. By using a “soft, low friction” bed as the boundary condition, the maximum ice extent was ∼100 km inland of the continental shelf break (Schannwell et al., 2020). In conclusion, the current range of estimates of maximal ice-sheet extent differ significantly, highlighting the uncertainty about the glacial history of this region and the factors affecting ice advance and retreat.

Figure 2Schematic display of the study area and the used methods. The shown features are not to scale.
We investigated the sea floor in front of the ice shelf with marine geophysical methods and used reflection seismics to image areas below the EIS (see Fig. 2).
3.1 Marine geophysical methods
Bathymetric data used in this study were collected during 16 expeditions of the RV Polarstern (Alfred-Wegener-Institut Helmholtz-Zentrum für Polar- und Meeresforschung, 2017) between 1989 and 2016 and are available at PANGAEA (see Supplement S1). The data were recorded with the hull-mounted multibeam echosounder systems Atlas Hydrosweep HSDS 2 and HSDS 3 (Alfred-Wegener-Institut Helmholtz-Zentrum für Polar- und Meeresforschung, 2017). The tracks are partly overlapping or have spacings up to 7 km, and the track widths range between 700 m and 2.3 km. All multibeam echosounder data were processed with the hydrographic software suite HIPS & SIPS from Teledyne CARIS. In this process, all data were corrected for sound velocity variations in the water column, and erroneous measurements were removed. Processed multibeam data were exported to ASCII files and subsequently gridded at 25 m resolution using a weighted moving average gridding algorithm in the QPS Fledermaus software. Details on the multibeam data and their processing can be found in Arndt et al. (2013).
The sub-bottom profiler data used in this study were recorded during expeditions PS82 in 2014 (Damaske and Kuhn, 2014) and PS96 in 2015/2016 (Arndt and Kuhn, 2016) of the RV Polarstern using a hull-mounted Atlas Parasound P70 sediment echosounder system (Alfred-Wegener-Institut Helmholtz-Zentrum für Polar- und Meeresforschung, 2017). The Parasound device was operated with primary frequencies of 18 and 22 kHz, resulting in a secondary frequency of 4 kHz. The master tracks of these RV Polarstern expeditions, which have a total track length of ∼400 km in the considered area and partially overlap or have a distance of up to ∼20 km, are shown in Fig. 1c.
3.2 On-ice reflection seismics
Data beneath the ice shelf were acquired using an on-ice vibroseismic source. The source signal is a linear sweep lasting 10 s with a frequency of 10 to 220 Hz (Smith et al., 2020). A snow streamer was used to receive the reflected seismic signals. It contained 60 channels, and each channel consisted of a group of eight geophones (Eisen et al., 2015; Smith et al., 2020). The seismic profiles were acquired during the Antarctic summer seasons 2016/17 and 2017/18 (hereinafter referred to as the 2017 and 2018 data sets, respectively). The seismic profiles are orientated across or along the predominant ice-flow direction and shown in Fig. 1c. Further technical details regarding the vibroseismic method are given in Eisen et al. (2015). Details of acquisition on the EIS are given in Smith et al. (2020), who studied the cavity geometry below the ice shelf but did not address geomorphological landforms. The vertical resolution for the stacked data at the sea floor is ∼6 m. The horizontal resolution ranges between 50 and 130 m, depending on the shot point distance. The uncertainty in sea floor depth determined from these data sets is 14.8 m (Smith et al., 2020).
The horizontal and vertical resolution of seismic data is, as described above, lower than that of the marine geophysical data, and the spatial coverage is much more sparse. Accordingly, we take care interpreting these data, as features are often imaged by a single seismic line only, limiting our ability to confirm the orientation or spatial extent of features. An evaluation of the seismic data is given in Sect. 5.3.
We describe landforms identified in front of and beneath the modern-day EIS, compare them to similar landforms found on other formerly glaciated continental shelves, and discuss later potential formation processes. Due to differences in data density and resolution between the marine and the on-ice reflection seismic data, we discuss the results separately in terms of the outer continental shelf (Sect. 4.1) and the sub-ice shelf (Sect. 4.2).
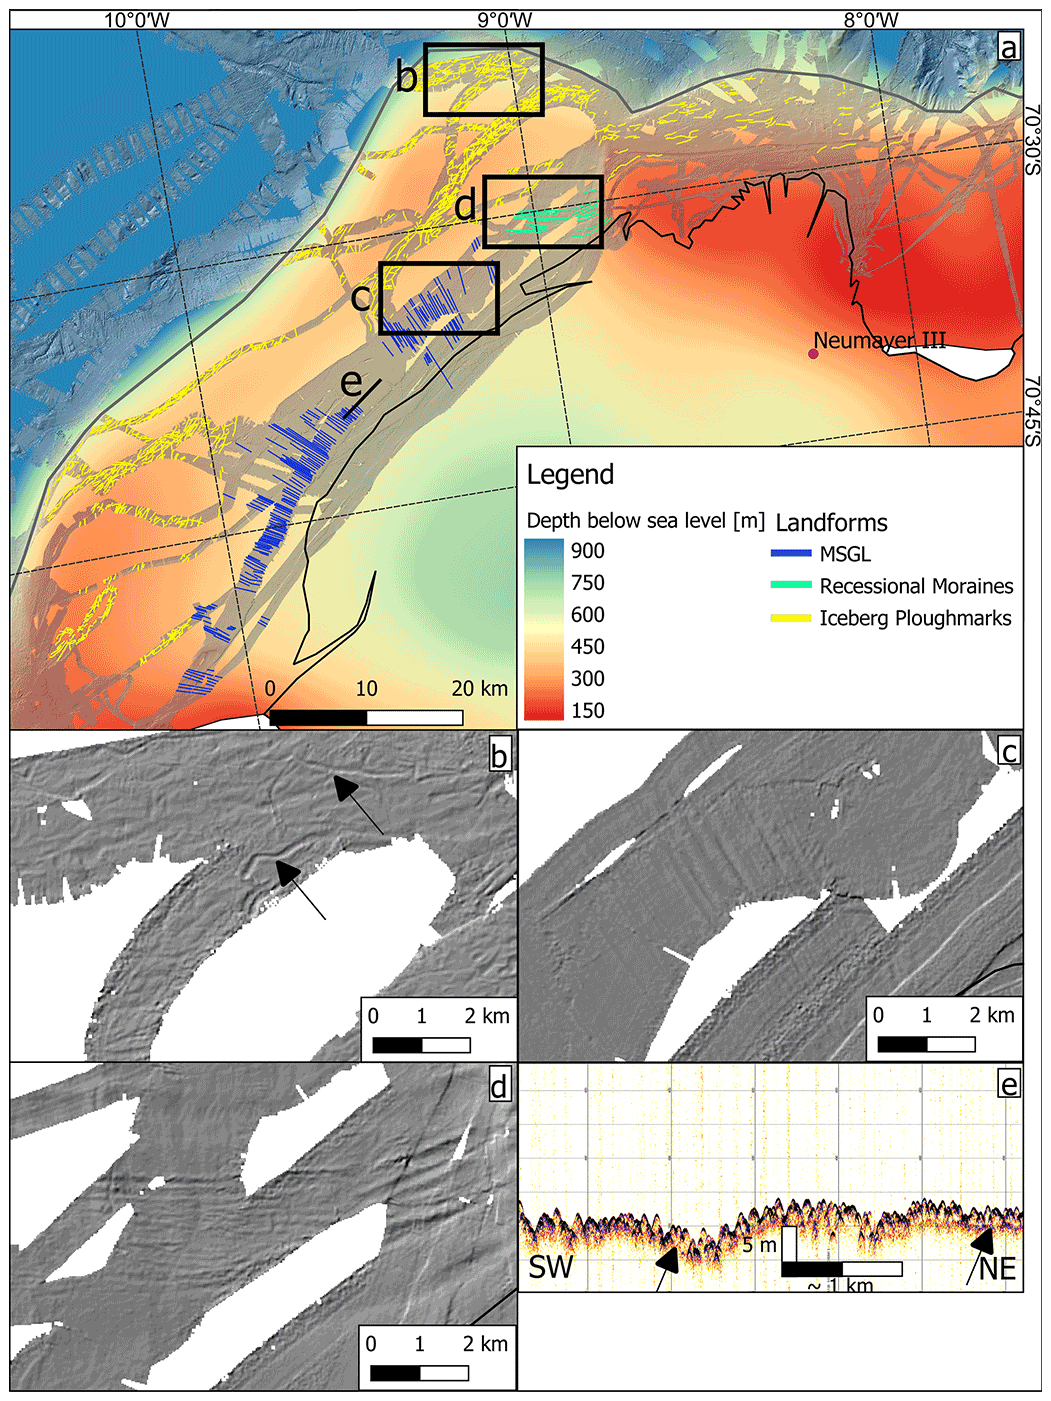
Figure 3Landforms at the continental shelf. The panel (a) displays the water depth and an overview of the identified landforms. The rectangles in the bathymetry map (a) indicate the location of the close-ups of iceberg ploughmarks (b), MSGLs (c) and recessional moraines (d). Their orientation is the same as in panel (a). Panel (e) is an echogram of the MSGL: the left black arrow indicates the absence of a basal layer and the right arrow its presence.
4.1 Marine geophysical data: the outer continental shelf
4.1.1 Iceberg ploughmarks
The outer continental shelf is covered by a multitude of curvilinear, elongated furrows (Fig. 3a, marked in yellow and b). Near the continental shelf break, they occur in water depths down to 535 m. At the eastern margin of the trough they occur in shallower water depths of about 320 m. In the deeper parts of the trough, near the ice shelf front, the furrows are only present at water depths shallower than 420 m. These furrows are randomly oriented, changing orientation within their tracks and occasionally cross-cutting. They are several hundreds of metres to more than 1000 m long, have widths ranging from a few metres (visible in the PARASOUND echograms) up to 100 m (Fig. 3b), and are up to 10 m deep. Based on the furrow characteristics, we interpret these as iceberg ploughmarks formed by the keels of drifting icebergs that have grounded on the sea floor, reworking the upper sea floor sediments along its path. Iceberg ploughmarks are a common feature of polar continental shelves and have also been identified a few hundred kilometres southwest of the EIS in the southern Weddell Sea (Lien et al., 1989; Gales et al., 2016; Arndt et al., 2017, 2020).
4.1.2 Mega-scale glacial lineations
The deepest part of the trough near the modern calving line is characterised by sets of parallel to sub-parallel linear ridges (Fig. 3a, blue lines and c). These ridges are between 1 and 8 km long and have widths between 150 and 450 m, resulting in elongation ratios between 15:1 and 40:1. The mean spacing between ridge crests is 250 m. The ridges are observed in water depths between 380 and 550 m with amplitudes ranging from less than 1 m up to 10 m. The ridges strike northwestward aligning with the trough axis. Closer to the trough edges, a divergent orientation of the lineations is observed. At the eastern edge of the trough they have a direction of 155∘ from N, and at the western edge of the trough mouth they are orientated 115∘ from N (see Fig. 3a).
Sub-bottom profiler data acquired across these ridges indicate that they were moulded into an acoustically transparent layer (Fig. 3e). A shallow and continuous sub-bottom reflector is visible beneath that transparent layer, which fades out further southwestwards. It is likely that this continuous reflector is only visible beneath the smaller ridges, where the acoustically transparent layer is thinner and the sub-bottom profiler signal can penetrate deep enough to resolve it.
We interpret those ridges as mega-scale glacial lineations (MSGLs). MSGLs are widely documented in former glaciated regions and have been described on land (Clark, 1993), on the sea floor (e.g. Ó Cofaigh et al., 2002) and beneath active ice streams (King et al., 2009). Their occurrence indicates the former presence of a fast-flowing ice stream (e.g. Stokes and Clark, 1999; Livingstone et al., 2012). The acoustically transparent layer into which the MSGLs are formed is often associated with a soft deformable till of varying shear strengths (Dowdeswell et al., 2004; Ó Cofaigh et al., 2005). Their slightly varying orientation in front of Ekström Ice Shelf indicates a diverging palaeo-ice flow on the outer continental shelf.
4.1.3 Recessional moraines
Close to the modern-day calving front, a set of linear and sub-parallel ridges is located at the eastern trough margin (Fig. 3a, turquoise lines). The mostly symmetrical ridges are up to 15 m high and have lengths between 1 and 5.7 km (Fig. 3d). Their widths vary between 100 and 300 m. The ridges occur at a relatively uniform spacing with a distance from crest to crest of about 300 m. The orientation of the ridges is approximately perpendicular to the trough axis. Further to the trough centre their orientation changes to 85∘ in the clockwise direction. The water depths in the area where the ridges occur range between 390 and 445 m.
Ridges of similar shapes and dimensions were found in the centre of formerly glaciated cross-shelf troughs and have been interpreted as recessional moraines, e.g. in the Amundsen Sea Embayment (e.g. Klages et al., 2015), in the Ross Sea (e.g. Simkins et al., 2016) and offshore northeast Greenland (e.g. Winkelmann et al., 2010). Accordingly, we interpret these linear and sub-parallel ridges as recessional moraines. Such sets of recessional moraines form at the ice margin by pushing and squeezing of sub- and proglacial deposits during short halts or minor readvances of the ice terminus during general ice-sheet retreat (e.g. Winkelmann et al., 2010).
4.2 On-ice seismic reflection data: sub-ice shelf
This study focuses on shallow sub-sea-floor features in the upper ∼100 m of the sea floor. We do, however, map one deeper geological feature, the volcanic Explora Wedge (Kristoffersen et al., 2014), where it outcrops at the sea floor (Fig. 1c, red line). The Explora Wedge divides the study area into two regions, marking a transition between soft and hard sea floor material. Accordingly, the landforms discussed here are divided into two groups, those downstream (north) (Sect. 4.2.1) and those upstream (south) (Sect. 4.2.2) of the outcropping Explora Wedge.

Figure 4Landforms downstream of the Explora Wedge. Panel (a) provides an overview of the found landforms. Panels (b)–(d) display examples for the seismic unit interpreted as subglacial till, and (e)–(i) show the bumps in sediment. The arrows indicate the direction of the current ice flow with respect to the seismic line, and the (x) symbol indicates that the seismic line is parallel to the ice flow direction.
4.2.1 Landforms downstream of the Explora Wedge outcrop – smoother sea floor
The seismic data collected downstream (north) of the outcropping Explora Wedge mainly cover the eastern part of the trough (Figs. 4 and 5). This area is shallower than the centre of the trough with water depths ranging from 250 m at the trough edge to 550 m closer to the trough centre and is mostly flat. Therefore, we refer to this area as the plateau hereafter. The seismic data show that the sea floor of the plateau is relatively smooth, with a clear and continuous sea floor reflection. The majority of the plateau is covered by a seismic unit with its base characterised by a clear sub-bottom reflection. This unit is between 13 and 45 m thick, overlying truncated dipping reflections (Fig. 4b–d, marked in purple). The thickest part of this sedimentary unit is located in a depression southwest of the German Neumayer III station (Fig. 4a, black dashed line) that is 16.3 km long (measured along seismic line 20170552) and 12.6 km wide (measured along seismic line 20180551).
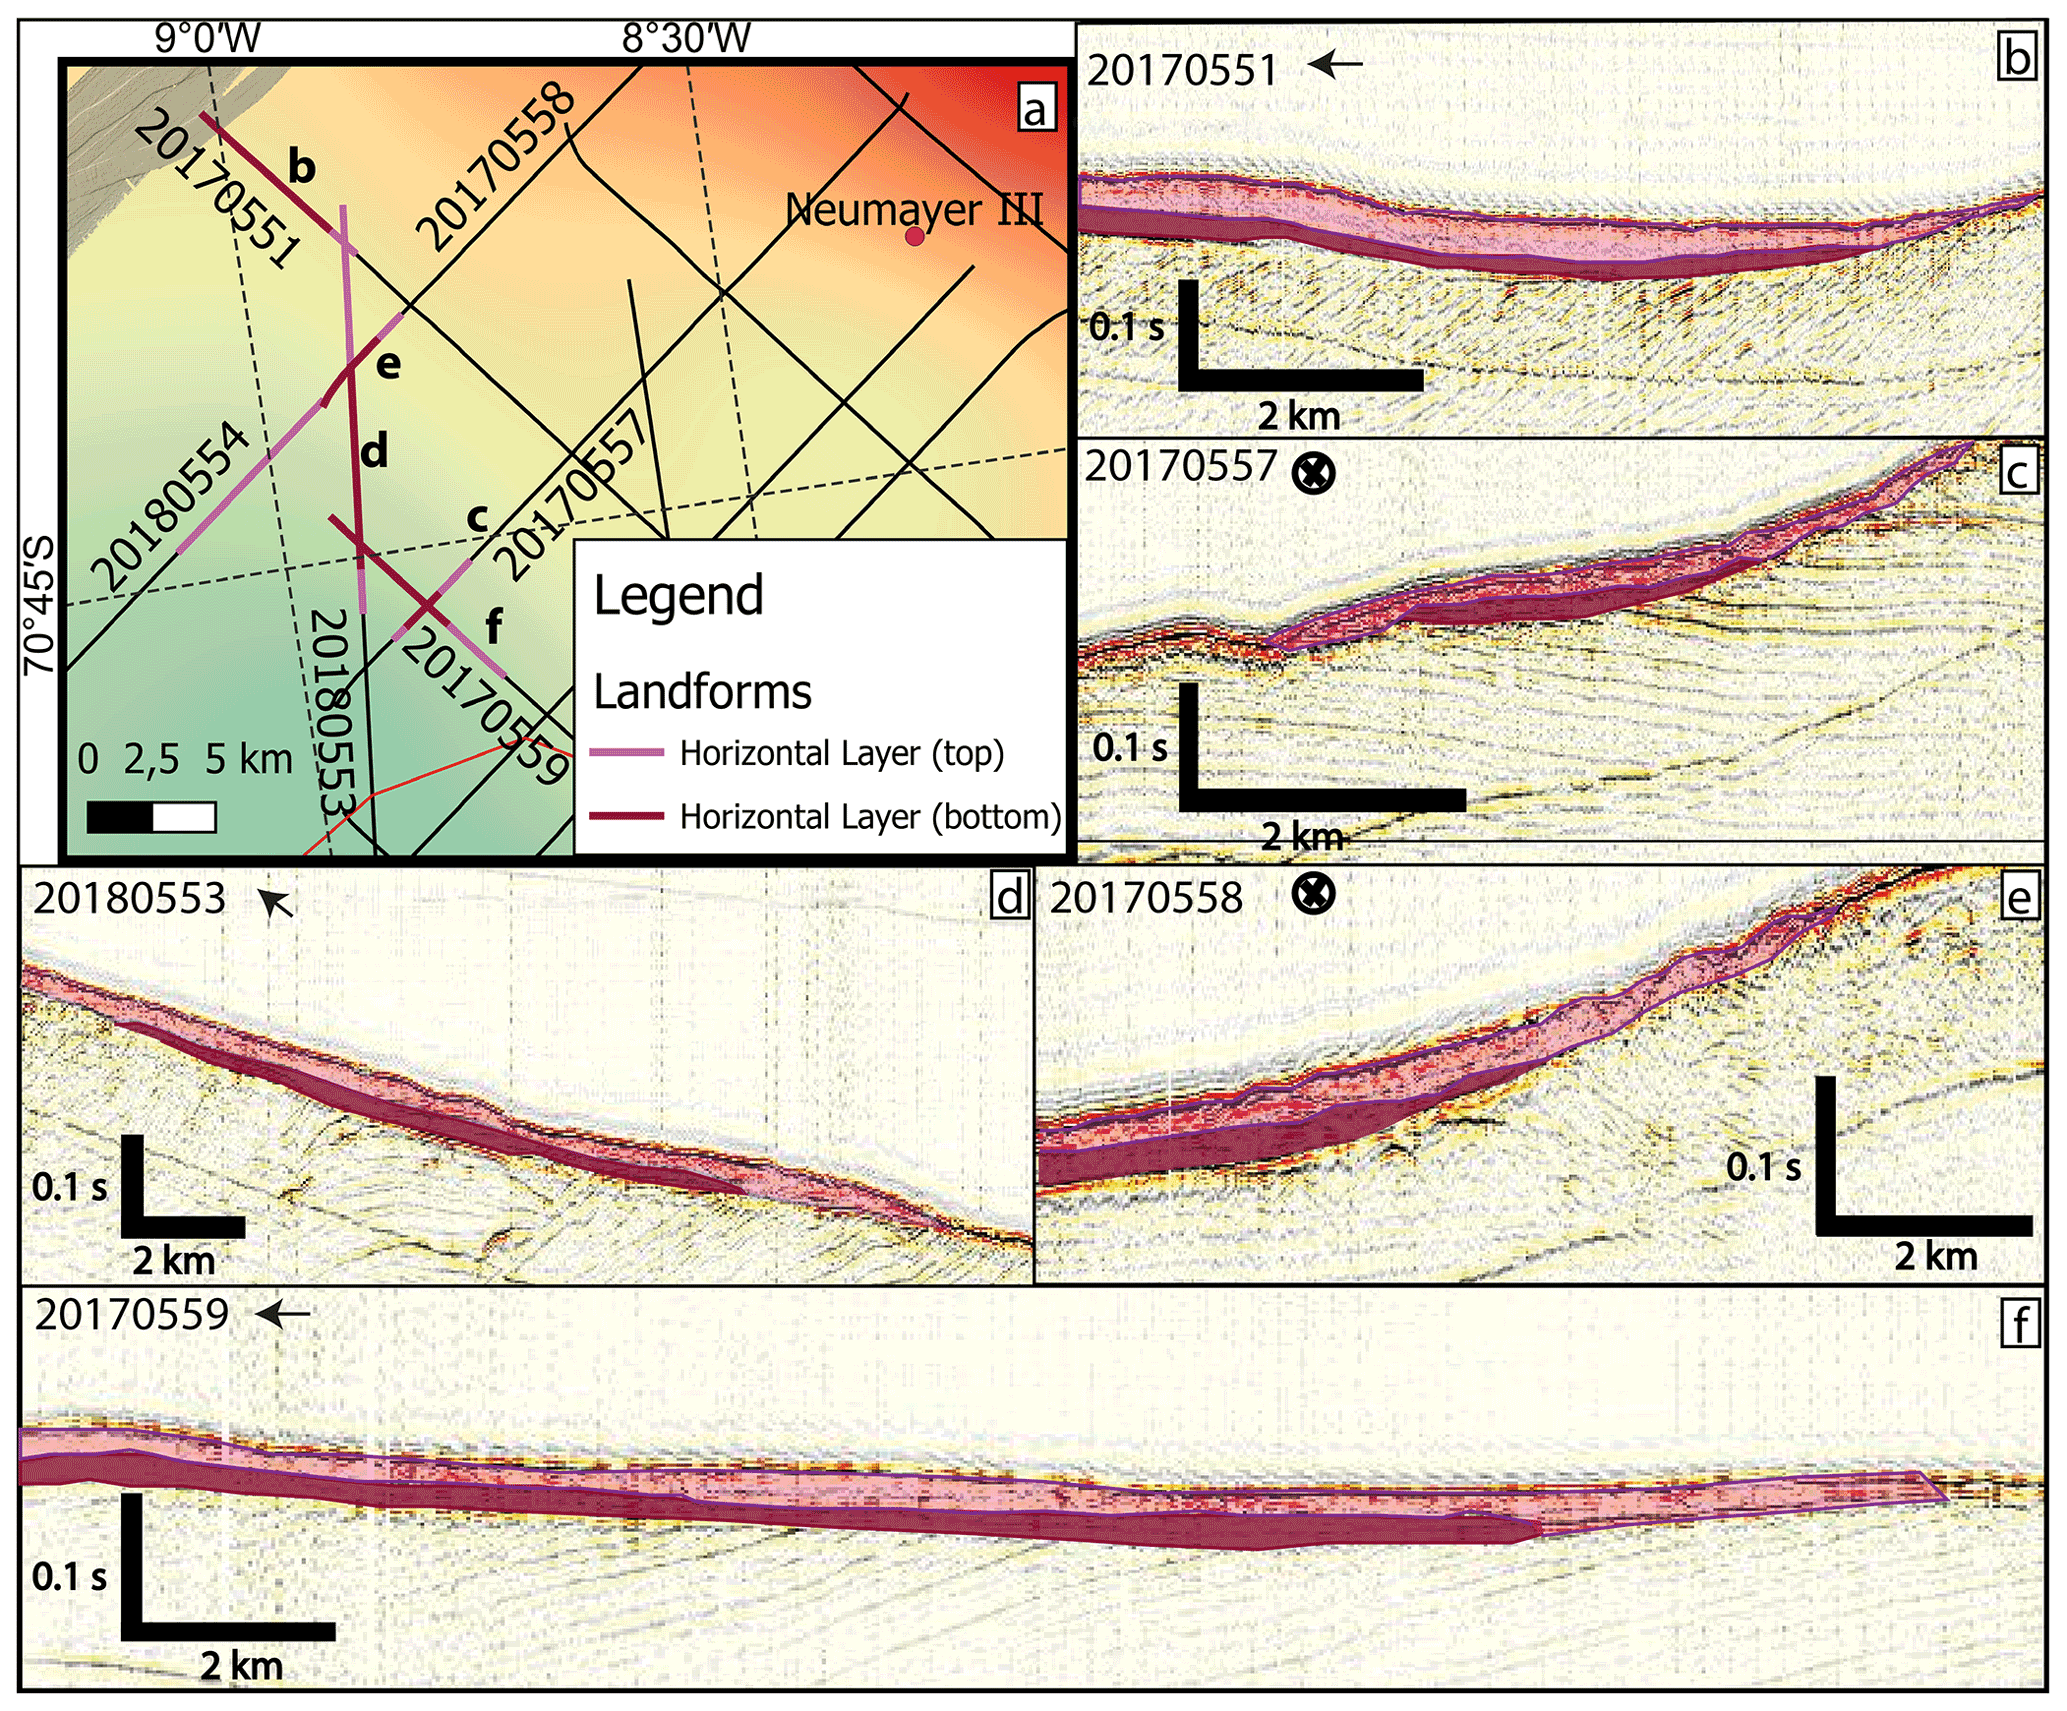
Figure 5Panel (a) gives an overview of the location of the sea-floor-parallel seismic unit. Panels (b)–(f) show the extent of the unit in the trough mouth. The dark pink represents the bottom layer and the light pink the layer on top. The direction of the current ice flow is indicated as in Fig. 4. The colour scale in (a) represents the depth below sea level as in Fig. 1.
Within this seismic unit we have identified five distinct thicker protrusions at the sea floor; from here on we will refer to these as “bumps” (Fig. 4e–i). The bumps in Fig. 4e, f and h are intersected by seismic lines in an along-flow direction. The bumps in Fig. 4e and f have thicknesses of around 20 m and along-flow extents of 1200 and 1800 m respectively. They have asymmetric forms with a steeper flank on the ice-faced side and a shallower flank in the ice-distal side direction. The bump in Fig. 4h is the thickest feature at 40 m and extends in an along-flow direction for 820 m, also showing a slightly asymmetrical form. Bumps in Fig. 4g and i are sampled by seismic lines oriented in an across-flow direction; both are around 15 m thick and extend for 1.5 km and 390 m respectively. They both have relatively symmetrical forms.
On the western edge of the plateau, as the sea floor begins to deepen into the trough, a distinct layered unit is imaged across a number of seismic lines (Fig. 5), in both the along-flow and across-flow directions. This unit, once again, overlies truncated dipping layers and appears to pinch out against these layers in shallower water depths at around 540 m (Fig. 5b). It is imaged down to depths of 800 m (Fig. 5d). The extent over which the feature could be mapped is shown in Fig. 5a. The unit comprises two clearly defined layers. The uppermost of the two layers is thicker, reaching a maximum thickness of around 40 m, close to the current calving front (Fig. 5a–f, light pink), and has a greater spatial extent. The lower layer has a maximum thickness of around 25 m and is less extensive (Fig. 5a–f, dark pink). The maximum thickness of the whole unit is 65 m.
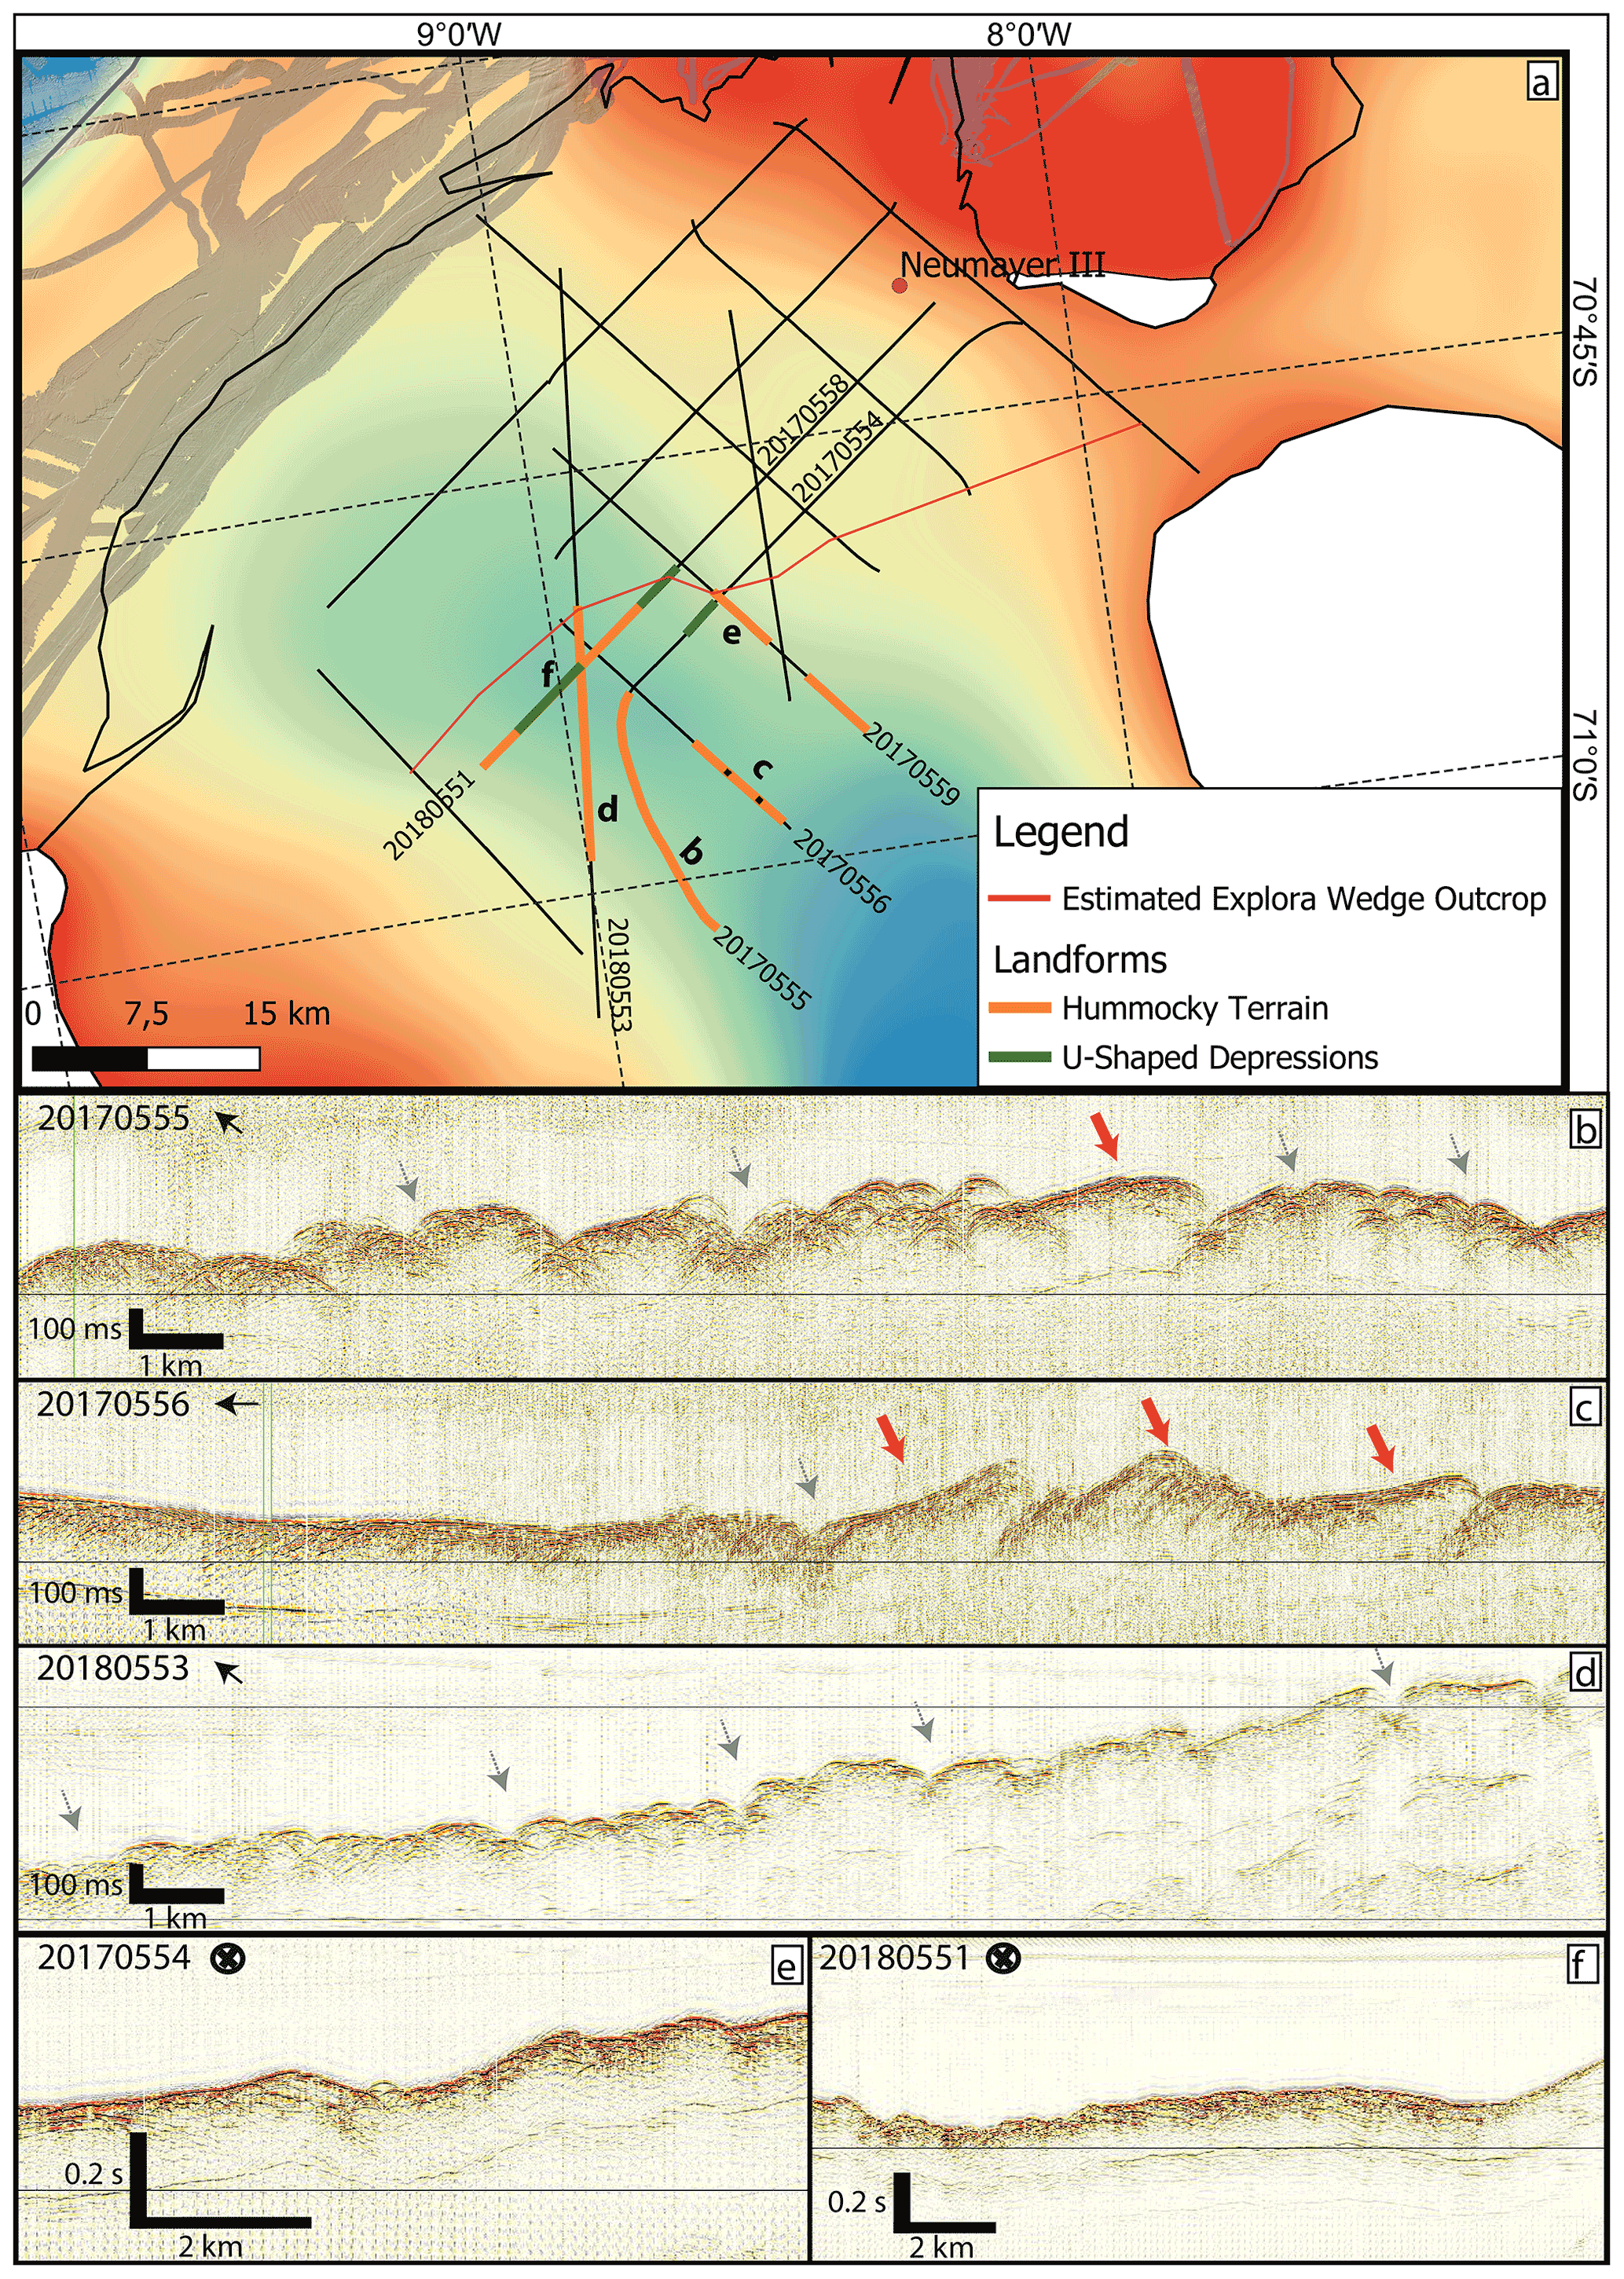
Figure 6Landforms upstream of the Explora Wedge outcrop. The locations of the irregular sea floor and U-shaped depressions are displayed in (a). Examples for the rough sea floor are shown in (b)–(d); the red arrows indicate the “hummocky landforms in bedrock”. The small depressions, which are pointed out with greyish dotted arrows, are seismic artefacts from crevasses in the ice shelf base above. A close-up of the U-shaped depression in seismic line 20170554 is in panel (e), and (f) displays these landforms in seismic profile 20180551. The direction of the current ice flow is indicated as in Figs. 4 and 5. The colour scale represents the depth below sea level as in Fig. 1.
4.2.2 Landforms upstream of the Explora Wedge outcrop – rougher sea floor
Upstream of the Explora Wedge outcrop, the sea floor is qualitatively rougher than downstream of the outcrop (Fig. 6a-d). In the centre of the incised trough, at a water depth of around 900 m, we image a series of hummocky landforms in the along-flow direction and on a gently curving seismic line, at approximately 25∘ to the along-flow direction (Fig. 6a, b). Some of the landforms have steeper sides in the upstream-facing direction and more gently sloping sides in the downstream-facing direction (Fig. 6b and c, red arrows), although it is not simple to divide them into individual features. They range in height from 30 and 90 m, measured from the most elevated point of the landform to the surrounding sea floor. Some of these landforms show morphological lows on their ice-faced side (Fig. 6b, c).
In the across-flow direction, directly upstream of the volcanic Explora Wedge outcrop, we image U-shaped depressions at the base of the trough flanks (Fig. 6e, f), with widths between 3 and 5 km and depths of 20 to 100 m compared to the average surrounding sea floor.
5.1 Palaeo-ice-sheet setting from marine geophysical evidence
An overdeepened trough is present beneath the EIS, which widens and shallows close towards the modern ice shelf front (Smith et al., 2020; Eisermann et al., 2020). Such troughs are common on Antarctic shelves (e.g. Ó Cofaigh et al., 2002; Livingstone et al., 2012; Graham et al., 2016a, b; Arndt et al., 2017; Larter et al., 2019) and are interpreted as the conduits of palaeo-ice streams during glaciations. Similar incised troughs are also present at adjacent ice shelves (Eisermann et al., 2020; Nøst, 2004; Favier et al., 2016). Smith et al. (2020) concluded that this trough was the location of a palaeo-ice stream; we corroborate and extend this interpretation with addition of geomorphological evidence. The presence of MSGLs on the continental shelf, terminating 11 km from the continental shelf break (Fig. 3a), is evidence that fast-flowing ice covered this area in the past. Fanning of the MSGLs at the trough mouth suggests divergent ice flow unconstrained by topography, typical of ice margins. Further evidence that grounded ice was present close to the continental shelf break is the presence of recessional moraines at the trough edges (Fig. 3d), perpendicular to the palaeo-ice-flow direction indicated by the MSGLs (Fig. 3a, c).
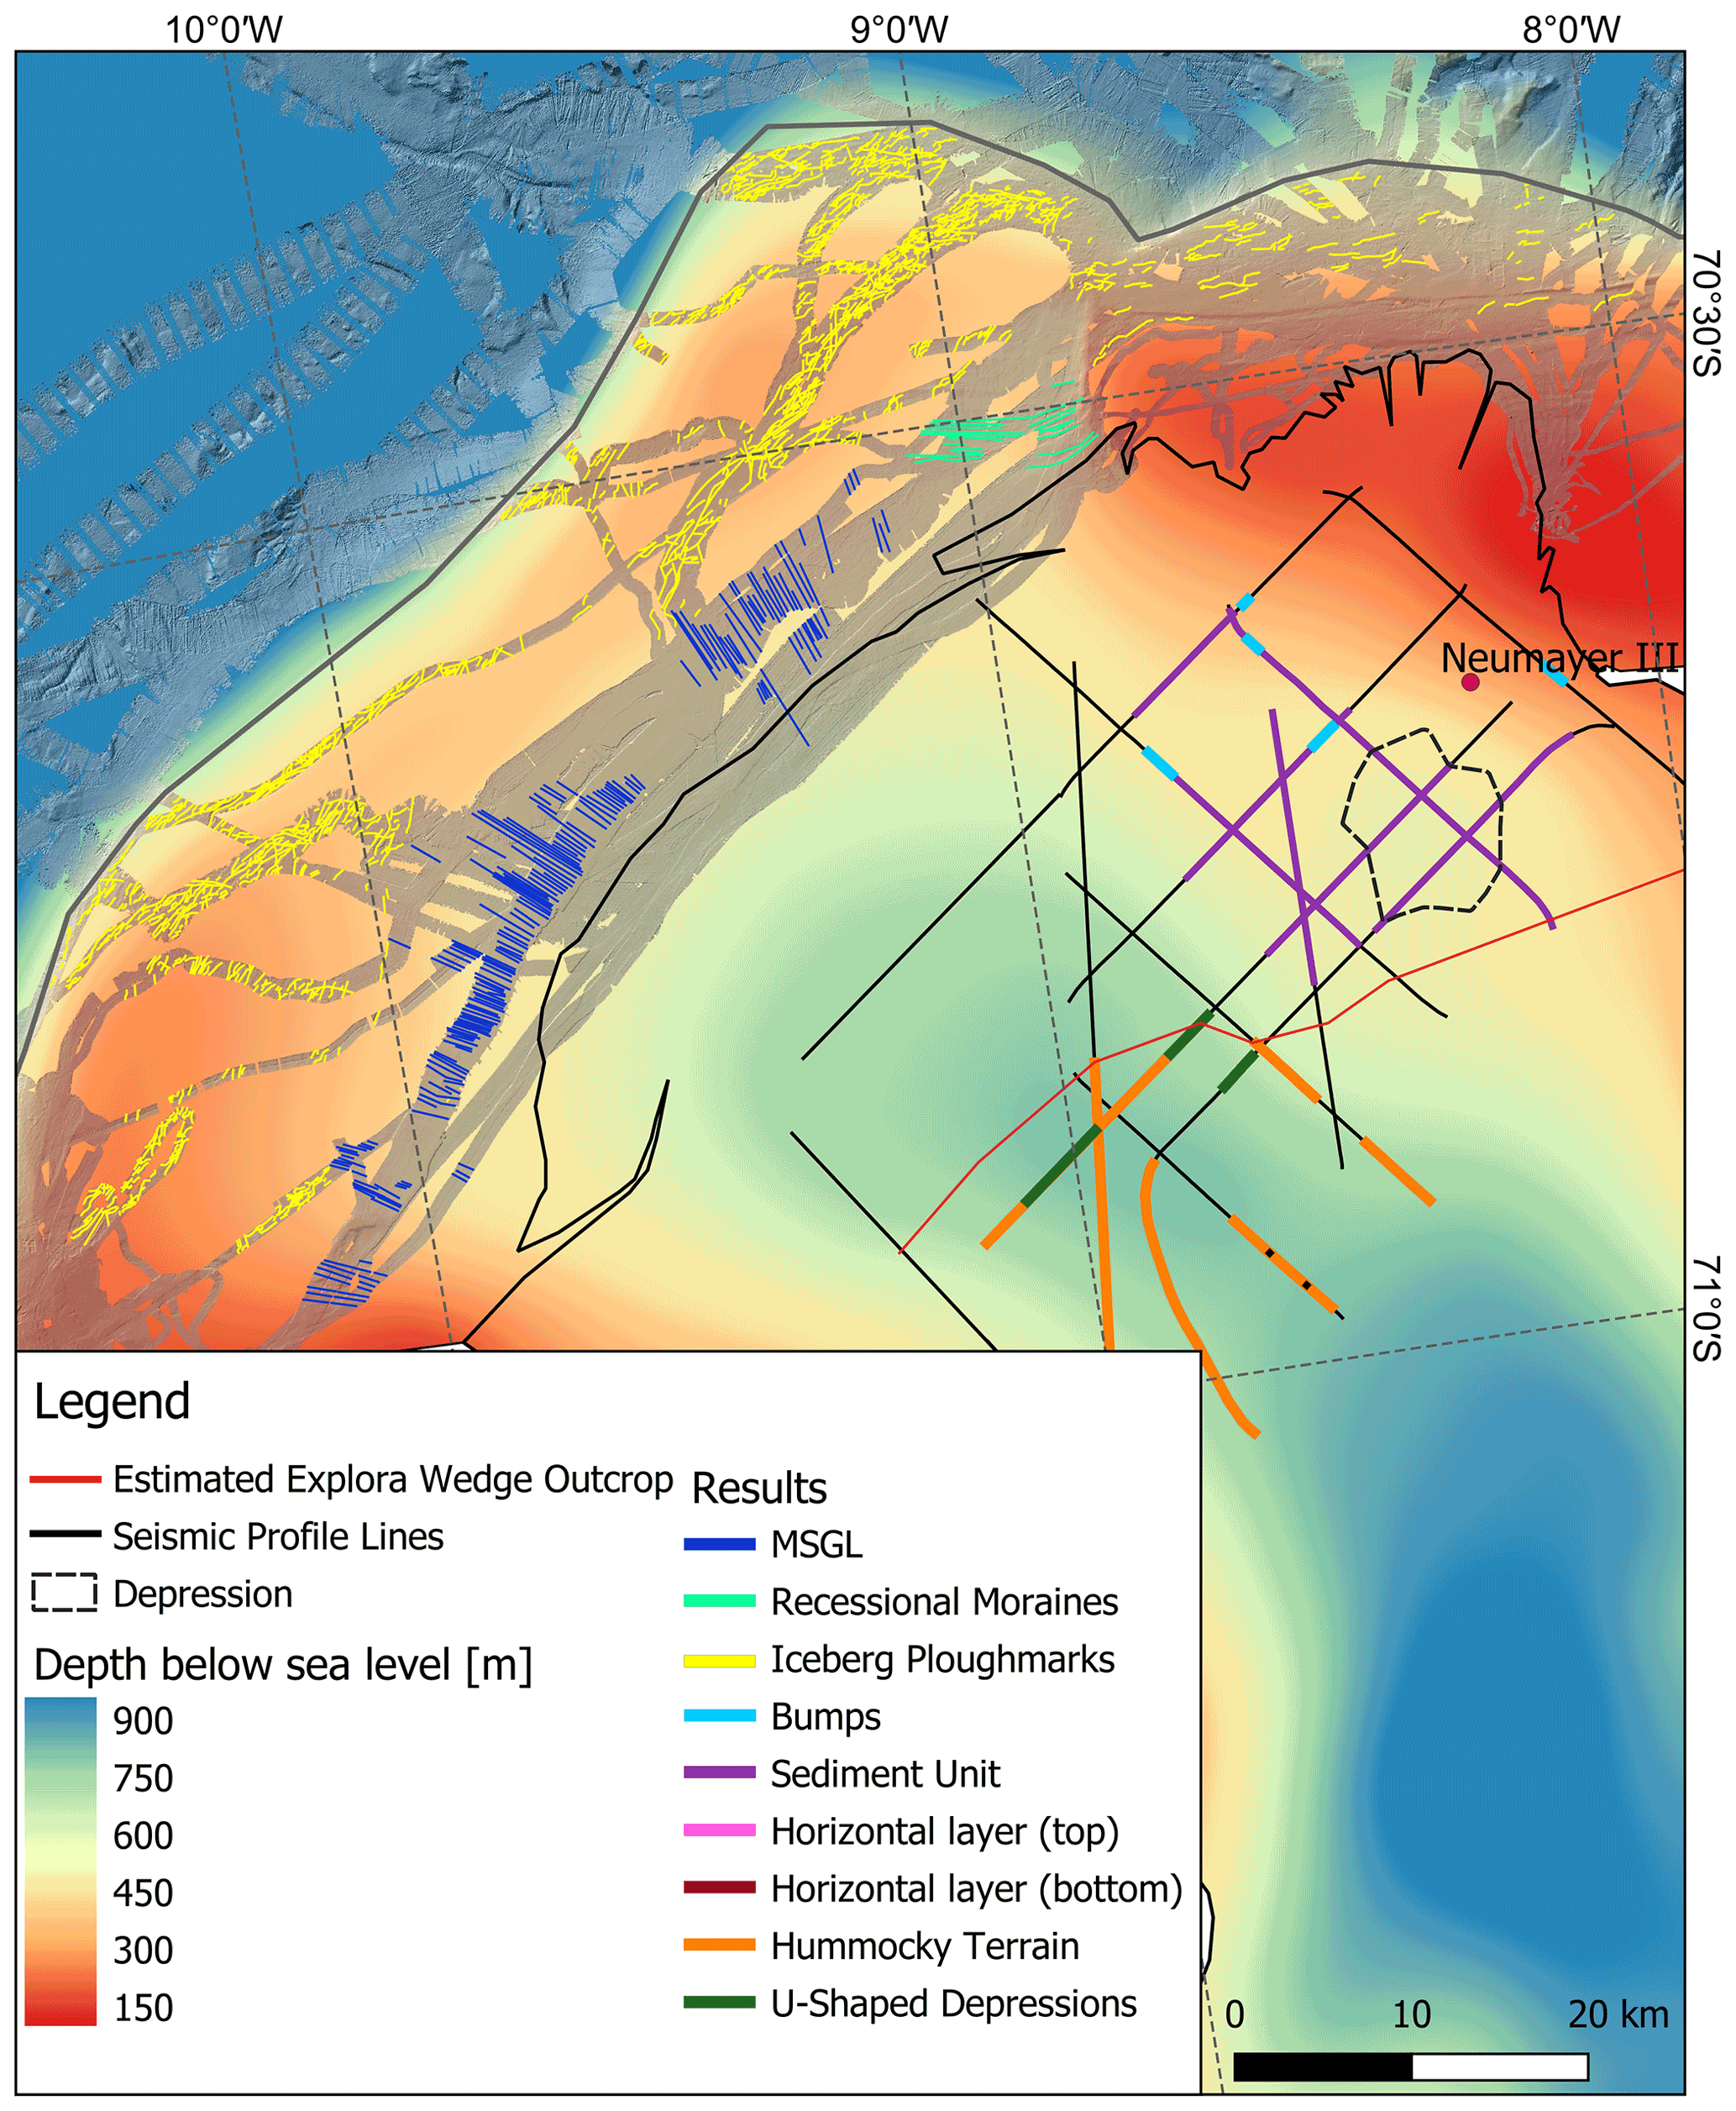
Figure 7Overview map of the identified landforms. The length of the individual coloured lines corresponds to the detected extent of the landform in the seismic data. The ice-shelf front (thin black line) is located 25 km south of the continental shelf edge (grey line).
The age of MSGLs and recessional moraines in the EIS embayment is difficult to constrain with currently available data. Grobe and Mackensen (1992) investigated sediments offshore of the EIS, which did not yield any datable material to constrain a minimum age for ice-sheet retreat. In addition, our data reveal that the sediment core location PS1385 is probably strongly affected by iceberg ploughing (Fig. 1c, pink dot), likely obliterating any stratigraphic successions. The thin drape layer on top of the MSGLs (Fig. 3e), and the fresh appearance of MSGLs and recessional moraines in the multibeam data, provides evidence that these features are relatively young, i.e. LGM and/or younger.
The moraines at the trough edges (Fig. 3a, d) are the only landforms indicative of short-lived grounding line stillstands during ice retreat. It is possible such features were also present in the trough centre; however this area is heavily covered by iceberg ploughmarks, which may have eradicated those moraines in the deeper parts of the trough.
The iceberg ploughmarks (Sect. 4.1.1), which cover large parts of the outer continental shelf (Fig. 3b), reach greater depths than ploughmarks within the Ekström embayment, indicating that the icebergs creating these two sets of ploughmarks have different origins. The mainly east–west-oriented ploughmarks at and beyond the continental shelf break were very likely formed by large icebergs transported from somewhere east of EIS and driven predominantly by currents (e.g. Antarctic Coastal Current) and wind over longer distances (Stuart and Long, 2011).
A bathymetric sill is present at the continental shelf break, separating the open ocean from the over-deepened incised trough; at its deepest point, the sill is at approximately 390 m water depth (Arndt et al., 2013). Therefore, icebergs calved outside Ekström trough were only able to enter the trough with a draft of less than 390 m modern-day water depth. It is, therefore, reasonable to assume that ploughmarks deeper than 390 m within the Ekström trough can only have been calved from the EIS itself. The ice shelf thickness of 2017 at the calving front (line 20170551) is approximately 250 m, thus making the draft of the produced icebergs too shallow to produce ploughmaks of that dimension. Therefore, the ploughmarks at water depths of up to 420 m within the Ekström trough indicate that the ice shelf was thicker at some time since recession of the calving line beyond the iceberg ploughmark locations and that the maximum ploughmark water depth can be used to estimate the maximum ice-shelf thickness during this time (see Sect. 6).
5.2 Interpretation of sub-ice-shelf seismic data
The on-ice reflection seismic data extend the marine geophysical coverage and image the continuation of the trough beneath the ice shelf. Due to limitations in the seismic data (see Sect. 5.3) we interpret these features in the context of the ice dynamic setting laid out by the marine geophysical data, which gives us a reference frame to constrain the types of landforms that may be expected in this realm. Furthermore, the seismic data allowed us to broadly identify a divide between qualitatively smoother or rougher sea floor, separated by the outcrop of the Explora Wedge at the sea floor. The rougher sea floor upstream of this wedge is likely made of more resistant crystalline bedrock, whereas the area downstream is likely covered with sedimentary substrate. A similar setting is observed in many other areas of Antarctica such as Pine Island Bay (Nitsche et al., 2013; Graham et al., 2016a), Marguerite Bay (Livingstone et al., 2013) or the Antarctic Peninsula (Larter et al., 2019). This transition in basal properties would have affected the palaeo-thermal regime and ice-flow regime, as ice-stream flow accelerates at the transition from crystalline to sedimentary substrate (e.g. Wellner et al., 2001; Ó Cofaigh et al., 2002; Lowe and Anderson, 2003; Siegert et al., 2005; Benn and Evans, 2010). Therefore, it provides evidence for the further interpretation of landforms identified in the seismic data.
5.2.1 Subglacial till
We interpret the 13 to 45 m thick seismic unit that overlays truncated dipping reflectors across much of the outer ice shelf cavity (Fig. 4a, b–d) as a subglacial till. This sedimentary material is commonly observed below ice sheets and glaciers. For example, studies on the Marguerite Trough show sediment thicknesses reaching 15 m (Ó Cofaigh et al., 2002) and 20 m (Dowdeswell et al., 2004), both similar to the minimal thicknesses seen in our study. In the Ross Sea, Shipp et al. (1999) describe a 2 to 9 m thick transparent drape unit, and Karl et al. (1987) interpreted an up to 40 m thick overlying layer to be basal till. Basal tills may show MSGLs (e.g. Ó Cofaigh et al., 2002; Dowdeswell et al., 2004), but since the resolution and line spacing of the used seismic data are not sufficient to image MSGLs of the dimensions seen in front of the ice shelf, a presence of MSGLs below the shelf ice cannot be detected.
Downstream (north) of the outcropping Explora Wedge, on the sub-ice-shelf trough margin, a horizontal layered deposit is present at the sea floor (Fig. 5). It has two clear layers, which can be distinguished from each other (overview in Fig. 5a and e–f, pink and dark pink). As described in Sect. 4.2.1, the top layer is thicker than the bottom layer and covers a larger spatial extent, pinching out against the trough flanks. An interpretation as subglacial till would also be reasonable in this area, since the location and sediment thickness are consistent with previous findings of such features (e.g. Engelhardt and Kamb, 1997; Tulaczyk et al., 1998; Ó Cofaigh et al., 2002; Dowdeswell et al., 2004; Epshtein, 2017; Lowe and Anderson, 2003).
The two distinct layers could be the result of a rapid ice-sheet retreat without major erosion, preserving the bottom layer and subsequent readvance, forming the upper layer. This would also fit with the well-preserved MSGLs imaged in the marine geophysical data on the continental shelf. Although it should be acknowledged that the fresh-looking MSGLs could also be due to the removal of loose sediments by water flow beneath the ice shelf (Klages et al., 2017).
Schannwell et al. (2020) simulated an idealised advance and retreat history of the grounding line of the EIS embayment over a 40 000-year cycle; however, there is no evidence to narrow down the timing between retreat and readvance. The simulations used a variety of bed conditions and showed that with both hard and soft beds there were three periods of grounding line stillstand during advance and one in the retreat phase. However, the situation is likely more complex than simulated by Schannwell et al. (2020), as our investigations have revealed a change in bed conditions 150 km from the grounding line, rather than a purely hard or soft bed, which has not been considered in the simulations so far. In general, short periods of readvance after groundling line stillstand are conceivable at the EIS embayment, as ice sheets in the Weddell Sea are discussed to have undergone several readvances (Davies et al., 2012, and references therein). An alternative scenario is that the lower layer originates from an earlier glaciation. However, this interpretation will remain ambiguous without age estimates from cores.
5.2.2 Bumps in subglacial till
The landforms we have called bumps (Fig. 4e–i) occur in an area of the plateau where subglacial till is present. The asymmetric form of the bumps imaged by seismic lines along the ice-flow direction with a steep flank facing the ice and a shallower ice-distal flank (Fig. 4e, f, h), as well as their dimensions to some extent, resembles the shape of drumlin or drumlinoid landforms. These landforms are generated under fast-flowing ice conditions below glaciers or ice streams by erosion, mobilisation or deposition of sediment (e.g. Clark, 1993; Smith et al., 2007; Graham et al., 2009). The more symmetrical shape of the bumps revealed by the across-flow profiles (Fig. 4g, i) may support an interpretation as drumlins. If we assume the along-flow and across-flow lines are cutting a family of such features orthogonally, then the heights and lengths of these features are within typical ranges for drumlinoids (Clark et al., 2009). Compared to Clark et al. (2009), the feature in Fig. 4i is within the range for the typical width of a drumlinoid; however the landform in Fig. 4g is wider than an expected width of 1500 m. However, compared to the work of Ely et al. (2016), who investigated the shape and size of subglacial bedforms in some locations of the Northern Hemisphere, the width of the feature in Fig. 4g fits to their reported width range of 1510 m for drumlins.
For past ice flow we expect that thickest and fastest-flowing part of the ice sheet was in the area of the main trough. The plateau area is outside of this area and was thus subject to thinner and slower-flowing ice than in the main trough. However, the plateau is largely at a similar depth to the area of sea floor on the continental shelf, where MSGLs have been identified from marine geophysical data. MSGLs provide evidence for fast palaeo-ice-flow velocities (Sect. 4.1.2) and suggest fast ice flow was possible in these shallower areas. We also interpret the plateau area to be covered by subglacial till (Sect. 4.2.1), providing a source of material for drumlin formation. The presence of MSGLs already implies the presence of a till.
Drumlinoid landforms in the western Amundsen Sea Embayment (Klages et al., 2015) were found to be preferentially formed at the transition between soft and more resistant bedrock (Wellner et al., 2001), and the bumps we observe in our survey are around 15 to 20 km downstream of the proposed bed–material divide of the Explora Wedge outcrop. Based on the limited seismic data coverage, an unambiguous classification of these features as drumlinoids cannot be made at this stage. However, we conclude that these features are likely to be formed by subglacial sediment moulded by fast-flowing ice.
5.2.3 Hummocky landforms in bedrock
An unambiguous interpretation of the hummocky landforms, identified in the centre of the subglacial trough upstream of the Explora Wedge outcrop, was not possible. However, some of these landforms appear to have an asymmetrical form with steeper ice-facing side (see Fig. 6a–d). This shape may be comparable to landforms formed in resistant bedrock by continuous erosion by ice streaming, e.g. crag and tails or whalebacks. Crag and tails have been found around Antarctica mainly occurring in the centre of sub-ice-shelf troughs in resistant bedrock, e.g. by Graham et al. (2009) in the Getz A/Dotson trough and Nitsche et al. (2013) in Pine Island Bay. Whalebacks have been identified for example in crystalline bedrock in the inner- or midshelf of Marguerite Bay, Antarctica (Livingstone et al., 2013), and in British Columbia, Canada (Evans, 1996). These landforms are also formed in fast-ice-flow environments (Evans, 1996; Roberts and Long, 2005). While the setting of these landforms is consistent with the setting inferred for the region in which the hummocky landforms occur at the EIS, meaning harder bed material upstream of the Explora Wedge and ice stream activity, and the general shape may be roughly similar to crag and tails or whalebacks, there is insufficient evidence to classify these landforms unambiguously as such.
5.2.4 U-shaped depressions
The U-shaped depressions at the trough margin (Fig. 6a, e, f) have comparable dimensions to meltwater channels discovered in Marguerite Bay (300–500 m wide, 30–200 m deep, Livingstone et al., 2013) and Pine Island Bay (1–2 km wide, 200–400m deep, Nitsche et al., 2013). These channels are interpreted to have formed by meltwater erosion into hard substrate at the ice-sheet base (Wellner et al., 2001). The depressions cannot be tracked over a larger area in our data set, which is why their interpretation as meltwater channels remains tentative and needs to be confirmed by more detailed surveys. The absence of meltwater flow paths in the swath bathymetry data might also be a result of a diffuse flow in subglacial till, which was already assumed in the Marguerite Trough (Dowdeswell et al., 2004). Another possible explanation might be that these deepenings did not originate from meltwater discharge, but from erosion of softer material by the ice-stream base, probably along tectonically derived pre-existing fault lines.
5.3 Assessment of sub-ice-shelf seismic data for the interpretation of glacial landforms
The on-ice reflection seismic surveys on EIS provide crucial data on the previously unknown bed character, sub-bottom geometry and sea floor features. Our geomorphological interpretation infers a range of landforms and sub-bottom structures that provide insights into the glacial history of this area. However, it also demonstrates the uncertainties this method has for revealing glacial geomorphological structures. The seismic data proved to be especially capable of revealing sub-sea-floor features. For example, they allowed us to reveal that a large area is covered by two seismic units that we interpreted as subglacial till on top of dipping sediments, which likely were truncated by glacial overriding. In addition, the seismic data were capable of showing differences in the sea floor roughness beneath the ice shelf, which, according to numerical ice-flow modelling, was important for the Ekström palaeo-ice-stream system (Schannwell et al., 2020).
The capability of this methodology for classical sea floor geomorphology interpretation, however, is limited due to the low data density, especially in direct comparison to swath bathymetry data. The majority of the smaller landforms imaged are crossed by only one seismic line either across or along the predominant ice-flow direction. Therefore, it is not possible to determine the exact 3D shape of these landforms, and neither their orientation nor their extent could be finally resolved. In our case, this short-coming could be overcome to some extent by the availability of marine geophysical data directly offshore of the calving front. These data provided a reference setting for the ice shelf cavity by verifying the presence of a palaeo-ice stream in the Ekström Trough through the mapping of MSGLs. Landform classification and mapping with on-ice seismic data cannot be done to the same level of certainty as with marine geophysical methods which have the advantage of a much higher resolution, capable of also detecting small-scale landforms.
The seismic data used here were originally acquired to image deeper geological stratigraphy, and their use in this near-surface sea floor study was somewhat opportunistic. In the future the use of on-ice seismic surveying for similar studies should not be ruled out. However, it certainly is more effective if combined with higher-resolution geomorphological mapping, e.g. using vessels in front of the ice shelves and at least some AUV dives in the cavity if possible. This would also enable seismic surveys to be targeted at features of interest, where the deeper penetration of seismic imaging would be of particular use. Nevertheless, the collection of on-ice seismic data proved to be a cheaper methodology to collect at least basic sea floor depth information in comparison to using an AUV, which in addition is at risk of being lost during a dive. Therefore, we conclude that this methodology is worth applying and developing further to extend our understanding of the most inaccessible and least surveyed parts of Antarctica. This is especially true for the Dronning Maud Land, where the continental shelf is narrow and nearly entirely covered by ice shelves, strongly limiting marine geophysical data acquisition.
5.4 Implications for future investigations
A general challenge of the Antarctic geoscience community is to quantify the LGM ice mass budget and post-LGM mass loss, which reveals past ice-sheet variability and the Antarctic Ice Sheet contribution to post-LGM sea level rise. Our findings here can be used to determine and evaluate boundary conditions for palaeo-ice-flow models of this wider region in this relatively poorly investigated sector of East Antarctica, allowing us to understand and simulate future behaviour of the ice shelves more reliably. Our results contribute to the solution of those challenges along two lines. Firstly, we provide new observational evidence. The EIS is a typical ice shelf of the wDML region (Neckel et al., 2012). Although it appears that adjacent ice shelves within Antarctica behave differently, the neighbouring ice shelves of EIS have a similar narrow continental shelf and are also underlain by incised troughs (Eisermann et al., 2020; Nøst, 2004; Favier et al., 2016), which may result in similar palaeo-ice thickness, retreat and advance styles. Relatively warm Circumpolar Deep Water masses have a significant influence on ice shelf variability (e.g. Jacobs et al., 1996, 2011; Hillenbrand et al., 2017; Paolo et al., 2015; Hattermann, 2018). However, as assumed for the neighbouring Fimbul Ice Shelf (Hattermann et al., 2014) as well as for the EIS (Smith et al., 2020), these warm water masses enter the cavity below the ice shelf only in relatively small amounts. Further evidence for the variability in the geological past with samples were collected during the Polarstern expedition EASI-1 in 2022 (Tiedemann and Müller, 2021). Secondly, we combined results from different geophysical observation methodologies in open water and underneath the ice shelf. Although observations from underneath a single ice shelf with reflection seismic approaches have their limitations (see Sect. 5.3), they nevertheless provide both insights into the sea floor properties and stratigraphy as well as valuable complementary information about sea floor geomorphology. Future reflection seismic deployment, e.g. as envisaged for the pre-site surveys of the SWAIS-2C drilling (Patterson et al., 2022) underneath the Ross Ice Shelf, can thus be optimised to not only profile sub-sea-floor stratigraphy but also consider better retrieval of geomorphology. At the same time, we showed the limitations of that approach, thus avoiding any false expectations.
We have identified a diverse range of landforms beneath and in front of the EIS using a combination of geophysical methods: swath bathymetry, sub-bottom profiler and seismic reflection data. The survey area is characterised by a deep trough running from the modern-day grounding line under the ice shelf and onto the continental shelf in front. At the trough mouth we have identified MSGLs, confirming that this trough was likely occupied by a palaeo-ice stream. The MSGLs stop around 11 km from the continental shelf break, which suggests this was most likely the minimum grounded ice extent during the most recent glaciation. We therefore present the first geomorphological evidence for LGM ice-sheet advance reaching the continental shelf break in this sector of Antarctica. Beneath the ice shelf, a sediment unit up to 45 m thick, covering much of the survey area and interpreted as subglacial till, adds evidence that this area was indeed covered by ice for some considerable time.
We have found sparse evidence to classify the ice retreat style in this area, but a lack of overprinting of the MSGLs suggests the ice initially retreated rapidly from the outer shelf (Shipp et al., 1999; Dowdeswell et al., 2004; Mosola and Anderson, 2006; Ó Cofaigh and Stokes, 2008). At the eastern edge of the survey area, where the sea floor is shallow and thus palaeo-ice thickness was likely less, we have evidence of a slower, periodic ice retreat, recorded by a series of moraines. Further inland, it was not possible to robustly classify glacial landforms using on-ice reflection seismic data, and thus the ice retreat style further inland remains unclear. However, we do note a transition between smoother and rougher sea floor, which will have influenced palaeo-ice dynamics in the area, since ice-flow velocities are higher on sedimentary substrate than on crystalline bedrock (e.g. Wellner et al., 2001; Ó Cofaigh et al., 2002; Lowe and Anderson, 2003; Siegert et al., 2005; Benn and Evans, 2010). Depressions are present at the trough margins, which potentially suggest more intense meltwater flow at some point in the past. Since there is no indication of meltwater discharge in the swath bathymetry data, it is possible, as already assumed in the Marguerite Trough, that the water follows a diffuse path in the subglacial till (Dowdeswell et al., 2004).
Based on iceberg ploughmarks and sea level reconstructions, we estimate that the ice thickness at the calving front in the Ekström Trough was ∼305 to 320 m at the time of calving between LGM and 10 ka BP (see Supplement S2 for calculations).
Methodologically, we also tested the approach of using seismic reflection data in combination with marine geophysical data, to obtain information about the sea floor and near-surface sea floor beneath the EIS. Our results show that the combined methods allow a fairly good classification of the landforms in their glacio-geological context and give important geomorphological information, such as the presence of medium- to large-scale landforms, hard or soft bedrock, and sea bed roughness. Hence, these methods are suitable for providing crucial constraints for palaeo-ice-flow models and the evaluation of their performances.
References to the data repositories for the different expeditions can be found in the Supplement S1 – Marine geophysical data acquisition parameters. The seismic bathymetry grid and point measurements of the sea floor depth along the seismic lines can be found in https://doi.org/10.1594/PANGAEA.907951 (Smith et al., 2019) and https://doi.org/10.1594/PANGAEA.931928 (Smith et al., 2021).
The supplement related to this article is available online at: https://doi.org/10.5194/tc-16-2051-2022-supplement.
All authors contributed to discussion of the manuscript and data interpretation and contributed comments toward the final version. AO designed and wrote the bulk of the paper, mapped geomorphological features and interpreted these. ECS, OE and JEA contributed text to sections of the paper and edited the manuscript. ECS additionally performed seismic data acquisition, processing and mapping of the volcanic Explora Wedge. AsL and CM performed seismic data acquisition. CH was in charge of the seismic equipment. OE coordinated, implemented and conducted the seismic fieldwork. JEA and BD led the acquisition and processing of marine geophysical data and together with JPK interpreted the data. RD and TAE provided discussion on data interpretation based on regional ice-flow modelling results. GK, CG, AnL, RT, FW and OE are co-PIs on the project that supplied the seismic data.
At least one of the (co-)authors is a member of the editorial board of The Cryosphere.
Publisher's note: Copernicus Publications remains neutral with regard to jurisdictional claims in published maps and institutional affiliations.
This article is part of the special issue “The Weddell Sea and the ocean off Dronning Maud Land: unique oceanographic conditions shape circumpolar and global processes – a multi-disciplinary study (OS/BG/TC inter-journal SI)”. It is not associated with a conference.
All data were collected and provided by the Alfred Wegener Institute, Helmholtz Centre for Polar and Marine Research (AWI) and campaign partners, Federal Institute for Geoscience and Natural Resources (Bundesanstalt für Geowissenschaften und Rohstoffe, BGR) and Bavarian Academy of Science and Humanities, Geodesy and Glaciology. This research is a contribution to the SCAR program Instabilities and Thresholds in Antarctica: The Antarctic contribution to Sea Level Change. We thank all captains, crews and scientists on board the RV Polarstern that enabled acquisition of the marine data used in this study. The authors would like to thank Emerson E&P Software, Emerson Automation Solutions, for providing licenses for the seismic software Paradigm, in the scope of the Emerson Academic Program.
Fieldwork and data processing by ECS since 2016 were funded through the AWI-BGR Sub-EIS-Obs project. ECS was additionally partly funded through the DFG COST-S2S project grant EI672/10-1 in the framework of the priority program “Antarctic Research with comparative investigations in Arctic ice areas”. Fieldwork was supported by the large-scale research infrastructure Neumayer III and Polarstern (Alfred-Wegener-Institut Helmholtz-Zentrum für Polar- und Meeresforschung, 2016, 2017). RD was supported by an Emmy Noether Grant of the Deutsche Forschungsgemeinschft (DR 822/3-1).
The article processing charges for this open-access publication were covered by the Alfred Wegener Institute, Helmholtz Centre for Polar and Marine Research (AWI).
This paper was edited by Laura de Steur and reviewed by two anonymous referees.
Alfred-Wegener-Institut Helmholtz-Zentrum für Polar- und Meeresforschung: Neumayer III and Kohnen Station in Antarctica operated by the Alfred Wegener Institute, Journal of large-scale research facilities, 2, A85, https://doi.org/10.17815/jlsrf-2-152, 2016. a
Alfred-Wegener-Institut Helmholtz-Zentrum für Polar- und Meeresforschung: Polar Research and Supply Vessel POLARSTERN Operated by the Alfred-Wegener-Institute, Journal of large-scale research facilities, 3, A119, https://doi.org/10.17815/jlsrf-3-163, 2017. a, b, c, d
Arndt, J. E. and Kuhn, G.: Profile of sediment echo sounding during POLARSTERN cruise PS96 (ANT-XXXI/2 FROSN) with links to ParaSound data files, PANGAEA [data set], https://doi.org/10.1594/PANGAEA.860442, 2016. a
Arndt, J. E., Schenke, H. W., Jakobsson, M., Nitsche, F.-O., Buys, G., Goleby, B., Rebesco, M., Bohoyo, F., Hong, J. K., Black, J., Greku, R., Udintsev, G. B., Barrios, F., Reynoso-Peralta, W., Taisei, M., and Wigley, R.: The International Bathymetric Chart of the Southern Ocean (IBCSO) Version 1.0–A new bathymetric compilation covering circum‐Antarctic waters, Geophys. Res. Lett., 40, 3111–3117, 2013. a, b, c, d
Arndt, J. E., Hillenbrand, C.-D., Grobe, H., Kuhn, G., and Wacker, L.: Evidence for a dynamic grounding line in outer Filchner Trough, Antarctica, until the early Holocene, Geology, 45, 1035–1038, https://doi.org/10.1130/G39398.1, 2017. a, b, c
Arndt, J. E., Larter, R. D., Hillenbrand, C.-D., Sørli, S. H., Forwick, M., Smith, J. A., and Wacker, L.: Past ice sheet–seabed interactions in the northeastern Weddell Sea embayment, Antarctica, The Cryosphere, 14, 2115–2135, https://doi.org/10.5194/tc-14-2115-2020, 2020. a, b
Benn, D. and Evans, D. J. A.: Glaciers and glaciation, 2nd Edition, Chapter 12, Landsystems and Palaeoglaciology, Routledge, 652 pp., 2010. a, b
Clark, C. D.: Mega-scale glacial lineations and cross-cutting ice-flow landforms, Earth Surf. Proc. Land., 18, 1–29, https://doi.org/10.1002/esp.3290180102, 1993. a, b
Clark, C. D., Hughes, A. L., Greenwood, S. L., Spagnolo, M., and Ng, F. S. L.: Size and shape characteristics of drumlins, derived from a large sample, and associated scaling laws, Quaternary Sci. Rev., 28, 677–692, https://doi.org/10.1016/j.quascirev.2008.08.035, 2009. a, b
Damaske, D. and Kuhn, G.: Profile of sediment echo sounding during POLARSTERN cruise PS82 (ANT-XXIX/9) with links to ParaSound data files, PANGAEA [data set], https://doi.org/10.1594/PANGAEA.837893, 2014. a
Davies, B., Hambrey, M., Smellie, J., Carrivick, J., and Glasser, N.: Antarctic Peninsula ice sheet evolution during the Cenozoic Era, Quaternary Sci. Rev., 31, 30–66, 2012. a
Davies, D., Bingham, R. G., Graham, A. G. C., Spagnolo, M., Dutrieux, P., Vaughan, D. G., Jenkins, A., and Nitsche, F. O.: High-resolution sub-ice-shelf seafloor records of twentieth century ungrounding and retreat of Pine Island Glacier, West Antarctica, J. Geophys. Res.-Earth, 122, 1698–1714, https://doi.org/10.1002/2017JF004311, 2017. a
Dowdeswell, J., Evans, J., Mugford, R., Griffiths, G., McPhail, S., Millard, N., Stevenson, P., Brandon, M., Banks, C., Heywood, K., Price, M., Dodd, P., Jenkins, A., Nicholls, K., Hayes, D., Abrahamsen, E., Tyler, P., Bett, B., Jones, D., Wadhams, P., Wilkinson, J., Stansfield, K., and Ackley, S.: Autonomous underwater vehicles (AUVs) and investigations of the ice–ocean interface in Antarctic and Arctic waters, J. Glaciol., 54, 661–672, https://doi.org/10.3189/002214308786570773, 2008. a
Dowdeswell, J. A., Ó Cofaigh, C., and Pudsey, C. J.: Thickness and extent of the subglacial till layer beneath an Antarctic paleo-ice stream, Geology, 32, 13–16, https://doi.org/10.1130/G19864.1, 2004. a, b, c, d, e, f, g
Eisen, O., Hofstede, C., Diez, A., Kristoffersen, Y., Lambrecht, A., Mayer, C., Blenkner, R., and Hilmarsson, S.: On-ice vibroseis and snowstreamer systems for geoscientific research, Polar Sci., 9, 51–65, https://doi.org/10.1016/j.polar.2014.10.003, 2015. a, b
Eisermann, H., Eagles, G., Ruppel, A., Smith, E. C., and Jokat, W.: Bathymetry beneath ice shelves of western Dronning Maud Land, East Antarctica, and implications on ice shelf stability, Geophys. Res. Lett., 47, e2019GL086724, https://doi.org/10.1029/2019GL086724, 2020. a, b, c, d, e, f, g
Ely, J., Clark, C., Spagnolo, M., Stokes, C., Greenwood, S., Hughes, A., Dunlop, P., and Hess, D.: Do subglacial bedforms comprise a size and shape continuum?, Geomorphology, 257, 108–119, 2016. a
Engelhardt, H. and Kamb, B.: Basal hydraulic system of a West Antarctic ice stream: constraints from borehole observations, J. Glaciol., 43, 207–230, https://doi.org/10.3189/S0022143000003166, 1997. a
Epshtein, O. G.: Basal (basic) moraines: Problem of the identification and principles of new classification, Lithol. Miner. Resour., 52, 125–146, https://doi.org/10.1134/s0024490217010023, 2017. a
Evans, I. S.: Abraded rock landforms (whalebacks) developed under ice streams in mountain areas, Ann. Glaciol., 22, 9–16, https://doi.org/10.3189/1996AoG22-1-9-16, 1996. a, b
Favier, L., Pattyn, F., Berger, S., and Drews, R.: Dynamic influence of pinning points on marine ice-sheet stability: a numerical study in Dronning Maud Land, East Antarctica, The Cryosphere, 10, 2623–2635, https://doi.org/10.5194/tc-10-2623-2016, 2016. a, b
Gales, J. A., Larter, R. D., and Leat, P. T.: Iceberg ploughmarks and associated sediment ridges on the southern Weddell Sea margin, edited by: Dowdeswell, J. A., Canals, M., Jakobsson, M., Todd, B. J., Dowdeswell, E. K., and Hogan, K., in: Atlas of submarine glacial landforms: modern, Quaternary and ancient. Geological Society, London, Memoirs, 46, 289–290, https://doi.org/10.1144/M46.11, 2016. a
Graham, A. G. C., Larter, R. D., Gohl, K., Hillenbrand, C.-D., Smith, J. A., and Kuhn, G.: Bedform signature of a West Antarctic palaeo-ice stream reveals a multi-temporal record of flow and substrate control, Quaternary Sci. Rev., 28, 2774–2793, https://doi.org/10.1016/j.quascirev.2009.07.003, 2009. a, b
Graham, A. G. C., Jakobsson, M., Nitsche, F. O., Larter, R. D., Anderson, J. B., Hillenbrand, C.-D., Gohl, K., Klages, J. P., Smith, J. A., and Jenkins, A.: Submarine glacial-landform distribution across the West Antarctic margin, from grounding line to slope: the Pine Island–Thwaites ice-stream system, edited by: Dowdeswell, J. A., Canals, M., Jakobsson, M., Todd, B. J., Dowdeswell, E. K., and Hogan, K., in: Atlas of submarine glacial landforms: modern, Quaternary and ancient. Geological Society, London, Memoirs, 46, 493–500, https://doi.org/10.1144/M46.173, 2016a. a, b
Graham, A. G. C., Nitsche, F. O., Larter, R. D., and Gohl, K.: Submarine landform assemblage produced beneath the Dotson-Getz palaeo-ice stream, West Antarctica, edited by: Dowdeswell, J. A., Canals, M., Jakobsson, M., Todd, B. J., Dowdeswell, E. K., and Hogan, K., in: Atlas of submarine glacial landforms: modern, Quaternary and ancient. Geological Society, London, Memoirs, 46, 345–348, https://doi.org/10.1144/M46.176, 2016b. a
Greenwood, S. L., Simkins, L. M., Halberstadt, A. R. W., Prothro, L. O., and Anderson, J. B.: Holocene reconfiguration and readvance of the East Antarctic Ice Sheet, Nat. Commun., 9, 1–12, 2018. a
Grobe, H. and Mackensen, A.: Late Quaternary climatic cycles as recorded in sediments from the Antarctic continental margin, in: Antarctic Research Series, 56, 349–376, https://doi.org/10.1029/AR056p0349, 1992. a, b
Hattermann, T.: Antarctic Thermocline Dynamics along a Narrow Shelf with Easterly Winds, J. Phys. Oceanogr., 48, 2419–2443, https://doi.org/10.1175/JPO-D-18-0064.1, 2018. a
Hattermann, T., Smedsrud, L. H., Nøst, O. A., Lilly, J. M., and Galton-Fenzi, B. K.: Eddy-resolving simulations of the Fimbul Ice Shelf cavity circulation: Basal melting and exchange with open ocean, Ocean Model., 82, 28–44, 2014. a
Hillenbrand, C.-D., Smith, J. A., Hodell, D. A., Greaves, M., Poole, C. R., Kender, S., Williams, M., Andersen, T. J., Jernas, P. E., Elderfield, H., Klages, J. P., Roberts, S. J., Gohl, K., Larter, R. D., and Kuhn, G.: West Antarctic Ice Sheet retreat driven by Holocene warm water incursions, Nature, 547, 43–48, 2017. a
Hodgson, D. A., Hogan, K., Smith, J. M., Smith, J. A., Hillenbrand, C.-D., Graham, A. G. C., Fretwell, P., Allen, C., Peck, V., Arndt, J.-E., Dorschel, B., Hübscher, C., Smith, A. M., and Larter, R.: Deglaciation and future stability of the Coats Land ice margin, Antarctica, The Cryosphere, 12, 2383–2399, https://doi.org/10.5194/tc-12-2383-2018, 2018. a
Hodgson, D. A., Jordan, T. A., De Rydt, J., Fretwell, P. T., Seddon, S. A., Becker, D., Hogan, K. A., Smith, A. M., and Vaughan, D. G.: Past and future dynamics of the Brunt Ice Shelf from seabed bathymetry and ice shelf geometry, The Cryosphere, 13, 545–556, https://doi.org/10.5194/tc-13-545-2019, 2019. a
Jacobs, S. S., Hellmer, H. H., and Jenkins, A.: Antarctic ice sheet melting in the Southeast Pacific, Geophys. Res. Lett., 23, 957–960, 1996. a
Jacobs, S. S., Jenkins, A., Giulivi, C. F., and Dutrieux, P.: Stronger ocean circulation and increased melting under Pine Island Glacier ice shelf, Nat. Geosci., 4, 519–523, 2011. a
Jakobsson, M., Anderson, J. B., Nitsche, F. O., Gyllencreutz, R., Kirshner, A. E., Kirchner, N., O'Regan, M., Mohammad, R., and Eriksson, B.: Ice sheet retreat dynamics inferred from glacial morphology of the central Pine Island Bay Trough, West Antarctica, Quaternary Sci. Rev., 38, 1–10, https://doi.org/10.1016/j.quascirev.2011.12.017, 2012. a
Jenkins, A., Dutrieux, P., Jacobs, S. S., McPhail, S. D., Perrett, J. R., Webb, A. T., and White, D.: Observations beneath Pine Island Glacier in West Antarctica and implications for its retreat, Nat. Geosci., 3, 468–472, 2010. a
Karl, H., Reimnitz, E., and Edwards, B.: Extent and nature of Ross Sea unconformity in the western Ross Sea, Antarctica, in: The Antarctic Continental Margin: Geology and Geophysics of Western Ross Sea, Earth Sci. Ser., Volume 5B, edited by: Cooper, A. K. and Davey, F. J., Circum-Pacific Councel for Energy and Mineral Resources, Houston, Texas, 77–92, 1987. a
King, E. C., Hindmarsh, R. C. A., and Stokes, C. R.: Formation of mega-scale glacial lineations observed beneath a West Antarctic ice stream, Nat. Geosci., 2, 585–588, https://doi.org/10.1038/ngeo581, 2009. a
Klages, J. P., Kuhn, G., Graham, A. G. C., Hillenbrand, C. D., Smith, J. A., Nitsche, F. O., Larter, R. D., and Gohl, K.: Palaeo-ice stream pathways and retreat style in the easternmost Amundsen Sea Embayment, West Antarctica, revealed by combined multibeam bathymetric and seismic data, Geomorphology, 245, 207–222, https://doi.org/10.1016/j.geomorph.2015.05.020, 2015. a, b
Klages, J. P., Kuhn, G., Hillenbrand, C.-D., Smith, J. A., Graham, A. G. C., Nitsche, F. O., Frederichs, T., Jernas, P. E., Gohl, K., and Wacker, L.: Limited grounding-line advance onto the West Antarctic continental shelf in the easternmost Amundsen Sea Embayment during the last glacial period, Plos one, 12, e0181593, https://doi.org/10.1371/journal.pone.0181593, 2017. a
Knust, R.: Station list and links to master tracks in different resolutions of POLARSTERN cruise PS82 (ANT-XXIX/9), Cape Town – Cape Town, 2013-12-19 – 2014-03-05, PANGAEA [data set], https://doi.org/10.1594/PANGAEA.832168, 2014. a
Kristoffersen, Y., Hofstede, C., Diez, A., Blenkner, R., Lambrecht, A., and Mayer, C., and Eisen, O.: Reassembling Gondwana: A new high quality constraint from vibroseis exploration of the sub-ice shelf geology of the East Antarctic continental margin, J. Geophys. Res.-Sol. Ea., 119, 9171–9182, https://doi.org/10.1002/2014jb011479, 2014. a, b
Larter, R. D., Hogan, K. A., Hillenbrand, C.-D., Smith, J. A., Batchelor, C. L., Cartigny, M., Tate, A. J., Kirkham, J. D., Roseby, Z. A., Kuhn, G., Graham, A. G. C., and Dowdeswell, J. A.: Subglacial hydrological control on flow of an Antarctic Peninsula palaeo-ice stream, The Cryosphere, 13, 1583–1596, https://doi.org/10.5194/tc-13-1583-2019, 2019. a, b
Lavoie, C., Domack, E. W., Pettit, E. C., Scambos, T. A., Larter, R. D., Schenke, H.-W., Yoo, K. C., Gutt, J., Wellner, J., Canals, M., Anderson, J. B., and Amblas, D.: Configuration of the Northern Antarctic Peninsula Ice Sheet at LGM based on a new synthesis of seabed imagery, The Cryosphere, 9, 613–629, https://doi.org/10.5194/tc-9-613-2015, 2015. a
Lien, R., Solheim, A., Elverhøi, A., and Rokoengen, K.: Iceberg scouring and sea bed morphology on the eastern Weddell Sea shelf, Antarctica, Polar Res., 7, 43–57, https://doi.org/10.1111/j.1751-8369.1989.tb00603.x, 1989. a
Livingstone, S., Ó Cofaigh, C., Stokes, C. R., Hillenbrand, C.-D., Vieli, A., and Jamieson, S. S.: Glacial geomorphology of Marguerite Bay Palaeo-Ice stream, western Antarctic Peninsula, J. Maps, 9, 558–572, https://doi.org/10.1080/17445647.2013.829411, 2013. a, b, c
Livingstone, S. J., Ó Cofaigh, C., Stokes, C. R., Hillenbrand, C.-D., Vieli, A., and Jamieson, S. S. R.: Antarctic palaeo-ice streams, Earth-Sci. Rev., 111, 90–128, https://doi.org/10.1016/j.earscirev.2011.10.003, 2012. a, b
Lowe, A. L. and Anderson, J. B.: Evidence for abundant subglacial meltwater beneath the paleo-ice sheet in Pine Island Bay, Antarctica, J. Glaciol., 49, 125–138, https://doi.org/10.3189/172756503781830971, 2003. a, b, c
Mackintosh, A., Golledge, N., Domack, E., Dunbar, R., Leventer, A., White, D., Pollard, D., DeConto, R., Fink, D., Zwartz, D., Gore, D., and Lavoie, C.: Retreat of the East Antarctic ice sheet during the last glacial termination, Nat. Geosci., 4, 195–202, 2011. a
Mosola, A. B. and Anderson, J. B.: Expansion and rapid retreat of the West Antarctic Ice Sheet in eastern Ross Sea: possible consequence of over-extended ice streams?, Quaternary Sci. Rev., 25, 2177–2196, https://doi.org/10.1016/j.quascirev.2005.12.013, 2006. a
Neckel, N., Drews, R., Rack, W., and Steinhage, D.: Basal melting at the Ekström Ice Shelf, Antarctica, estimated from mass flux divergence, Ann. Glaciol., 53, 294–302, https://doi.org/10.3189/2012AoG60A167, 2012. a, b
Nicholls, K. W., Abrahamsen, E. P., Buck, J. J. H., Dodd, P. A., Goldblatt, C., Griffiths, G., Heywood, K. J., Hughes, N. E., Kaletzky, A., Lane-Serff, G. F., McPhail, S. D., Millard, N. W., Oliver, K. I. C., Perrett, J., Price, M. R., Pudsey, C. J., Saw, K., Stansfield, K., Stott, M. J., Wadhams, P., Webb, A. T., and Wilkinson, J. P.: Measurements beneath an Antarctic ice shelf using an autonomous underwater vehicle, Geophys. Res. Lett., 33, L08612, https://doi.org/10.1029/2006GL025998, 2006. a
Nitsche, F. O., Gohl, K., Larter, R. D., Hillenbrand, C.-D., Kuhn, G., Smith, J. A., Jacobs, S., Anderson, J. B., and Jakobsson, M.: Paleo ice flow and subglacial meltwater dynamics in Pine Island Bay, West Antarctica, The Cryosphere, 7, 249–262, https://doi.org/10.5194/tc-7-249-2013, 2013. a, b, c
Nøst, O. A.: Measurements of ice thickness and seabed topography under the Fimbul Ice Shelf, Dronning Maud Land, Antarctica, J. Geophys. Res.-Oceans, 109, C10, https://doi.org/10.1029/2004JC002277, 2004. a, b, c
Ó Cofaigh, C. and Stokes, C. R.: Reconstructing ice-sheet dynamics from subglacial sediments and landforms: introduction and overview, Earth Surf. Proc. Land., 33, 495–502, https://doi.org/10.1002/esp.1672, 2008. a
Ó Cofaigh, C., Pudsey, C. J., Dowdeswell, J. A., and Morris, P.: Evolution of subglacial bedforms along a paleo-ice stream, Antarctic Peninsula continental shelf, Geophys. Res. Lett., 29, 41-1–41-4, https://doi.org/10.1029/2001GL014488, 2002. a, b, c, d, e, f, g
Ó Cofaigh, C., Dowdeswell, J. A., Allen, C. S., Hiemstra, J. F., Pudsey, C. J., Evans, J., and Evans, D.: Flow dynamics and till genesis associated with a marine-based Antarctic palaeo-ice stream, Quaternary Sci. Rev., 24, 709–740, https://doi.org/10.1016/j.quascirev.2004.10.006, 2005. a
Paolo, F. S., Fricker, H. A., and Padman, L.: Volume loss from Antarctic ice shelves is accelerating, Science, 348, 327–331, 2015. a
Patterson, M. O., Levy, R. H., Kulhanek, D. K., van de Flierdt, T., Horgan, H., Dunbar, G. B., Naish, T. R., Ash, J., Pyne, A., Mandeno, D., Winberry, P., Harwood, D. M., Florindo, F., Jimenez-Espejo, F. J., Läufer, A., Yoo, K.-C., Seki, O., Stocchi, P., Klages, J. P., Lee, J. I., Colleoni, F., Suganuma, Y., Gasson, E., Ohneiser, C., Flores, J.-A., Try, D., Kirkman, R., Koch, D., and the SWAIS 2C Science Team: Sensitivity of the West Antarctic Ice Sheet to +2 °C (SWAIS 2C), Sci. Dril., 30, 101–112, https://doi.org/10.5194/sd-30-101-2022, 2022. a
Rignot, E., Jacobs, S., Mouginot, J., and Scheuchl, B.: Ice-Shelf Melting Around Antarctica, Science, 341, 266–270, https://doi.org/10.1126/science.1235798, 2013. a
Roberts, D. H. and Long, A. J.: Streamlined bedrock terrain and fast ice flow, Jakobshavns Isbrae, West Greenland: implications for ice stream and ice sheet dynamics, Boreas, 34, 25–42, https://doi.org/10.1111/j.1502-3885.2005.tb01002.x, 2005. a
Schannwell, C., Drews, R., Ehlers, T. A., Eisen, O., Mayer, C., Malinen, M., Smith, E. C., and Eisermann, H.: Quantifying the effect of ocean bed properties on ice sheet geometry over 40 000 years with a full-Stokes model, The Cryosphere, 14, 3917–3934, https://doi.org/10.5194/tc-14-3917-2020, 2020. a, b, c, d, e, f
Schröder, M.: Station list and links to master tracks in different resolutions of POLARSTERN cruise PS96 (ANT-XXXI/2 FROSN), Cape Town – Punta Arenas, 2015-12-06 – 2016-02-14, PANGAEA [data set], https://doi.org/10.1594/PANGAEA.859021, 2016. a
Shipp, S., Anderson, J., and Domack, E.: Late Pleistocene–Holocene retreat of the West Antarctic Ice-Sheet system in the Ross Sea: part 1–geophysical results, Geol. Soc. Am. Bull., 111, 1486–1516, 1999. a, b
Siegert, M. J., Taylor, J., and Payne, A. J.: Spectral roughness of subglacial topography and implications for former ice-sheet dynamics in East Antarctica, Global Planet. Change, 45, 249–263, https://doi.org/10.1016/j.gloplacha.2004.09.008, 2005. a, b
Simkins, L. M., Anderson, J. B., and Greenwood, S. L.: Glacial landform assemblage reveals complex retreat of grounded ice in the Ross Sea, Antarctica, edited by: Dowdeswell, J. A., Canals, M., Jakobsson, M., Todd, B. J., Dowdeswell, E. K., and Hogan, K., in: Atlas of submarine glacial landforms: modern, Quaternary and ancient. Geological Society, London, Memoirs, 46, 353–356, https://doi.org/10.1144/M46.168, 2016. a
Smith, A., Murray, T., Nicholls, K., Makinson, K., Adalgeirsdóttir, G., Behar, A., and Vaughan, D.: Rapid erosion, drumlin formation, and changing hydrology beneath an Antarctic ice stream, Geology, 35, 127, https://doi.org/10.1130/g23036a.1, 2007. a
Smith, E. C., Kuhn, G., Gaedicke, C., Drews, R., Ehlers, T. A., Franke, D., Hofstede, C. M., Lambrecht, A., Läufer, A., Mayer, C., Tiedemann, R., and Eisen, O.: Sea floor bathymetry under Ekström Ice Shelf, Antarctica, from a compilation of seismic vibroseis data, https://doi.org/10.1594/PANGAEA.907951, PANGAEA [data set], 2019. a
Smith, E. C., Hattermann, T., Kuhn, G., Gaedicke, C., Berger, S., Drews, R., Ehlers, T. A., Franke, D., Gromig, R., Hofstede, C., Lambrecht, A., Läufer, A., Mayer, C., Tiedemann, R., Wilhelms, F., and Eisen, O.: Detailed seismic bathymetry beneath Ekström Ice Shelf, Antarctica: Implications for glacial history and ice-ocean interaction, Geophys. Res. Lett., 47, e2019GL086187, https://doi.org/10.1029/2019GL086187, 2020. a, b, c, d, e, f, g, h, i, j, k
Smith, E. C., Kuhn, G., Gaedicke, C., Drews, R., Ehlers, T. A., Franke, D., Hofstede, C. M., Lambrecht, A., Läufer, A., Mayer, C., Tiedemann, R., and Eisen, O.: Sea floor depth under Ekström Ice Shelf, Antarctica, from seismic vibroseis surveys 2010–2018, https://doi.org/10.1594/PANGAEA.931928, PANGAEA [data set], 2021. a
Stokes, C. R. and Clark, C. D.: Geomorphological criteria for identifying Pleistocene ice streams, Ann. Glaciol., 28, 67–74, https://doi.org/10.3189/172756499781821625, 1999. a
Stuart, K. and Long, D.: Tracking large tabular icebergs using the SeaWinds Ku-band microwave scatterometer, Deep-Sea Res. Pt. II, 58, 1285–1300, https://doi.org/10.1016/j.dsr2.2010.11.004, 2011. a
Tiedemann, R. and Müller, J.: Expedition Programme PS128, Expedition Programme PS128, Bremerhaven, Alfred Wegener Institute for Polar and Marine Research, 34 p., 2021. a
Tulaczyk, S., Kamb, B., Scherer, R. P., and Engelhardt, H. F.: Sedimentary processes at the base of a West Antarctic ice stream; constraints from textural and compositional properties of subglacial debris, J. Sediment. Res., 68, 487–496, https://doi.org/10.2110/jsr.68.487, 1998. a
Wellner, J. S., Lowe, A. L., Shipp, S. S., and Anderson, J. B.: Distribution of glacial geomorphic features on the Antarctic continental shelf and correlation with substrate: implications for ice behavior, J. Glaciol., 47, 397–411, https://doi.org/10.3189/172756501781832043, 2001. a, b, c, d
Winkelmann, D., Jokat, W., Jensen, L., and Schenke, H.-W.: Submarine end moraines on the continental shelf off NE Greenland – Implications for Lateglacial dynamics, Quaternary Sci. Rev., 29, 1069–1077, https://doi.org/10.1016/j.quascirev.2010.02.002, 2010. a, b