the Creative Commons Attribution 4.0 License.
the Creative Commons Attribution 4.0 License.
 | 20 Apr 2022
Land–atmosphere interactions in sub-polar and alpine climates in the CORDEX Flagship Pilot Study Land Use and Climate Across Scales (LUCAS) models – Part 2: The role of changing vegetation
Priscilla A. Mooney
Diana Rechid
Edouard L. Davin
Eleni Katragkou
Natalie de Noblet-Ducoudré
Marcus Breil
Rita M. Cardoso
Anne Sophie Daloz
Peter Hoffmann
Daniela C. A. Lima
Ronny Meier
Pedro M. M. Soares
Giannis Sofiadis
Susanna Strada
Gustav Strandberg
Merja H. Toelle
Marianne T. Lund
Land cover in sub-polar and alpine regions of northern and eastern Europe have already begun changing due to natural and anthropogenic changes such as afforestation. This will impact the regional climate and hydrology upon which societies in these regions are highly reliant. This study aims to identify the impacts of afforestation/reforestation (hereafter afforestation) on snow and the snow-albedo effect and highlight potential improvements for future model development. The study uses an ensemble of nine regional climate models for two different idealised experiments covering a 30-year period; one experiment replaces most land cover in Europe with forest, while the other experiment replaces all forested areas with grass. The ensemble consists of nine regional climate models composed of different combinations of five regional atmospheric models and six land surface models. Results show that afforestation reduces the snow-albedo sensitivity index and enhances snowmelt. While the direction of change is robustly modelled, there is still uncertainty in the magnitude of change. The greatest differences between models emerge in the snowmelt season. One regional climate model uses different land surface models which shows consistent changes between the three simulations during the accumulation period but differs in the snowmelt season. Together these results point to the need for further model development in representing both grass–snow and forest–snow interactions during the snowmelt season. Pathways to accomplishing this include (1) a more sophisticated representation of forest structure, (2) kilometre-scale simulations, and (3) more observational studies on vegetation–snow interactions in northern Europe.
- Article
(3131 KB) - Full-text XML
- Companion paper
- BibTeX
- EndNote


Interactions between the land surface and the atmosphere in sub-polar and alpine climates occur largely through the snow-albedo effect in winter and spring. These interactions strongly influence the regional climate, and any change to either land cover or snow cover in these regions will alter the regional climate (IPCC, 2019; Cherubini et al., 2018; Bender et al., 2020). Importantly, changes to the land surface, such as afforestation, also alter the snow cover (Mooney et al., 2021).
Land cover is undergoing rapid change in many parts of the world, including in the sub-polar and alpine regions. Some of this change is a natural response to climate change, e.g. forest fires (Wang et al., 2020) and “greening of the Arctic” (Myers-Smith et al., 2020). Other changes to the land surface are the result of more direct human influence such as afforestation (Mooney et al., 2021). The impact of these perturbations to the land surface on the regional climate and hydrology can have considerable consequences for society. In these regions, many communities rely on snow for water resources, tourism, energy, and recreation (Framstad et al., 2009; Duncker et al., 2012). They are also vulnerable to snow-related hazards such as flooding and avalanches (Abermann et al., 2019).
Many observation-based studies have assessed the impact of forests on snow accumulation and loss compared to open sites such as grasslands (e.g. Golding and Swanson, 1978; Essery et al., 2003; Varhola et al., 2010; Lundquist et al., 2013). These studies and references therein have shown that the impacts of forests on snow accumulation and ablation are dependent on vegetation structure, local climate, topography, and aspect. Forests can reduce snowpack compared to grasslands through canopy interception and emitting terrestrial infrared radiation. Conversely, forests can enhance snowpack by shading it from solar radiation and sheltering it from strong winds (Varhola et al., 2010).
One factor that influences the magnitude of snowpack reduction through canopy interception is forest density. For dense forests, canopy interception can lead to losses in snowpack that exceed 60 % of the total annual snowpack (Hedstrom and Pomeroy, 1998). This loss in snowpack during the accumulation period can be offset by the canopy's shading of the snowpack from solar radiation and strong winds in the snowmelt season if this is the dominant mechanism for snow loss (Lundquist et al., 2013). However, the loss of snowpack during the snowmelt season could be dominated by increased terrestrial infrared radiation instead if winter temperatures (December–January–February, DJF) exceed −1 ∘C (Lundquist et al., 2013).
Representing these highly complex interactions between forests and snow cover poses a challenge for both global and regional climate modelling (Mudryk et al., 2020). In regional climate models (RCMs), key processes for vegetation–snow interactions are simulated by both the atmospheric model and the land surface model (LSM). During the accumulation phase, atmospheric processes most strongly influence snowpack characteristics, but during the snowmelt season, land surface processes are most influential. Various studies (e.g. Essery et al., 2003; Mudryk et al., 2020; Mooney et al., 2020) have demonstrated that while climate models have become more sophisticated in their representation of vegetation–snow interactions and have improved in their ability to simulate snow cover, there are still deficiencies in the simulation of snow amount.
In Daloz et al. (2021; hereafter Part 1), we have shown that deficiencies in the simulation of the snow-albedo climate forcing, a key land–atmosphere interaction in sub-polar and alpine climates, are greatest during the snowmelt period for different regional climate models participating in the World Climate Research Programme's (WCRP) Coordinated Regional Climate Downscaling Experiment (CORDEX) Flagship Pilot Study (FPS) Land Use and Climate Across Scales (LUCAS; Rechid et al., 2017), hereafter called CORDEX FPS LUCAS.
These model deficiencies combined with limited observations means much remains unknown about the impact of afforestation on the regional climate system and snowpack characteristics in sub-polar and alpine climates of northern and eastern Europe. This study will address this issue and further focus future model development on vegetation–snow interactions using an ensemble of nine CORDEX FPS LUCAS simulations for two different and extreme land cover changes. While Part 1 used simulations with a realistic land cover map, this study (Part 2) uses simulations with idealised land cover maps that cover most of Europe with forest in one experiment and grass in the other.
The aims of this study are (1) to identify robust impacts of afforestation on the snow-albedo effect, snow variables, and a selection of societally relevant metrics and (2) to highlight required improvements for model development in these regions. This study is the first to investigate land–atmosphere interactions with a focus on snow variables in high-latitude regions by using an ensemble of regional climate models with idealised land cover scenarios specifically designed to assess the impact of afforestation in Europe. In doing so, this study will provide one of the most robust assessments of the impact of afforestation on snowpack in northern and eastern Europe to date. A description of the methodology can be found in the next section, and the results are presented in Sect. 3. These results are further discussed in Sect. 4, and the conclusions are presented in Sect. 5.
2.1 CORDEX FPS LUCAS experiments
Simulations in the CORDEX FPS LUCAS were performed for three different types of experiments: EVAL, FOREST, and GRASS. All simulations use a grid spacing of 0.44∘, cover the period 1986–2015, and use the standard EURO-CORDEX domain (Jacob et al., 2014). Boundary and initial conditions for all simulations were derived from the European Centre for Medium-Range Weather Forecasting's interim reanalysis (ERA-Interim; Dee et al., 2011). The difference between the EVAL, FOREST, and GRASS experiments lies in the land cover maps. Simulations for the EVAL experiment use the present-day land cover map specific to each regional climate model (RCM). The EVAL simulations are the control simulations and have been used to evaluate the performance of the different RCMs in Part 1 (Daloz et al., 2021) and by Davin et al. (2020) and Sofiadis et al. (2022). The FOREST and GRASS experiments, which are the focus of this paper, use idealised land cover maps (see Fig. 1 for an example) that are designed to represent the theoretical maximum of forest and grass coverage. These idealised land cover maps are derived from a MODIS-based present-day land cover map. From this map, the fractional coverage of forest is expanded until it covers 100 % of non-bare soil ground. The FOREST map conserves the ratio of tree types (i.e. broadleaf vs. needleleaf and deciduous vs. evergreen) found in the MODIS-based land cover map. The GRASS land cover map was developed in the same way as the FOREST land cover map. A more comprehensive description of the land cover maps and conversion rules can be found in Davin et al. (2020).
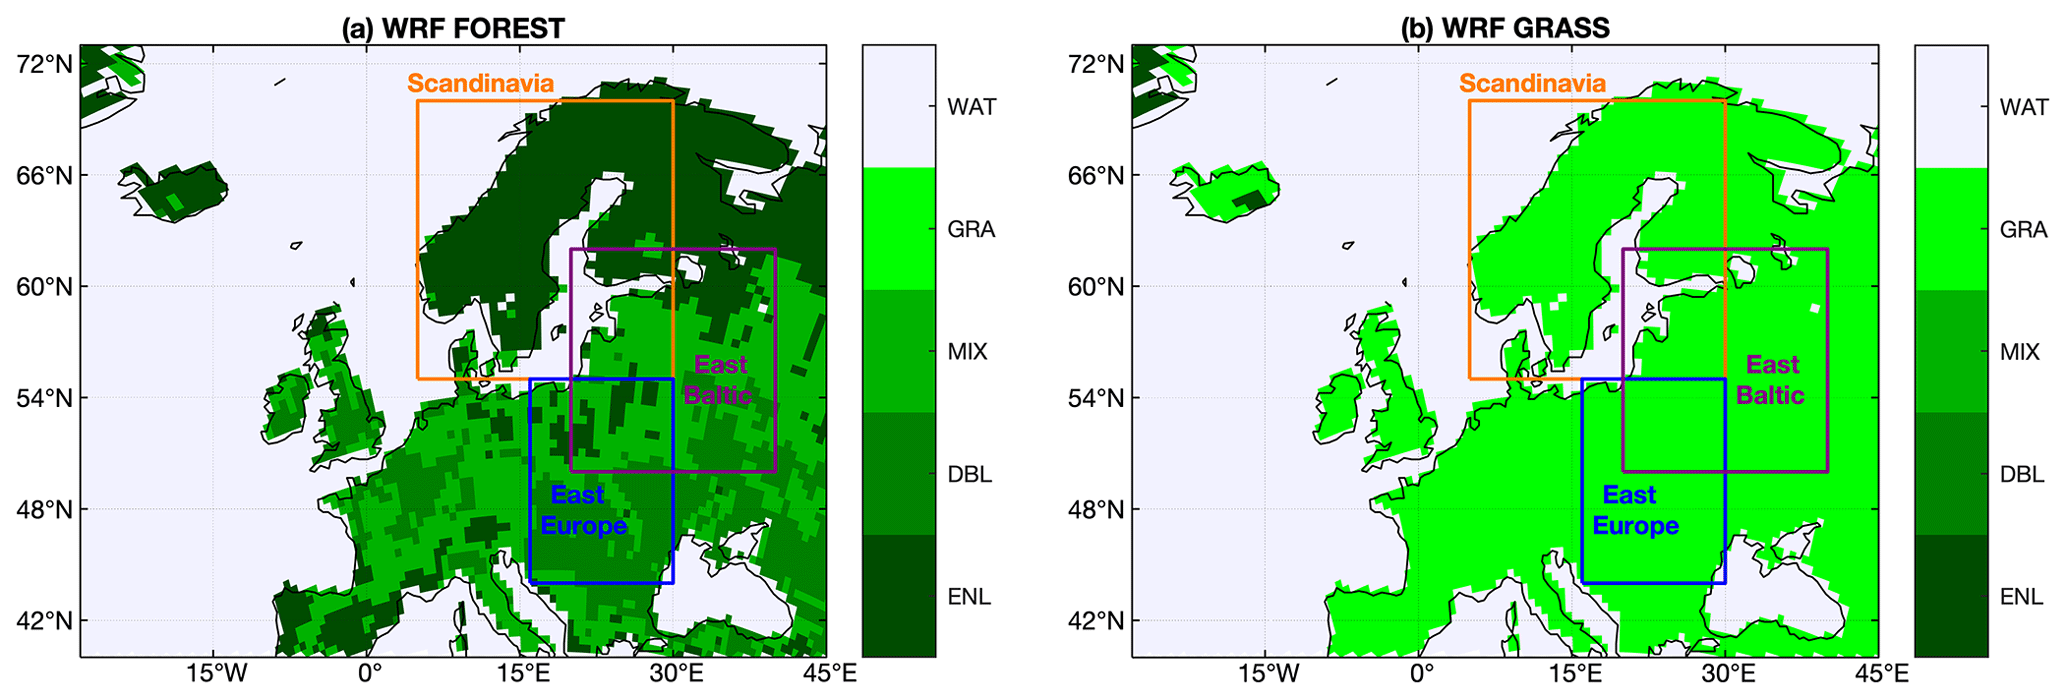
Figure 1The three regions considered in the analysis: Scandinavia, East Baltic, and East Europe. Also shown are the land cover maps for the FOREST and GRASS experiments. The colour bars indicate land cover type where WAT means water, GRA means grass, MIX means mixed forests, DBL means deciduous broadleaf, and ENL means evergreen needleleaf.
2.2 CORDEX FPS LUCAS models
This study uses nine RCMs composed of different combinations of five regional atmospheric models and six LSMs. The combinations are shown in Table 1, which also specifies the model versions, key references for each model, and their representation of vegetation–snow interactions. The ensemble consists of two regional models (WRF and CCLM; see Appendix A for unabbreviated model and institute names) that use multiple LSMs allowing for the analysis to isolate the impact of the LSMs on the results. Uniquely, the ensemble consists of two WRF–NoahMP simulations that differ only by their representation of convection and planetary boundary layer processes. Hereafter, each of these combinations will be considered as different RCMs, as they differ in the way they represent different atmospheric and land surface processes.
Data for all snow variables were available for WRFc–NoahMP, CCLM–CLM5.0, WRFa–NoahMP, RCA, and WRFb–CLM4.0. However, REMO–iMOVE, RegCMa–CLM4.5, and CCLM–TERRA did not have data for snow depth, while CCLM–VEG3D could only provide a binary number of 0 and 1 for the snow cover fraction. Snow depth for REMO–iMOVE, RegCMa–CLM4.5, and CCLM–TERRA was calculated from snow water equivalent using a constant value of 312 kg m−3 for the bulk density as described in Sturm et al. (2010).
Vegetation–snow interactions
Below we provide a short description of the vegetation–snow interactions in the different land surface models. A more comprehensive description for each model can be found in the references listed in Table 1 for each model.
Canopy interception. All models except RCA account for canopy interception of precipitation. WRFa–NoahMP, WRFc–NoahMP, CCLM–CLM5.0, CCLM–Veg3D, and REMO–iMOVE use a separate layer for the vegetation canopy, which allows for both liquid water and ice to be intercepted by the vegetation canopy. CCLM–TERRA also accounts for interception of rain and snow using separate reservoirs for each. While WRFb–CLM4.0 and RegCM-CLM4.5 also use a separate layer for the canopy, the interception of precipitation does not distinguish between rain and snow.
Turbulent transfer under canopy. In WRFa–NoahMP, WRFc–NoahMP, CCLM–Veg3D, CCLM–TERRA, and REMO–iMOVE, turbulent fluxes between snow, vegetation, and air use Monin–Obukhov similarity theory (MOST) stability functions to calculate aerodynamic resistance with respect to the displacement and roughness lengths of the canopy. In RCA4, turbulent transfer within the canopy layer is parameterised following Choudhury and Monteith (1988). The canopy air state is connected to the canopy itself and to the surface beneath the canopy with separate aerodynamic resistances, respectively. In WRFb–CCLM4.0, CCLM–CLM5.0, and RegCMa–CLM4.5, aerodynamic resistances to heat/moisture transfer between the ground and the canopy air account for the turbulent transfer via a coefficient that results from interpolation between values for dense canopy and bare soil (Zeng et al., 2005). The dense-canopy turbulent-transfer coefficient in Zeng et al. (2005) is modified from its original value of 0.004 to account for stability.
Radiative transfer. WRFa–NoahMP, WRFc–NoahMP, WRFb–CLM4.0, CCLM–CLM5.0, and RegCMa–CLM4.5 use the two-stream approximation of Dickinson (1983) and Sellers (1985) for radiative transfer within vegetation canopies. CCLM–Veg3D also uses a two-stream approach, but the radiative transfer is calculated after the approach of Ritter and Geleyn (1992). In RCA, the net radiation components are separated between the forest canopy and the forest floor. In this separation a sky view factor is applied which accounts for the degree of canopy closure (Verseghy et al., 1993), which is a function of leaf area index (LAI) only for terrestrial infrared and diffuse solar radiation. In CCLM–TERRA, the radiative transfer equations are calculated in terms of upward and downward fluxes based on the two-stream methods. Surface radiation fluxes depend on surface albedo and temperature.
In REMO–iMOVE, there is no direct canopy radiative transfer; land surface influence is calculated for visible and near-infrared through albedo changes.
Snow albedo. The surface albedo in WRFa–NoahMP, WRFc–NoahMP, and WRFb–CLM4.0 is a diagnostic produced from the ratio of total reflected solar radiation to total downward solar radiation. In RCA4, snow albedo for open-land snow is a prognostic variable, and the albedo for snow in the forest is set constant to 0.5. In CCLM–Veg3D, snow albedo is a prognostic quantity depending on the age of the snow. CCLM–TERRA has a time-dependent snow albedo introduced by an ageing function with pre-given maximum and minimum snow-albedo values which accounts for partial coverage of the soil surface by vegetation and snow for albedo. In REMO–iMOVE, the snow albedo is calculated as a function of snow surface temperature and forest cover. The snow-covered land surface albedo is a function of the snow albedo, the background albedo, and the actual snow depth. In both CCLM–CLM5.0 and RegCMa–CLM4.5, snow albedo within each snow layer is simulated with the Snow, Ice, and Aerosol Radiative (SNICAR) model, which incorporates a two-stream radiative transfer solution from Toon et al. (1989) and considers snow age.
Table 1A list of the RCMs, LSMs, and the model names used in this study. Also listed are the key references describing the models and the institutions that performed the simulations. Institution and model abbreviations are shown in Appendix A.

2.3 Snow-albedo sensitivity index (SASI)
The key interaction between the land and the atmosphere in sub-polar and alpine climates is through changes in surface albedo during winter and spring. This study uses the SASI index (Xu and Dirmeyer, 2013), which is a measure of the climate forcing from the snow-albedo effect. SASI has units of watts per square metre and is defined mathematically as
where SW is the incoming solar radiation, σ(fsno) is the standard deviation of snow cover fraction over time, and Δα is the difference in surface albedo between the snow-covered surface and non-snow-covered surface. In this study, Δα has a constant value of 0.5 for grass and 0.2 for forests, as the values for this could not be obtained from the models. The albedo values used for snow-covered grass and forest were 0.70 and 0.35 based on Barlage et al. (2005), while albedo values used for non-snow-covered grass and forest were 0.2 and 0.15 based on Myhre and Myhre (2003). Although there are differences in the snow-covered values for different types of forests, i.e. deciduous vs. evergreen, these differences were very small (0.35 vs. 0.34). Previous studies on the impacts of afforestation in sub-polar climates, such as Mooney et al. (2021), have shown that such small changes in albedo have a negligible impact on the outcome. Based on this, the same value was used for all forests regardless of forest type. High SASI values of 10 W m−2 or more indicate a strong radiative forcing from the snow-albedo effect.
2.4 Start date of snowmelt season
This study follows the definition of Xu and Dirmeyer (2011) to identify the start date for the snowmelt season. The start date for the snowmelt season is determined when the 5 d running mean of snow water equivalent falls to 80 % of its peak value.
3.1 SASI
Figure 2 shows the temporal evolution of SASI for the FOREST and GRASS simulations in the Scandinavia, East Baltic, and the Europe regions for January to June. Values for July to December are excluded due to the lack of snow cover and/or low levels of incoming solar radiation. SASI is typically low in January, since incoming solar radiation is low. As the season progresses, SASI values increase with increasing solar radiation until the snow starts melting. As the snow cover decreases, SASI values decrease and reach zero in most places by June. Consequently, the timing of snowmelt differs in the different regions due to latitudinal differences leading to different times for peak values of SASI.
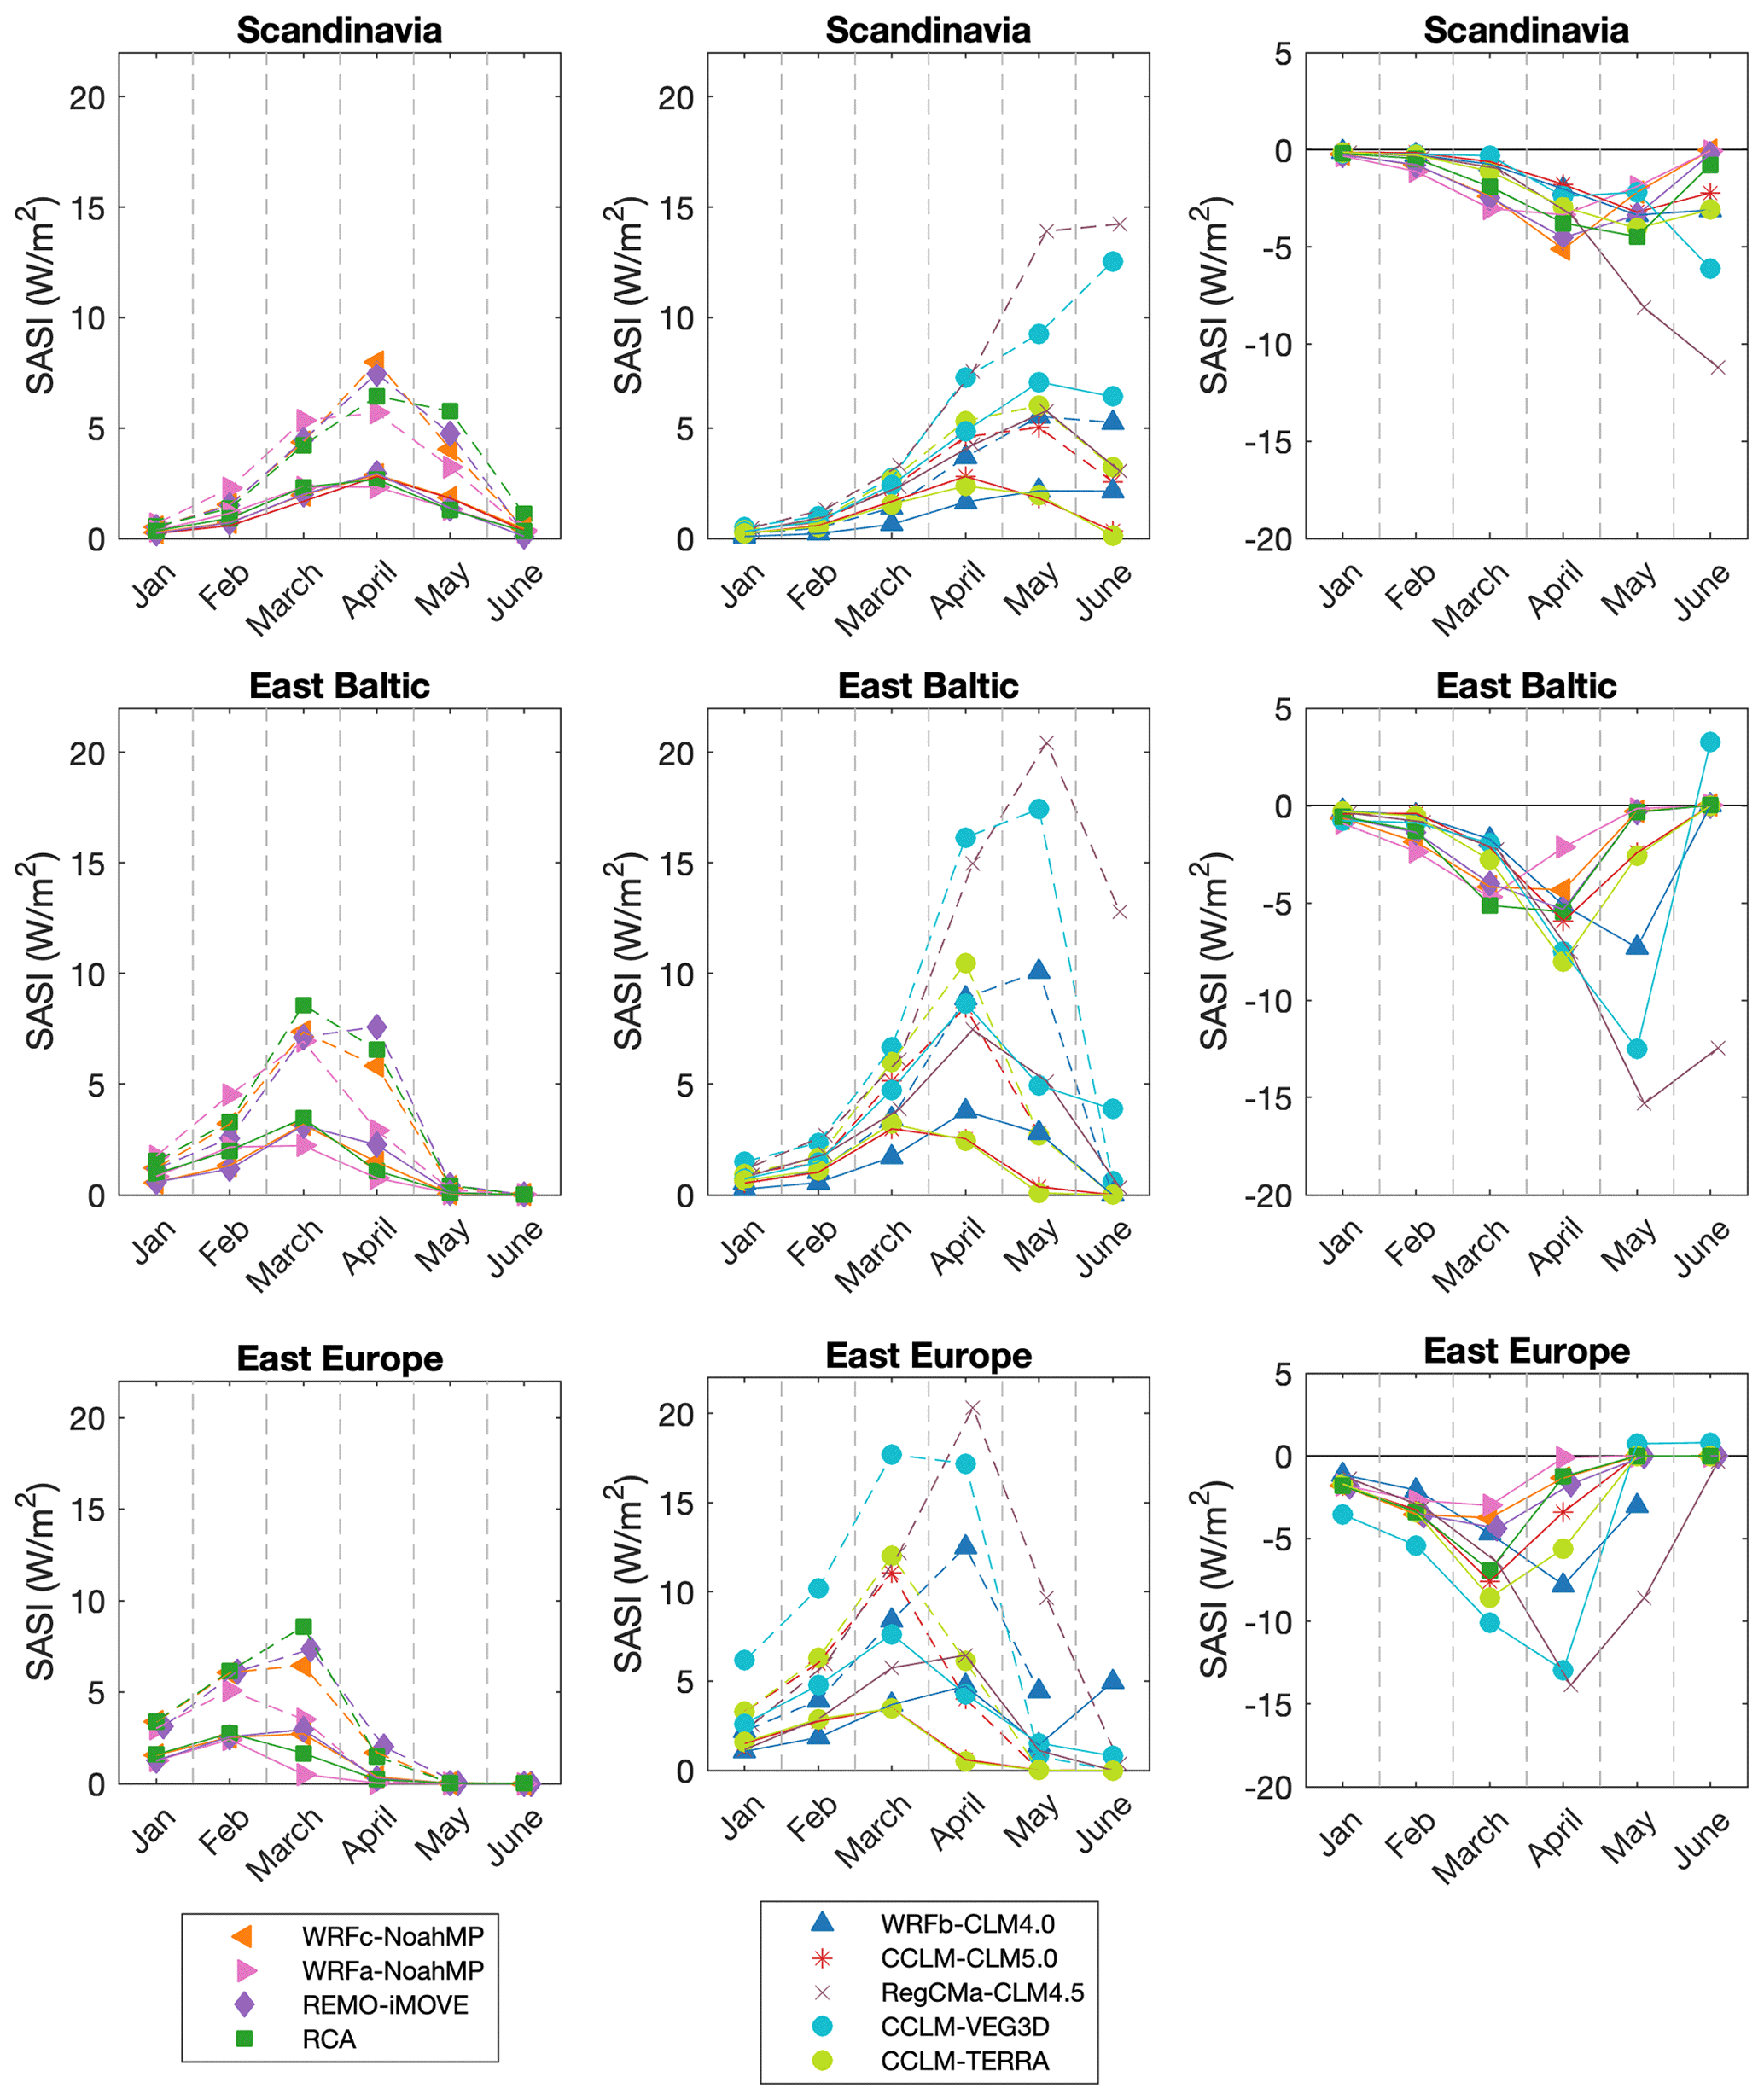
Figure 2The first and second columns show the SASI values for the GRASS (dashed lines) and FOREST (solid lines) experiments averaged over the three different regions shown in Fig. 1. The nine simulations are divided into two different columns based on their values (high vs. low); the purpose of this separation is to ease interpretation of the results. The third column shows the impact of afforestation on SASI (FOREST−GRASS).
Figure 2 shows that GRASS simulations have higher SASI values than FOREST simulations meaning afforestation reduces the climate forcing from the snow-albedo effect. This is consistent with the findings of Davin et al. (2020), which also used the CORDEX FPS LUCAS models and showed that afforestation increased surface temperatures in all of these CORDEX FPS LUCAS models. Davin et al. (2020) also showed that afforestation increased net solar radiation and sensible heat considerably in these same models. This points to the decreased albedo from afforestation enhancing net solar radiation and leading to a positive response in surface air temperature to afforestation. In light of this, the lower SASI values for the FOREST simulations compared to the GRASS values can be primarily attributed to the difference in Δα, which is 0.5 for GRASS and 0.2 for FOREST. Generally, afforestation does not impact the timing of the maximum value in SASI.
Four RCMs (WRFa–NoahMP, WRFc–NoahMP, REMO–iMOVE, and RCA) produce SASI values similar to each other for the GRASS experiment and also for the FOREST experiment. The other RCMs simulate considerably different values for SASI in the GRASS experiment, with the largest differences appearing in the snowmelt season (April–June) when the SASI for some simulations can be 2–3 times larger than SASI values for other simulations. This is also evident in the FOREST experiment. It is important to note here that results for CCLM–VEG3D may arise from the use of a binary number (0 or 1) for snow cover fraction. The next subsection presents the impact of afforestation on snow water equivalent and snow cover, which are key variables for SASI.
3.2 Snow water equivalent and snow depth
Snow water equivalent and snow depth are considered together, as there is a relationship between these quantities and as three of the models provide only snow water equivalent, from which snow depth is derived by using a constant density value of 312 kg m−3.
Figure 3 shows the difference between the FOREST and GRASS experiments for snow water equivalent for the nine different models. Only differences that are statistically significant at the 95 % confidence level using Student's t test are shown. Four of the models show that afforestation reduces snow water equivalent in all months, and one model shows that afforestation increases snow water equivalent in all months. The remaining four models show more spatial variability in both magnitude and sign of change.
A summary of Fig. 3 is presented in Fig. 4 which shows the spatial variability and mean in the difference between FOREST and GRASS experiments. In Scandinavia, most RCMs show that afforestation reduces snow water equivalent with modest decreases and little spatial variability during the accumulation phase but large decreases and large spatial variability during the snowmelt season. Four RCMs (WRFa–NoahMP, WRFb–CLM, WRFc–NoahMP, and CCLM–TERRA) show that afforestation increases snow water equivalent during the accumulation period. Three of these RCMs show that afforestation also leads to higher values of snow water equivalent during the snowmelt season; WRFb–CLM shows that afforestation decreases the snow water equivalent during the melt season. The results for the East Baltic region are similar to Scandinavia despite the difference in forest type; Scandinavia has predominantly evergreen needleleaf forests, while the East Baltic region is dominated by mixed forests with considerable areas of deciduous broadleaf and evergreen needleleaf forests. In both the Scandinavia and East Baltic regions, models display a greater spatial variability during the snowmelt season than during the accumulation period. Only small differences for a few models are shown in the East Europe region. However, values for snow water equivalent are smaller in this region compared to the others. The results for snow depth are not shown here, as they are very similar to the results for snow water equivalent.
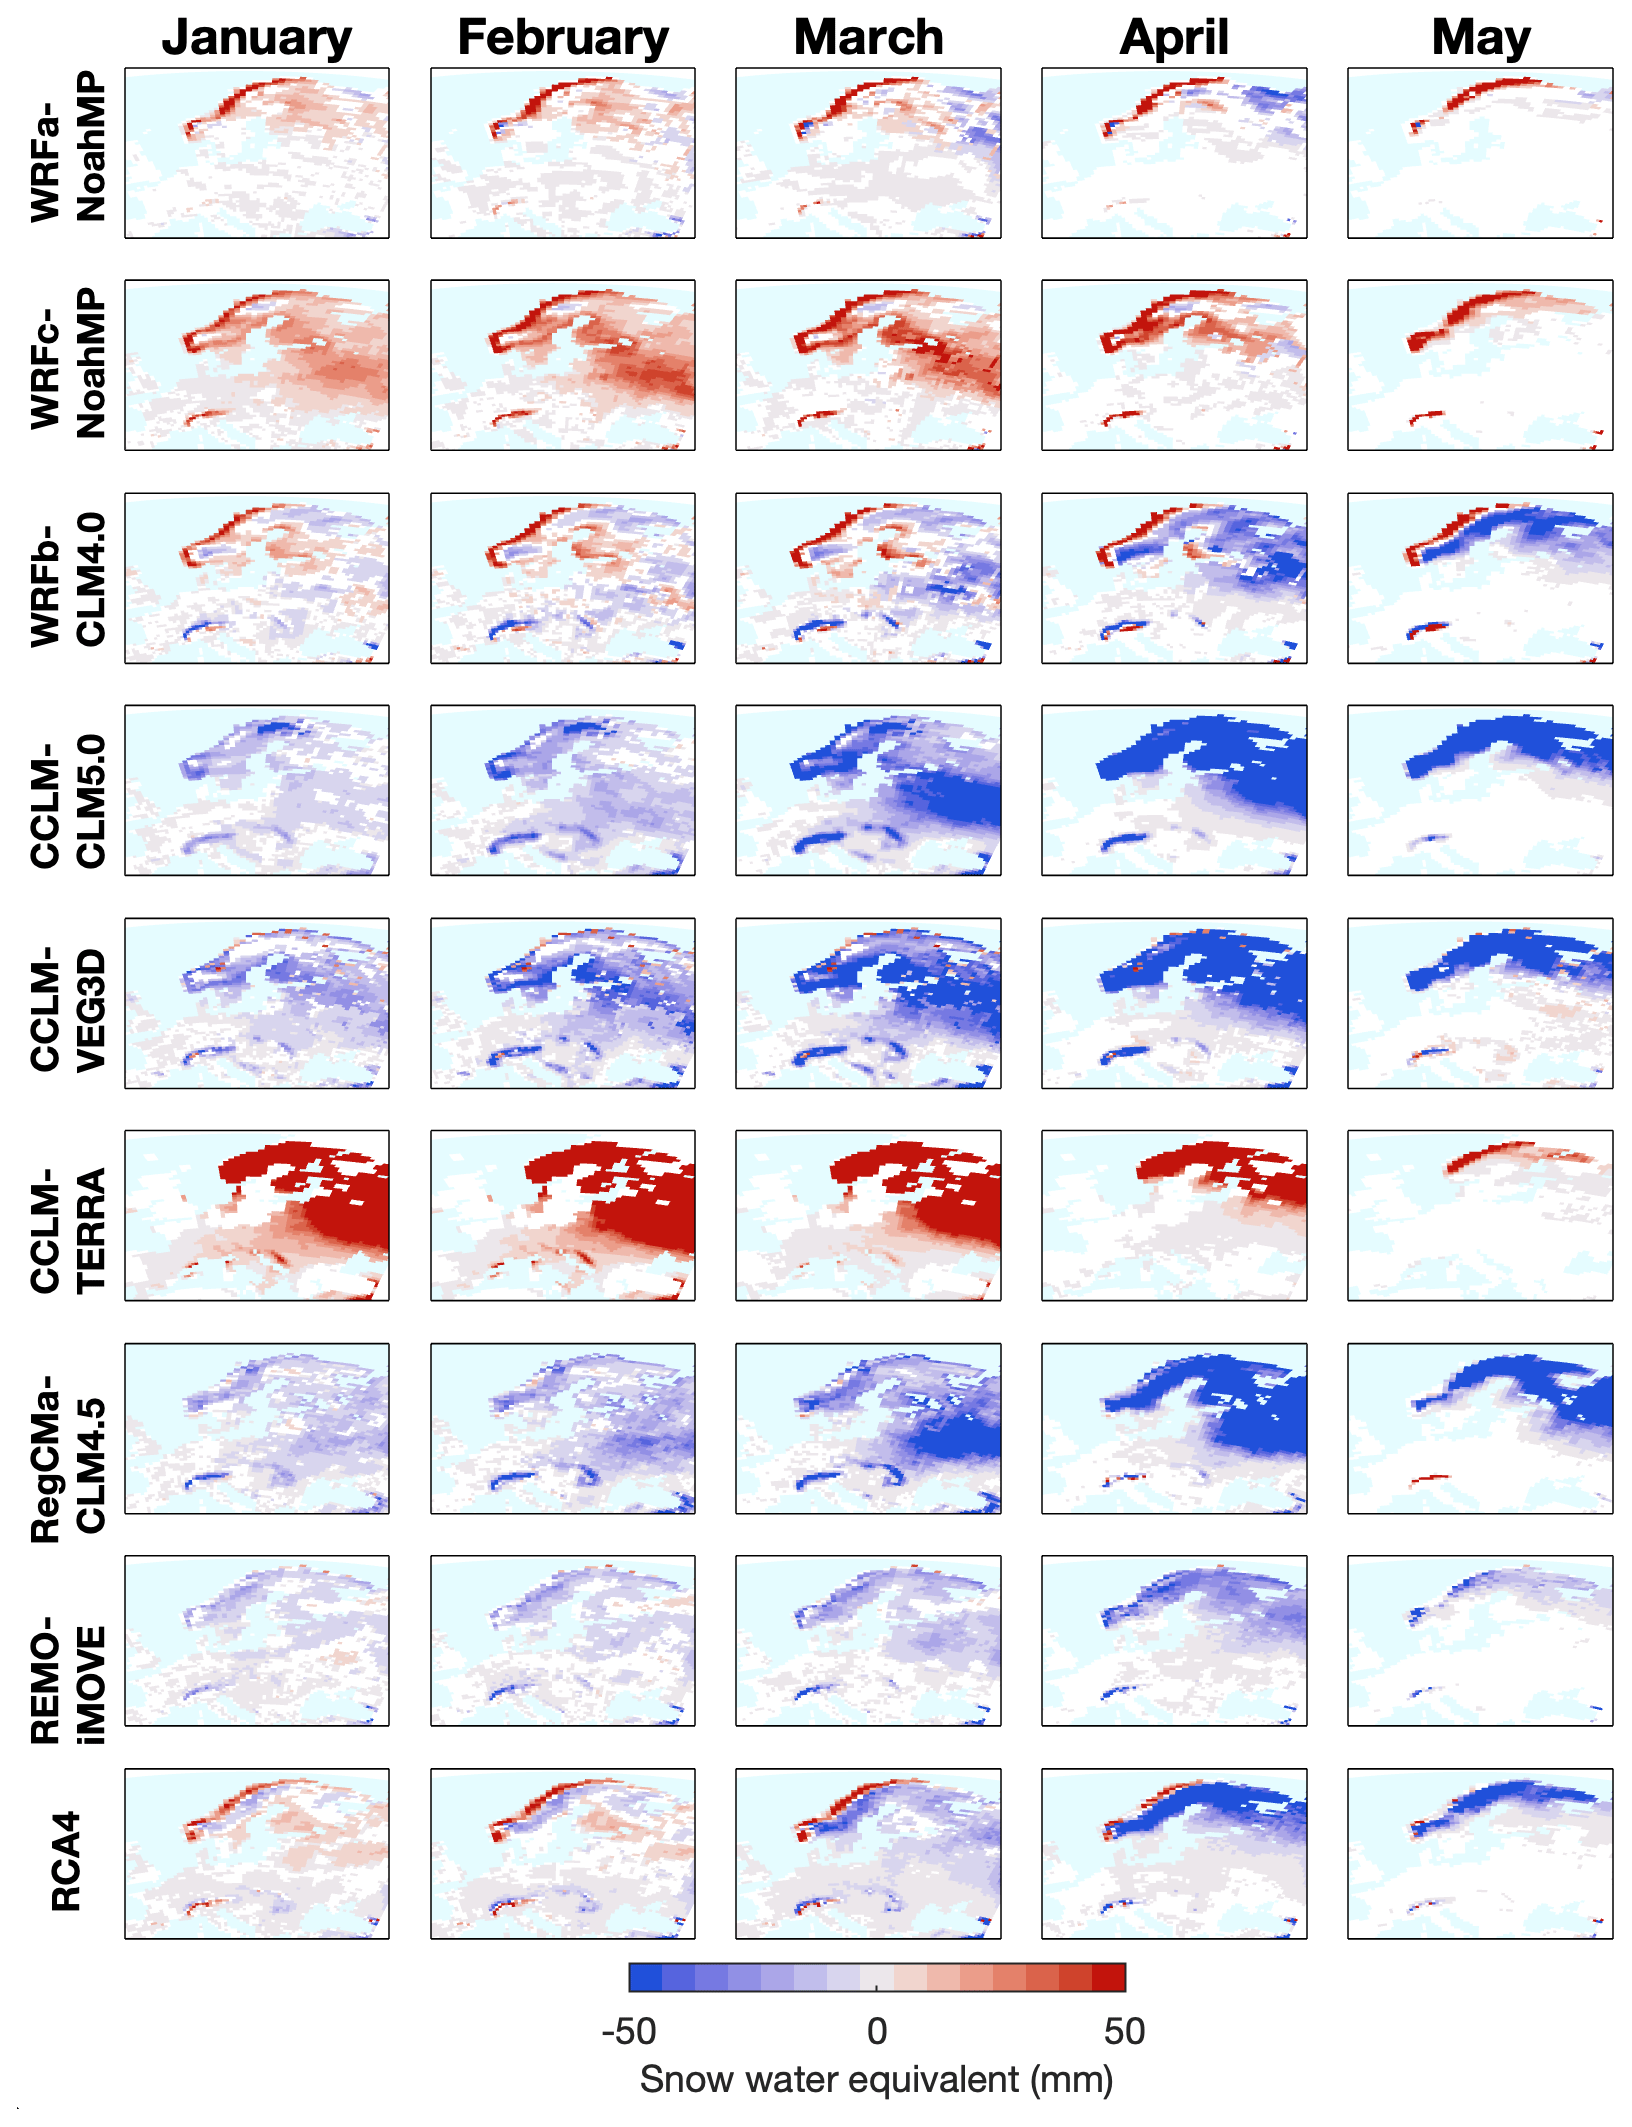
Figure 3Impact of afforestation (FOREST−GRASS) on snow water equivalent (SWE) simulated by the CORDEX FPS LUCAS models. White spaces show grid boxes that are not statistically significant at the 95 % confidence level.

Figure 4Impact of afforestation (FOREST−GRASS) on snow water equivalent (SWE) simulated by the LUCAS models. The box plots indicate the spatial variability in the difference between the FOREST and GRASS experiments for each month from January to May (see y axis). Only differences that are statistically significant at the 95 % confidence level are considered. Statistical significance was determined using Student's t test.
3.3 Snow cover
Figure 5 shows the spatial variability in the difference of snow cover fraction between the FOREST and GRASS experiments. As in Figs. 3 and 4, only differences that are statistically significant at the 95 % confidence level are considered. Most notable in these results is the strong effect of afforestation and large spatial variability demonstrated by the three CCLM models during the snowmelt season. All results show a reduction in snow cover due to afforestation in the snowmelt season with little impact evident during the accumulation period. All three regions show some impact of afforestation on snow cover.
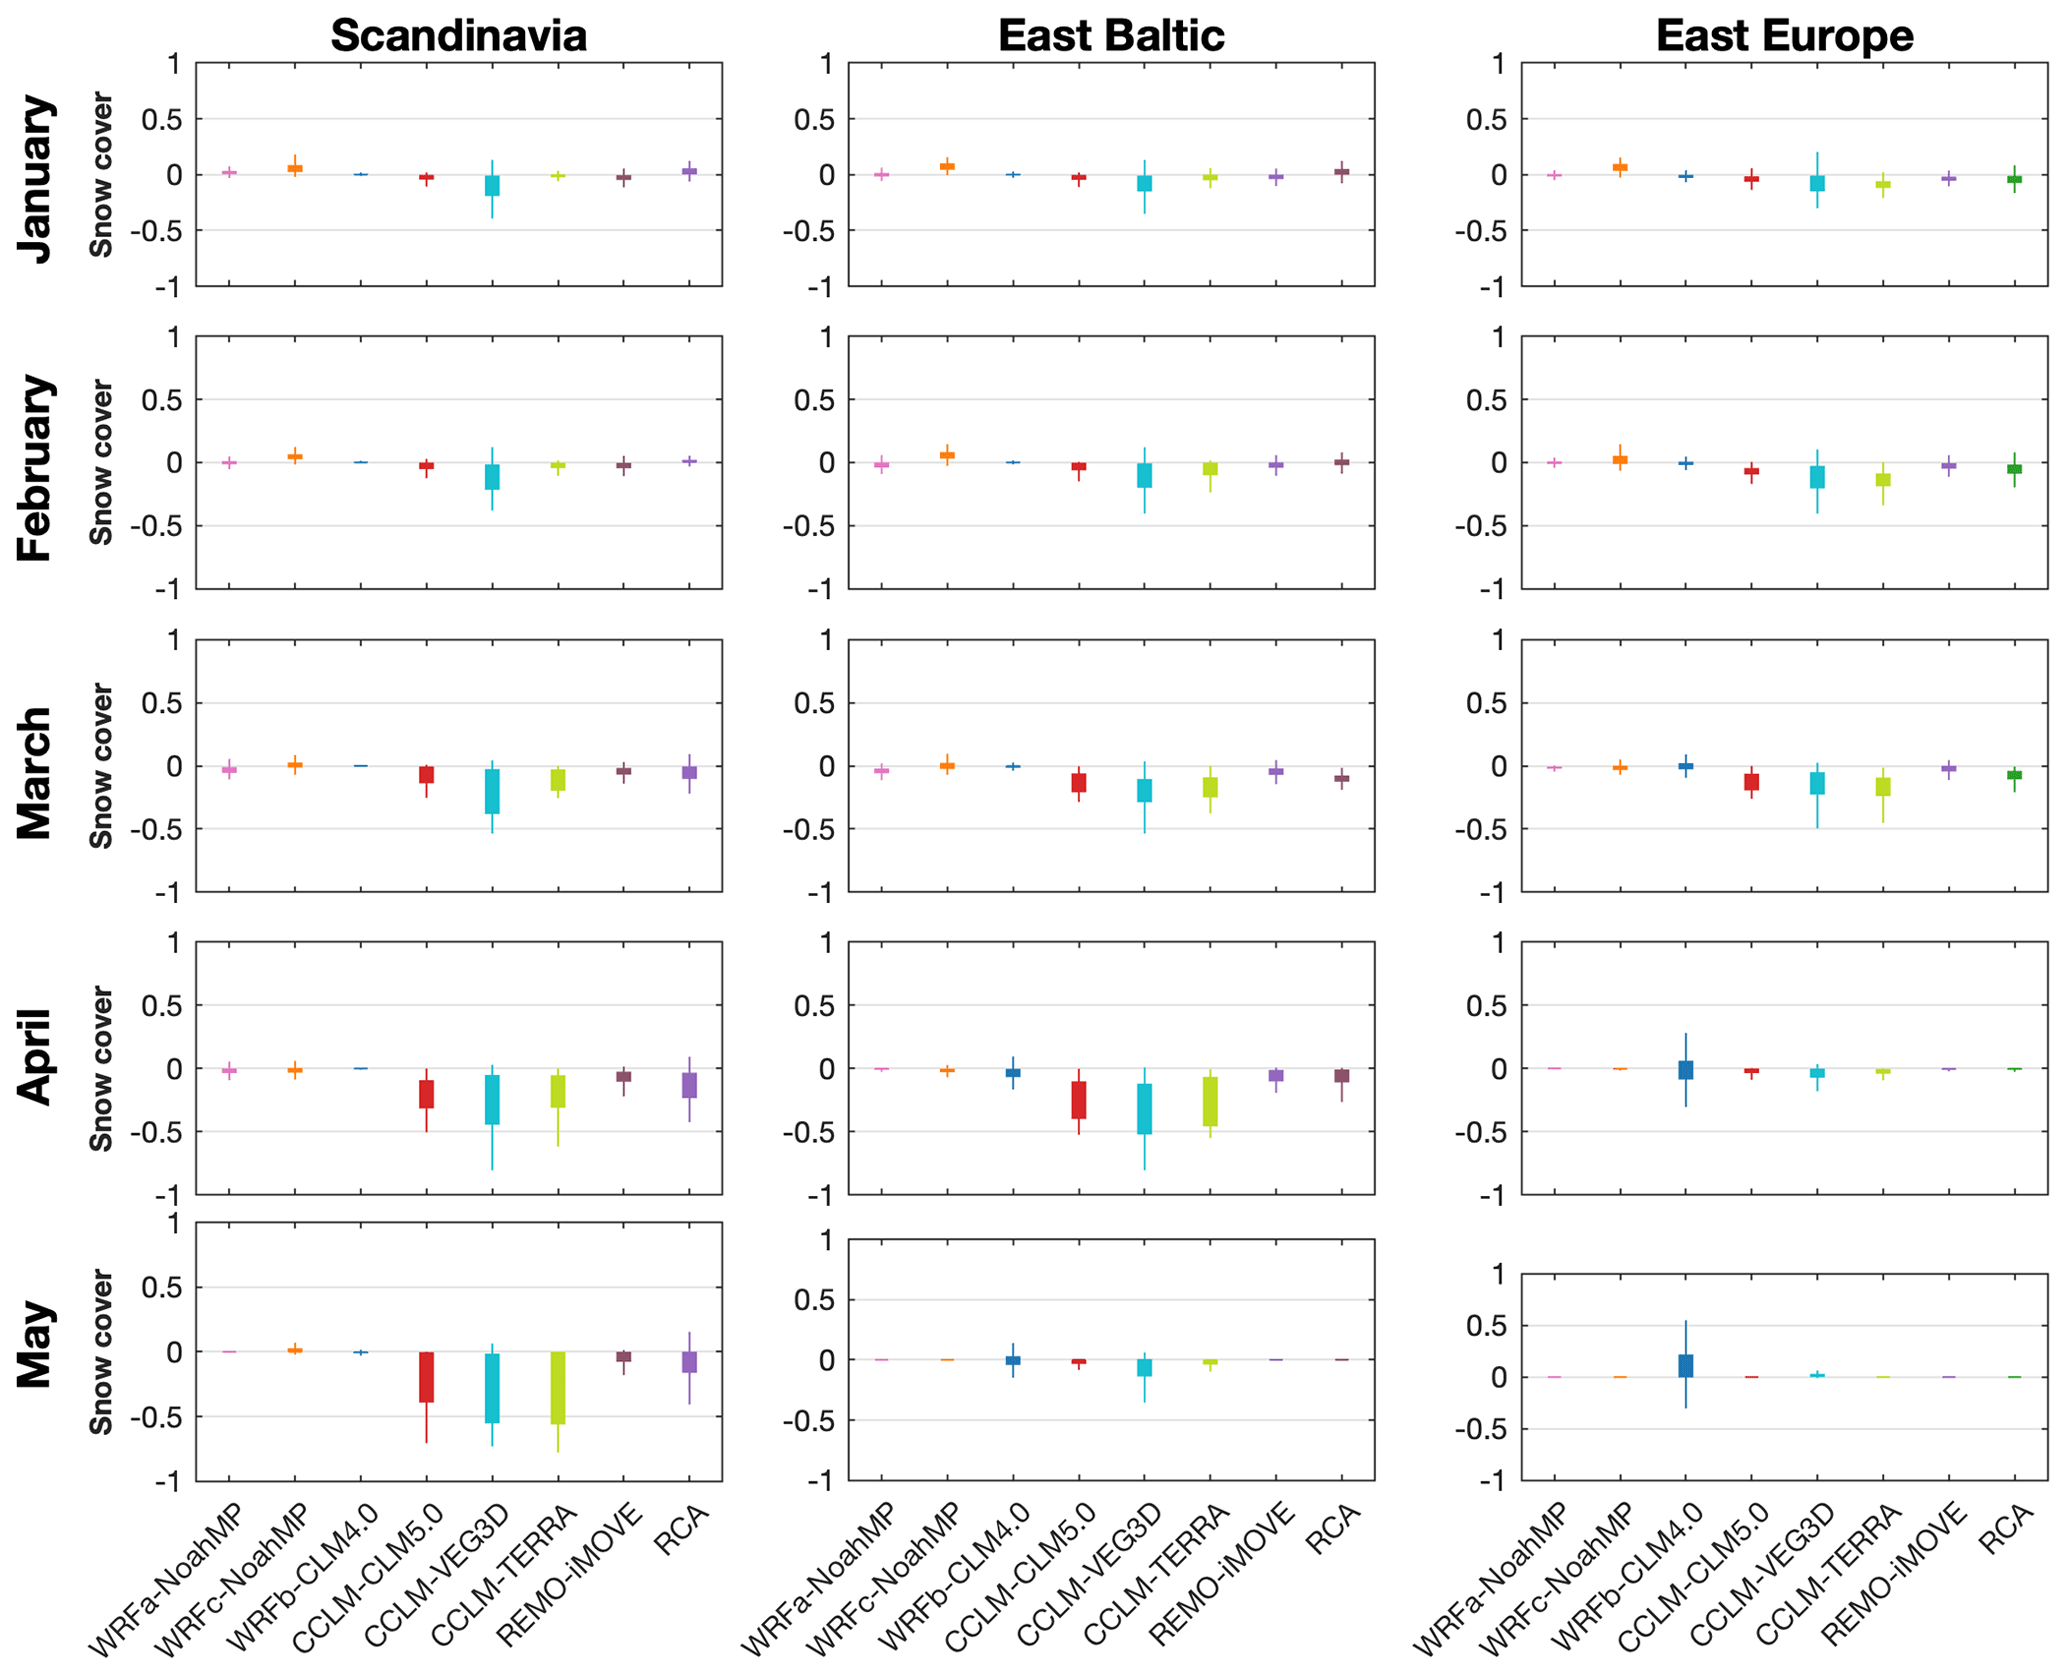
Figure 5Impact of afforestation (FOREST−GRASS) on snow cover fraction simulated by the CORDEX FPS LUCAS models. The box plots indicate the spatial variability in the difference between the FOREST and GRASS experiments. Only differences that are statistically significant at the 95 % confidence level are considered. Statistical significance was determined using Student's t test.
3.4 Snow days
Figure 6 shows the impact of afforestation on the number of snow days. Snow days are defined as days when snow depth exceeds 0.1 m, and the number of snow days is indicative of the length of the snow season. Four RCMs show that afforestation increases the number of snow days, while five RCMs show that afforestation decreases the number of snow days. Three of the four RCMs showing an increase are from the WRF modelling system; three of the five RCMs showing a decrease are from the CCLM model. Both the WRF and CCLM ensembles consist of different LSMs. This suggests that differences in the representation of atmospheric processes are largely responsible for this conflicting result. Nonetheless, there are differences in the magnitude of the response to afforestation within the WRF and CCLM ensembles, suggesting that land surface processes are also important.
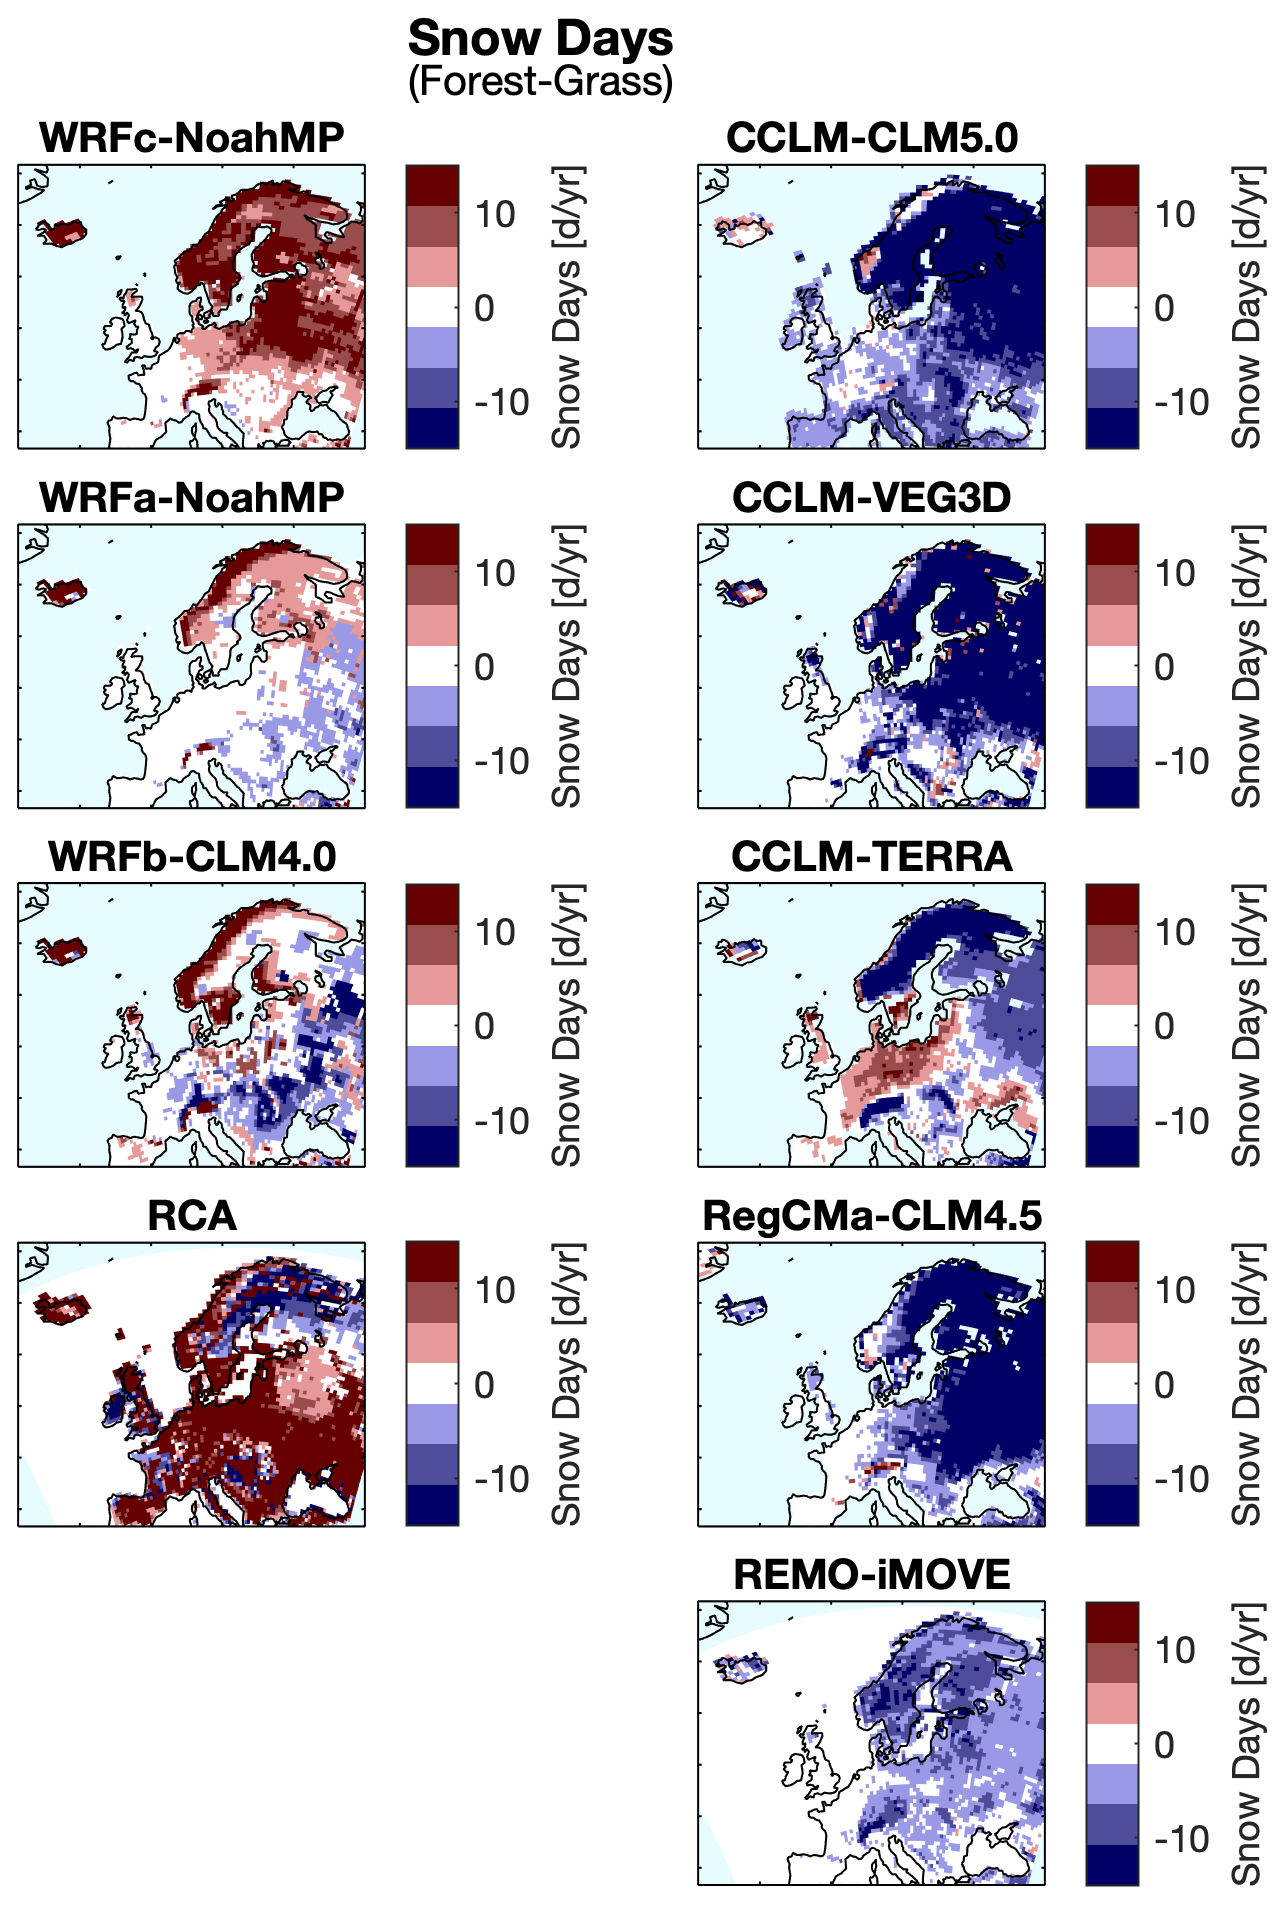
Figure 6Impact of afforestation (FOREST−GRASS) on the number of snow days in the season, an indicator for the length of the snow season.
3.5 Snowmelt
Figure 7 shows the impact of afforestation on the start of the snowmelt season. The start of the snowmelt season is determined when the 5 d moving mean of snow water equivalent reaches 80 % of the season maximum in the 5 d moving mean of snow water equivalent. In general, the results of Fig. 7 show that afforestation tends to delay the onset of snowmelt. This is most evident in the Scandinavia and East Baltic regions. In the East Europe region, the mean value for most RCMs also shows a delay in the start of the snowmelt season. However, there is large spatial variability, and two RCMs (REMO–iMOVE and WRFa–NoahMP) have a mean value greater than zero, suggesting an earlier start of the snowmelt season.

Figure 7Impact of afforestation (FOREST – GRASS) on the start of the snowmelt season in the three different regions shown in Fig. 1. The snowmelt season starts when the 5 d moving mean of snow water equivalent reaches 80 % of the maximum value of the 5 d moving mean in the season.
As highlighted in the companion paper (Daloz et al., 2021) and other studies (e.g. Matiu et al., 2020), regional climate models have substantial difficulties in simulating snow-related processes and variables. This study highlights the need for further model development in the representation of vegetation–snow interactions during the snowmelt season. This is evident from disagreements between models on the magnitude and sign of change arising from afforestation for some of the analyses. It is further evident in the disagreement between model results and observations shown in the companion paper of Daloz et al. (2021), especially during the snowmelt season. Model improvements in the representation of vegetation–snow interactions can substantially reduce known biases in regional climate simulations for other climate variables in northern and eastern Europe (Mooney et al., 2013; Katragkou et al., 2015). Such improvements would increase confidence in climate change projections for these regions.
Observational studies using paired-site experiments of forests and open spaces, such as grass, have shown that afforestation generally decreases snow accumulation and lowers melt rates (Varhola et al., 2010, and references therein). However, the processes behind these results are very complex and highly variable depending on multiple factors that have led to conflicting results (Lundquist et al., 2013). While all models struggle to reproduce these complexities, there are some robust findings here. Models show that afforestation has the greatest impact during the snowmelt season, and there is good agreement between the models in simulating the impacts on snow cover. This is consistent with other international studies assessing the ability of climate and land surface models to simulate snow cover (Essery et al., 2009; Mudryk et al., 2020; Krinner et al., 2018). However, there is less agreement in the magnitude of changes during the snowmelt season when afforestation impacts are greatest. Simulating vegetation–snow interactions during snowmelt is a known challenge for models (Krinner et al., 2018). The models also showed good agreement in simulating the impact of afforestation on the onset of the snowmelt season, although there was disagreement on the magnitude of change. Disagreement was also found on the impact of afforestation on snow water equivalent. This may be related to the known deficiencies in climate models to simulate snow mass variables, such as snow water equivalent, highlighted in previous studies (Thackeray et al., 2019; Mudryk et al., 2020).
Societies in many sub-polar and mountainous regions of the world depend on snow accumulation and snowmelt for a myriad of social and economic activities, e.g. water resources and winter tourism. Indeed, these regions are also vulnerable to flooding and avalanches. Regardless of the sign of change if the impact of afforestation or deforestation on snow accumulation and/or melt is sufficiently large, communities in these regions will be impacted by afforestation. Certain ecological species are also highly dependent on snow, and if afforestation mitigates some of the snowmelt expected in a warmer world, then afforestation could help conservation efforts by offering potential sites for “climate change refugia” in a warmer world. Together these points highlight the societal and ecological need for better information on the impact of afforestation in sub-polar and alpine regions, some of which are already undergoing afforestation.
In this study, we used an ensemble of RCMs to investigate the impact of afforestation during January–June on the climate forcing due to the snow-albedo effect, which is a key land–atmosphere interaction in sub-polar and alpine climates. The study showed that afforestation decreases the snow-albedo climate forcing. This is largely due to changes in surface albedo. While models agreed on the sign of change, there was disagreement on the magnitude of the impact of afforestation on SASI. Results also showed that there was no impact on the timing of the peak value of SASI, which generally occurs in March or April depending on the region. Our study also showed that there was a large spread in the values for both the FOREST and GRASS simulations, suggesting that model improvements are required for both grass–snow and forest–snow interactions.
The study also examined the impact of afforestation on snow water equivalent, snow depth, and snow cover fraction. Most models show that afforestation has a smaller impact in January and February, when snow is generally accumulating, than in March, April, and May, when snow is melting. Most models showed that afforestation reduced snow water equivalent, snow depth, and snow cover fraction in March, April, and May, when snow is typically melting. However, the models do disagree on the magnitude of the change. This indicates that afforestation enhances snowmelt with little to no impact on snow accumulation. Afforestation was also shown to generally delay the start of the snowmelt season. Analysis of the impact of afforestation on the number of snow days was inconclusive with four models showing increases and five models showing clear decreases.
The main limitations of this study are the (1) coarse model resolution, (2) inadequate model representation of complex forest–snow interactions, and (3) lack of forest–snow observations. The coarse spatial resolution in this study limits the ability of all models to adequately represent essential atmospheric processes such as precipitation and key land surface processes and characteristics, e.g. elevation and canopy–snow interactions. Another limitation is the simplistic representation of forest–snow interactions even in the most sophisticated models. For example, most models do not consider the role of forest density in forest–snow interactions, even though observation-based studies have shown the importance of this forest characteristic, and there are well-known differences in forest density between managed and natural forests. Another well-known deficiency in regional models is their inability to represent windblown snowdrift, which is an important factor for quantifying the snow-albedo effects of afforestation. Finally, the study's ability to determine which model or models correctly represent vegetation–snow processes is severely hampered by the lack of high-quality observations of surface energy and moisture fluxes in forests and grasslands in these regions, particularly in Scandinavia.
These limitations highlight the need for future developments in land surface models to focus on a more sophisticated representation of forest–snow interactions such as the impact of forest type, density, and atmospheric temperatures on both snowmelt and snow accumulation. Indeed, such development would also enhance the performance of regional climate models in these regions.
Future studies should consider using kilometre-scale resolutions, as computational resources are becoming more affordable. This would better represent important atmospheric processes and aspects of the land surface such as precipitation processes and mountainous terrain. This is particularly important in Scandinavia, where models in this study show large differences in snow water equivalent. Convection-permitting models would not only improve the amounts of precipitation, but also its classification into rain and snow would be based on microphysical processes instead of the threshold-based approaches used in coarser models. The next two phases of CORDEX FPS LUCAS will be implemented at higher resolutions, with the third phase applying kilometre-scale resolutions. This will provide additional knowledge and insights into this important topic.
Future studies could also consider the impact of dynamic vegetation modelling on the snow–albedo feedback. Previous studies such as Cook et al. (2008) have shown that dynamic vegetation in climate models can be an important amplifier of the snow–albedo feedback. Such an analysis was not possible in this study, as most models did not have this capability. Future studies should examine this when more land surface models have developed this capacity.
There is also a need for more observational work on vegetation–snow interactions, particularly in northern Europe. A number of observational studies have been conducted in Canada, Russia, and the United States of America, but only a few have been carried out in northern Europe. Existing observational studies show that vegetation–snow interactions depend on numerous factors, including elevation and climate. This implies that the results from studies in other regions may not necessarily apply to northern Europe. Such observations would advance our understanding of vegetation–snow interactions, support model evaluation, improve model development, and reduce uncertainty in future climate projections.
| Institutions | |
| AUTH | Aristotle University of Thessaloniki |
| BCCR | Bjerknes Centre for Climate Research |
| BTU | Brandenburgische Technische Universität |
| ETH | Eidgenössische Technische Hochschule |
| Zürich | |
| GERICS | Climate Service Center Germany |
| ICTP | International Centre for Theoretical |
| Physics | |
| IDL | Instituto Amaro da Costa |
| JLU | Justus-Liebig-Universität Gießen |
| KIT | Karlsruhe Institute of Technology |
| SMHI | Swedish Meteorological and |
| Hydrological Institute | |
| Regional climate | |
| models | |
| CCLM | COSMO-CLM (Consortium for Small-scale |
| Modeling Climate Limited-area Modelling) | |
| RCA | Rossby Centre Regional Atmospheric |
| Climate Model | |
| RegCM | Regional Climate Model |
| REMO | Regional Model |
| WRF | Weather Research and Forecasting Model |
| Land surface | |
| models | |
| CLM | Community Land Surface Model |
| iMOVE | Interactive MOsaic-based VEgetation |
| model | |
| NoahMP | Noah Multiparameterization |
Simulations were forced by the ERA-Interim reanalysis dataset (https://www.ecmwf.int/en/forecasts/datasets/reanalysis-datasets/era-interim 28 November 2018, Dee et al., 2011). The source code for the Weather Research and Forecasting (WRF) model can be accessed at https://doi.org/10.5065/D6MK6B4K (Powers et al., 2017). The documentation for COSMO-Model is available at https://www.dwd.de/EN/ourservices/cosmo_documentation/cosmo_documentation.html (last access: 12 August 2021, Sørland et al., 2021), although a license is required for access (http://www.cosmo-model.org/content/consortium/licencing.htm, COSMO, 2022). The RegCM4 model is available at https://github.com/ictp-esp/RegCM (last access: 8 March 2021; Giorgi et al., 2012) and https://doi.org/10.5281/zenodo.4603556 (Georgi et al., 2021). The source code of the REMO model is available on request from the Climate Service Center Germany (contact@remo-rcm.de) (Wilhelm et al., 2014). The model output was analysed using climate data operators (https://doi.org/10.5281/zenodo.3539275, Schulzweida, 2019).
PAM, DR, ELD, EK, MB, RMC, PH, DCAL, RM, PMMS, GS, SS, GS, and MHT performed the RCM simulations, using vegetation maps produced by ELD. PAM designed the research, analysed the data, and wrote the paper. All authors contributed to interpreting the results and revising the text.
The contact author has declared that neither they nor their co-authors have any competing interests.
Publisher’s note: Copernicus Publications remains neutral with regard to jurisdictional claims in published maps and institutional affiliations.
In Norway, the simulations were stored on the NIRD (National Infrastructure for Research Data) server with resources provided by Uninett Sigma2 – the National Infrastructure for High Performance Computing and Data Storage in Norway. WRFc–NoahMP simulations were performed and stored on resources provided by Uninett Sigma2 – the National Infrastructure for High Performance Computing and Data Storage in Norway (NN9280K, NS9001K, and NS9599K). WRFb–CLM4.0 simulations were supported by computational time granted from the National Infrastructures for Research and Technology S.A. (GRNET S.A.) in the ARIS national high-performance computing facility (project nos. pr005025 and pr007033_thin). Edouard L. Davin and Ronny Meier acknowledge financial support from the Swiss National Science Foundation (SNSF) through the CLIMPULSE (CLimate IMPacts of Utilizing Land in Switzerland and Europe) project and thank the Swiss National Supercomputing Centre (CSCS) for providing computing resources. Peter Hoffmann is funded by the Climate Service Center Germany (GERICS) of the Helmholtz-Zentrum Hereon in the framework of the Helmholtz Institute for Climate Service Science (HICSS) project LANDMATE (Modelling human LAND surface Modifications and its feedbacks on local and regional cliMATE). The authors gratefully acknowledge the WCRP CORDEX Flagship Pilot Study LUCAS (Land use and Climate Across Scales) and the research data exchange infrastructure and services provided by the Jülich Supercomputing Centre, Germany, as part of the Helmholtz Data Federation initiative.
This research has been supported by the Norges Forskningsråd (grant no. 254966) and the Fundação para a Ciência e a Tecnologia (grant nos. PTDC/CTA-MET/28914/2017 and UIDB/50019/2020). The research work from Giannis Sofiadis was supported by the Hellenic Foundation for Research and Innovation (HFRI) under the HFRI PhD Fellowship grant (no. 1359). Priscilla A. Mooney was partially supported by the European Union's Horizon 2020 research and innovation framework programme (PolarRES, grant agreement no. 101003590).
This paper was edited by Ruth Mottram and reviewed by two anonymous referees.
Abermann, J., Eckerstorfer, M., Malnes, E., and Hansen, B. U.: A large wet snow avalanche cycle in West Greenland quantified using remote sensing and in situ observations, Nat. Hazards, 97, 517–534, https://doi.org/10.1007/s11069-019-03655-8, 2019.
Barlage, M., Zeng, X., Wei, H., and Mitchell, K. E.: A global 0.05∘ maximum albedo dataset of snow-covered land based on MODIS observations, Geophys. Res. Lett., 32, L17405, https://doi.org/10.1029/2005GL022881, 2005.
Bender, E., Lehning, M., and Fiddes, J.: Changes in Climatology, Snow Cover, and Ground Temperatures at High Alpine Locations, Front. Earth Sci., 8, 100, https://doi.org/10.3389/feart.2020.00100, 2020.
Braun, F. J. and Schädler, G.: Comparison of Soil Hydraulic Parameterizations for Mesoscale Meteorological Models, J. Appl. Meteorol., 44, 1116–1132, https://doi.org/10.1175/JAM2259.1, 2005.
Choudhury, B. J. and Monteith, J. L.: A four-layer model for the heat budget of homogeneous land surfaces, Q. J. Roy. Meteor. Soc., 114, 373–398, 1988.
Cherubini, F., Huang, B., Hu, X., Tölle, M. H., and Strømman, A. H.: Quantifying the climate response to extreme land cover changes in Europe with a regional model, Environ. Res. Lett., 13, 074002, https://doi.org/10.1088/1748-9326/aac794, 2018.
Cook, B. I., Bonan, G. B., Levis, S., and Epstein, H. E.: Rapid vegetation responses and feedbacks amplify climate model response to snow cover changes, Clim. Dynam., 30, 391–406, https://doi.org/10.1007/s00382-007-0296-z, 2008.
COSMO: COSMO Model Licence [data set], http://www.cosmo-model.org/content/consortium/licencing.htm (last access: 12 August 2021), 2022.
Daloz, A. S., Schwingshackl, C., Mooney, P., Strada, S., Rechid, D., Davin, E. L., Katragkou, E., de Noblet-Ducoudré, N., Belda, M., Halenka, T., Breil, M., Cardoso, R. M., Hoffmann, P., Lima, D. C. A., Meier, R., Soares, P. M. M., Sofiadis, G., Strandberg, G., Toelle, M. H., and Lund, M. T.: Land-atmosphere interactions in sub-polar and alpine climates in the CORDEX FPS LUCAS models: I. Evaluation of the snow-albedo effect, The Cryosphere Discuss. [preprint], https://doi.org/10.5194/tc-2021-290, in review, 2021.
Davin, E. L., Rechid, D., Breil, M., Cardoso, R. M., Coppola, E., Hoffmann, P., Jach, L. L., Katragkou, E., de Noblet-Ducoudré, N., Radtke, K., Raffa, M., Soares, P. M. M., Sofiadis, G., Strada, S., Strandberg, G., Tölle, M. H., Warrach-Sagi, K., and Wulfmeyer, V.: Biogeophysical impacts of forestation in Europe: first results from the LUCAS (Land Use and Climate Across Scales) regional climate model intercomparison, Earth Syst. Dynam., 11, 183–200, https://doi.org/10.5194/esd-11-183-2020, 2020.
Deardorff, J. W.: Efficient prediction of ground surface temperature and moisture, with inclusion of a layer of vegetation, J. Geophys. Res.-Oceans, 83, 1889–1903, https://doi.org/10.1029/JC083iC04p01889, 1978.
Dee, D. P., Uppala, S. M., Simmons, A. J., Berrisford, P., Poli, P., Kobayashi, S., Andrae, U., Balmaseda, M. A., Balsamo, G., Bauer, P., Bechtold, P., Beljaars, A. C. M., van de Berg, L., Bidlot, J., Bormann, N., Delsol, C., Dragani, R., Fuentes, M., Geer, A. J., Haimberger, L., Healy, S. B., Hersbach, H., Hólm, E. V., Isaksen, L., Kållberg, P., Köhler, M., Matricardi, M., McNally, A. P., Monge-Sanz, B. M., Morcrette, J.-J., Park, B.-K., Peubey, C., de Rosnay, P., Tavolato, C., Thépaut, J.-N., and Vitart, F.: The ERA-Interim reanalysis: configuration and performance of the data assimilation system, Q. J. Roy. Meteor. Soc., 137, 553–597, https://doi.org/10.1002/qj.828, 2011 (data available at: https://www.ecmwf.int/en/forecasts/datasets/reanalysis-datasets/era-interim, last access: 28 November 2018).
Dickinson, R. E.: Land surface processes and climate-surface albedos and energy balance, Adv. Geophys., 25, 305–353, 1983.
Doms, G., Förstner, J., Heise, E., Herzog, H.-J., Mironov, D., Raschendorfer, M., Reinhardt, T., Ritter, Schrodin, B. R., Schulz, J.-P., and Vogel, G.: A Description of the Nonhydrostatic Regional Model LM, Part II: Physical Parameterization, Deutscher Wetterdienst (DWD), 2013.
Duncker, P. S., Raulund-Rasmussen, K., Gundersen, P., Katzensteiner, K., De Jong, J., Ravn, H. P., Smith, M., Eckmüllner, O., and Spiecker, H.: How forest management affects ecosystem services, including timber production and economic return synergies and trade-offs, Ecol. Soc., 17, 1–17, 2012.
Essery, R., Pomeroy, J., Parviainen, J., and Storck, P.: Sublimation of Snow from Coniferous Forests in a Climate Model, J. Climate, 16, 1855–1864, https://doi.org/10.1175/1520-0442(2003)016<1855:SOSFCF>2.0.CO;2, 2003.
Essery, R., Rutter, N., Pomeroy, J., Baxter, R., Stähli, M., Gustafsson, D., Barr, A., Bartlett, P., and Elder, K.: SNOWMIP2: An Evaluation of Forest Snow Process Simulations, B. Am. Meteorol. Soc., 90, 1120–1136, https://doi.org/10.1175/2009BAMS2629.1, 2009.
Framstad, E., Berglund, H., Gundersen, V., Heikkilä, R., Lankinen, N., Peltola, T., Risbøl, O., and Weih, M.: Increased biomass harvesting for bioenergy: Effects on biodiversity, landscape amenities and cultural heritage values, TemaNord, Copenhagen, Nordic Council of Ministers, 591, https://doi.org/10.6027/TN2009-591, 2009.
Giorgi, F., Coppola, E., Solmon, F., Mariotti, L., Sylla, M. B., Bi, X., Elguindi, N., Diro, G. T., Nair, V., Giuliani, G., Turuncoglu, U. U., Cozzini, S., Güttler, I., O'Brien, T. A., Tawfik, A. B., Shalaby, A., Zakey, A. S., Steiner, A. L., Stordal, F., Sloan, L. C., and Brankovic, C.: RegCM4: model description and preliminary tests over multiple CORDEX domains, Clim. Res., 52, 7–29, 2012.
Giorgi, F., Solmon, F., Bi, X., Coppola, E., Giuliani, G., Turunçoğlu, U., Güttler, I., Mariotti, L., Rita, N., O'Brien, T. A., Tawfik, A., Elguindi, N., Piani, S., Pal, J., Diro, G. T., and Shalaby, A.: ictp-esp/RegCM: Paper Release (4.7.1), Zenodo [data set], https://doi.org/10.5281/zenodo.4603556, 2021.
Golding, D. L. and Swanson, R. H.: Snow accumulation and melt in small forest openings in Alberta, Can. J. Forest Res., 8, 380–388, https://doi.org/10.1139/x78-057, 1978.
Grabe, F.: Simulation der Wechselwirkung zwischen Atmosphäre, Vegetation und Erdoberfläche bei Verwendung unterschiedlicher Parametrisierungsansätze, PhD Thesis, Inst. for Meteorology and Climate Research, Karlsruhe Institute of Technology, Karlsruhe, Germany, 2002.
Hedstrom, N. R. and Pomeroy, J. W.: Measurements and modelling of snow interception in the boreal forest, Hydrol. Process., 12, 1611–1625, https://doi.org/10.1002/(SICI)1099-1085(199808/09)12:10/11<1611::AID-HYP684>3.0.CO;2-4, 1998.
IPCC: Summary for Policymakers, in: Climate Change and Land: an IPCC special report on climate change, desertification, land degradation, sustainable land management, food security, and greenhouse gas fluxes in terrestrial ecosystems, edited by: Shukla, P. R., Skea, J., Calvo Buendia, E., Masson-Delmotte, V., Pörtner, H.-O., Roberts, D. C., Zhai, P., Slade, R., Connors, S., van Diemen, R., Ferrat, M., Haughey, E., Luz, S., Neogi, S., Pathak, M., Petzold, J., Portugal Pereira, J., Vyas, P., Huntley, E., Kissick, K., Belkacemi, M., and Malley, J., in press, 2019.
Jacob, D., Elizalde, A., Haensler, A., Hagemann, S., Kumar, P., Podzun, R., Rechid, D., Remedio, A. R., Saeed, F., Sieck, K., Teichmann, C., and Wilhelm, C.: Assessing the Transferability of the Regional Climate Model REMO to Different COordinated Regional Climate Downscaling EXperiment (CORDEX) Regions, Atmosphere, 3, 181–199, https://doi.org/10.3390/atmos3010181, 2012.
Jacob, D., Petersen, J., Eggert, B., Alias, A., Christensen, O. B., Bouwer, L. M., Braun, A., Colette, A., Déqué, M., Georgievski, G., Georgopoulou, E., Gobiet, A., Menut, L., Nikulin, G., Haensler, A., Hempelmann, N., Jones, C., Keuler, K., Kovats, S., Kröner, N., Kotlarski, S., Kriegsmann, A., Martin, E., van Meijgaard, E., Moseley, C., Pfeifer, S., Preuschmann, S., Radermacher, C., Radtke, K., Rechid, D., Rounsevell, M., Samuelsson, P., Somot, S., Soussana, J.-F., Teichmann, C., Valentini, R., Vautard, R., Weber, B., and Yiou, P.: EURO-CORDEX: new high-resolution climate change projections for European impact research, Reg. Environ. Change, 14, 563–578, https://doi.org/10.1007/s10113-013-0499-2, 2014.
Katragkou, E., García-Díez, M., Vautard, R., Sobolowski, S., Zanis, P., Alexandri, G., Cardoso, R. M., Colette, A., Fernandez, J., Gobiet, A., Goergen, K., Karacostas, T., Knist, S., Mayer, S., Soares, P. M. M., Pytharoulis, I., Tegoulias, I., Tsikerdekis, A., and Jacob, D.: Regional climate hindcast simulations within EURO-CORDEX: evaluation of a WRF multi-physics ensemble, Geosci. Model Dev., 8, 603–618, https://doi.org/10.5194/gmd-8-603-2015, 2015.
Krinner, G., Derksen, C., Essery, R., Flanner, M., Hagemann, S., Clark, M., Hall, A., Rott, H., Brutel-Vuilmet, C., Kim, H., Ménard, C. B., Mudryk, L., Thackeray, C., Wang, L., Arduini, G., Balsamo, G., Bartlett, P., Boike, J., Boone, A., Chéruy, F., Colin, J., Cuntz, M., Dai, Y., Decharme, B., Derry, J., Ducharne, A., Dutra, E., Fang, X., Fierz, C., Ghattas, J., Gusev, Y., Haverd, V., Kontu, A., Lafaysse, M., Law, R., Lawrence, D., Li, W., Marke, T., Marks, D., Ménégoz, M., Nasonova, O., Nitta, T., Niwano, M., Pomeroy, J., Raleigh, M. S., Schaedler, G., Semenov, V., Smirnova, T. G., Stacke, T., Strasser, U., Svenson, S., Turkov, D., Wang, T., Wever, N., Yuan, H., Zhou, W., and Zhu, D.: ESM-SnowMIP: assessing snow models and quantifying snow-related climate feedbacks, Geosci. Model Dev., 11, 5027–5049, https://doi.org/10.5194/gmd-11-5027-2018, 2018.
Kotlarski, S.: A Subgrid Glacier Parameterisation for Use in Regional Climate Modelling, PhD thesis, Reports on Earth System Science No. 42, Max Planck Institute for Meteorology, Hamburg, http://www.mpimet.mpg.de/fileadmin/publikationen/Reports/WEB_BzE_42.pdf (last access: 8 April 2022), 2007.
Lawrence, D. M., Fisher, R. A., Koven, C. D., Oleson, K. W., Swenson, S. C., Bonan, G., Collier, N., Ghimire, B., van Kampenhout, L., Kennedy, D., Kluzek, E., Lawrence, P. J., Li, F., Li, H., Lombardozzi, D., Riley, W. J., Sacks, W. J., Shi, M., Vertenstein, M., Wieder, W. R., Xu, C., Ali, A. A., Badger, A. M., Bisht, G., van den Broeke, M., Brunke, M. A., Burns, S. P., Buzan, J., Clark, M., Craig, A., Dahlin, K., Drewniak, B., Fisher, J. B., Flanner, M., Fox, A. M., Gentine, P., Hoffman, F., Keppel-Aleks, G., Knox, R., Kumar, S., Lenaerts, J., Leung, L. R., Lipscomb, W. H., Lu, Y., Pandey, A., Pelletier, J. D., Perket, J., Randerson, J. T., Ricciuto, D. M., Sanderson, B. M., Slater, A., Subin, Z. M., Tang, J., Thomas, R. Q., Val Martin, M., and Zeng, X.: The Community Land Model Version 5: Description of New Features, Benchmarking, and Impact of Forcing Uncertainty, J. Adv. Model. Earth Sy., 11, 4245–4287, https://doi.org/10.1029/2018MS001583, 2019.
Lundquist, J. D., Dickerson-Lange, S. E., Lutz, J. A., and Cristea, N. C.: Lower forest density enhances snow retention in regions with warmer winters: A global framework developed from plot-scale observations and modeling, Water Resour. Res., 49, 6356–6370, https://doi.org/10.1002/wrcr.20504, 2013.
Matiu, M., Petitta, M., Notarnicola, C., and Zebisch, M.: Evaluating Snow in EURO-CORDEX Regional Climate Models with Observations for the European Alps: Biases and Their Relationship to Orography, Temperature, and Precipitation Mismatches, Atmosphere, 11, 46, https://doi.org/10.3390/atmos11010046, 2020.
Mooney, P. A., Mulligan, F. J., and Fealy, R.: Evaluation of the Sensitivity of the Weather Research and Forecasting Model to Parameterization Schemes for Regional Climates of Europe over the Period 1990–95, J. Climate, 26, 1002–1017, https://doi.org/10.1175/JCLI-D-11-00676.1, 2013.
Mooney, P. A., Sobolowski, S., and Lee, H.: Designing and evaluating regional climate simulations for high latitude land use land cover change studies, Tellus A, 72, 1–17, https://doi.org/10.1080/16000870.2020.1853437, 2020.
Mooney, P. A., Lee, H., and Sobolowski, S.: Impact of Quasi-Idealized Future Land Cover Scenarios at High Latitudes in Complex Terrain, Earths Future, 9, e2020EF001838, https://doi.org/10.1029/2020EF001838, 2021.
Mudryk, L., Santolaria-Otín, M., Krinner, G., Ménégoz, M., Derksen, C., Brutel-Vuilmet, C., Brady, M., and Essery, R.: Historical Northern Hemisphere snow cover trends and projected changes in the CMIP6 multi-model ensemble, The Cryosphere, 14, 2495–2514, https://doi.org/10.5194/tc-14-2495-2020, 2020.
Myers-Smith, I. H., Kerby, J. T., Phoenix, G. K., Bjerke, J. W., Epstein, H. E., Assmann, J. J., John, C., Andreu-Hayles, L., Angers-Blondin, S., Beck, P. S. A., Berner, L. T., Bhatt, U. S., Bjorkman, A. D., Blok, D., Bryn, A., Christiansen, C. T., Cornelissen, J. H. C., Cunliffe, A. M., Elmendorf, S. C., Forbes, B. C., Goetz, S. J., Hollister, R. D., de Jong, R., Loranty, M. M., Macias-Fauria, M., Maseyk, K., Normand, S., Olofsson, J., Parker, T. C., Parmentier, F.-J. W., Post, E., Schaepman-Strub, G., Stordal, F., Sullivan, P. F., Thomas, H. J. D., Tømmervik, H., Treharne, R., Tweedie, C. E., Walker, D. A., Wilmking, M., and Wipf, S.: Complexity revealed in the greening of the Arctic, Nat. Clim. Change, 10, 106–117, https://doi.org/10.1038/s41558-019-0688-1, 2020.
Myhre, G. and Myhre, A.: Uncertainties in Radiative Forcing due to Surface Albedo Changes Caused by Land-Use Changes, J. Climate, 16, 1511–1524, https://doi.org/10.1175/1520-0442(2003)016<1511:UIRFDT>2.0.CO;2, 2003.
Niu, G.-Y. and Yang, Z.-L.: An observation-based formulation of snow cover fraction and its evaluation over large North American river basins, J. Geophys. Res.-Atmos., 112, D21101, https://doi.org/10.1029/2007JD008674, 2007.
Niu, G.-Y., Yang, Z.-L., Mitchell, K. E., Chen, F., Ek, M. B., Barlage, M., Kumar, A., Manning, K., Niyogi, D., Rosero, E., Tewari, M., and Xia, Y.: The community Noah land surface model with multiparameterization options (Noah-MP): 1. Model description and evaluation with local-scale measurements, J. Geophys. Res.-Atmos., 116, D12109, https://doi.org/10.1029/2010JD015139, 2011.
Oleson, K. W., Lawrence, D. M., Bonan, G. B., Flanner, M. G., Kluzek, E., Lawrence, P. J., and Zeng, X.: Technical Description of version 4.0 of the Community Land Model (CLM) (No. NCAR/TN-478+STR), University Corporation for Atmospheric Research, https://doi.org/10.5065/D6FB50WZ, 2010.
Oleson K. W., Lawrence, D. M., Bonan, G. B., Drewniak, B., Huang, M., Koven, C. D., Levis, S., Li, F., Riley, W. J., Subin, Z. M., Swenson, S., Thornton, P. E., Bozbiyik, A., Fisher, R., Heald, C. L., Kluzek, E., Lamarque, J.-F., Lawrence, P. J., Leung, L. R., Lipscomb, W., Muszala, S. P., Ricciuto, D. M., Sacks, W. J., Sun, Y., Tang, J., and Yang, Z.-L.: Technical description of version 4.5 of the Community Land Model (CLM), No. NCAR/TN-503+STR, University Corporation for Atmospheric Research, 420 pp., https://doi.org/10.5065/D6RR1W7M, 2013.
Powers, J. G., Klemp, J. B., Skamarock, W. C., Davis, C. A., Dudhia, J., Gill, D. O., Coen, J. L., Gochis, D. J., Ahmadov, R., Peckham, S. E., Grell, G. A., Michalakes, J., Trahan, S., Benjamin, S. G., Alexander, C. R., Dimego, G. J., Wang, W., Schwartz, C. S., Romine, G. S., Liu, Z., Snyder, C., Chen, F., Barlage, M. J., Yu, W., and Duda, M. G.: The Weather Research and Forecasting Model: Overview, System Efforts, and Future Directions, B. Am. Meteorol. Soc., 98, 1717–1737, https://doi.org/10.1175/BAMS-D-15-00308.1, 2017.
Rechid, D., Davin, E., de Noblet-Ducoudré, N., and Katragkou, E.: CORDEX Flagship Pilot Study LUCAS – Land Use & Climate Across Scales – a new initiative on coordinated regional land use change and climate experiments for Europe, 19th EGU General Assembly, EGU2017, 23–28 April 2017, Vienna, Austria, 19, p. 13172, 2017.
Ritter, B. and Geleyn, J-.F.: A Comprehensive Radiation Scheme for Numerical Weather Prediction Models with Potential Applications in Climate Simulations, Mon. Weather Rev., 120, 303–325, https://doi.org/10.1175/1520-0493(1992)120<0303:ACRSFN>2.0.CO;2, 1992.
Roeckner, E., Arpe, K., Bentsson, L., Christoph, M., Claussen, M., Dümenil, L., Esch, M., Giorgetta, M., Schlese, U., and Schulzweida, U.: The atmospheric general circulation model ECHAM-4: Model description and simulation of present day climate, Max-Planck Institut für Meteorologie, Report No. 218, 90 pp., https://mpimet.mpg.de/fileadmin/publikationen/Reports/MPI-Report_218.pdf (last access: 8 April 2022), 1996.
Samuelsson, P., Gollvik, S., and Ullerstig, A.: The land-surface scheme of the Rossby Centre regional atmospheric model (RCA3), Reports Meteorology, 122, SMHI, SE-60176 Norrköping, Sweden, ISSN 0283-7730, 2006.
Samuelsson, P., Gollvik S., Jansson, C., Kupiainen, M., Kourzeneva, E., and Jan van de Berg, W.: The surface processes of the Rossby Centre regional atmospheric climate model (RCA4), Reports Meteorology, 157, SMHI, Norrköping, Sweden, ISSN 0283-7730, 2015.
Schulzweida, U.: CDO User Guide (1.9.8), Zenodo [data set], https://doi.org/10.5281/zenodo.3539275, 2019.
Schrodin, E. and Heise, E.: A new multi-layer soil model, COSMO Newsletter No. 2, 149–151, 2002.
Sofiadis, G., Katragkou, E., Davin, E. L., Rechid, D., de Noblet-Ducoudre, N., Breil, M., Cardoso, R. M., Hoffmann, P., Jach, L., Meier, R., Mooney, P. A., Soares, P. M. M., Strada, S., Tölle, M. H., and Warrach Sagi, K.: Afforestation impact on soil temperature in regional climate model simulations over Europe, Geosci. Model Dev., 15, 595–616, https://doi.org/10.5194/gmd-15-595-2022, 2022.
Sellers, P. J.: Canopy reflectance, photosynthesis and transpiration, Int. J. Remote Sens., 6, 1335–1372, 1985.
Sørland, S. L., Brogli, R., Pothapakula, P. K., Russo, E., Van de Walle, J., Ahrens, B., Anders, I., Bucchignani, E., Davin, E. L., Demory, M.-E., Dosio, A., Feldmann, H., Früh, B., Geyer, B., Keuler, K., Lee, D., Li, D., van Lipzig, N. P. M., Min, S.-K., Panitz, H.-J., Rockel, B., Schär, C., Steger, C., and Thiery, W.: COSMO-CLM regional climate simulations in the Coordinated Regional Climate Downscaling Experiment (CORDEX) framework: a review, Geosci. Model Dev., 14, 5125–5154, https://doi.org/10.5194/gmd-14-5125-2021, 2021 (data available at: https://www.dwd.de/EN/ourservices/cosmo_documentation/cosmo_documentation.html, last access: 30 August 2021).
Strandberg, G., Bärring, L., Hansson, U., Jansson, C., Jones, C., Kjellström, E., Kolax, M., Kupiainen, M., Nikulin, G., Samuelsson, P., Ullerstig, A., and Wang, S.: CORDEX scenarios for Europe from the Rossby Centre regional climate model RCA4, SMHI Meteorology and Climatology Rep. 116, 84 pp., https://www.smhi.se/polopoly_fs/1.90275!/Menu/general/extGroup/attachmentColHold/mainCol1/file/RMK_116.pdf (last access: 8 April 2022), 2015.
Sturm, M., Taras, B., Liston, G. E., Derksen, C., Jonas, T., and Lea, J.: Estimating Snow Water Equivalent Using Snow Depth Data and Climate Classes, J. Hydrometeorol., 11, 1380–1394, https://doi.org/10.1175/2010JHM1202.1, 2010.
Thackeray, C. W., Fletcher, C. G., and Derksen, C.: Diagnosing the Impacts of Northern Hemisphere Surface Albedo Biases on Simulated Climate, J. Climate, 32, 1777–1795, https://doi.org/10.1175/JCLI-D-18-0083.1, 2019.
Toon, O. B., McKay, C. P., Ackerman, T. P., and Santhanam, K.: Rapid calculation of radiative heating rates and photodissociation rates in inhomogeneous multiple scattering atmospheres. J. Geophys. Res., 94, 16287–16301, https://doi.org/10.1029/JD094iD13p16287, 1989.
van Kampenhout, L., Lenaerts, J. T. M., Lipscomb, W. H., Sacks, W. J., Lawrence, D. M., Slater, A. G., and van den Broeke, M. R.: Improving the Representation of Polar Snow and Firn in the Community Earth System Model, J. Adv. Model. Earth Sy., 9, 2583–2600, https://doi.org/10.1002/2017MS000988, 2017.
Varhola, A., Coops, N. C., Weiler, M., and Moore, R. D.: Forest canopy effects on snow accumulation and ablation: An integrative review of empirical results, J. Hydrol., 392, 219–233, https://doi.org/10.1016/j.jhydrol.2010.08.009, 2010.
Verseghy, D. L., McFarlane, N. A., and Lazare, M.: CLASS – A Canadian land surface scheme for GCMs, II. Vegetation model and coupled runs, Int. J. Climatol., 13, 347–370, 1993.
Wang, A. and Zeng, X.: Improving the treatment of the vertical snow burial fraction over short vegetation in the NCAR CLM3, Adv. Atmos. Sci., 26, 877–886, https://doi.org/10.1007/s00376-009-8098-3, 2009.
Wang, J. A., Sulla-Menashe, D., Woodcock, C. E., Sonnentag, O., Keeling, R. F., and Friedl, M. A.: Extensive land cover change across Arctic–Boreal Northwestern North America from disturbance and climate forcing, Glob. Change Biol., 26, 807–822, https://doi.org/10.1111/gcb.14804, 2020.
Wilhelm, C., Rechid, D., and Jacob, D.: Interactive coupling of regional atmosphere with biosphere in the new generation regional climate system model REMO-iMOVE, Geosci. Model Dev., 7, 1093–1114, https://doi.org/10.5194/gmd-7-1093-2014, 2014.
Xu, L. and Dirmeyer, P.: Snow-atmosphere coupling strength in a global atmospheric model, Geophys. Res. Lett., 38, L13401, https://doi.org/10.1029/2011GL048049, 2011.
Xu, L. and Dirmeyer, P.: Snow-Atmosphere Coupling Strength. Part II: Albedo Effect Versus Hydrological Effect, J. Hydrometeorol., 14, 404–418, https://doi.org/10.1175/JHM-D-11-0103.1, 2013.
Zeng, X., Dickinson, R. E., Barlage, M., Dai, Y., Wang, G., and Oleson, K.: Treatment of under-canopy turbulence in land models, J. Climate, 18, 5086–5094, 2005.