the Creative Commons Attribution 4.0 License.
the Creative Commons Attribution 4.0 License.
 | 24 Feb 2021
Inventory and changes of rock glacier creep speeds in Ile Alatau and Kungöy Ala-Too, northern Tien Shan, since the 1950s
Tazio Strozzi
Tobias Bolch
Rafael Caduff
Håkon Trefall
Markus Stoffel
Alexander Kokarev
Spatio-temporal patterns related to the viscous creep in perennially frozen sediments of rock glaciers in cold mountains have rarely been studied outside the densely populated European Alps. This study investigates the spatial and temporal variability of rock glacier movement in the Ile Alatau and Kungöy Ala-Too mountain ranges, northern Tien Shan, a region with particularly large and fast rock glaciers. Over the study region of more than 3000 km2, an inventory of slope movements was constructed using a large number of radar interferograms and high-resolution optical imagery. The inventory includes more than 900 landforms, of which around 550 were interpreted as rock glaciers. Out of the active rock glaciers inventoried, 45 are characterized by a rate of motion exceeding 100 cm/a. From these fast rock glaciers we selected six (Gorodetzky, Morenny, Archaly, Ordzhonikidze, Karakoram, and Kugalan Tash) and studied them in more detail using offset tracking between repeat aerial images and historical and modern high-resolution optical satellite data. Two of these rock glaciers showed a steady increase in decadal surface velocities from the 1950s onwards, with speeds being roughly 2 to 4 times higher in recent years compared to the 1950s and 1960s. Three rock glaciers showed similar accelerations over the last 1 to 2 decades but also phases of increased speeds in the 1960s. This development indicates a possible significant increase in current sediment and ice fluxes through rock glaciers and implies that their material transport in the region might gain geomorphodynamic importance relative to material transport by glaciers, assuming the latter decreases together with the regional glacier shrinkage. The study demonstrates how air and satellite image archives are exploited to construct one of the longest decennial times series of rock glacier speeds currently available. Our results are in line with findings from Europe about rock glacier speeds increasing with atmospheric warming and underline local variability of such an overall response.
- Article
(25928 KB) - Full-text XML
-
Supplement
(1759 KB) - BibTeX
- EndNote


Debris–ice mixtures on mountain slopes can accumulate, deform under gravity, and form striking tongue-shaped features of viscous flow, up to a kilometre wide and several kilometres long – so-called rock glaciers (Haeberli, 1985; Martin and Whalley, 1987; Barsch, 1996). Rock glaciers can be defined as “the visible expression of cumulative deformation by long-term creep of ice/debris mixtures under permafrost conditions” (Berthling, 2011), a definition that we will follow in this study. Prominent rock glaciers are found in most cold mountain environments on Earth (Barsch, 1996; Jones et al., 2018). The long-term preservation of ice content in rock glaciers under permafrost conditions, situated under a rocky active layer, enable these landforms to creep over time periods of thousands of years (Haeberli et al., 1999; Krainer et al., 2015). The thermal conditions below the freezing point make the creep of ice-rich frozen ground inherently sensitive to climatic conditions, and it is able to change over different timescales (Kääb et al., 2007; Delaloye et al., 2010; Sorg et al., 2015). Besides their climatic and geomorphic significance, creeping frozen sediments can also be the source of rockfall and debris flows and thus evolve into local-scale natural hazards (Kaufmann and Ladstädter, 2008; Roer et al., 2008; Stoffel and Huggel, 2012; Scapozza et al., 2014; Deline et al., 2015; Schoeneich et al., 2015; Bodin et al., 2016; Kummert et al., 2017; Scotti et al., 2017).
Creep speed of perennially frozen sediments is considered a valuable indicator of environmental, in particular of climatic, and ground-thermal conditions. Creep speed of frozen debris in cold mountains is expected to increase with ground temperature (Arenson and Springman, 2005a, b; Kääb et al., 2007; Arenson et al., 2015; Müller et al., 2016), although it is also influenced substantially by a number of other factors such as topography (e.g. slope), provision of ice and debris, temporal and spatial variations in ice content, rheology of the frozen debris, thickness of the creeping permafrost layer, and advection, infiltration, or internal production of water (Jansen and Hergarten, 2006; Cicoira et al., 2019a; Kenner et al., 2020). The role of water can enhance the response of creep speeds of frozen debris to rising ground temperatures when approaching melting conditions (Kääb et al., 2007; Ikeda et al., 2008; Delaloye et al., 2010; Arenson et al., 2015; Hartl et al., 2016; Buchli et al., 2018; Cicoira et al., 2019b).
From above, it becomes clear that inventorying contemporary motion and monitoring speed of bodies of ice-rich perennially frozen debris over time may contribute substantially to a better understanding of the climatic and geomorphic significance of such coherent creep of cold mountain slopes, its response to climatic changes, and the impacts from spatio-temporal variations in such creep, for instance changing slope and infrastructure stability and alpine sediment transport. Inventorying kinematics of rock glaciers and other bodies of frozen mountain sediments over regional scales seems currently best done using satellite radar interferometry, supported by optical and topographic data (IPA Action Group, 2020). This method enables detection of slow slope movement, not least rock glacier motion, over large regions and hundreds of individual landforms (Villarroel et al., 2018). The approach has been used to develop rock glacier motion inventories for the Swiss Alps (Strozzi et al., 2004; Barboux et al., 2014); Sierra Nevada, California (Liu et al., 2013); northern Iceland (Lilleoren et al., 2013); Brooks Range, Alaska (Rick et al., 2015); Carpathians, Romania (Necsoiu et al., 2016); northeastern Tien Shan, Xinjiang, China (Wang et al., 2017); and the dry Andes of Argentina and Chile (Villarroel et al., 2018). These studies mainly relied on satellite L-band synthetic aperture radar (SAR) data such as from the JERS and PALSAR instruments and C-band data such as from ERS and Sentinel-1. The categorization of landforms into classified movement rates or orders of magnitude (cm/d, cm/month, dm/month, cm/yr, etc.) has been proven useful (Barboux et al., 2014).
Rock glacier speed was shown to vary at a range of timescales, including seasonal, annual, decennial, or centennial (Delaloye et al., 2010; Scapozza et al., 2014). For a few rock glaciers worldwide, mostly concentrated in the European Alps, important time series exist with seasonal to decennial time resolutions. Most of these measurements are based on terrestrial geodetic surveys. This implies that such time series cannot be established retrospectively for locations that have not been monitored in the past. Satellite radar interferometry is mainly available for 21st-century creep velocities. The only means to measure 20th-century rock glacier surface velocities at yet unmeasured locations and to reconstruct rock glacier speed variations at climatic timescales (i.e. at roughly decennial timescales) and back into the last century is by offset tracking in repeat historic and modern air and satellite imagery (Kääb et al., 2007; Kaufmann, 2012; Sorg et al., 2015; Monnier and Kinnard, 2017).
The limited number of studies that have presented data on decennial variations in rock glacier speed in the past have drawn a contrasting picture of decadal-scale increases in speed but also reported decreases or phases of decrease, as well as episodes of stable creep speeds, e.g. in the Austrian Alps (Schneider and Schneider, 2001; Krainer and He, 2006; Kellerer-Pirklbauer and Kaufmann, 2012; Hartl et al., 2016), the Rocky Mountains (Janke, 2005), the French Alps (Bodin et al., 2009), the Swiss Alps (Delaloye et al., 2010; PERMOS, 2016), and northern Norway (Eriksen et al., 2018). The long-term observational studies underline qualitatively or quantitatively the influence of variations in mean annual air or ground temperature on the creep of perennially frozen debris, as suggested by theoretical and laboratory studies (see above). Decrease in speed was also shown to coincide with a significant surface lowering, thus hinting to a degradation of ice-rich permafrost (Bodin et al., 2009). Again, by far most of the above few studies on decennial variations in rock glacier speed stem from the European Alps.
The aim of the present study is to systematically inventory contemporary rock glacier creep speeds over two mountain ranges in the northern Tien Shan and to reconstruct speed changes since the mid-20th century for selected landforms, with the specific goal to eventually provide spatio-temporal variations in the creep of frozen debris for a region outside the European Alps. The lack of availability of detailed long-term meteorological data at the rock glacier locations prevents a detailed analysis of the potential influence of temperatures, precipitation, and snow cover on the observed rock glacier motions, though.
The mountain ranges of Ile Alatau and Kungöy Ala-Too (former names: Zailijskij and Kungej Alatau) are located at the border of Kyrgyzstan and Kazakhstan, central Asia (Fig. 1). They rise from the Kazakh steppe to the north and Lake Issyk-Köl (Issyk-Kul, 1608 m a.s.l.) to the south up to an elevation of almost 5000 m a.s.l. Ongoing tectonic activity has caused many earthquakes with magnitudes of up to 8.0 and more (Yadav and Kulieshius, 1992; Lukk et al., 1995; Tibaldi and Graziotto, 1997), and the stronger ones of these earthquakes have triggered a large number of mass movements (Delevaux et al., 2001; Korjenkov et al., 2004; Strom and Korup, 2006). The dominant lithology of the mountain ridges is granite, but weaker schists build the lower-lying saddles as well as larger parts of the valleys.
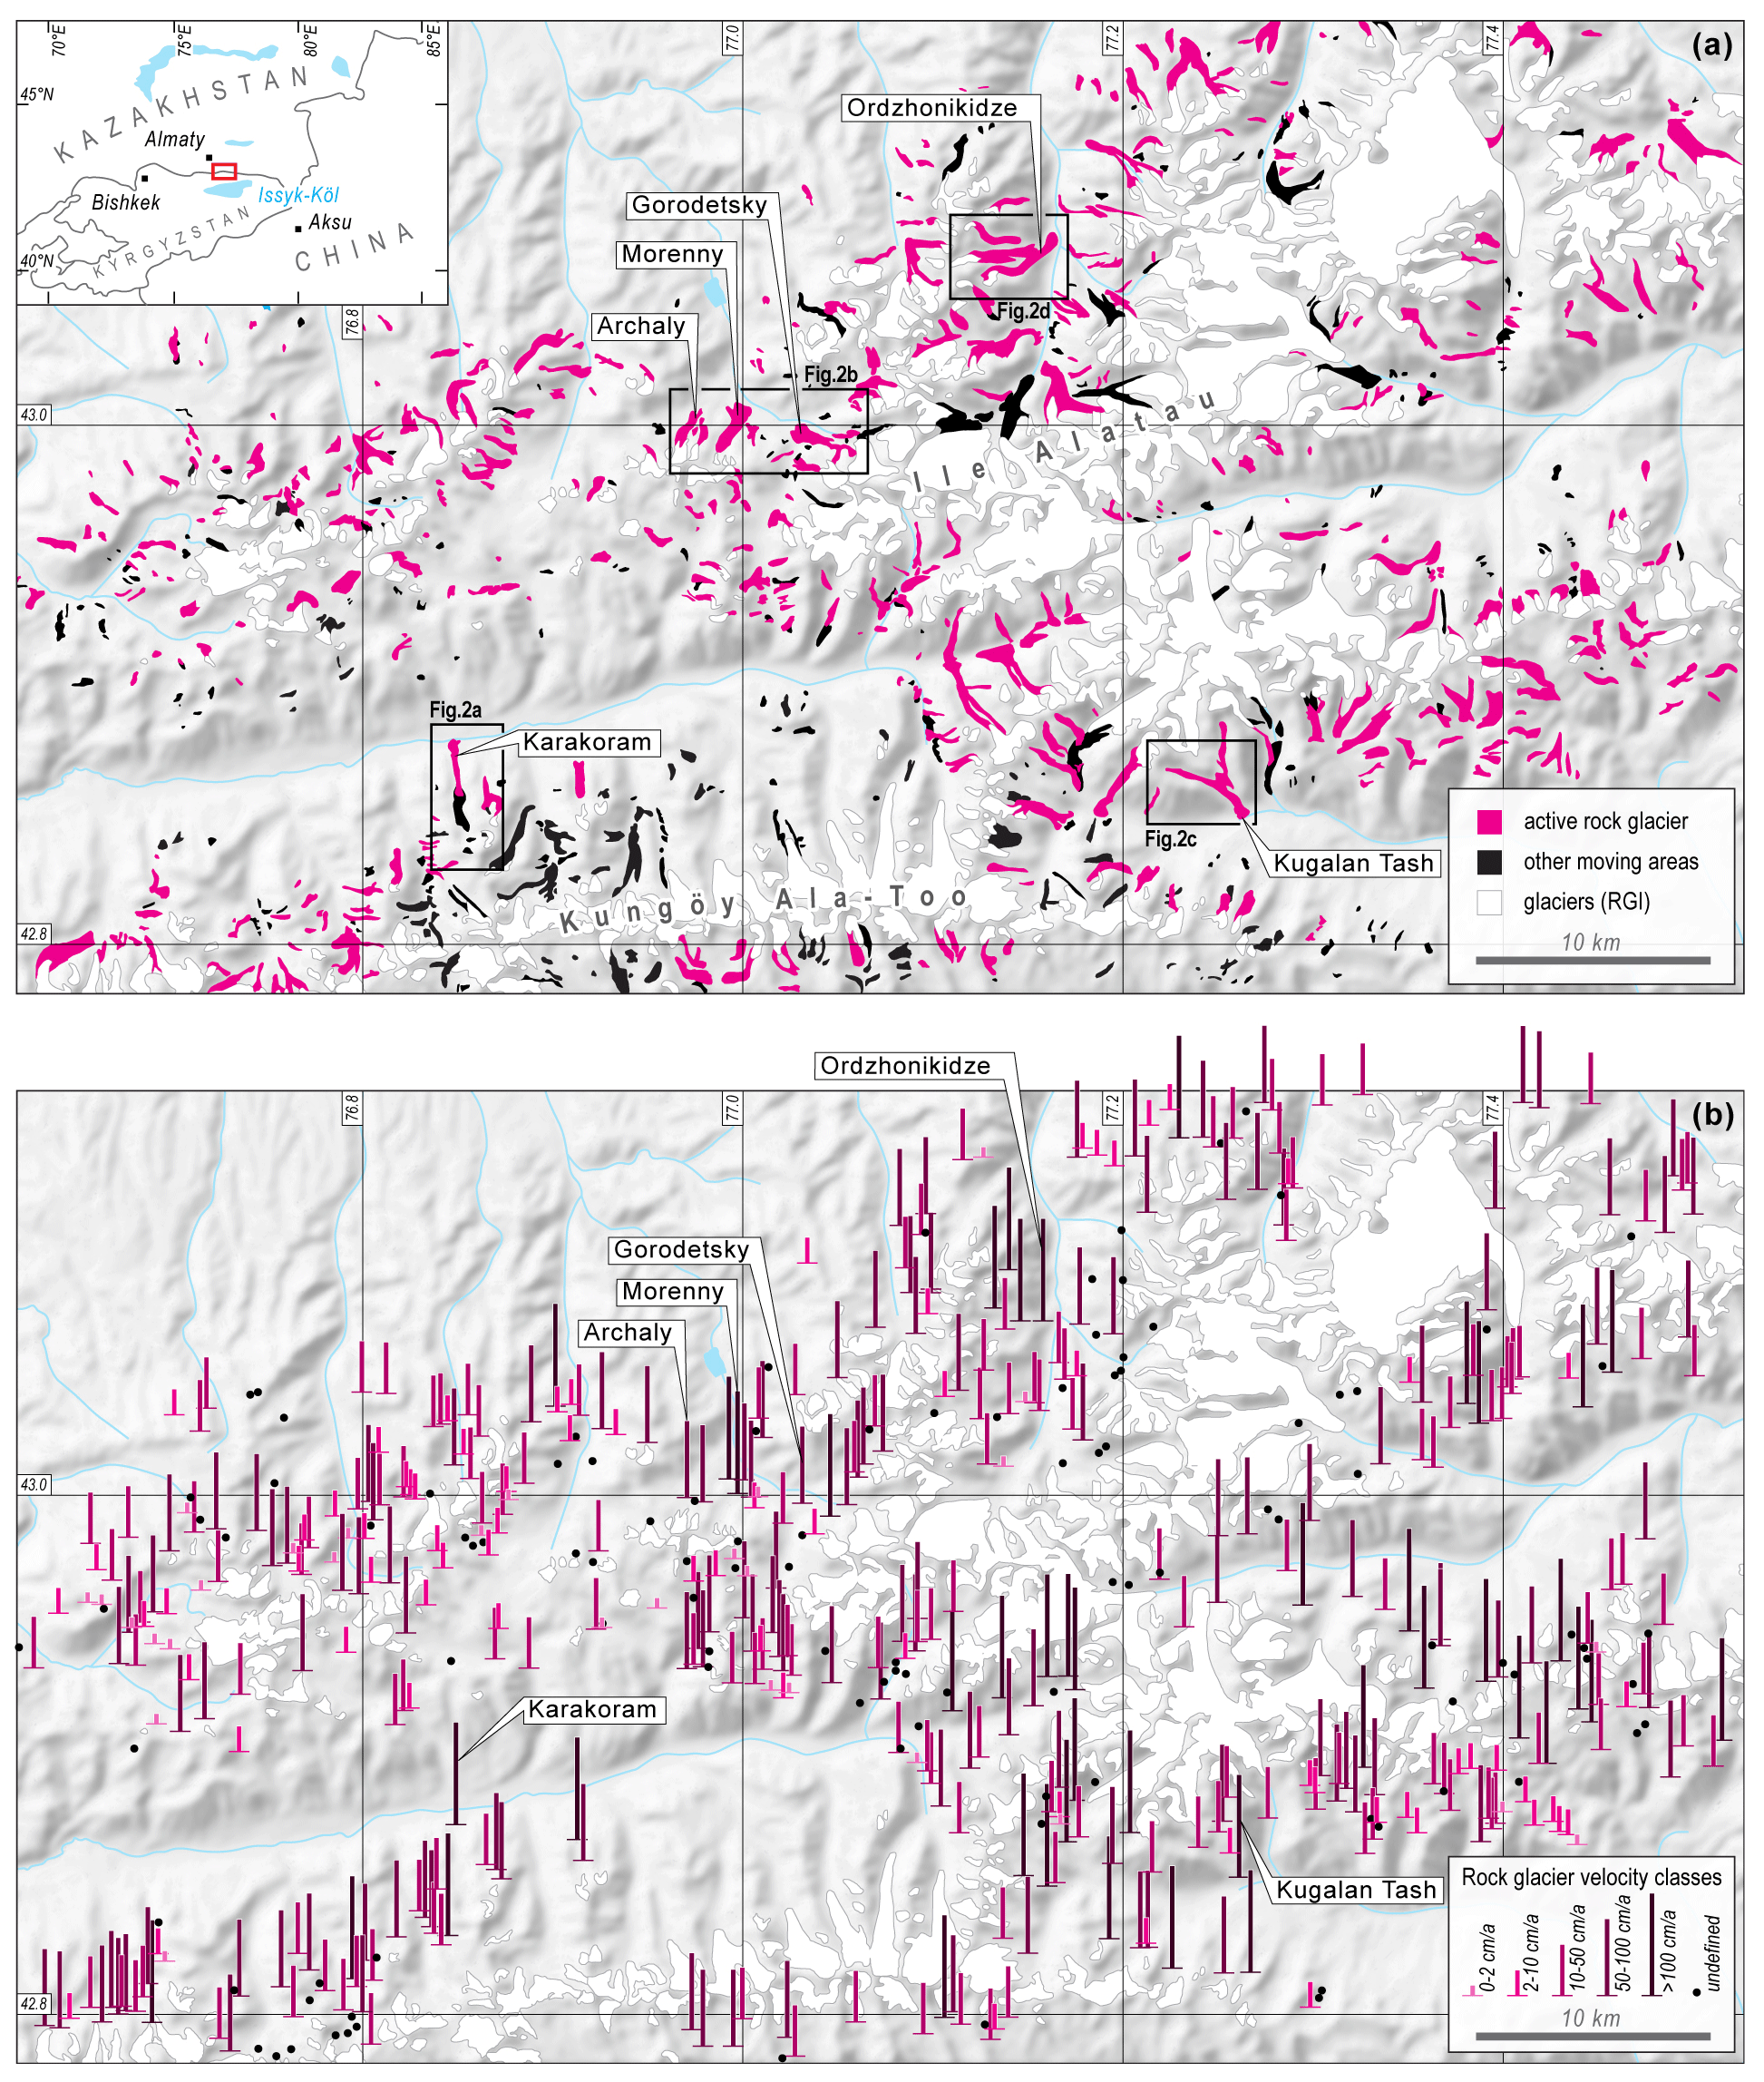
Figure 1(a) Movement inventory of rock glaciers and other forms of surface deformation over parts of the Ile Alatau and Kungöy Ala-Too, northern Tien Shan. (b) Displacement rates are based on satellite radar interferometry, and interpretation of process types is based in addition on high-resolution optical satellite images. The glacier mask is from the Randolph Glacier Inventory (RGI) (Pfeffer et al., 2014). The panel to the upper left indicates the location of the study area (red rectangle). The labels in (a) point to the rock glaciers of which photogrammetric time series of surface speed were constructed, and the rectangles point to detail panels in Fig. 2. Note that the full inventory is available online with all attributes in GIS format (see Data availability section).
The climate of the study region is continental with mean annual precipitation exceeding 1000 mm on the northern slopes but less than 800 mm on the southern ridges and in general for elevations above 3000 m a.s.l. (Bolch, 2007; Narama et al., 2010). Minimum precipitation is typically recorded during winter under the Siberian High. Maximum precipitation is found for spring and early summer. The 0∘ isotherm is estimated at slightly above 2700 m a.s.l. (Bolch, 2007). Ground temperature measurements showed that permafrost occurrence is likely above 3200 m a.s.l. (Gorbunov, 1996). Air temperatures have been increasing since the 1970s with annual rates of about 0.01 ∘C and higher rates during late summer and winter (Bolch, 2007; Marchenko et al., 2007; Narama et al., 2010; Sorg et al., 2012). Ground temperature measurements at depths of 5–25 m at about 3300 m a.s.l. show an increase between 0.3 and 0.6 ∘C from the 1970s to 2004 (Marchenko et al., 2007). All rock glaciers investigated here in more detail using photogrammetry (Gorodetzky, Morenny, Archaly, Ordzhonikidze, Karakoram, and Kugalan Tash) originate in areas where permafrost is very likely, whereas the fronts of the large rock glaciers are often located at elevations slightly below the lower boundary of regional permafrost occurrence (Bolch and Gorbunov, 2014). In the hemispheric-scale 1 km resolution permafrost model by Obu et al. (2019), all the rock glaciers studied in detail have permafrost probabilities > 0.5 and modelled mean annual ground temperatures (MAGTs) between −0 and −2 ∘C. In line with the results from Bolch and Gorbunov (2014), the model indicates that the Karakoram rock glacier reaches down into non-permafrost terrain (MAGT ∼ +1.4 ∘C).
Rock glaciers are widespread in the study area, and some are remarkably large with areas exceeding 2 km2. A first rock glacier inventory was compiled based on aerial photography from the 1970s. More than 1000 rock glaciers (amongst them about 180 inactive ones according to visual interpretation by the below authors) were identified in Ile Alatau and Kungöy Ala-Too, covering a total area of about 90 km2 (Gorbunov and Titkov, 1989; Gorbunov et al., 1998). The average altitude of the active rock glaciers is 3400 m a.s.l.; the lowest elevation of an active rock glacier front is less than 2700 m a.s.l. Most rock glaciers in Ile Alatau are on north-facing slopes, whereas in Kungöy Ala-Too the southern aspect prevails. The highest rock glacier density is found in the central and western part of Ile Alatau as well as in some north-facing side branches of the Chon-Kemin and Chilik valleys where the percentage of glacierized terrain is 10 %–20 % (Titkov, 1988; Gorbunov and Titkov, 1989). Rock glacier density decreases towards the outer parts of the mountain ranges due to decreasing elevations of the ridges. In a more recent inventory, Bolch and Gorbunov (2014) identified 72 rock glaciers in the central part of Ile Alatau and Kungöy Ala-Too based on Landsat ETM+ imagery and aided by aerial images as well as high-resolution satellite images from Google Earth. Blöthe et al. (2019) mapped rock glaciers over high-mountain Asia, including our study region, with the purpose of statistically modelling and detecting those landforms that divert, block, or else impact river channels. One of our study rock glaciers, Ordzhonikidze, is explicitly mentioned in their study, but also the Karakoram and Kugalan Tash rock glaciers studied here clearly divert the river channels at their snout.
Displacement measurements of large boulders on a few large rock glaciers using ground surveys and aerial imagery from 1969, 1979, and 1994 revealed annual speeds between less than 1 m/a and extraordinarily high rates of more than 11 m/a (Gorbunov et al., 1992). On average, there was an increase in the surface speed found between the periods 1969–1979 and 1979–1994, except for the Karakorum rock glacier, which is at the lowest elevation. Displacement rates of individual boulders vary greatly within rock glaciers. There are some areas where the latest measurements show inactivity (Gorbunov et al., 1992; Kokarev et al., 1997). Most of the measured boulders showed displacements in the slope direction, but those rock glaciers reaching the valley floor also exhibit lateral displacement, pointing to a spread onto the valley floor. It was suggested that some rock glaciers in the Tien Shan are subject to rapid advances, maybe caused by earthquakes. This might be the reason why some rock glaciers have been shown to advance into forested areas (Gorbunov, 1983). Four of the rock glaciers studied in Gorbunov et al. (1992) are also investigated in detail in this study, and results are compared in the discussion section of this contribution.
Sorg et al. (2015) used tree-ring growth anomalies from 280 trees growing on rock glaciers in the study area, or close to it, as an indicator for rock glacier activity and compared their results to climatic data and detailed glacier mass balances for the period 1895–2011. They find that the activity of the rock glaciers studied correlates well with decadal variations in summer air temperatures and glacier mass balance – rock glacier activity and tree growth anomalies are positively linked to high summer temperatures and inversely to glacier mass balances. As a secondary focus, these authors also use preliminary offset tracking between repeat aerial and satellite imagery to show that on a multi-decadal scale the variations in rock glacier speeds show more contrasting and site-specific changes, with accelerations and decelerations, both varying over time and even within the same rock glacier system. They attribute this behaviour partially to the different stages of the rock glaciers on their path towards inactivation under continued atmospheric warming in the region. Sorg et al. (2015) did not use radar interferometry in their study nor compile a kinematic rock glacier inventory. It is the offset tracking work started in Sorg et al. (2015) that we extend in the second part of the present study in terms of data and time steps, number of rock glaciers, and methods used. The specific rock glaciers studied to this end are Morenny, Archaly, Gorodetzky, Ordzhonikidze, Kugalan Tash and Karakorum (Fig. 1). These rock glaciers were chosen because they were the focus of previous studies including rock glacier monitoring work, and they were the only ones with suitable aerial images for time series measurement available to us. More details about these rock glaciers are introduced under the Results section.
3.1 Radar interferometry
An inventory of rock glaciers and other periglacial processes in the Ile and Kungöy ranges of the northern Tien Shan was compiled in this study by visual analysis of differential SAR interferograms and satellite optical images. We computed differential SAR interferograms (DInSAR) with short baselines and time intervals between 1 d and 1 year from the ERS-1/2 tandem mission (1998–1999), ALOS-1 PALSAR-1 (2006–2010), ALOS-2 PALSAR-2 (2014–2016), and Sentinel-1 (2015–2018, Supplement Table S1). Images acquired along both ascending and descending geometries and during summer (snow-free) and winter (dry-snow) conditions were employed. For topographic reference and orthorectification, we computed a DEM from TanDEM-X data at a spatial resolution of 10 m. Bistatic TanDEM-X acquisitions along ascending (13 and 24 January 2012) and descending (15 December 2013 and 6 January 2014) orbits were combined to reduce problems in areas masked by layover and shadow, which differently affect opposite slopes along north–south-oriented valleys in mountainous regions (Ambrosi et al., 2018). In general, we estimate the errors due to atmospheric distortions and noise in the DInSAR images to be on the order of one-fourth of a phase cycle (i.e. one-eighth of the radar wavelength used) (Strozzi et al., 2001). All processing was done using the GAMMA radar software.
By combining interpretation of all interferograms, signals related to the motion of periglacial phenomena over various time intervals were first identified from the wrapped interferometric signals following the recommendations given in Barboux et al. (2014) and marked as point features. In a second step, the extent of the InSAR movement signals was mapped based on the interferograms, and in addition supported by optical high-resolution imagery from Google Earth/Map and Bing Maps. Next, the deformation rates of the mapped landforms were classified using five classes (i.e. 0–2, 2–10, 10–50, 50–100, and > 100 cm/a). In short, interferogram interpretation and estimate of movement class are based on a large stack of interferograms, not only 12 d Sentinel-1 interferograms as shown in the figures. In suitable interferograms, movement fringes were counted for moving areas with phase coherence, and this fringe count was converted to line-of-sight movement using the respective radar wavelength. Confined areas of coherence loss (fringe noise) can be due to high surface speeds that decorrelate the interferometric signal. The choice of classes was routed in guidelines from the Swiss government for landslide, rockfall, and debris flow hazard management, which was the only such recommendation with respect to radar interferometry available at the time of inventory compilation and is certainly open to discussion. An updated version of the openly available inventory will rather follow classes meanwhile suggested by an international working group (IPA Action Group, 2020). In cases where the estimated velocity was close to the upper boundary of a velocity class, the polygon was assigned to this faster class as the one-dimensional line-of-sight measurement provided by radar interferometry represents only one movement component and thus typically underestimates the actual three-dimensional surface movement. The same was done with natural temporal variations in surface displacement rates; i.e. if two or more classes were present during the observation time span, the highest displacement rate was used to determine the velocity class. Because the interferometry-derived displacement rates are measured along the satellite line of sight, we empirically considered the line of sight in the assessment of the state of activity of the mapped landforms (see above). Approaches to rock glacier kinematics inventorying from radar interferometry are currently developing much (IPA Action Group, 2020). At the time of compilation of our inventory, it was practice to rely on expert decisions based on wrapped interferograms. For current compilation of such inventories, recent computational and data availability advances are exploited to further process interferograms, for instance accounting for variable line of sights or exact time intervals.
In the final step of our analysis, the specific interferometric fringe pattern, optical images, and shaded relief of the DEM were visually interpreted to classify the process types associated with the observed slope movements. In addition to the rock glaciers as the main objective of this study, movements related to solifluction and debris movements, dead ice and subsidence, debris-covered glaciers, and ice-cored moraines were classified. Related recommendations from an international working group (IPA Action Group, 2020) were not yet available at the time of inventory compilation. High-resolution satellite images were the main source for the classification into the above classes. In cases of missing information due to low resolution or cloud cover in the images, the interferograms were consulted as a secondary source for the interpretation. The following exemplifies some considerations taken during the expert decision. For instance, rock glaciers usually show an overall increase in speed towards the front and inner region of the polygon mapped, which helps to identify them against other movements. Rock glaciers can be discriminated from debris-covered glaciers by thermokarstic features such as supraglacial ponds, which lead to loss of radar phase coherence and are visible in optical or even radar data. In addition, ice is sometimes visible in high-resolution optical images. Melting dead-ice bodies have characteristic spot-like fringe patterns from local subsidence that are visible only in late-summer interferograms. Similar appearance in the interferograms can sometimes be observed for debris movements (soli-/gelifluction). This process type is, though, typically found on inclined slopes but lacks large-scale compressional features (lobes). Ice-cored moraines are connected to the former lateral or terminal moraines of a retreated glacier, a situation that can often be recognized in all kinds of image and topographic data. For cases where the InSAR signal could not be unambiguously assigned to a process type and where optical images and DEMs were also not of help or not available with sufficient quality, an “undefined” class was introduced.
Above the maximum inventory movement rate of 100 cm/a, motion could not be quantified anymore using radar interferometry, but detection was still possible. This maximum measurable displacement rate depends not only on the wavelength used, but also on the movement type (e.g. spatially coherent vs. locally variable) and terrain (e.g. terrain slope relative to radar incidence angle or movement azimuth relative to satellite azimuth). In the case of Sentinel-1 interferograms, for instance, assuming a maximum measurable displacement rate of half a wavelength (2.8 cm) (Villarroel et al., 2018) gives for the shortest temporal baselines available over the study area (12 d) a maximum value of 85 cm/a. One reason for classifying decorrelated areas in the > 100 cm/a class is that motion decorrelation usually happens under higher displacements than this minimum value of 85 cm/a. A second reason is that the topographic correction factor is in realistic cases not lower than 1.1–1.2, making a line-of-sight displacement rate of 85 cm/a rather belong to a landform of the > 100 cm/a class. Data from the ERS 1 d tandem phase were not good enough, likely due to snow melt and snow changes, to quantify motion in areas that were decorrelated in interferograms from other sensors.
Currently, methods for computing seasonal time series of rock glacier speed from repeat radar interferometry are being developed (Strozzi et al., 2020), but these methods and time series of suitable data were not yet fully available at compilation of the kinematic inventory of this study. Further, producing such time series for a number of rock glaciers would have by far exceeded the resources available for our study.
3.2 Matching of repeat optical images
For four sites with rock glaciers in the study area (Gorodetsky, Morenny, Archaly; Ordzhonokidze; Kugalan Tash; Karakorum; Fig. 1), decadal-scale variations in speed were estimated based on offset tracking between repeat optical images. The radiometric quality, distortions, and sensor types used in this study were very different. Roughly, we used three categories of data: historic aerial images, historic spy satellite images, and contemporary high-resolution satellite data (Table S2). The contemporary satellite images from the DigitalGlobe (now Maxar) constellation or Pléiades were oriented using standard procedures based on the provided rational polynomial function coefficients and checked with a few control points extracted from Google Earth. Over the Gorodetsky–Morenny–Archaly rock glacier group, Pléiades stereo data were available. A corresponding digital elevation model (DEM) was therefore constructed, and the satellite images were orthorectified based on this DEM. For the other three sites without their own DEMs produced, orthoimages were computed using the C-band SRTM DEM (30 m resolution), the ALOS PRISM AW3D DEM (commercial version, 5 m resolution version), and the TanDEM-X WorldDEM (commercial version, 12 m resolution version). The high-mountain Asia DEM (Shean, 2017) – produced with stereo data from the DigitalGlobe/Maxar archive – was also investigated; it turned out to be very good for the Karakoram and Ordzhonikidze rock glaciers but showed large voids over the Kugalan Tash rock glacier. Based on the analysis of these different DEMs such as from DEM differences, level of detail, and void cover, and based on the distortion patterns over stable ground between the corresponding orthoimages produced, it was decided to use the TanDEM-X WorldDEM for the generation of the orthoimages, except for Gorodetsky–Morenny–Archaly where the Pléiades DEM was used. At the time of processing, the TanDEM-X WorldDEM appeared to be the most complete, detailed, and consistent DEM over all sites. The orthoimages generated from the contemporary optical satellite data served as a source of georeference for the older images.
The aerial images used in this study stem from Soviet-era archives, and the digital copies available to us were of very variable quality, typically scans of copies of the original images using consumer-grade scanners, or similar. The images had thus significant distortions and very variable radiometric contrast. No camera calibrations were available. In addition, we used high-resolution declassified spy satellite images from Corona missions (KH-4A and KH-4B) (Altmaier and Kany, 2002; Bolch et al., 2008; Narama et al., 2010; Goerlich et al., 2017). These images have a complex panoramic geometry, in addition to film distortions. Thus, to both the aerial and Corona images, no rigorous sensor models were applied, but rather empirical models were used consisting of fourth-order rational polynomials computed from around 40–50 ground control points at each site. Ground control was extracted from the contemporary satellite orthoimages and DEMs. All processing of the optical data was done using the PCI Geomatica software (version 2018sp1).
Eventually, horizontal displacements were measured between pairs of the orthoimages using standard subpixel-level normalized cross-correlation (Kääb and Vollmer, 2000; Debella-Gilo and Kääb, 2011; Kääb, 2021). For the contemporary satellite images and some particularly good 20th-century images, entire flow fields could be measured successfully. For the majority of the older image data, the resulting velocity fields contained substantial areas were image matching failed, as indicated by low correlation values, or vectors pointing randomly at different directions. Time series were only constructed for points that had reliable measurements for all periods, i.e. measurements that passed thresholds on correlation coefficients (depending on individual image quality, but usually between 0.4 and 0.6) and manual removal of obvious outliers. The time series shown in the following results and figures are average time series for all individual measurements within manually delineated zones. These zones are also shown in the figures. The purpose of creating such time series zones was to focus on central rock glacier parts with substantial movement and to exclude rock glacier parts that were considered less representative, for instance due to location at the margins of the rock glacier (system) or due to uncertain measurements. Even for these averaging zones, the low number of suitable measurements in the historical images typically limited the choice of clusters of points with available time series. The accuracy of temporal speed variations was then evaluated using three measures: (i) speeds on stable ground (for Gorodetsky, Morenny, Archaly, and recent periods for the other rock glaciers only), (ii) variation in speeds within the point clusters (spatial variance), and (iii) variation in speed variations between periods and clusters (spatio-temporal variance). Potential uncertainties in the time series are thus given as the normalized median absolute deviation (NMAD; Höhle and Höhle, 2009) of stable ground speeds (red error bars, i), as the standard deviation of speeds over one period (blue error bars, ii), and as standard deviation of speed differences between two periods (grey error bars, iii). The purpose of error bars (ii) is to visualize the homogeneity of speeds within a cluster. Variations in this measure over a time series then give hints at measurement uncertainties, under the assumption that the velocity pattern within the cluster is not changing strongly over time. The error budget resulting from the highly variable quality of the base images and their georeferencing and from the DEMs used for their orthorectification, and the offset tracking procedure is examined in more detail in the Discussion section of this study. The reason why stable ground offsets were included as error bars for the Gorodetsky, Morenny, and Archaly rock glaciers only is that these three landforms are surrounded by large areas of flat terrain, a surface type and topography that we considered representative for the rock glaciers themselves. The other rock glaciers are in large parts surrounded by steep terrain with a large number of image-matching problems and larger impacts from DEM errors on the image orientation and orthorectification, in particular for the aerial and Corona photos. Automatic processing of robust and meaningful stable ground error bars was thus not feasible for the time series of the other rock glaciers, and respective errors are given in the result text where available.
In a supplementary analysis, we also relate the advance rates of rock glaciers to the surface speeds above the fronts. The ratio between both quantities is a function of the ice content that melts out at the front, and the vertical profile of horizontal speeds, i.e. the total material flux into the front (Kääb and Reichmuth, 2005). We roughly estimate the advance rates by measuring some 10 manually selected distances along the main flow direction between repeat positions of the front base using flickering orthoimages of modern-era high-resolution satellite images. It is clear that such an estimate of advance is coarse and difficult anyway due to local variability from falling boulders and erosions. Our aim is thus only to investigate large differences between rock glaciers in a qualitative way. Detailed quantitative analysis of such advance rates would require disentangling the compound effects of ice content and vertical velocity profile, which is to our best knowledge not possible using air and satellite images. Respective conclusions are only possible when the ratio between advance and surface speed is very small (approaching zero; pointing to a very high ice content melting out and/or very shallow moving layer, both preventing strong advance) or approaching 1 (very low ice content and little decrease in horizontal speeds with depth, i.e. so-called block movement). Also, the resolution and quality of the image data available to us are not sufficient to measure time series of advance rates.
Extending photogrammetric time series to other rock glaciers in the region would be of high value, but the large difficulties of acquiring Soviet-era aerial photos, the high costs of the modern commercial high-resolution satellite images, and the large effort necessary to process the data consistently from very different sensors and with very different qualities prevented us from extending the time series to even more rock glaciers as already done in this study.
4.1 Rock glacier motion inventory
The inventory of rock glacier creep speed and movement of periglacial and glacial processes over the Ile and Kungöy ranges of the northern Tien Shan covers a surface of more than 3000 km2 and includes more than 900 landforms, namely 551 rock glaciers, 184 solifluction features/debris movements, 46 dead-ice/subsidence forms, 18 debris-covered glaciers, and 14 ice-cored moraines (for inventory access see Data availability section). Finally, 98 features remained undefined due to the lack of good-quality high-resolution images available at the time the inventory was created. Of the active rock glaciers, which are homogeneously distributed over the study region, 45 were characterized by a rate of motion exceeding 100 cm/a. We identified 21 large rock glaciers exceeding 1 km2 in size with the largest being about 2 km2. The mean rock glacier size is 0.27 km2. Some of the largest rock glaciers also have the largest elevation difference of up to 1500 m. Several rock glaciers extend below 3000 m a.s.l., with the lowermost elevation of active rock glacier fronts being at about 2700 m a.s.l., amongst them the Karakorum and Ordzhonikidze rock glaciers, which are analysed in more detail in this study. The highest rooting zone of a rock glacier is situated above 4000 m, and the mean elevation is 3480 m. Six rock glaciers within the class > 100 cm/a were further analysed in this study by matching of repeat optical images: Gorodetsky–Morenny–Archaly, Ordzhonikidze, Karakoram, and Kugalan Tash (Fig. 1).
A selected Sentinel-1 interferogram for all these rock glaciers demonstrates how the motion cannot be quantified over large parts of the rock glaciers as no consistent movement fringes are present (Fig. 2). However, the moving areas can still be detected and mapped even if movement fringes cannot be reliably unwrapped (i.e. integrated) into displacement rates or coherence is completely lost.
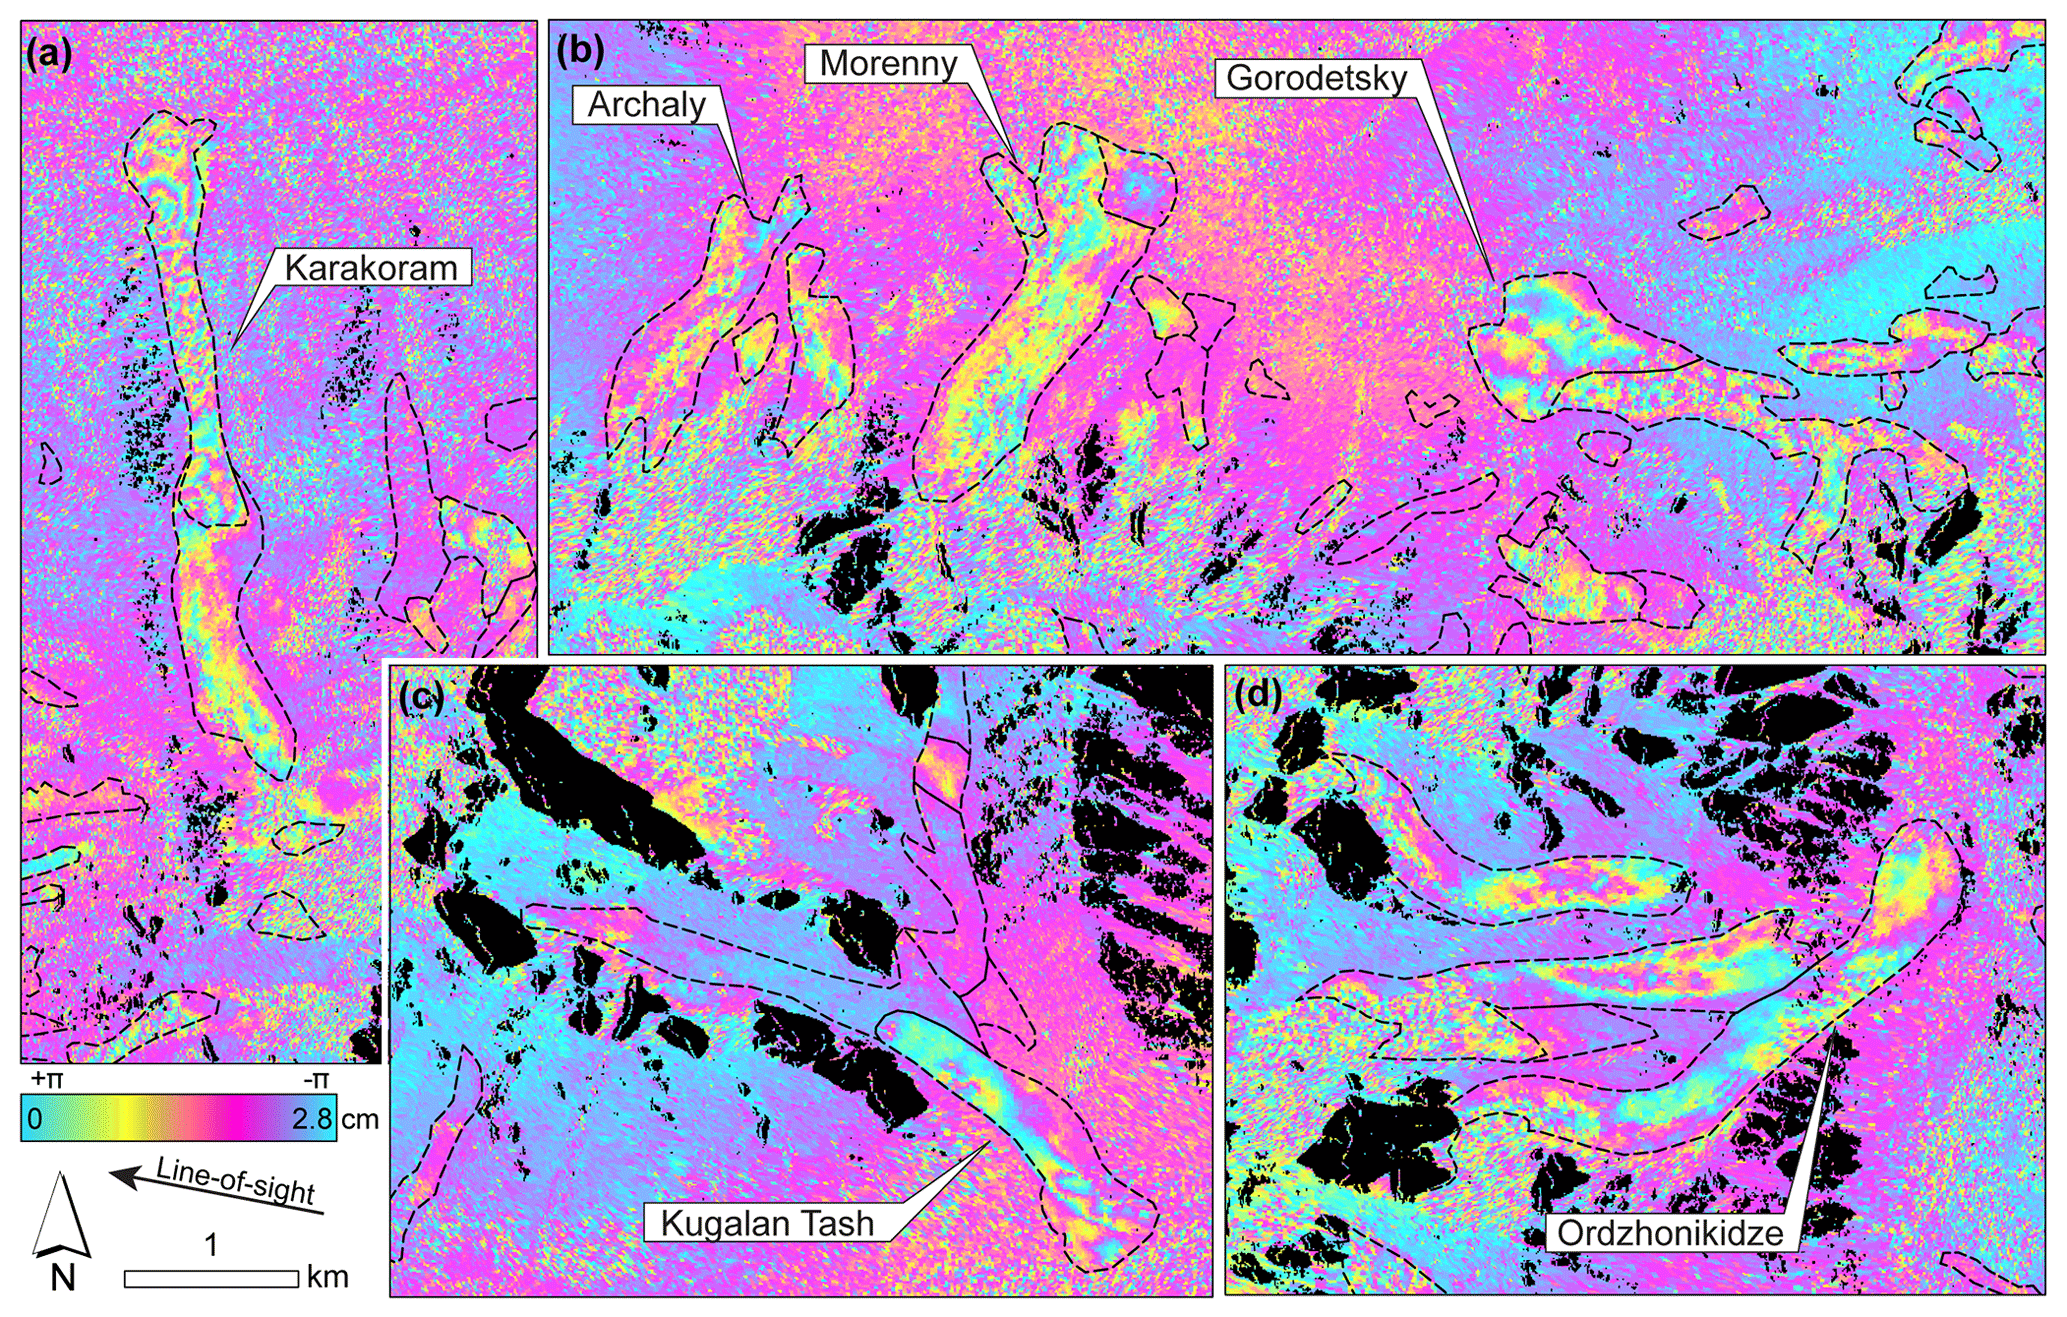
Figure 2Wrapped orthorectified interferogram between descending Sentinel-1 C-band radar (5.6 cm wavelength) data on 24 August and 5 September 2018 (12 d). Black areas are due to radar layover and shadow. The black dashed lines are the inventory outline polygons from our motion classes. Panels (a)–(d) show interferogram sections of the rock glaciers investigated in detail photogrammetrically.
4.2 Detailed flow fields and 60-year time series
4.2.1 Gorodetsky, Morenny, and Archaly
Surface velocities from matching repeat images, in the following termed “photogrammetric velocities” for short, between 2012 and 2016 (for exact dates and image sources see Table S2) over the Gorodetsky rock glacier (Fig. 3a) show a pattern of coherent viscous flow, with several zones of comparably high speed (Fig. 3c). The highest speeds of up to 1.4 m/a are found along the lower southern margin of the rock glacier, which agrees well with the interferograms (Fig. 2) where the strongest signs of coherence loss (noisy fringes) are found over the same zone. The NMAD of stable ground offsets for 2012–2016 is 0.25 m (0.06 m/a). The Gorodetsky rock glacier seems to be connected to the forefields of five glaciers, three of which are visible in Fig. 3a, whereas two are located more to the east. The zones between the present-day glaciers and the main rock glacier do not show any significant movement. Close inspection of the repeat high-resolution optical images and the interferogram Fig. 2b rather reveals a mixture of areas characterized by rapidly changing thermokarst features, such as melt ponds, melt depressions, or small slope instabilities, and areas that appear stable and without any visible ice-related activity. Together, these lines of evidence suggest that today the rock glacier has no direct contact with the glaciers.
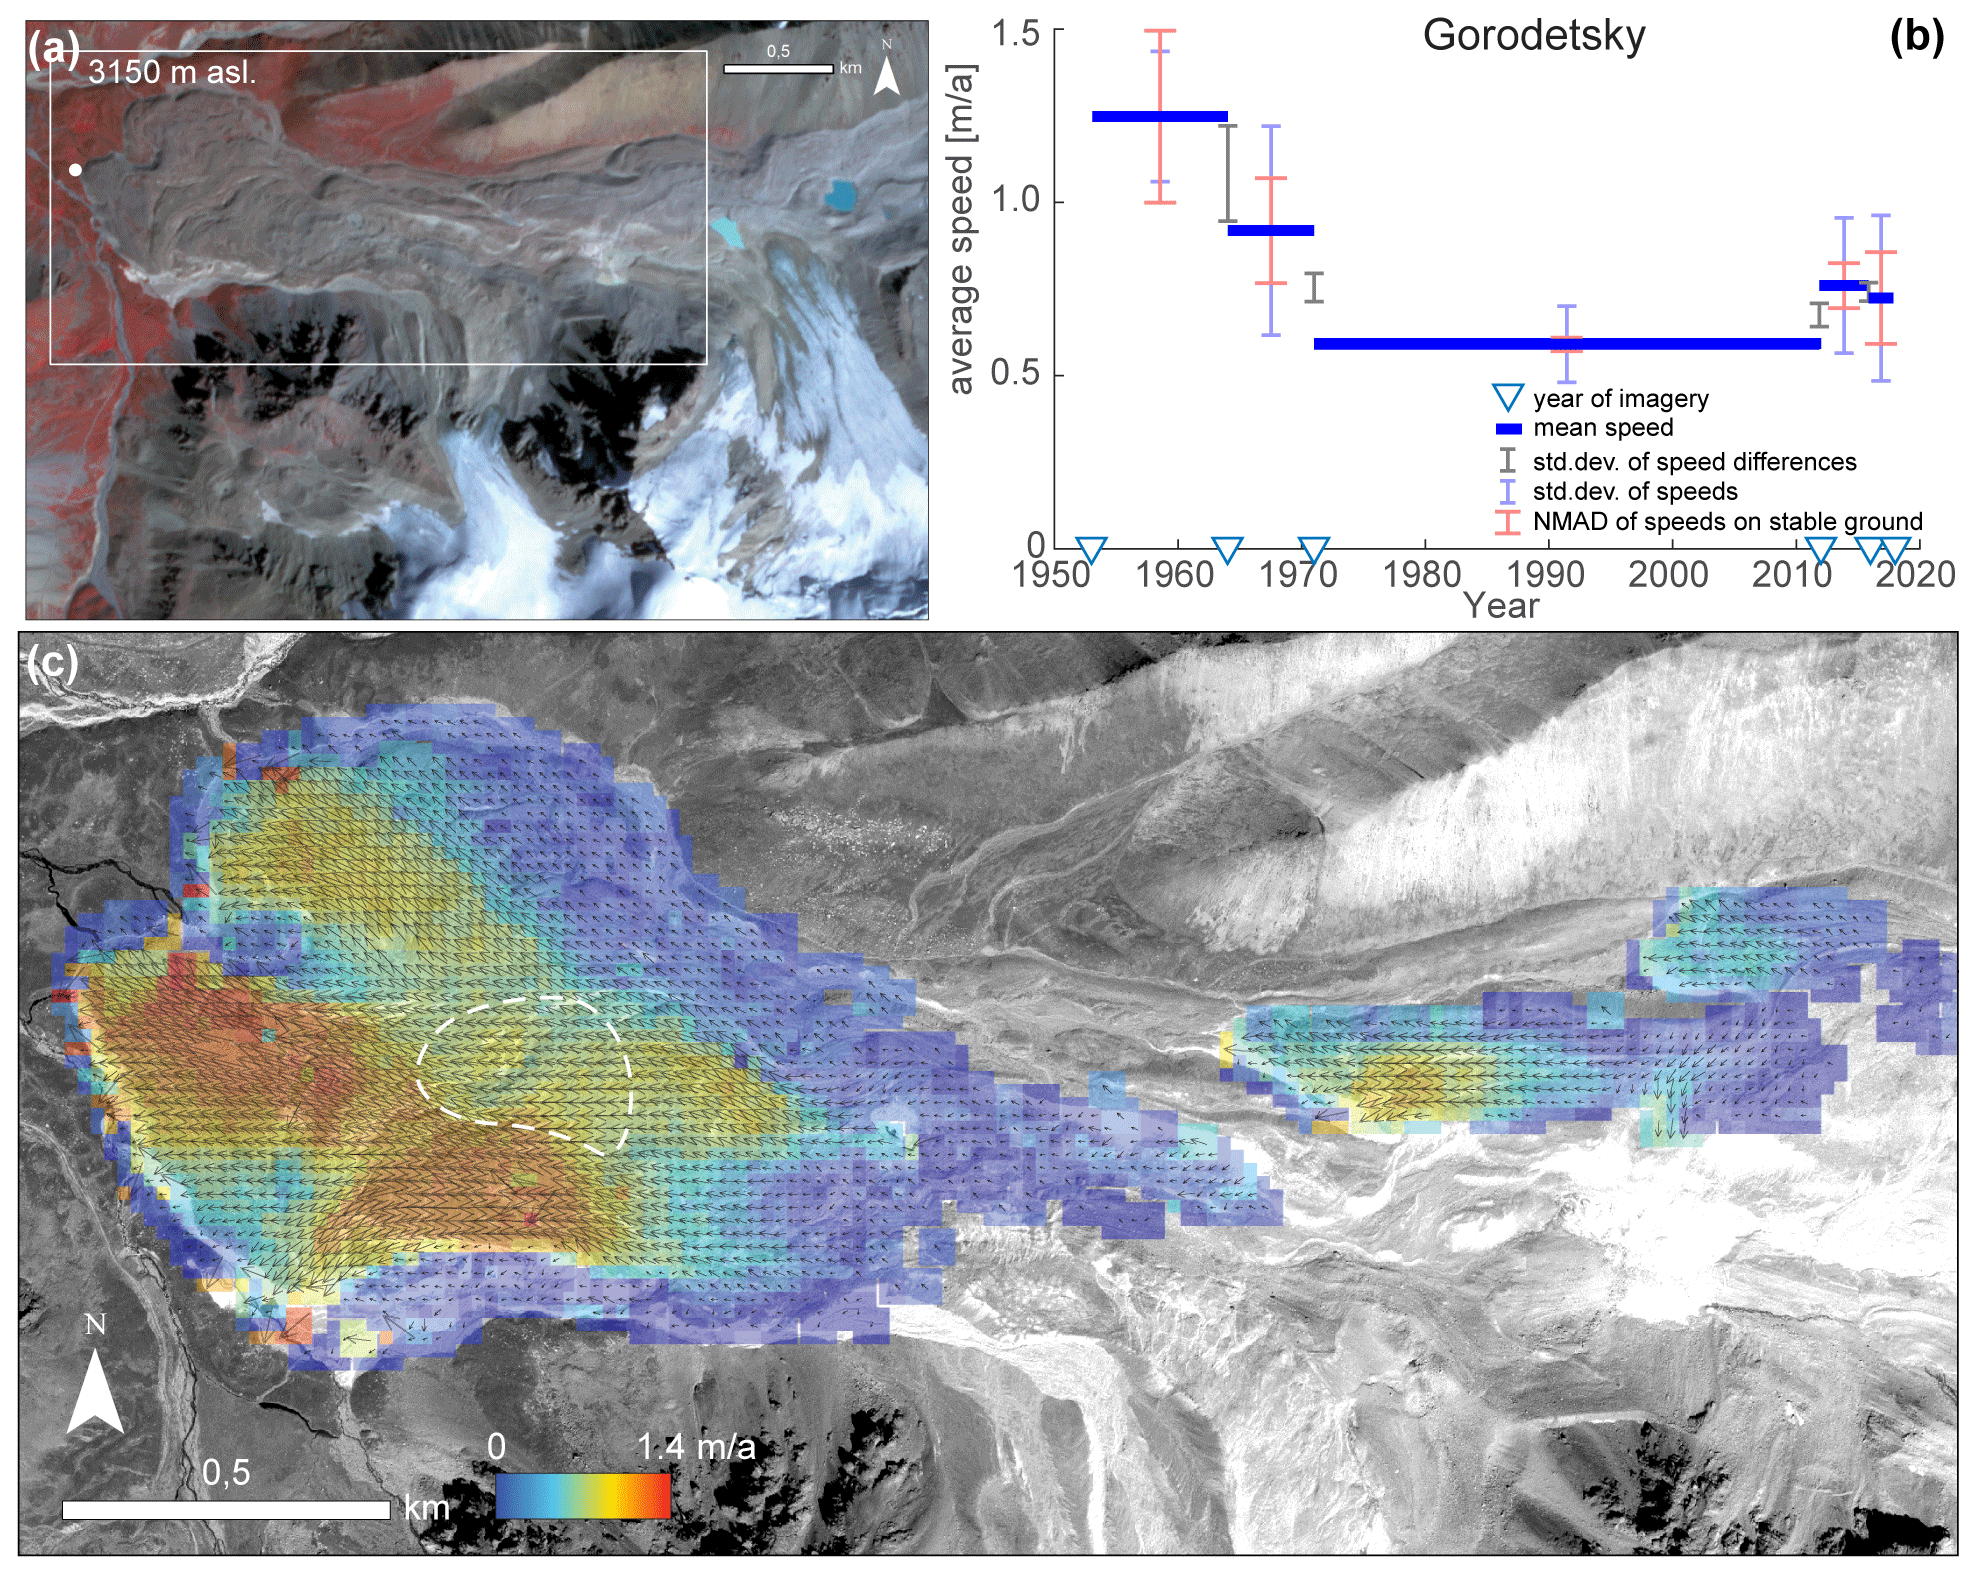
Figure 3Velocities and speed variations on the Gorodetsky rock glacier. (a) Overview image; © Planet image on 7 September 2016 in near-infrared–red–green R–G–B composition. (b) Average time series of speeds for a cluster of points (white dashed outline in panel c). Error bars give normalized median absolute deviations (NMADs) of stable ground speeds (red), standard deviations of speeds within the point cluster (blue), and standard deviations of speed differences within the measurement periods (grey) in m/a. Blue triangles on the time axis indicate years of imagery used. (c) Colour-coded velocity field with vectors superimposed from image matching between 2012 and 2016 high-resolution satellite images (for exact dates and sensors see Table S2). Background image: Pléiades, 27 August 2016 © CNES (2016), and Airbus DS (2016).
A time series of speeds for a cluster of points (ca. 45) in the central portion of the rock glacier (white dashed outline in Fig. 3c) suggests a decrease in speed from 1953 to 2012. By contrast, over the period 2012–2018, we measured a slight increase in speed, though hardly exceeding the error bars. The large gap of data between 1971 and 2012 prevents a more detailed assessment and only enables measurement of average speeds over a large part of the observation period.
The results for the Archaly and Morenny rock glaciers are comparable to those obtained for Gorodetsky, except that the 1953 aerial image covers only Gorodetsky. The forefields connecting the rock glaciers and the glaciers above them (Fig. 4c) show clear signs of thermokarstic ice degradation and slow or no movement as well, but the evidence is spatially less extensive than at Gorodetsky. A distinct fast-flowing branch (up to 2.5 m/a) diverts from the mainly south–north-flowing Morenny rock glacier towards the northwest (Fig. 4e). The InSAR results (Fig. 2) are consistent with the velocity field (Fig. 4e) in that they show coherent fringes over much of the slower-moving part of the rock glacier but strong noise from phase coherence loss over the fast-moving lateral branch. Overall, the Archaly rock glacier moves faster than Morenny (Fig. 4d), which is also reflected in the more decorrelated interferometric phases (Fig. 2). Though, on the central part of the Morenny rock glacier, speeds are also on the order of > 100 cm/a, in a zone just above the time series cluster, i.e. consistent with the interferogram interpretations (Fig. 1). The time series for the Archaly (∼ 40 points) and Morenny (∼ 75 points) rock glaciers (Fig. 4a and b) look similar to that of Gorodetsky for 1964 onwards, though with larger speed increases relative to their error bars.
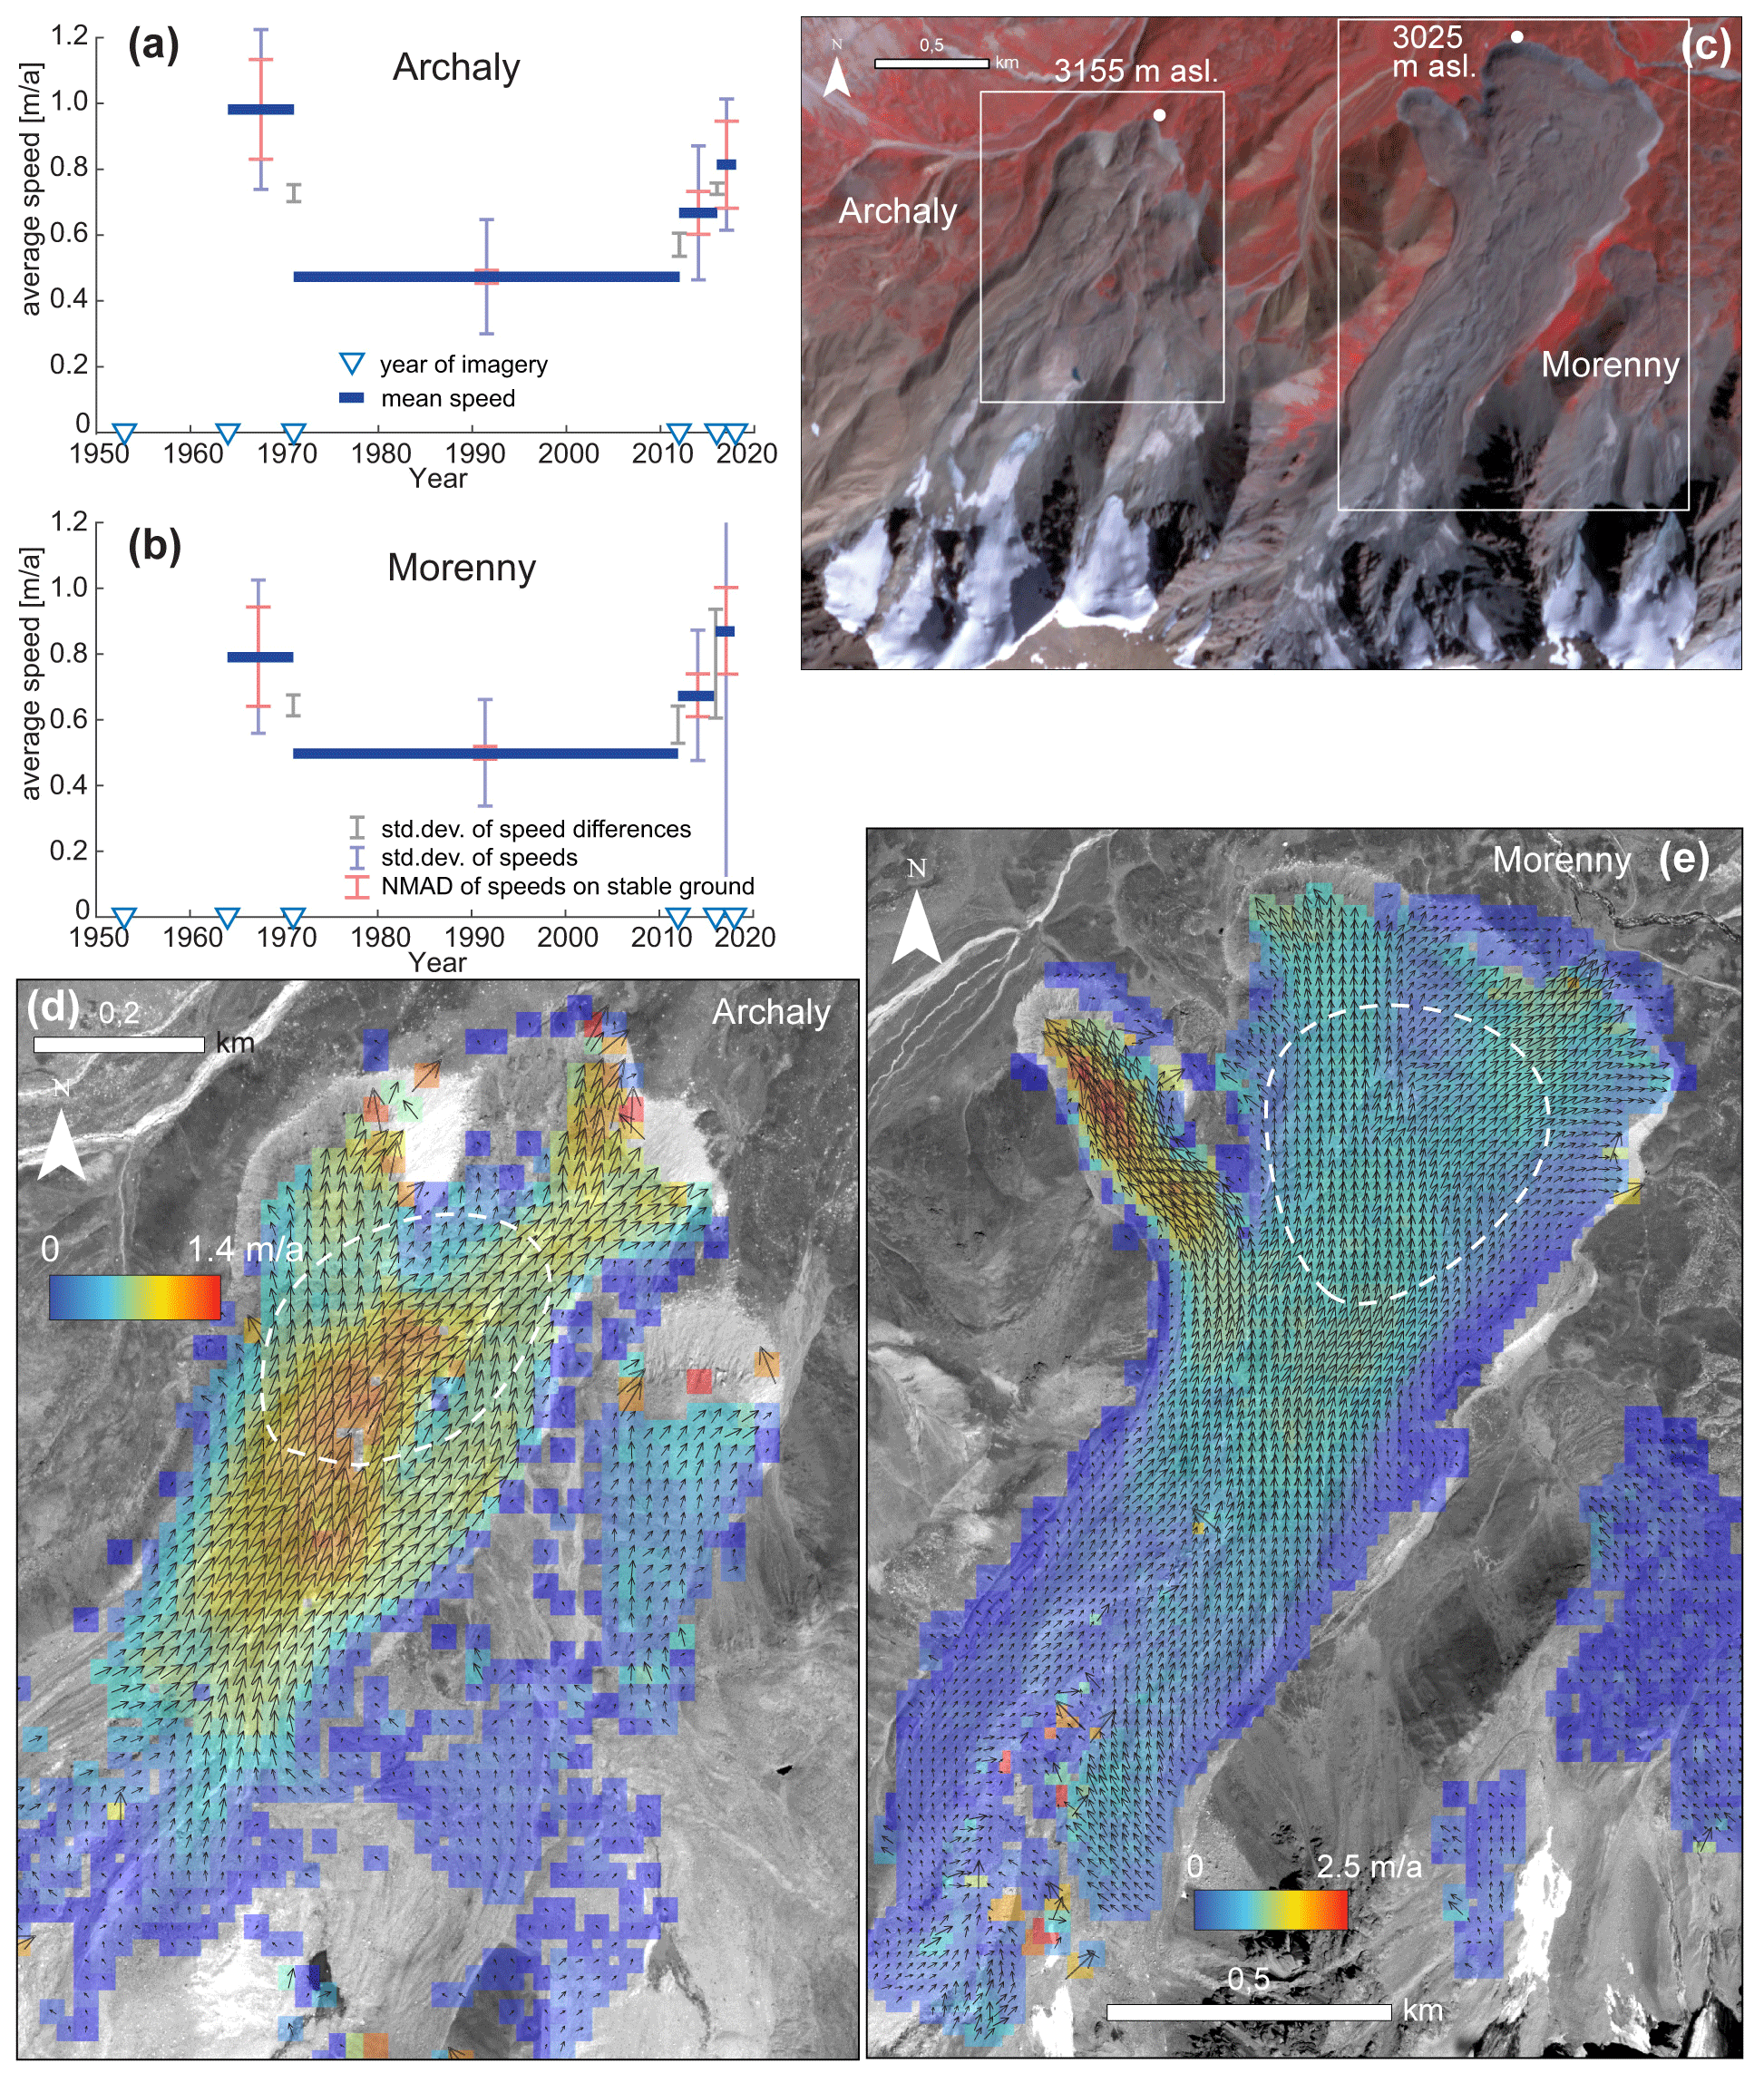
Figure 4Velocities and speed variations on the Archaly and Morenny rock glaciers. (a, b) Average time series of speeds for clusters of points (white dashed outline in panels d and e). Error bars give normalized median absolute deviations (NMADs) of stable ground speeds (red), standard deviations of speeds within the point cluster (blue), and standard deviations of speed differences within the measurement periods (grey) in m/a. Blue triangles on the time axis indicate years of imagery used. (c) Overview image; © Planet image on 7 September 2016 in near-infrared false colour. (d, e) Colour-coded velocity fields with vectors superimposed from image matching between 2012 and 2016 high-resolution satellite images (for exact dates and sensors see Table S2). Background image: Pléiades, 27 August 2016, © CNES (2016), and Airbus DS (2016).
The long time series of aerial images and satellite images allow an estimation of advance rates of the rock glaciers and the relation of these to surface speeds above the fronts. Advance rates in 2012–2018 at the southern branch of the Gorodetsky rock glacier are roughly 0.8 m/a, and the 2012–2016 surface speeds are around 1.2 m/a, giving a ratio of around 0.67. In addition, we measure a similar average advance in 1953–2012 of 0.7 m/a. The fast-creeping western branch of the Morenny rock glacier shows very little advance but surface speeds above the front of 2 m/a, giving a very small advance ratio between both, equivalent to a very shallow sheet of creeping material and/or very ice-rich material. The Archaly rock glacier showed advance rates of roughly up to 0.3 m/a, with 2012–2016 surface speeds of around 1.1 m/a, and thus an advance ratio of around 0.3. Note that these ratios are a function of both the ice content melting out at the front and the vertical variation in horizontal velocities, which cannot be separated from our measurements.
4.2.2 Karakoram
The velocity field on the Karakoram rock glacier (Fig. 5a, c) shows one coherent stream of material from a partially ice-covered rock wall (Fig. 5a). A few thermokarst depressions and lakes are found in the root zone of the rock glacier. The lowermost part of the rock glacier hosts significant vegetation including dozens of trees (Sorg et al., 2015), visible in red colour in the infrared false colour composite Fig. 5a. Maximum speeds recorded over 2009–2017 reach up to 6.5 m/a. Speeds in the upper part of the rock glacier, in the zone of thermokarst features, are on the order of a few dm/a. The NMAD of stable ground offsets for 2009–2017 is 0.65 m (0.08 m/a), but matching quality around the rock glacier is clearly lower than on the rock glacier. The high speeds of the Karakoram rock glacier are consistent with the interferogram given in Fig. 2, where strong phase noise is visible. The high speeds and associated surface changes result in a situation in which a larger number of points with valid velocity measurements over all measurement periods can only be found in the lowermost portion of the rock glacier. There, the average of the point cluster (ca. 20 points) shows a steadily increasing speed over the period from 1960 to 2017 (Fig. 5b). Available aerial images from 1977, 1985, and 2008 have not been used in this time series because they were of too low quality to enable reliable measurements, or their dates were too close to other image dates so that measurements did not exceed the measurement noise level. The advance rate of the Karakoram rock glacier can only be measured in a meaningful way in the northwestern portion of the rock glacier front as the other parts of the front terminate in a river. In this northwestern part of the front, the advance rate (∼ 1 m/a) is very similar to the surface speeds above the front, leading to a ratio close to 1. This result points to block movement of the entire rock glacier column (i.e. little decrease in horizontal speeds with depth until a basal shear horizon) and very little ice content left at the front.
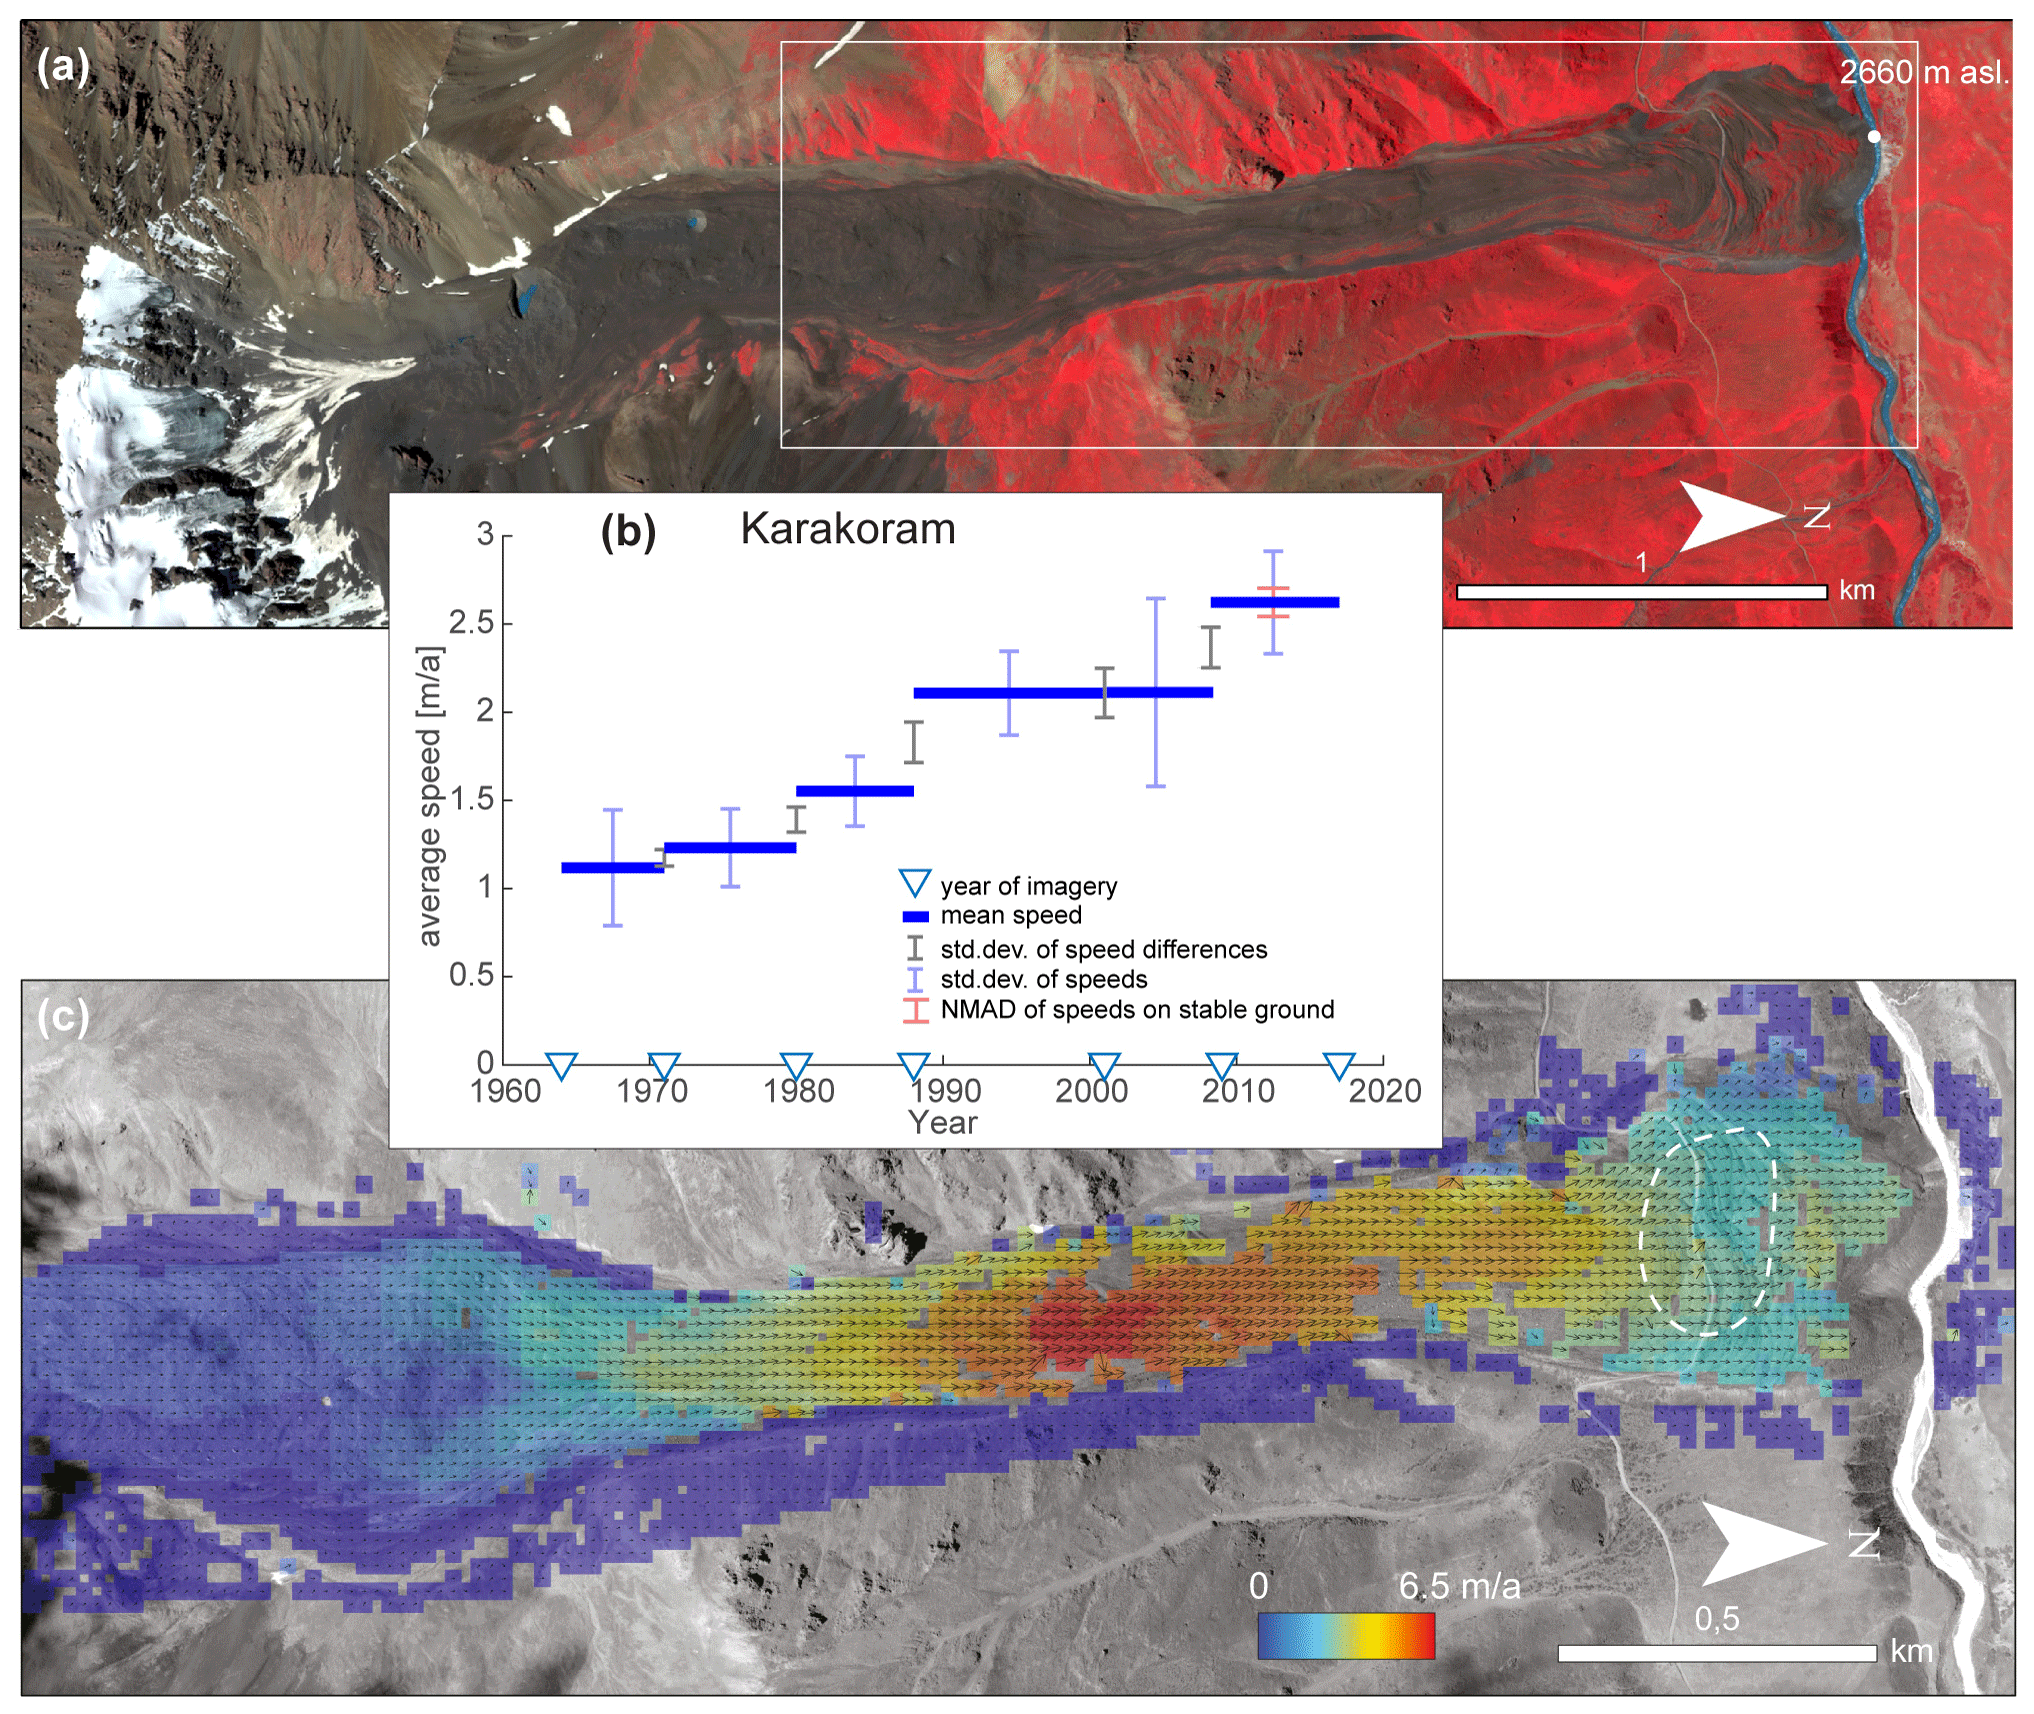
Figure 5Velocities and speed variations on the Karakoram rock glacier. (a) Overview image; © Planet image on 7 September 2016 in near-infrared false colour. (b) Average time series of speeds for a cluster of points (white dashed outline in panel c). Error bars give standard deviations of speeds within the point cluster (blue), standard deviations of speed differences within the measurement periods (grey), and the NMAD of stable ground offsets (red, 2009–2017 only) in m/a. Blue triangles on the time axis indicate years of imagery used. (c) Colour-coded velocity field with vectors superimposed from image matching between 2009 and 2017 high-resolution satellite images (for exact dates and sensors see Table S2). Background image: GeoEye, 29 July 2017, © Maxar.
4.2.3 Ordzhonikidze
The Ordzhonikidze rock glacier is a system of several streams of viscous flow, all connected to small cirque glaciers or their forefields (Fig. 6a). The lowermost part of the longest stream reaches into forested terrain and carries vegetation, including dozens of trees (showing in red in Fig. 6a) (Sorg et al., 2015). For all individual rock glacier streams, a coherent flux of material seems to exist from the cirque glaciers into the rock glaciers, with surface speeds of around 1 m/a. The highest speeds of up to 4 m/a over 2016–2018 are found on a steep narrow part of the longest stream. The NMAD of stable ground offsets 2016–2018 is 0.65 m (0.32 m/a), but matching quality around the rock glacier is clearly lower than on the rock glacier. The interferometric fringe pattern (Fig. 2) and the interferometric interpretations (Fig. 1) are consistent with photogrammetric measurements (Fig. 6e), with phase noise over the fastest rock glacier parts and more coherent fringes over the slower parts. Velocity time series were computed for four zones (A: ∼ 60 points; B: ∼ 100; C: ∼ 70; D: ∼ 50; Fig. 6e) and over the periods 1953–1966, 1966–1971, 1971–1985, 1985–2009, 2009–2013, 2013–2016, and 2016–2018 (for exact image dates and types see Table S2). A period of higher speeds over 1966–1971 is found for all four zones (Fig. 6b–d). Although with variable timing and to variable degrees, we detect an overall increase in speed for all rock glacier zones investigated. Rock glacier advance rate ratios are difficult to characterize because of the many separated fronts. Roughly, at the front below zone A, advance rates are on the order of 0.7 m/a, and speeds above this front are between 1 and 2 m/a (corresponding to advance ratios of around 0.35–0.7). At the front below zone D, the advance is on the order of 0.7 m/a, and surface speeds are around 1.2 m/a (thus a ratio of around 0.6), based on advance rates and speeds over the period 2009–2018.

Figure 6Velocities and speed variations across the Ordzhonikidze rock glacier system. (a) Overview image; GeoEye image (© Maxar) on 6 October 2013 in near-infrared false colour, with the southernmost part from a Planet image on 7 September 2016. (b–d) Average time series of speeds for clusters of points (zones A–D; white dashed outline in panel e). Error bars give standard deviations of speeds within the point clusters (blue), standard deviations of speed differences within the measurement periods (grey), and the NMAD of stable ground offsets (red, 2016–2018 only) in m/a. Blue triangles on the time axis indicate years of imagery used. (e) Colour-coded velocity field with vectors superimposed from image matching between 2016 and 2018 high-resolution satellite images (for exact dates and sensors see Table S2). Background image: GeoEye, 6 October 2013 (© Maxar).
4.2.4 Kugalan Tash
The Kugalan Tash rock glacier is connected to a cirque with no significant ice bodies remaining at the present day (Fig. 7a). Our earliest aerial images of 1956 clearly show more ice cover than today, both in the rock walls and at their base. Movement rates between this cirque and the rock glacier are smaller than the error bars. Only very little vegetation is growing on the rock glacier (Fig. 7a) (Sorg et al., 2015). Maximum speeds found on the stream of viscous flow over 2012–2014 are around 2.5 m/a. The NMAD of stable ground offsets in 2012–2014 is 0.65 m, like for Karakoram and Ordzonikidze (0.32 m/a). The photogrammetrically measured rock glacier stream is well reflected in the interferogram depicted in Fig. 2, with coherent fringes in the slower parts, and phase noise due to coherence loss over the faster parts. Speed time series for 1956–1973, 1973–1988, 1988–2004, 2004–2012, and 2012–2014 were measured for two zones (A: ∼ 20 points; B: ∼ 30 points). Zone A shows a steady increase in speeds (Fig. 7c). The behaviour of velocities in zone B (not shown) resembles the changes in zone A but with a smaller amplitude that is within the error bars. At this site, we did not use Corona satellite photos from 1971 as the aerial images from 1973 were of better quality. Rock glacier advance rates in 2004–2012 are around 0.4 m/a and around 1.2 m/a for speeds recorded above the front, corresponding to an advance ratio of around 0.3.
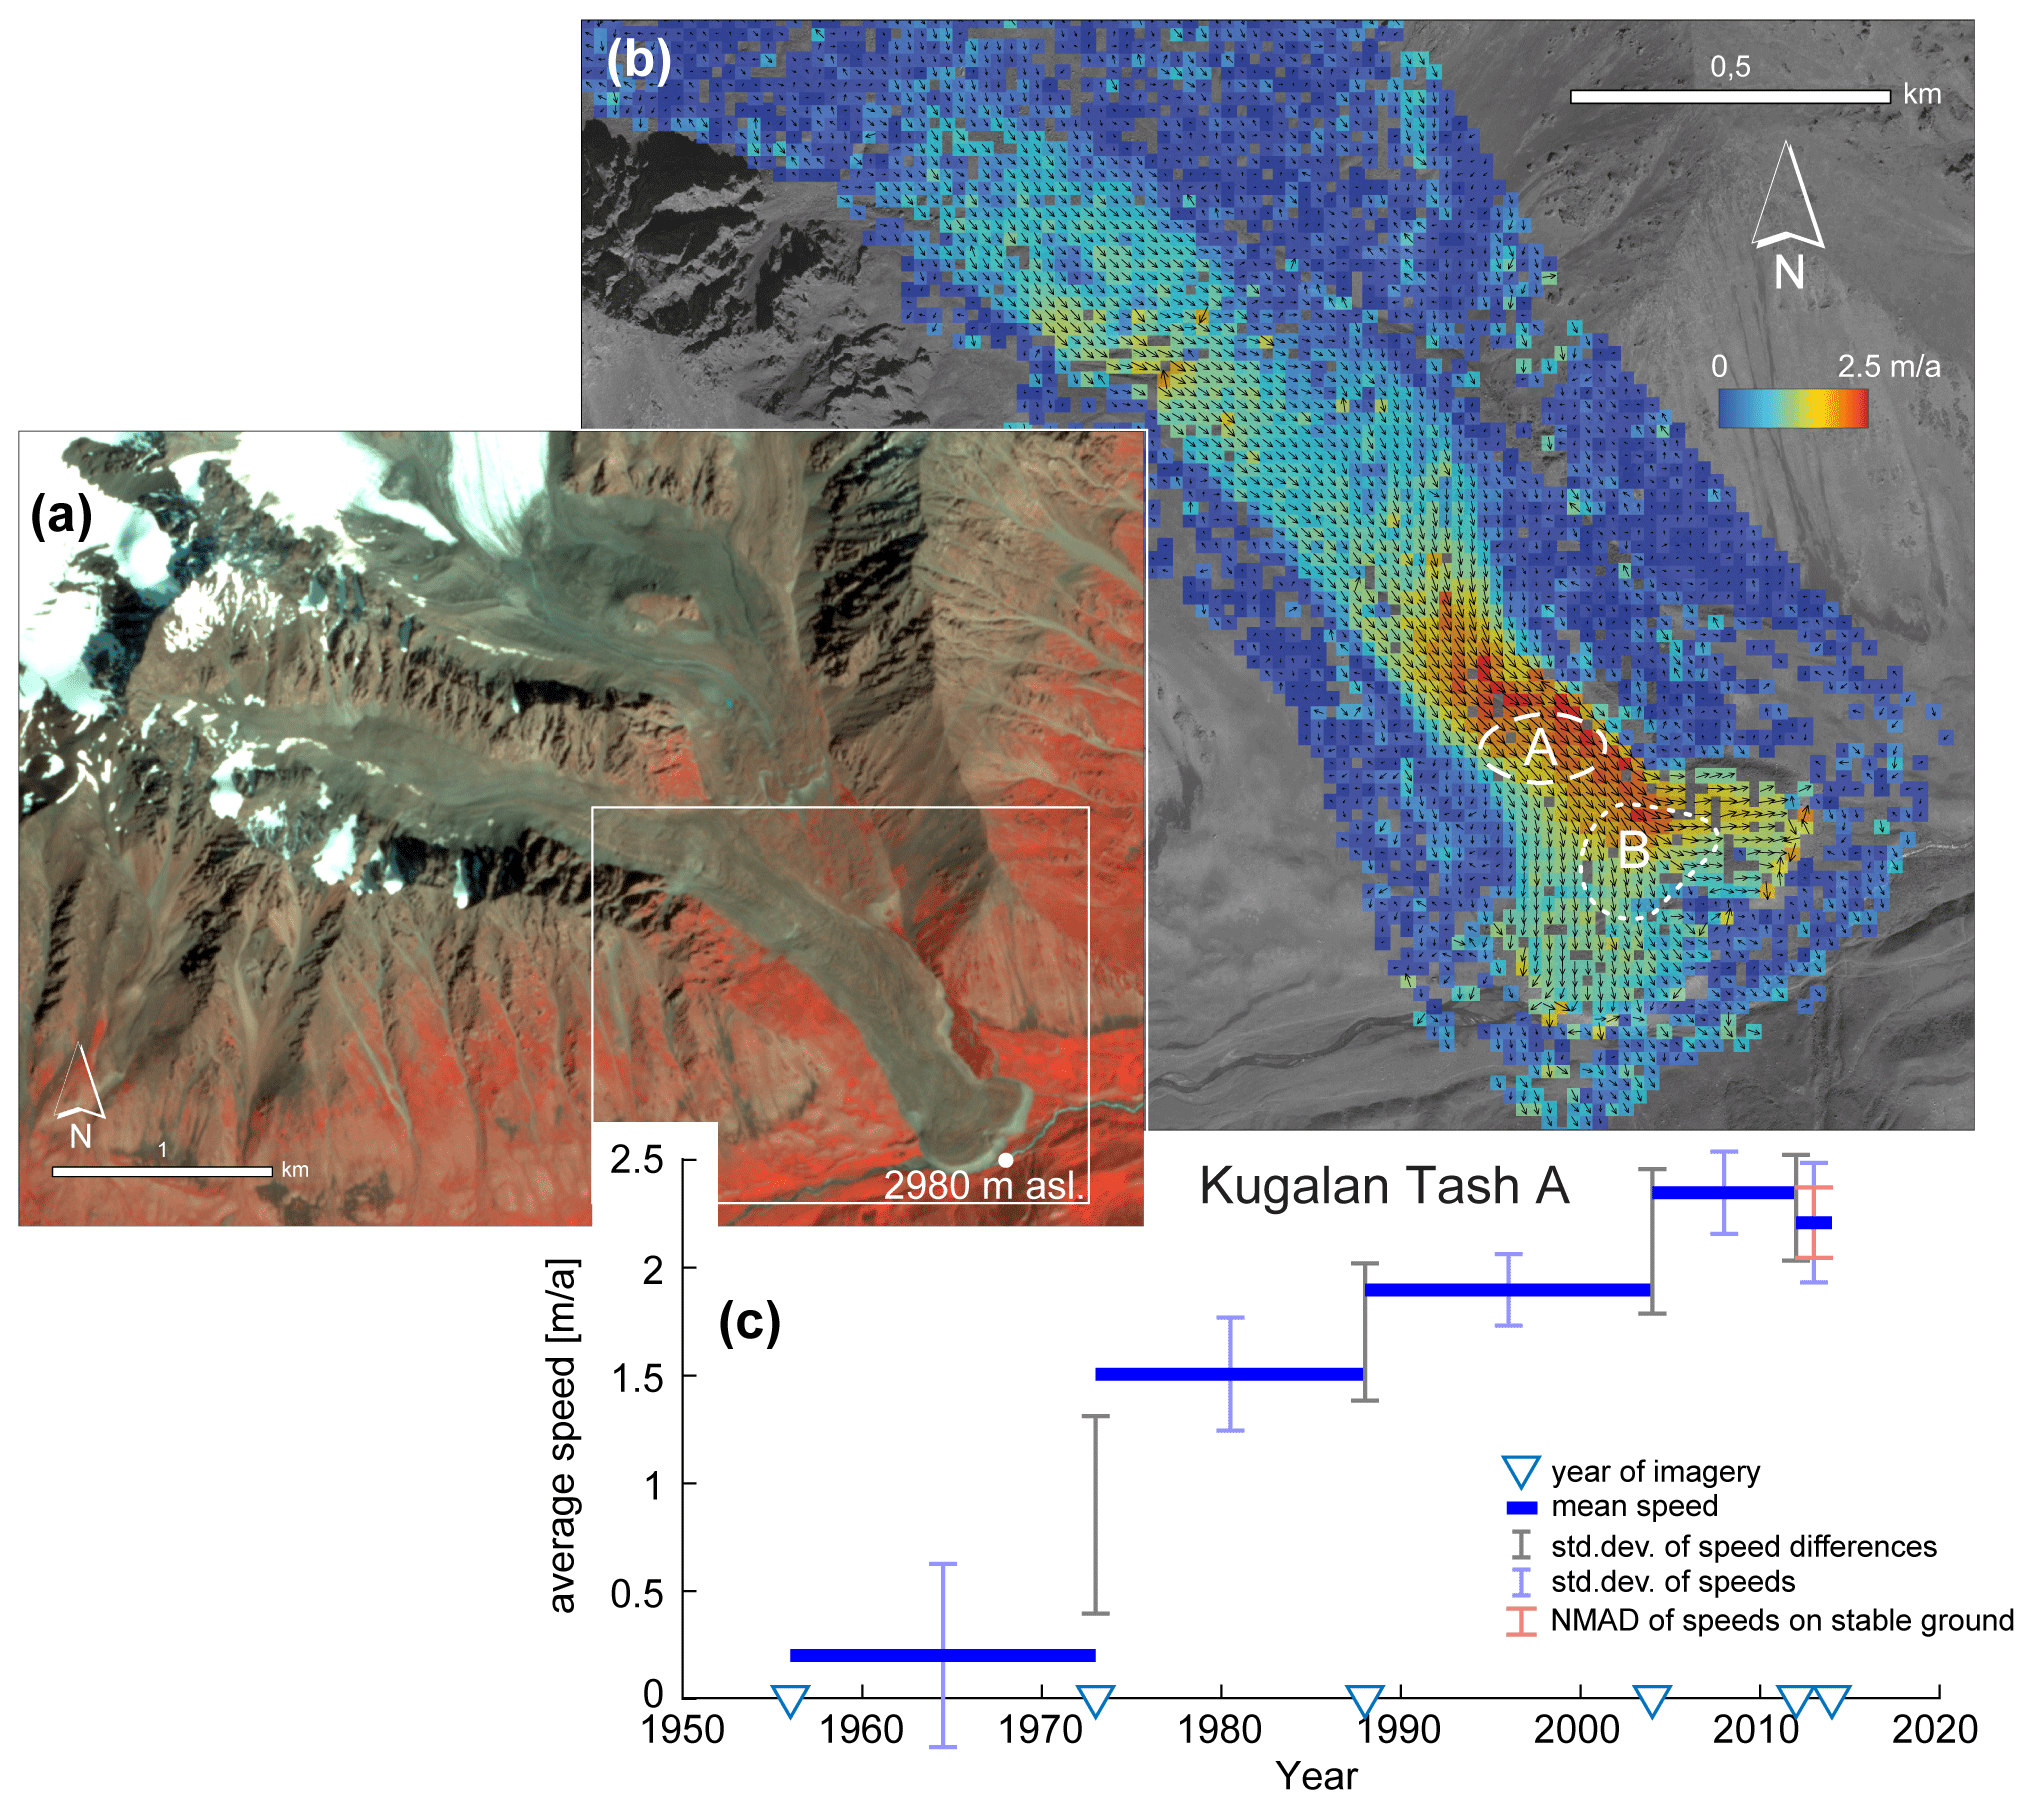
Figure 7Velocities and speed variations on the Kugalan Tash rock glacier. (a) Overview image; © Planet image on 7 September 2016 in near-infrared false colour. (b) Colour-coded velocity field with vectors superimposed from image matching between 2012 and 2014 high-resolution satellite images (for exact dates and sensors see Table S2). Background image: WorldView1, 23 September 2012, ©Maxar. (c) Average time series of speeds for cluster of points A (white dashed outline in panel b). Error bars give standard deviations of speeds within the point clusters (blue), standard deviations of speed differences within the measurement periods (grey), and the NMAD of stable ground offsets (red, 2012–2014 only) in m/a. Blue triangles on the time axis indicate years of imagery used. Also, results for zone B show an increase in speed over 1956–2014 (from 0.7 to 1.8 m/a), but changes are for the most part within the error bars and therefore not shown.
5.1 Radar interferometry versus photogrammetry
The photogrammetric velocity fields derived from repeat aerial and satellite photos and high-resolution optical satellite data in this study agree reasonably well with the radar interferograms and their interpretation. Noteworthy is that both datasets have been obtained independently as the photogrammetric velocity fields were not accessible to the team processing and interpreting radar interferometry data, and vice versa. Nonetheless, all rock glaciers investigated using photogrammetry were classified correctly from the interferograms (Fig. 1). When having a closer look at the full resolution of the radar interferograms, however, small differences can be seen. As radar interferometry provides in principle only one motion component (line of sight) – in contrast to photogrammetry where two horizontal components are obtained – any discrimination of lateral from vertical movements is obviously more difficult in radar interferograms. By way of example, a small elongated zone of phase coherence loss (phase noise) can be detected in the eastern sector of the main part of the Gorodetsky rock glacier (Fig. 2) and has been interpreted as a fast-moving zone within the rock glacier (Fig. 1). Photogrammetric investigation, however, shows that this zone should be interpreted rather as a zone of thermokarstic erosion, a process that can cause loss of interferometric phase coherence. One needs to underline, however, that radar interferometry and multitemporal photogrammetry require very different datasets and that the two approaches usually serve different purposes. Radar interferometry is typically used to reliably map the activity of a large number of rock glaciers over large areas, a target that can only be achieved by using free, weather-independent, and easily accessible baseline data (e.g. Sentinel-1). By contrast, photogrammetric approaches such as the ones used here require very specific, highly resolved data that cover only small areas and can be costly or else difficult to obtain.
In addition, we would also like to stress that the motion patterns seen in the wrapped radar interferograms (Fig. 2) agree very well with the photogrammetric velocity fields. Fast-moving rock glacier parts are characterized by interferometric phase noise, whereas slower-moving parts show more coherent interferometric fringes (e.g. Fig. 8, and Supplement for the other rock glaciers). In the 12 d interferograms displayed in Figs. 2 and 8, the transition between both cases seems to indeed be at speeds of around 85–100 cm/a, which is in good agreement with estimates from Villarroel et al. (2018) and estimates made above in the Method section.
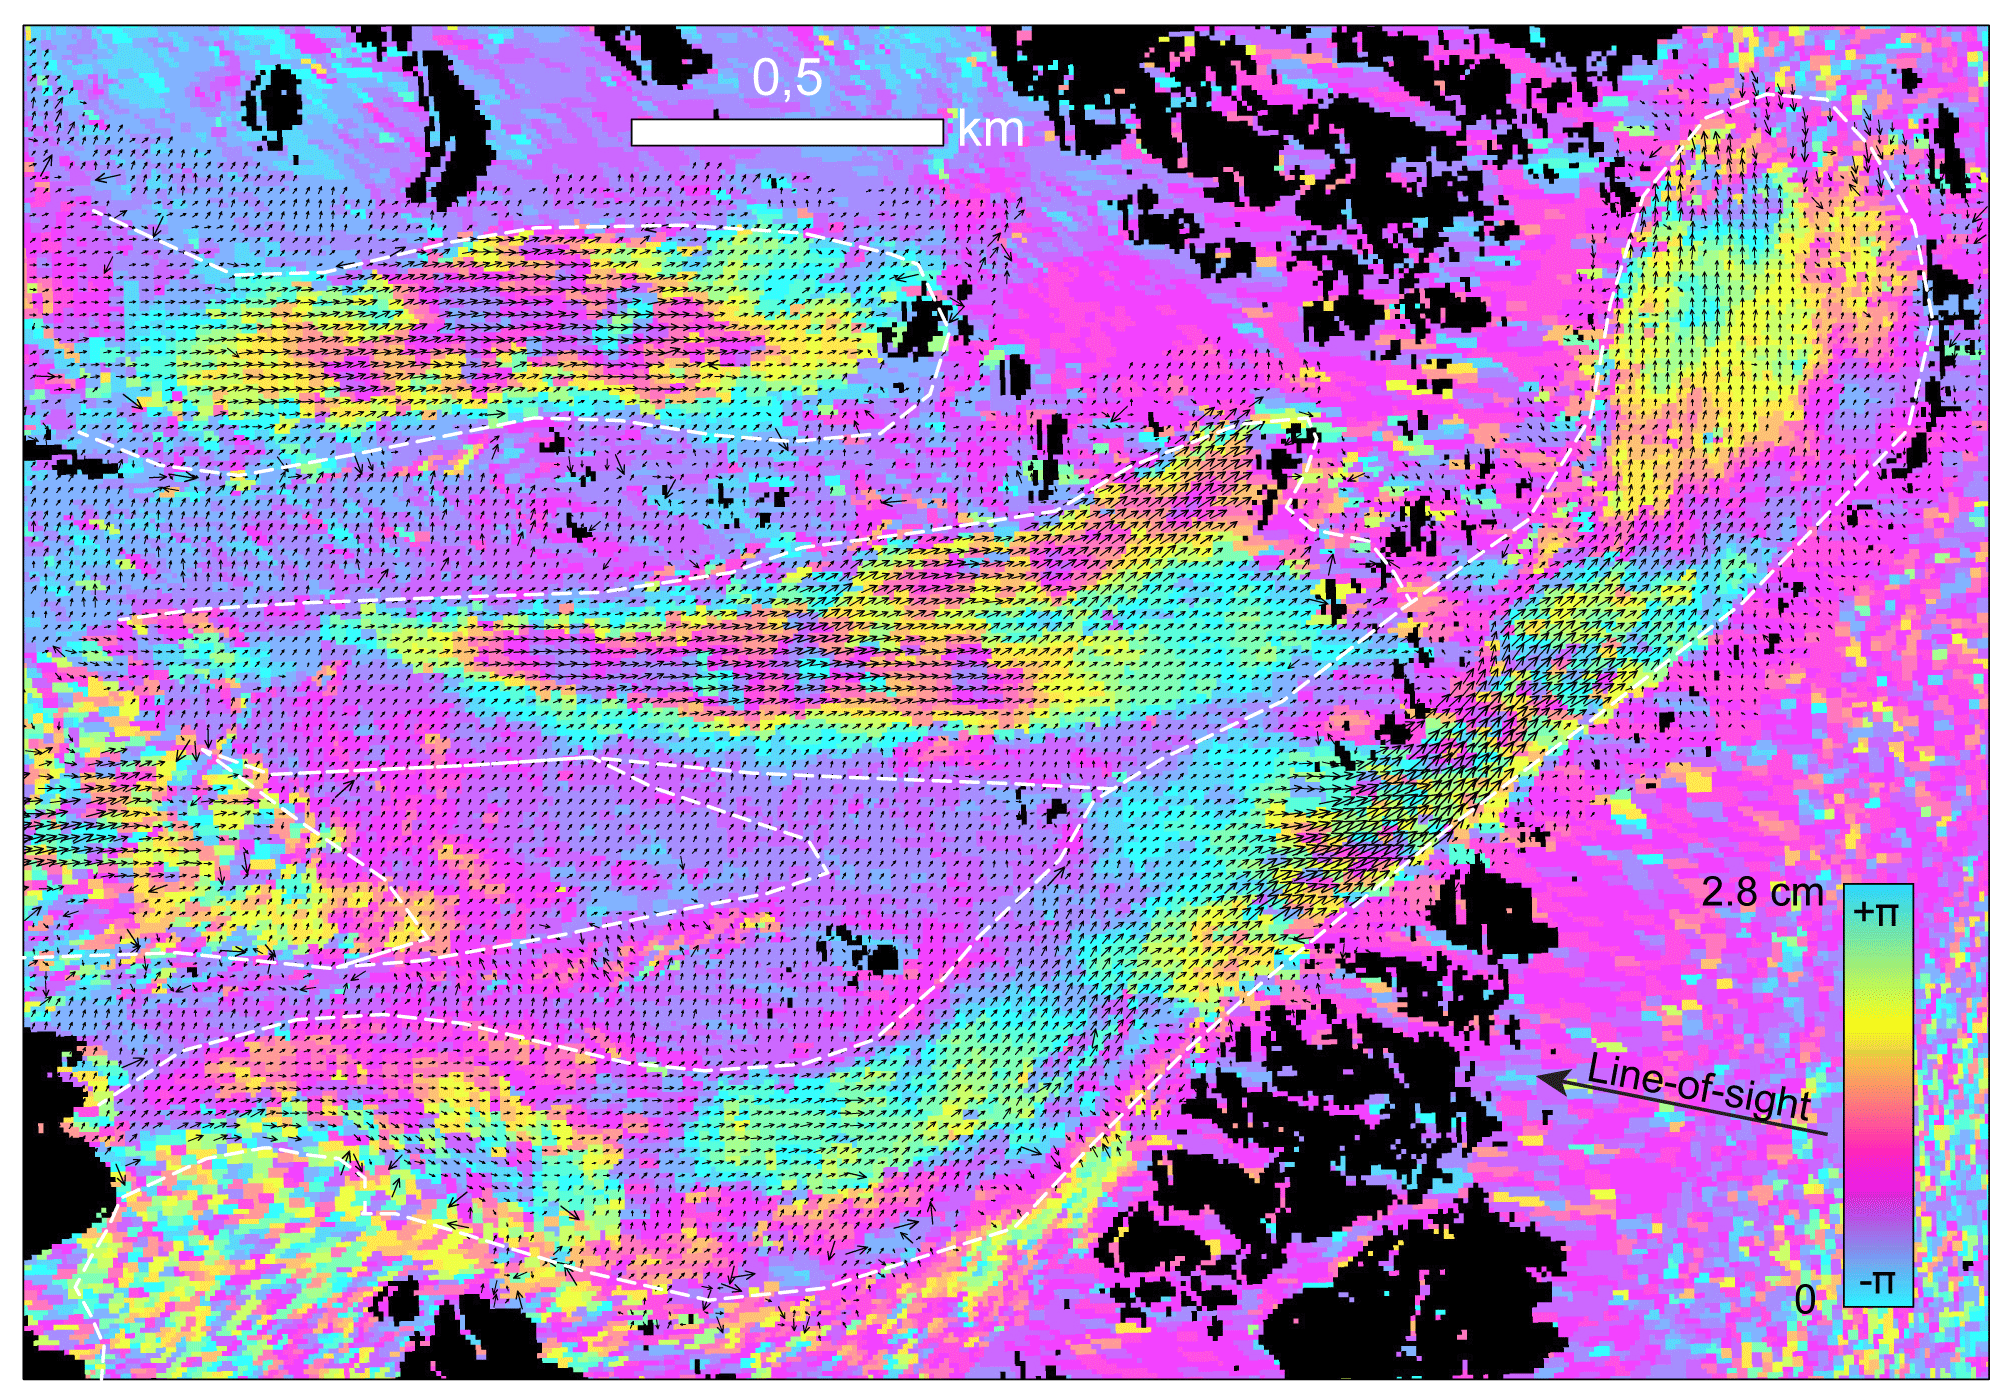
Figure 8The Ordzhonikidze rock glacier. Section of an interferogram between Sentinel-1 radar data on 24 August and 5 September 2018 (12 d; slightly smaller section than Fig. 2d) with vectors superimposed from image matching between 2016 and 2018 high-resolution satellite images (for exact dates and sensors see Table S2). The white dashed lines are the inventory outline polygons from our motion and process-type classes. Photogrammetric velocities are up to 4 m/a. Similar comparisons for the other rock glaciers are displayed in the Supplement.
Whereas our motion classes are based on quantitative measurements, it is clear that our landform classification involves some uncertainty, especially for process types that naturally have no sharp boundary between them (in spatial terms or in terms of process definition) but rather transitions, such as the downstream transition from a debris-covered glacier into a rock glacier. Further, it is clear that the radar and optical data available at the time of classification, for instance their resolution, will influence the class decision.
5.2 Uncertainties in the photogrammetric measurements
In this section, the error budget of our photogrammetric displacement measurements, and thus of our speed time series, is analysed. Error budgets are typically composed of (a) overall shifts between the orthorectified data, (b) lateral shifts in the orthoimages due to errors in the DEM used for orthorectification, (c) distortions in the raw data or in the sensor model that propagate into the orthoimages, and (d) image-matching uncertainties and errors (Lacroix et al., 2015; Kääb et al., 2016, 2017, 2019).
Biases of type (a) are much minimized by our processing scheme and should not influence our results in a significant way. One orthorectified high-resolution satellite scene is used as a master for georeferencing of all other images over a site, and image sections are additionally co-registered over stable ground during the offset tracking procedure.
Orthorectification offsets due to DEM errors, i.e. error budget component (b), are difficult to quantify precisely. They will in particular affect the aerial images we used as those have typically much larger opening angles (field of view versus flying height) compared to the satellite images. In the very worst case, a DEM error could translate 1:1 to a lateral offset for off-nadir projection angles of 45∘, which are typical at the margins of aerial images. We can estimate such orthorectification offsets from stable ground offsets (e.g. Figs. 3b and 4a–b), but we cannot be sure that these estimates are representative for the rock glacier surfaces as the elevations there could have changed over time with respect to the DEM used for orthorectification (here the TanDEM-X WorldDEM), or DEM errors on rock glaciers could be systematically different from DEM errors outside the rock glaciers. In this study, we computed a number of orthoimages using different DEMs (see Sect. 3.2) and analysed offsets in them in order to select the best DEM. From the stable ground offset tests we performed, we find NMADs of offsets around the rock glaciers ranging from around 1–3 m for the old aerial and Corona photos and 0.25–0.65 m for the modern satellite images. Another more stringent way to estimate orthorectification errors (b) would be to analyse offsets between stereo orthoimages, i.e. different images of the same scene (typically stereo images) rectified by the same DEM (Kääb and Vollmer, 2000; Kääb et al., 2016; Altena and Kääb, 2017). We had no suitable image data available to perform such tests, though.
Distortions in the raw data or sensor model used, i.e. errors of type (c), are especially expected for the Corona spy satellite data and some of the low-quality aerial images obtained. We have attempted to minimize such effects by using fourth-order rational polynomial sensor models computed from around 40–50 ground control points per image. These errors can be estimated from stable ground offsets as well and are also contained in the respective numbers given above. By contrast to the orthorectification offsets, it can be assumed that image or model distortions are independent of the image content and thus affect stable areas in a similar way to the rock glaciers.
The final error category (d) concerns matching errors. These can range from gross outliers to fine matching inaccuracies. Gross outliers in our displacement measurements were eliminated by thresholds on the correlation coefficient (typically between 0.4 and 0.6) and a manual selection of points that have consistent measurements in all measurement periods for a site. Therefore, those vectors appearing inconsistent with respect to surrounding vectors (i.e. mainly sections of the vector field with random variation in directions) have been disregarded. In addition, we made sure that the time series obtained from mean speeds for point clusters were consistent with the time series obtained from median values for the point clusters, as the latter are less sensitive to outliers. Mean values give a better representation of the actual measurements, but the median values are a suitable check of whether outliers were properly removed by the thresholds and visual removals described in Sect. 3.2. The remaining matching accuracy varies much with the corresponding image quality, including resolution, contrast, and/or noise. Effects from matching inaccuracies were minimized by averaging speeds of point clusters over several tens of points. Again, this matching accuracy can be estimated from stable ground offsets, in particular for surfaces that have similar visual contrast as the rock glaciers, and is included in the numbers given above under error component (b). A further possibility for describing the uncertainty of individual average speeds for the time series intervals could be average correlation values for each step. Correlation values alone are, however, not a very unique measure to characterize (geometric) matching uncertainty. Rather, they indicate radiometric similarity and signal outliers, which we, however, detected visually in this work.
In stable ground offsets, the combination of error types (b)–(d) is present. For all years for the Gorodetsky, Morenny, and Archaly rock glaciers, and one recent interval for the other rock glaciers, we compared the normalized median absolute deviations (NMADs) of stable ground offsets to the standard deviations of speeds within point clusters and to the standard deviation of speed differences to find that the latter two seem to be overall a more conservative uncertainty measure, which we thus show for the other intervals of the time series. The latter two standard deviations also contain natural and, thus, non-erroneous variability in speeds and speed differences. On the other hand, we know that orthorectification errors (b) might be larger on the rock glaciers than for flat areas around them, so we prefer to use an error measure that is more conservative than the stable ground offsets.
5.3 Speed time series
The photogrammetric velocity fields from this study show a wide spatial variation in rock glacier speeds, with the maximum speeds of up to 6.5 m/a found on the Karakoram rock glacier. Whereas the Karakoram, Ordzhonikidze, and Kugalan Tash rock glaciers, or rock glacier systems, consist of well identifiable individual streams, the Gorodetsky, Morenny, and Archaly rock glaciers display more complex flow patterns, viscously spreading out over a flat valley bottom.
This study also shows that the temporal variations in rock glacier speeds from repeat aerial images and satellite data, available since the 1950s, display a contrasting picture. The only feature in the time series common to all rock glaciers studied in more detail is indeed an increase in speeds in recent years, but results clearly differ with respect to the ratio between the amount of speed increases and their error bars.
The Karakoram rock glacier showed a consistent increase in speed over the entire study period, but due to its fast movement, which limits reliable measurements over all measurement periods and all sections, this can only be confirmed for the lowermost part of the rock glacier. Through the manual tracking of 15 individual boulders in aerial images over the period 1969–1984, Gorbunov et al. (1992) and Gorbunov and Titkov (1989) find a similar behaviour of speed increase in the lowermost part of the rock glacier (measurement points 1 and 3 shown in the latter publication). For the parts further up, these authors documented a decrease in speed over their two study periods, interpreting these changes as a wave-like acceleration–deceleration process as the rock glacier material is travelling downstream. Measurements on our images over these rock glacier parts are too scarce and have too large of error bars to allow for a meaningful comparison. The lowermost rock glacier part, where our measurement points are situated, deforms under a regime of strong longitudinal compression, with longitudinal strain rates in the order of 0.012/a derived from the photogrammetric velocity fields and consistent with the many transverse ridges visible (Kääb and Weber, 2004). We suggest this rock glacier part responds to variations in mass flux from above through a combination of variations in horizontal speeds and surface elevation changes. Under the assumption of incompressible material, these two components of rock glacier kinematics would be correlated, but we have no measurements of elevation changes available to disentangle them. As indicated by the advance ratio of close to 1 (advance rate and surface speed both on the order of ∼ 1 m/a), the ice content of the front could be quite low. For both the lowermost rock glacier part (Fig. 5a) and the few points measurable in the middle part, speeds have more than doubled over 1964–2017. The results from the present study are also consistent with those from Sorg et al. (2015), with both studies showing a steady increase in speed over time. The measurement points used in Sorg et al. (2015) do not extend as far down to lower rock glacier elevations as the increased number of points in the present study, so that the speeds found in their work average to higher values compared to the present study.
The Kugalan Tash rock glacier shows an overall increase in speeds over 1956–2014 as well, but at a lower significance level than for the Karakoram rock glacier (Fig. 7c). The increase in speeds on the lowermost rock glacier part (zone B) is lower than for zone A. Zone B, under a strong compressive creep regime (up to about 0.03/a), reaches and diverts the river, similar to the situation observed for the lowermost part of the Karakoram rock glacier. The photogrammetric measurements in Sorg et al. (2015) show, by contrast to the reprocessing and extension performed here, higher speeds during 1956–1971, a feature that we cannot confirm in the new assessment anymore. Through use of an improved DEM in our new processing and other improvements related to co-registration of images, we consider the results presented here to be more reliable.
Overall, all investigated zones on the Ordzhonikidze rock glacier system show an acceleration over the period 1953–2018 as well, a phenomenon that is most clearly visible in the higher-lying northern rock glacier (zone A in Fig. 6e). A striking peak in speeds is visible over the period 1966–1971 (Fig. 6b–d), for which we do not, however, have a clear explanation. Meteorological and glacier mass balance data (Fig. 2 in Sorg et al., 2015, and Bolch and Marchenko, 2009) show that this period covers mostly years with rather cold summer temperatures in the region and balanced glacier mass budgets, i.e. not particularly warm air temperatures or large meltwater productions. Importantly however, and consistent with the glacier mass balances, snow measurements at two stations close to the rock glacier (Bolshoje Almatinskoje Ozero, Great Almatinka Lake, 2516 m a.s.l., and Mynzhilki, 3017 m a.s.l.) (for locations see Bolch and Marchenko, 2009) show strongly above-average snow heights during the 1960s (MeteorologicalService, 1968). Winter temperatures were rather above average in the 1960s (Bolch and Marchenko, 2009). Using a dendrochronological rock glacier activity index, Sorg et al. (2015) show that the period 1960–1970 is characterized by particularly high movement activity at the Ordzhonikidze rock glacier. Such activity peak is not found for the Karakoram rock glacier and another rock glacier in the region studied in the latter work (Fig. S8 in Sorg et al., 2015). Increased permafrost and ground ice temperatures due to early snow cover and thus enhanced surface insulation (Bodin et al., 2009) and enhanced amounts of snow meltwater (Cicoira et al., 2019b) from exceptionally large snow heights are thus possible explanations for the peak in rock glacier speed during the 1960s. We find no evidence that an earthquake could have caused enhanced displacements (Rosenwinkel et al., 2015). We also did not find any indications of particular distortions in the images that could have caused erroneous displacement values. No measurements exist from other studies that could be used to compare our results.
Our time series results for the Ordzhonikidze rock glacier are very similar and consistent among all four zones investigated, and most speed variations exceed their error bars. This was much less the case for the photogrammetric results in Sorg et al. (2015), and we suggest our much improved and extended processing as the main reason for the differences, which are in addition for the most part within the large error bars in the 2015 study.
The Gorodetsky rock glacier is the only system investigated in this study that does not show an increase in speed over the study period. The Morenny and Archaly rock glaciers show such an increase only in the last decade and not much exceeding the measurement error bars (Figs. 3b and 4a–b). These three rock glaciers are also the ones for which data availability was least good and for which no images existed between 1971 and 2012. The Archaly and Morenny rock glaciers show a similar behaviour over time and increased speed over 1964–1971, similar to the Ordzhonikidze rock glacier, which is just 15 km to the northeast, at the northern slope of the Ile Alatau and likely under similar meteorological conditions. The agreement between the Archaly, Morenny, and Ordzhonikidze rock glaciers with respect to the increased speeds in the second half of the 1960s and the high dendrochronological activity during this time on the Ordzhonikidze rock glacier (Sorg et al., 2015) suggest that this feature in speed variations could in fact be a reliable measurement, possibly related to early snow cover, large snow heights, and associated increased ground temperatures and/or amounts of snow meltwater.
Gorbunov et al. (1992) investigated displacements of boulders on the Archaly and Morenny rock glaciers over 1969–1984 and find an overall increase in speeds between 1969–1979 and 1979–1984. Over shorter timescales (1973–1977, 1977–1978, 1978–1982), the authors first identify a decrease in speeds and then again an increase, leading them to suggest the existence of pulse-like speed variations. Our measurements contain no details over these study periods, but it seems very reasonable to assume that speeds did actually vary within our 1971–2012 measurement period. Sorg et al. (2015) did not study the Gorodetsky, Archaly, and Morenny rock glaciers. Measurements for some boulders by Gorbunov et al. (1992) on the Gorodetsky rock glacier for 1964–1984 reveal speeds similar to our measurements, specifically slightly higher than our 2012–2016 speeds.
In situ measurements of the lower outline of the Gorodetzky rock glacier front revealed that advance rates for 1923–1980, around the location where we also measured the advance, were on the order of 0.8 m/a (Gorbunov and Titkov, 1989; Kokarev et al., 1997), i.e. equal to our coarse measurements of 0.8 m/a for 2012–2018 and slightly higher than our 1953–2012 advance of 0.7 m/a. Advance rates increased to about 1.6 m/a in the 1990s (Bolch and Marchenko, 2009). As our 2012–2018 estimates are significantly lower than the latter value for the 1990s, they might be an indication for a decrease in advance rate. Our 1953–2012 estimate of 0.7 m/a is, however, not compatible with this assumption unless there were particularly low advance rates between the 1990s and 2012. Given the coarse character of our image-based advance estimates and the high variability of rock glacier advance over short spatial scales, it is difficult to compare our estimates in detail to the previous measurements, though.
5.4 Wider geomorphic implications
All photogrammetric velocity fields obtained reflect coherent viscous streams of creeping perennially frozen ice-rich debris. Given the increase in air temperatures in the region during the study period (Bolch, 2007; Sorg et al., 2012, 2015), the behaviour observed for the bodies of frozen debris in the study area is aligned with findings from Europe and from theoretical considerations that creep speeds of perennially frozen ice-rich debris increase overall under atmospheric warming (Kääb et al., 2007; Delaloye et al., 2010; PERMOS, 2016; Eriksen et al., 2018). Surface speeds for most rock glaciers photogrammetrically investigated in our study were roughly 2 to 4 times higher in recent years than during the 1950s and 1960s. This indicates a significant increase in sediment and ice fluxes through these rock glaciers and potentially for the entire study region if one assumes that speed increases also apply overall to the other rock glaciers or bodies of frozen debris mapped using radar interferometry. A detailed analysis of sediment fluxes is not the focus of this study, but assuming for instance an average thickness of 20 m for the creeping layer (Cicoira et al., 2020) and block movement (i.e. basal velocity equals surface velocity) gives an average increase in volume flux on the order of +200 m3/a2 per rock glacier for the rock glaciers studied in detail. For around 50 large and fast rock glaciers in the study region the latter number would scale to +10 000 m3/a2. Note that this estimate has a very rough order of magnitude with a number of unknowns for individual rock glaciers (e.g. from vertical velocity profile and melting ice content) and for the region (e.g. time series representative for all rock glaciers?). Assuming that the area shrinkage (Bolch, 2007; Narama et al., 2010; Severskiy et al., 2016) and mass loss of glaciers in the region (Farinotti et al., 2015; Treichler et al., 2019; Kapitsa et al., 2020) lead to a reduced glacier motion and rate of sediment transport by the glaciers, the increase in rock glacier speed implies that associated sediment transport may currently gain importance relative to sediment transport by glaciers (see Monnier and Kinnard, 2017; Seligman et al., 2019). Such growing geomorphodynamic importance of rock glaciers relative to glaciers under atmospheric warming is in line with the higher thermal inertia of rock glaciers compared to glaciers through their blocky active layer that in essence reduces ground temperatures locally.
The ratios between rock glacier advance rates and surface speeds over the rock glaciers studied in detail cover almost the full spectrum between very small ratios and 1, with most ratios between 0.3 and 0.7. The ratio between both quantities is a function of the ice content that melts out at the front and the vertical profile of horizontal speeds, i.e. the total material flux into the front (Kääb and Reichmuth, 2005). Unless the ratios are very small (i.e. pointing to very high ice content and/or a shallow moving layer; Morenny) or close to 1 (i.e. low ice content and block movement; Karakoram), we cannot disentangle the influences from ice content and vertical velocity profile on the observed advance rates from our measurements. Relative to each other, the Gorodetzky and Ordzonikidze rock glaciers (ratios of 0.7 and 0.6) seem to have a lower ice content and/or less steep decrease in speed down from the surface to depth at their frontal parts than the Archaly and Kugalan Tash rock glaciers (0.3).
Using satellite radar interferometry, we have compiled a slope movement inventory including rock glaciers and other periglacial landforms for the Ile Alatau and Kungöy Ala-Too ranges of the northern Tien Shan. We confirm that these ranges host a large number of rock glaciers and identify a large number of comparably fast-moving (> 100 cm/a) individual rock glaciers. The radar-interferometric interpretations derived in this study agree well with photogrammetric offset tracking measurements based on repeat high-resolution optical satellite data, in terms of both overall motion class and surface velocity patterns. When using 12 d Sentinel-1 interferograms, speeds of up to roughly 100 cm/a can be measured, above which phase decorrelation makes precise quantification of speeds impossible. However, the outlines can still be drawn using the decorrelation pattern, and velocity can be assumed to be a minimum velocity of 100 cm/a for a 12 d Sentinel-1 interferogram.
Overall, we found an increase in surface speed for the selected rock glaciers. This is in line with theoretical considerations of overall acceleration of creeping perennially frozen ice-rich debris under atmospheric warming and observational evidence that has so far been mainly available for the European Alps. Compared to the dozens of related studies available for the European Alps and the much better availability of suitable data there, our single study can, by necessity, not provide similarly robust results as available for the Alps, though. Our finding suggests that for many rock glaciers of our movement inventory speeds might have been lower during recent decades than contained in this contemporary map. The increase in surface speeds for most time series constructed implies a substantial increase in sediment and ice fluxes through these rock glaciers. This could indicate that sediment transport through rock glaciers and other bodies of frozen debris might currently gain importance compared to a declining sediment transport by glaciers, which shrink in the region.
Besides recent acceleration, we also find signs of earlier high speeds or increases in speed. The Morenny and Archaly rock glaciers had equally high speeds at the beginning of our measurement series, and the Gorodetsky rock glacier had likely even higher ones. The most striking peak in speeds is estimated for the second half of the 1960s for the Ordzhonikidze rock glacier system on the northern slope of the study region in the Ile Alatau. A possible explanation for this feature is particularly large snow heights in the region during the period of concern that could have contributed to enhanced surface insulation during winter and associated reduced permafrost cooling and ground ice warming and/or enhanced flow of snow meltwater into the rock glaciers.
All rock glaciers studied photogrammetrically exhibit coherent streams of viscous flow, indicating creep of spatially continuous bodies of perennially frozen ice-rich debris. The good agreement between photogrammetric and radar-interferometric results is a strong indication that this finding also holds for the other rock glaciers contained in the kinematic inventory. The rock glacier fronts that reach valley floors show a strongly compressive flow regime, and changes or increases in speeds further upstream affect them in a complex way, involving changes not only in horizontal speeds but potentially also in the thickness of the creeping layer of the perennially frozen debris. The fronts might respond rather more passively to upstream speed changes than actively produce their own changes.
Our study presents one of the most comprehensive data sets of rock glacier kinematics and their changes over recent decades outside of the European Alps. These data may serve a range of follow-up works, such as analysis of rock glacier dynamics or investigation of associated sediment fluxes in relation to other processes of alpine sediment transport. In terms of additional measurements, the combination of elevation change time series over the rock glaciers with the kinematics of this study might in a next study better illuminate the mass balance of these land forms and their response to climatic changes.
The image matching code used for this study (Correlation Image AnalysiS, CIAS) is available from http://www.mn.uio.no/icemass (Kääb, 2021). The software used for radar interferometry, the GAMMA remote sensing software, is commercial.
The rock glacier and slope instability inventory compiled for this study from differential SAR interferograms and optical imagery, 1998–2016, northern Tien Shan, is available from the Permafrost Information System (PerSys, https://apgc.awi.de/group/persys) (PerSys, 2021). Sentinel-1 data used in our study are freely available from the ESA/EC Copernicus Sentinels Scientific Data Hub at https://scihub.copernicus.eu (Copernicus Open Access Hub, 2021). ERS-1/2 and ALOS-1 PALSAR-1 data are available from the ESA through registration procedures. ALOS-2 PALSAR-2 data are available from JAXA, and TanDEM-X data are available from DLR through proposal application procedures. Planet data are not openly available as Planet is a commercial company. However, scientific access schemes to these data exist. Data from DigitalGlobe satellites (GeoEye, Ikonos, WorldView, Quickbird) and Pléiades are commercial, but programmes to facilitate academic access exist.
The supplement related to this article is available online at: https://doi.org/10.5194/tc-15-927-2021-supplement.
AKä performed the photogrammetric analyses and wrote the paper. TS and RC performed the radar interferometric analyses and wrote the paper. TB assisted with analyses and wrote the paper. HT assisted with photogrammetric analyses. MS and AKo contributed to discussions and edited the paper. AKo compiled the available snow cover data.
The authors declare that they have no conflict of interest.
Thanks are due to Alessandro Cicoira, Philippe Schöneich, and Line Rouyet for their careful review comments and Wilfried Haeberli for additional helpful comments that improved the paper. We are grateful to the providers of free data for this study: European Space Agency (ESA)/European Commission (EC) Copernicus for Sentinel-1 data, ESA for ERS-1/2 and ALOS-1 PALSAR-1 data, the German Aerospace Center (DLR) for TanDEM-X data, the Japan Aerospace Exploration Agency (JAXA) for ALOS-2 PALSAR-2 data, and Planet for their CubeSat data via Planet's Ambassadors Program. ERS-1/2 and ALOS-1 PALSAR-1 data were provided by ESA, courtesy of C1F.6504. ALOS-2 PALSAR-2 images were provided by JAXA, courtesy of RA4-1058. TanDEM-X data were provided by DLR, courtesy of Wegmulle_NTI_INSA3397. We are grateful to CNES/Airbus DS for the provision of the Pléiades satellite data within the Pléiades Glacier Observatory facilitated by Etienne Berthier (LEGOS) and Delphine Fontannaz (CNES).
This research has been supported by the European Research Council (ICEMASS (grant no. 320816)) and the European Space Agency (grant nos. 40001161196/15/I-NB, 4000123681/18/I-NB, 4000109873/14/I-NB, 4000127593/19/I-NS, and 4000127656/19/NL/FF/gp). This work was funded by the ESA projects GlobPermafrost (40001161196/15/I-NB), Permafrost_CCI (4000123681/18/I-NB), and Glaciers_CCI (4000109873/14/I-NB, 4000127593/19/I-NS) and the ESA EarthExplorer10 Mission Advisory Group (4000127656/19/NL/FF/gp) as well as by the European Research Council under the European Union's Seventh Framework Programme (FP/2007-2013)/ERC grant agreement no. 320816.
This paper was edited by Jürg Schweizer and reviewed by Line Rouyet, Philippe Schoeneich, and Alessandro Cicoira.
Altena, B. and Kääb, A.: Elevation change and improved velocity retrieval using orthorectified optical satellite data from different orbits, Remote Sens.-Basel, 9, 300, https://doi.org/10.3390/rs9030300, 2017.
Altmaier, A. and Kany, C.: Digital surface model generation from CORONA satellite images, ISPRS J. Photogramm., 56, 221–235, https://doi.org/10.1016/S0924-2716(02)00046-1, 2002.
Ambrosi, C., Strozzi, T., Scapozza, C., and Wegmuller, U.: Landslide hazard assessment in the Himalayas (Nepal and Bhutan) based on Earth-Observation data, Eng. Geol., 237, 217–228, https://doi.org/10.1016/j.enggeo.2018.02.020, 2018.
Arenson, L. and Springman, S.: Triaxial constant stress and constant strain rate tests on ice-rich permafrost samples, Can. Geotech. J., 42, 412–430, https://doi.org/10.1139/t04-111, 2005a.
Arenson, L. and Springman, S.: Mathematical descriptions for the behaviour of ice-rich frozen soils at temperatures close to 0 C, Can. Geotech. J., 42, 431–442, https://doi.org/10.1139/t04-109, 2005b.
Arenson, L. U., Colgan, W., and Marshall, H. P.: chap. 2 – Physical, thermal, and mechanical properties of snow, ice, and permafrost, in: Snow and Ice-Related Hazards, Risks and Disasters, edited by: Shroder, J. F., Haeberli, W., and Whiteman, C., Academic Press, Boston, 35–75, 2015.
Barboux, C., Delaloye, R., and Lambiel, C.: Inventorying slope movements in an Alpine environment using DInSAR, Earth Surf. Proc. Land., 39, 2087–2099, https://doi.org/10.1002/esp.3603, 2014.
Barsch, D.: Rockglaciers. Indicators for the present and former geoecology in high mountain environments, Springer, Berlin, 331 pp., 1996.
Berthling, I.: Beyond confusion: Rock glaciers as cryo-conditioned landforms, Geomorphology, 131, 98–106, https://doi.org/10.1016/j.geomorph.2011.05.002, 2011.
Blöthe, J. H., Rosenwinkel, S., Höser, T., and Korup, O.: Rock-glacier dams in High Asia, Earth Surf. Proc. Land., 44, 808–824, https://doi.org/10.1002/esp.4532, 2019.
Bodin, X., Thibert, E., Fabre, D., Ribolini, A., Schoeneich, P., Francou, B., Reynaud, L., and Fort, M.: Two decades of responses (1986–2006) to climate by the Laurichard rock glacier, French Alps, Permafrost Periglac., 20, 331–344, https://doi.org/10.1002/ppp.665, 2009.
Bodin, X., Krysiecki, J.-M., Schoeneich, P., Le Roux, O., Lorier, L., Echelard, T., Peyron, M., and Walpersdorf, A.: The 2006 collapse of the Bérard rock glacier (Southern French Alps), Permafrost Periglac., 28, 209–223, https://doi.org/10.1002/ppp.1887, 2016.
Bolch, T.: Climate change and glacier retreat in northern Tien Shan (Kazakhstan/Kyrgyzstan) using remote sensing data, Global Planet. Change, 56, 1–12, https://doi.org/10.1016/j.gloplacha.2006.07.009, 2007.
Bolch, T. and Marchenko, S.: Significance of glaciers, rockglaciers and ice-rich permafrost in the Northern Tien Shan as water towers under climate change conditions, in: Selected Papers from the Workshop in Almaty, Kazakhstan, 2006, edited by: Braun, L., Hagg, W., Severskiy, I. V., and Young, G. J., UNESCO-IHP and German National Committee for IHP/HWRP, Paris, 132–144, 2009.
Bolch, T. and Gorbunov, A. P.: Characteristics and origin of rock glaciers in northern Tien Shan (Kazakhstan/Kyrgyzstan), Permafrost Periglac., 25, 320–332, https://doi.org/10.1002/ppp.1825, 2014.
Bolch, T., Buchroithner, M., Pieczonka, T., and Kunert, A.: Planimetric and volumetric glacier changes in the Khumbu Himal, Nepal, since 1962 using Corona, Landsat TM and ASTER data, J. Glaciol., 54, 592–600, https://doi.org/10.3189/002214308786570782, 2008.
Buchli, T., Kos, A., Limpach, P., Merz, K., Zhou, X. H., and Springman, S. M.: Kinematic investigations on the Furggwanghorn Rock Glacier, Switzerland, Permafrost Periglac., 29, 3–20, https://doi.org/10.1002/ppp.1968, 2018.
Cicoira, A., Beutel, J., Faillettaz, J., Gärtner-Roer, I., and Vieli, A.: Resolving the influence of temperature forcing through heat conduction on rock glacier dynamics: a numerical modelling approach, The Cryosphere, 13, 927–942, https://doi.org/10.5194/tc-13-927-2019, 2019a.
Cicoira, A., Beutel, J., Faillettaz, J., and Vieli, A.: Water controls the seasonal rhythm of rock glacier flow, Earth Planet. Sc. Lett., 528, 115844, https://doi.org/10.1016/j.epsl.2019.115844, 2019b.
Cicoira, A., Marcer, M., Gartner-Roer, I., Bodin, X., Arenson, L. U., and Vieli, A.: A general theory of rock glacier creep based on in-situ and remote sensing observations, Permafrost Periglac., 32, 139–153, https://doi.org/10.1002/ppp.2090, 2020.
Copernicus Open Access Hub: Copernicus programme, European Commission and European Space Agency, available at: https://scihub.copernicus.eu, last access: 18 January 2021.
Debella-Gilo, M. and Kääb, A.: Sub-pixel precision image matching for measuring surface displacements on mass movements using normalized cross-correlation, Remote Sens. Environ., 115, 130–142, https://doi.org/10.1016/j.rse.2010.08.012, 2011.
Delaloye, R., Lambiel, C., and Gärtner-Roer, I.: Overview of rock glacier kinematics research in the Swiss Alps, Geogr. Helv., 65, 135–145, https://doi.org/10.5194/gh-65-135-2010, 2010.
Delevaux, D., Abdrakhmatov, K. E., Lemzin, I. N., and Strom, L.: Opolszni i Razpyvy Keminskogo Zemletrjacenija 1911 g. s Ms 8,2 v Kirgizii, 42, 1667–1677, 2001 (in Russian).
Deline, P., Gruber, S., Delaloye, R., Fischer, L., Geertsema, M., Giardino, M., Hasler, A., Kirkbride, M., Krautblatter, M., Magnin, F., McColl, S., Ravanel, L., and Schoeneich, P.: chap. 15 – Ice loss and slope stability in high-mountain regions, in: Snow and Ice-Related Hazards, Risks and Disasters, edited by: Shroder, J. F., Haeberli, W., and Whiteman, C., Academic Press, Boston, 521–561, 2015.
Eriksen, H. O., Rouyet, L., Lauknes, T. R., Berthling, I., Isaksen, K., Hindberg, H., Larsen, Y., and Corner, G. D.: Recent acceleration of a rock glacier complex, Adjet, Norway, documented by 62 years of remote sensing observations, Geophys. Res. Lett., 45, 8314–8323, https://doi.org/10.1029/2018gl077605, 2018.
Farinotti, D., Longuevergne, L., Moholdt, G., Duethmann, D., Molg, T., Bolch, T., Vorogushyn, S., and Guntner, A.: Substantial glacier mass loss in the Tien Shan over the past 50 years, Nat. Geosci., 8, 716–722, https://doi.org/10.1038/Ngeo2513, 2015.
Goerlich, F., Bolch, T., Mukherjee, K., and Pieczonka, T.: Glacier mass loss during the 1960s and 1970s in the Ak-Shirak range (Kyrgyzstan) from multiple stereoscopic Corona and Hexagon imagery, Remote Sens.-Basel, 9, 275, https://doi.org/10.3390/rs9030275, 2017.
Gorbunov, A., Seversky, E., Titkov, S., Marchenko, S. and Popov, M.: Rock glaciers, Zailiysiky Range, Kungei Ranges, Tienshan, Kazakhstan. Boulder, CO, National Snow and Ice Data Center/World Data Center for Glaciology, Digital Media, https://doi.org/10.7265/51zk-r767, 1998.
Gorbunov, A. and Titkov, S.: Kamennye Gletchery Gor Srednej Azii [= Rock glaciers of the Central Asian mountains], Akademia Nauk SSSR, Yakutsk, 1989.
Gorbunov, A. P.: Rock glaciers of the mountains of middle Asia, Fourth International Permafrost Conference, Fairbanks, Alaska, 359–362, 1983.
Gorbunov, A. P.: Monitoring the evolution of permafrost in the Tien Shan, Permafrost Periglac., 7, 297–298, 1996.
Gorbunov, A. P., Titkov, S. N., and Polyakov, V. G.: Dynamics of rock glaciers of the Northern Tien Shan and the Djungar Ala Tau, Kazakhstan, Permafrost Periglac., 3, 29–39, https://doi.org/10.1002/ppp.3430030105, 1992.
Haeberli, W.: Creep of mountain permafrost: internal structure and flow of alpine rock glaciers, Mitteilungen der Versuchsanstalt für Wasserbau, Hydrologie und Glaziologie der ETH Zürich, 142 pp., 1985.
Haeberli, W., Kääb, A., Wagner, S., Geissler, P., Haas, J. N., Glatzel-Mattheier, H., Wagenbach, D., and Vonder Mühll, D.: Pollen analysis and 14C-age of moss remains recovered from a permafrost core of the active rock glacier Murtèl/Corvatsch (Swiss Alps): geomorphological and glaciological implications, J. Glaciol., 45, 1–8, 1999.
Hartl, L., Fischer, A., Stocker-Waldhuber, M., and Abermann, J.: Recent speed-up of an alpine rock glacier: an updated chronology of the kinematics of outer Hochebenkar rock glacier based on geodetic measurements, Geogr. Ann. A, 98, 129–141, https://doi.org/10.1111/geoa.12127, 2016.
Höhle, J. and Höhle, M.: Accuracy assessment of digital elevation models by means of robust statistical methods, ISPRS J. Photogramm., 64, 398–406, https://doi.org/10.1016/j.isprsjprs.2009.02.003, 2009.
Ikeda, A., Matsuoka, N., and Kääb, A.: Fast deformation of perennially frozen debris in a warm rock glacier in the Swiss Alps: An effect of liquid water, J. Geophys. Res.-Earth, 113, F01021, https://doi.org/10.1029/2007JF000859, 2008.
IPA Action Group: Rock glacier inventories and kinematics, available at: https://www3.unifr.ch/geo/geomorphology/en/research/ipa-action-group-rock-glacier/, last access: 22 December 2020.
Janke, J. R.: Long-Term flow measurements (1961–2002) of the Arapaho, Taylor, and Fair Rock Glaciers, Front Range, Colorado, Phys. Geogr., 26, 313–336, https://doi.org/10.2747/0272-3646.26.4.313, 2005.
Jansen, F. and Hergarten, S.: Rock glacier dynamics: Stick-slip motion coupled to hydrology, Geophys. Res. Lett., 33, L10502, https://doi.org/10.1029/2006gl026134, 2006.
Jones, D. B., Harrison, S., Anderson, K., and Betts, R. A.: Mountain rock glaciers contain globally significant water stores, Sci. Rep.-UK, 8, 2834, https://doi.org/10.1038/s41598-018-21244-w, 2018.
Kääb, A.: Correlation Image Analysis software (CIAS), available at: http://www.mn.uio.no/icemass, last access: 18 January 2021.
Kääb, A. and Reichmuth, T.: Advance mechanisms of rockglaciers, Permafrost Periglac., 16, 187–193, 2005.
Kääb, A. and Vollmer, M.: Surface geometry, thickness changes and flow fields on creeping mountain permafrost: automatic extraction by digital image analysis, Permafrost Periglac., 11, 315–326, https://doi.org/10.1002/1099-1530(200012)11:4<315::Aid-Ppp365>3.0.Co;2-J, 2000.
Kääb, A. and Weber, M.: Development of transverse ridges on rockglaciers. Field measurements and laboratory experiments, Permafrost Periglac., 15, 379–391, 2004.
Kääb, A., Frauenfelder, R., and Roer, I.: On the response of rockglacier creep to surface temperature increase, Global Planet. Change, 56, 172–187, 2007.
Kääb, A., Winsvold, S. H., Altena, B., Nuth, C., Nagler, T., and Wuite, J.: Glacier remote sensing using Sentinel-2. Part I: radiometric and geometric performance, and application to ice velocity, Remote Sens.-Basel, 8, 598, https://doi.org/10.3390/Rs8070598, 2016.
Kääb, A., Altena, B., and Mascaro, J.: Coseismic displacements of the 14 November 2016 Mw 7.8 Kaikoura, New Zealand, earthquake using the Planet optical cubesat constellation, Nat. Hazards Earth Syst. Sci., 17, 627–639, https://doi.org/10.5194/nhess-17-627-2017, 2017.
Kääb, A., Altena, B., and Mascaro, J.: River-ice and water velocities using the Planet optical cubesat constellation, Hydrol. Earth Syst. Sci., 23, 4233–4247, https://doi.org/10.5194/hess-23-4233-2019, 2019.
Kapitsa, V., Shahgedanova, M., Severskiy, I., Kasatkin, N., White, K., and Usmanova, Z.: Assessment of changes in mass balance of the Tuyuksu group of glaciers, Northern Tien Shan, between 1958 and 2016 using ground-based observations and Pleiades satellite imagery, Front. Earth Sci.-Switz, 8, 259, https://doi.org/10.3389/feart.2020.00259, 2020.
Kaufmann, V.: The evolution of rock glacier monitoring using terrestrial photogrammetry: the example of Äußeres Hochebenkar rock glacier (Austria), Austrian J. Earth Sci., 105, 63–77, 2012.
Kaufmann, V. and Ladstädter, R.: Documentation and visualization of the morphodynamics of Hinteres Langtalkar rock glacier (Hohe Tauern range, Austrian Alps) based on aerial photographs (1954–2006) and geodetic measurements (1999–2007), Tenth International Symposium on High Mountain Remote Sensing Cartography Kathmandu, 2008.
Kellerer-Pirklbauer, A. and Kaufmann, V.: About the relationship between rock glacier velocity and climate parameters in Central Austria, Austrian J. Earth Sci., 105, 94–112, 2012.
Kenner, R., Pruessner, L., Beutel, J., Limpach, P., and Phillips, M.: How rock glacier hydrology, deformation velocities and ground temperatures interact: Examples from the Swiss Alps, Permafrost Periglac., 31, 3–14, https://doi.org/10.1002/ppp.2023, 2020.
Kokarev, A., Shesterova, I., and Schröder, H.: Die Blockgletscher im Sailiskij Alatau des Tienschan (Kasachstan), Hallesches Jahrbuch Geowissenschaften, 19, 81–94, 1997 (in German).
Korjenkov, A. M., Kovalenko, V. A., and Usmanov, S. F.: Long-term preservation of Paleoseismic deformation as a tool for revealing traces of ancient seismic catastrophes (example of the Chon-Kemin Valley, Kyrgyzstan), Kartographische Bausteine, 28, 137–154, 2004.
Krainer, K. and He, X.: Flow velocities of active rock glaciers in the Austrian Alps, Geogr. Ann. A, 88, 267–280, https://doi.org/10.1111/j.0435-3676.2006.00300.x, 2006.
Krainer, K., Bressan, D., Dietre, B., Haas, J. N., Hajdas, I., Lang, K., Mair, V., Nickus, U., Reidl, D., Thies, H., and Tonidandel, D.: A 10,300-year-old permafrost core from the active rock glacier Lazaun, southern Ötztal Alps (South Tyrol, northern Italy), Quaternary Res., 83, 324–335, https://doi.org/10.1016/j.yqres.2014.12.005, 2015.
Kummert, M., Delaloye, R., and Braillard, L.: Erosion and sediment transfer processes at the front of rapidly moving rock glaciers: Systematic observations with automatic cameras in the western Swiss Alps, Permafrost Periglac., 29, 21–33, https://doi.org/10.1002/ppp.1960, 2017.
Lacroix, P., Berthier, E., and Maquerhua, E. T.: Earthquake-driven acceleration of slow-moving landslides in the Colca valley, Peru, detected from Pleiades images, Remote Sens. Environ., 165, 148–158, https://doi.org/10.1016/j.rse.2015.05.010, 2015.
Lilleoren, K. S., Etzelmuller, B., Gartner-Roer, I., Kaab, A., Westermann, S., and Gudmundsson, A.: The distribution, thermal characteristics and dynamics of permafrost in Trollaskagi, Northern Iceland, as inferred from the distribution of rock glaciers and ice-cored moraines, Permafrost Periglac., 24, 322–335, https://doi.org/10.1002/ppp.1792, 2013.
Liu, L., Millar, C. I., Westfall, R. D., and Zebker, H. A.: Surface motion of active rock glaciers in the Sierra Nevada, California, USA: inventory and a case study using InSAR, The Cryosphere, 7, 1109–1119, https://doi.org/10.5194/tc-7-1109-2013, 2013.
Lukk, A. A., Yunga, S. L., Shevchenko, V. I., and Hamburger, M. W.: Earthquake focal mechanisms, deformation state, and seismotectonics of the Pamir-Tien Shan region, Central-Asia, J. Geophys. Res.-Sol. Ea., 100, 20321–20343, https://doi.org/10.1029/95jb02158, 1995.
Marchenko, S. S., Gorbunov, A. P., and Romanovsky, V. E.: Permafrost warming in the Tien Shan Mountains, Central Asia, Global Planet. Change, 56, 311–327, https://doi.org/10.1016/j.gloplacha.2006.07.023, 2007.
Martin, H. E. and Whalley, W. B.: Rock glaciers. Part I: Rock glacier morphology: classification and distribution, Prog. Phys. Geog., 11, 260–282, 1987.
MeteorologicalService: Meteorologicheski ezhegodnik za zimu 1965–1966 gg, Meteorological annual report 1965–1966, Heft 18, Alma-Ata 1968, 311 pp., 1968.
Monnier, S. and Kinnard, C.: Pluri-decadal (1955–2014) evolution of glacier–rock glacier transitional landforms in the central Andes of Chile (30–33∘ S), Earth Surf. Dynam., 5, 493–509, https://doi.org/10.5194/esurf-5-493-2017, 2017.
Müller, J., Vieli, A., and Gärtner-Roer, I.: Rock glaciers on the run – understanding rock glacier landform evolution and recent changes from numerical flow modeling, The Cryosphere, 10, 2865–2886, https://doi.org/10.5194/tc-10-2865-2016, 2016.
Narama, C., Kääb, A., Duishonakunov, M., and Abdrakhmatov, K.: Spatial variability of recent glacier area changes in the Tien Shan Mountains, Central Asia, using Corona (∼ 1970), Landsat (∼ 2000), and ALOS (∼ 2007) satellite data, Global Planet. Change, 71, 42–54, https://doi.org/10.1016/j.gloplacha.2009.08.002, 2010.
Necsoiu, M., Onaca, A., Wigginton, S., and Urdea, P.: Rock glacier dynamics in Southern Carpathian Mountains from high-resolution optical and multi-temporal SAR satellite imagery, Remote Sens. Environ., 177, 21–36, https://doi.org/10.1016/j.rse.2016.02.025, 2016.
Obu, J., Westermann, S., Bartsch, A., Berdnikov, N., Christiansen, H. H., Dashtseren, A., Delaloye, R., Elberling, B., Etzelmuller, B., Kholodov, A., Khomutov, A., Kääb, A., Leibman, M. O., Lewkowicz, A. G., Panda, S. K., Romanovsky, V., Way, R. G., Westergaard-Nielsen, A., Wu, T. H., Yamkhin, J., and Zou, D. F.: Northern Hemisphere permafrost map based on TTOP modelling for 2000–2016 at 1 km2 scale, Earth-Sci. Rev., 193, 299–316, https://doi.org/10.1016/j.earscirev.2019.04.023, 2019.
PERMOS: Permafrost in Switzerland 2010/2011 to 2013/2014, University of Fribourg, Chemin du Musée, 4 CH–1700 Fribourg, 2016.
Permafrost Information System (PerSys): Open access geospatial data dissemination and visualization portal for the ESA GlobPermafrost project, https://apgc.awi.de/group/persys, last access: 18 January 2021.
Pfeffer, W. T., Arendt, A. A., Bliss, A., Bolch, T., Cogley, J. G., Gardner, A. S., Hagen, J. O., Hock, R., Kaser, G., Kienholz, C., Miles, E. S., Moholdt, G., Molg, N., Paul, F., Radic, V., Rastner, P., Raup, B. H., Rich, J., Sharp, M. J., Andeassen, L. M., Bajracharya, S., Barrand, N. E., Beedle, M. J., Berthier, E., Bhambri, R., Brown, I., Burgess, D. O., Burgess, E. W., Cawkwell, F., Chinn, T., Copland, L., Cullen, N. J., Davies, B., De Angelis, H., Fountain, A. G., Frey, H., Giffen, B. A., Glasser, N. F., Gurney, S. D., Hagg, W., Hall, D. K., Haritashya, U. K., Hartmann, G., Herreid, S., Howat, I., Jiskoot, H., Khromova, T. E., Klein, A., Kohler, J., Konig, M., Kriegel, D., Kutuzov, S., Lavrentiev, I., Le Bris, R., Li, X., Manley, W. F., Mayer, C., Menounos, B., Mercer, A., Mool, P., Negrete, A., Nosenko, G., Nuth, C., Osmonov, A., Pettersson, R., Racoviteanu, A., Ranzi, R., Sarikaya, M. A., Schneider, C., Sigurdsson, O., Sirguey, P., Stokes, C. R., Wheate, R., Wolken, G. J., Wu, L. Z., and Wyatt, F. R.: The Randolph Glacier Inventory: a globally complete inventory of glaciers, J. Glaciol., 60, 537–552, https://doi.org/10.3189/2014JoG13J176, 2014.
Rick, B., Delaloye, R., Barboux, C., and Strozzi, T.: Detection and inventorying of slope movements in the Brooks Range, Alaska using DInSAR: a test study, 68th Canadian Geotechnical Conference and 7th Canadian Permafrost Conference, Quebec, 2015.
Roer, I., Haeberli, W., Avian, M., Kaufmann, V., Delaloye, R., Lambiel, C., and Kääb, A.: Observations and considerations on destabilizing active rockglaciers in the European Alps, Ninth International Conference on Permafrost, Fairbanks, 1505–1510, 2008.
Rosenwinkel, S., Korup, O., Landgraf, A., and Dzhumabaeva, A.: Limits to lichenometry, Quaternary Sci. Rev., 129, 229–238, https://doi.org/10.1016/j.quascirev.2015.10.031, 2015.
Scapozza, C., Lambiel, C., Bozzini, C., Mari, S., and Conedera, M.: Assessing the rock glacier kinematics on three different timescales: a case study from the southern Swiss Alps, Earth Surf. Proc. Land., 39, 2056–2069, https://doi.org/10.1002/esp.3599, 2014.
Schneider, B. and Schneider, H.: Zur 60jährigen Messreihe der kurzfristigen Geschwindigkeitsschwankungen am Blockgletscher im Äusseren Hochebenkar, Ötztaler Alpen, Tirol, Zeitschrift für Gletscherkunde und Glazialgeologie, 37, 1–33, 2001.
Schoeneich, P., Bodin, X., Echelard, T., Kaufmann, V., Kellerer-Pirklbauer, A., Krysiecki, J.-M., and Lieb, G. K.: Velocity changes of rock glaciers and induced hazards, in: Engineering Geology for Society and Territory – Volume 1, Cham, 223–227, 2015.
Scotti, R., Crosta, G. B., and Villa, A.: Destabilisation of creeping permafrost: the plator rock glacier case study (Central Italian Alps), Permafrost Periglac., 28, 224–236, https://doi.org/10.1002/ppp.1917, 2017.
Seligman, Z. M., Klene, A. E., and Nelson, F. E.: Rock glaciers of the Beartooth and northern Absaroka ranges, Montana, USA, Permafrost Periglac., 30, 249–259, https://doi.org/10.1002/ppp.2019, 2019.
Severskiy, I., Vilesov, E., Armstrong, R., Kokarev, A., Kogutenko, L., Usmanova, Z., Morozova, V., and Raup, B.: Changes in glaciation of the Balkhash-Alakol basin, central Asia, over recent decades, Ann. Glaciol., 57, 382–394, https://doi.org/10.3189/2016AoG71A575, 2016.
Shean, D.: High Mountain Asia 8-meter DEMs derived from along-track optical imagery. Boulder, Colorado USA, NASA National Snow and Ice Data Center Distributed Active Archive Center, Digital data, https://doi.org/10.5067/GSACB044M4PK, 2017.
Sorg, A., Bolch, T., Stoffel, M., Solomina, O., and Beniston, M.: Climate change impacts on glaciers and runoff in Tien Shan (Central Asia), Nat. Clim. Change, 2, 725–731, https://doi.org/10.1038/Nclimate1592, 2012.
Sorg, A., Kääb, A., Roesch, A., Bigler, C., and Stoffel, M.: Contrasting responses of Central Asian rock glaciers to global warming, Sci. Rep.-UK, 5, 8228, https://doi.org/10.1038/srep08228, 2015.
Stoffel, M. and Huggel, C.: Effects of climate change on mass movements in mountain environments, Prog. Phys. Geog., 36, 421–439, https://doi.org/10.1177/0309133312441010, 2012.
Strom, A. L. and Korup, O.: Extremely large rockslides and rock avalanches in the Tien Shan Mountains, Kyrgyzstan, Landslides, 3, 125–136, 2006.
Strozzi, T., Wegmüller, U., Tosi, L., Bitelli, G., and Spreckels, V.: Land subsidence monitoring with differential SAR interferometry, Photogramm. Eng. Rem. S., 67, 1261–1270, 2001.
Strozzi, T., Kääb, A., and Frauenfelder, R.: Detecting and quantifying mountain permafrost creep from in-situ, airborne and spaceborne remote sensing methods, Int. J. Remote Sens., 25, 2919–2931, 2004.
Strozzi, T., Caduff, R., Jones, N., Barboux, C., Delaloye, R., Bodin, X., Kääb, A., Matzler, E., and Schrott, L.: Monitoring rock glacier kinematics with satellite synthetic aperture radar, Remote Sens.-Basel, 12, 559, https://doi.org/10.3390/rs12030559, 2020.
Tibaldi, A. and Graziotto, E.: Three-dimensional compressional deformations in the Zailiski Alatau mountains, Kazakstan, Geodin. Acta, 10, 239–249, https://doi.org/10.1080/09853111.1997.11105304, 1997.
Titkov, S.: Rock Glaciers and glaciation of the Central Asian Mountains., 5th International Permafrost Conference, Tondheim, 259–262, 1988.
Treichler, D., Kääb, A., Salzmann, N., and Xu, C.-Y.: Recent glacier and lake changes in High Mountain Asia and their relation to precipitation changes, The Cryosphere, 13, 2977–3005, https://doi.org/10.5194/tc-13-2977-2019, 2019.
Villarroel, C. D., Beliveau, G. T., Forte, A. P., Monserrat, O., and Morvillo, M.: DInSAR for a Regional Inventory of Active Rock Glaciers in the Dry Andes Mountains of Argentina and Chile with Sentinel-1 Data, Remote Sens.-Basel, 10, 1588, https://doi.org/10.3390/rs10101588, 2018.
Wang, X., Liu, L., Zhao, L., Wu, T., Li, Z., and Liu, G.: Mapping and inventorying active rock glaciers in the northern Tien Shan of China using satellite SAR interferometry, The Cryosphere, 11, 997–1014, https://doi.org/10.5194/tc-11-997-2017, 2017.
Yadav, R. R. and Kulieshius, P.: Dating of Earthquakes – tree-ring responses to the catastrophic earthquake of 1887 in Alma-Ata, Kazakhstan, Geogr. J., 158, 295–299, https://doi.org/10.2307/3060298, 1992.