the Creative Commons Attribution 4.0 License.
the Creative Commons Attribution 4.0 License.
 | 19 Feb 2021
Trends and spatial variation in rain-on-snow events over the Arctic Ocean during the early melt season
Cunde Xiao
Jiping Liu
Qiang Wang
Shifeng Pan
Xiaojun Yuan
Minghu Ding
Feng Zhang
Kai Xue
Peter A. Bieniek
Hajo Eicken
Rain-on-snow (ROS) events can accelerate the surface ablation of sea ice, thus greatly influencing the ice–albedo feedback. However, the variability of ROS events over the Arctic Ocean is poorly understood due to limited historical station data in this region. In this study early melt season ROS events were investigated based on four widely used reanalysis products (ERA-Interim, JRA-55, MERRA, and ERA5) in conjunction with available observations at Arctic coastal stations. The performance of the reanalysis products in representing the timing of ROS events and the phase change of precipitation was assessed. Our results show that ERA-Interim better represents the onset date of ROS events in spring, and ERA5 better represents the phase change of precipitation associated with ROS events. All reanalyses indicate that ROS event timing has shifted to earlier dates in recent decades (with maximum trends up to −4 to −6 d per decade in some regions in ERA-Interim) and that sea ice melt onset in the Pacific sector and most of the Eurasian marginal seas is correlated with this shift. There has been a clear transition from solid to liquid precipitation, leading to more ROS events in spring, although large discrepancies were found between different reanalysis products. In ERA5, the shift from solid to liquid precipitation phase during the early melt season has directly contributed to a reduction in spring snow depth on sea ice by more than −0.5 cm per decade averaged over the Arctic Ocean since 1980, with the largest contribution (about −2.0 cm per decade) in the Kara–Barents seas and Canadian Arctic Archipelago.
- Article
(8918 KB) - Full-text XML
- BibTeX
- EndNote


Changes in the phase of precipitation (solid or liquid) can impact the freeze–thaw processes of cryospheric components (such as sea ice, snow, and permafrost), the hydrological cycle, and terrestrial and marine ecosystems. With the rapid warming of the Arctic climate, precipitation will increasingly occur in liquid form (Bintanja and Andry, 2017). Liquid precipitation helps the growth and northward expansion of vegetation and promotes the ablation of snow, ice, and permafrost (e.g., Putkonen and Roe, 2003; Rennert et al., 2009; Casson et al., 2010). Increased frequency of liquid precipitation in spring can accelerate the thawing of permafrost, which in turn leads to more methane release (Neumann et al., 2019). The snowmelt associated with rain-on-snow (ROS) events can directly lead to a decrease in spring snow water equivalent and have a significant influence on water storage and supply in snowmelt-controlled areas (Birsan et al., 2005; Renard et al., 2008; Jeong et al., 2016).
Weather stations are relatively sparse in the Arctic region, and very few of them have sensors that can distinguish between solid and liquid precipitation (Peterson et al., 2006; White et al., 2007; Rawlins et al., 2010; Førland et al., 2020). Recent studies based on station observations in Alaska, the Canadian Arctic Archipelago, and the high-Arctic archipelago Svalbard indicated that spring precipitation over these land areas has transitioned from solid precipitation to liquid precipitation in recent decades (Han et al., 2018; Førland et al., 2020). Several other studies also investigated the changes in the frequency and intensity of winter warming events that occasionally occurred with intense rainfall (Vikhamar-Schuler et al., 2016) and the effects of ROS events on snow cover using data from manned stations in Svalbard (Peeters et al., 2019). Because there are no long-term observations over Arctic sea ice, few studies have examined precipitation phases over the sea ice region so far. Screen and Simmonds (2012) analyzed the seasonal variations in snowfall and rainfall over the Arctic Ocean and showed that the fraction of summer precipitation falling as snow has decreased in recent decades. Dou et al. (2019) analyzed changes in the phase of precipitation over coastal sea ice in northern Alaska. They found that since the 1990s ROS events have been shifting to earlier dates in May, helping trigger and accelerate surface ablation of sea ice in the region. In contrast, solid precipitation (snowfall) in spring can retard sea ice melt to some extent (Perovich et al., 2017).
Atmospheric reanalysis data are often used to understand climate change processes and to drive sea ice–ocean models, which warrants an assessment of how well ROS events are represented in reanalyses. A few previous studies (Screen and Simmonds, 2012; Lindsay et al., 2014; Boisvert et al., 2018) have examined Arctic precipitation characteristics in reanalysis products. However, there is a lack of systematic studies of the long-term variations in precipitation phases over the Arctic Ocean. In particular, analysis during early stages of sea ice ablation (March to June) is lacking. In this period ROS events play a key role in initiating snow and sea ice melt, because the occurrence, timing, and quantity of rainfall can greatly affect reductions in snow albedo, enhance heat transfer into the snowpack, and promote the formation and development of melt ponds.
This study is motivated by the need to improve understanding of changes in the phase of precipitation during the early stages of sea ice ablation (March to June) and to evaluate the timing of ROS events promoting onset of melt during this period. Due to the extremely limited coverage of historical in situ observations over the Arctic Ocean, we first assess the representation of ROS events in four state-of-the-art reanalysis datasets using the limited long-term observations available. The station observations were derived from a single station along the Alaska coast and 14 stations in the Canadian Arctic Archipelago (CAA) located in close vicinity of sea ice. Second, we use the reanalysis datasets to investigate changes in ROS events over the Arctic Ocean in recent decades. Both the timing and amount of liquid precipitation in the early melt season were analyzed. We also consider the question as to whether such shifts in early melt season precipitation are part of an Arctic-wide trend or a more localized phenomenon and to what extent the ROS events influence variations in snow depth over sea ice.
2.1 Precipitation in ERA-I, MERRA, JRA-55, and ERA5
Gridded precipitation information over the Arctic Ocean was derived from four reanalysis products, the European Centre for Medium-Range Weather Forecasts (ECMWF) reanalysis interim (ERA-I; Dee et al., 2011), the Japanese 55-year Reanalysis (JRA-55; Kobayashi et al., 2015), and the latest reanalysis product of ECMWF, ERA5 (Hersbach and Dee, 2016). Boisvert et al. (2018) evaluated the performance of various reanalysis datasets in simulating the precipitation in the Arctic Ocean and showed that the Modern-Era Retrospective analysis for Research and Applications (MERRA version 2; Gelaro et al., 2017) significantly overestimates the total precipitation compared to MERRA (Rienecker et al., 2011), ERA-I, and JRA-55. They further pointed out that MERRA and MERRA-2 both overestimate snowfall, especially for MERRA-2. In contrast, they both significantly underestimate rainfall (for both rainfall amount and rainfall days), leading to an underestimation of rain–total precipitation (RPR) over the Arctic Ocean. Accordingly, we chose MERRA for the analysis in this study since its underestimation is relatively slight.
ERA-I uses the ECMWF forecasting model (version cycle 31r1 (CY31r1)) with a horizontal resolution of T213 (∼ 78 km). ERA5 is the fifth-generation reanalysis from ECMWF. It provides several improvements compared to ERA-I, as detailed by Hersbach and Dee (2016). The analysis is produced at a 1-hourly time step using a significantly more advanced 4D-Var assimilation scheme with a horizontal resolution of approximately 30 km. JRA-55 spans the longest record of the atmospheric global reanalysis datasets evaluated here and covers a period extending back to 1958. It is based on the TL319 (55 km × 55 km) spectral resolution version, with a linear Gaussian grid, of the JMA global spectral model (GSM) with 4D-Var and also incorporates TOVS and SSM/I satellite data. MERRA uses the Goddard Earth Observing System Data Assimilation System (GEOS-5) (Rienecker et al., 2011). It applies the GEOS-5 AGCM dynamical atmospheric model, which includes a finite-volume dynamical core and a native latitude–longitude horizontal resolution of .
There is no direct assimilation of precipitation data in the Arctic Ocean (Kalnay et al., 1996; Dee et al., 2011; Reichle et al., 2017). The representation of precipitation, however, can be influenced indirectly by other assimilated fields. For example, satellite measurements of microwave radiances were used to adjust humidity fields in ERA-I, which can thereby influence precipitation indirectly (Dick Dee, Sivaranjan Uppala, and Adrian Simmons, personal communication, 21 October 2018). To facilitate a comparison with station observations, the reanalysis data were bilinearly interpolated to a common 0.125∘ × 0.125∘ grid, and the grid points nearest to each station were chosen. Daily mean precipitation data were used in our analysis. We chose 0.5 mm per day as the threshold to determine the occurrence of rainfall, since this value is close to the field measurement accuracy (Dou et al., 2019) and high enough to eliminate spurious counts of rainfall events.
2.2 Satellite-derived sea ice concentration
There must be snow cover on the ground or ice surface when ROS events occur (McCabe et al., 2007). Surface-based observations and satellite remote sensing studies by Warren et al. (1999), Webster et al. (2014), and Kwok et al. (2020) showed that most of the Arctic sea ice surface is covered by snow during March through June, with snow depth decreasing rapidly throughout June and bare ice appearing along the marginal seas of the Arctic Ocean in July. In recent years, removal of snow through melt has shifted into June (Kwok et al., 2020). Therefore, we used the monthly sea ice concentration (SIC) in May and June to mask the range of ROS events over the Arctic Ocean. The SIC data from the U.S. National Snow and Ice Data Center (NSIDC) derived from the NASA Team algorithm (Fetterer et al., 2017) are used to define the boundaries of Arctic sea ice during the study period. SIC in this dataset is derived from passive microwave brightness temperatures. Since the SIC data are available every 2 d before 1987, the series since 1988 is used for the analysis in this study. The original data are on a polar stereographic grid with a spatial resolution of 25 km × 25 km; we re-gridded them onto a 0.125∘ × 0.125∘ grid to be consistent with the format of the precipitation reanalysis data. The sea ice extent is calculated from SIC using a threshold of 15 % (Gloersen et al., 1993).
2.3 Station precipitation data
To evaluate the reanalysis data, the long-term records from the few available coastal stations were used. We employed total precipitation and snowfall observations from January 1952 to June 2017 at the Utqiaġvik Weather Service Office (WSO) Airport station, located at Utqiaġvik near the coast of the Chukchi Sea (available from the Alaska Climate Research Center, http://climate.gi.alaska.edu/acis_data, last access: 10 July 2020). The snowfall data are given as snow water equivalent. The snowfall amount was subtracted from the total precipitation to obtain the rainfall amount.
We also obtained total precipitation and rainfall station data across the Canadian Arctic Archipelago from the daily network program “DLY04” (part of Environment Canada's national archive, http://climate.weather.gc.ca/index_e.html, last access: 12 July 2020). The DLY04 data have been quality-controlled following the current standards of Environment Canada. We selected 14 meteorological stations with relatively long time spans (1980–2007) next to sea ice in northern Canada (north of 60∘ N, details shown in Table 1). The criterion used to determine the occurrence of rainfall for station data is the same as that used for reanalysis data.
Table 1Stations in Canadian Arctic Archipelago (CAA) selected for comparison with reanalysis datasets.
2.4 Satellite-derived sea ice melt onset dates
At present, melt onset detection from passive microwave satellite data is based on the temporal variability of brightness temperatures at 19 and 37 GHz. Snow and ice emissivity increases significantly with increasing wetness, i.e., as the liquid water builds up in the snowpack and at the ice surface due to onset of melt (Markus et al., 2009). The sea ice melt onset dataset was retrieved from the satellite microwave radiometer data for the Scanning Multichannel Microwave Radiometer, Special Sensor Microwave/Imager, and Special Sensor Microwave Imager and Sounder (Markus et al., 2009; Stroeve et al., 2014). This dataset has been shown to represent the melt signal of ice and snow and has been used to reveal the mechanisms triggering Arctic sea ice ablation (e.g., Mortin et al., 2016). Melt onset is described by two different variables: early melt onset (EMO) and continuous melt onset (Markus et al., 2009). We applied the EMO criterion – the first time melt is detected – in this study, because it has been shown that this parameter is closely linked to the atmospheric processes triggering melt (Mortin et al., 2016). For the correlation analysis the native 25 km × 25 km EMO data grid for the period 1980–2017 was interpolated to the 0.125∘ × 0.125∘ reanalysis grids described in the previous section.
2.5 Methods
The ratio of rain–total precipitation (RPR) was analyzed to reflect the change in precipitation phase. The larger the ratio, the greater the proportion of rainfall in the total precipitation. The increase in RPR indicates the trend from snowfall to rainfall. The linear trends of RPR and the first ROS event date (FRD) in spring were computed using the least-squares method (Belington and Robinson, 2003), and the corresponding confidence levels (that is, the probabilities of linear trends with a non-zero slope) were estimated by Student's t statistic (Box et al., 2005).
Snow depth on sea ice is very sensitive to changes in precipitation phase. Solid precipitation increases snow depth while liquid precipitation does not. We estimated the contribution of precipitation phase transitions to the trend (interdecadal variation) in snow depth on sea ice over the period 1980–2017. We first detrended the variations in precipitation phase (RPR) to obtain an RPR sequence without precipitation phase transition, and then we multiplied the total precipitation by the detrended RPR to obtain the detrended precipitation that fell as ROS events over the past decades. Then, the differences in the snowfall amount due to the change in precipitation phase were derived by the difference of the time series of precipitation occurring as ROS events before and after detrending. The snowfall reduction (snow water equivalent) was converted to snow depth reduction based on the climatological monthly mean snow density given by Warren et al. (1999). Finally, the linear trend of the variations in snow depth caused by precipitation phase change was calculated. Note that this study only considered the direct contribution of mass loss of snowfall due to precipitation phase transition (from solid to liquid) to the reduction in snow depth over sea ice. The contribution of energy input during the phase transition of precipitation (e.g., warm air, high moisture, latent heat from rain) has not been included. Therefore, the actual contribution of precipitation phase transition is greater than the estimation of this study.
3.1 Trends in the timing of melt season ROS events
The first ROS events that occur during the spring melt season were evaluated to assess their linkage with the onset of sea ice melt. Before analyzing the variability in timing of these events, the four reanalysis datasets were first evaluated using precipitation measurements at the Utqiaġvik station in northern Alaska and 14 coastal stations adjacent to sea ice in the CAA (station details shown in Table 1). On average, the dates (i.e., day of the year) of the first spring ROS events in ERA-I (149 ± 15) are slightly earlier than the station observed mean value (152 ± 17), but closer than the other reanalysis products that have a larger negative bias (JRA-55 (133 ± 21); ERA5 (135 ± 21); MERRA (138 ± 17)). The standard deviation (±value) represents the spatial variability of the timing of the first spring ROS amongst the 15 stations. Changing the threshold of precipitation events may affect the determination of the date of the first rainfall to a certain extent, especially for the reanalysis with more frequent trace precipitation, such as MERRA and MERRA-2 (Boisvert et al., 2018). Therefore, using a lower precipitation threshold may result in an earlier ROS event being detected in these reanalysis datasets, while a higher threshold may result in a later ROS event. However, different thresholds will not have a fundamental impact on the spatial distribution of the trend of the first rainfall timing.
Trends of the first ROS event date in northern Alaska and the CAA region show significant spatial differences across the station observations (Fig. 1a). Most stations have negative trends indicating earlier ROS events with time, and there is a large spread in the trend magnitude among the station observations. In general, the directions of the trends in ERA-I are most consistent with the station observations, and the magnitudes of the trends are comparable to the observations for two-thirds of the stations (Utqiaġvik, Chesterfield Inlet, Arviat, Kugaaruk, Whale Cove, Repulse Bay, Taloyoak, Paulatuk, Komakuk Beach). ERA5 is consistent with ERA-I in the trend direction except at Igloolik, but it underestimates the trend magnitudes at some stations (Fig. 1a). MERRA is in line with most stations in the direction of the trends except at three stations (Kugaaruk, Rankin Inlet, Taloyoak). For trend values, MERRA is comparable to observations at nearly half of the stations (Fig. 1a). JRA-55 exhibits a relatively large deviation in both the directions and magnitudes of the trends from these station observations.
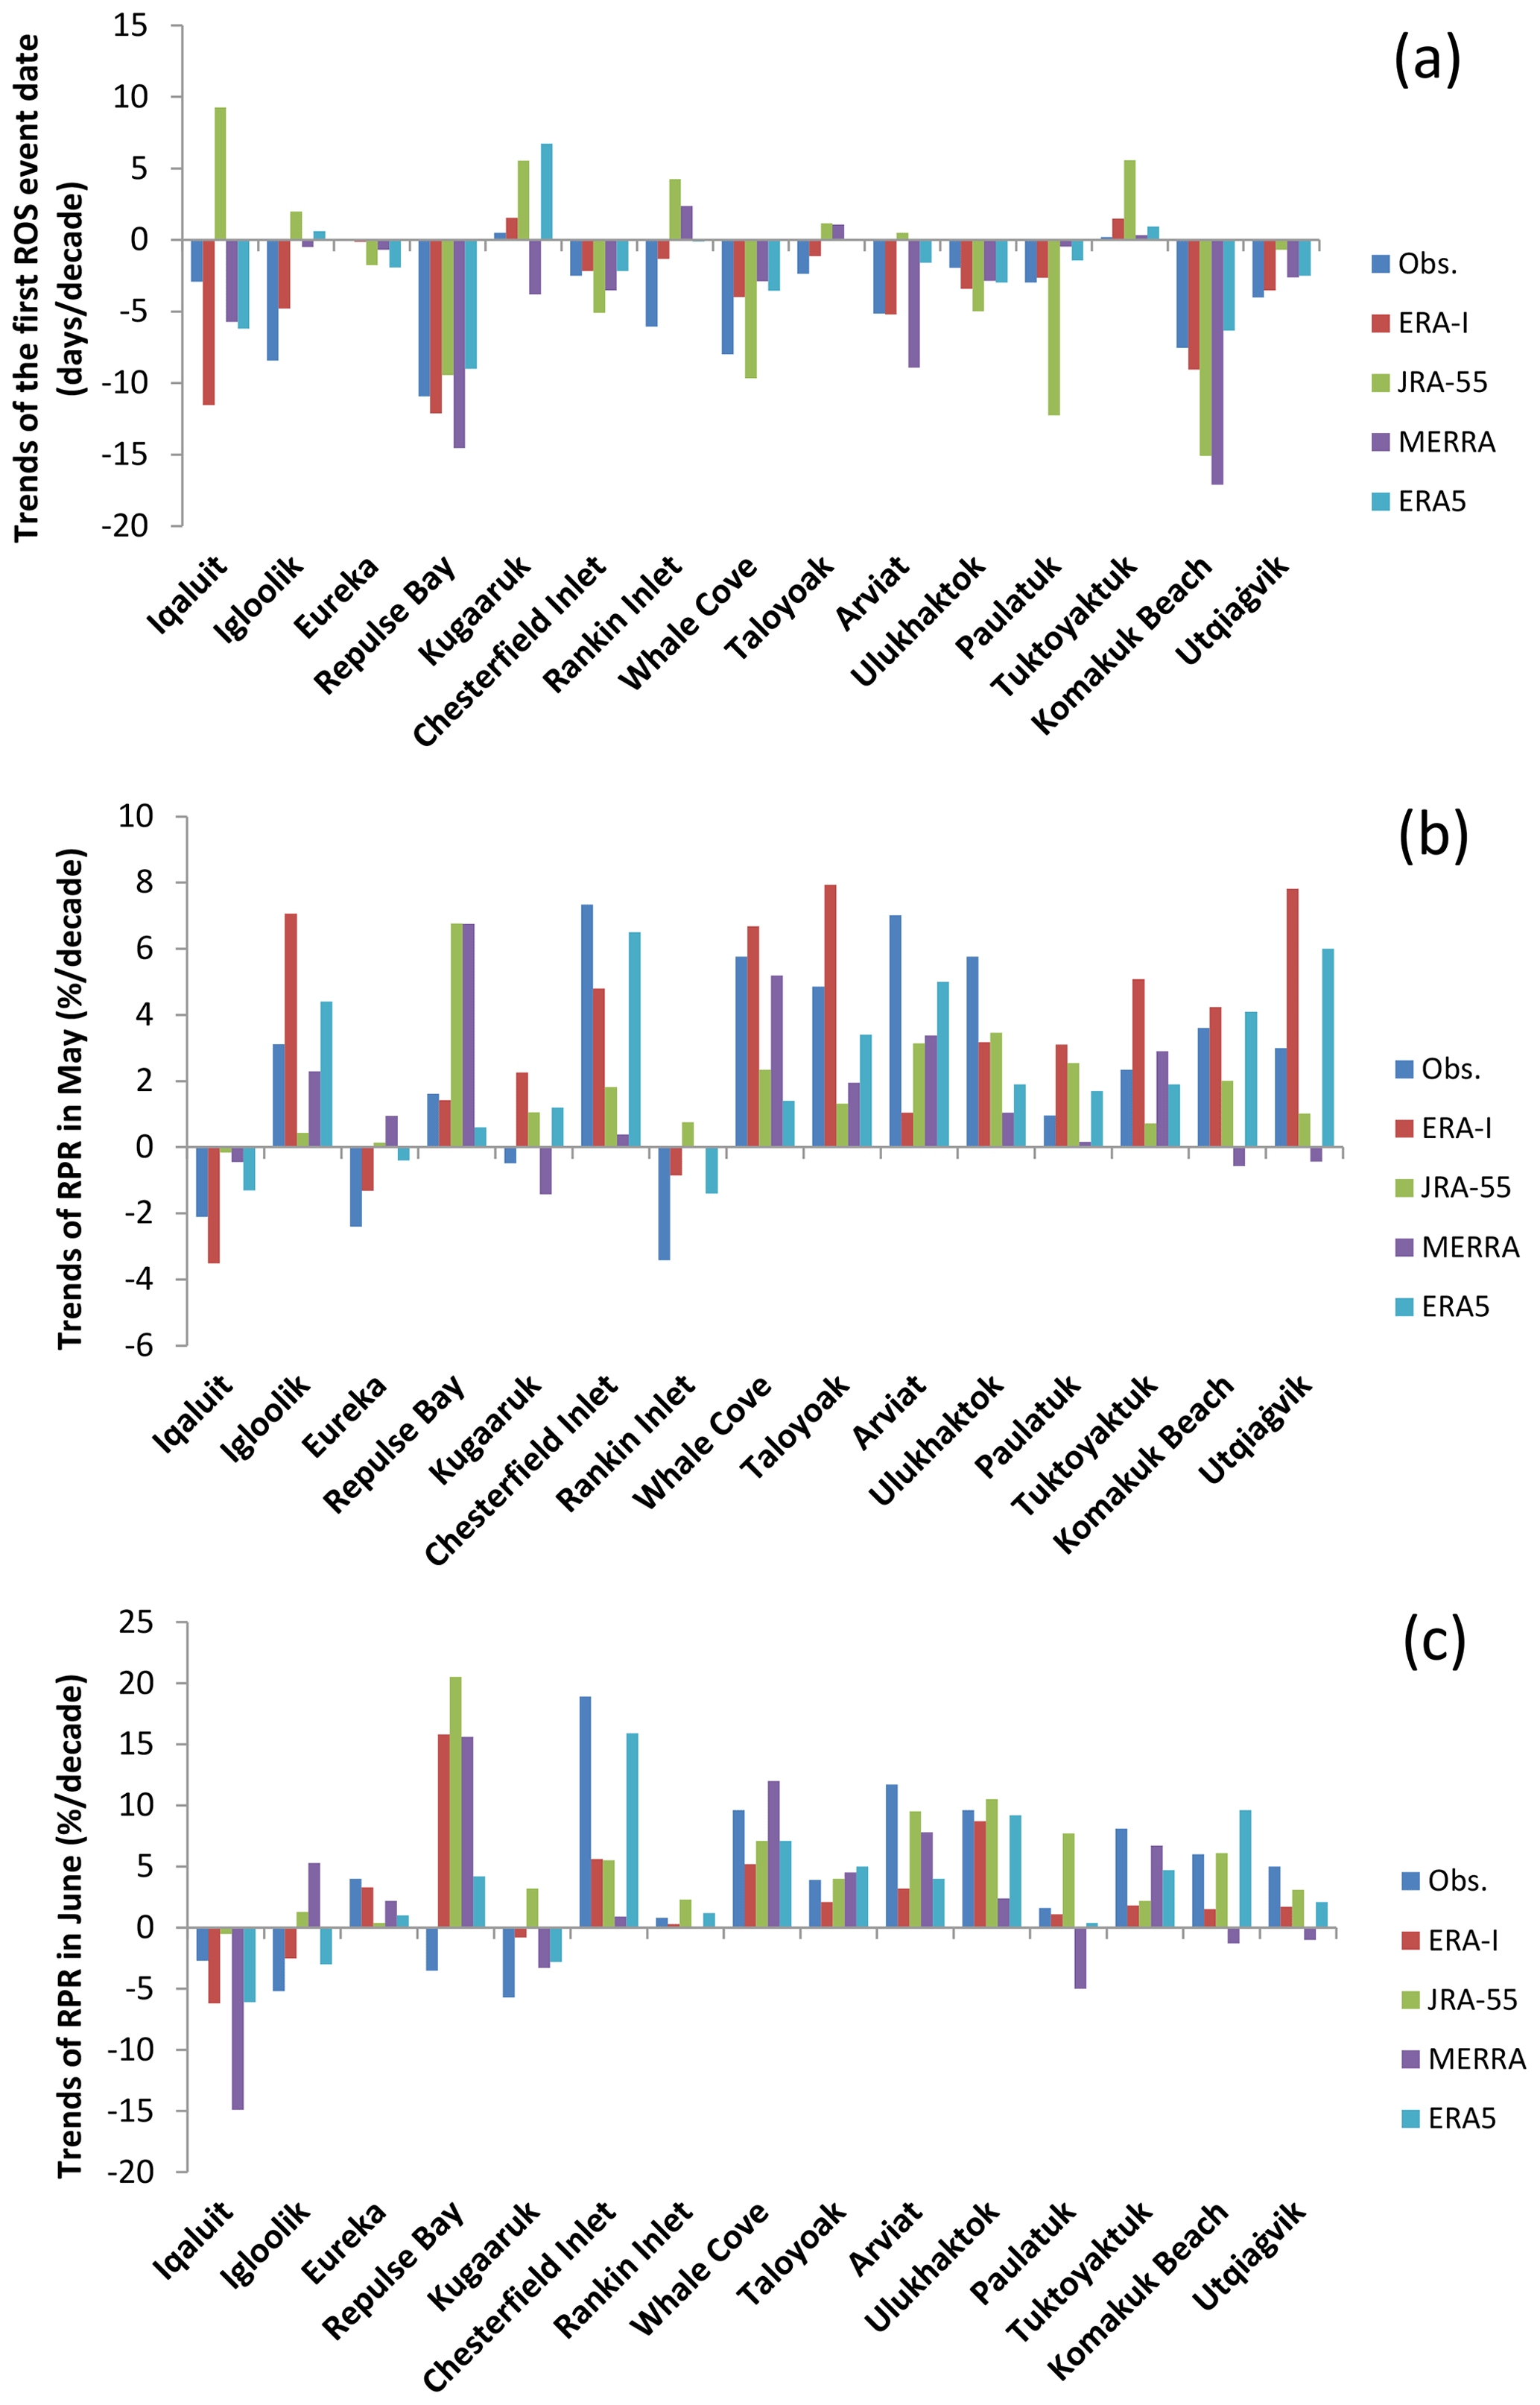
Figure 1(a) Comparison of the trends in the first rain-on-snow (ROS) event date between the four reanalysis datasets and the station observations. (b) Comparison of trends in the rain–precipitation ratio (RPR) in May between different reanalysis datasets and the station observations. (c) Same as (b) but for June. The Utqiaġvik station and 14 stations in the Canadian Arctic Archipelago (CAA; see Table 1 for station information) are used and arranged from east to west.
ERA-I, JRA-55, and MERRA have similar spatial patterns over the Arctic Ocean for the trend of the date of the first ROS events (Fig. 2). These products reveal trends towards earlier ROS events across most of the study areas except for the North Atlantic–Arctic region, Bering Sea, and Hudson Bay (Fig. 2a–c). In contrast, ERA5 presents a trend towards earlier ROS events in nearly all regions including the Atlantic sector (Fig. 2d). All reanalysis datasets show consistent trends over the Arctic Ocean, but there are discrepancies in the location of significant trends among the datasets. The negative trend in ERA-I reaches −4 to −6 d per decade in some regions of the Beaufort, East Siberian, and Laptev seas and stays below −2 d per decade in most other parts of the Arctic Ocean. JRA-55 has a stronger trend than ERA-I and other products, especially in the Eurasian Basin where the trend at most grid points can be up to −6 to −8 d per decade. The magnitude of the trend in MERRA is smaller than that in JRA-55 and ERA-I. The strongest trends over the Arctic Ocean in MERRA range from −2 to −4 d per decade and are mainly located over the marginal seas. ERA5 has a smaller area with significant trends, although it presents the most significant trend (more than −8 d per decade) in the east-central part of the Canada basin. In summary, although there are some discrepancies, all reanalysis products consistently show that the first ROS events during the spring season have been occurring earlier over many regions of the Arctic Ocean, and the most pronounced trends were over the marginal seas.

Figure 2Trend in the date of the first rainfall in spring (March to June) over Arctic sea ice north of 50∘ N during 1980–2017 in (a) ERA-I, (b) JRA-55, (c) MERRA, and (d) ERA5 (units: days per decade). The trend is calculated only for grid cells which experienced rainfall between March and June in more than 80 % of the years in the record (i.e., in >30 years). Dotted regions indicate that the trends are significant at the 95 % confidence level or higher (p<0.05). A negative trend means that the first rainfall shifts to earlier dates.
3.2 Sensitivity of sea ice melt onset to ROS events
We examined the ERA-I dataset, which was found to compare well with the observations at the Alaska Arctic and CAA stations in the preceding section, to analyze the sensitivity of early sea ice melt onset to ROS events in the Arctic. A detrended correlation analysis reveals that EMO is sensitive to ROS events in the Pacific sector of the Arctic Ocean and most of the Siberian marginal seas (Fig. 3). EMO in the Kara, Laptev, and Chukchi seas, along with the eastern part of the East Siberian Sea, exhibits the highest correlation with and therefore is most sensitive to ROS events (Fig. 3). There are also significant correlations over the northern waters of the Chukchi Sea, western central Arctic Ocean, Hudson Bay, and waters north of Severnaya Zemlya, but the FRD occurs after EMO in these areas. In conclusion, the sensitivity of EMO to FRD is mainly present in the marginal seas of the Arctic Ocean.
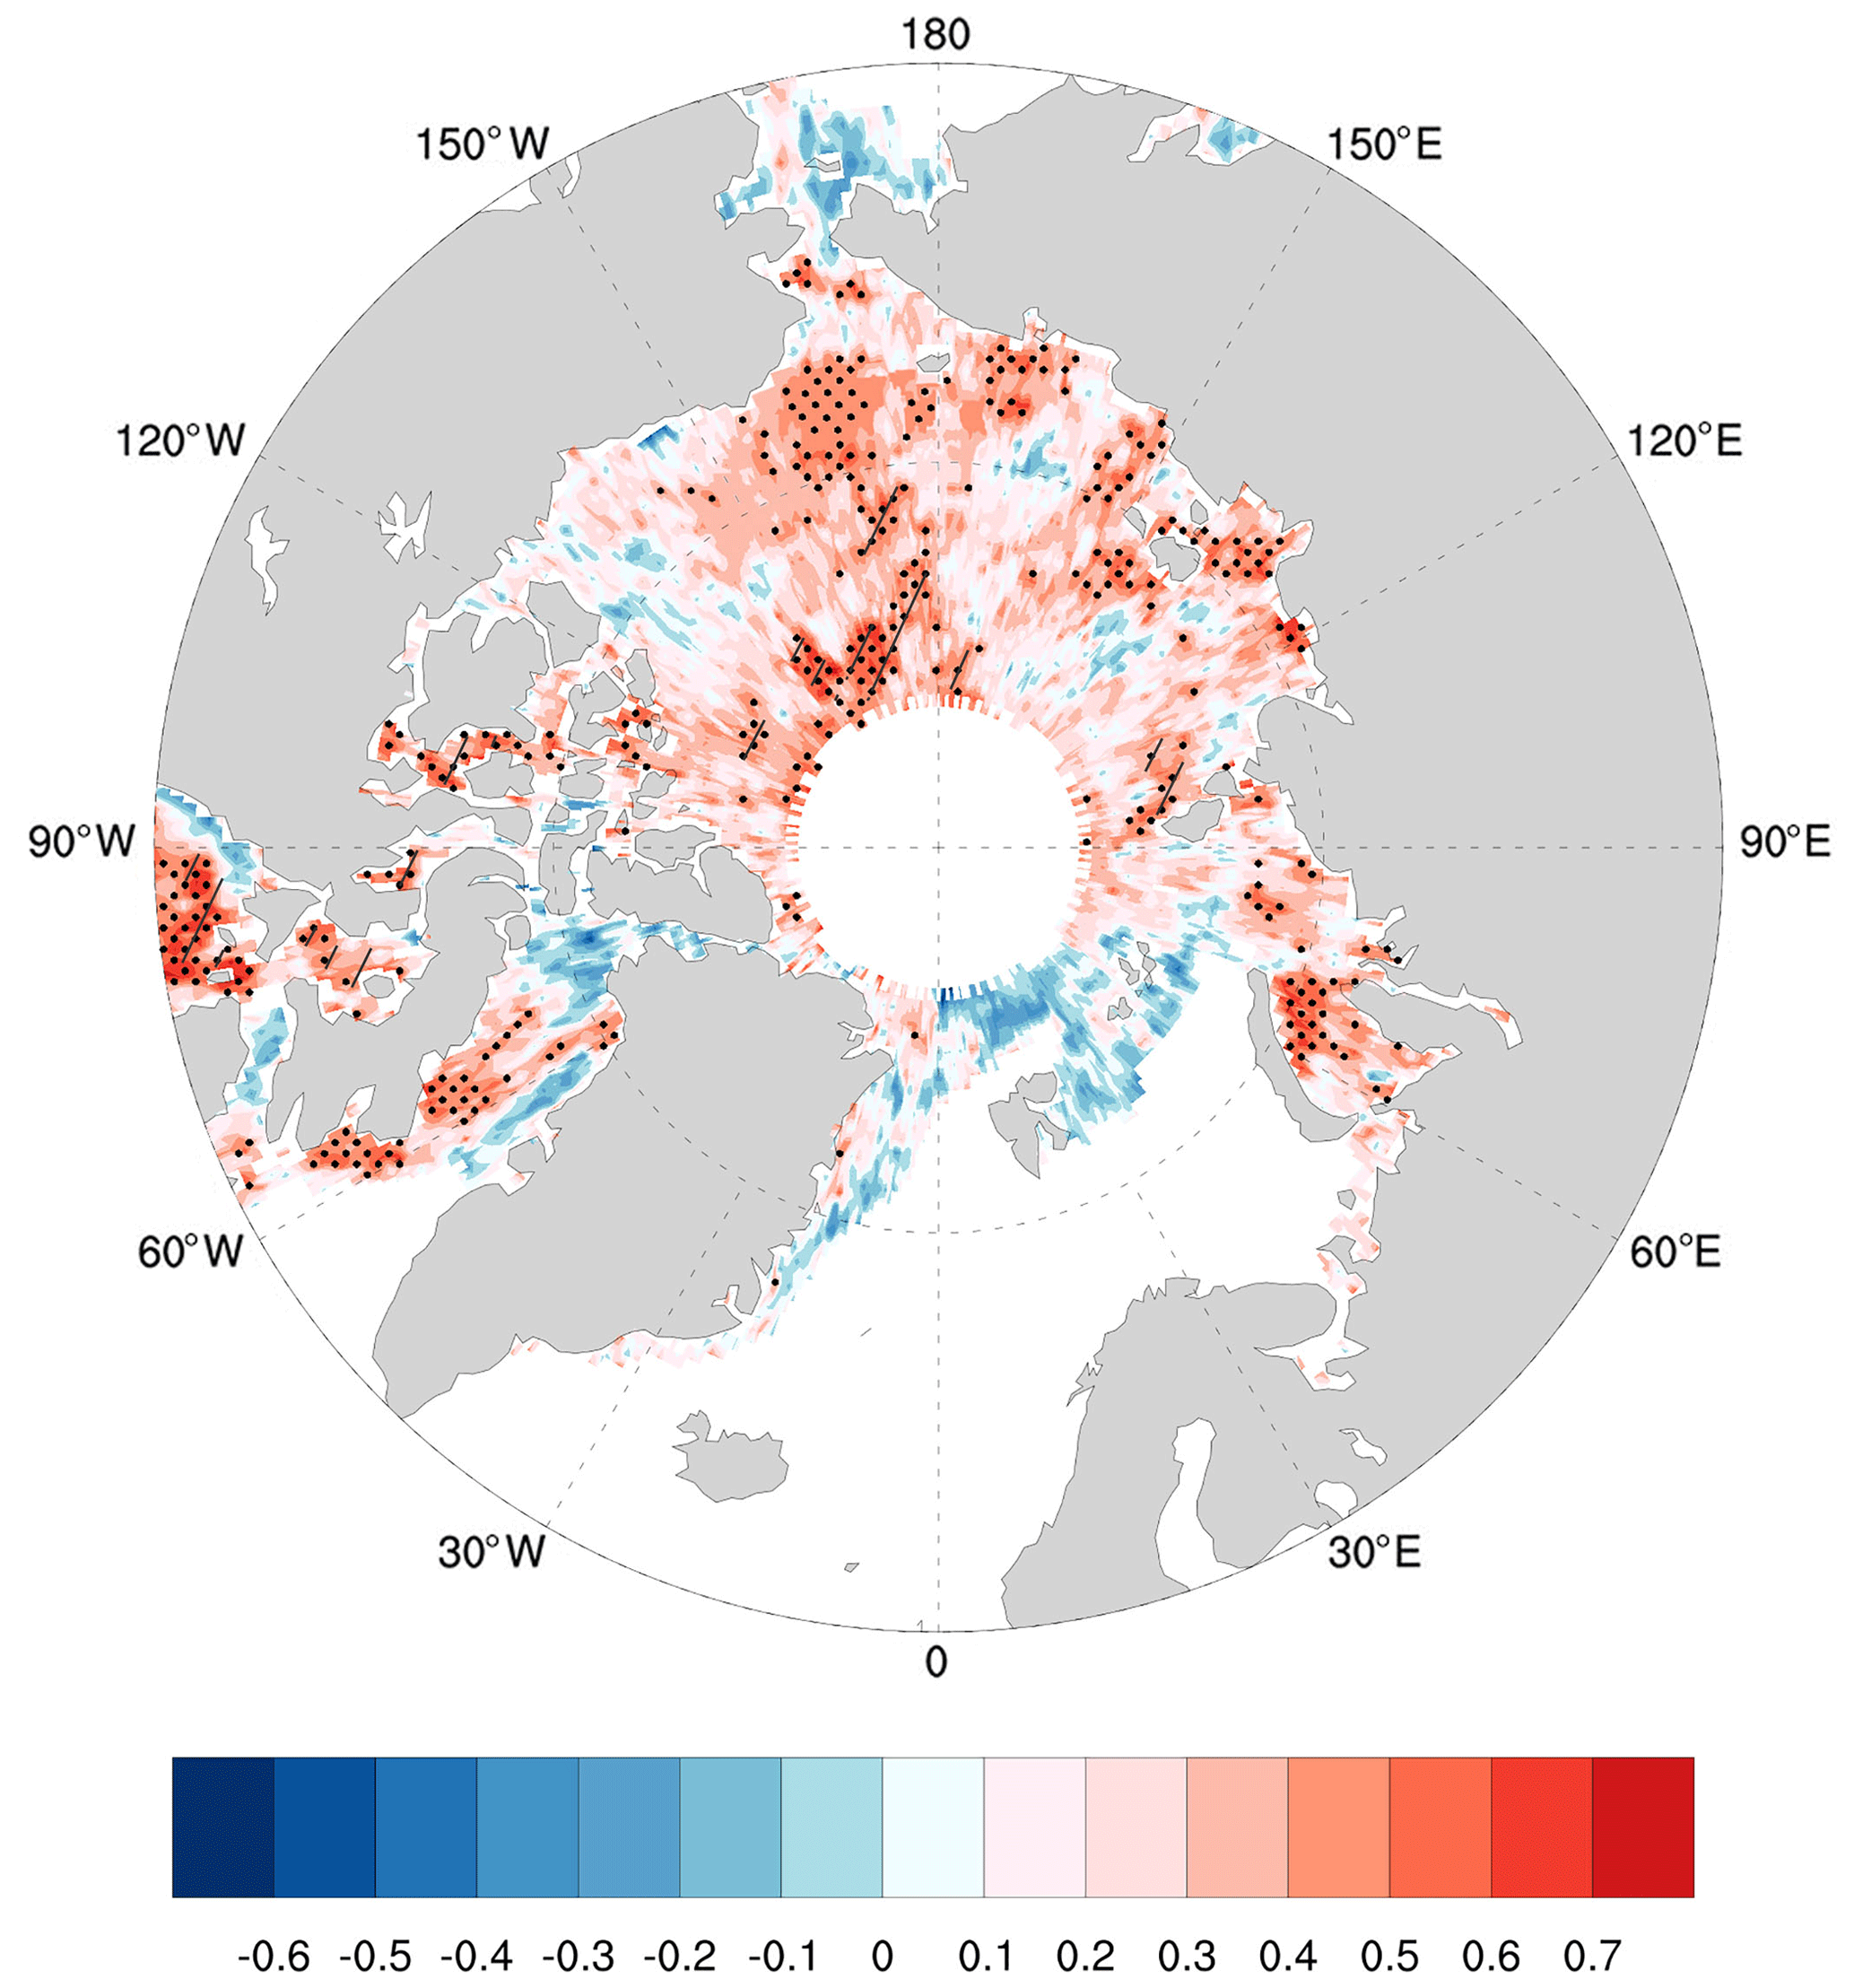
Figure 3The spatial distribution of correlations between linearly detrended first ROS event date (FRD) from ERA-I and early melt onset date (EMO) over 1980–2017. Regions where the correlation coefficients pass the 95 % confidence level (p<0.05) are denoted by black dots. Regions where the FRD comes after EMO are also denoted by a slash.
Earlier studies explained potential trigger mechanisms for sea ice ablation mainly in terms of atmospheric physical processes. Specifically, melt-triggering weather patterns were shown to be associated widely with intensified atmospheric transient eddy activity and enhanced northward transport of warm and moist air (e.g., Persson, 2012; Liu and Schweiger, 2017; Hegyi and Deng, 2017). As a result, there are typically positive anomalies in air temperature, precipitable water vapor, and cloud fraction which increase the downward longwave radiative flux at the surface, contributing to initial melt (Mortin et al., 2016; Kapsch et al., 2016; Oltmanns et al., 2019; Huang et al., 2019). In addition, ROS events may also occur alongside warm and moist air invasions (Bieniek et al., 2018) and influence the snow and ice ablation. ROS events can directly lead to an increase in the amount of liquid water at the surface and alter the emissivity (Markus and Cavalieri, 2000; Ferraro et al., 2013). Additionally, rainfall can effectively reduce the surface albedo and bring in additional heat when it penetrates into the snow layer, initiating positive snow–ice albedo feedback (Dou et al., 2019).
The above analysis provides further evidence to explain increased vulnerability of Arctic sea ice to climate change. Rapid sea ice loss is not just driven by warm weather systems which cause positive anomalies of heat flux, moisture convergence, and downward long-wave radiation flux (e.g., Kug et al., 2010; Lee et al., 2017), thus leading to rapid melting of sea ice (e.g., Parkinson and Comiso, 2013; Serreze et al., 2016; Praetorius et al., 2018; Bi et al., 2019). We suggest that springtime ROS events are also a factor influencing sea ice melt onset, although their impact is more pronounced on regional scales, as shown in Fig. 3.
3.3 Variability and trends in precipitation phase
The amount of rainfall depends on the total precipitation and the portion of total precipitation occurring as rainfall, as quantified by the rain precipitation ratio, RPR (see Sect. 2.5). Below, we evaluated and compared changes in RPR across four different reanalysis products. The RPR averaged over the Arctic Ocean is overall higher for all spring months in ERA-I than in the other three reanalysis datasets (Fig. 4). MERRA has the lowest RPR among the four reanalysis datasets (Fig. 4c). JRA-55 and ERA5 have similar RPRs in March, April, and June, while May RPR based on ERA5 is lower than that in JRA-55 (Fig. 4b and d). RPR is relatively small in March and April in all reanalyses, indicating that most precipitation falls as snow during this period. RPR increases significantly in May and June, and rainfall accounts for about half of the total precipitation by June, but there are large discrepancies between datasets. The interannual variability of RPR in JRA-55 is significantly larger than that in the other three products in June.
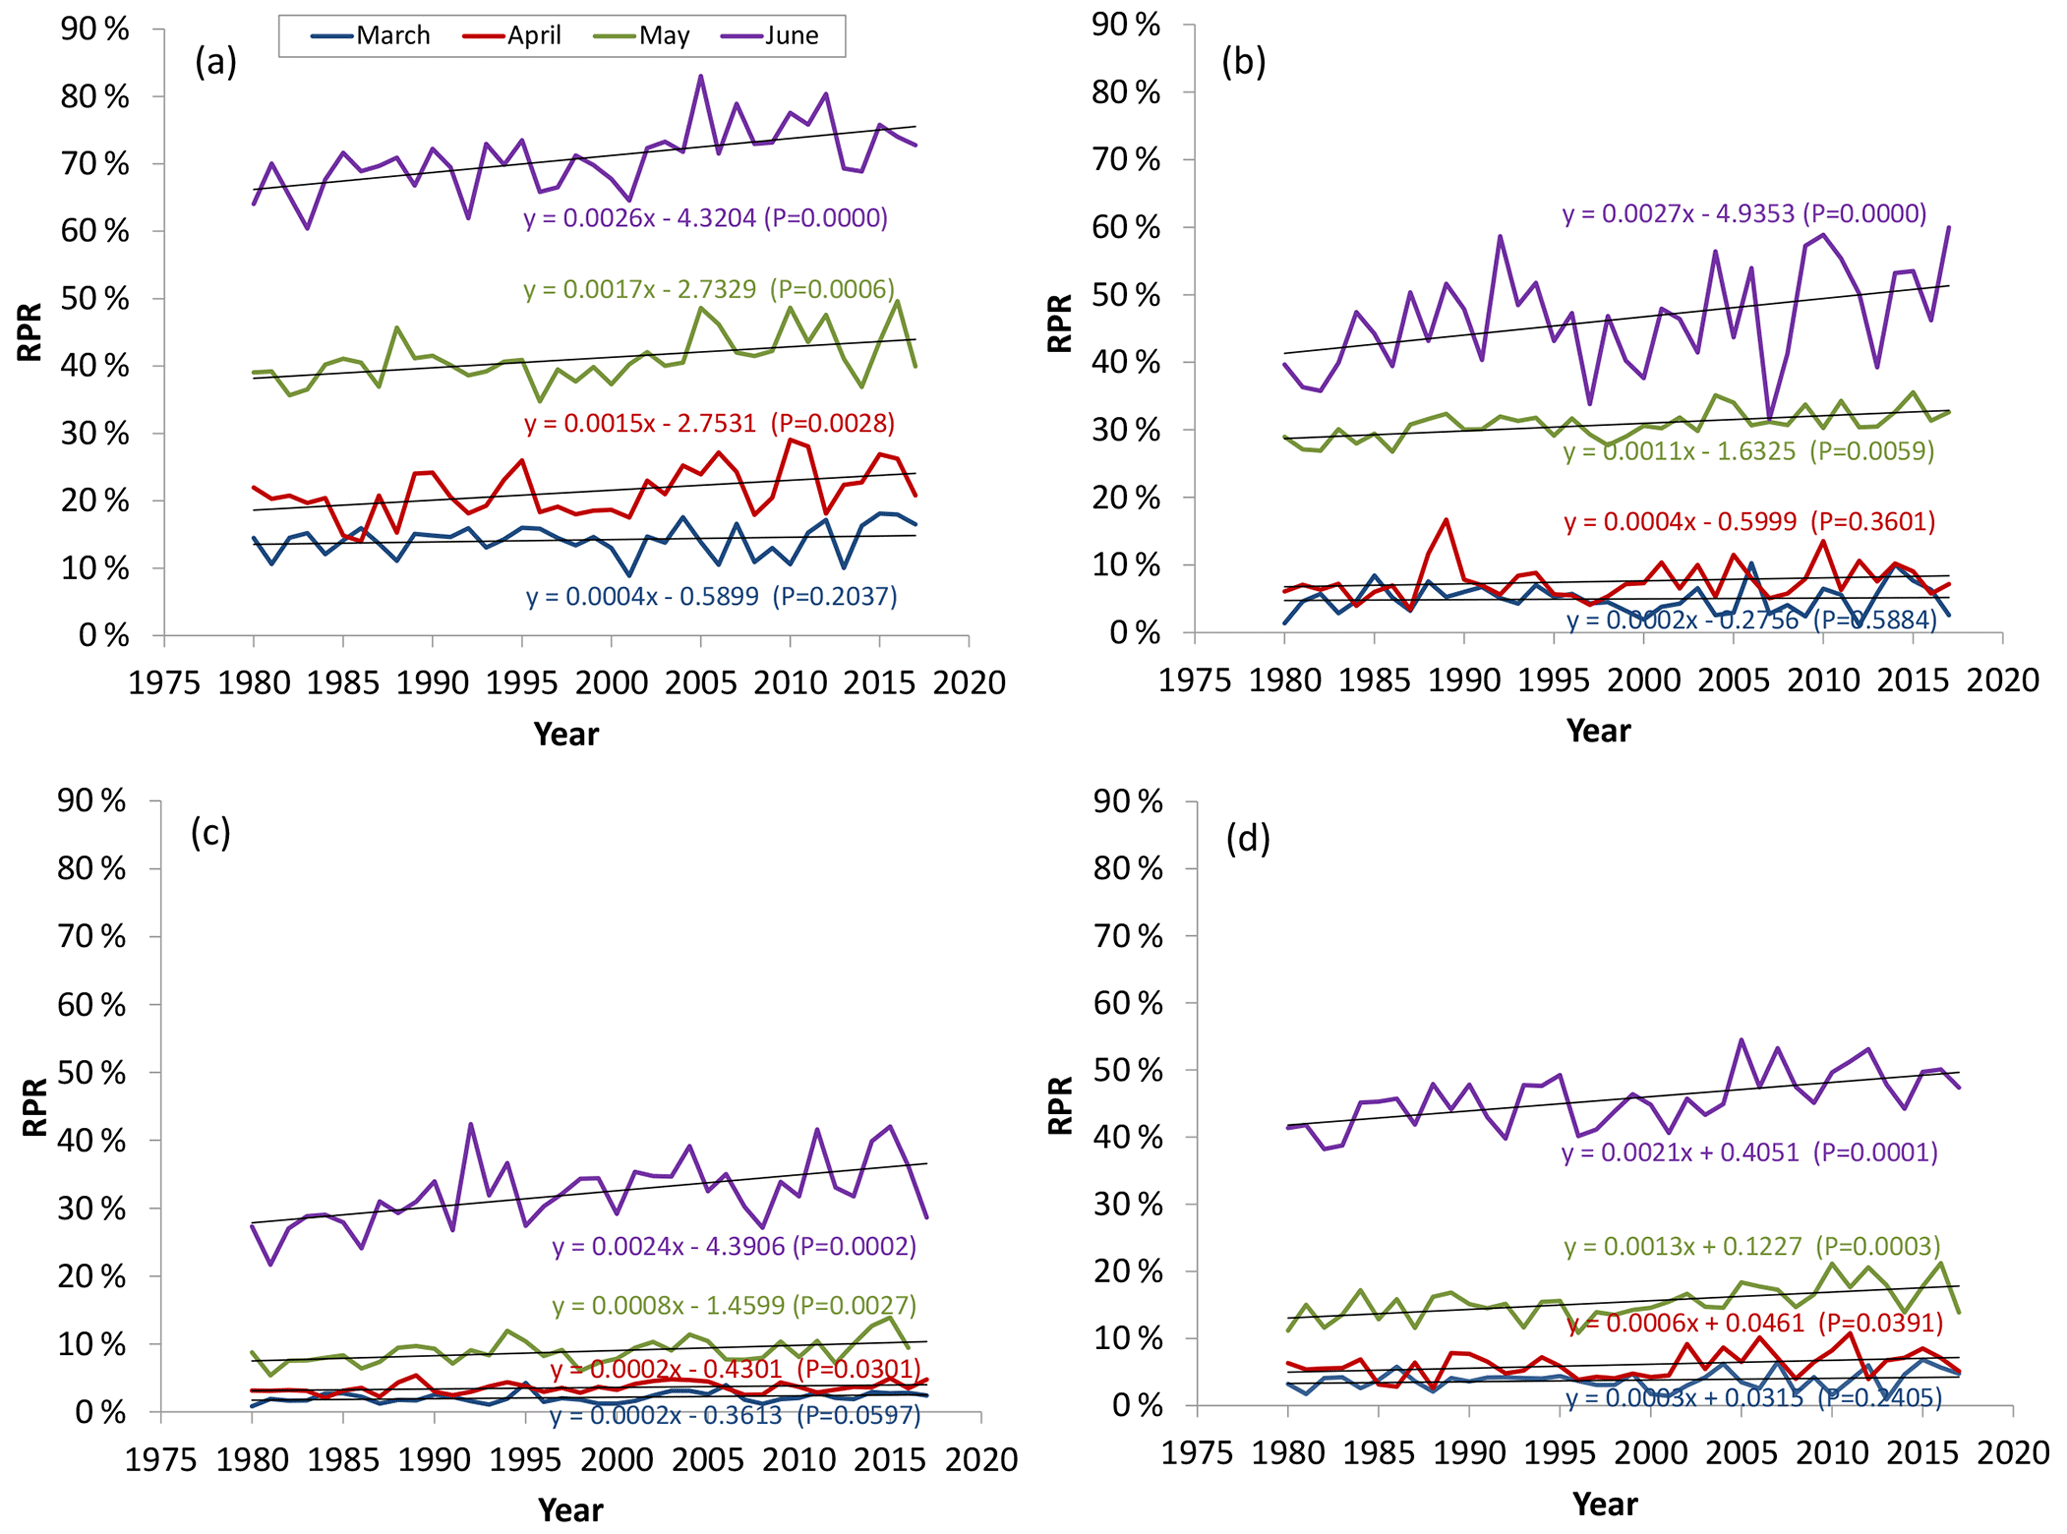
Figure 4Time series of monthly rainfall–precipitation ratio (RPR) averaged over the Arctic Ocean for (a) ERA-I, (b) JRA-55, (c) MERRA, and (d) ERA5.
RPR in the four products exhibits consistently increasing trends in each month over past decades, especially in May and June. The most significant trend occurs in June for all the reanalysis datasets (Fig. 4). Averaged over the whole Arctic sea ice area, the RPR trend in June in ERA-I, JRA, MERRA, and ERA5 amounts to 2.6 %, 2.7 %, 2.4 %, and 2.1 % per decade, respectively. The RPR trends in May from ERA-I, JRA, MERRA, and ERA5 are 1.7 %, 1.1 %, 0.8 %, and 1.3 % per decade, respectively. We note that the changes in the RPR in June–May over the studied period in all the products, although statistically significant, are smaller than the spread of the RPR mean values among these reanalysis products.
We further assessed the reanalysis datasets using the station observations in northern Alaska and CAA. Due to the lack of significant trends in RPR in March and April (Fig. 4), we focus on the RPR in May and June in the following, which is the period when precipitation phase matters for snow–ice ablation. Averaged over the stations, the mean RPR in June in ERA5 (65.7 % ± 4.0 %) and JRA-55 (66.1 % ± 11.5 %) is closer to the observations (63.3 % ± 9.1 %), but it is overestimated by ERA-I (88.3 % ± 7.9 %) and underestimated by MERRA (47.9 % ± 6.9 %). In May, the observed mean RPR at the stations (13.1 % ± 2.3 %) is well reproduced by ERA5 (15.4 % ± 2.6 %), while JRA-55 (30.7 % ± 2.1 %) overestimates it and MERRA (8.9 % ± 1.8 %) underestimates it. Actually, the ERA-I overestimates the RPR in all months from March to June (not shown), which is consistent with earlier studies (Leeuw et al., 2015; Wang et al., 2019).
For RPR in June, ERA-I and ERA5 have similar trend directions and reproduce the observed direction at all stations except for Repulse Bay (Fig. 1c). JRA-55 also captures the direction of the trends except at three stations (Kugaaruk, Igloolik, and Repulse Bay). ERA5 has trend magnitudes comparable with the observations at 13 of the stations (except for Arviat and Repulse Bay), and ERA-I is comparable with 11 of the station observations (Fig. 1c). JRA-55 is comparable to the observations at more than half of the stations, while MERRA performs relatively poorly, with trend values comparable to the observations only at six stations. For the trend of RPR in May, the four products are able to reproduce the trend direction at most stations (Fig. 1b). Similar to the situation in June, ERA5 performs better than the other three products in northern Alaska and CAA in May.
The spatial patterns of the trends in June RPR obtained from the four reanalysis datasets are shown in Fig. 5e–h. It can be seen that increasing trends of RPR exist over most of the Arctic sea ice area, although there are significant spatial variations. ERA-I has the largest area with significant increasing trends, including the sector of the East Siberian Sea that extends to the center of the Arctic Ocean (ESAO) and the Kara Sea, where the increasing trends range up to 4 %–6 % per decade (Fig. 5e). In JRA-55, high increasing trends also exist over the ESAO region, but the area with statistically significant values is smaller than in ERA-I (Fig. 5f). Another region with high increasing trends in JRA-55 is the Canada Basin (Fig. 5f). The significant increasing trends in MERRA are mainly located in the marginal seas including the eastern Canada Basin and Chukchi, Laptev, and Kara seas (Fig. 5g). ERA5 has significant increasing trends in the Beaufort Sea, north Chukchi Sea, and the Kara Sea, and there is a weakly negative trend over the eastern Canada Basin, which is different from the other three datasets (Fig. 5h). Although the spatial patterns are quite different, the maximum trend values (4 %–6 % per decade) are similar in the four reanalysis datasets.
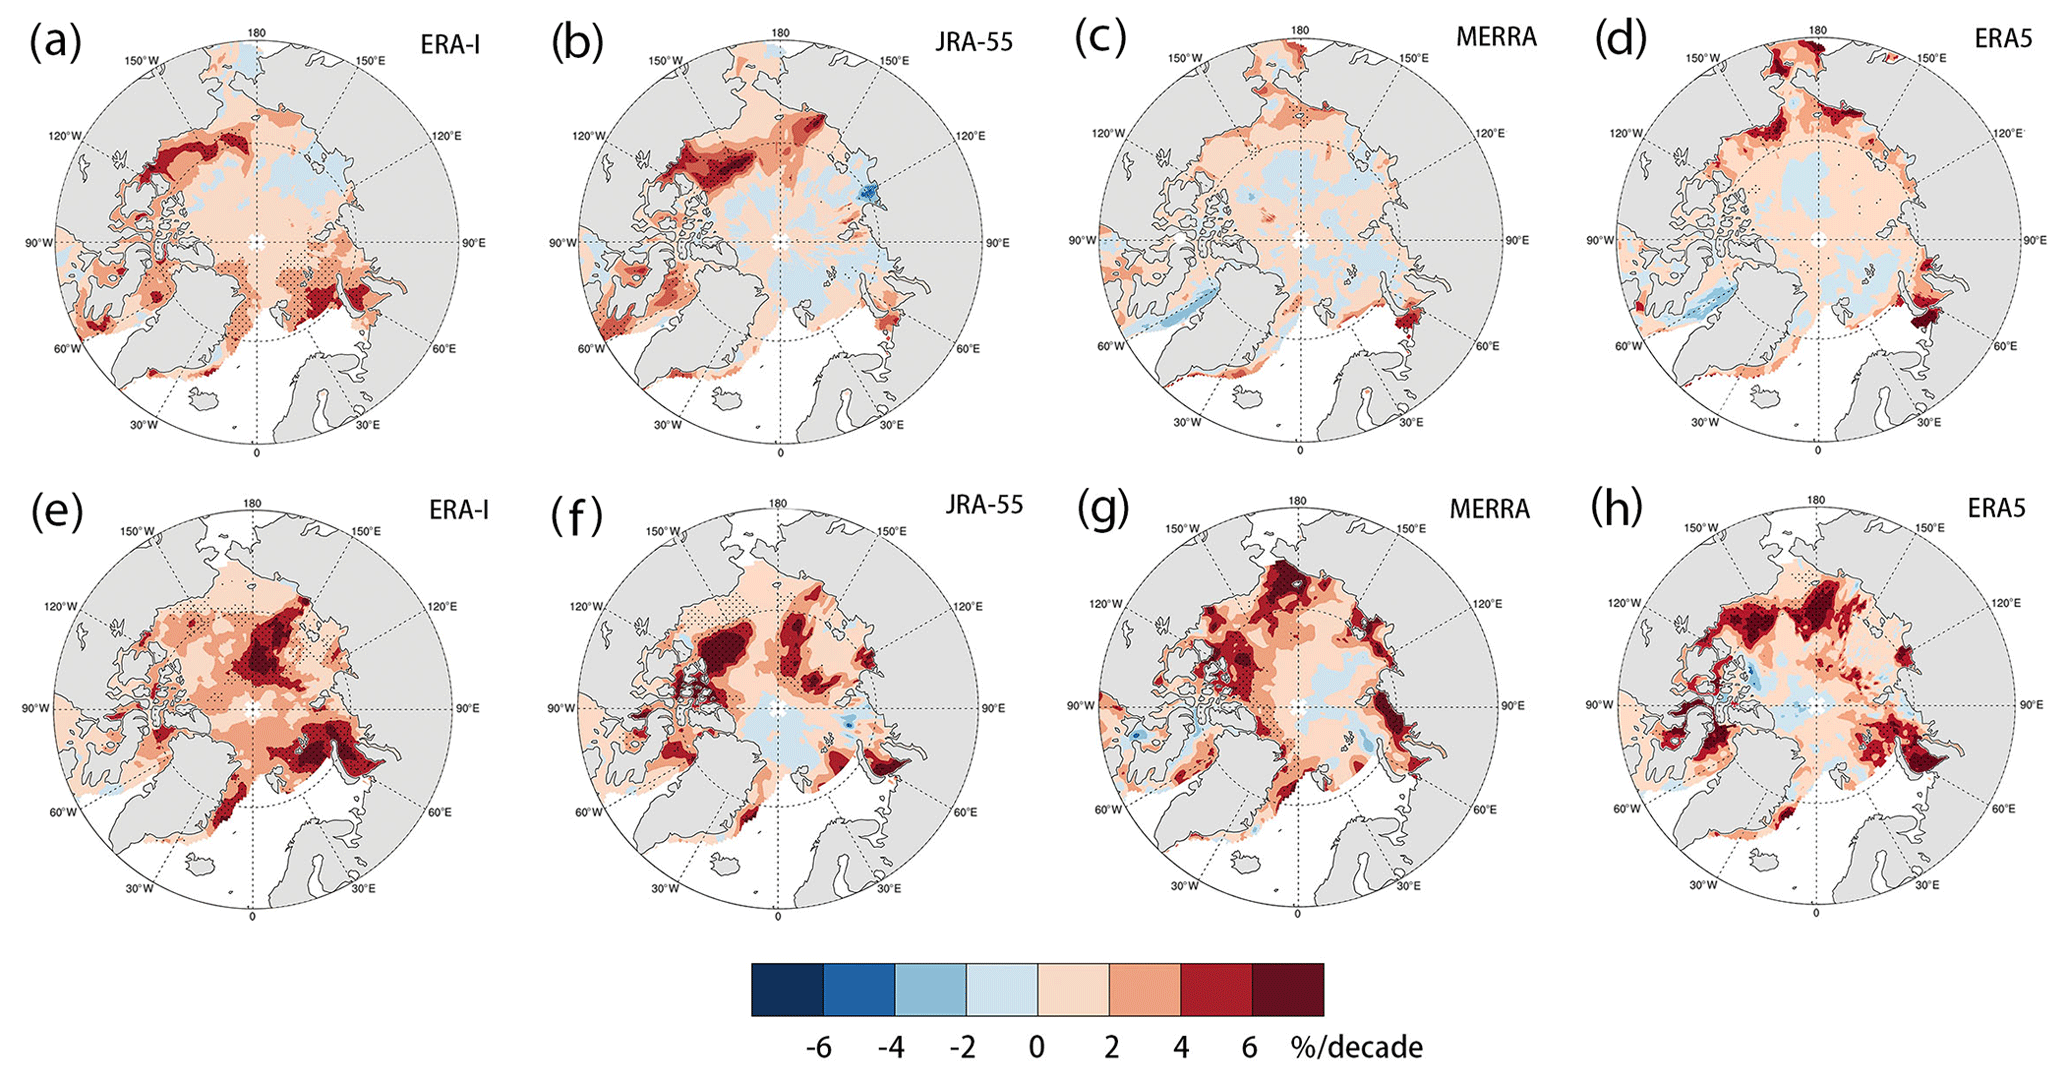
Figure 5Linear trend of rainfall–precipitation ratio (RPR) in May (upper panel) and June (bottom panel) over Arctic sea ice during 1980–2017 in ERA-I (a, e), JRA-55 (b, f), MERRA (c, g), and ERA5 (d, h). Regions passing the 0.05 significance test are denoted by black dots.
In May, significant RPR trends (4 %–6 % per decade) are present in the western Arctic Ocean in both ERA-I and JRA-55, while they are also present in the western Kara Sea in ERA-I (Fig. 5a–d). The spatial pattern of the RPR trend in May in ERA5 is close to MERRA, but the magnitude of the trends is greater than in MERRA over the marginal seas (Fig. 5c–d). Overall, the RPR trends are predominantly positive over the Arctic Ocean in May and June, although there are large spatial differences among the products in both months. There is also an increasing trend close to the ice edge in the Atlantic sector, especially in the Nordic arctic region. A recent study based on station observations in Svalbard demonstrated that the solid precipitation has decreased at a rate of 2.3 %–6.5 % per decade in this region during the past decades, while the liquid precipitation has increased at a rate of 0.6 %–9.4 % per decade during the same period (Førland et al., 2020). This is generally consistent with our results in the Atlantic sector (Figs. 4–5).
3.4 Contribution of changes in precipitation phase to snow reduction over sea ice
The trend of rainfall during ROS events accumulated from March to June was estimated based on ERA5, which shows the best performance in the representation of RPR when compared with station observations. The trends of total precipitation and RPR were also analyzed for the same period. As shown in Fig. 6, the ROS shows a significant increasing trend toward higher rainfall amounts in the marginal seas and CAA area except for the southern part of the Chukchi Sea and the western part of the East Siberian Sea. In the same period, the total precipitation amounts significantly increased in the northern Barents Sea and parts of the Kara Sea. They significantly declined along eastern Greenland, and the change in other areas of the Arctic Ocean is relatively small. The trend of RPR is generally consistent with the trend of ROS (Fig. 6).
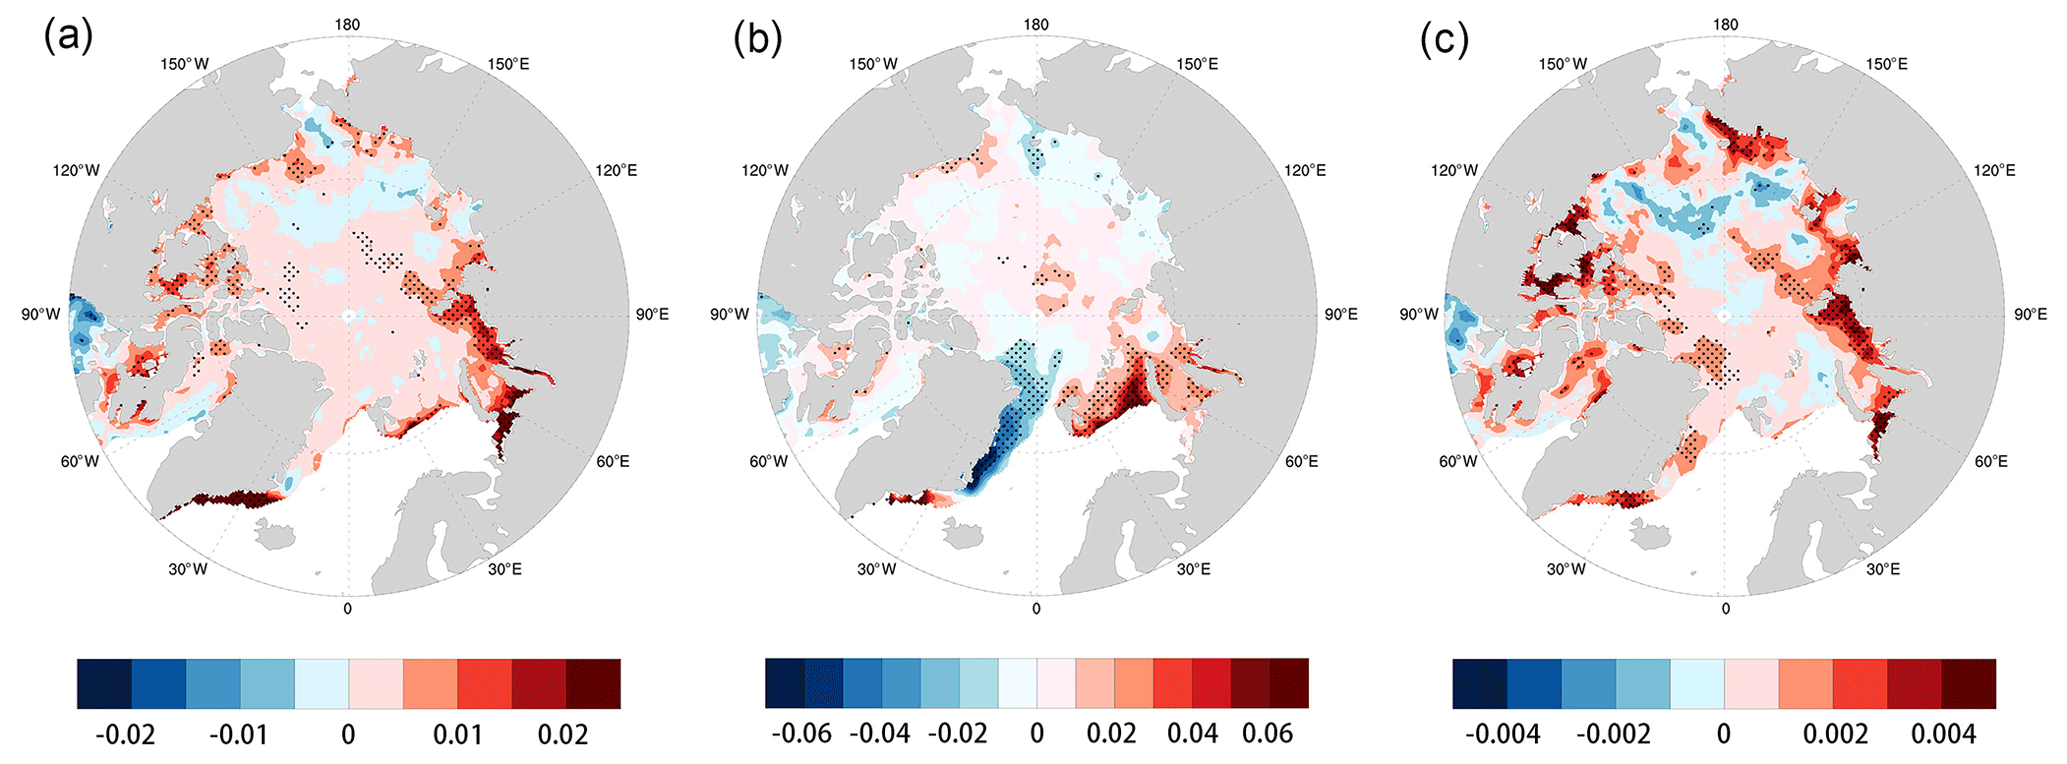
Figure 6Trend of rainfall (a), total precipitation (b), and RPR (c) during March and June based on ERA5 over Arctic sea ice during 1980–2017. Regions passing a 0.05 significance test are denoted by dots. The trend is derived from the slope of a linear regression. Unit of (a) and (b): centimeters per decade; unit of (c): percent per decade.
Webster et al. (2019) investigated the inter-decadal changes in snow depth over Arctic sea ice and attributed its variability and trends mainly to cyclone activity and accompanying precipitation, followed by the sea ice freeze-up. Here, we estimated the contribution of changes in precipitation phases to trends in spring snow depth on sea ice over the period 1980–2017 based on ERA5. We only consider the direct contribution from the mass of precipitation (less snowfall, lower snow thickness) while the indirect contribution from the latent heat of rainfall is beyond the scope of this study. Our analysis indicates that the impact on snow depth by precipitation phase changes has significant spatial variations (Fig. 7). The phase change leads to declines in snow depth in most of the Arctic marginal seas. In some small areas (including the central Canada Basin and part of the East Siberian Sea) increases in snow depth are induced. The Kara–Barents seas and Canadian Arctic Archipelago exhibit the largest decreasing trend (more than −2.0 cm per decade). Averaged over the Arctic Ocean, the reduction rate in snow thickness associated with precipitation phase transition is −0.5 cm per decade over the past decades. The actual contribution of the changes in the precipitation phases should be greater if the latent heat of increased rainfall is taken into account. This study suggests that the interdecadal decrease in snow depth on sea ice in spring is enhanced by the change in precipitation phase (solid to liquid) during the initial ablation period, in addition to the impacts from variability in cyclone snowfall over the snow accumulation season (Webster et al., 2019) and delayed sea ice freeze-up during autumn (Webster et al., 2014).
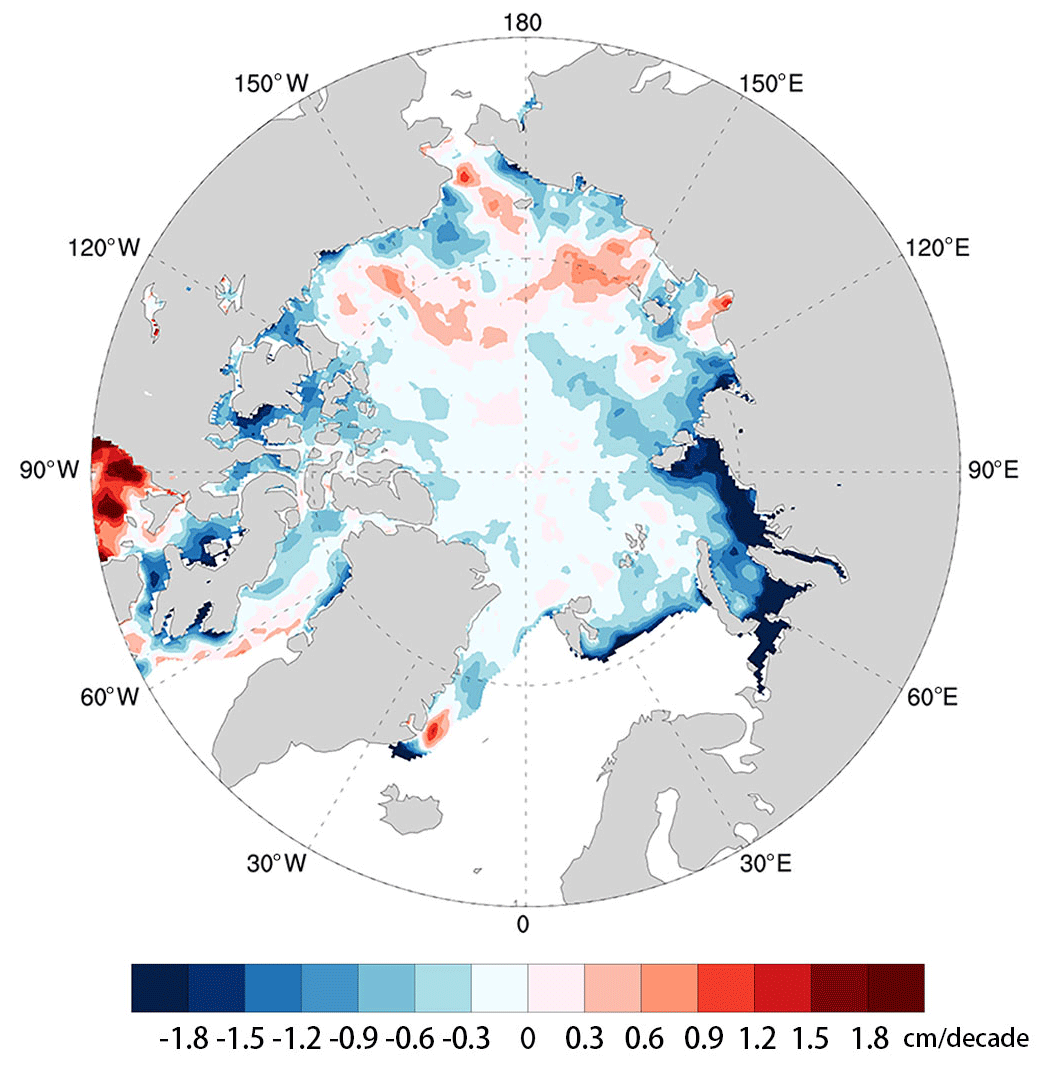
Figure 7The interdecadal trends in snow depth on sea ice induced by the precipitation phase transition in the early melt season during 1980–2017 based on ERA5.
Observations on landfast ice in the Chukchi Sea showed that spring rain-on-snow (ROS) events have an important impact on the sea ice ablation process during the early melt season (Dou et al., 2019). In particular, the timing of the first ROS events of the melt season is a key factor influencing the surface melt onset. However, because continuous precipitation observations are not available in the Arctic Ocean, there is little knowledge about the timing of the first ROS events in the Arctic sea ice area. This study, for the first time, synthesizes station observations at coastal sites in Arctic North America and multiple atmospheric reanalysis datasets, to examine rain on snow events over sea ice. We assessed the timing of the first ROS events in spring and the fraction of total precipitation occurring as rain over the Arctic Ocean during the initial phase of the melt season in four reanalysis products.
Our results show that the date of the first ROS events in ERA-I is closer to the station observations than in the other three products, in terms of the average timing, interannual variability, and trends. ERA-I and JRA-55 have similar trend magnitudes for the timing of the initial spring ROS events over the Arctic Ocean. The multiple reanalysis products consistently indicate that trends towards earlier spring ROS events exist throughout much of the Arctic Ocean over the past decades, with the most pronounced negative trends in the marginal seas. Results further demonstrate that sea ice melt onset is sensitive to the timing of the first melt season ROS events in the Pacific sector of the Arctic Ocean and the Eurasian marginal seas, especially over the Chukchi Plateau, in the Kara, Laptev, and East Siberian seas. The rain–precipitation ratio (RPR) averaged over the Arctic Ocean shows a significant increasing trend in May and June in all reanalysis datasets, although there are differences in the magnitude of the trend among the datasets. RPR in ERA-I is significantly higher than in other datasets over all spring months. For the mean value of RPR in May and June, ERA5 is closer to the observations at coastal stations, followed by JRA-55, while ERA-I overestimates and MERRA underestimates the observations.
ERA5 more reasonably reproduces the observed RPR and its trends than ERA-I compared with station observations. Several new techniques have been incorporated into ERA5 since ERA-I that have likely improved its performance. Firstly, ERA5 applies a prognostic cloud microphysics scheme, with separate cloud liquid, cloud ice, rain and snow prognostic variables (Sotiropoulou et al., 2015), which is more realistic than the scheme used in ERA-I that determines liquid and ice in cloud only by a temperature threshold (e.g., Dutra et al., 2011). Secondly, ERA5 uses much higher spatial and temporal resolutions, to improve the ability of the model to simulate meteorological conditions on regional scales, which is especially beneficial for simulating precipitation. In addition, ERA5 uses a newer assimilation scheme and involves various newly reprocessed datasets, for example, the reprocessed version of the Ocean and Sea Ice Satellite Application Facilities sea ice concentration (OSI-SAFr), and recent instruments that could not be ingested into ERA-I. As a result, ERA5 has a more consistent sea surface temperature and sea ice concentration (Hersbach and Dee, 2016), which will also improve the precipitation simulation over areas with strong and frequent air–sea interaction.
This study suggests that the solid-to-liquid precipitation phase transition (i.e., increased ROS events) contributed to a substantial reduction in snow depth on sea ice during the early melt season. ROS events have other important impacts that are not studied in this paper. For example, the formation of superimposed ice as a result of ROS events can also accelerate sea ice surface ablation during the early melt season by promoting the formation of melt ponds (Eicken et al., 2004; Petrich et al., 2012) and strengthening the ice–albedo feedback with the potential to cause greater ice mass loss in the warm period (Perovich et al., 1997; Stroeve et al., 2014; Schröder et al., 2014).
As atmospheric reanalysis datasets are often used to drive ocean ice models and for understanding climate dynamics, it is crucial to understand the uncertainties in the timing, phase, and spatial distribution of precipitation in these datasets. Among the studied datasets, ERA-I most realistically represents the timing of ROS events, and ERA5 favorably reproduces the RPR during ROS events and the phase change of precipitation in the study period. All the reanalysis datasets have certain biases compared to individual station observations. Besides requiring new techniques in different reanalysis systems to better reproduce precipitation, reliable observations that can better confine reanalysis are also required in the future.
The precipitation data at the Utqiaġvik Weather Service Office (WSO) Airport station are available from the Alaska Climate Research Center at http://climate.gi.alaska.edu/acis_data (Alaska Climate Research Center, 2020) The MERRA reanalysis dataset can be accessed at https://disc.sci.gsfc.nasa.gov/datasets?page=1&keywords=merra (Rienecker et al., 2011). The JRA-55 reanalysis dataset can be accessed at https://climatedataguide.ucar.edu/climate-data/jra-55 (Kobayashi et al., 2015). The ERA5 reanalysis dataset can be accessed at https://cds.climate.copernicus.eu/cdsapp#/dataset/reanalysis-era5-single-levels-monthlymeans?tab=form (Hersbach and Dee, 2016). The ERA-Interim reanalysis dataset can be accessed at https://apps.ecmwf.int/datasets/data/interim-full-daily/levtype=sfc/ (Dee et al., 2011).
TD, CX, HE, and JL jointly conceived the study. TD analyzed the data and wrote the manuscript with additional input from CX, HE, QW, JS, XY, and PAB. All of the authors discussed the results and contributed to interpretations.
The authors declare that they have no conflict of interest.
We wish to acknowledge ECMWF for ERA-Interim and ERA5 data. JRA-55 reanalysis data are obtained from the Japan Meteorological Agency Climate Prediction Division, Global Environment and Marine Department. MERRA reanalysis data are available from the NASA Goddard Earth Sciences Data and Information Services Center (GES-DISC). This study is funded by the National Key Research and Development Program of China (2018YFC1406103, 2018YFA0605901) and the National Nature Science Foundation of China (NSFC 41971084, 41676185).
This research has been supported by the National Key Research and Development Program of China (grant nos. 2018YFC1406103 and 2018YFA0605901) and the National Nature Science Foundation of China (NSFC 41971084, 41676185).
This paper was edited by Ketil Isaksen and reviewed by two anonymous referees.
Alaska Climate Research Center: ACIS Daily Data Browser, available at: http://climate.gi.alaska.edu/acis_data, last access: 28 July 2020.
Belington, P. R. and Robinson, D. K.: Data Reduction and Error Analysis for the Physical Sciences, edn. 3, McGraw-Hill Education, University of California, 320 pp., 2003.
Bi, H., Yang, Q., Liang, X., Zhang, L., Wang, Y., Liang, Y., and Huang, H.: Contributions of advection and melting processes to the decline in sea ice in the Pacific sector of the Arctic Ocean, The Cryosphere, 13, 1423–1439, https://doi.org/10.5194/tc-13-1423-2019, 2019.
Bieniek, P. A., Bhatt, U. S., Walsh, J. E., Lader, R., Griffith, B., Roach, J. K., and Thoman, R. L.: Assessment of Alaska rain-on-snow events using dynamical downscaling, J. Appl. Meteorol. Climatol., 57, 1847–1863, https://doi.org/10.1175/JAMC-D-17-0276.1, 2018.
Bintanja, R. and Andry, O.: Towards a rain-dominated Arctic, Nat. Clim. Change, 7, 263–267, 2017.
Birsan, M. V., Molnar, P., Burlando, P., and Faundler, M. P.: Streamflow trends in Switzerland, J. Hydrol., 314, 312–329, 2005.
Boisvert, L. N., Webster, M. A., Petty, A. A., Markus, T., Bromwich, D. H., and Cullather, R. I.: Intercomparison of precipitation estimates over the Arctic Ocean and its peripheral seas from reanalyses, J. Climate, 31, 8441–8462, 2018.
Box, G. E. P., Hunter, J. S., and Hunter, W. G.: Statistics for Experimenters: Design, Innovation, and Discovery, edn. 2, John Wiley & Sons Inc., USA, 672 pp., 2005.
Casson, N. J., Eimers, M. C., and Buttle, J. M.: The contribution of rain-on-snow events to nitrate export in the forested landscape of southcentral Ontario, Canada, Hydrol. Process., 24, 1985–1993, 2010.
Dee, D. P., Uppala, S. M., Simmons, A. J., Berrisford, P., Poli, P., Kobayashi, S., Andrae, U., Balmaseda, M. A., Balsamo, G., Bauer, P., Bechtold, P., Beljaars, A. C. M., van de Berg, L., Bidlot, J., Bormann, N., Delsol, C., Dragani, R., Fuentes, M., Geer, A. J., Haimberger, L., Healy, S. B., Hersbach, H., Hólm, E. V., Isaksen, L., Kållberg, P., Köhler, M., Matricardi, M., McNally, A. P., Monge-Sanz, B. M., Morcrette, J. J., Park, B. K., Peubey, C., de Rosnay, P., Tavolato, C., Thépaut, J. N., and Vitart, F.: The ERA-Interim reanalysis: configuration and performance of the data assimilation system, Q. J. Roy. Meteorol. Soc., 137, 553–597, https://doi.org/10.1002/qj.828, 2011 (data available at: https://apps.ecmwf.int/datasets/data/interim-full-daily/levtype=sfc/, last access: 12 August 2020).
Dou, T., Xiao, C., Liu, J., Han, W., Du, Z., Mahoney, A. R., Jones, J., and Eicken, H.: A key factor initiating surface ablation of Arctic sea ice: earlier and increasing liquid precipitation, The Cryosphere, 13, 1233–1246, https://doi.org/10.5194/tc-13-1233-2019, 2019.
Dutra, E., Schär, C., Viterbo, P., and Miranda, P. M. A.: Land atmosphere coupling associated with snow cover, Geophys. Res. Lett., 38, L15707, https://doi.org/10.1029/2011GL048435, 2011.
Eicken, H., Grenfell, T. C., Perovich, D. K., Richter-Menge, J. A., and Frey, K.: Hydraulic controls of summer Arctic pack ice albedo, J. Geophys. Res., 109, C08007, https://doi.org/10.1029/2003JC001989, 2004.
Ferraro, R. R., Peters-Lidard, C. D., Hernandez, C., Turk, F. J., Aires, F., Prigent, C., Lin, X., Boukabara, S.-A., Furuzawa, F. A., Gopalan, K., Harrison, K. W., Karbou, F., Li, L., Liu, C., Masunaga, H., Moy, L., Ringerud, S., Skofronick-Jackson, G. M., Tian, Y., and Wang, N.-Y.: An Evaluation of Microwave Land Surface Emissivities Over the Continental United States to Benefit GPM-Era Precipitation Algorithms, IEEE T. Geosci. Remote, 51, 378–398, 2013.
Fetterer, F., Knowles, K., Meier, W., Savoie, M., and Windnagel, A. K.: Sea Ice Index, Version 3 (Boulder, CO: NSIDC National Snow and Ice Data Center), https://doi.org/10.7265/N5K072F8, 2017.
Førland, E. J., Isaksen, K., Lutz, J., Hanssen-Bauer, I., Schuler, T. V., Dobler, A., Gjelten, H. M., and Vikhamar-Schuler, D.: Measured and Modeled Historical Precipitation Trends for Svalbard, J. Hydrometeorol., 21, 1279–1296, https://doi.org/10.1175/JHM-D-19-0252.1, 2020.
Gelaro, R., McCarty, W., Suárez, M. J., Todling, R., Molod, A., Takacs, L., Randles, C. A., Darmenov, A., Bosilovich, M. G., Reichle, R., Wargan, K., Coy, L., Cullather, R., Draper, C., Akella, S., Buchard, V., Conaty, A., da Silva, A. M., Gu, W., Kim, G.-K., Koster, R., Lucchesi, R., Merkova, D., Nielsen, J. E., Partyka, G., Pawson, S., Putman, W., Rienecker, M., Schubert, S. D., Sienkiewicz, M., and Zhao, B.: The Modern-Era Retrospective Analysis for Research and Applications, version 2 (MERRA-2), J. Climate, 30, 5419–5454, https://doi.org/10.1175/JCLI-D-16-0758.1, 2017.
Gloersen, P., Campbell, W. J., Cavalieri, D. J., Comiso, J. C., Parkinson, C., and Zwally, H. J.: Satellite passive microwave observations and analysis of Arctic and Antarctic sea ice, 1978–1987, Ann. Glaciol., 17, 149–154, 1993.
Han, W., Xiao, C., Dou, T., and Ding, M.: Arctic has been going through a transition from solid precipitation to liquid precipitation in spring, Chinese Sci. Bull., 63, 1154–1162, https://doi.org/10.1360/N972018-00088, 2018 (in Chinese).
Hegyi, B. M. and Deng Y.: Dynamical and thermodynamical impacts of high- and low-frequency atmospheric eddies on the initial melt of Arctic sea ice, J. Climate, 30, 865–883, 2017.
Hersbach, H. and Dee, D.: ERA5 reanalysis is in production, ECMWF Newsletter 147, ECMWF, available at: https://www.ecmwf.int/en/newsletter/147/news/era5-reanalysis-production (last access: 24 March 2017), 2016 (data available at: https://cds.climate.copernicus.eu/cdsapp#/dataset/reanalysis-era5-single-levels-monthlymeans?tab=form, last access: 12 August 2020).
Huang, Y., Dong, X., Xi, B., and Deng, Y.: A survey of the atmospheric physical processes key to the onset of Arctic sea ice melt in spring, Clim. Dynam., 52, 4907–4922, 2019.
Jeong, D. I., Sushama, L., and Khaliq, M. N.: Attribution of spring snow water equivalent (SWE) changes over the northern hemisphere to anthropogenic effects, Clim. Dynam., 48, 3645–3658, https://doi.org/10.1007/s00382-016-3291-4, 2016.
Kalnay, E., Kanamitsu, M., Kistler, R., Collins, W., Deaven, D., Gandin, L., Iredell, M., Saha, S., White, G., Woollen, J., Zhu, Y., Chelliah, M., Ebisuzaki, W., Higgins, W., Janowiak, J., Mo, K. C., Ropelewski, C., Wang, J., Leetmaa, A., Reynolds, R., Jenne, R., and Joseph, D.: The NCEP/NCAR 40 Year Reanalysis Project, B. Am. Meteorol. Soc., 77, 437–471, https://doi.org/10.1175/1520-0477(1996)077<0437:TNYRP>2.0.CO;2, 1996.
Kapsch, M. L., Graversen, R. G., Tjernström, M., and Bintanja, R.: The effect of downwelling longwave and shortwave radiation on Arctic summer sea ice, J. Climate, 29, 1143–1159, 2016.
Kobayashi, S., Ota, Y., Harada, Y., Ebita, A., Moriya, M., Onoda, H., Onogi, K., Kamahori, H., Kobayashi, C., Endo, H., Miyaoka, K., and Takahashi, K.: The JRA-55 Reanalysis: General specifications and basic characteristics, J. Meteorol. Soc. Jpn., 93, 5–48, https://doi.org/10.2151/jmsj.2015-001, 2015 (data available at: https://climatedataguide.ucar.edu/climate-data/jra-55, last access: 12 August 2020).
Kug, J. S., Choi, D. H., Jin, F. F., Kwon, W. T., and Ren, H. L.: Role of synoptic eddy feedback on polar climate responses to the anthropogenic forcing, Geophys. Res. Lett., 37, L14704, https://doi.org/10.1029/2010GL043673, 2010.
Kwok, R., Cunningham, G. F., Kacimi, S., Webster, M. A., Kurtz, N. T., and Petty, A. A.: Decay of the snow cover over Arctic sea ice from ICESat-2 acquisitions during summer melt in 2019, Geophys. Res. Lett., 47, e2020GL088209, https://doi.org/10.1029/2020GL088209, 2020.
Lee, H. J., Kwon, M. O., and Yeh, S. W.: Impact of poleward moisture transport from the North Pacific on the acceleration of sea ice loss in the Arctic since 2002, J. Climate, 30, 6757–6769, 2017.
Leeuw, J. D., Methven, J., and Blackburn, M.: Evaluation of ERA-Interim reanalysis precipitation products using England and Wales observations, Q. J. Roy. Meteorol. Soc., 141, 798–806, https://doi.org/10.1002/qj.2395, 2015.
Lindsay, R., Wensnahan, M., Schweiger, A., and Zhang, J.: Evaluation of Seven Different Atmospheric Reanalysis Products in the Arctic, J. Climate, 27, 2588–2606, 2014.
Liu, Z. and Schweiger, A.: Synoptic conditions, clouds, and sea ice melt onset in the beaufort and chukchi seasonal ice zone, J. Climate, 30, 6999–7016, 2017.
Markus, T. and Cavalieri, D. J.: An enhancement of the NASA Team sea ice algorithm, IEEE T. Geosci. Remote, 38, 1387–1398, 2000.
Markus, T., Stroeve, J. C., and Miller, J.: Recent changes in Arctic sea ice melt onset, freezeup, and melt season length, J. Geophys. Res., 114, C12024, https://doi.org/10.1029/2009JC005436, 2009.
McCabe, G. J., Clark, M. P., and Hay, L. E.: Rain-on-snow events in the western United States, B. Am. Meteorol. Soc., 88, 319–328, 2007.
Mortin, J., Svensson, G., Graversen, R. G., Kapsch, M.-L., Stroeve, J. C., and Boisvert, L. N.: Melt onset over Arctic sea ice controlled by atmospheric moisture transport, Geophys. Res. Lett., 43, 6636–6642, https://doi.org/10.1002/2016GL069330, 2016.
Neumann, R. B., Moorberg, C. J., Lundquist, J. D., Turner, J. C., Waldrop, M. P., McFarland, J. W., Euskirchen, E. S., Edgar, C. W., and Turetsky, R.: Warming effects of spring rainfall increase methane emissions from thawing permafrost, Geophys. Res. Lett., 46, https://doi.org/10.1029/2018GL081274, 2019.
Oltmanns, M., Straneo, F., and Tedesco, M.: Increased Greenland melt triggered by large-scale, year-round cyclonic moisture intrusions, The Cryosphere, 13, 815–825, https://doi.org/10.5194/tc-13-815-2019, 2019.
Parkinson, C. L. and Comiso, J. C.: On the 2012 record low Arctic sea ice cover: Combined impact of preconditioning and an August storm, Geophys. Res. Lett., 40, 1356–1361, https://doi.org/10.1002/grl.50349, 2013.
Peeters, B., Pedersen, Å. Ø., Loe, L. E., Isaksen, K., Veiberg, V., Stien, A., Kohler, J., Gallet, J.-C., Aanes, R., and Hansen, B. B.: Spatiotemporal patterns of rain-on-snow and basal ice in high Arctic Svalbard: detection of a climate-cryosphere regime shift, Environ. Res. Lett., 14, 015002, https://doi.org/10.1088/1748-9326/aaefb3, 2019.
Perovich, D. K., Bruce, C. E., and Richter-Menge, J. A.: Observations of the annual cycle of sea ice temperature, Geophys. Res. Lett., 24, 555–558, 1997.
Perovich, D., Polashenski, C., Arntsen, A., and Stwertka, C.: Anatomy of a late spring snowfall on sea ice, Geophys. Res. Lett., 44, 2802–2809, https://doi.org/10.1002/2016GL071470, 2017.
Persson, P. O. G.: Onset and end of the summer melt season over sea ice: Thermal structure and surface energy perspective from SHEBA, Clim. Dynam., 39, 1349–1371, 2012.
Peterson, B., McClelland, J., Curry, R., Holmes, R., Walsh, J., and Agaard, K.: Trajectory shifts in the Arctic and sub-Arctic freshwater cycle, Science, 313, 1061–1066, 2006.
Petrich, C., Eicken, H., Zhang, J., Krieger, J. R., Fukamachi, Y., and Ohshima, K. I.: Coastal landfast sea ice decay and break-up in northernAlaska: Key processes and seasonal prediction, J. Geophys. Res., 117, C02003, https://doi.org/10.1029/2011JC007339, 2012.
Praetorius, S., Rugenstein, M., Persad, G., and Caldeira, K.: Global and Arctic climate sensitivity enhanced by changes in North Pacific heat flux, Nat. Commun., 9, 3124, https://doi.org/10.1038/s41467-018-05337-8, 2018.
Putkonen, J. and Roe, G.: Rain-on-snow events impact soil temperatures and affect ungulate survival, Geophys. Res. Lett., 30, 1188, https://doi.org/10.1029/2002GL016326, 2003.
Rawlins, M. A., Steele, M., Holland, M. M., Adam, J. C., Cherry, J. E., Francis, J. A., Groisman, P. Y., Hinzman, L. D., Huntington, T. G., Kane, D. L., Kimball, J. S., Kwok, R., Lammers, R. B., Lee, C. M., Lettenmaier, D. P., McDonald, K. C., Podest, E., Pundsack, J. W., Rudels, B., Serreze, M. C., Shiklomanov, A., Skagseth, Ø., Troy, T. J., Vörösmarty, C. J., Wensnahan, M., Wood, E. F., Woodgate, R., Yang, D., Zhang, K., and Zhang, T.: Analysis of the Arctic system for freshwater cycle intensification: observations and expectations, J. Climate, 23, 5715–5737, 2010.
Reichle, R. H., Draper, C. S., Liu, Q., Girotto, M., Mahanama, S. P. P., Koster, R. D., and De Lannoy, G. J. M.: Assessment of MERRA-2 Land Surface Hydrology Estimates, J. Climate, 30, 2937–2960, 2017.
Renard, B., Lang, M., Bois, P., Dupeyrat, A., Mestre, O., Niel, H., Sauquet, E., Prudhomme, C., Parey, S., Paquet, E., Neppel, L., Gaihard, J.: Regional methods for trend detection: Assessing field significance and regional consistency, Water Resour. Res., 44, W08419, https://doi.org/10.1029/2007WR006268, 2008.
Rennert, K., Roe, G., Putkonen, J., and Bitz, C. M.: Soil thermal and ecological impacts of rain on snow events in the circumpolar Arctic, J. Climate, 22, 2302–2315, 2009.
Rienecker, M. M., Suarez, M. J., Gelaro, R., Todling, R., Bacmeister, J., Liu, E., Bosilovich, M. G., Schubert, S. D., Takacs, L. Kim, G. K., Bloom, S., Chen, J., Collins, D., Conaty, A., da Silva, A., Gu, W., Joiner, J., Koster, R. D., Lucchesi, R., Molod, A., Owens, T., Pawson, S., Pegion, P., Redder, C. R., Reichle, R., Robertson, F. R., Ruddick, A. G., Sienkiewicz, M., and Woollen, J.: MERRA: NASA's Modern-Era Retrospective Analysis for Research and Applications, J. Climate, 24, 3624–3648, https://doi.org/10.1175/JCLI-D-11-00015.1, 2011 (data available at: https://disc.sci.gsfc.nasa.gov/datasets?page=1&keywords=merra, last access: 12 August 2020).
Schröder, D., Feltham, D. L., Flocco, D., and Tsamados, M.: September Arctic sea-ice minimum predicted by spring melt-pond fraction, Nat. Clim. Change, 4, 353–357, 2014.
Screen, J. A. and Simmonds, I.: Declining summer snowfall in the Arctic: causes, impacts and feedbacks, Clim. Dynam., 38, 2243–2256, 2012.
Serreze, M. C., Crawford, A. D., Stroeve, J. C., Barrett, A. P., and Woodgate, R. A.: Variability, trends, and predictability of seasonal sea ice retreat and advance in the Chukchi Sea, J. Geophys. Res.-Oceans, 121, 7308–7325, https://doi.org/10.1002/2016JC011977, 2016.
Sotiropoulou, G., Sedlar, J., Forbes, R., and Tjernström, M.: Summer Arctic clouds in the ECMWF forecast model: An evaluation of cloud parameterization schemes, Q. J. Roy. Meteorol. Soc., 142, 387–400, 2015.
Stroeve, J. C., Markus, T., Boisvert, L., Miller, J., and Barrett, A.: Changes in Arctic melt season and implications for sea ice loss, Geophys. Res. Lett., 41, 1216–1225, 2014.
Vikhamar-Schuler, D., Isaksen, K., Haugen, J. E., Tømmervik, H., Luks, B., Schuler, T. V., and Bjerke, J. W.: Changes in Winter warming events in the Nordic Arctic Region, J. Climate, 29, 6223–6244, https://doi.org/10.1175/JCLI-D-15-0763.1, 2016.
Wang, C., Graham, R. M., Wang, K., Gerland, S., and Granskog, M. A.: Comparison of ERA5 and ERA-Interim near-surface air temperature, snowfall and precipitation over Arctic sea ice: effects on sea ice thermodynamics and evolution, The Cryosphere, 13, 1661–1679, https://doi.org/10.5194/tc-13-1661-2019, 2019.
Warren, S. G., Rigor, I. G., Untersteiner, N., Radionov, V. F., Bryazgin, N. N., Aleksandrov, Y. I., and Colony, R.: Snow depth on Arctic sea ice, J. Climate, 12, 1814–1829, 1999.
Webster, M. A., Rigor, I. G., Nghiem, S. V., Kurtz, N. T., Farrell, S. L., Perovich, D. K., and Sturm, M.: Interdecadal changes in snow depth on Arctic sea ice, J. Geophys. Res.-Oceans, 119, 5395–5406, https://doi.org/10.1002/2014JC009985, 2014.
Webster, M. A., Parker, C., Boisvert, L., and Kwok, R.: The role of cyclone activity in snow accumulation on arctic sea ice, Nat. Commun., 10, 1–12, 2019.
White, D., Hinzman, L., Alessa, L., Cassano, J., Chambers, M., Falkner, K., Francis, J., Gutowski Jr., W. J., Holland, M., Holmes, R. M., Huntington, H., Kane, D., Kliskey, A., Lee, C., McClelland, J., Peterson, B., Scott Rupp, T., Straneo, F., Steele, M., Woodgate, R., Yang, D., Yoshikawa, K., and Zhang, T.: The Arctic freshwater system: changes and impacts, J. Geophys. Res., 112, G02S54, https://doi.org/10.1029/2006JG000353, 2007.