the Creative Commons Attribution 4.0 License.
the Creative Commons Attribution 4.0 License.
 | 23 Dec 2021
Effect of snowfall on changes in relative seismic velocity measured by ambient noise correlation
Antoine Guillemot
Alec van Herwijnen
Eric Larose
Stephanie Mayer
Laurent Baillet
In mountainous, cold temperate and polar sites, the presence of snow cover can affect relative seismic velocity changes () derived from ambient noise correlation, but this relation is relatively poorly documented and ambiguous. In this study, we analyzed raw seismic recordings from a snowy flat field site located above Davos (Switzerland), during one entire winter season (from December 2018 to June 2019). We identified three snowfall events with a substantial response of measurements (drops of several percent between 15 and 25 Hz), suggesting a detectable change in elastic properties of the medium due to the additional fresh snow. To better interpret the measurements, we used a physical model to compute frequency-dependent changes in the Rayleigh wave velocity computed before and after the events. Elastic parameters of the ground subsurface were obtained from a seismic refraction survey, whereas snow cover properties were obtained from the snow cover model SNOWPACK. The decrease in due to a snowfall was well reproduced, with the same order of magnitude as observed values, confirming the importance of the effect of fresh and dry snow on seismic measurements. We also observed a decrease in with snowmelt periods, but we were not able to reproduce those changes with our model. Overall, our results highlight the effect of the snow cover on seismic measurements, but more work is needed to accurately model this response, in particular for the presence of liquid water in the snowpack.
- Article
(3676 KB) - Full-text XML
- Companion paper
- BibTeX
- EndNote


The method of seismic ambient noise correlation is broadly used to monitor the subsurface, in order to detect physical processes in the surveyed medium such as changes in rigidity, fluid injection or cracking (Sens-Schönfelder and Wegler, 2006; Larose et al., 2015). Several observables such as relative velocity changes of surface waves or changes in waveforms can be continuously measured. These indicators can be precursors for catastrophic events such volcanic eruptions (Brenguier et al., 2008; Rivet et al., 2015) or landslide failure (Le Breton et al., 2020).
Relative seismic velocity changes () can be estimated from daily or hourly seismic ambient noise cross-correlations, assuming (at least partially) both temporal and spatial stability of the sources (Hadziioannou et al., 2009). As the coda part of cross-correlations is mostly controlled by surface waves and scattering (Obermann et al., 2013), can be estimated in different frequency bands, corresponding to different depths of investigation (Mainsant et al., 2012; Voisin et al., 2016). Velocity changes are sensitive to environmental influences in the shallow subsurface, such as temperature (Tsai, 2011; Richter et al., 2014; Hillers et al., 2015), atmospheric fluctuations (Hillers et al., 2015; Gradon et al., 2021), freezing–thawing (Gassenmeier et al., 2015; James et al., 2017; Miao et al., 2019; Guillemot et al., 2020; Steinmann et al., 2021) and groundwater level fluctuations (Meier et al., 2010; Mainsant et al., 2012; Hillers et al., 2014; Rivet et al., 2015; Voisin et al., 2017; Planès et al., 2017; Wang et al., 2017; Clements and Denolle, 2018). These latter environmental effects on have been studied both experimentally and numerically (Berger, 1975; Tsai, 2011), and they have been recently reviewed in the context of landslide monitoring (Le Breton et al., 2020). In polar and cold temperate regions, significant variations were observed related to the presence of snow (Hotovec-Ellis et al., 2014; Wang et al., 2017). Some observations show a positive correlation between snow depth and measurements at a seasonal scale (Hotovec-Ellis et al., 2014; Wang et al., 2017), whereas Wang et al. (2017) and Le Breton (2019, Fig. A11) mentioned a negative correlation during intense snowfalls. In ice sheets, Mordret et al. (2016) modeled the effect of snow accumulation by using poroelasticity and viscoelasticity at a seasonal scale. But to the best of our knowledge, the effect of snow on in snowy temperate regions has not been properly studied with high resolutions (Larose et al., 2015, Fig. 10).
Snow is a highly porous material with low density and a low elastic modulus (Gerling et al., 2017). Typical densities for a seasonal snow cover range from 50 to 500 kg m−3 (Schweizer and Jamieson, 2003). Fresh snow generally has a density between 50 and 150 kg m−3, yet due to snow settlement (compaction), density rapidly increases. Snow is a material that exists very close to its melting point, causing rapid microstructural changes (e.g., Herwijnen and Miller, 2013). During the winter season, when air temperature mostly remains below freezing, there is no liquid water in the snowpack and snow temperatures are below zero. This is called a dry snowpack. In spring, warm temperatures and solar radiation cause daily surface melting. As a result, snowpack temperatures gradually increase to 0 ∘C, and the liquid water content increases. This is called a wet snowpack. Elastic wave velocities in snow, like most of its mechanical properties, including the elastic modulus, are highly dependent on snow density, temperature and liquid water content. While the effects of snow density and temperature are well documented (e.g., Schweizer and Camponovo, 2002; Sayers, 2021), the influence of liquid water content is still poorly understood. Modeling snow acoustics is highly challenging, since acoustic phase velocities of this porous medium strongly depend on porosity, stiffness and density of the bulk frame. Recent studies address this dependency using rigid-frame and Biot's models, assuming pore space to be air-filled (Capelli et al., 2016; Sidler, 2015; Sayers, 2021). Furthermore, the presence of liquid water, and with it melting and refreezing of snow, deeply changes the behavior of snowpack from grain- to fluid-supported, making wet-snow modeling much more complex than in the case of dry snow. Overall, partially saturated wet snow remains a critical challenge for modeling. In general, snow cover modifies the overall density and rigidity of the investigated medium and thus the propagation velocity of seismic waves. Furthermore, meltwater runoff from the snowpack can percolate through the subsurface, increasing pore pressure and density of the porous medium. Snowfall and snowmelt periods are therefore expected to affect seismic surface wave propagation, leading to changes.
To better understand and constrain the effect of snow on , we deployed seismic sensors during an entire winter season at a site in the eastern Swiss Alps. We measured substantial changes related to snowfall and melting, indicating a detectable effect of snow cover variations at this site. These observations were compared to theoretical values of computed from a mechanical model based on snow cover and subsurface elastic properties. Our results are of interest for seismology, through a better interpretation of seismic measurements in snowy regions, and for snow cover monitoring, through the potential estimate of snowpack properties and their influence on the subsurface by seismic measurements.
The seismic monitoring system was installed to monitor snow avalanches (Heck et al., 2018). It consisted of seven vertical geophones (Fig. 1b) with an eigenfrequency of 4.5 Hz, and data were recorded using a 24-bit acquisition system with a sampling rate of 500 Hz (van Herwijnen and Schweizer, 2011). To increase the signal-to-noise ratio, the sensors were buried 30 to 50 cm deep as suggested by Heck et al. (2019). For this study, we used data from two sensors deployed at a distance of 35 m (yellow dots in Fig. 1c). Data were collected from 17 December 2018 to 11 June 2019.
The instrumentation was deployed at the Jenatschalp field site in the Dischma valley above Davos (eastern Swiss Alps; 46.73∘ N, 9.91∘ E; Fig. 1a). The field site is a flat meadow at an elevation of 1930 m a.s.l. surrounded by mountain peaks that rise up to 3000 m. The field site was also equipped with seven automatic cameras installed at two different locations for visual snow thickness estimation of the site and the adjacent slopes.
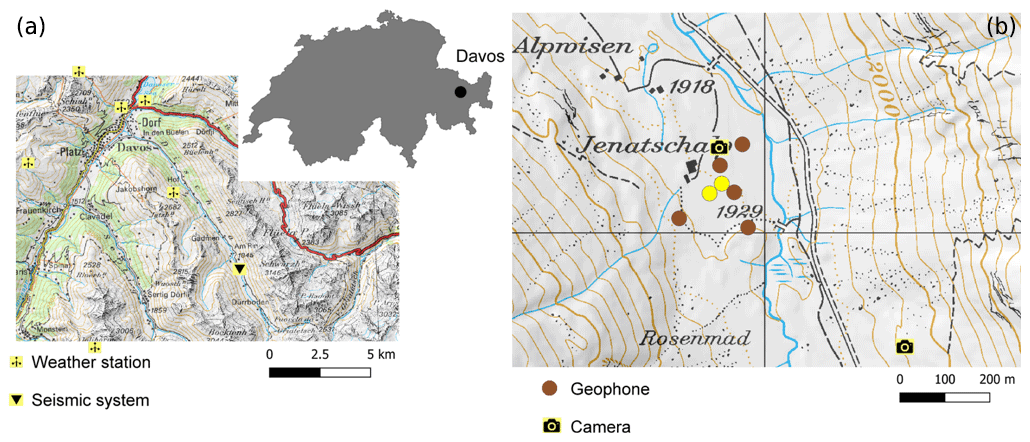
Figure 1(a) Map of the Davos area, Switzerland. The location of the seismic system is shown by the black triangle; the wind wheel shows the locations of six of the seven the weather stations that provided input data for SNOWPACK. (b) Detailed map of the Jenatschalp site showing the geometry of the seismic array and the positions of automatic cameras. The yellow circles indicate the positions of sensors used in this study. Reproduced with permission from Swisstopo (JA100118).
3.1 SNOWPACK simulations
To estimate snowpack properties at the location of the seismic sensors, we generated a one-dimensional snowpack simulation using the snow cover model SNOWPACK (Lehning et al., 1999; Bartelt and Lehning, 2002). SNOWPACK simulates snow microstructure and the layering of the snowpack based on weather data. It is based on a Lagrangian finite-element implementation and solves the non-stationary heat transfer and settlement equations. It encompasses phase transitions and the transport of liquid water. The model provides detailed information on the mechanical and physical properties of each snow layer, including temperature, density, liquid water content and snow microstructural descriptors. As there were no meteorological measurements as input data at the site, we interpolated measurements from seven automatic weather stations (AWSs) within a radius of 20 km of the field site at elevations ranging from to 1563 to 2558 m a.s.l. (Fig. 1a). All AWSs provided half-hourly measurements of air temperature, relative humidity, wind speed and direction. Measured precipitation with a heated rain gauge and incoming short- and longwave radiation were only available at two and three AWSs, respectively. For the spatial interpolations, we used the preprocessing library MeteoIO (Bavay and Egger, 2014) included in the SNOWPACK model. For most of the meteorological parameters, we used the IDW-LAPSE algorithm, which combines inverse distance weighting with a lapse rate. To estimate the snow surface temperature, energy fluxes at the snow–atmosphere boundary were calculated (Neumann boundary conditions). For the soil heat flux at the bottom of the snowpack, we set a constant value of 0.06 W m−2, which approximates the geothermal heat flux (Davies and Davies, 2010). The flow of liquid water through the snowpack was simulated using Richards equations (Wever et al., 2014). With the starting date set to 15 September 2018, the simulation was run with a time step of 15 min until all snow on the ground had melted on 7 June 2019. This melt-out data coincided well with the disappearance of the snow on the images of the automatic cameras.
To model the influence of the snowpack on changes in seismic velocities (see Sect. 4), we divided the entire snowpack into two layers each with a density and temperature equal to the depth-averaged density and temperature of all sub-layers. In winter, when the snowpack is cold and dry (i.e., snow temperature below 0 ∘C), the two layers represent the settled base of the snowpack and the layer of fresh snow on top which is typically less dense (Fig. 2). In spring, when the snowpack melts (i.e., snow temperatures at 0 ∘C), the two layers represent the base of the snowpack that stays at 0 ∘C and the upper layer of the snowpack that periodically refreezes, for instance during the night or during cold weather. To define these two layers at each modeling time step we used the following procedure:
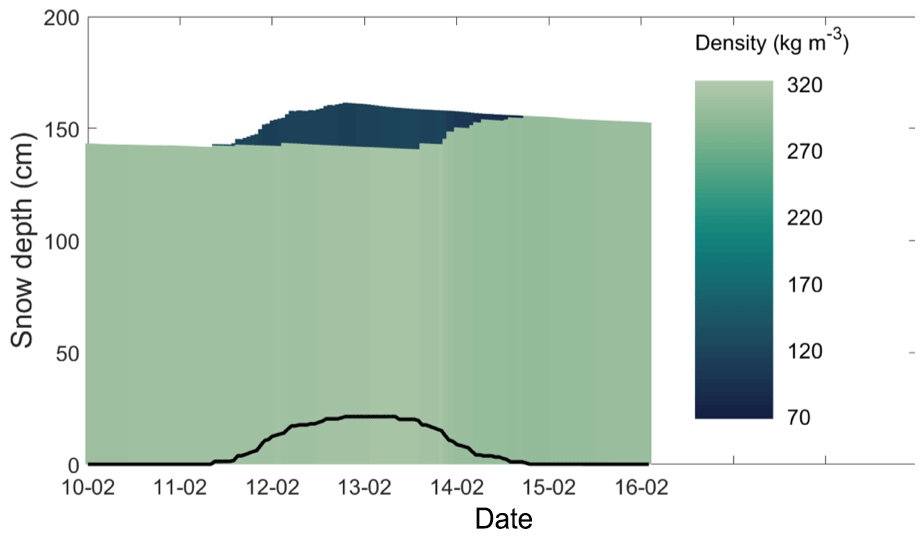
Figure 2Evolution of snow density (colors) of the simplified snowpack consisting of two layers, during one snowfall event. When HN48 (black curve) was zero, both layers have the same density. For HN48> 0, the upper layer consists of lower-density snow (dark blue).
-
In winter, we first determined the amount of new snow in the past 48 h (HN48, black line in Fig. 2). If HN48=0, then the entire snowpack consisted of one layer with a thickness equal to the snow depth HS. However, if HN48> 0, we then determine the depth dmax of the lowest layer within HN48 consisting of precipitation particles or decomposed and fragmented particles (Fierz et al., 2009) and with a density lower than 220 kg m−3. For dmax=0 the snowpack again consisted of one layer, while for 0<dmax<HN48 the snowpack consisted of two layers with thickness HS − dmax and dmax (Fig. 2).
-
In spring, we determined the depth dcold of the lowest layer from the snow surface with a negative temperature. For dcold=0 the entire snowpack consisted of one layer with a thickness equal to the snow depth HS, while for 0<dcold<HS the snowpack consisted of two layer with thickness HS − dcold and dcold.
3.2 Seismic observations
From raw seismic measurements, we derived by using the common method of ambient noise correlation (Campillo and Paul, 2003; Bensen et al., 2007; Larose et al., 2015). First, we preprocessed the 6 h long raw seismic recordings by subtracting the mean, detrending, clipping and spectral whitening between 0.2 and 30 Hz. We then calculated the cross-correlations of the two sensors with 3600 s long time windows, and applied a Wiener filter (with a 10×10 local window size; Moreau et al., 2017) to the resulting correlogram. From this filtered correlogram, we selected a time window from 0.2 to 0.5 s in both causal (correlation time > 0) and acausal (correlation time < 0) codas (Fig. 3), which are known to be sensitive to elastic properties of the extended subsurface between sensors. In these time windows, we estimated the relative velocity change () and the corresponding correlation coefficient (CC) by using the stretching method (Hadziioannou et al., 2011; Le Breton et al., 2021). We thus have time series with four values per day during the entire data period, in different frequency bands ranging from 10 to 25 Hz with a bandwidth of 4 Hz. Such seismic observations are shown in Fig. 4. In this figure the reference period is chosen to be from January to February 2019 in order to select a long period with dry snow during the winter season as reference.
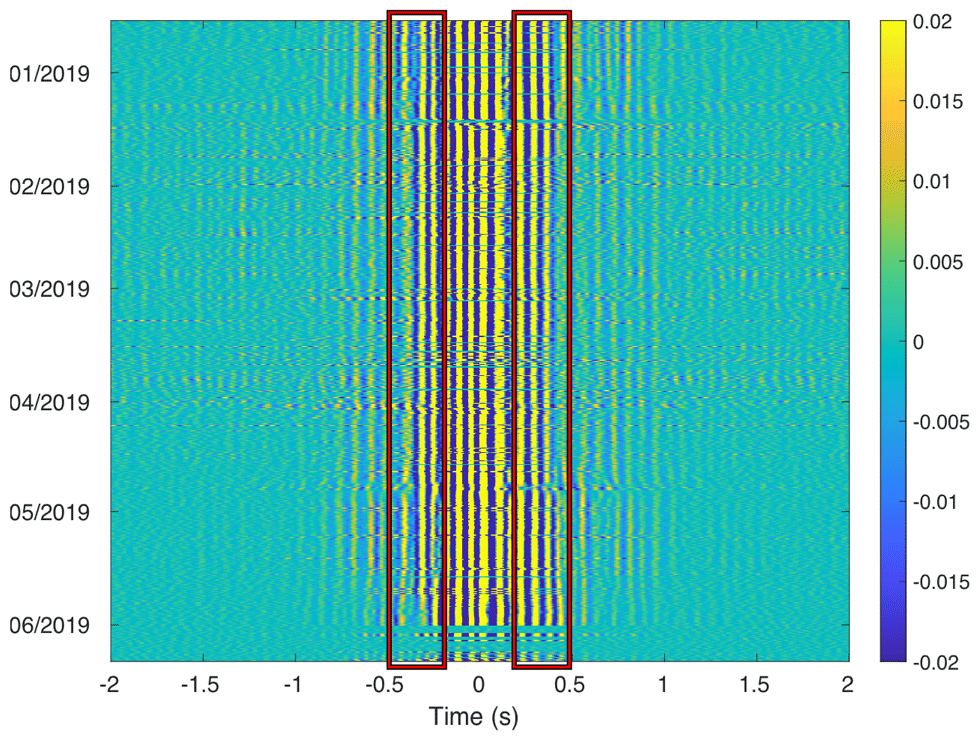
Figure 3Filtered normalized correlogram from raw seismic noise cross-correlations over the pair of geophones used for the study. The time windows from which the values are estimated are localized by red boxes, corresponding to the direct (positive) and indirect (negative) coda part of the waveforms.
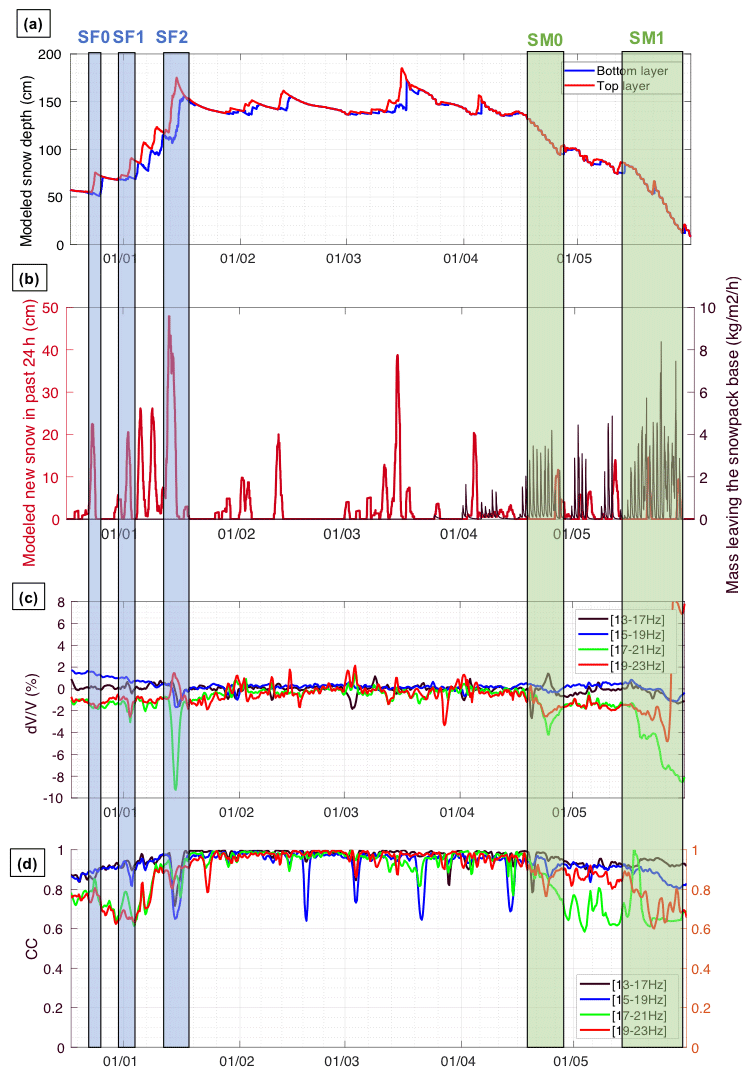
Figure 4Results of snow simulations over the entire season from December 2018 and June 2019, with (a) interpolated snow depth of layers defined by a procedure based on density and (b) modeled new snow in the past 24 h (in red) and mass leaving the snowpack base, highlighting melting in spring (black curve). Seismic observations are also presented over the same period, with relative surface wave velocity changes () (c) and the correlation coefficient (CC) (d) for different frequency bands (see legend). From these time series, we select three snowfall events (SF0, SF1 and SF2 in blue boxes) and two melting periods (SM0 and SM1 in green boxes), during which a significant and simultaneous response occurs.
By comparing the seismic observations with modeled snow cover (Fig. 4a), in particular modeled new snow and runoff, we identified variations in and CC associated with snowfall and snowmelt periods, with different responses in intensity and frequency. We then decided to focus on the most significant periods during which a snow cover variation leads to a response: three snowfall events between 22 December and 15 January (named SF0, SF1 and SF2) and two main snowmelt periods between 15 April and 29 May (named SM0 and SM1). These periods are highlighted in Fig. 4.
In order to quantify in relation to snowpack variations accurately, for each of the three snowfall and two snowmelt periods we used new reference periods covering 7 d before the start of the period of interest. In this case, is close to zero just before the event, and changes in are then expected to be related to variations in the snowpack. Such seismic observables are shown for each event, together with snow cover depth variations highlighting significant snowfalls or snowmelt (Figs. 5–9). When the correlation coefficient (CC) was too low (we fixed the minimal threshold arbitrarily at 0.6), we considered uncertainties in as too high and removed the corresponding values. Since phase aliasing and cycle skipping are known to occur using the stretching method (James et al., 2017), we also removed a few outliers (singular values with more than 10 % absolute difference with their neighbors) that should not be physically interpretable.
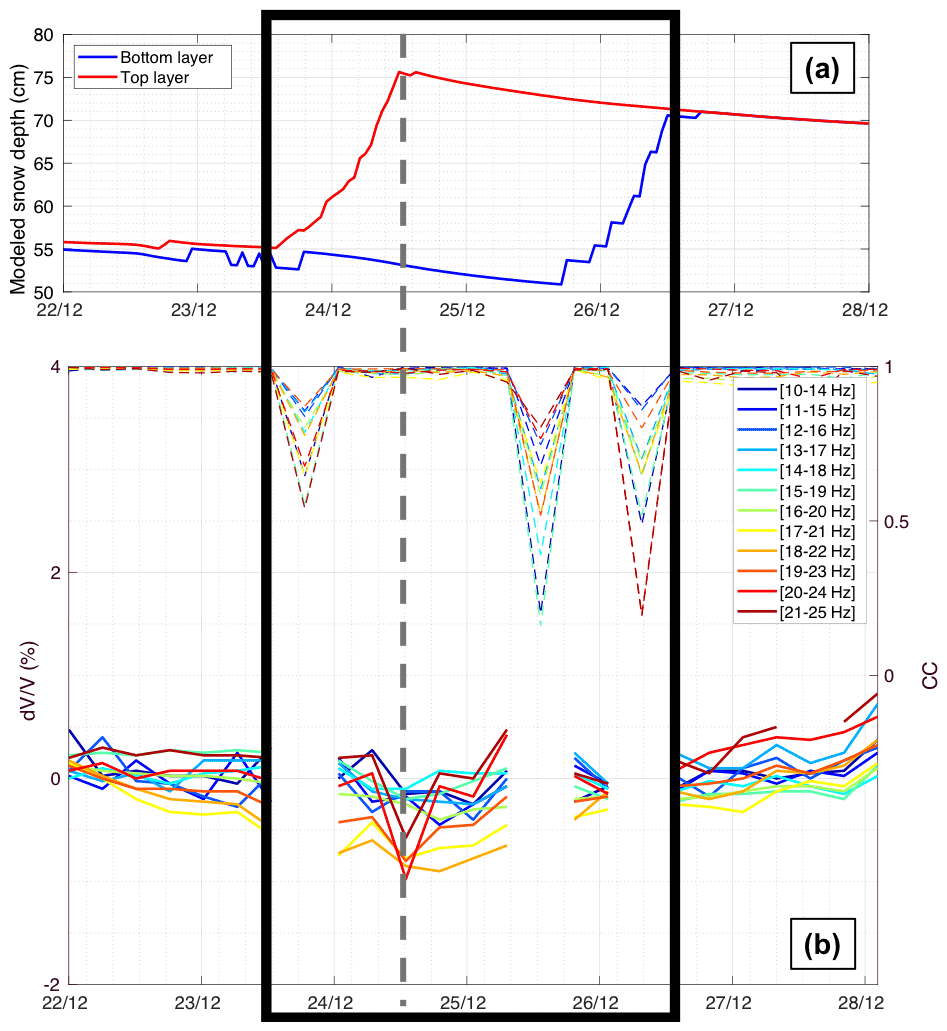
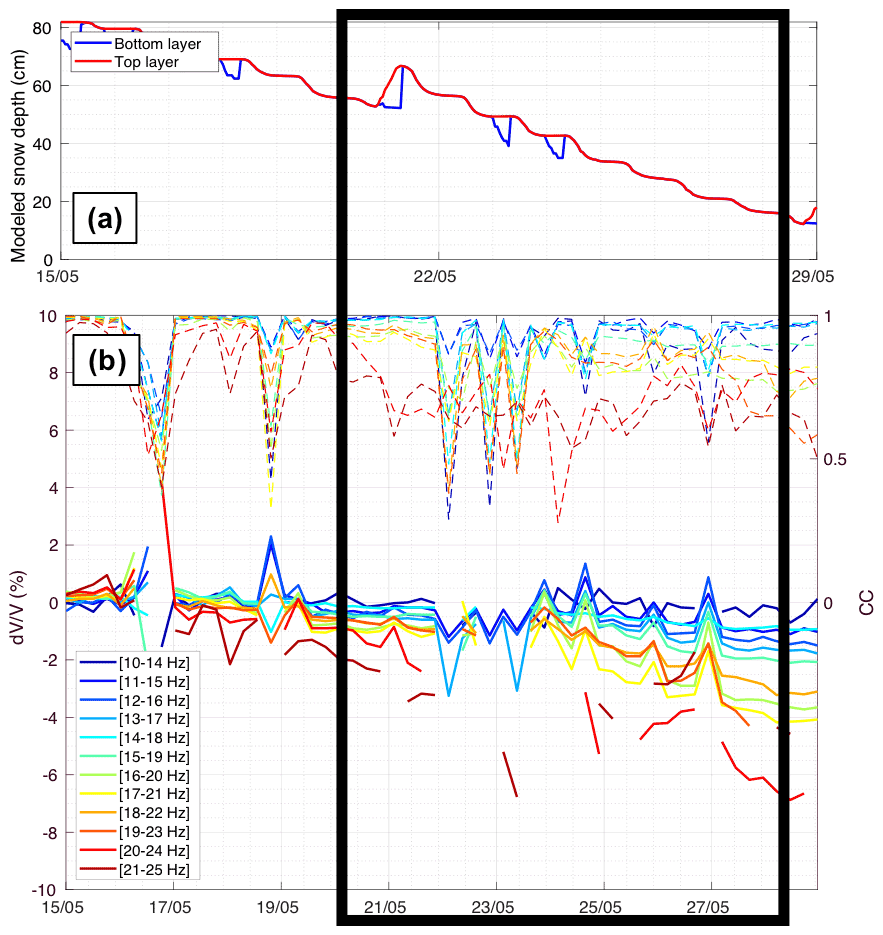
Figure 5Observations during the snowfall event 0 (SF0), with the modeled depth of each snow layer from SNOWPACK simulations (a), and measurements at different frequency bands, with corresponding CC values in dashed lines (b). When the correlation coefficient (CC) is too low (CC < 0.8), values are considered outliers and then removed. The frame in black shows approximately the whole period of interest, whereas the dashed grey line highlights precisely the state of the medium with corresponding observables just after the event.
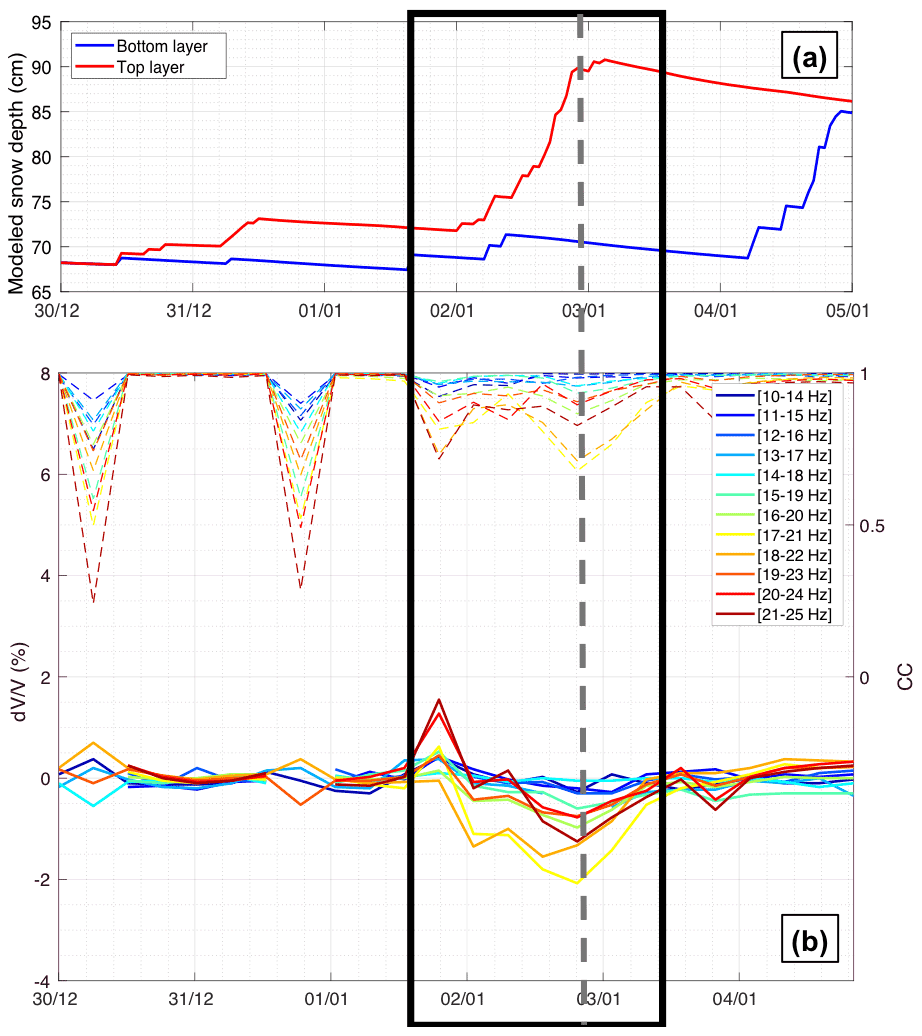
Figure 6Observations during snowfall event 1 (SF1), with the modeled depth of each snow layer from SNOWPACK simulations (a), and measurements at different frequency bands, with corresponding CC values in dashed lines (b). When the correlation coefficient (CC) is too low (CC < 0.6), values are considered outliers and then removed. The frame in black shows approximately the whole period of interest, whereas the dashed grey line highlights precisely the state of the medium with corresponding observables, just after the event.
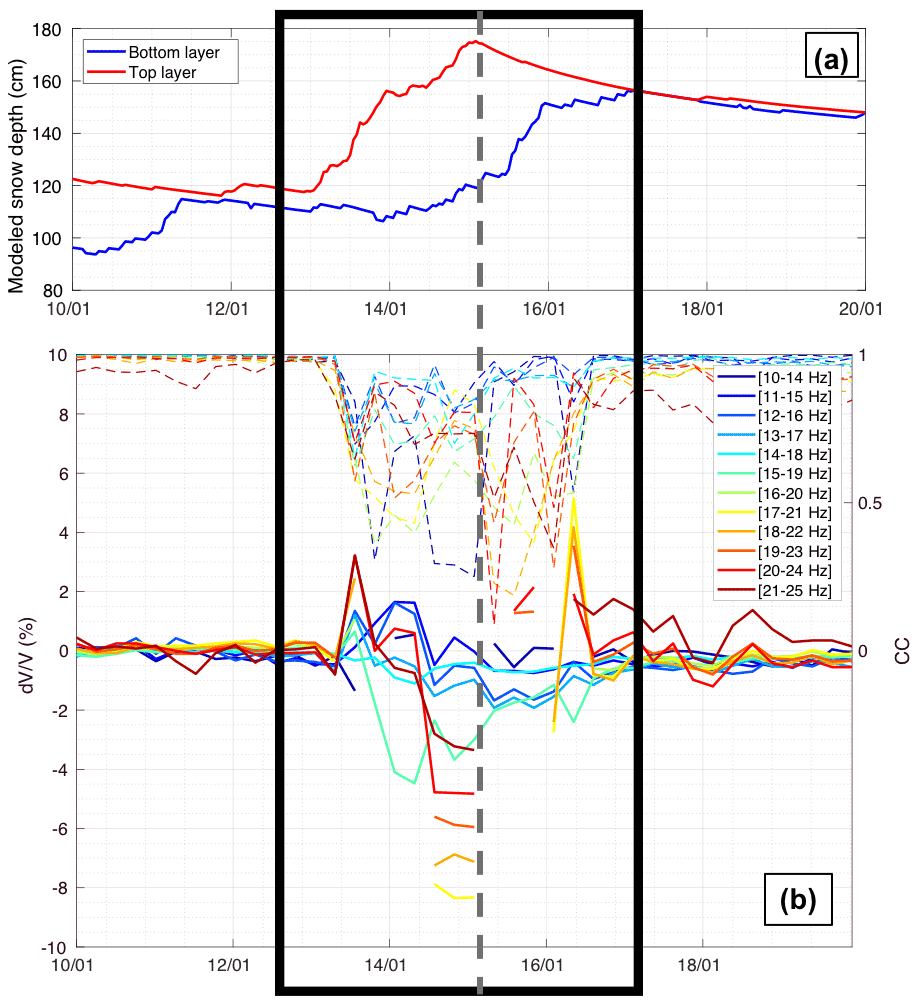
Overall, we observed a decrease for significant snowfall events (SF0, SF1 and SF2). For the earlier main snowfall (SF0), the decrease was minor (less than 1 %; see Fig. 5). However, for the following snowfalls (SF1 and SF2), we observed decreases in of several percent just after the event (Figs. 6–7), suggesting a more important role of fresh and dry snow in the elasticity change of the surveyed medium than during SF0. In other words, additional fresh snow brings new mass onto the existing layer without bringing any significant rigidity. Furthermore, the and CC responses were most sensitive in the frequency band around 20 Hz for all cases.
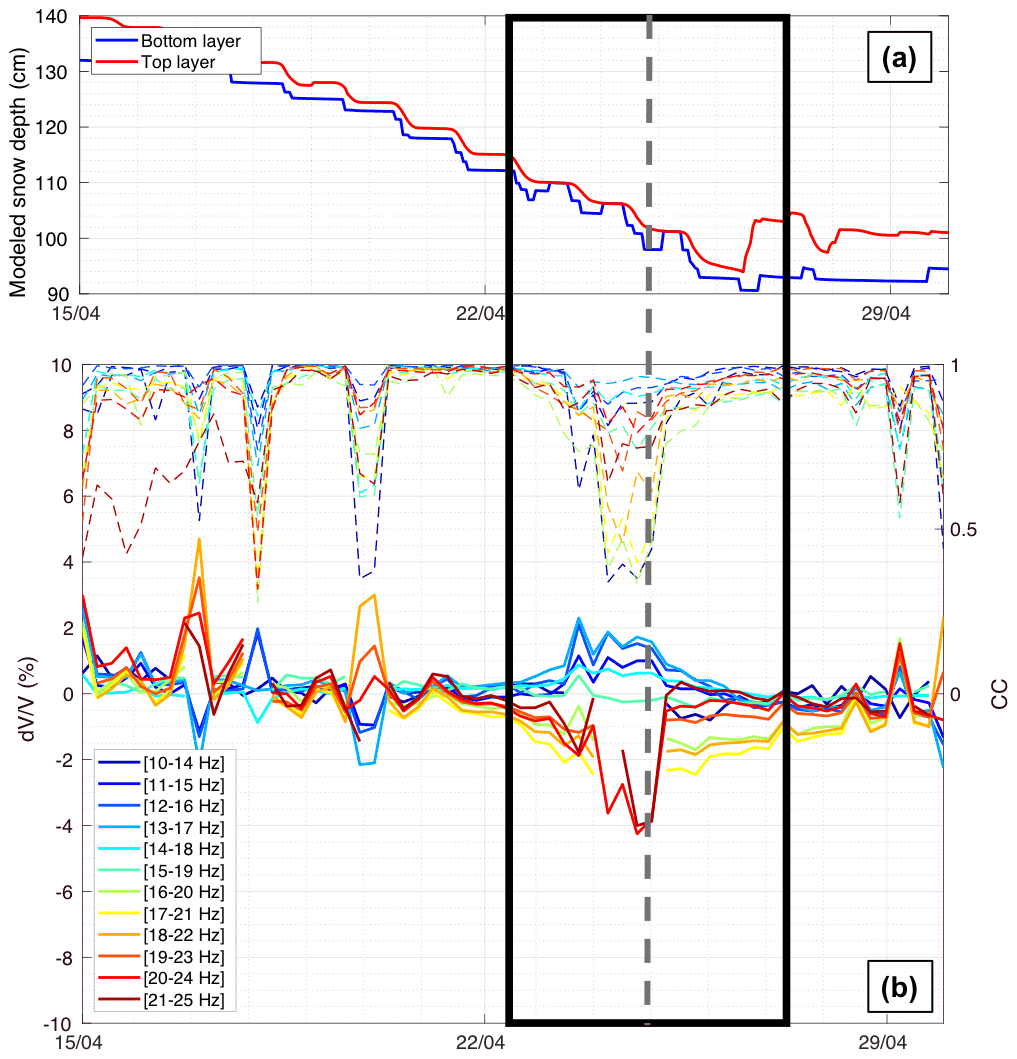
For both melting periods (SM0 in Fig. 8 and SM1 in Fig. 9), we also observed a decrease of several percent, especially for high frequencies (above 16 Hz). For SM0 there was a slight increase in for low frequencies (below 15 Hz). For SM1, changes in occurred over a longer time period, suggesting that the subsurface likely moistened or saturated during the melt-out phase of the snowpack, leading to a loss of rigidity.
Overall, these observations suggest that there is a substantial influence of the snowpack and ground subsurface below on seismic wave velocities. We address this quantitatively by a modeling step detailed in the following part.
In this study we use the coda of cross-correlations from a pair of sensors at a distance of around 50 m, hence monitoring the subsurface through diffused surface waves. Thus, the measurements account for the variation in surface wave velocity. The following part aims to model such velocity before and after the periods of interest (snowfalls and snowmelt), accounting for elastic changes due to snowpack changes, in order to compare modeled variations to observed ones. To handle this question, we built a physical model based on linear elasticity, with elastic parameters of the surveyed medium as inputs, which compute surface wave velocity against frequency.
Among environmental factors, we assume that snowpack changes play the major role, leading to surface wave velocity fluctuations consecutive to snowfalls or snowmelt events. For example, atmospheric pressure changes may probably influence measured , but we expect the amplitude of this effect to be negligible (less than 0.1 % for a variation of a few kilopascals) (Le Breton et al., 2021; Hotovec-Ellis et al., 2014).
Input parameters contain elastic (P-wave and S-wave seismic velocities) and inertial (density) properties of the medium, modeling the ground subsurface and the snow layers above. From this 1D model, the corresponding surface wave dispersion curve is then obtained as a result of the forward problem solved by the Geopsy package (Wathelet et al., 2004), using the linear theory of elasticity (Wathelet, 2005) and assuming that surface waves are mostly dominated by Rayleigh waves (Grêt et al., 2006). In fact, the energy partitioning dynamics favors Rayleigh waves in the early part of the coda, when considering vertical component sensors and with most of the seismic noise sources being at (or almost at) the surface (Obermann et al., 2013). Moreover, it is worth noticing that our study does not depend on the depth of geophones, since we studied only surface wave phase velocities that are not depth-dependent (contrarily to the wave amplitude). We then estimate Rayleigh wave velocities just before and just after the event (snowfall or snowmelt), allowing us to deduce the modeled relative velocity variations () against frequency, for each event.
4.1 Numerical ground parameterization
To model surface wave propagation within the ground subsurface, we performed P- and S-wave refraction surveys in July 2020, employing 24 geophones (horizontal and vertical) and sledgehammer strikes (Fig. 10).
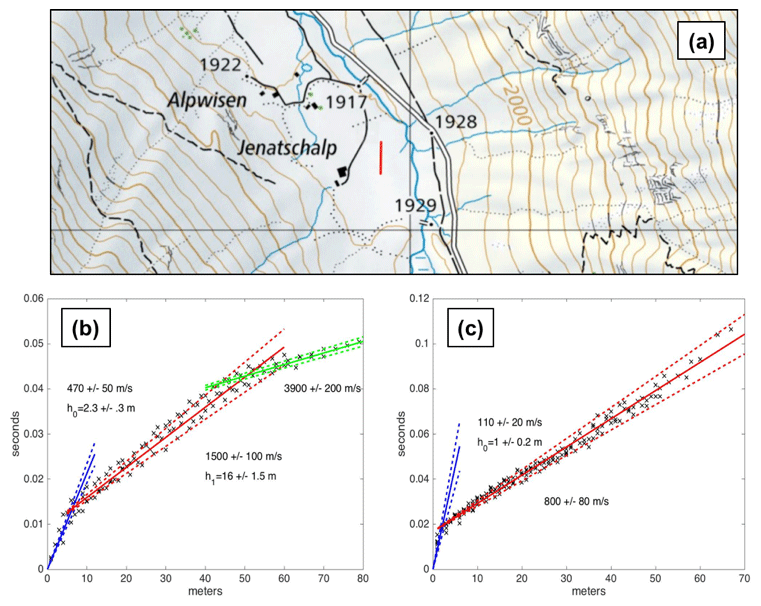
Figure 10(a) Location map of the geophysical investigations in the Jenatschalp site (red profile), reproduced with permission from Swisstopo (JA100118). (b) Results of the active seismic refraction for P-wave velocity (Vp) layering (b) and S-wave velocity (Vs) layering (c).
Assuming a horizontally layered medium (which, from geological and geomorphological studies, is partially true), we deduced from time–distance plots of the first arrivals a three-layer model down to a depth of about 20 m. Note that, as usual, the P-wave profile goes deeper than the S-wave profile, the latter not allowing us to resolve the second interface at around 15 m depth.
The first layer (0–1 m) consists of vegetated clayey drained moraine ( m s−1; m s−1; estimated density kg m−3), overlaying a similar layer with less organic content (1–2.3 m; m s−1; m s−1; est. density kg m−3). Then, the water table is reached in a morainic terrain (2.3–17 m; m s−1; m s−1). Below 18 m, the bedrock is likely constituted of consolidated crystalline rocks ( m s−1; est. density kg m−3). In that latter unit, we estimate the shear wave velocity ( m s−1) assuming a Poisson's ratio of 0.25–0.30 (Tarkov and Vavakin, 1982) which are average values for consolidated rocks.
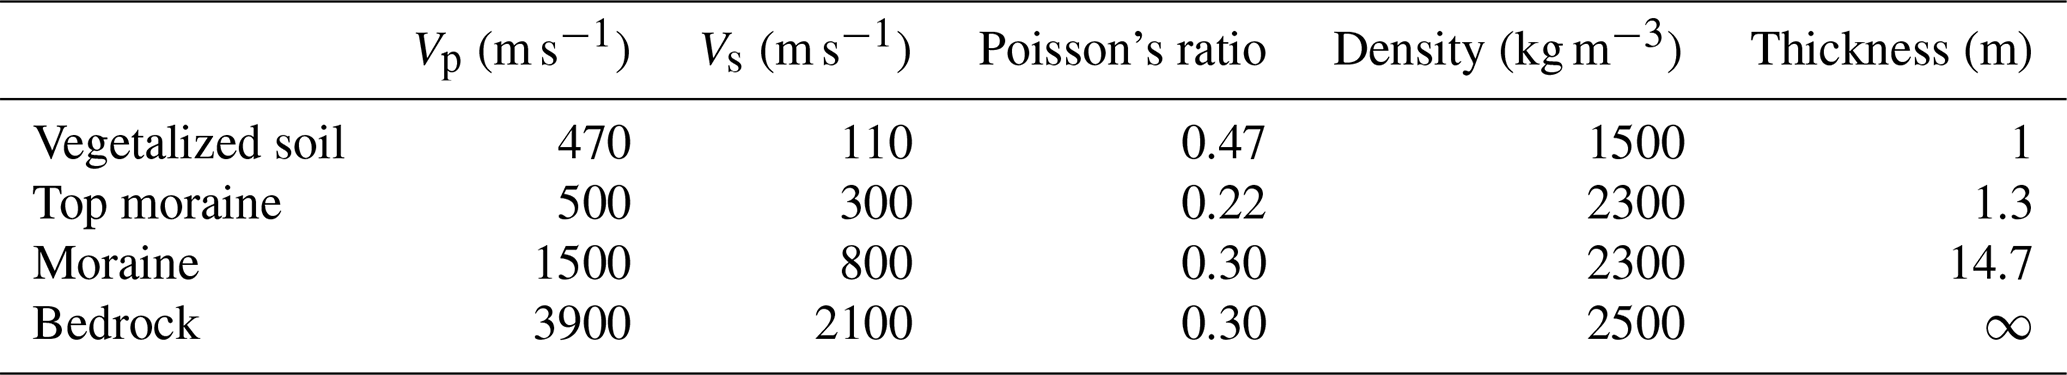
Densities were estimated from the literature (Taylor and Blum, 1995) and the geological map, keeping in mind that densities have limited variations for different lithologies and feebly impact surface wave velocity variations. Also, considering the frequency of the surface waves studied here (mainly between 10 and 25 Hz), bedrock seismic parameters play a limited to negligible role, such that it was not necessary to obtain better estimations below 17 m depth. All parameters of the ground model are summarized in Table 1. We also assumed that these ground parameters are unchanged during the whole season.
Table 1Numerical ground model deduced from geophysical investigations. These parameters are used in order to model values, and they are assumed constant before and after snowfall events.
4.2 Numerical ground parameterization
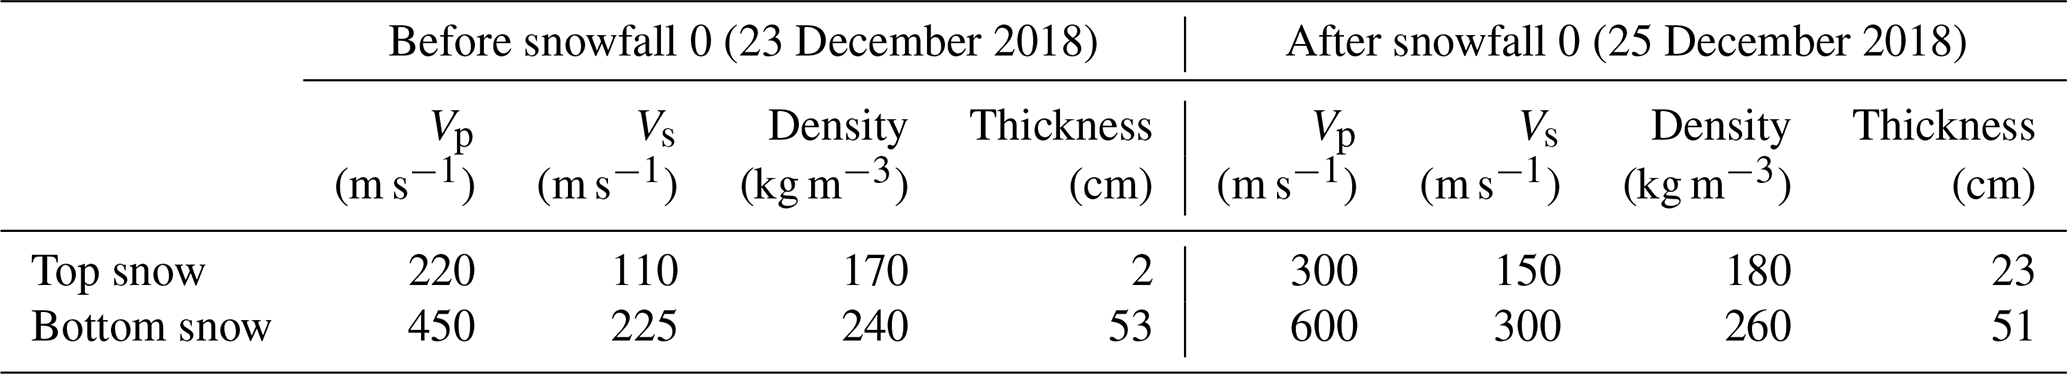
Snowpack properties were estimated from the modeled density and temperature of each layer (see Sect. 3.1). Seismic parameters are then computed by using empirical relations for Vp and Vs, assuming a Poisson's ratio of the snow equal to 0.3. This modeling step deals only with dry snow, since no liquid water is taken into account for the sake of simplicity.
First we address the relationship between snow density and Young's modulus E at a reference temperature ∘C (Gerling et al., 2017):
In parallel we use the temperature–Young's modulus relation with Tm=273 K and E0=0.75 MPa the reference shear modulus measured at 263 K (Schweizer and Camponovo, 2002) :
with A0=0.747, , K, , and K.
By combining these two expressions, Eqs. (1) and (2), we obtain a temperature- and density-dependent Young's modulus for snow:
Seismic velocities are then deduced as follows (classical formula):
with a Poisson's ratio of snow , and from (Capelli et al., 2016, Fig. 1)
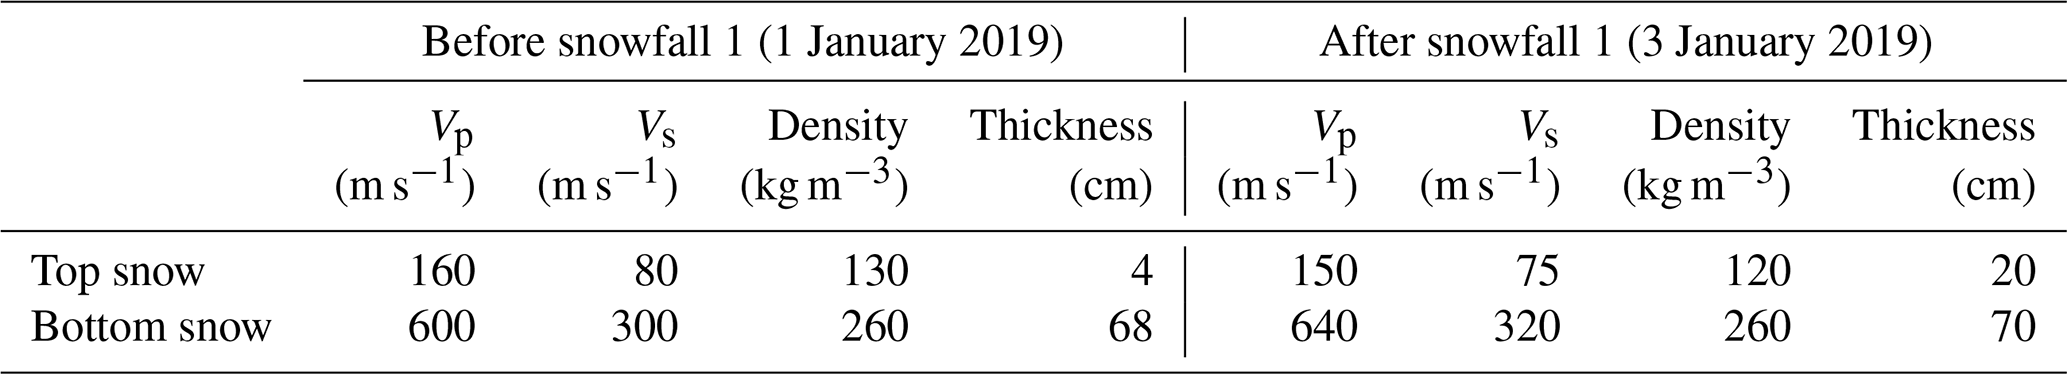
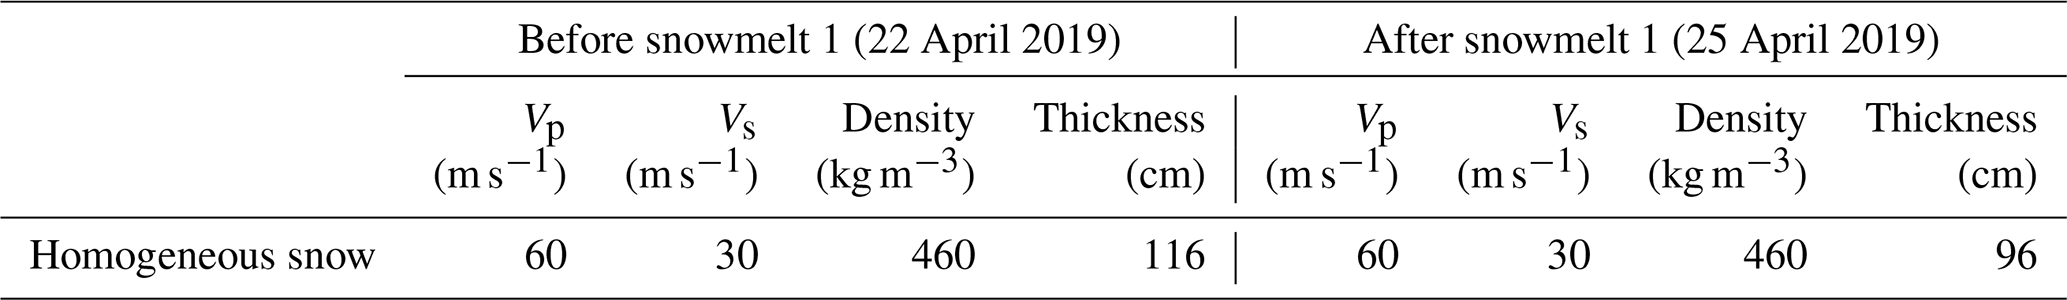
We then obtained snow models for the three snowfall events (SF0, SF1, SF2), before and after the main increase in snow depth. We also apply a model for the first melting period (SM0) before and after the observed perturbation. The results of this parameterization step are summarized in Tables 2–5, respectively.

In brief, we summarize both the instrumentation of the site and the 1D modeling protocol by a schematic cross-section for the snowfall event 2 (Fig. 11).
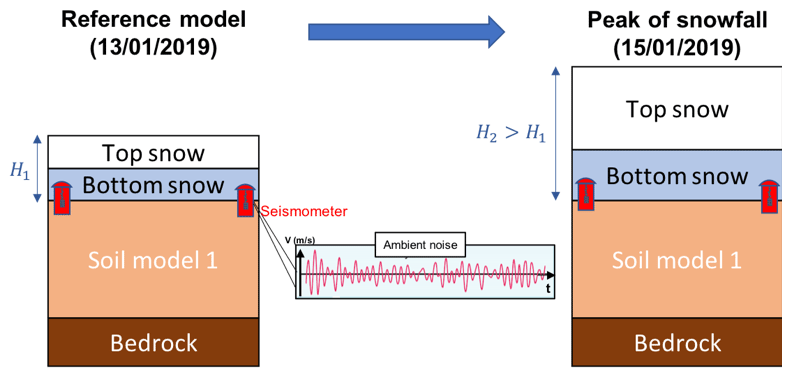
Figure 11Schematic 1D cross-section of the instrumentation of the study site, with the location of seismic sensors buried in the shallow subsurface, and the modeled layered medium at two temporal steps (before and during peak of snowfall event 2, as an example). The only changes between these models are the increasing snow depth and mechanical properties of both snow layers, as specified in Table 4.
4.3 Results of modeling
We computed Rayleigh wave propagation velocities by Geopsy, for each model composed of stacked snow and ground layers (see Table 1 for ground and Tables 2–5 for snow), before and after each snowpack event. The relative velocity change between the model before and after the event was then considered to comprise the modeled values, which are computed for different frequency bands.
Then we compared observed and modeled values of with frequency (Fig. 12a for SF0, Fig. 12b for SF1, Fig. 12c for SF2, Fig. 12d for SM0). Model results are shown with error bars corresponding to snow elastic parameter uncertainties (P- and S-wave velocities ±10 %) in order to assess the sensitivity of the model to snow modeling.
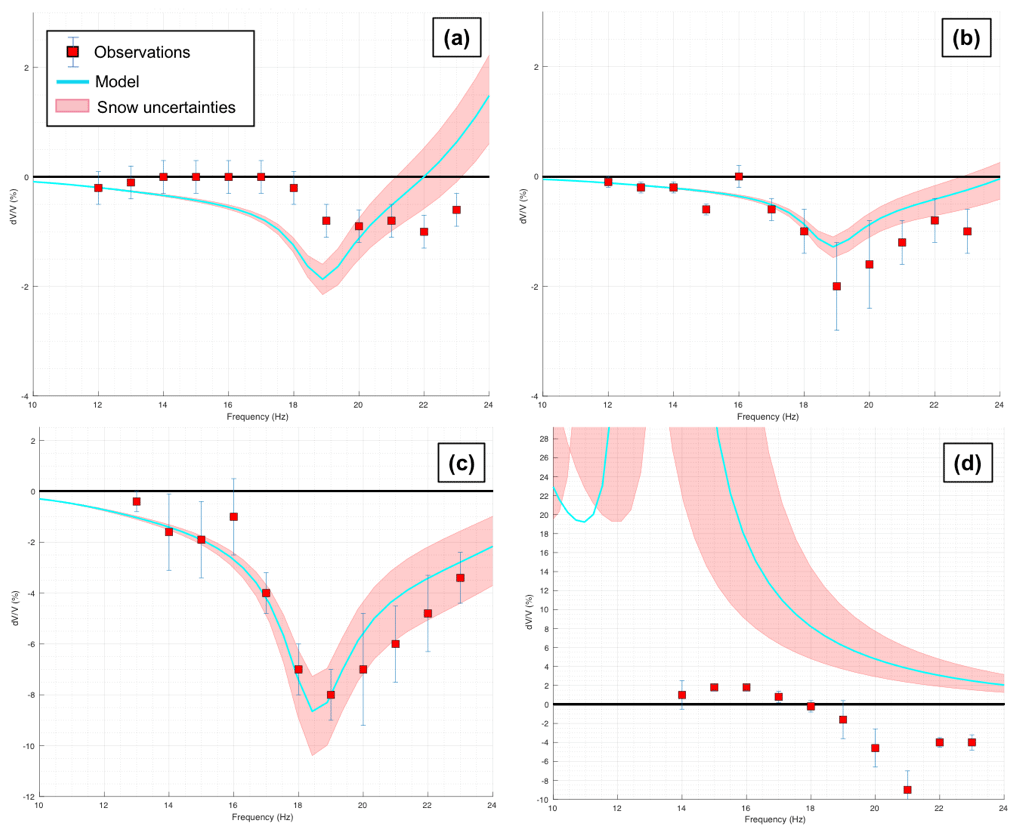
Figure 12(a) Results of the modeling for snowfall event 0 (SF0), with the modeled response with respect to frequency (blue curve) and uncertainties (shaded pink curves) related to ±10 % variations in snow elastic parameters. Observations are highlighted in red squares, whose frequency is fixed to the center of the frequency band of the measured . (b) Same legend for snowfall event 1 (SF1). (c) Same legend for snowfall event 2 (SF2). (d) Same legend for snowmelt event 0 (SM0).
For all the three snowfall events (SF0, SF1, SF2), both observed and modeled are of the same order of magnitude, reinforcing the interpretation of changes in as a response to snow depth increase. Nevertheless, modeled values were generally over-estimated for SF0 event, where only very small variations were observed. In this case, the sensibility of measurements probably reaches its limits for this snowfall. For the SF1 and SF2 events, however, the model is in good agreement with observations.
In contrast, our model did not match with observations for the SM0 event. Modeled values are positive and very high, whereas we observed negative . It is worth noticing that our model assumes totally dry snow when estimating elastic properties. But the moistening of snowpack and shallow ground layers below is a common process occurring in early and late spring, probably changing the elastic behavior of the snowpack during this melting period due to the presence of liquid water. Nevertheless, Fig. 12d shows the limit of the validity of our model, which addresses only a dry medium (snowpack and ground) in early winter season.
In this study we measured changes in at a snow-covered site over an entire winter season. We modeled the results with relatively good agreement, except during snowmelt. This modeling aims at assessing the effect of snowpack variations on measurements. We reproduced decrease due to a snowfall, with the same order of magnitude as the observed values. Some uncertainties are still unclear and may explain the gap between observed and modeled values. Uncertainties in elastic parameters of the snowpack are mentioned above. For the ground subsurface, the sensitivity of the model is negligible for deep layers, so bedrock uncertainties do not play any role here. However, the model is more sensitive to elastic parameters of shallow layers, especially S-wave velocity, since we assume the monitoring of Rayleigh surface waves. Hence, the uncertainties linked to the shallow layers of the ground may induce errors in the results. The sensitivity of our model to snow elastic properties was addressed by accounting for ±10 % variations, resulting in modeled that can vary by several percent (see Fig. 12), especially for high frequencies (above 15 Hz). Finally, our physical model based on surface wave propagation velocity may be improved by considering the effect of liquid water on the noise wavefield and its changes in frequency content, which is recorded by buried seismic sensors over the season, with a view to detecting spurious estimates.
For the three snowfall periods (SF0, SF1, SF2), the agreement between observed and modeled values of reinforces our interpretation: a snowfall event has a substantial and almost direct effect on measurements, with a decrease of several percent in a frequency band between 15 and 25 Hz at our site. Since we consider fresh and dry snow, this decrease is probably related to an increase in the overall mass of the surveyed medium induced by the additional snow weight several hours after a snowfall event without rigidity increase (since fresh snow has little rigidity).
For melting periods (SM0), our model was not able to reproduce the observations, probably because of the significant change in elastic behavior induced by liquid water percolation into the snowpack and the subsurface. The parameterizations used for the elastic properties of snow were based on laboratory measurements of dry snow (Schweizer and Camponovo, 2002; Gerling et al., 2017). However, we apply those to a wet snowpack and therefore do not account for the influence of liquid water in the snowpack. To better model the influence of liquid water in both the snow and the ground, a poroelastic three-phase approach is likely required to accurately estimate elastic parameters (especially for realistic Vp and Vs values) (Sidler, 2015), but that is out of the scope of this article. At the most, we can expect that the presence of liquid water increases the density and melting decreases the rigidity (contacts between grains), together decreasing the shear wave velocity and thus decreasing (Grêt et al., 2006; Voisin et al., 2017, 2016; Sidler, 2015).
Moreover, not every snowfall event led to a clear response during the entire winter season (Fig. 4). In our case, only three snowfall periods show a substantial effect on seismic velocities, suggesting that this snow effect is relative. Indeed, it depends on the elastic parameter gap between the snow layer and underlying ground layers: if the density of new snow is not that much different than the existing snowpack (for dry snowpack in early winter, as in SF0) or if the additional new snow layer is negligible compared to the entire snowpack thickness (for thick and compacted snowpack in late winter, as in March), this effect will be minor and less detectable. These latter statements have been confirmed by our model: fresh dry snow on compacted snowpack has little influence on (modeled variation less than 1 % in the considered frequency band).
For early snowfalls (SF0, SF1, SF2), these observations demonstrate that the is well modeled by surface wave phase velocity changes due to the successive snow layers, provided that the elastic properties of each layer are properly independently estimated. Improving the fits of both seismic and snowpack time series presented in the study requires more refined field observations or small-scale mechanical models. As a long-term perspective of the present work, will be used to better assess the mechanical properties of the snow layers, with a time resolution below daily and uncertainties below 10 %.
We addressed the effect of snowfall and snowmelt on seismic velocity variations, derived from ambient noise correlation. From observations over a winter season, we actually measured drops related to snowpack thickness changes. We modeled these decreases by elastic changes in dry snowpack, which explain well the observed values. When a snowfall brings a fresh new snow layer that significantly differs from the medium below in terms of rigidity and density, it induces elastic changes measurable by a pair of seismic sensors. Finally, the present study gives a quantitative knowledge of the snow effect on : this response can be inverted to more finely constrain mechanical properties of snowpack, while the interaction between the snowpack and subsurface has to be addressed for accurate seismic monitoring in snowy regions.
SNOWPACK simulations and seismic data are available upon request at the WSL Institute for Snow and Avalanche Research SLF (Davos, Switzerland).
AvH designed and supported the meteorological and seismic experiments at the Jenatschalp site. EL and AvH performed the active seismic refraction survey at the study site. Seismic data processing and mechanical modeling were developed by AG, in close collaboration with LB, EL and AvH. SNOWPACK simulations were designed and processed by SM. AG prepared the manuscript with contributions from all co-authors.
The contact author has declared that neither they nor their co-authors have any competing interests.
Publisher’s note: Copernicus Publications remains neutral with regard to jurisdictional claims in published maps and institutional affiliations.
The authors particularly thank SLF (Davos) and SIG ISTerre (Grenoble) for their valuable assistance with fieldwork, meteo station maintenance and seismic data retrieval.
This work was supported by the ANR LabCom GEO3iLAB project and was partly funded by the WSL research program Climate Change Impacts on Alpine Mass Movements – CCAMM (https://ccamm.slf.ch/en/index.html, last access: 21 December 2021).
This paper was edited by Adam Booth and reviewed by two anonymous referees.
Bartelt, P. and Lehning, M.: A physical SNOWPACK model for the Swiss avalanche warning: Part I: numerical model, Cold Reg. Sci. Technol., 35, 123–145, https://doi.org/10.1016/S0165-232X(02)00074-5, 2002.
Bavay, M. and Egger, T.: MeteoIO 2.4.2: a preprocessing library for meteorological data, Geosci. Model Dev., 7, 3135–3151, https://doi.org/10.5194/gmd-7-3135-2014, 2014.
Bensen, G. D., Ritzwoller, M. H., Barmin, M. P., Levshin, A. L., Lin, F., Moschetti, M. P., Shapiro, N. M., and Yang, Y.: Processing seismic ambient noise data to obtain reliable broad-band surface wave dispersion measurements, Geophys. J. Int., 169, 1239–1260, https://doi.org/10.1111/j.1365-246X.2007.03374.x, 2007.
Berger, J.: A note on thermoelastic strains and tilts, J. Geophys. Res., 80, 274–277, https://doi.org/10.1029/JB080i002p00274, 1975.
Brenguier, F., Shapiro, N. M., Campillo, M., Ferrazzini, V., Duputel, Z., Coutant, O., and Nercessian, A.: Towards forecasting volcanic eruptions using seismic noise, Nat. Geosci., 1, 126–130, https://doi.org/10.1038/ngeo104, 2008.
Campillo, M. and Paul, A.: Long-Range Correlations in the Diffuse Seismic Coda, Science, 299, 547–549, https://doi.org/10.1126/science.1078551, 2003.
Capelli, A., Kapil, J. C., Reiweger, I., Or, D., and Schweizer, J.: Speed and attenuation of acoustic waves in snow: Laboratory experiments and modeling with Biot's theory, Cold Reg. Sci. Technol., 125, 1–11, https://doi.org/10.1016/j.coldregions.2016.01.004, 2016.
Clements, T. and Denolle, M. A.: Tracking Groundwater Levels Using the Ambient Seismic Field, Geophys. Res. Lett., 45, 6459–6465, https://doi.org/10.1029/2018GL077706, 2018.
Davies, J. H. and Davies, D. R.: Earth's surface heat flux, Solid Earth, 1, 5–24, https://doi.org/10.5194/se-1-5-2010, 2010.
Fierz, C., Armstrong, R. L., Durand, Y., Etchevers, P., Greene, E., Mcclung, D. M., Nishimura, K., Satyawali, P. K., and Sokratov, S. A.: The International Classification for Seasonal Snow on the Ground, UNESCO, IHP (International Hydrological Programme)–VII, Technical Documents in Hydrology, 83, 2009.
Gassenmeier, M., Sens-Schönfelder, C., Delatre, M., and Korn, M.: Monitoring of environmental influences on seismic velocity at the geological storage site for CO2 in Ketzin (Germany) with ambient seismic noise, Geophys. J. Int., 200, 524–533, https://doi.org/10.1093/gji/ggu413, 2015.
Gerling, B., Löwe, H., and van Herwijnen, A.: Measuring the Elastic Modulus of Snow, Geophys. Res. Lett., 44, 11088–11096, https://doi.org/10.1002/2017GL075110, 2017.
Gradon, C., Brenguier, F., Stammeijer, J., Mordret, A., Hindriks, K., Campman, X., Lynch, R., Boué, P., and Chmiel, M.: Seismic Velocity Response to Atmospheric Pressure Using Time-Lapse Passive Seismic Interferometry, B. Seismol. Soc. Am., 111, 3451–3458, https://doi.org/10.1785/0120210069, 2021.
Grêt, A., Snieder, R., and Scales, J.: Time-lapse monitoring of rock properties with coda wave interferometry: Time-lapse monitoring of rock properties, J. Geophys. Res., 111, 148–227, https://doi.org/10.1029/2004JB003354, 2006.
Guillemot, A., Helmstetter, A., Larose, É., Baillet, L., Garambois, S., Mayoraz, R., and Delaloye, R.: Seismic monitoring in the Gugla rock glacier (Switzerland): ambient noise correlation, microseismicity and modelling, Geophys. J. Int., 221, 1719–1735, https://doi.org/10.1093/gji/ggaa097, 2020.
Hadziioannou, C., Larose, E., Coutant, O., Roux, P., and Campillo, M.: Stability of monitoring weak changes in multiply scattering media with ambient noise correlation: Laboratory experiments, J. Acoust. Soc. Am., 125, 3688–3695, 2009.
Hadziioannou, C., Larose, E., Baig, A., Roux, P., and Campillo, M.: Improving temporal resolution in ambient noise monitoring of seismic wave speed, J. Geophys. Res.-Sol. Ea., 116, B07304 pp., https://doi.org/10.1029/2011JB008200, 2011.
Heck, M., Hobiger, M., van Herwijnen, A., Schweizer, J., and Fäh, D.: Localization of seismic events produced by avalanches using multiple signal classification, Geophys. J. Int., 216, 201–217, https://doi.org/10.1093/gji/ggy394, 2018.
Heck, M., van Herwijnen, A., Hammer, C., Hobiger, M., Schweizer, J., and Fäh, D.: Automatic detection of avalanches combining array classification and localization, Earth Surf. Dynam., 7, 491–503, https://doi.org/10.5194/esurf-7-491-2019, 2019.
Hillers, G., Campillo, M., and Ma, K.-F.: Seismic velocity variations at TCDP are controlled by MJO driven precipitation pattern and high fluid discharge properties, Earth Planet Sc. Lett., 391, 121–127, https://doi.org/10.1016/j.epsl.2014.01.040, 2014.
Hillers, G., Ben-Zion, Y., Campillo, M., and Zigone, D.: Seasonal variations of seismic velocities in the San Jacinto fault area observed with ambient seismic noise, Geophys. J. Int., 202, 920–932, https://doi.org/10.1093/gji/ggv151, 2015.
Hotovec-Ellis, A. J., Gomberg, J., Vidale, J. E., and Creager, K. C.: A continuous record of intereruption velocity change at Mount St. Helens from coda wave interferometry, J. Geophys. Res.-Sol. Ea., 119, 2199–2214, https://doi.org/10.1002/2013JB010742, 2014.
James, S. R., Knox, H. A., Abbott, R. E., and Screaton, E. J.: Improved moving window cross-spectral analysis for resolving large temporal seismic velocity changes in permafrost, Geophys. Res. Lett., 44, 4018–4026, https://doi.org/10.1002/2016GL072468, 2017.
Larose, E., Carrière, S., Voisin, C., Bottelin, P., Baillet, L., Guéguen, P., Walter, F., Jongmans, D., Guillier, B., Garambois, S., Gimbert, F., and Massey, C.: Environmental seismology: What can we learn on earth surface processes with ambient noise?, J. Appl. Geophys., 116, 62–74, https://doi.org/10.1016/j.jappgeo.2015.02.001, 2015.
Le Breton, M.: Impulse response from rainfall to displacement, chapter 8, in: Suivi temporel d'un glissement de terrain à l'aide d'étiquettes RFID passives, couplé à l'observation de pluviométrie et de bruit sismique ambiant, PhD Thesis, Université Grenoble Alpes, ISTerre, Grenoble, France, 204–227, 2019.
Le Breton, M., Bontemps, N., Guillemot, A., Baillet, L., and Larose, É.: Landslide monitoring using seismic ambient noise correlation: challenges and applications, Earth-Sci. Rev., 216, 103518, https://doi.org/10.1016/j.earscirev.2021.103518, 2021.
Lehning, M., Bartelt, P., Brown, B., Russi, T., Stöckli, U., and Zimmerli, M.: snowpack model calculations for avalanche warning based upon a new network of weather and snow stations, Cold Reg. Sci. Technol., 30, 145–157, https://doi.org/10.1016/S0165-232X(99)00022-1, 1999.
Mainsant, G., Larose, E., Brönnimann, C., Jongmans, D., Michoud, C., and Jaboyedoff, M.: Ambient seismic noise monitoring of a clay landslide: Toward failure prediction, J. Geophys. Res., 117, F01030, https://doi.org/10.1029/2011JF002159, 2012.
Meier, U., Shapiro, N. M., and Brenguier, F.: Detecting seasonal variations in seismic velocities within Los Angeles basin from correlations of ambient seismic noise, Geophys. J. Int., 181, 985–996, https://doi.org/10.1111/j.1365-246X.2010.04550.x, 2010.
Miao, Y., Shi, Y., Zhuang, H. Y., Wang, S. Y., Liu, H. B., and Yu, X. B.: Influence of Seasonal Frozen Soil on Near-Surface Shear Wave Velocity in Eastern Hokkaido, Japan, Geophys. Res. Lett., 46, 9497–9508, https://doi.org/10.1029/2019GL082282, 2019.
Mordret, A., Mikesell, T. D., Harig, C., Lipovsky, B. P., and Prieto, G. A.: Monitoring southwest Greenland's ice sheet melt with ambient seismic noise, Science Adv., 2, e1501538, https://doi.org/10.1126/sciadv.1501538, 2016.
Moreau, L., Stehly, L., Boué, P., Lu, Y., Larose, E., and Campillo, M.: Improving ambient noise correlation functions with an SVD-based Wiener filter, Geophys. J. Int., 211, 418–426, https://doi.org/10.1093/gji/ggx306, 2017.
Obermann, A., Planès, T., Larose, E., Sens-Schönfelder, C., and Campillo, M.: Depth sensitivity of seismic coda waves to velocity perturbations in an elastic heterogeneous medium, Geophys. J. Int., 194, 372–382, https://doi.org/10.1093/gji/ggt043, 2013.
Planès, T., Rittgers, J. B., Mooney, M. A., Kanning, W., and Draganov, D.: Monitoring the tidal response of a sea levee with ambient seismic noise, J. Appl. Geophys., 138, 255–263, https://doi.org/10.1016/j.jappgeo.2017.01.025, 2017.
Richter, T., Sens-Schönfelder, C., Kind, R., and Asch, G.: Comprehensive observation and modeling of earthquake and temperature-related seismic velocity changes in northern Chile with passive image interferometry, J. Geophys. Res.-Sol. Ea., 119, 4747–4765, https://doi.org/10.1002/2013JB010695, 2014.
Rivet, D., Brenguier, F., and Cappa, F.: Improved detection of preeruptive seismic velocity drops at the Piton de La Fournaise volcano, Geophys. Res. Lett., 42, 2015GL064835, https://doi.org/10.1002/2015GL064835, 2015.
Sayers, C. M.: Porosity dependence of elastic moduli of snow and firn, J. Glaciol., 67, 1–9, https://doi.org/10.1017/jog.2021.25, 2021.
Schweizer, J. and Camponovo, C.: The temperature dependence of the effective elastic shear modulus of snow, Cold Reg. Sci. Technol., 35, 55–64, https://doi.org/10.1016/S0165-232x(02)00030-7, 2002.
Schweizer, J. and Jamieson, J. B.: Snowpack properties for snow profile analysis, Cold Reg. Sci. Technol., 37, 233–241, https://doi.org/10.1016/S0165-232X(03)00067-3, 2003.
Sens-Schönfelder, C. and Wegler, U.: Passive image interferometry and seasonal variations of seismic velocities at Merapi Volcano, Indonesia, Geophys. Res. Lett., 33, L21302, https://doi.org/10.1029/2006GL027797, 2006.
Sidler, R.: A porosity-based Biot model for acoustic waves in snow, J. Glaciol., 61, 789–798, https://doi.org/10.3189/2015JoG15J040, 2015.
Steinmann, R., Hadziioannou, C., and Larose, E.: Effect of centimetric freezing of the near subsurface on Rayleigh and Love wave velocity in ambient seismic noise correlations, Geophys. J. Int., 224, 626–636, https://doi.org/10.1093/gji/ggaa406, 2021.
Tarkov, A. P. and Vavakin, V. V.: Poisson's ratio behaviour in various crystalline rocks: application to the study of the Earth's interior, Phys. Earth Planet. In., 29, 24–29, https://doi.org/10.1016/0031-9201(82)90134-0, 1982.
Taylor, A. and Blum, J. D.: Relation between soil age and silicate weathering rates determined from the chemical evolution of a glacial chronosequence, Geology, 23, 979–982, https://doi.org/10.1130/0091-7613(1995)023<0979:RBSAAS>2.3.CO;2, 1995.
Tsai, V. C.: A model for seasonal changes in GPS positions and seismic wave speeds due to thermoelastic and hydrologic variations, J. Geophys. Res.-Sol. Ea., 116, B04404, https://doi.org/10.1029/2010JB008156, 2011.
van Herwijnen, A. and Schweizer, J.: Seismic sensor array for monitoring an avalanche start zone: design, deployment and preliminary results, J. Glaciol., 57, 267–276, https://doi.org/10.3189/002214311796405933, 2011.
van Herwijnen, A. and Miller, D. A.: Experimental and numerical investigation of the sintering rate of snow, J. Glaciol., 59, 269–274, https://doi.org/10.3189/2013JoG12J094, 2013.
Voisin, C., Garambois, S., Massey, C., and Brossier, R.: Seismic noise monitoring of the water table in a deep-seated, slow-moving landslide, Interpretation, 4, SJ67–SJ76, https://doi.org/10.1190/INT-2016-0010.1, 2016.
Voisin, C., Guzmán, M. A. R., Réfloch, A., Taruselli, M., and Garambois, S.: Groundwater Monitoring with Passive Seismic Interferometry, J. Water Res. Protect., 9, 1414, https://doi.org/10.4236/jwarp.2017.912091, 2017.
Wang, Q.-Y., Brenguier, F., Campillo, M., Lecointre, A., Takeda, T., and Aoki, Y.: Seasonal Crustal Seismic Velocity Changes Throughout Japan, J. Geophys. Res.-Sol. Ea., 122, 7987–8002, https://doi.org/10.1002/2017JB014307, 2017.
Wathelet, M.: Array recordings of ambient vibrations: surface-wave inversion, PhD Thesis Université de Liège, 2005.
Wathelet, M., Jongmans, D., and Ohrnberger, M.: Surface-wave inversion using a direct search algorithm and its application to ambient vibration measurements, Near Surf. Geophys., 2, 211–221, https://doi.org/10.3997/1873-0604.2004018, 2004.
Wever, N., Fierz, C., Mitterer, C., Hirashima, H., and Lehning, M.: Solving Richards Equation for snow improves snowpack meltwater runoff estimations in detailed multi-layer snowpack model, The Cryosphere, 8, 257–274, https://doi.org/10.5194/tc-8-257-2014, 2014.