the Creative Commons Attribution 4.0 License.
the Creative Commons Attribution 4.0 License.
 | 07 Dec 2021
Generation and fate of basal meltwater during winter, western Greenland Ice Sheet
Toby Meierbachtol
Neil Humphrey
Jun Saito
Aidan Stansberry
Basal sliding in the ablation zone of the Greenland Ice Sheet is closely associated with water from surface melt introduced to the bed in summer, yet melting of basal ice also generates subglacial water year-round. Assessments of basal melt rely on modeling with results strongly dependent upon assumptions with poor observational constraints. Here we use surface and borehole measurements to investigate the generation and fate of basal meltwater in the ablation zone of Isunnguata Sermia basin, western Greenland. The observational data are used to constrain estimates of the heat and water balances, providing insights into subglacial hydrology during the winter months when surface melt is minimal or nonexistent. Despite relatively slow ice flow speeds during winter, the basal meltwater generation from sliding friction remains manyfold greater than that due to geothermal heat flux. A steady acceleration of ice flow over the winter period at our borehole sites can cause the rate of basal water generation to increase by up to 20 %. Borehole measurements show high but steady basal water pressure rather than monotonically increasing pressure. Ice and groundwater sinks for water do not likely have sufficient capacity to accommodate the meltwater generated in winter. Analysis of basal cavity dynamics suggests that cavity opening associated with flow acceleration likely accommodates only a portion of the basal meltwater, implying that a residual is routed to the terminus through a poorly connected drainage system. A forcing from cavity expansion at high pressure may explain observations of winter acceleration in western Greenland.
- Article
(7200 KB) - Full-text XML
- BibTeX
- EndNote


The flow speed of the outer flanks of the Greenland Ice Sheet (GrIS) typically exhibits distinct seasonal (e.g., Zwally et al., 2002) and diurnal (e.g., Shepherd et al., 2009) variations that can be doubling to tripling. Both observational (e.g., Andrews et al., 2014) and modeling (e.g., Schoof, 2010) studies have established a close association between the speed changes and evolving subglacial hydrologic conditions forced by surface melt. Despite little to no surface melt in the winter months, this period is when the vast majority of the overall ice displacement occurs (Sole et al., 2013) due to continuous motion (albeit relatively slow) over about two-thirds of the year. A steady increase in speed over the course of the winter has also been reported for certain locations of the western Greenland Ice Sheet with satellite (e.g., Fitzpatrick et al., 2013; Joughin et al., 2008, 2010; Moon et al., 2014) and ground-based (e.g., Stevens et al., 2016; van de Wal et al., 2015) observations. Acceleration during winter is not an omnipresent characteristic of GrIS ice flow, but neither is the occurrence unique to Greenland: individual reports of speed increases throughout winter also exist for surge-type glaciers in North America (Abe and Furuya, 2015) and for valley glaciers in the Alps (Iken and Truffer, 1997). While the phenomenon appears to be common to glaciers and ice sheets, the driving processes are unclear, particularly with regards to in situ observations of bed conditions.
Water is introduced to the bed during the winter via basal ice melt driven by geothermal heat, sliding friction, and strain heating of the ice. The magnitude of basal ice melt in the western Greenland ablation zone has been assessed by models which are heavily dependent upon assumptions about sliding speed (e.g., Brinkerhoff et al., 2011; Meierbachtol et al., 2015). These studies suggest that ice melt rates are spatially variable and reach values on the order of 2 cm a−1 along the relatively slow-moving outer flanks of the land-terminating ablation zone (10 cm a−1 adjacent to Jakobshavn Isbræ; Lüthi et al., 2002). While the water generated from basal melt is trivially small in comparison to that derived from surface melt in summer, basal ice melt may become important during the winter months, particularly when considering the accumulation of basal meltwater over time and space.
Basal meltwater generated in winter is potentially routed into storage sinks in the ice (e.g., basal crevasses), absorbed by the groundwater system, routed into a connected subglacial drainage system, and/or accommodated by expansion of basal water cavities. The pressure, availability, and distribution of water dictate potential groundwater recharge and exchanges between the bed and storage sinks in the overlying ice, and the connectivity and water flux conditions dictate throughput to the terminus for winter discharge. The winter configuration of the drainage system and associated ice–bed coupling drive winter ice flow and dictate the initial hydrologic conditions that are perturbed by the spring surface melt, which ultimately results in a spring acceleration of ice flow. Yet, little is known about bed conditions in winter due to the paucity of observations and the difficulty of addressing critical subgrid-scale processes with models.
This study examines the role of basal meltwater generation in subglacial drainage system characteristics in the ablation zone of western Greenland. We focus on the Isunnguata Sermia outlet basin and on the winter months when surface melt is minimal to nonexistent. We analyze data that include surface motion, measured by GPS stations and satellite, and subglacial conditions measured by in situ sensors placed in a network of boreholes to the bed. The borehole data offer direct context and constraints on bed conditions, as well as facilitating measurement-based constraints on basal meltwater generation and its fate in hydrologic processes.
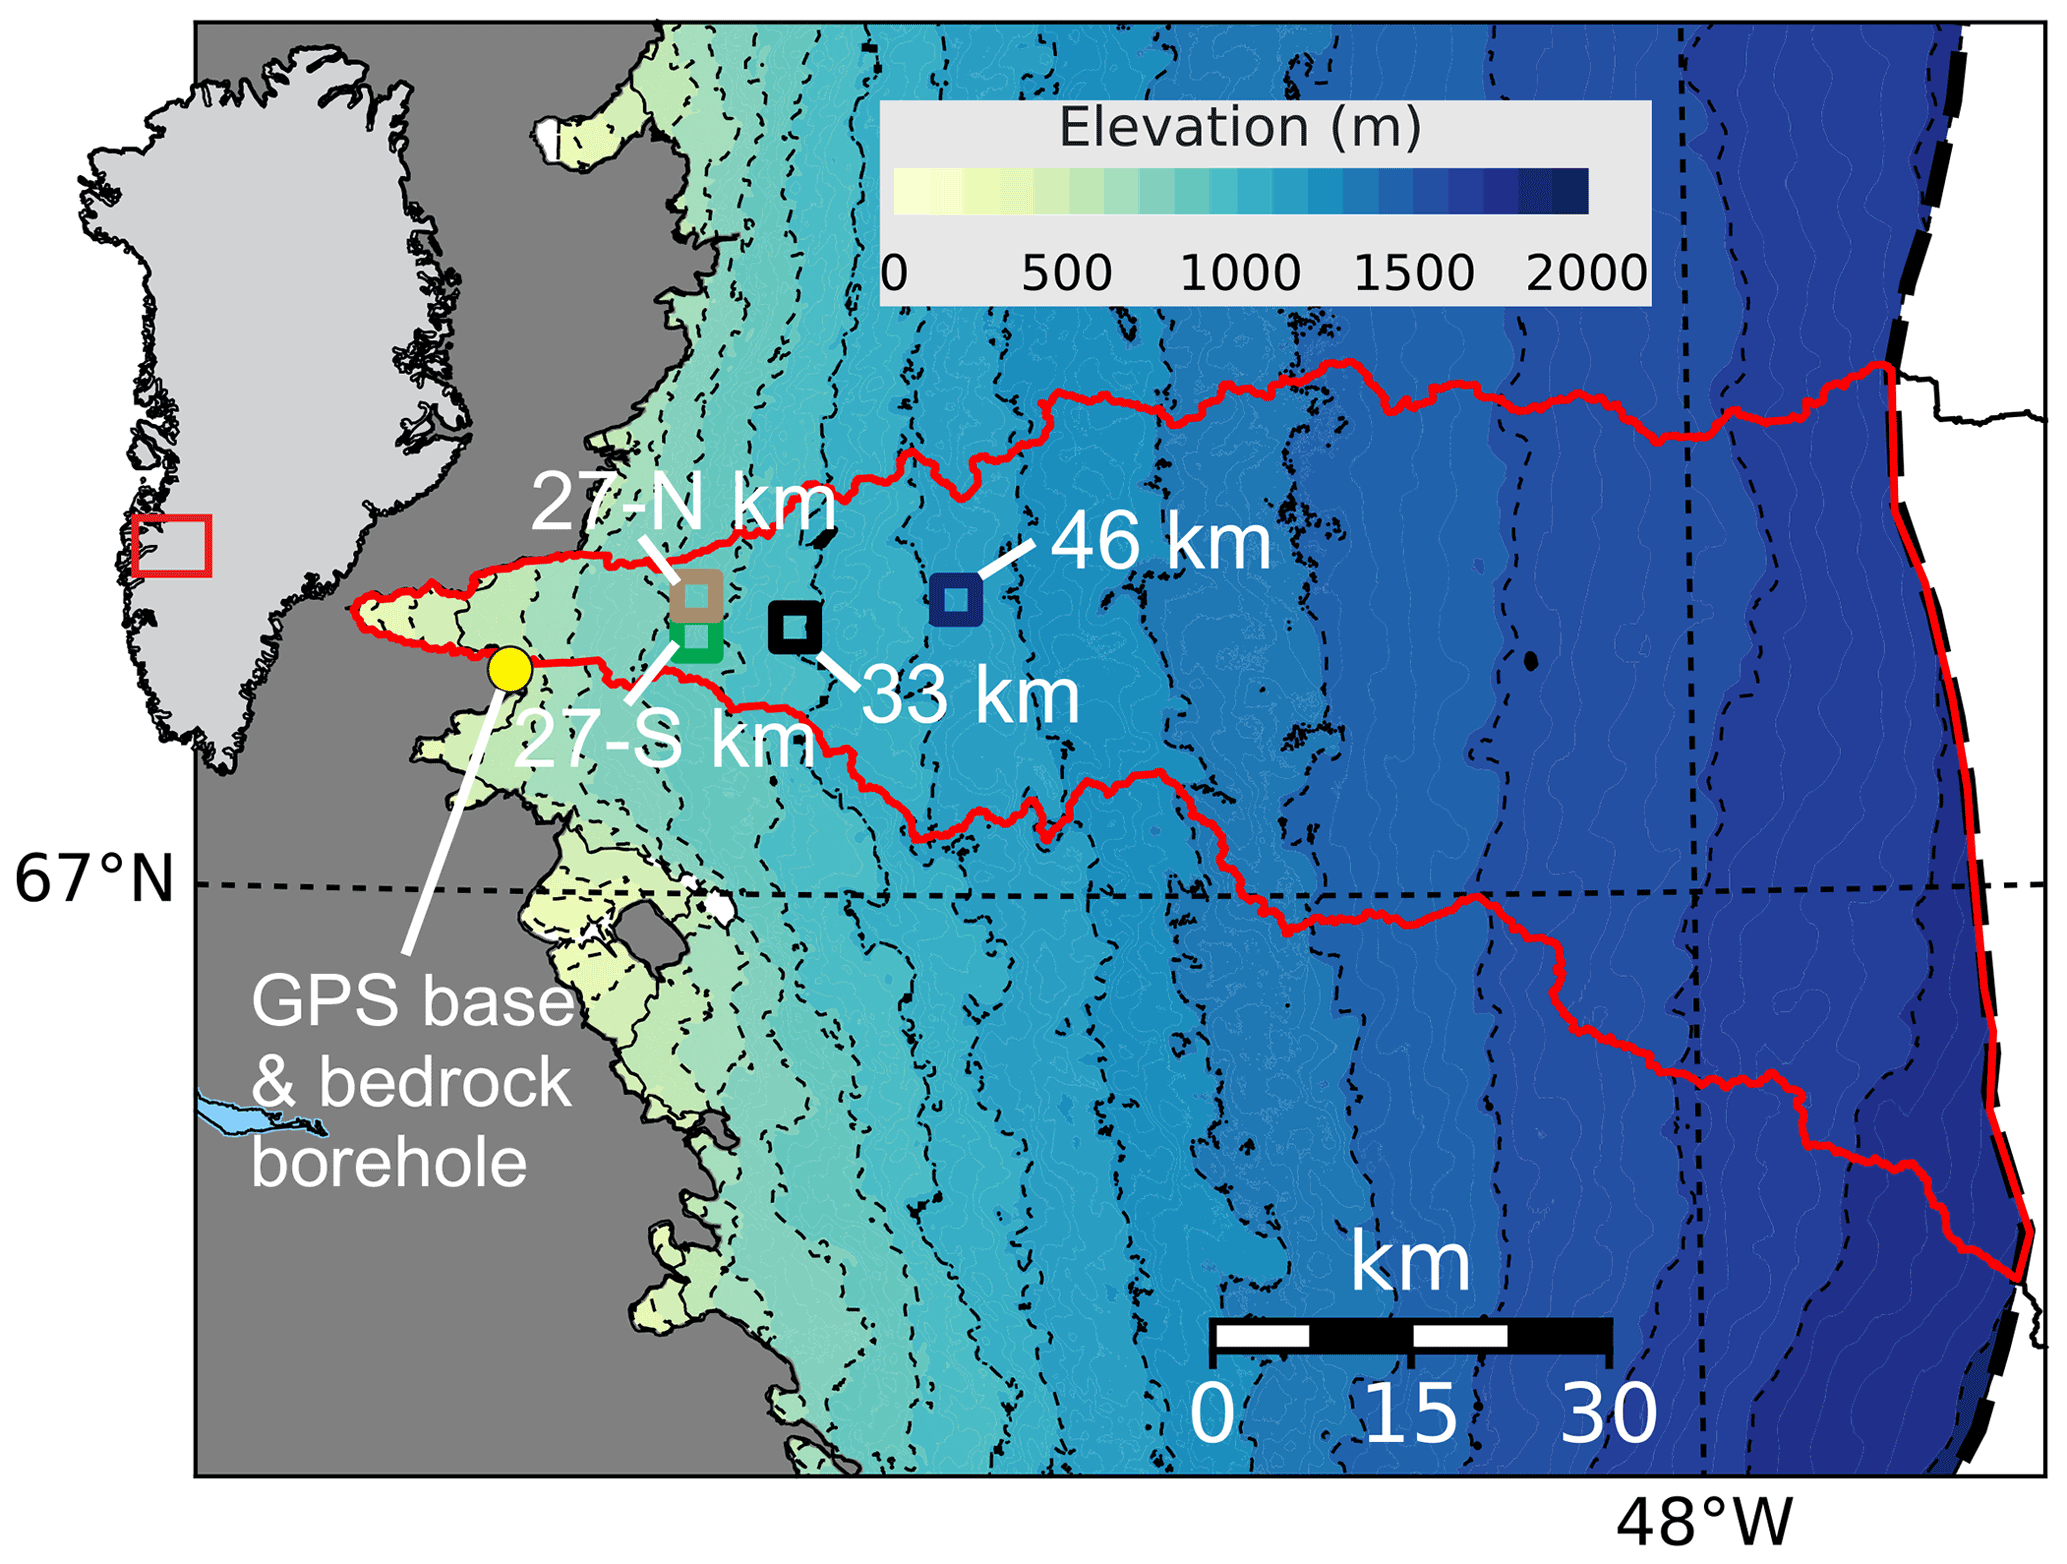
Figure 1Map showing Isunnguata Sermia basin (red outline) in western Greenland. The inland basin boundary is clipped at the long-term position of the equilibrium line (see methods). Measurement sites are labeled as distance from the terminus. Datasets include basal water pressure (at 27∘ S, 27∘ N; 33 and 46 km), meteorological data and surface melt (at 33 km), and GPS speed (at 33 and 46 km).
2.1 Sites and measurements
The Isunnguata Sermia (IS) basin is directly north of the well-studied Russell Glacier and K-transect (van de Wal et al., 2008) near the center of the ∼450 km long land-terminating portion of western Greenland (Fig. 1). Within the IS basin we have comprehensive in situ measurements collected in 32 boreholes drilled to the bed along a transect of sites extending 46 km inland from the outlet glacier terminus. Boreholes were drilled with a hot water system (Meierbachtol et al., 2013) and vary from ∼100 m deep near the ice margin to 830 m deep at a site 46 km from the terminus.
We present data from sites 27, 33, and 46 km from the terminus, but our analysis is primarily focused on data collected at the 33 km site. Here nine boreholes extending 640–688 m to the bed were instrumented. Five surface GPS stations yield 3 years of in situ observations of surface velocity, and borehole inclinometers provide a direct measure of the basal sliding component of ice motion (Maier et al., 2019). Meteorological variables were also measured at the site, including surface ice melt by sonic distance sensors and rain precipitation by tipping buckets (Hills et al., 2018). Our delineation of the winter period is based on glaciological variables (defined in Sect. 3.1) rather than the strict meteorological definition. The data and analyses in the sections below draw upon previously published work on the borehole transect addressing subsurface conditions, including ice temperature, composition of the bed surface, water pressure, and borehole partitioning of ice deformation and basal sliding speeds.
Delineation of the IS basin catchment is based on the field of total potential of basal water, calculated under assumptions of ice density (910 kg m−3) and water pressure equal to ice overburden pressure (Wright et al., 2016). The catchment boundary was computed by the r.watershed module of GRASS GIS (GRASS Development Team, 2020). We impose an inland catchment boundary defined by the long-term (1958–2016) equilibrium line altitude (ELA) from RACMO2.3p2 (Noël et al., 2018). The latter is not likely to be a true boundary with respect to basal water, but data limitations prevent analysis of conditions further inland, and previous work has suggested that this boundary is a reasonable proxy for the onset of sliding conditions that control melt generation (Meierbachtol et al., 2016a).
2.2 Surface speed
High-temporal-resolution details of winter velocity at the 33 km site are revealed by a 3-year record of surface displacement measured by GPS. Five GPS stations installed in a diamond pattern, each with an antenna placed on a pole drilled into the ice, recorded data from summer 2014 to summer 2017. Trimble NetR9 or NetRS receivers with batteries and solar recharging were installed to run continuously during months with sunlight. The stations shut down for 1–2 months during the dark months of December and January due to low power. The surface velocity was calculated from position data collected at 15 s intervals (Maier et al., 2019). Positions with reported error >0.02 m were eliminated, although these were rare. Positions were binned at 15 min intervals from which velocities were derived and then smoothed with an 8 h window. Data were processed against a base station located off the ice sheet ∼22 km away using the TRACK (version 1.29) differential kinematic processing module within GAMIT/GLOBK software (Herring et al., 2010). Here we focus on the central station, since the differences between stations are inconsequential to our results.
We assess the spatial pattern of the winter speed-up across the basin through analysis of the publicly archived MEaSUREs version 2 monthly satellite velocity mosaics (Joughin et al., 2018a). The MEaSUREs product incorporates multiple SAR data sources, combined with Landsat feature tracking, and has a 200×200 m posting and 1-month temporal resolution (i.e., April values represent velocities calculated from displacements over the month of April). For our purposes of basin assessment with satellite data, we define the winter period as October to the end of April. While this period conservatively captures winter conditions across the basin, we note that winter weather conditions may initiate earlier and terminate later, depending on elevation and year.
The velocity products have intrinsic errors associated with the measurements and methodologies, as well as inconsistences in availability of the primary satellite data. The errors tend to be more problematic when considering finer detail and shorter time intervals (Derkacheva et al., 2020). Limitations of the velocity product thus dictate that our MEaSUREs data analysis is restricted to the 2017–2018 winter, which is deemed to have the best quality (Joughin et al., 2018b). The average error over the basin of the velocity product for the month of October 2017 is <3 m a−1. The average velocity is <87 m a−1 over the basin during that month, so the velocity error is ∼3 % of the average value. The greatest challenge is with differencing the velocity fields between the start and end of the winter period in order to examine basin-wide changes. We limit our results to show only values that rise above reported measurement errors. In other words, if differencing between the start and end of winter products indicates a 20 % speed change in a given location but error terms alone yield a 15 % change, we show results as a minimum change of 5 %.
2.3 Basal water pressure
Boreholes instrumented with water pressure transducers were used to directly measure basal water pressure. Data were collected at 5 to 15 min intervals during summer and 15 to 30 min intervals during winter. Details of the instrumentation are presented in Wright et al. (2016). Pressure values were converted to fraction of ice overburden, with uncertainty in this calculation arising from transducer resolution, ice depth measurement, and assumed ice density, the latter being the greatest. Incorporating a range for ice density values from 900–917 kg m−3 yields a total uncertainty of −0.022 to +0.026 times overburden (Wright et al., 2016). We present data from several boreholes drilled at the 33 km site, in addition to data from holes at 27 km north and 27 km south sites with records extending through the winter period.
2.4 Basal meltwater generation
2.4.1 Instrumented site
Our prior measurements in boreholes of the basal ice temperature and sliding speed allow the basal ice melt to be calculated with an unusually high level of observational constraint at our 33 km study site. Melt rate, (m w.e. s−1), is calculated from the energy balance at the bed:
where ρ and L are ice density and latent heat of fusion, respectively, and ub is the borehole-measured basal velocity, which is 96 % of the surface speed (Maier et al., 2019). Driving stress, τd, is computed as ρgHsin α, assuming ice density, ρ, of 910 kg m−3, slope, α, averaged over eight ice thicknesses (Kamb and Echelmeyer, 1986), and ice thickness, H, measured accurately in boreholes to the bed. The geothermal heat flux, Qgeo, is ∼27 mW m−2 and is constrained by direct measurements in a bedrock borehole located ∼22 km away (Meierbachtol et al., 2015). Heat flow into the ice above the bed, , is known to be insignificant because our borehole temperature measurements indicate that a temperate ice layer exists above the bed (Harrington et al., 2015; Hills et al., 2017).
The basal meltwater generation is a model result rather than a direct measurement at the bed. We adopt the common assumption that basal ice melt from sliding friction is a function of sliding speed and driving stress (Cuffey and Paterson, 2010), without higher-order terms. Our borehole observations minimize uncertainties related to basal temperature and sliding speed, and they provide an unusually accurate measure of ice depth. However, uncertainties related to driving stress remain. Previous work (Meierbachtol et al., 2016b) examined the driving stress and uncertainties across the basin, including a profile through our study sites. While Meierbachtol et al. (2016b) found that higher-order terms are not substantial at the kilometer scale, the uncertainties related to highly localized stresses that may impact sliding friction are unquantifiable.
2.4.2 Basin catchment
Our analysis of basal meltwater generation is extended to the catchment scale using Eq. (1) along with constraints from our site-specific measurements and existing datasets for ice geometry and flow speed. As in Sect. 2.3.1, geothermal heat flux is assumed to be 27 mW m−2 based on nearby measurements. As above, we assume no thermal gradient draws heat from the bed into the ice because 32 boreholes drilled around the basin show temperate basal ice and wet bed conditions.
We approximate basal shear stress by averaging calculated driving stress over a triangular averaging window of eight ice thicknesses to roughly capture the effects of longitudinal stresses (Kamb and Echelmeyer, 1986). Longitudinal and lateral stress transfer could change local shear stress by a large percentage below or above average values, but on the kilometer scale this likely averages out. Driving stress is calculated based on BedMachine3 surface and bed geometries (Morlighem et al., 2017). The driving stress at this site is representative of much of western Greenland (Maier et al., 2019), and sparse direct measurements from elsewhere in western GrIS also show a high fraction of winter motion results from sliding at the bed (Ryser et al., 2014b). Thus, we adopt the assumption that the measurements showing a high sliding fraction at the 33 km site are representative of sliding across the catchment. The applied sliding fraction is not likely exceeded around the IS catchment based on the high value and the fact that it exceeds the sliding fraction measured in a basin ∼250 km to the north (Ryser et al., 2014b). Thus, our melt generation results are likely an upper limit, which is an important assumption that must be acknowledged.
2.5 Cavitation and meltwater budget
To assess the fate of basal meltwater, we examine local storage in subglacial cavities of the meltwater generated over time. We balance the water from basal ice melt against the opening of water storage space in idealized basal cavities, focusing the analysis on the 33 km site where observational data at the surface and in boreholes allow maximum constraint on the problem.
We assume basal sliding opens water-filled cavities on the downstream side of bedrock bumps as motion over a hard bed accelerates through the winter. We implement the analysis developed by Kamb (1987) for determining cavity stability on a highly idealized orthogonal rise and/or step geometry. Testing of this theoretical approach against experimental data has shown that it can be good approximation of cavity geometry (Zoet and Iverson, 2015). Cavity opening is a function of sliding speed and basal water pressure, and closure is due to viscous creep of the ice. The resulting gap height in a water cavity between ice and bed g is given by
where x is distance from the bedrock step face, h is the chosen step height, and Lc is the cavity length. Cavity length is computed as
where η is a nonlinear ice viscosity (i.e., Cuffey and Paterson, 2010, p. 61) and the effective pressure is N (m is the rate of melt-back of the overlying ice roof, which, considering our conceptual framework – see Fig. 8 – of isolated cavities with zero water flow, we take to be negligible). Cavity areas at the beginning and end of the winter season are computed by integrating Eq. (2) over the step length under changing sliding conditions, and the difference is computed as the change in cavity area over the winter (ΔCa). We assume a unit thickness in and out of the two-dimensional plane to maintain unit consistency with the melt calculations below.
The height of a water cavity is set by the step's rise, but a cavity of a particular length can potentially exist on steps of many different lengths. The unsubmerged portion of the step provides the sliding surface that generates basal meltwater during the winter. Equation (1) describes the melt generation over a unit area of ice in contact with the bed. In the case of our idealized cavity configuration, the energy generated from sliding over the step length is dissipated on the unsubmerged portion of the step. We assume no higher-order stresses. The energy available for melting therefore results from the dissipation of the driving stress over the full step length and the geothermal heat flux, and it is applied to the ice in contact with bedrock (ice melt resulting from warming of the water in the cavity is assumed to be negligible). The melt rate, with energy dissipated over the unsubmerged portion of the step, is thus
The total meltwater, Mtot, is then found by integrating Eq. (4) over the winter period. Together, Eqs. (2)–(4) permit calculation of, for any given step height, the step and cavity lengths required for basal melt generation to balance cavity opening from accelerating sliding over winter. We use this simple calculation to test the feasibility of cavities in winter being completely isolated.
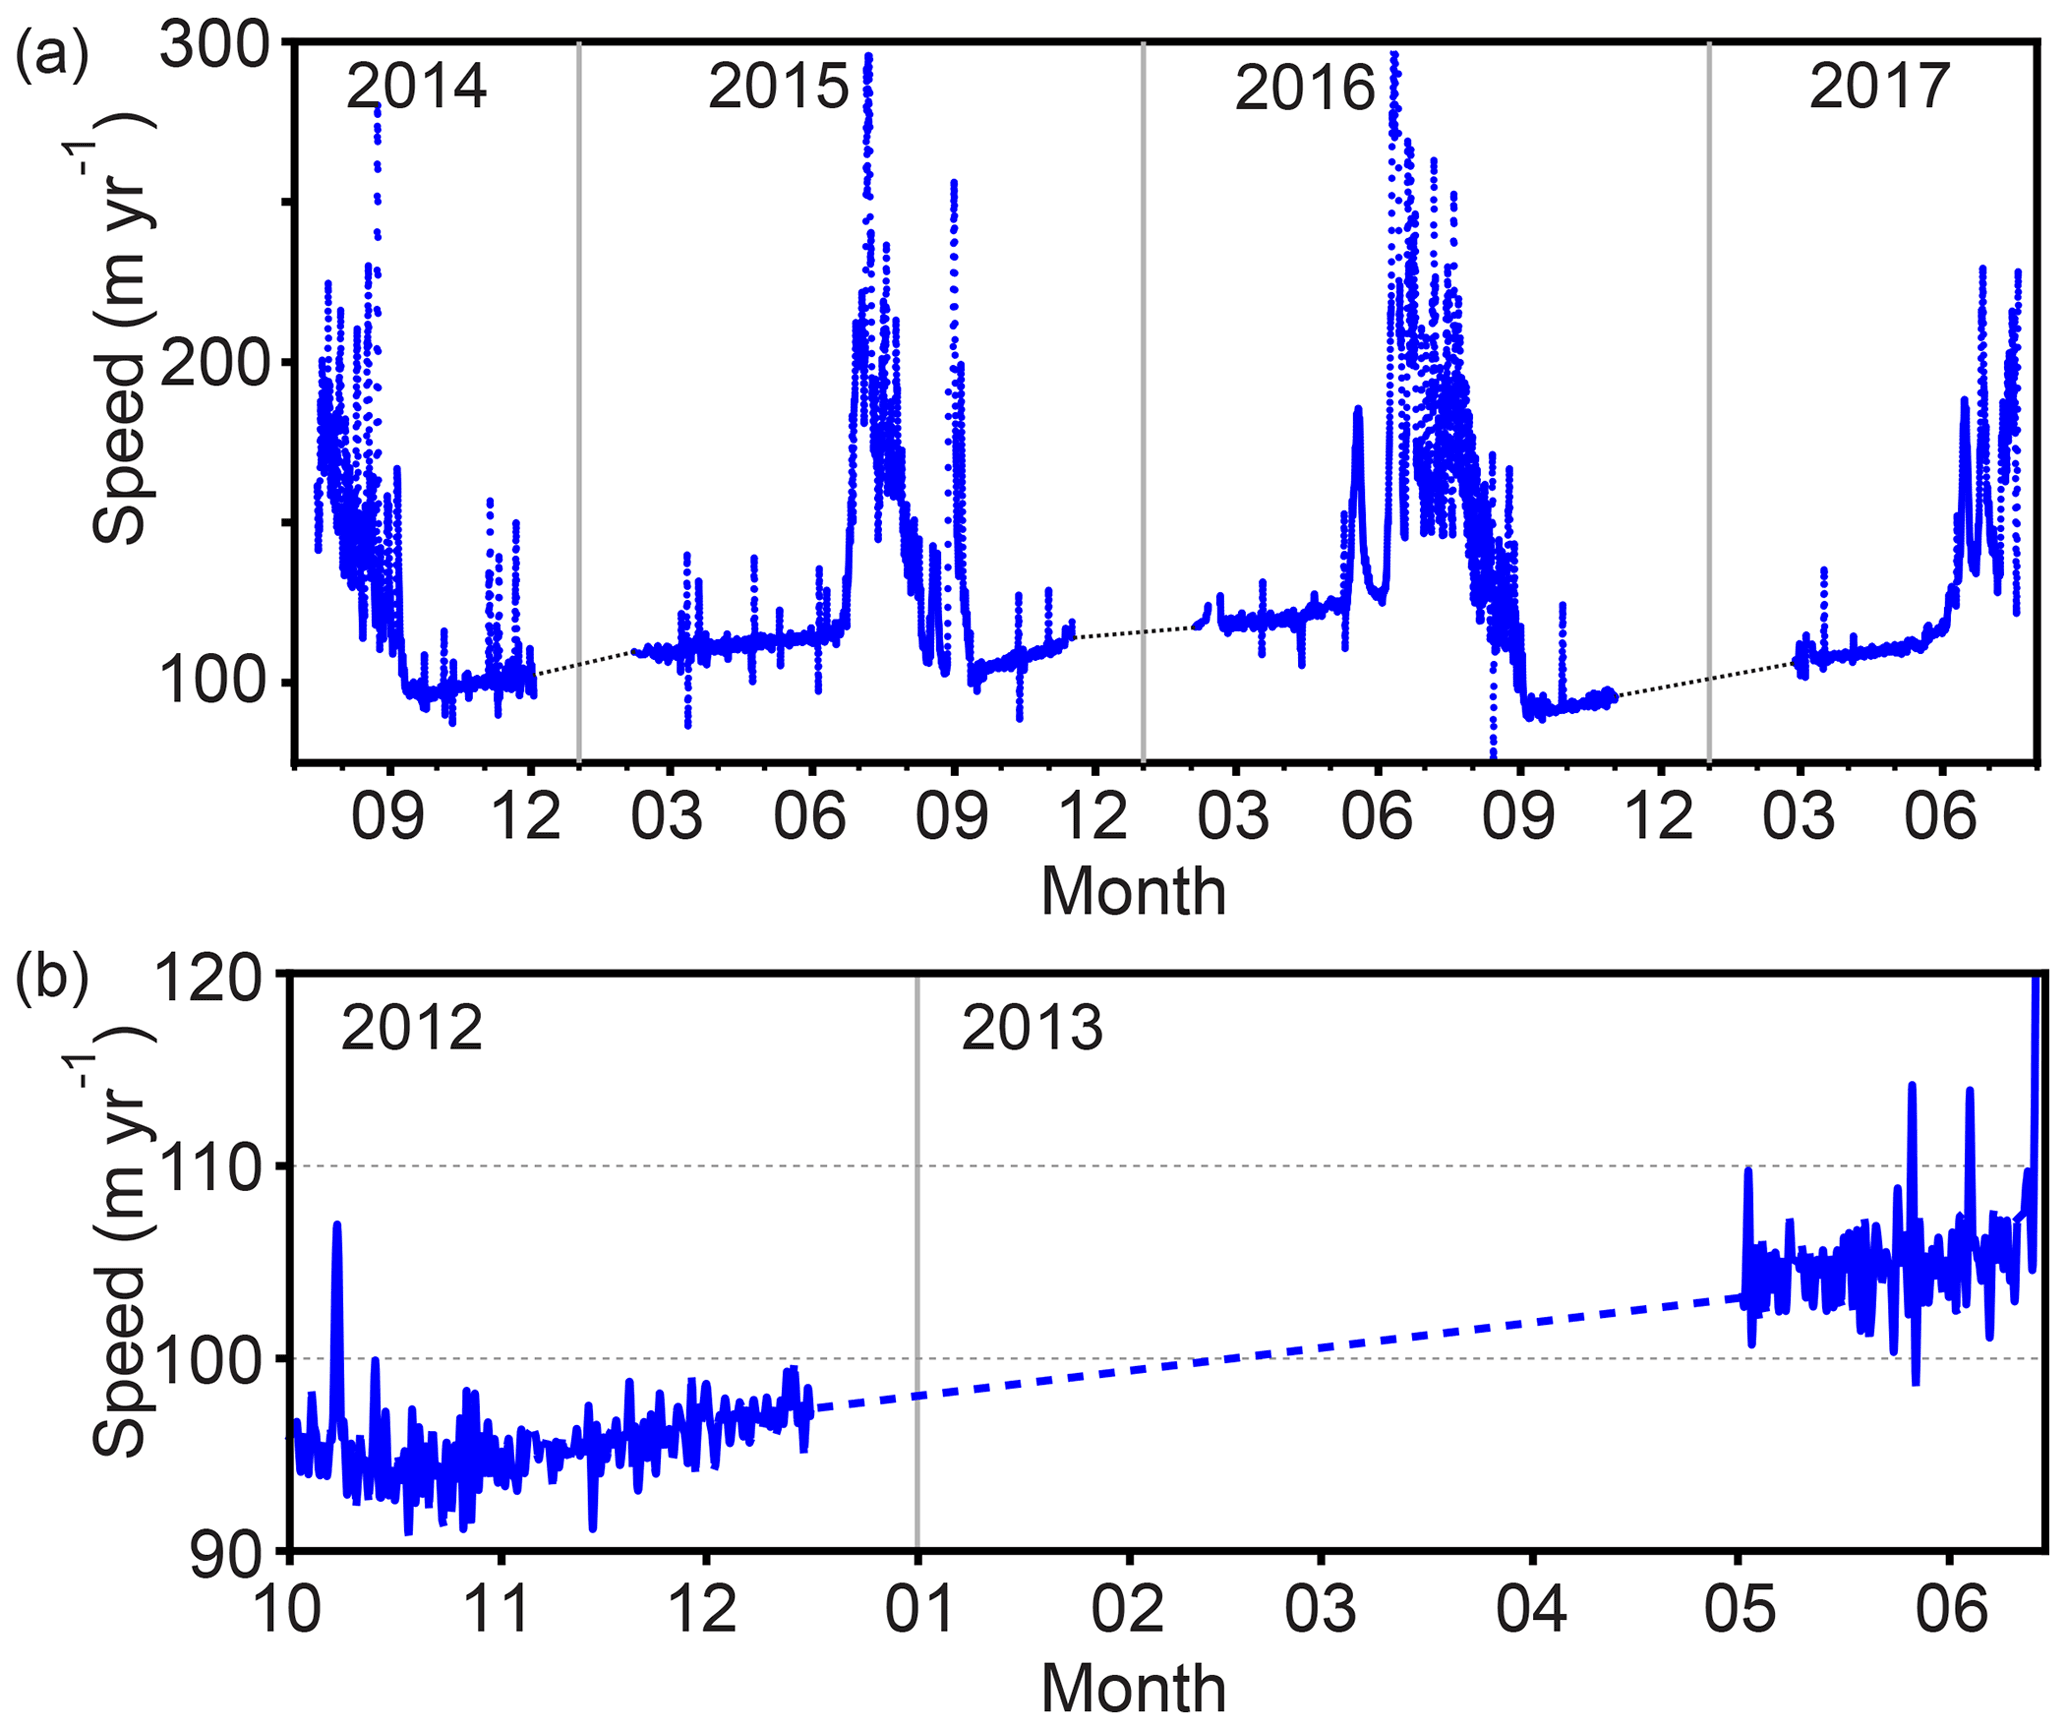
Figure 2Ice flow speed measured with on-ice GPS stations and processed against the base station shown in Fig. 1: (a) 3 years of flow speed at the 33 km site; (b) one winter of flow speed at the 46 km site. Dashed lines indicate missing data due to GPS shutdown due to midwinter power loss. All measurements indicate higher speeds in late winter than early winter.
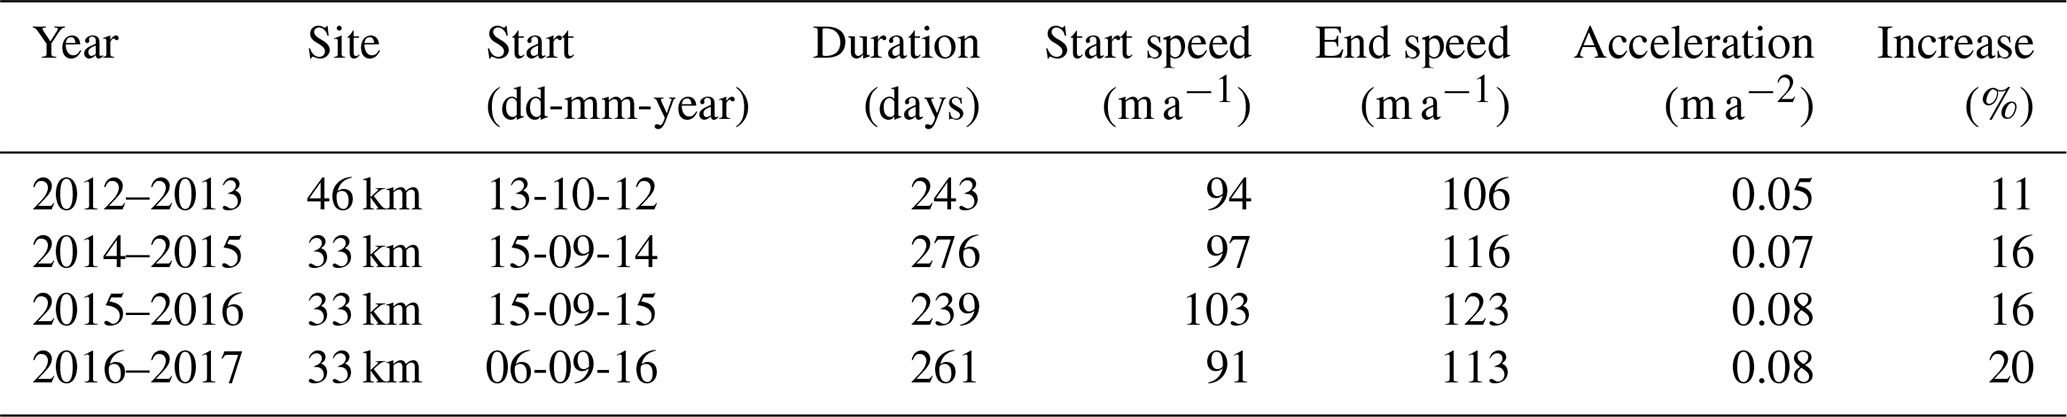
Table 1Characteristics of winter acceleration as measured with GPS stations.
3.1 Winter ice flow
The winter period at the 33 km site is a distinct phase of the annual velocity cycle based on three characteristics: (1) a relatively slow average speed, (2) no diurnal or large-magnitude changes in speed, and (3) a continuous and steady acceleration of speed (Fig. 2). The average acceleration during the three winters measured by GPS was about 0.07–0.08 m a−2, persisting for 239, 261, and 276 d. A very slight decrease in acceleration was present as the winter progressed such that late winter acceleration was slightly below the winter average. The total speed increase during the winter was 11 %–20 %, depending on the year (Table 1). The changes are well outside the GPS uncertainty (position uncertainty is 1–2 cm, yielding velocity uncertainties of ∼1 % over a weekly timescale). GPS measurements at the 46 km site confirmed a similar annual velocity cycle in 2012, but a slower winter acceleration with daily acceleration averaging about 0.05 m a−2 (Table 1).

Figure 3Time series of data collected at the 33 km borehole site showing the start and end of the winter period: (a)–(c) winter onset; (d)–(f) winter termination. Melt is red, and rain is blue (c, f). Borehole, GPS, and meteorological instruments are all located within 10 m of each other.
The onset and termination of the winter mode can be delineated on the basis of surface speed, surface meteorological conditions, and basal water pressure (Fig. 3). As the surface melt becomes less intense during the autumn season, the speed diminishes and eventually diurnal variations in speed cease. The speed then reaches an annual minimum, which as in Stevens et al. (2016), we designate as the transition to winter mode. This occurred on 15 September, 15 September, and 6 September during the years 2014–2016, respectively. The minimum speed varied between 91 and 103 m a−1, which is a range of 12 %, depending on the year. The winter period at the 33 km site represented 65 %–75 % of the calendar year, accounting for about two-thirds of the annual displacement. For example, the total displacement during the 2016–2017 winter period was 74 m. The end of winter is defined by an abrupt speed increase in spring (mid-May to mid-June) associated with the onset of surface melt. Sudden speed-up events are associated with high-intensity melt periods (Fig. 3). Basal water pressure in spring becomes far more irregular than during winter, but does not consistently rise or fall and does not yet contain diurnal variations. Peak speeds in spring eventually increase threefold over winter values, approaching 300 m a−1 (Fig. 2).
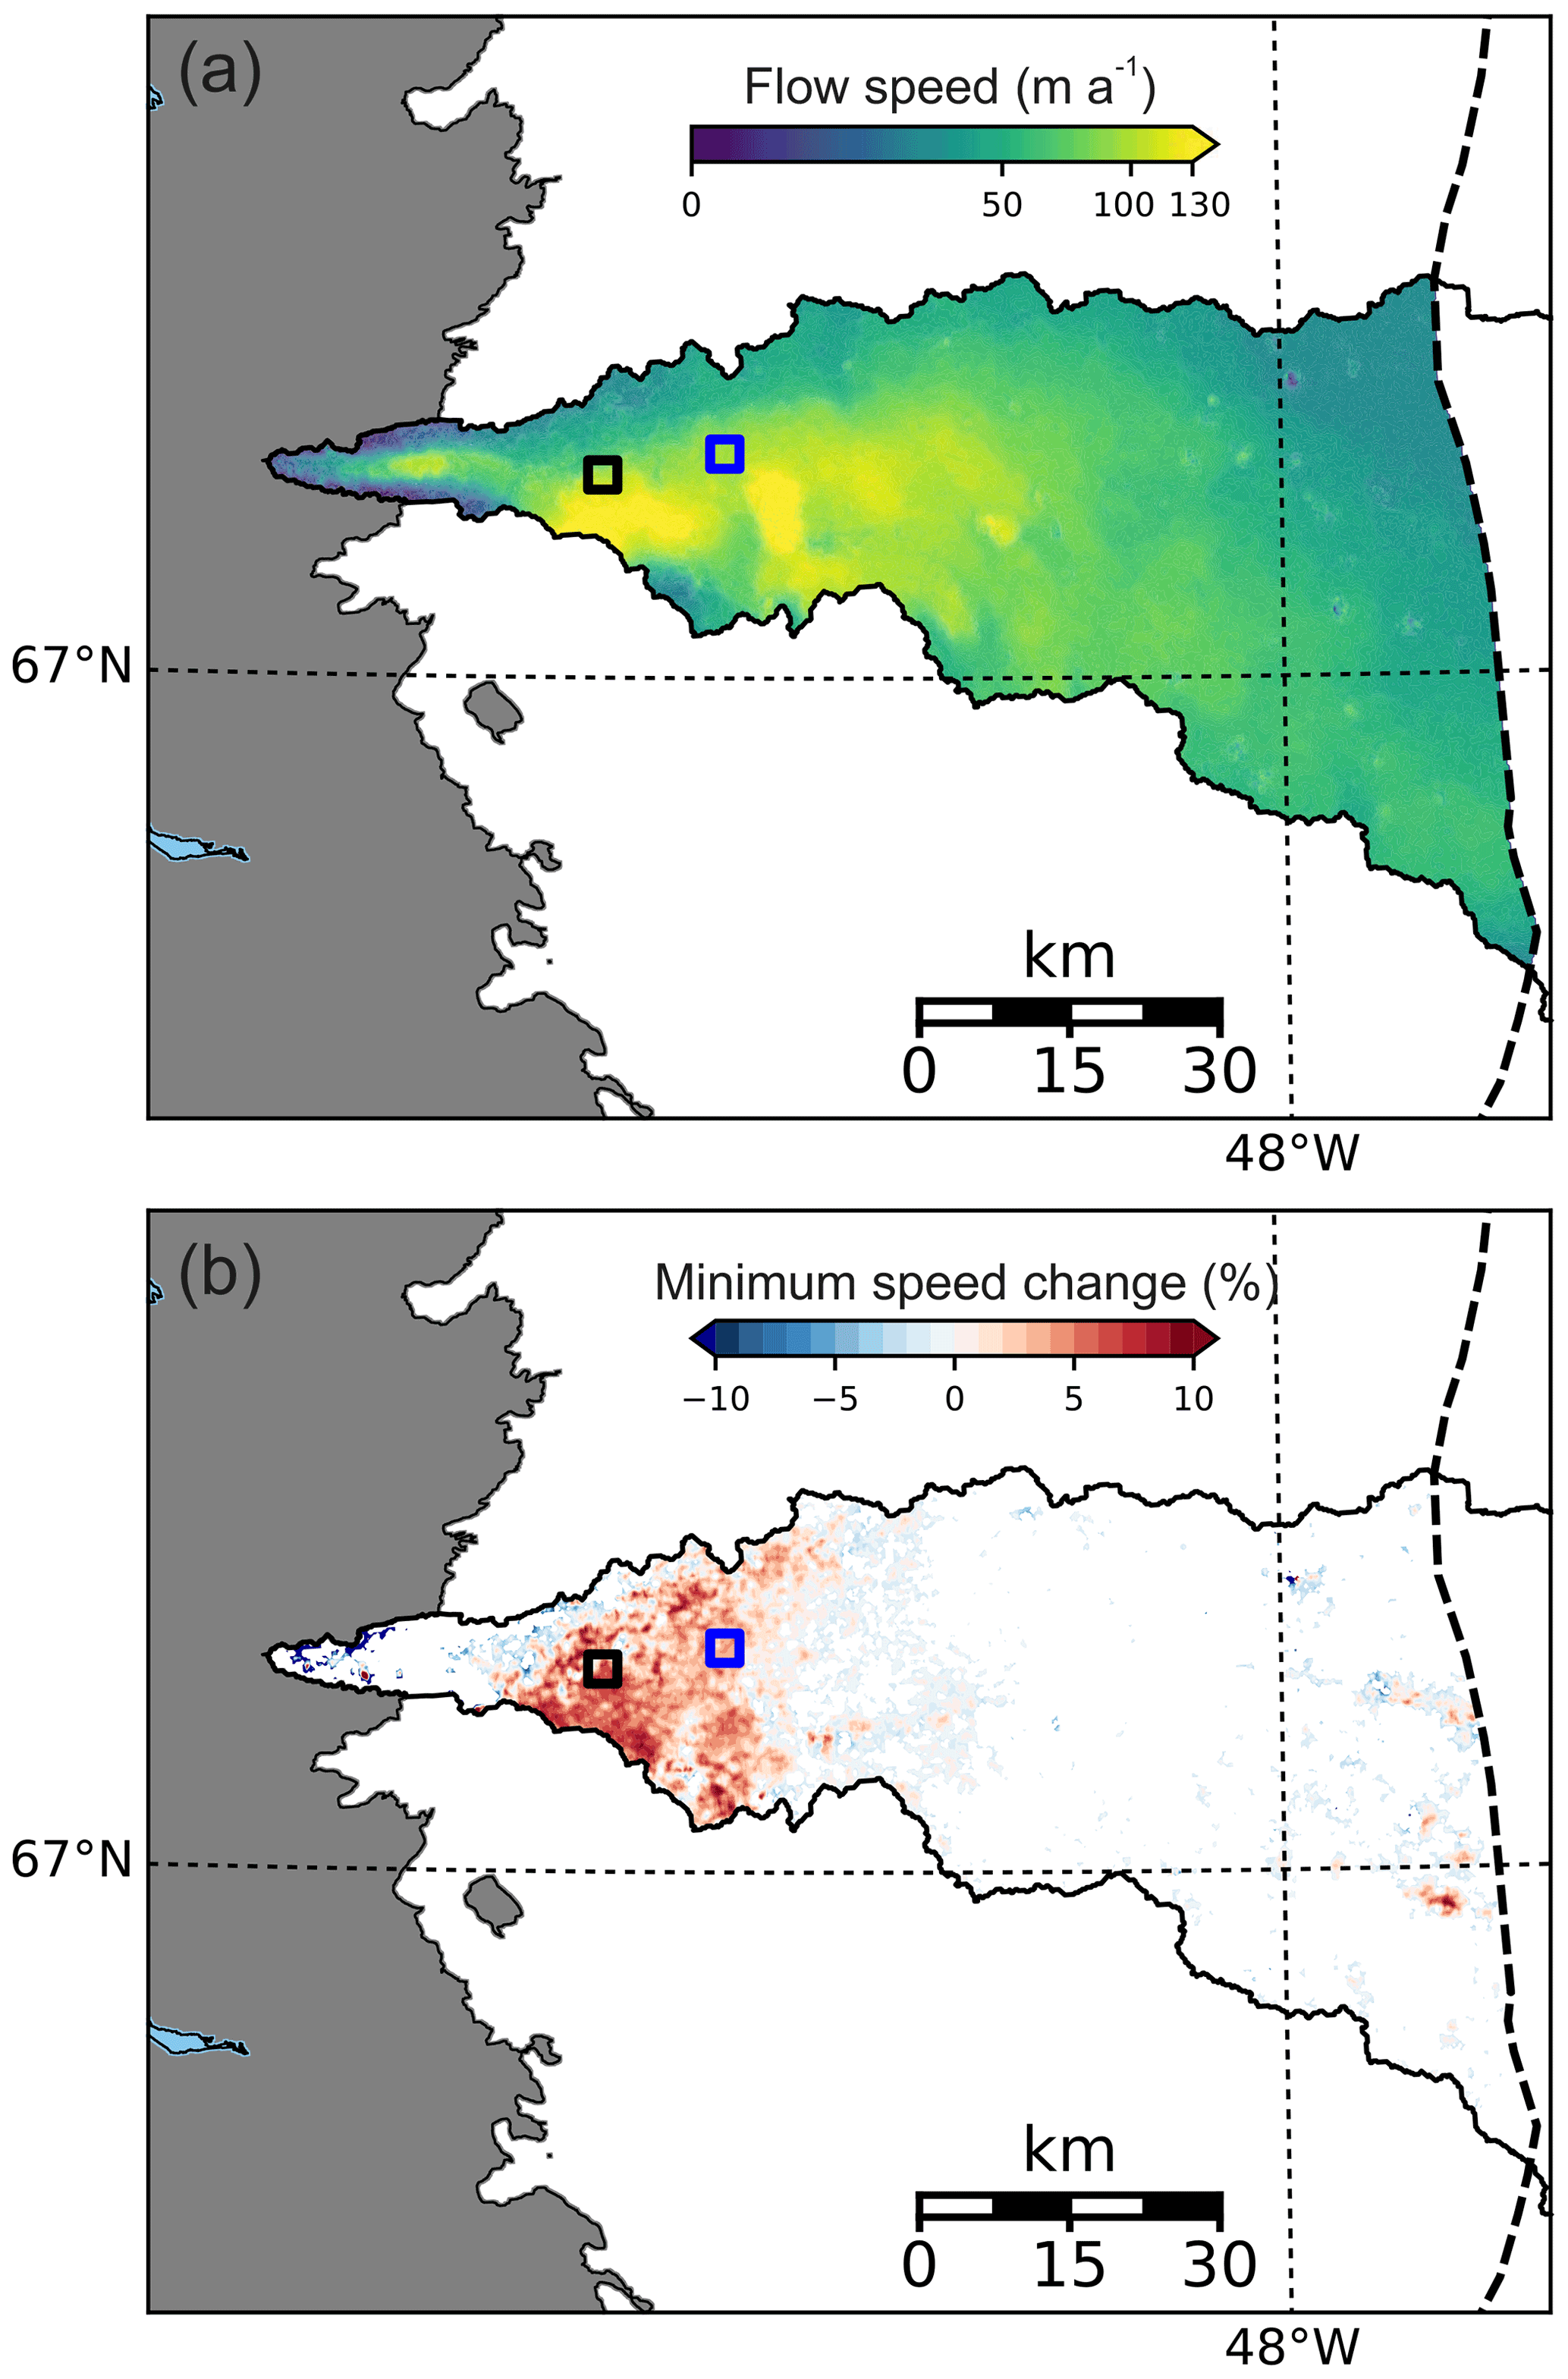
Figure 4Spatial characteristics of ice flow across Isunnguata Sermia basin during winter 2017–2018 based on the MEaSUREs v2 product. (a) Pattern of ice flow speed during early winter measured over the month of October 2017. (b) Minimum ice speed change (as percentage) from October through April; shown are the percentage speed changes minus the potential percentage change resulting from error terms. Areas showing no change could have potentially experienced an October–April speed change, but not enough to overcome errors. The 33 and 46 km measurement sites are shown as boxes.
MEaSUREs data reveal that ice flow acceleration over the winter of 2017–2018 occurred across a broad area of the IS basin ablation zone. The acceleration is spatially continuous across a reach from about 30 to 50 km inland from the terminus, and extending north and south to the basin boundaries (Fig. 4). The 33 km site is near the center of the reach, and the 46 km site is near the furthest inland edge. Other areas of the basin may or may not have accelerated during the 2017–2018 winter: only within this reach do the magnitudes of acceleration rise above measurement uncertainty. These ice speed increases (the amounts above measurement error) are up to 10 % of the winter velocity minima. The reach where winter acceleration occurs with a high degree of certainty is within the fastest-moving portion of the basin, where winter speeds are >100 m a−1.
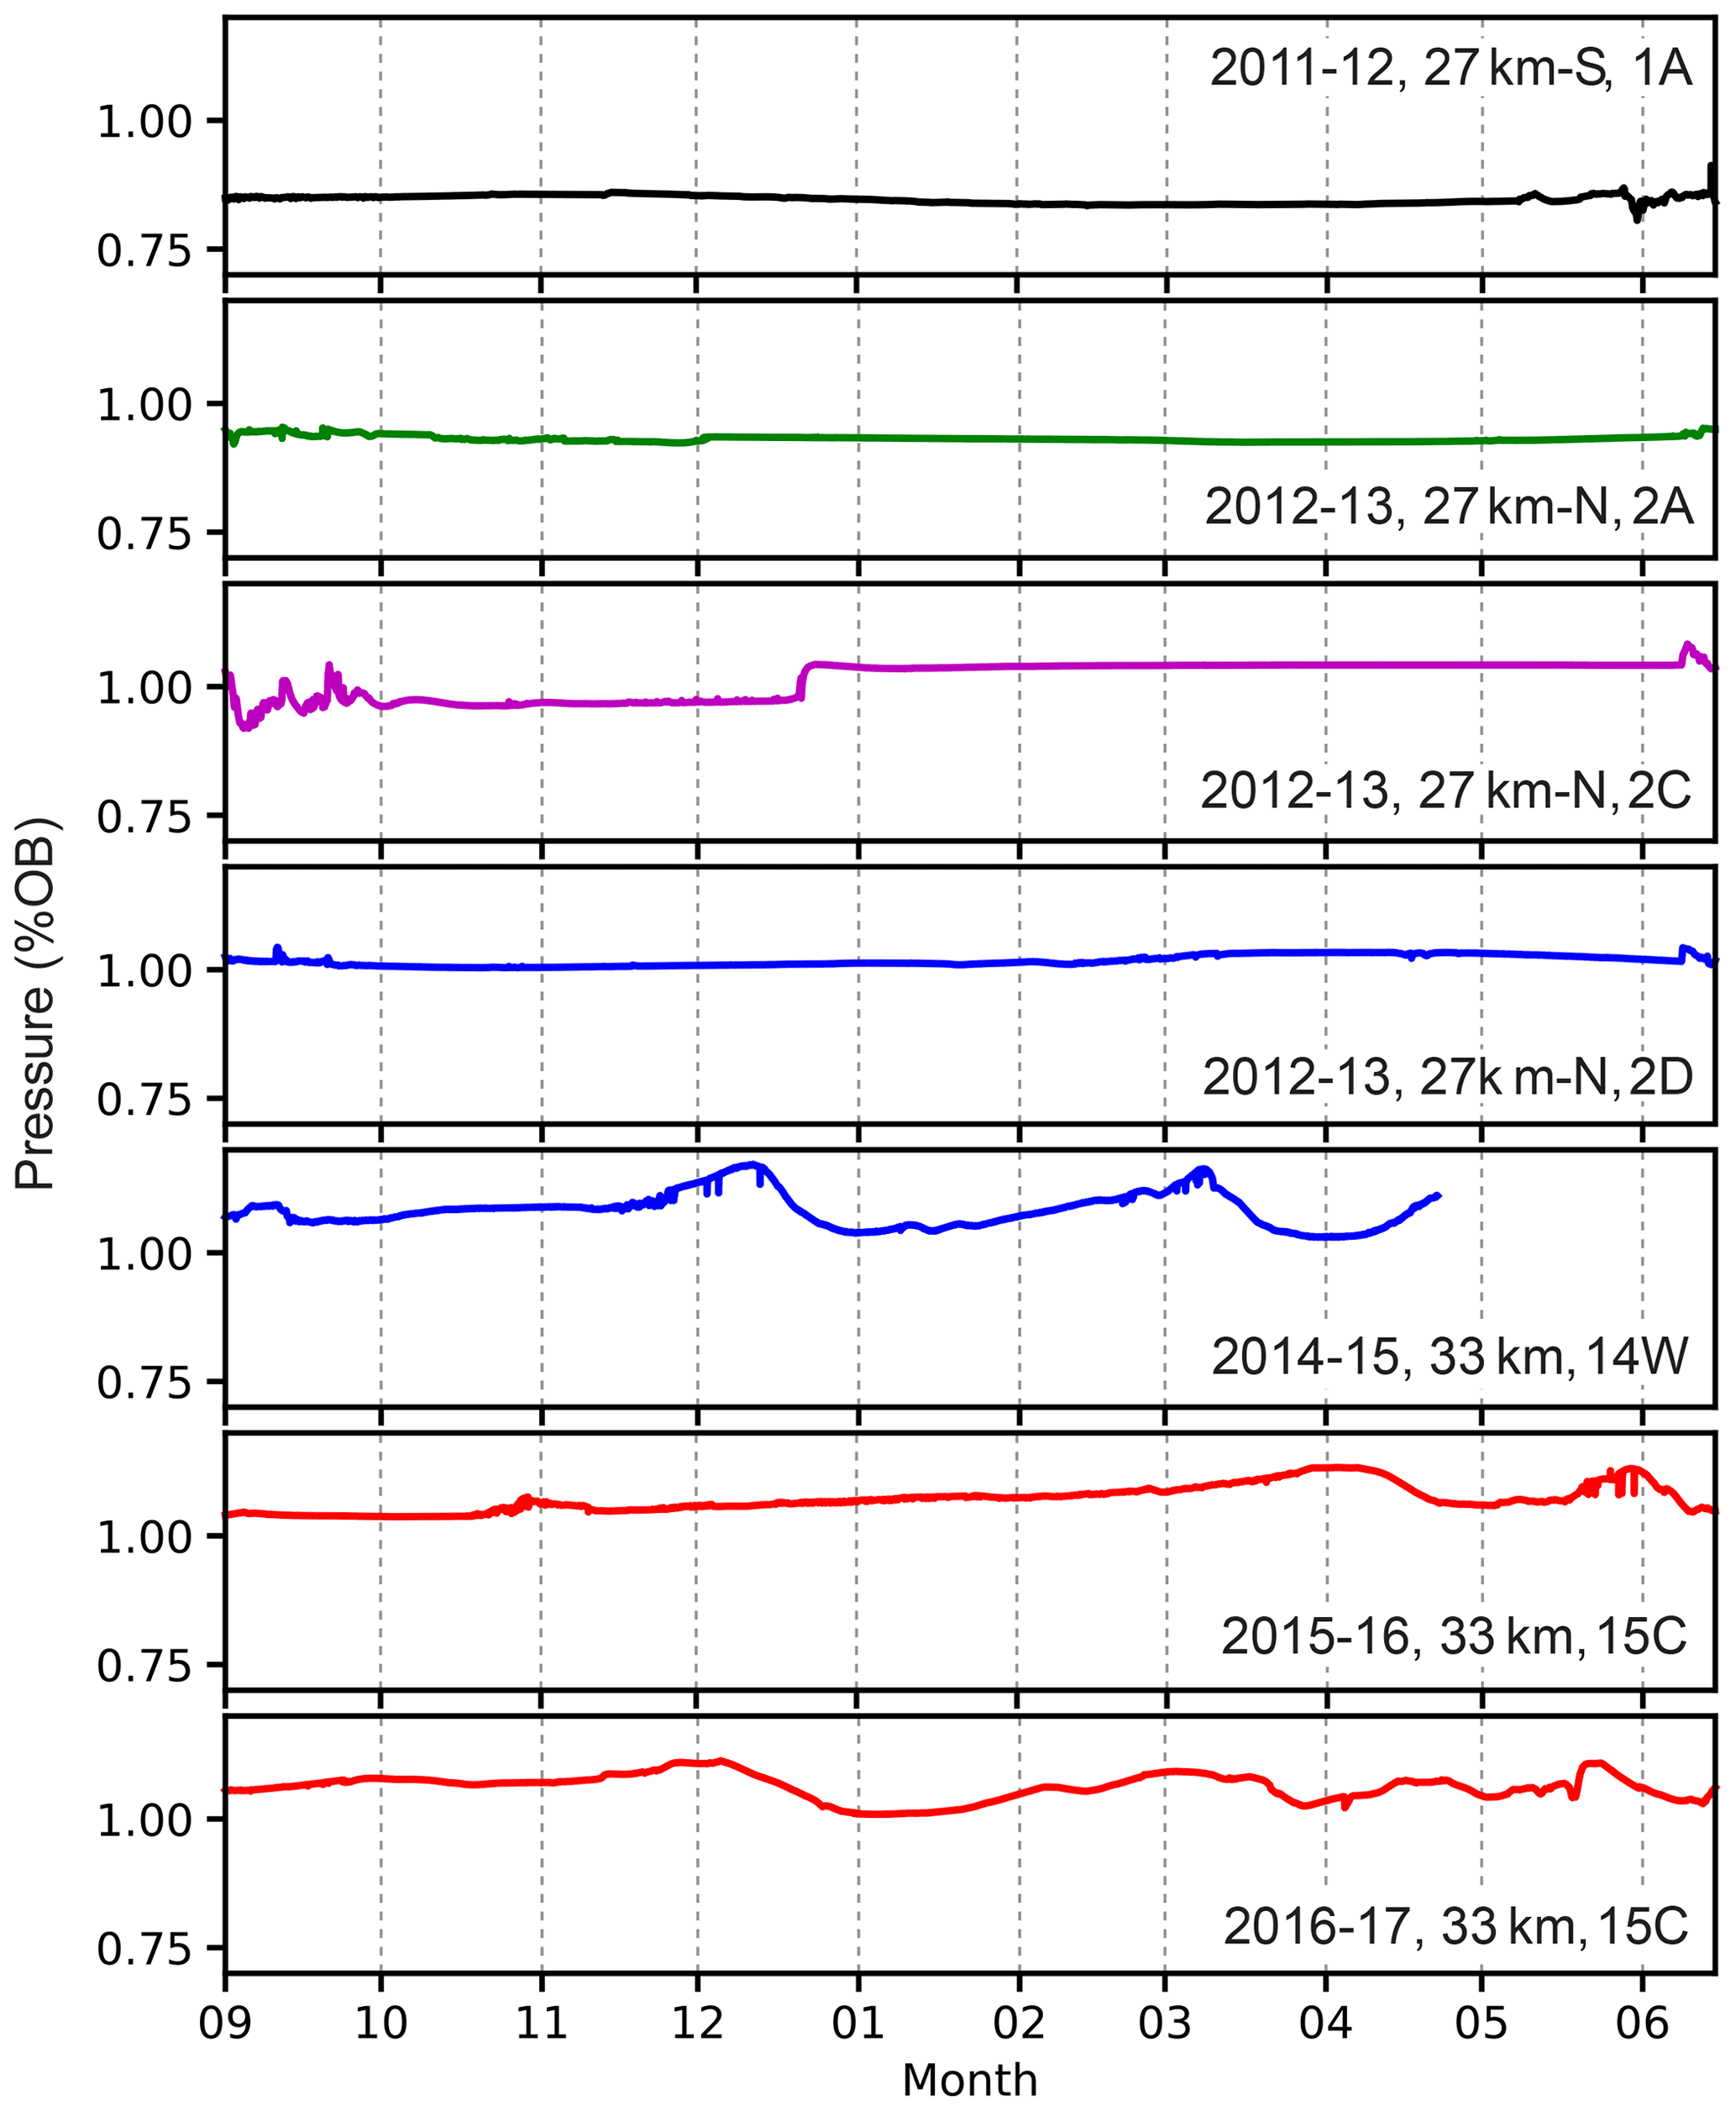
Figure 5Basal water pressure measured in boreholes centered on selected winters. Year, location as distance (km) from the terminus, and borehole name are shown on the right side of each panel.
3.2 Basal water pressure in winter
Basal water pressures measured directly in boreholes at the 33 km site, as well as at two other borehole sites in the IS basin, demonstrate high and relatively steady values for nearly 8 months of the winter period (Fig. 5). No consistent trends are observed in the winter pressure values. Water pressures are near or just above overburden and undergo very low-frequency variability over periods of weeks to months. The small variations likely stem from the advection of pressure sensors tens of meters across variable bed conditions. The character of winter pressure variability strongly contrasts with the summer period, which has large and frequent changes in pressure and includes diurnal swings (Wright et al., 2016). At the onset of winter, diurnal swings in basal water pressure come to an end, concurrent with the end of diurnal variations in ice flow speed. The transition includes a substantial drop in mean pressure, reaching an annual low pressure about 10 d prior to the ice flow speed minimum (Fig. 3). Pressure then climbs over several weeks to high and steady winter values.
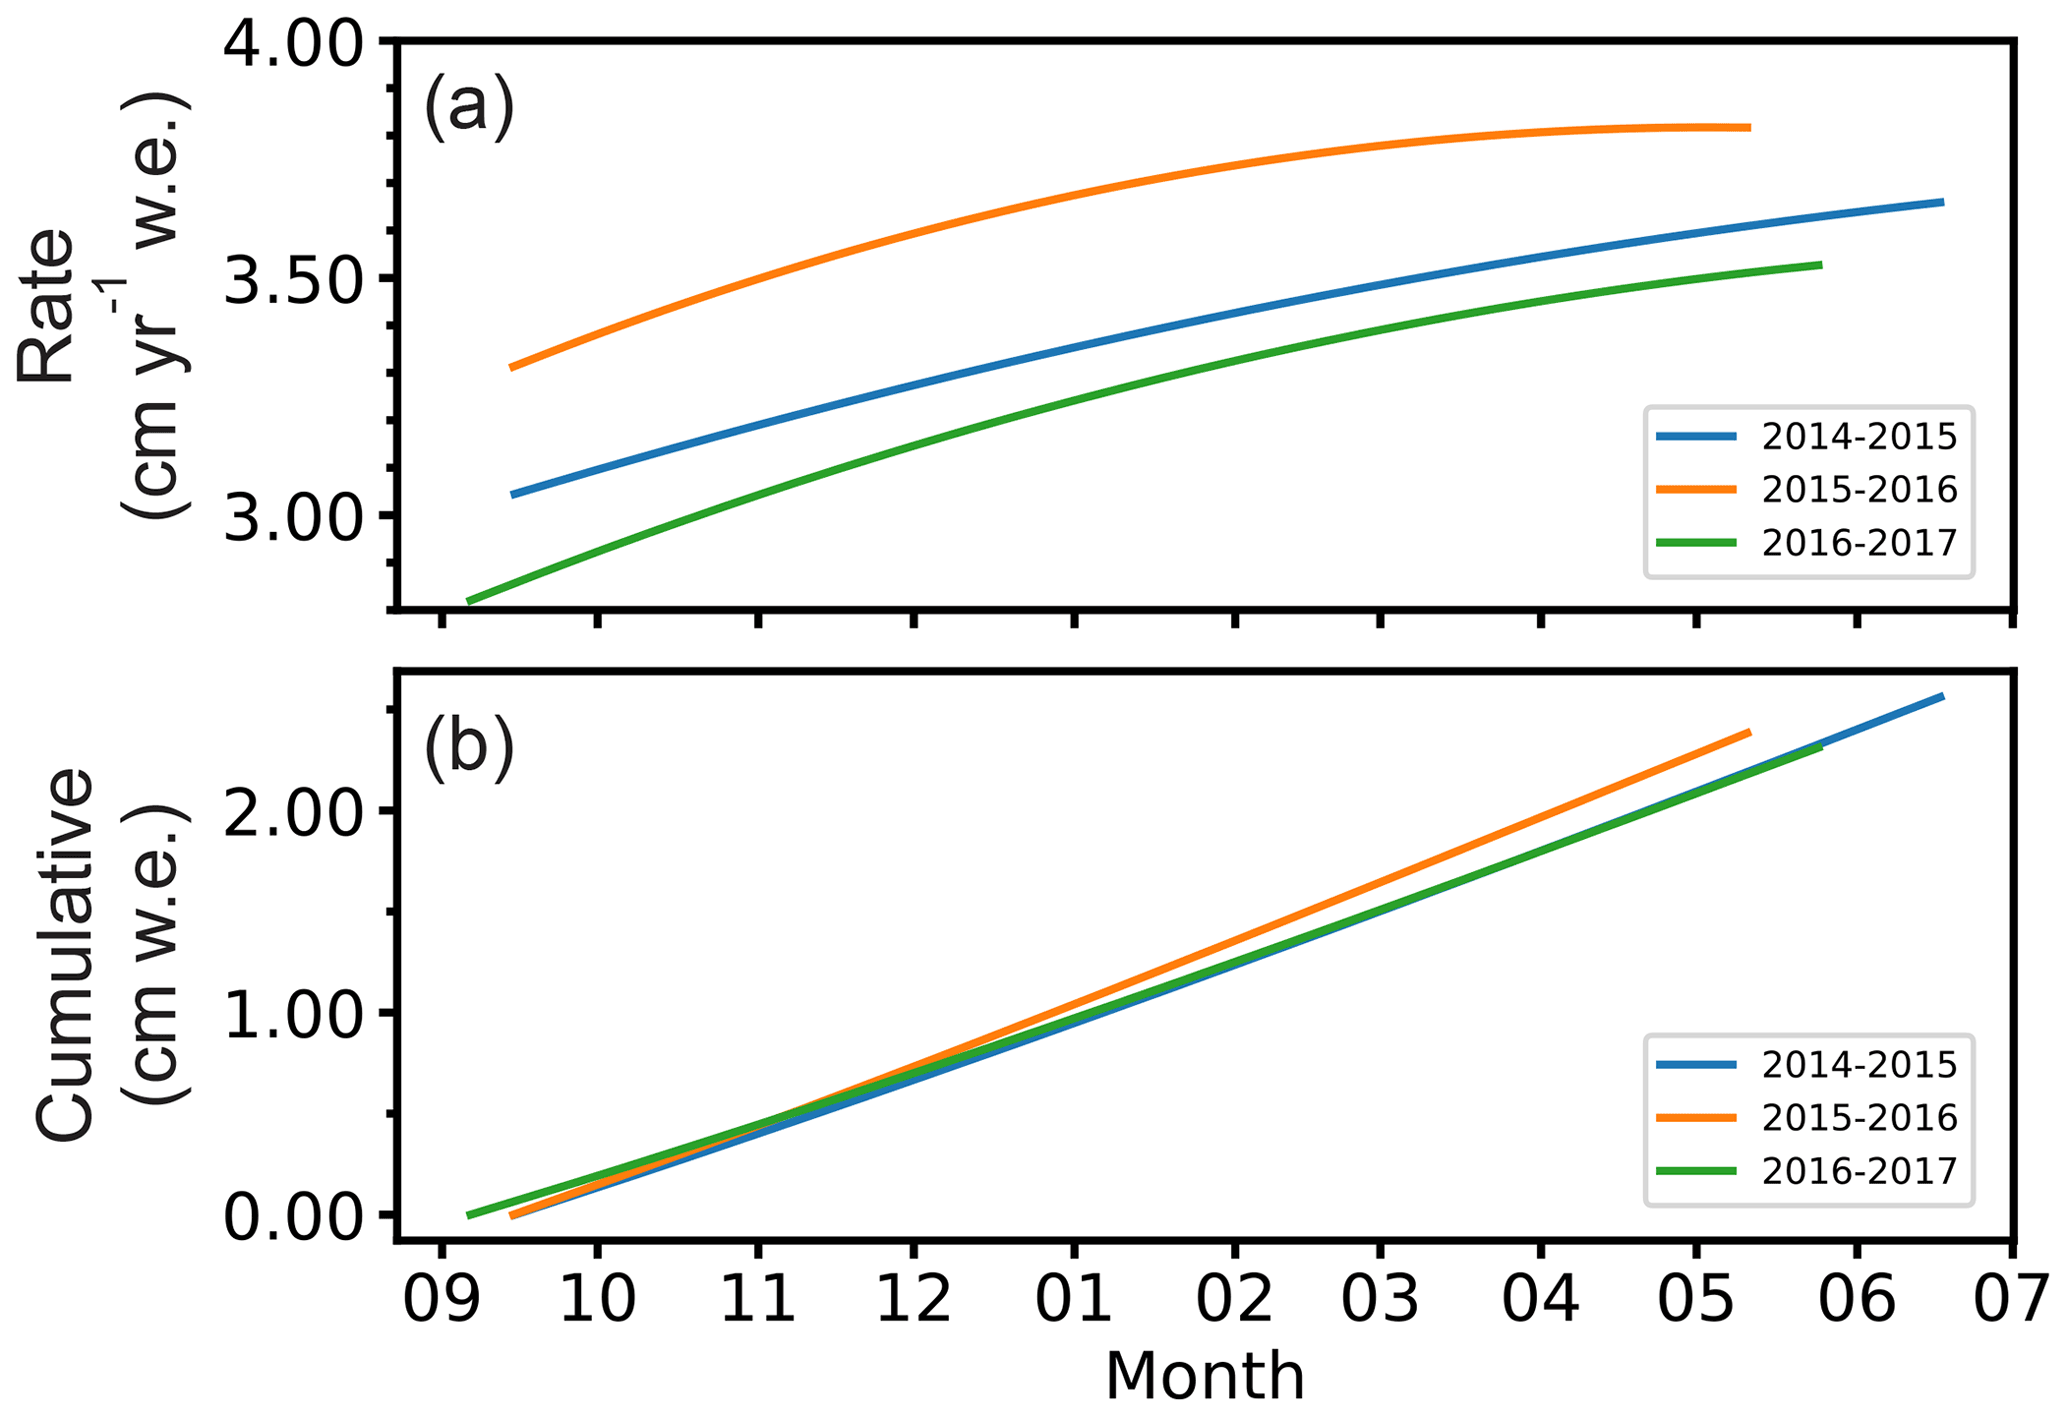
Figure 6Basal meltwater generation at the 33 km site: (a) instantaneous basal melt rate in water equivalent over the winter during 3 different years; (b) cumulative meltwater generation over the winter period during 3 years.
3.3 Basal meltwater production
The rate of basal meltwater generation at the 33 km site increases all winter, commensurate with the steadily increasing ice sliding speed (Fig. 6). Direct measurements of ice deformation revel negligible melting from strain heating (Maier et al., 2019). Whereas the geothermal heat flux for the region is estimated to be ∼27 mW m−2 (Meierbachtol et al., 2015), the frictional heat from sliding during winter is manyfold greater and calculated to be about 340 mW m−2. Consequently, the time series of meltwater generation largely mimics the ice speed series.
The basal meltwater generation during the 2016–2017 winter, the slowest of the three measured winter periods (Fig. 2), increases from 2.8 cm a−1 w.e. at the start to more than 3.5 cm a−1 w.e. by the end of winter (Fig. 6a), which is a 20 % increase over the period. The cumulative meltwater for the winter months reached 2.6, 2.4, and 2.3 cm w.e. during winters of 2014–2015, 2015–2016, and 2016–2017, respectively. Meltwater generation differs from year to year, stemming from the date of the winter onset and the initial starting speed. The instantaneous ice melt rate on any particular day of winter can vary by >10 % between years. However, the cumulative meltwater at any point in the winter is not particularly different between years since the winter is not long enough to cause much spread from the rate differences (Fig. 6b). Note that all above values represent an area average. In reality, some area of the ice is separated from the bed over basal water cavities, meaning that the thickness melted from ice remaining in contact with the bed is greater than this average. Furthermore, rates of basal ice melt can be expected to be up to 3 times greater during high-speed periods of summer.
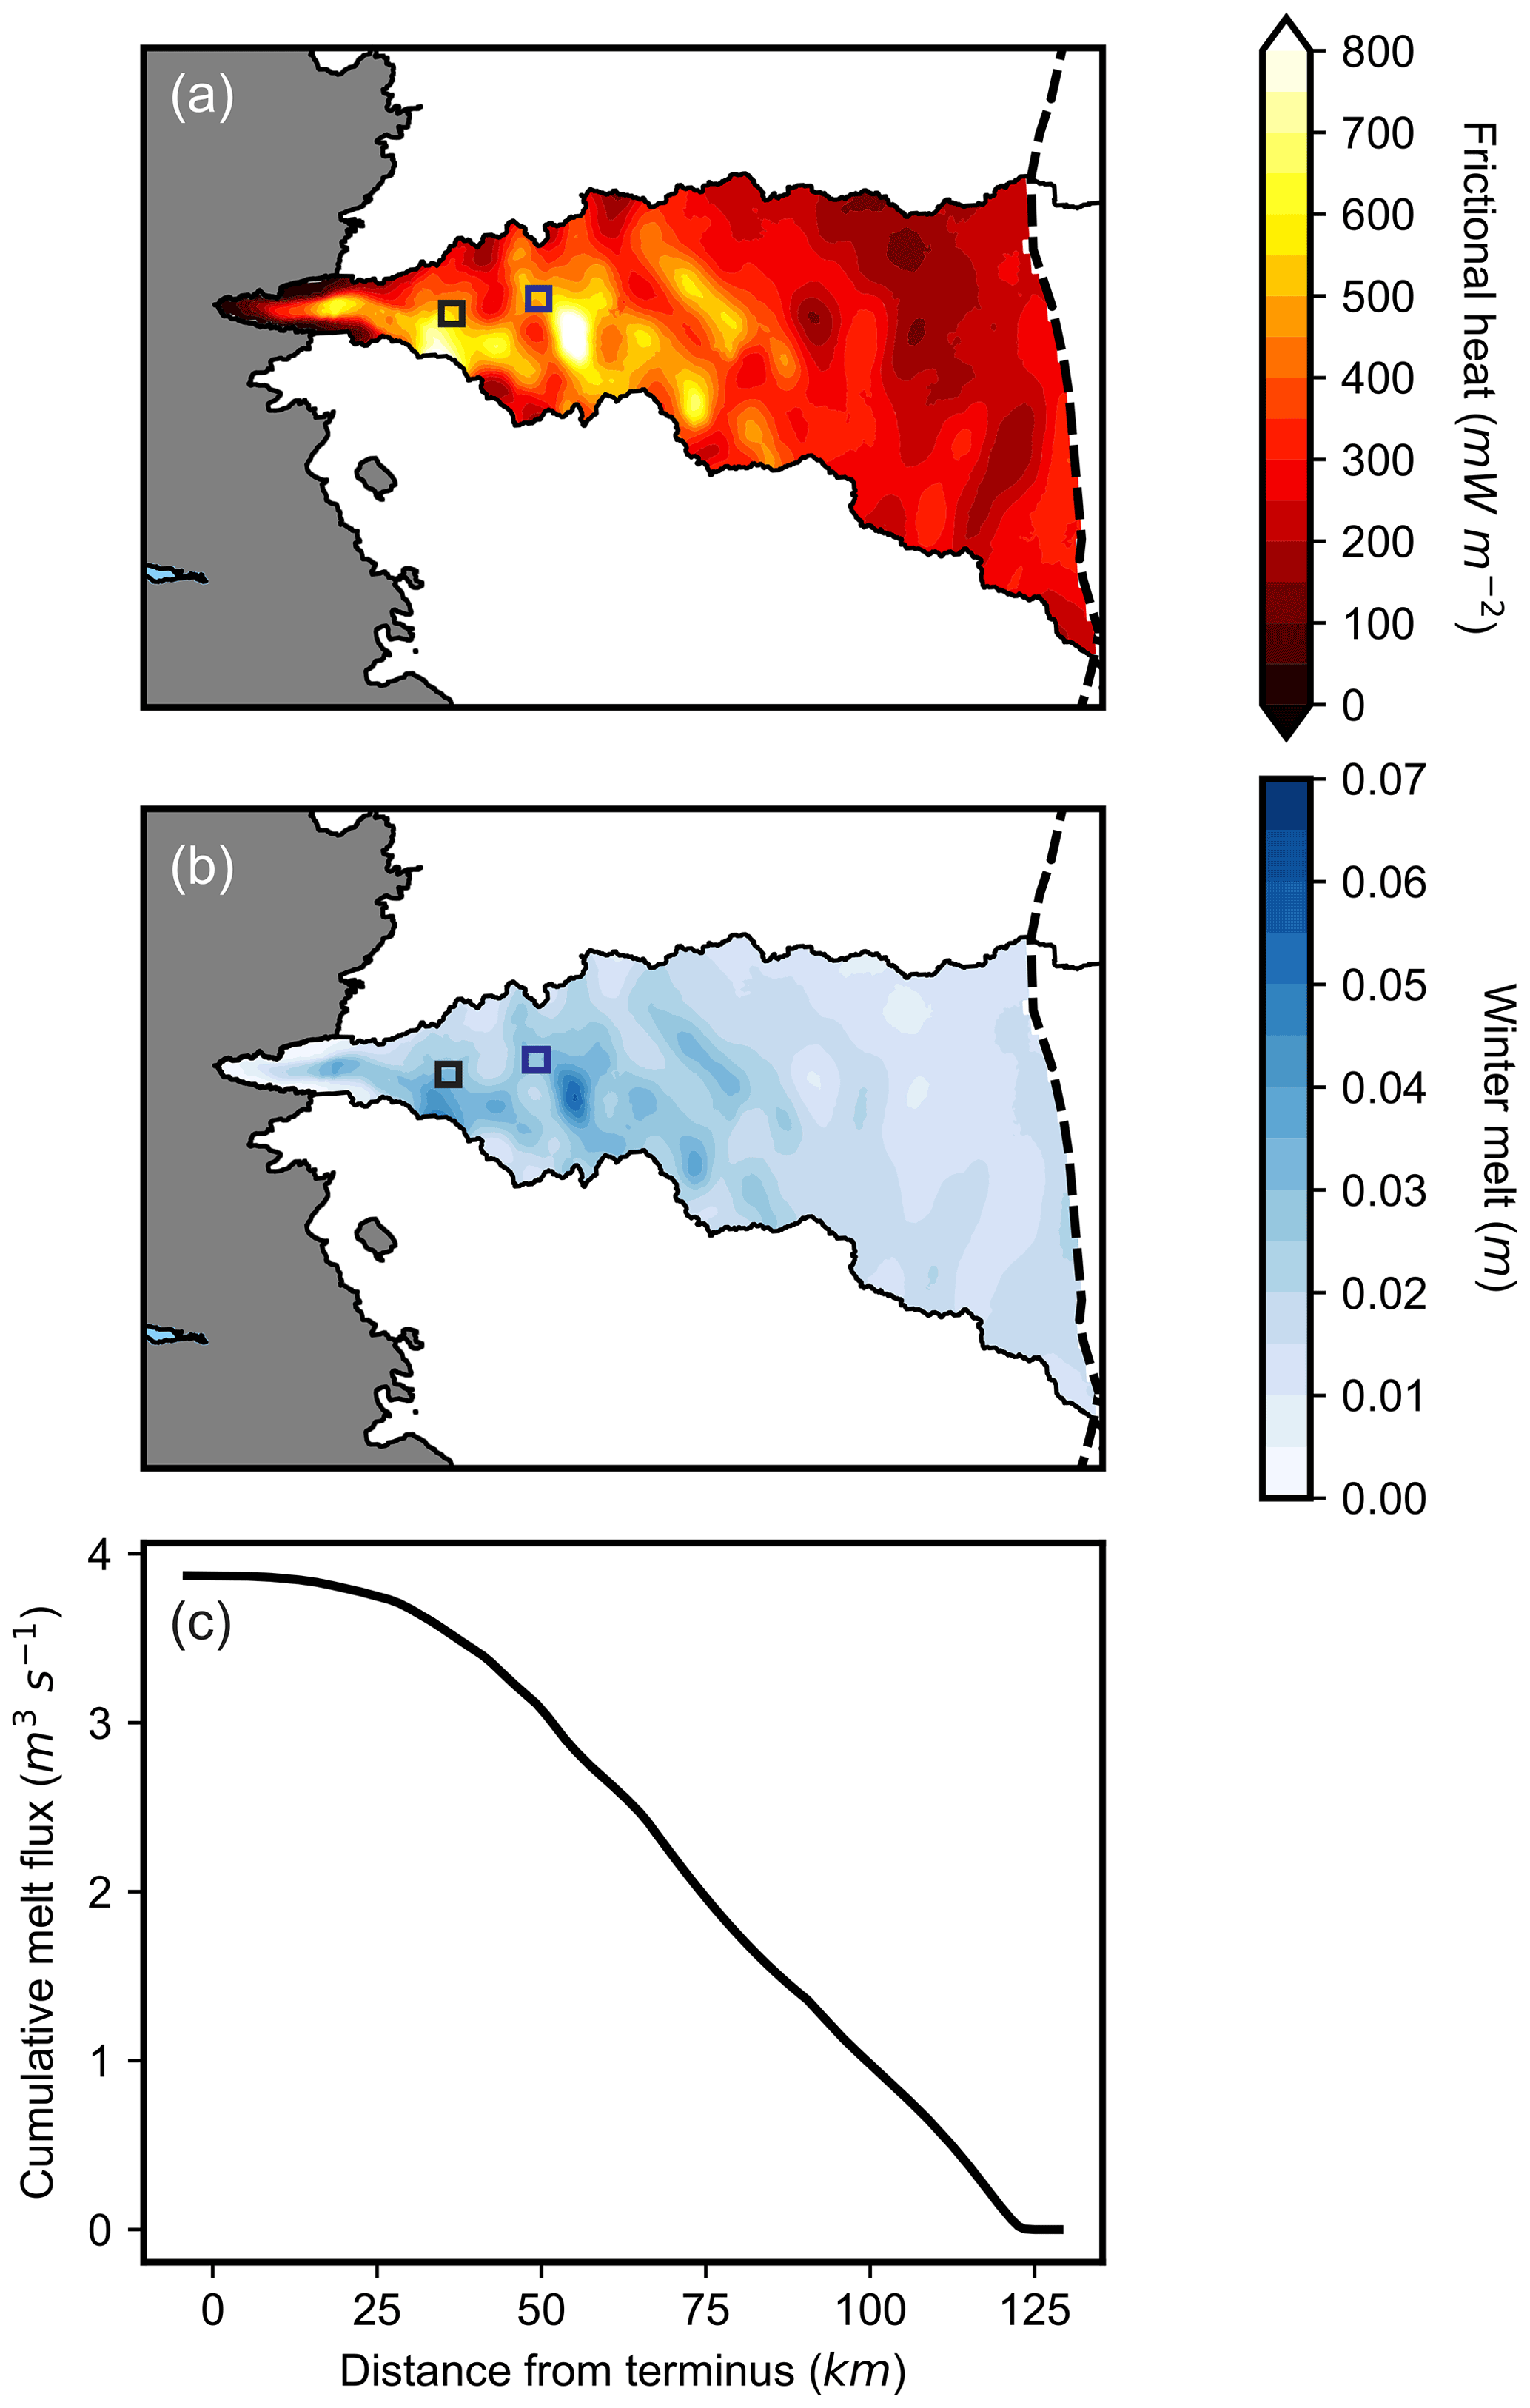
Figure 7Basal ice melt during winter 2017–2018 across the Isunnguata Sermia basin based on satellite velocity and model assumptions described in the text: (a) basal frictional heat rate averaged over the winter period (October through April); (b) total basal meltwater generated during the winter months; (c) top-to-bottom accumulation of basal meltwater generation rate averaged over the winter period. Basal meltwater is integrated as a function of inland distance, irrespective of potential routing pathways.
The highest rates of frictional heat from sliding and basal meltwater generation in the IS basin are concentrated around the 33 km site, the region experiencing the greatest acceleration in winter. Here, the flow speeds are relatively high and the basal shear stress is large due to comparatively steep surface slopes, so basal frictional heat is higher than elsewhere in the basin (Fig. 7a). Basal frictional heating in this region is >600 mW m−2 over areas that are tens of square kilometers. Frictional heating is far lower further inland, but still several times greater than the geothermal heat flux. The values calculated across the basin are likely upper limits because the fraction of motion attributable to sliding is not likely any higher than what we measured at the 33 km site.
The greatest frictional heat from sliding across the basin is sufficient to generate >5 cm of basal meltwater during the October–April winter period (Fig. 7b). The frictional heating from slower speeds further than about 75 km inland generates lower melt amounts of 1–2 cm per winter, but this part of the basin has a far greater area than closer to the margin. Averaged over October–April, the estimated melt integrated over the entire basin is equivalent to an instantaneous meltwater flux of 3.9 m3 s−1. The total volume of water generated from the IS basin over the 2017–2018 winter is calculated as 5.2×10⁷ m3. While the basal meltwater generation in some areas of the basin can increase over winter by 20 % (i.e., the accelerating region surrounding the 33 km site), the total meltwater from the basin mainly reflects the large inland area of the basin experiencing little to no winter acceleration (Fig. 4). Thus, neither the instantaneous rates nor winter totals should vary much from year to year.
The potential demand on a subglacial drainage system for exhausting meltwater generation is demonstrated by the accumulation of the melt rate from the top to bottom of the basin (Fig. 7c). Thus, if all basal melt is routed to the terminus, the accumulated values are the required flux of the drainage system with respect to position along the basin. Notably, values reach 3.0 m3 s−1 by >50 km inland from the margin and do not increase much over the last 25 km because the basin width narrows toward the terminus. Note that we have not accounted for any meltwater generated above the ELA, where sliding speeds are relatively slow but the bed is most likely at the melting point to an eventual boundary with frozen conditions (MacGregor et al., 2016). Furthermore, we have accumulated all basal meltwater, whereas some water may be routed into the groundwater system or stored locally in the ice or in the drainage system. We discuss these issues in Sect. 4.1.
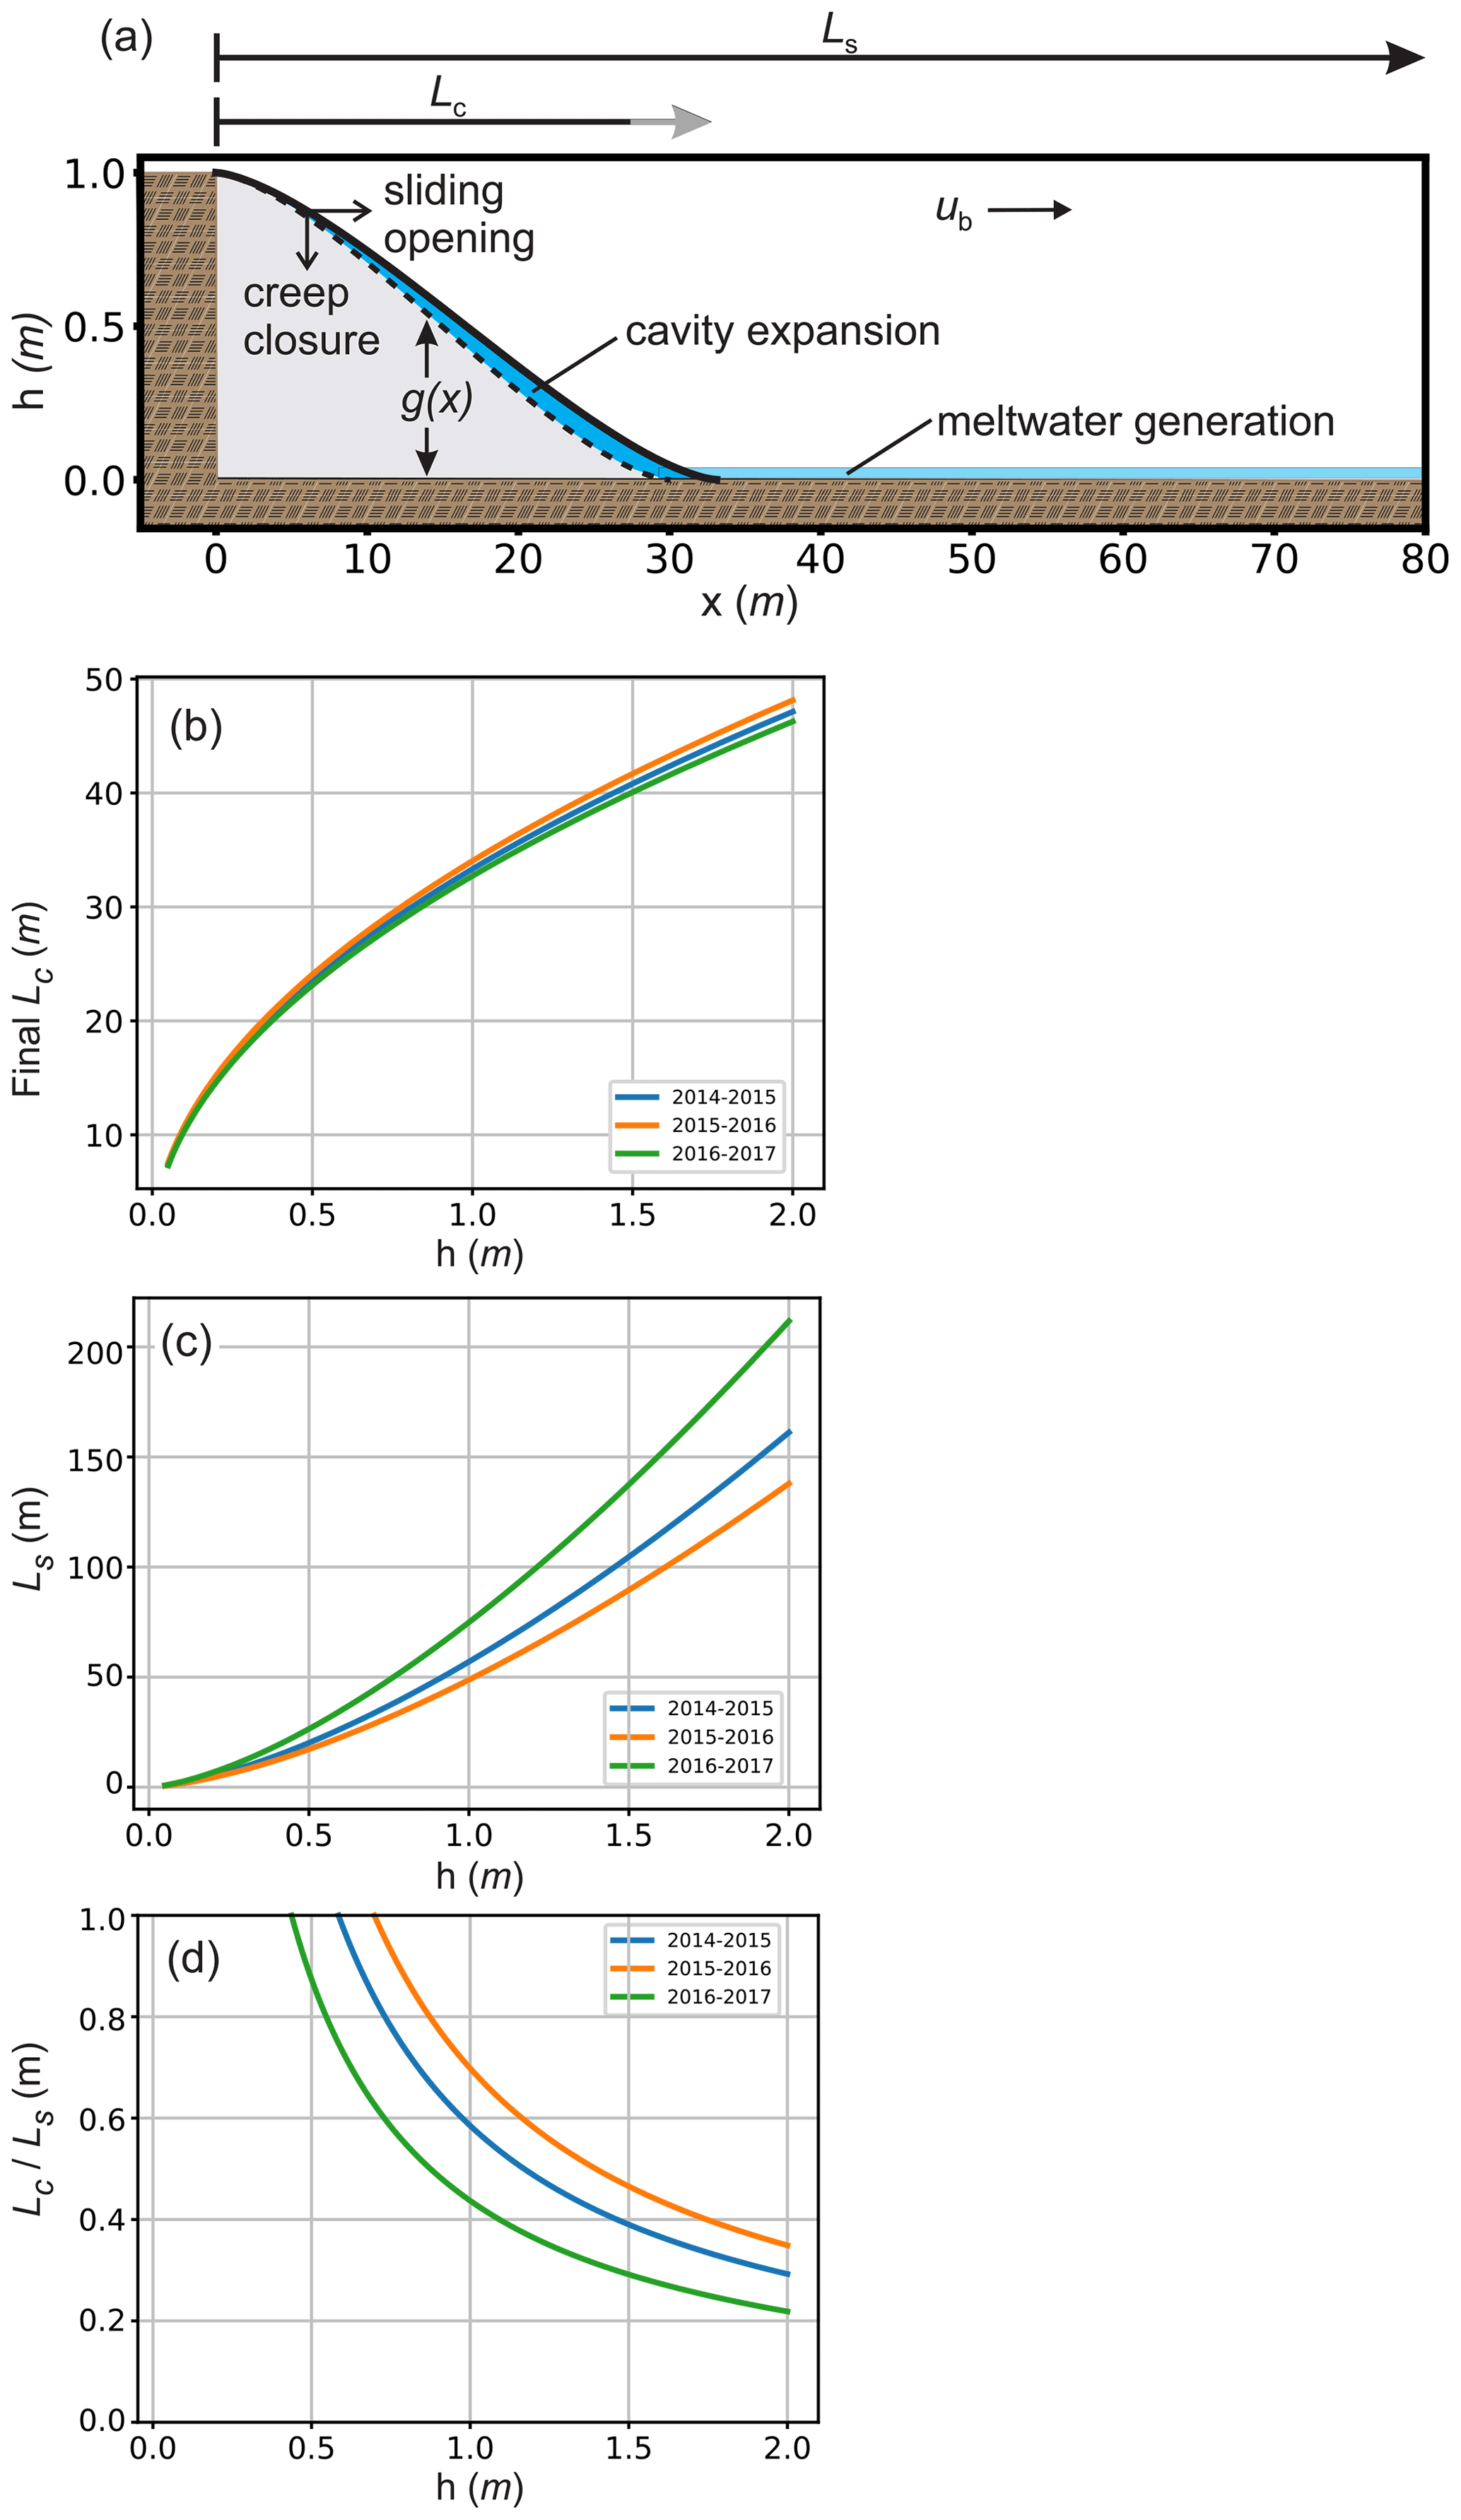
Figure 8Cavity geometries based on the Kamb (1987) stepped-bed analysis. (a) Bed and cavity geometry, showing cavity expansion as sliding speed increased over the 2016–2017 winter. Labels correspond to terms in Eqs. (2)–(4) in the text. Model results for three different winter periods show the stable cavity lengths required to balance sliding speed, meltwater generation, and cavity expansion under the assumption of isolated cavities. Plotted are results for a range of potential step heights: (b) final cavity length after the cavity has expanded to accommodate the meltwater generated over the winter period; (c) length of steps required to accommodate both the water cavity and the portion of the step in contact with ice; (d) ratio of cavity length to step length, which must be less than 1 because cavities cannot be longer than their steps.
3.4 Cavitation with water budget
Functional relationships between various geometric parameters of the stepped-cavity system can be derived from our observational constraints with the assumption that all generated melt is stored locally. Higher rises on bed steps generate basal water cavities that span longer distances across the bed, with cavities that are always extraordinarily long relative to their height (Fig. 8b). For example, a 1 m rise requires cavities that extend 32–34 m across the step. This predominantly reflects the high sensitivity of cavity geometry to the pervasive high basal water pressure we measure.
With cavities submerging a portion of the bed, the remaining portion of the step in contact with ice must accommodate the sliding friction (i.e., Eq. 4). Because our assumption requires a closed water budget, cavity expansion constrains this length: the water generated by ice melt on the bed surface must balance the water entering storage as cavities expand. This constrains the step length required to yield the basal melt that fills space opened by cavity expansion during winter acceleration (Fig. 8c). Steps any longer than this would yield more meltwater than the available cavity space, and shorter steps would not produce enough basal meltwater to fill the opening cavity. The results for 3 years with different speeds illustrate the strong sensitivity of the analysis to variations in sliding speed and winter acceleration. Calculations with data from all years, however, yield steps that are extraordinary long relative to their step heights.
Finally, we compare the length of cavities to the length of steps to limit the solution space to plausible geometric scenarios (albeit with the no-flux assumption). The ratio of cavity length to step length must be less than 1 because no cavity can be longer than the step it occupies. Depending on the year, the minimum step rise to produce cavities that can grow to sequester all the water produced by basal meltwater is 0.45 to 0.7 m (Fig. 8d). However, the lengths of cavities corresponding to reasonable steps are extremely long: for a 1 m step rise, the step length is 50–75 m and the cavity length is 33–34 m.
4.1 Accommodation of basal meltwater
Friction-derived meltwater is manyfold greater than the component of meltwater derived from geothermal heating due to the high fraction of motion from sliding in winter. Moreover, the rate of meltwater generation at borehole sites across the central region of the IS basin can increase by up to 20 % over the winter. The winter state of the basal drainage system must therefore accommodate and/or evacuate a water flux that is likely to be reasonably large when integrated over the basin and that increases over the ∼7-month duration of the winter.
Some meltwater is likely accommodated by the underlying groundwater system, although groundwater modeling of fractured bedrock conditions beneath the GrIS and similar ice sheet settings (Jaquet et al., 2019; Lemieux et al., 2008) suggests recharge rates of millimeters per year (mm a−1) rather than the centimeter per year (cm a−1) rates of meltwater production. Englacial storage space is also unlikely to have sufficient capacity for the water. To accommodate the water in the overlying ice mass, englacial storage space would need to open over time to match the continuous production of meltwater. However, the stored water would need to periodically drain to avoid continuous build-up of water so as to maintain the liquid water content in the temperate ice layer below a few percent (Brown et al., 2017). Further, our borehole transect reveals that the temperate layer at inland locations can be just a few meters thick (Harrington et al., 2015), which severely limits the potential for liquid water storage in basal ice (Downs et al., 2018).
The total water in storage and the geometry of cavities are a function of unknown bed roughness. Nevertheless, an increase in the storage space over the winter should occur due to cavity expansion as the ice flow accelerates (Iken, 1981). Our measured basal water pressures are continuously near overburden and sliding speeds approach 100 m a−1 during winter. Thus, Kamb's (1987) stepped-cavity system with a no-flow condition requires stable cavities to have large step heights and/or lengths (e.g., cavities many tens of meters long). Only these large-sized cavities can undergo sufficient expansion to accommodate the volume of basal meltwater generated. The large size, however, is unsupported by prior observations of cavities on a hard bed (e.g., Anderson et al., 1982; Walder and Hallet, 1979), which suggest water cavities are much smaller. Observations of a single cavity at our 33 km site using dye dilution techniques also indicate a far smaller cavity size with a volume of several cubic meters (Meierbachtol et al., 2016b). Furthermore, the large cavity size is radically inconsistent with bed geometries considered by subglacial hydrology models (e.g., Downs et al., 2018; Schoof, 2010; Werder et al., 2013).
A more realistic irregular bed would yield shorter cavities than the oversimplified stepped bed because the downstream side of cavities would terminate against any slight rise in the bed. Accommodation of new water though cavity growth would be even more restricted, so the Kamb (1987) stepped-bed analysis represents the upper end of potential cavity storage of the water generated by basal melting. Hence, the scenario that all basal meltwater is accommodated by opening isolated cavities appears to be untenable. The challenges of attributing all winter meltwater generation to local sinks in ice, substrate, or expansion of water cavities, therefore imply connectivity in the subglacial drainage system during winter.
Assuming water flow through a winter mode of the subglacial drainage system, the basal meltwater in excess to that accommodated by cavity expansion will migrate down hydraulic potential from around the basin. Minor meltwater fluxes should be routed locally through an orifice-connected cavity network (Kamb, 1987). Some water may ultimately be stored in sediment-filled basins or as lakes in depressions since the water pressure is high everywhere we observe. Airborne radar reflectivity suggests widespread basal water storage during the winter along the non-trough areas of the IS basin (Chu et al., 2016), but the time evolution of the water storage is unclear. Storing all basal meltwater in large subglacial features requires the sinks to expand to accommodate continuous (and increasing) water flux and to periodically drain.
Alternatively, water emerging from the IS basin outlet has been observed in winter, although it was attributed to release of stored water with no consideration of water flux due to basal ice melt (Pitcher et al., 2020). Basal melt rates are sufficiently high that the water accumulating along hydraulic potential lows as it migrates toward the margin could reach discharges on the order of a few meters per second (m3 s−1) (Fig. 7). For example, if all basal meltwater from the IS basin were routed to the terminus outlet, the mean winter discharge at the outlet would be about >3 m3 s−1. Discharge of this magnitude, if focused into a single pathway or small number of pathways (connected cavity network), has the potential to support some degree of persistent channelization (Hewitt, 2011; Meierbachtol et al., 2013). Thus, overwintering of one or more basal meltwater channels in favored locations is quite plausible, although flux limitations demand they are rare.
4.2 Implications for acceleration in winter
Ice sheet acceleration can result from an increase in driving stress and/or a decrease in basal traction. We see no way to link our observations of winter acceleration to a steady increase in driving stress because the speed-up is widespread and irrespective of ice thickness gradients. Earlier works have appealed to pressurization of the basal drainage system over the course of winter as a means for decreasing basal traction, manifested conceptually through either isolation of cavities as the drainage system shuts down (e.g., Fitzpatrick et al., 2013) or widespread re-pressurization of the bed in response to closure of low-pressure channels (e.g., Sole et al., 2013). Our observations suggest that pressurization occurs over a few weeks in autumn (Figs. 3 and 5), but then with no monotonic increase in the basal water pressure over the winter period (Fig. 5), a finding in agreement with observations from elsewhere in Greenland (Ryser et al., 2014a). Existing observational data are therefore at odds with attributing the steady winter ice flow acceleration to rising basal water pressure.
Ice acceleration during winter, however, implies cavity expansion (Iken, 1981) and the transfer of load to unsubmerged bedrock, albeit on a cavity network with some connected water flux. This leads to the question of whether a steady cavity opening resulting from basal meltwater generation drives the steady winter acceleration of ice flow. Water evacuation through a poorly connected drainage system would modulate the acceleration and maintain the constant high pressure. Such processes should be annually repeatable, but will vary from place to place due to basal sediment cover and roughness. Indeed, the strongly accelerating region of the basin has a hard bed where we have drilled boreholes (Harper et al., 2017), whereas the bed has been determined to be sediment-covered at discrete sites both further inland (Booth et al., 2012; Kulessa et al., 2017) and closer to the margin (Dow et al., 2013). The nature of the bed over large areas of the basin remains unknown.
Surface and borehole measurements at an instrumented site in the Isunnguata Sermia basin constrain estimates of basal meltwater generation and subglacial hydrological conditions over the winter period. Despite relatively slow surface speeds during winter, basal ice melt from sliding friction is many times that resulting from geothermal heat flux. At our drilling site 33 km from the ice margin, enough heat at the bed is available to generate ∼2.5 cm of water equivalent during the winter period, although amounts differ slightly from year to year due to variable dates of the winter onset and initial winter speeds. We observe a slow and steady acceleration during winter, similar to reports from elsewhere on the Greenland Ice Sheet. As a consequence, the instantaneous melt rate on any given day of winter can vary by >10 % between years. Further, an acceleration of ice flow over the winter can increase the instantaneous melt rate by 20 % from the start to end of winter.
Borehole measurements show steady and high basal water pressure during winter. Ice and groundwater sinks do not likely have sufficient capacity to accommodate the basal meltwater generated during winter where rates are high. Cavity opening associated with ice acceleration accommodates some meltwater, but a residual is likely routed through a connected drainage system and discharged to the terminus. The winter acceleration is thus associated with opening of water cavities, but in a connected and high-pressure system. This state of the winter drainage system sets the initial conditions for the onset of spring drainage evolution and speed-up.
Variations in driving stress and winter speed across the basin drive a spatial pattern of basal meltwater generation. Assuming the sliding rates we measure at our field site persist over the basin, the greatest melt rates are concentrated ∼30 to 50 km inland from the terminus during the 2017–2018 winter, which is a region that also experienced a measurable acceleration during winter. The water generated from the IS basin over the winter is calculated to be 5.2×10⁷ m3, or 3.9 m3 s−1 averaged over the winter. Despite our measurements of significant time variability across a broad reach of the basin, the basin totals mainly reflect the large area experiencing comparatively low basal melt rates and having little to no winter acceleration. Thus, if all meltwater from basal ice melt across the basin is routed to the terminus outlet, we expect the total discharge there due to basal ice melt not to increase much over winter or vary much from year to year. Substantial time variability, if present, would likely reflect release of stored water.
Data used to generate this paper are available for download from the Arctic Data Science Center: basal water pressures (https://doi.org/10.18739/A2VQ2SB3C, Meierbachtol, 2017); GPS surface velocity data (https://doi.org/10.18739/A2154DP90, Maier, 2019); and meteorological data (https://doi.org/10.18739/A2QV3C418, Hills, 2018).
JH and TM conceived of the work. NH, JS, and AS assisted with data collection and analysis. All authors contributed to paper preparation.
The contact author has declared that neither they nor their co-authors have any competing interests.
Publisher's note: Copernicus Publications remains neutral with regard to jurisdictional claims in published maps and institutional affiliations.
We thank Samuel Doyle and Martin Lüthi for detailed and helpful reviews of this paper.
This project was funded by the NSF Office of Polar Programs – Arctic Natural Sciences (award nos. 1203451 and 0909495) and the Svensk Kärnbränslehantering AB/Canadian Nuclear Waste Management Organization (Catchnet project).
This paper was edited by Adam Booth and reviewed by Martin Lüthi and Samuel Doyle.
Abe, T. and Furuya, M.: Winter speed-up of quiescent surge-type glaciers in Yukon, Canada, The Cryosphere, 9, 1183–1190, https://doi.org/10.5194/tc-9-1183-2015, 2015.
Anderson, R. S., Hallet, B., Walder, J., and Aubry, B. F.: Observations in a cavity beneath Grinnell Glacier, Earth Surf. Process. Landf., 7, 63–70, https://doi.org/10.1002/esp.3290070108, 1982.
Andrews, L. C., Catania, G. A., Hoffman, M. J., Gulley, J. D., Lüthi, M. P., Ryser, C., Hawley, R. L., and Neumann, T. A.: Direct observations of evolving subglacial drainage beneath the Greenland Ice Sheet, Nature, 514, 80–83, https://doi.org/10.1038/nature13796, 2014.
Booth, A. D., Clark, R. A., Kulessa, B., Murray, T., Carter, J., Doyle, S., and Hubbard, A.: Thin-layer effects in glaciological seismic amplitude-versus-angle (AVA) analysis: implications for characterising a subglacial till unit, Russell Glacier, West Greenland, The Cryosphere, 6, 909–922, https://doi.org/10.5194/tc-6-909-2012, 2012.
Brinkerhoff, D. J., Meierbachtol, T. W., Johnson, J. V., and Harper, J. T.: Sensitivity of the frozen-melted basal boundary to perturbations of basal traction and geothermal heat flux: Isunnguata Sermia, western Greenland, Ann. Glaciol., 52, 43–50, 2011.
Brown, J., Harper, J., and Humphrey, N.: Liquid water content in ice estimated through a full-depth ground radar profile and borehole measurements in western Greenland, The Cryosphere, 11, 669–679, https://doi.org/10.5194/tc-11-669-2017, 2017.
Chu, W., Schroeder, D. M., Seroussi, H., Creyts, T. T., Palmer, S. J., and Bell, R. E.: Extensive winter subglacial water storage beneath the Greenland Ice Sheet, Geophys. Res. Lett., 43, 12484–12492, https://doi.org/10.1002/2016GL071538, 2016.
Cuffey, K. M. and Paterson, W. S. B.: The physics of glaciers, 4th edn., Elsevier, Oxford, 2010.
Derkacheva, A., Mouginot, J., Millan, R., Maier, N., and Gillet-Chaulet, F.: Data reduction using statistical and regression approaches for ice velocity derived by Landsat-8, Sentinel-1 and Sentinel-2, Remote Sens., 2020, 1935, https://doi.org/10.3390/rs12121935, 2020.
Dow, C. F., Hubbard, A., Booth, A. D., Doyle, S. H., Gusmeroli, A., and Kulessa, B.: Seismic evidence of mechanically weak sediments underlying Russell Glacier, West Greenland, Ann. Glaciol., 54, 135–141, https://doi.org/10.3189/2013AoG64A032, 2013.
Downs, J. Z., Johnson, J. V., Harper, J. T., Meierbachtol, T., and Werder, M. A.: Dynamic hydraulic conductivity reconciles mismatch between modeled and observed winter subglacial water pressure, J. Geophys. Res.-Earth Surf., 123, 818–836, https://doi.org/10.1002/2017JF004522, 2018.
Fitzpatrick, A. A. W., Hubbard, A., Joughin, I., Quincey, D. J., Van As, D., Mikkelsen, A. P. B., Doyle, S. H., Hasholt, B., and Jones, G. A.: Ice flow dynamics and surface meltwater flux at a land-terminating sector of the Greenland ice sheet, J. Glaciol., 59, 687–696, https://doi.org/10.3189/2013JoG12J143, 2013.
GRASS Development Team: Geographic Resources Analysis Support System (GRASS), available at: https://grass.osgeo.org (last access: 14 April 2021), 2020.
Harper, J. T., Humphrey, N. F., Meierbachtol, T. W., Graly, J. A., and Fischer, U. H.: Borehole measurements indicate hard bed conditions, Kangerlussuaq sector, western Greenland Ice Sheet, J. Geophys. Res.-Earth Surf., 122, 1–14, https://doi.org/10.1002/2017JF004201, 2017.
Harrington, J. A., Humphrey, N. F., and Harper, J. T.: Temperature distribution and thermal anomalies along a flowline of the Greenland Ice Sheet, Ann. Glaciol., 56, 98–104, https://doi.org/10.3189/2015AoG70A945, 2015.
Herring, T., King, R., and McClusky, S.: GAMIT/GLOBK Reference Manuals, Release 10.4, Massachusetts Institute of Technology, Cambridge, MA, USA, 2010.
Hewitt, I. J.: Modelling distributed and channelized subglacial drainage: The spacing of channels, J. Glaciol., 57, 302–314, https://doi.org/10.3189/002214311796405951, 2011.
Hills, B.: Near-surface ice temperature measurements from Western Greenland, 2011–2017, Arctic Data Center [data set], https://doi.org/10.18739/A2QV3C418, 2018.
Hills, B. H., Harper, J. T., Humphrey, N. F., and Meierbachtol, T. W.: Measured horizontal temperature gradients constrain heat transfer mechanisms in Greenland ice, Geophys. Res. Lett., 44, 9778–9785, https://doi.org/10.1002/2017GL074917, 2017.
Hills, B. H., Harper, J. T., Meierbachtol, T. W., Johnson, J. V., Humphrey, N. F., and Wright, P. J.: Processes influencing heat transfer in the near-surface ice of Greenland's ablation zone, The Cryosphere, 12, 3215–3227, https://doi.org/10.5194/tc-12-3215-2018, 2018.
Iken, A.: The effect of the subglacial water pressure on the sliding velocity of a glacier in an idealized numerical model, J. Glaciol., 27, 407–421, https://doi.org/10.1017/S0022143000011448, 1981.
Iken, A. and Truffer, M.: The relationship between subglacial water pressure and velocity of Findelengletscher, Switzerland, during its advance and retreat, J. Glaciol., 43, 328–338, 1997.
Jaquet, O., Namar, R., Siegel, P., Harper, J., and Jansson, P.: Groundwater flow modelling under transient ice sheet – conditions in Greenland, Swedish Nucl. Fuel Waste Manag. Organ., SKB R-19-1, 1–123, 2019.
Joughin, I., Das, S. B., King, M. A., Smith, B. E., and Howat, I. M.: Seasonal speedup along the flank of the Greenland Ice Sheet, Science, 320, 781–783, https://doi.org/10.1126/science.1153288, 2008.
Joughin, I., Smith, B. E., Howat, I. M., Scambos, T., and Moon, T.: Greenland flow variability from ice-sheet-wide velocity mapping, J. Glaciol., 56, 415–430, https://doi.org/10.3189/002214310792447734, 2010.
Joughin, I., Smith, B. E., and Howat, I.: Greenland Ice Mapping Project: ice flow velocity variation at sub-monthly to decadal timescales, The Cryosphere, 12, 2211–2227, https://doi.org/10.5194/tc-12-2211-2018, 2018a.
Joughin, I., Smith, B., Howat, I., and Scambos, T.: MEaSUREs Greenland Ice Sheet velocity map from InSAR data, Version 2, User Manual, National Snow and Ice Data Center (NSIDC), https://doi.org/10.5067/OC7B04ZM9G6Q, 2018b.
Kamb, B.: Glacier surge mechanism based on linked cavity configuration of the basal water conduit system, J. Geophys. Res., 92, 9083–9100, 1987.
Kamb, B. and Echelmeyer, K.: Stress-gradient coupling in glacier flow: 1. Longitudinal averaging of the influence of ice thickness and surface slope, J. Glaciol., 32, 267–284, 1986.
Kulessa, B., Hubbard, A. L., Booth, A. D., Bougamont, M., Dow, C. F., Doyle, S. H., Christoffersen, P., Lindbäck, K., Pettersson, R., Fitzpatrick, A. A. W., and Jones, G. A.: Seismic evidence for complex sedimentary control of Greenland Ice Sheet flow, Sci. Adv., 3, 1–9, https://doi.org/10.1126/sciadv.1603071, 2017.
Lemieux, J. M., Sudicky, E. A., Peltier, W. R., and Tarasov, L.: Dynamics of groundwater recharge and seepage over the Canadian landscape during the Wisconsinian glaciation, J. Geophys. Res.-Earth Surf., 113, 1–18, https://doi.org/10.1029/2007JF000838, 2008.
Lüthi, M., Funk, M., Iken, A., Gogineni, S., and Truffer, M.: Mechanisms of fast flow in Jakobshavn Isbræ, West Greenland: Part III. Measurements of ice deformation, temperature and cross-borehole conductivity in boreholes to the bedrock, J. Glaciol., 48, 369–385, https://doi.org/10.3189/172756502781831322, 2002.
MacGregor, J. A., Fahnestock, M. A., Catania, G. A., Aschwanden, A., Clow, G. D., Colgan, W. T., Gogineni, S. P., Morlighem, M., Nowicki, S. M. J., Paden, J. D., Price, S. F., and Seroussi, H.: A synthesis of the basal thermal state of the Greenland Ice Sheet, J. Geophys. Res.-Earth Surf., 121, 1328–1350, https://doi.org/10.1002/2015JF003803, 2016.
Maier, N.: Global Positioning System (GPS) positions and in situ ice deformation from borehole inclinometry measurements in Western Greenland, winter 2015–16, Arctic Data Center [data set], https://doi.org/10.18739/A2154DP90, 2019.
Maier, N., Humphrey, N., Harper, J., Meierbachtol. T., and Meierbachtol, T.: Sliding dominates slow-flowing margin regions, Greenland Ice Sheet, Sci. Adv., 5, eaaw5406, https://doi.org/10.1126/sciadv.aaw5406, 2019.
Meierbachtol, T.: Basal water pressure measured in boreholes drilled to the bed of Western Greenland: 2014–2017, Arctic Data Center [data set], https://doi.org/10.18739/A2VQ2SB3C, 2017.
Meierbachtol, T., Harper, J., and Humphrey, N.: Basal drainage system response to increasing surface melt on the Greenland Ice Sheet, Science, 341, 777–779, https://doi.org/10.1126/science.1235905, 2013.
Meierbachtol, T., Harper, J., Johnson, J., Humphrey, N., and Brinkerhoff, D.: Thermal boundary conditions on western Greenland: Observational constraints and impacts on the modeled thermomechanical state, J. Geophys. Res.-Earth Surf., 120, 623–636, https://doi.org/10.1002/2014JF003375, 2015.
Meierbachtol, T., Harper, J. T., Humphrey, N. F., and Wright, P.: Mechanical forcing on water pressure in a hydrologically isolated reach beneath Western Greenland's ablation zone, Ann. Glaciol., 57, 1–9, https://doi.org/10.1017/aog.2016.5, 2016a.
Meierbachtol, T., Harper, J., and Johnson, J.: Force balance along isunnguata Sermia, west Greenland, Front. Earth Sci., 4, 1–9, https://doi.org/10.3389/feart.2016.00087, 2016b.
Moon, T., Joughin, I., Smith, B., Van Den Broeke, M. R., Van De Berg, W. J., Noël, B., and Usher, M.: Distinct patterns of seasonal Greenland glacier velocity, Geophys. Res. Lett., 41, 7209–7216, https://doi.org/10.1002/2014GL061836, 2014.
Morlighem, M., Williams, C. N., Rignot, E., An, L., Arndt, J. E., Bamber, J. L., Catania, G., Chauché, N., Dowdeswell, J. A., Dorschel, B., Fenty, I., Hogan, K., Howat, I., Hubbard, A., Jakobsson, M., Jordan, T. M., Kjeldsen, K. K., Millan, R., Mayer, L., Mouginot, J., Noël, B. P. Y., O'Cofaigh, C., Palmer, S., Rysgaard, S., Seroussi, H., Siegert, M. J., Slabon, P., Straneo, F., van den Broeke, M. R., Weinrebe, W., Wood, M., and Zinglersen, K. B.: BedMachine v3: Complete bed topography and ocean bathymetry mapping of Greenland from multibeam echo sounding combined with mass conservation, Geophys. Res. Lett., 44, 11051–11061, https://doi.org/10.1002/2017GL074954, 2017.
Noël, B., van de Berg, W. J., van Wessem, J. M., van Meijgaard, E., van As, D., Lenaerts, J. T. M., Lhermitte, S., Kuipers Munneke, P., Smeets, C. J. P. P., van Ulft, L. H., van de Wal, R. S. W., and van den Broeke, M. R.: Modelling the climate and surface mass balance of polar ice sheets using RACMO2 – Part 1: Greenland (1958–2016), The Cryosphere, 12, 811–831, https://doi.org/10.5194/tc-12-811-2018, 2018.
Pitcher, L. H., Smith, L. C., Gleason, C. J., Miège, C., Ryan, J. C., Hagedorn, B., van As, D., Chu, W., and Forster, R. R.: Direct Observation of Winter Meltwater Drainage From the Greenland Ice Sheet, Geophys. Res. Lett., 47, 1–10, https://doi.org/10.1029/2019GL086521, 2020.
Ryser, C., Lüthi, M. P., Andrews, L. C., Catania, G. A., Funk, M., Hawley, R., Hoffman, M., and Neumann, T. A.: Caterpillar-like ice motion in the ablation zone of the Greenland ice sheet, J. Geophys. Res.-Earth Surf., 119, 2258–2271, https://doi.org/10.1002/2013JF003067, 2014a.
Ryser, C., Lüthi, M. P., Andrews, L. C., Hoffman, M. J., Catania, G. A., Hawley, R. L., Neumann, T. A., and Kristensen, S. S.: Sustained high basal motion of the Greenland ice sheet revealed by borehole deformation, J. Glaciol., 60, 647–660, https://doi.org/10.3189/2014JoG13J196, 2014b.
Schoof, C.: Ice-sheet acceleration driven by melt supply variability, Nature, 468, 803–806, https://doi.org/10.1038/nature09618, 2010.
Shepherd, A., Hubbard, A., Nienow, P., King, M., McMillan, M., and Joughin, I.: Greenland ice sheet motion coupled with daily melting in late summer, Geophys. Res. Lett., 36, L01501, https://doi.org/10.1029/2008GL035758, 2009.
Sole, A., Nienow, P., Bartholomew, I., Mair, D., Cowton, T., Tedstone, A., and King, M. A.: Winter motion mediates dynamic response of the Greenland Ice Sheet to warmer summers, Geophys. Res. Lett., 40, 3940–3944, https://doi.org/10.1002/grl.50764, 2013.
Stevens, L. A., Behn, M. D., Das, S. B., Joughin, I., Noël, B. P. Y., van den Broeke, M. R., and Herring, T.: Greenland Ice Sheet flow response to runoff variability, Geophys. Res. Lett., 43, 11295–11303, https://doi.org/10.1002/2016GL070414, 2016.
van de Wal, R. S. W., Boot, W., van den Broeke, M. R., Smeets, C. J. P. P., Reijmer, C. H., Donker, J. J. A., and Oerlemans, J.: Large and rapid melt-induced velocity changes in the ablation zone of the Greenland Ice Sheet, Science, 321, 111–113, https://doi.org/10.1126/science.1158540, 2008.
van de Wal, R. S. W., Smeets, C. J. P. P., Boot, W., Stoffelen, M., van Kampen, R., Doyle, S. H., Wilhelms, F., van den Broeke, M. R., Reijmer, C. H., Oerlemans, J., and Hubbard, A.: Self-regulation of ice flow varies across the ablation area in south-west Greenland, The Cryosphere, 9, 603–611, https://doi.org/10.5194/tc-9-603-2015, 2015.
Walder, J. and Hallet, B.: Geometry of former subglacial water channels and cavities, J. Glaciol., 23, 335–346, 1979.
Werder, M. A., Hewitt, I. J., Schoof, C. G., and Flowers, G. E.: Modeling channelized and distributed subglacial drainage in two dimensions, J. Geophys. Res.-Earth Surf., 118, 2140–2158, https://doi.org/10.1002/jgrf.20146, 2013.
Wright, P., Harper, J., Humphrey, N., and Meierbachtol, T.: Measured basal water pressure variability of the western Greenland Ice Sheet: Implications for hydraulic potential, J. Geophys. Res.-Earth Surf., 121, 1134–1147, https://doi.org/10.1002/2016JF003819, 2016.
Zoet, L. K. and Iverson, N. R.: Experimental determination of a double-valued drag relationship for glacier sliding, J. Glaciol., 61, 1–7, https://doi.org/10.3189/2015JoG14J174, 2015.
Zwally, H. J., Abdalati, W., Herring, T., Larson, K., Saba, J., and Steffen, K.: Surface Melt – Induced Acceleration of Greenland Ice-Sheet Flow, Science, 297, 218–222, 2002.