the Creative Commons Attribution 4.0 License.
the Creative Commons Attribution 4.0 License.
 | 25 Nov 2021
Seasonal evolution of Antarctic supraglacial lakes in 2015–2021 and links to environmental controls
Mariel C. Dirscherl
Andreas J. Dietz
Claudia Kuenzer
Supraglacial meltwater accumulation on ice shelves may have important implications for future sea level rise. Despite recent progress in the understanding of Antarctic surface hydrology, potential influences on ice shelf stability as well as links to environmental drivers remain poorly constrained. In this study, we employ state-of-the-art machine learning on Sentinel-1 synthetic aperture radar (SAR) and optical Sentinel-2 satellite imagery to provide new insight into the inter-annual and intra-annual evolution of surface hydrological features across six major Antarctic Peninsula and East Antarctic ice shelves. For the first time, we produce a high-resolution record of supraglacial lake extent dynamics for the period 2015–2021 at unprecedented 10 m spatial resolution and bi-weekly temporal scale. Through synergetic use of optical and SAR data, we obtain a more complete mapping record also enabling the delineation of buried lakes. Our results for Antarctic Peninsula ice shelves reveal below-average meltwater ponding during most of melting seasons 2015–2018 and above-average meltwater ponding throughout summer 2019–2020 and early 2020–2021 considering years 2015–2021 as a reference period. Meltwater ponding on investigated East Antarctic ice shelves was far more variable, with above-average lake extents during most 2016–2019 melting seasons and below-average lake extents during 2020–2021, considering the reference interval 2016–2021. This study is the first to investigate relationships with climate drivers both spatially and temporally including time lag analysis. The results indicate that supraglacial lake formation in 2015–2021 is coupled to the complex interplay of local, regional and large-scale environmental drivers with similar driving factors over both ice sheet regions. In particular, varying air temperature, solar radiation and wind conditions influenced supraglacial lake formation over all six ice shelves despite strong local to regional discrepancies, as revealed through pixel-based correlation analysis. Furthermore, regional climatic conditions were shown to be influenced by Southern Hemisphere atmospheric modes showing large-scale impacts on the spatio-temporal evolution of supraglacial lakes as well as on above- or below-average meltwater ponding with respect to the period 2015–2021. Finally, the local glaciological setting, including melt–albedo feedbacks and the firn air content, was revealed to strongly influence supraglacial lake distribution. Recent increases in Antarctic Peninsula surface ponding point towards a further reduction in the firn air content, implying an increased risk for ponding and hydrofracture. In addition, lateral meltwater transport was observed over both Antarctic regions with similar implications for future ice shelf stability.
- Article
(14763 KB) - Full-text XML
-
Supplement
(1985 KB) - BibTeX
- EndNote


With accelerating global climate change, the Greenland and Antarctic ice sheets are exposed to increasing environmental pressure (Meredith et al., 2019). Recent disintegration of Antarctic Peninsula (API) ice shelves was associated with atmospheric warming causing extensive meltwater ponding and hydrofracture to initiate ice shelf collapse (Banwell et al., 2013; Bell et al., 2018; Cook and Vaughan, 2010; Leeson et al., 2020; Rignot et al., 2004; Scambos et al., 2004). Ice shelf collapse leads to a reduction in buttressing, initiating glacier acceleration and causing API ice mass loss to increase from 7±13 to 33±16 billion tonnes per year in 1992–2017 (Berthier et al., 2012; Rott et al., 2018; The IMBIE Team, 2018). With surface melting expected to double by 2050 (Trusel et al., 2015), Antarctic surface hydrological features will expand and likely contribute to future ice shelf instability and ice mass loss (Arthur et al., 2020b; Lai et al., 2020). Apart from the risk of hydrofracture (Fürst et al., 2016; Lai et al., 2020), also an inland migration of lakes could result in ice flow accelerations through the connection of surface and basal hydrological systems, leading to basal lubrication and sliding due to a reduction in basal shear stress (Bartholomew et al., 2010; Bell et al., 2018; Tuckett et al., 2019; Siegert et al., 2018). Moreover, melt–albedo feedbacks can contribute to enhanced melting near exposed bedrock, blue ice and supraglacial lakes themselves (Arthur et al., 2020b; Bell et al., 2018; Kingslake et al., 2017; Lenaerts et al., 2017). Occurrence of supraglacial meltwater ponding is further promoted in regions of low firn air content (FAC) due to firn over-saturation, refreezing of lakes or the absence of snowfall (Alley et al., 2018; Arthur et al., 2020b; Kuipers Munneke et al., 2014; Lenaerts et al., 2017; Spergel et al., 2021; Stokes et al., 2019) as well as over topographic undulations and where katabatic or foehn winds prevail (Cape et al., 2015; Datta et al., 2019; Laffin et al., 2021; Lenaerts et al., 2017; Luckman et al., 2014). In addition, ice shelves that are structurally weakened by fractures and crevasses could be more vulnerable to hydrofracture (Lhermitte et al., 2020).
Despite recent advances in the understanding of Antarctic surface hydrology, detailed analyses of the spatio-temporal evolution of Antarctic supraglacial lakes as well as implications for ice shelf stability and links to environmental controls remain poorly constrained. For improved evaluation of seasonal fluctuations in Antarctic surface hydrology as well as associated drivers and impacts, automated mapping methods with spatio-temporal transferability are required. In this context, recent progress in the mapping of Antarctic surface hydrology results from large-scale mapping efforts using optical (Dell et al., 2020; Dirscherl et al., 2020; Halberstadt et al., 2020; Kingslake et al., 2017; Moussavi et al., 2020; Stokes et al., 2019) and synthetic aperture radar (SAR) (Dirscherl et al., 2021) data from spaceborne remote sensing and has revealed widespread occurrence of surface ponding particularly on the API and East Antarctic Ice Sheet (EAIS) (Arthur et al., 2020b). Employing state-of-the-art machine learning method developments using Sentinel-1 SAR (Dirscherl et al., 2021) and optical Sentinel-2 data (Dirscherl et al., 2020) enables the generation of fused supraglacial lake extent classification products at high spatial and temporal resolution. This allows sensor-specific advantages and disadvantages to be exploited and overcome, including the retrieval of maps during polar darkness or cloud cover with Sentinel-1 SAR. Furthermore, the penetration capability of Sentinel-1 enables the mapping of buried and slightly frozen lakes. On the other hand, Sentinel-2 allows the retrieval of mappings for lakes that cannot be identified in SAR data due to effects such as severe wind roughening. Providing more complete mapping records than single-sensor classifications, combined Sentinel-1 and Sentinel-2 supraglacial lake extent mappings are the primary data source within the present study.
Exploiting the archive of Sentinel-1 and Sentinel-2, this study aims to (i) investigate seasonal and inter-annual supraglacial lake extent dynamics in 2015–2021 over six major Antarctic ice shelves on the API and EAIS, (ii) analyse anomalous supraglacial lake occurrence above or below average with respect to the observational period 2015–2021, (iii) establish a link between spatio-temporal variability in supraglacial lake occurrence and associated environmental controls including both the near-surface climate and the local glaciological setting, and (iv) evaluate the influence of teleconnections and Southern Hemisphere atmospheric modes on climate and lake extent variability. While it is beyond the scope of this study to identify specific short-term drivers of lake occurrence or absence, we mostly focus on the analysis of climate variability during the entire investigation period 2015–2021.

Figure 1Overview map of Antarctica with the study regions on the Antarctic Peninsula (API) (a–c) and the East Antarctic Ice Sheet (EAIS) (d–f) outlined in red. The shaded turquoise area in (a)–(f) delineates the areas of interest used for statistical correlation analysis. Over Amery Ice Shelf, Beaver Lake, a permanent lake feature at the western grounding line, was excluded from analyses in order to avoid misclassifications in optical imagery. The outline of the Antarctic ice sheets is taken from IMBIE (2016), and coastline and grounding line data are from Mouginot et al. (2017) and Rignot et al. (2013). The background in (a)–(f) is the Landsat Image Mosaic of Antarctica (LIMA) (Bindschadler et al., 2008). MB: Marguerite Bay. RE: Ronne Entrance. FML: Fisher, Mellor and Lambert glacier systems. WAIS: West Antarctic Ice Sheet.
The six major ice shelves investigated in this study are shown in Fig. 1. Of these, three are situated on the south-western API, and three are distributed around the margin of the EAIS. The choice of study regions was made in agreement with known supraglacial lake occurrences across different glaciological and climatic settings (Banwell et al., 2021; Dell et al., 2020; Dirscherl et al., 2021; Kingslake et al., 2017; Spergel et al., 2021) as well as satellite data availability. The study regions on the API are located in the Bellingshausen Sea sector and cover the neighbouring George VI, Bach and Wilkins ice shelves (Fig. 1a–c). Separated by Alexander Island (71∘00′ S, 70∘00′ W), these ice shelves cover an area of ∼23 370, ∼4540 and ∼11 144 km2, respectively (Cook and Vaughan, 2010; Holt et al., 2013b). While Bach and Wilkins ice shelves are fed by several inlets from Alexander Island and have comparatively broad calving fronts with respect to their total extent, the structural setting of George VI Ice Shelf is far more complex (Banwell et al., 2021). Stretching over ∼450 km along its centreline and up to ∼75 km at its northern and southern calving fronts in Marguerite Bay and Ronne Entrance, George VI Ice Shelf is located within a narrow channel between Alexander Island and Palmer Land (Holt et al., 2013a). The latter provides most of the ice inflow onto the ice shelf, compressing laterally against Alexander Island (Hambrey et al., 2015; Holt et al., 2013b; LaBarbera and MacAyeal, 2011; Reynolds and Hambrey, 1988). The structural setting of George VI also influences its ice motion, reaching peak velocities up to 2.5 m d−1 at its eastern grounding line and considerably lower values towards the west (Hogg et al., 2017). In contrast, ice flow velocities on Bach and Wilkins ice shelves are comparatively low, with maxima up to ∼1 m d−1 near their grounding lines (Hogg et al., 2017; Padman et al., 2012). Over recent decades, changes in ice dynamics along the Bellingshausen Sea sector were mostly attributed to the local glacier and bedrock geometry as well as Circumpolar Deep Water upwelling onto the continental shelf, leading to enhanced basal melting (Hogg et al., 2017; Minchew et al., 2018; Rignot et al., 2019). On the other hand, summer surface melting led to the formation of extensive surface hydrological networks over all three ice shelves (Fig. 2a–c) (Banwell et al., 2021; Dirscherl et al., 2020, 2021; Reynolds, 1981; Wagner, 1972).
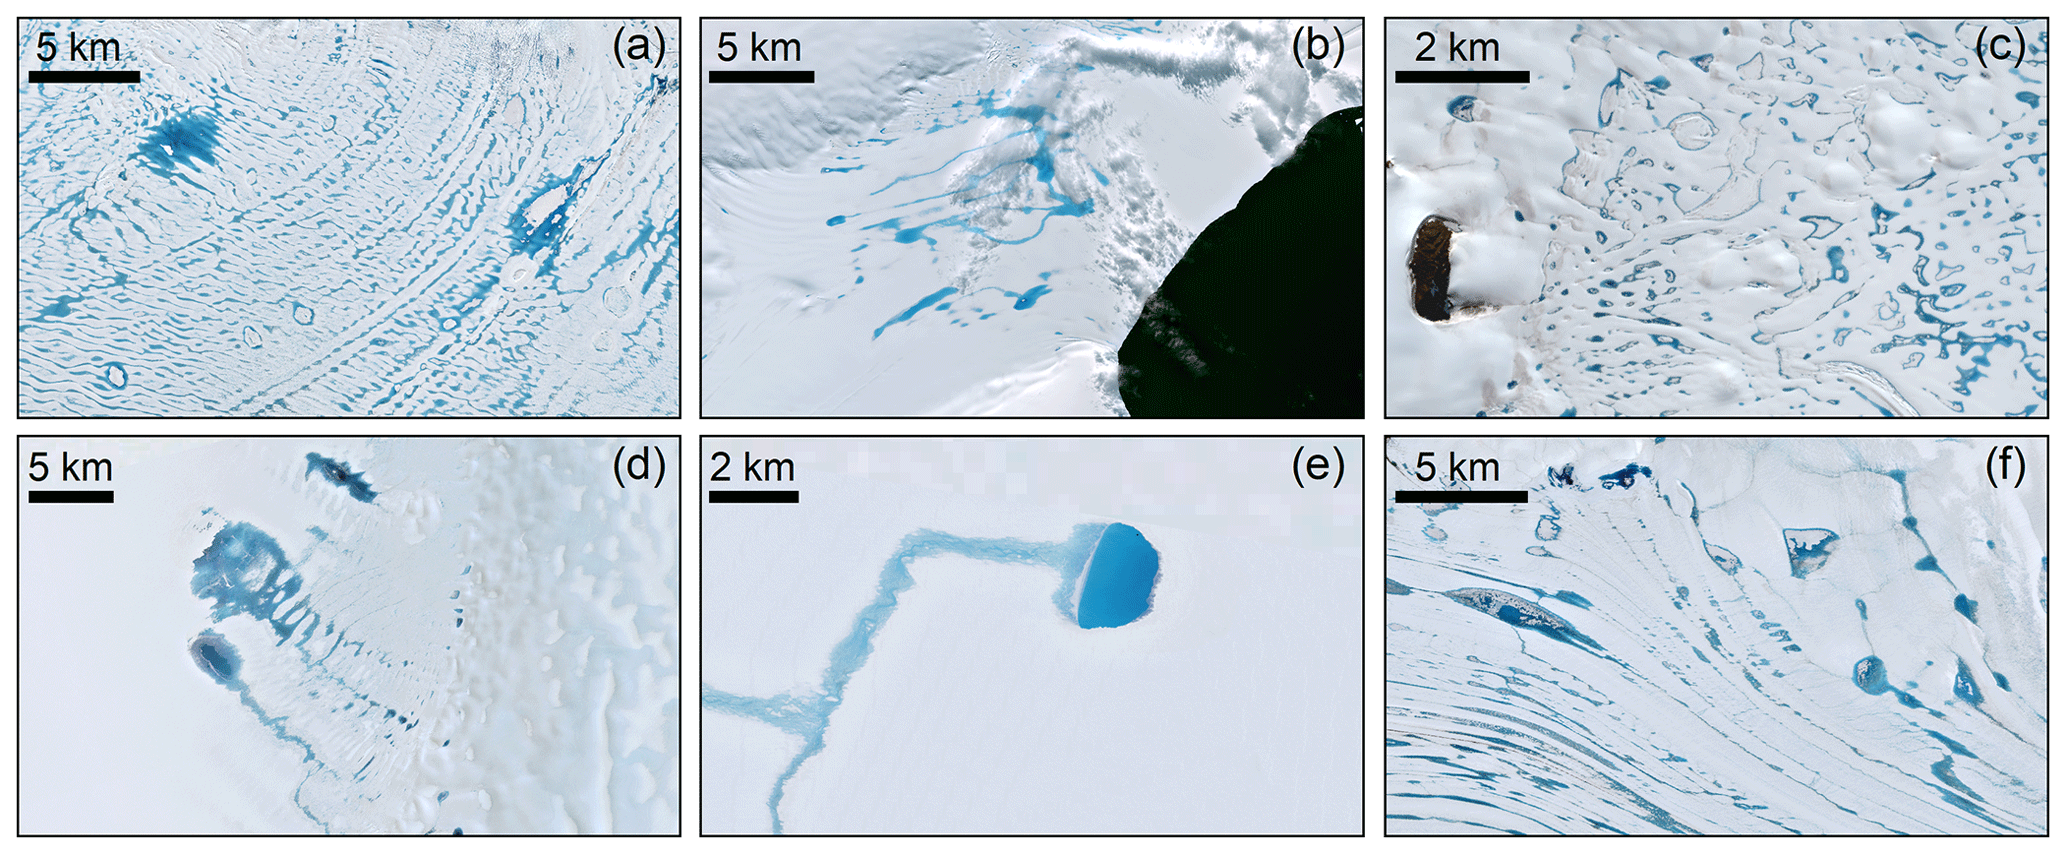
Figure 2Sentinel-2 optical image extracts (RGB) showing supraglacial lake occurrence on (a) 19 January 2020 over George VI Ice Shelf, (b) 29 January 2020 over Bach Ice Shelf, (c) 23 January 2021 over Wilkins Ice Shelf, (d) 2 February 2017 over Riiser-Larsen Ice Shelf, (e) 21 January 2019 over Nivlisen Ice Shelf and (f) 2 January 2019 over Amery Ice Shelf. Data source: Copernicus Sentinel-2 data.
The three investigated ice shelves on the EAIS are Riiser-Larsen, Nivlisen and Amery ice shelves, each stretching over an area of ∼48 180, ∼7600 and ∼62 620 km2, respectively (Dell et al., 2020; Foley et al., 2013). Riiser-Larsen Ice Shelf (Fig. 1d) is located in western Dronning Maud Land (72∘40′ S, 15∘00′ W) and is grounded along several hundred kilometres running parallel to the calving front with several ice rises and pinning points (Kleiner and Humbert, 2014). Most of the ice discharge into Riiser-Larsen Ice Shelf originates from the adjacent Plogbreen and Veststraumen ice streams, with ice velocities generally below 1 m d−1 (Gardner et al., 2018; Shen et al., 2018). Nivlisen Ice Shelf (Fig. 1e) lies within the central section of Dronning Maud Land (70∘30′ S, 11∘30′ E) and is fed by ice draining through the Wohlthat Mountains (Horwath et al., 2006). Its overall ice flow is comparatively slow, with peak velocities < 0.5 m d−1 (Horwath et al., 2006; Shen et al., 2018). Situated in Mac. Robertson Land, Amery (71∘00′ S, 70∘00′ E) is the largest of all East Antarctic ice shelves (Fig. 1f). Amery Ice Shelf is located in Prydz Bay and stretches over a length and width of ∼550 and ∼180 km, respectively. It is nourished by three major glaciers – Fisher, Mellor and Lambert – and reaches peak velocities of 4 m d−1 at its front (Tong et al., 2018). Overall, ice dynamics at Amery, Riiser-Larsen and Nivlisen ice shelves remained remarkably steady over the last decades (Gardner et al., 2018; Rignot et al., 2019; Shen et al., 2018; Tong et al., 2018). At the same time, extensive networks of supraglacial lakes and streams were observed on all three ice shelves (Fig. 2d–f) (Dell et al., 2020; Dirscherl et al., 2020, 2021; Moussavi et al., 2020; Spergel et al., 2021; Stokes et al., 2019).
In this study, the area of interest (AOI) chosen for statistical analyses over each ice shelf region was delineated in agreement with confirmed supraglacial lake occurrences during at least one time step within our investigation period of 2015–2021 as well as on the basis of resampled ERA5-Land pixel footprints (turquoise area in Fig. 1a–f). For George VI, Bach, Wilkins, Riiser-Larsen, Nivlisen and Amery ice shelves, this resulted in AOI subsets of 27 324, 9504, 15 660, 1512, 5292 and 41 760 km2, respectively. Where lake coverage expanded inland across the grounding lines, the adjacent grounded ice was included, explaining the partly larger AOI sizes compared to the corresponding ice shelf areas. At this point it has to be noted that satellite data acquisition (Sect. 3.1) as well as lake extent mapping (Sect. 3.2) was performed on the basis of the full ice shelf areas.
3.1 Datasets
3.1.1 Satellite imagery
For automated mapping of Antarctic supraglacial lake extents, we jointly use Sentinel-1 and Sentinel-2 satellite imagery. The Sentinel-1 SAR data used in this study were acquired in ground range detected (GRD) format and interferometric wide (IW) swath mode, delivering data products at 10 m pixel spacing and in horizontal transmit-and-receive polarization (HH). While the general repeat interval of Sentinel-1 corresponds to 6 d at the Equator, up to daily revisit frequencies can be achieved in high latitudes. For each study region, we acquired all available Sentinel-1 data covering the period 1 November to 31 March in 2015–2021 within pre-defined boundaries, including the six ice shelves as well as surrounding grounded area. Over Riiser-Larsen, Nivlisen and Amery ice shelves, data availability during the 2015–2016 melting season was not sufficient, restricting the Sentinel-1 data selection to the period 2016–2021. In contrast, Sentinel-1 data over George VI, Bach and Wilkins ice shelves were available during all melting seasons 2015–2021. Overall, this resulted in a total number of 3075 Sentinel-1 acquisitions covering all six study regions.
Regarding optical Sentinel-2 data, we selected all imagery with a scene cloud cover < 75 % available within the same pre-defined time frame and boundaries as defined for Sentinel-1. This comparatively high cloud threshold was chosen in order to obtain the most complete record of supraglacial lake occurrence during months when high cloud cover prevails in parts of the image scenes. Moreover, cloud masking procedures over glaciated regions are often impacted by the appearance of ice similar to clouds, thus indicating higher cloud coverage than is present in the actual acquisitions and resulting in an incomplete data record. Considering these filtering criteria as well as the high revisit frequency of Sentinel-2 over polar regions (<5 d), a total of 2167 Sentinel-2 acquisitions were gathered for all six study regions within the period November to March in 2016–2021. Similarly to Sentinel-1, data availability was restricted during melting season 2015–2016.
3.1.2 ERA5-Land reanalysis data
For analysis of climatological controls on Antarctic supraglacial lake occurrence in 2015–2021, we use hourly ERA5-Land atmospheric reanalysis data (Munoz Sabater, 2019). ERA5-Land replaces the former ERA-Interim product of the European Centre for Medium-Range Weather Forecasts (ECMWF) and provides reanalysis data for a variety of land variables at a spatial resolution of 0.1∘ (∼9 km) as well as a temporal coverage dating back to 1981. The use of large-scale reanalysis data compared to ground-based observations, e.g. from local weather stations, is particularly beneficial over Antarctica as its vast size and remote geographical location complicate detailed ground-based monitoring efforts.
The ERA5-Land variables used in this study include 2 m air temperature, surface net solar radiation, wind, total precipitation and snowmelt. Data were retrieved for the period 1 October to 1 March of each melting season in 2015–2021. October and November data were included for evaluation of potential time lag effects of climate variables. For precipitation data, we retrieved hourly estimates for all remaining months in 2015–2020 in order to allow the evaluation of links between previous-year precipitation and supraglacial lake formation.
To start with, ERA5-Land temperature data provide the best estimate of the seasonal cycle of near-surface temperature over coastal Antarctica and particularly the API (Gossart et al., 2019; Tetzner et al., 2019). ERA5-Land temperature data outperform other reanalysis datasets considering its low bias and low mean absolute error of 2 ∘C over Antarctica (Gossart et al., 2019). On the other hand, surface net solar radiation represents the difference between downward solar (or shortwave) radiation incident upon the Earth's surface and the amount of radiation reflected back to space. To date, data on surface net solar radiation have not been validated over Antarctica, while studies over China and Europe point towards an improved performance of ERA5 radiation components compared to other reanalysis datasets (Jiang et al., 2020; Urraca et al., 2018). ERA5-Land wind data are provided at 10 m above the surface as the horizontal speed of air moving towards the north and east, respectively. ERA5-Land wind data were revealed to capture the typical annual cycle of wind with a mean underestimation during winter, when katabatic wind forcing is strongest (Gossart et al., 2019). Similarly, a slight underestimation of wind magnitude was observed over coastal Antarctica during summer, resulting in an overall mean absolute error of 2.8 m s−1 (Gossart et al., 2019). Estimates of ERA5-Land total precipitation are provided in metres depth and include all liquid and frozen water accumulated at the Earth's surface. Overall, ERA5-Land precipitation data perform well in detecting precipitation events over the API even though a bias may exist, e.g. due to the negligence of effects such as the redeposition of snow (Tetzner et al., 2019). Finally, ERA5-Land modelled snowmelt data are available in metres of water equivalent. As no evaluation of the ERA5-Land snowmelt product exists for the Antarctic continent, the data should be interpreted with care.
3.2 Methods
3.2.1 Pre-processing and data preparation
The satellite data were pre-processed using sensor-specific processing tools. For Sentinel-1 SAR data, we used the open-source Sentinel Application Platform (SNAP). Pre-processing of Sentinel-1 SAR imagery includes orbit correction, thermal noise removal, radiometric calibration, speckle filtering and terrain correction. For the latter, the TanDEM-X PolarDEM 90 m of Antarctica (Wessel et al., 2021) was used. In order to prepare the data for prediction of supraglacial lakes (Sect. 3.2.2), each pre-processed Sentinel-1 image was normalized and tiled into 480×480 px patches with 200 px overlap (Dirscherl et al., 2021). In contrast, optical Sentinel-2 data required correction for atmospheric effects using Sen2Cor, a processor for retrieval of surface reflectance (Louis et al., 2016). Moreover, selected indices needed for image classification (Dirscherl et al., 2020) were calculated, and all bands and indices were resampled to the highest resolution of available Sentinel-2 bands (10 m).
Pre-processing of ERA5-Land data included a range of individual processing steps for each variable. Hourly estimates of ERA5-Land air temperature were resampled to daily averages, and temperature measured in kelvin was converted to degrees Celsius (∘C). Hourly data on surface net solar radiation were converted to average daily energy fluxes in watts per square metre (W m−2). Hourly zonal (u) and meridional (v) wind stress components at 10 m above the surface were used to derive daily averages of zonal and meridional wind stress to be converted to wind magnitude () and direction () following aggregation to bi-weekly averages (Sect. 3.2.3). For calculation of daily total precipitation, we considered the total accumulated value of a day and converted to millimetres depth. Finally, daily snowmelt information was obtained from hourly snowmelt data through consideration of the total accumulated value of a day and conversion to millimetres of water equivalent. All obtained daily ERA5-Land data were reprojected to the Antarctic Polar Stereographic projection in order to allow the comparison to lake extent mappings.
3.2.2 Automated supraglacial lake extent mapping
For prediction of supraglacial lake extents in normalized Sentinel-1 image patches, we use a convolutional neural network (CNN) based on residual U-Net (Dirscherl et al., 2021). In detail, a standard U-Net architecture was complemented with residual connections as well as an Atrous Spatial Pyramid Pooling (ASPP) module for improved performance. In this context, the choice of a deep learning network over traditional image processing techniques was mainly made due to the similar appearance of Antarctic supraglacial lakes and surface features such as wet snow, blue ice or topographic shadow in single-polarized SAR imagery as well as due to effects such as wind roughening and speckle noise (Dirscherl et al., 2021). Model training was performed on a graphics processing unit (GPU) cluster using 21 200 Sentinel-1 image patches extracted from 58 manually labelled Sentinel-1 image scenes covering melting seasons 2018–2019 and 2019–2020 over 13 different Antarctic regions. Following semantic segmentation of the image patches, the resultant prediction probability maps were reshaped into their original image size and thresholded. In particular, all pixels above a probability threshold of 0.5 were accepted as supraglacial lake pixels. As part of post-processing, remaining errors in the binary classification maps were reduced by applying morphological filtering as well as topographic and coastline masking using a resampled version of the TanDEM-X PolarDEM as well as a dilated Sentinel-1 coastline product of 2018 (Baumhoer et al., 2021). The performance of the Sentinel-1 classification approach was evaluated by means of 23 000 random point samples collected over 10 independent test sites that were not presented to the model during training and that contained surface features that are difficult to discriminate from lakes as well as lakes of varying appearances. Their evaluation as part of a confusion matrix suggests the good functionality of the algorithm with an average F1 score of 93 % for all regions. The F1 score is a common statistical accuracy metric reflecting the harmonic mean of the rate of true positive pixels with respect to all true class samples and the rate of true positive pixels with respect to all predicted class samples (Jolly, 2018; Müller and Guido, 2016). Remaining limitations are mostly related to false positive lake classifications over radar shadow, wet snow or blue ice.
Supraglacial lake classification in optical Sentinel-2 imagery was performed using an advanced version of the machine learning algorithm published in Dirscherl et al. (2020). In detail, the algorithm is based upon a random forest (RF) classifier trained on a high-performance computing (HPC) cluster with selected Sentinel-2 bands and indices covering 14 different Antarctic regions during three austral summers as well as manually created labels and topographic variables derived from the Antarctic TanDEM-X digital elevation model (DEM). Similarly to Sentinel-1, post-classification involved bands, indices, topographic and coastline masking, and morphological erosion. The main modifications in the advanced version of the RF algorithm include (i) the integration of more training data over shadow; (ii) the improvement of post-classification, e.g. through fine-tuning of variable thresholds; and (iii) the use of prediction probability maps for efficient slush elimination. Overall, this classification strategy returned an average F1 score of ∼95 % for a random selection of 28 000 points that were sampled over 14 independent Antarctic test sites not presented to the model during training. Remaining limitations of the classification method include difficulties in detecting mixed pixels at lake edges as well as errors over shadow. Yet, errors due to shadow mainly affect acquisitions towards the end of a summer season, when the incidence angle of the sun is lower. Furthermore, the discrimination between open water and slightly frozen lakes (e.g. Fig. 2d and e) remains challenging. For this reason, we restrict our analysis to supraglacial lake extent derivation and do not calculate lake volumes. To support analyses of local controls on lake ponding, we also derive mappings of rock outcrop using the modified RF algorithm.
3.2.3 Time series generation and statistical analysis
Following supraglacial lake extent mapping, we aggregated all data to bi-weekly time series. To start with, Sentinel-1 and Sentinel-2 classification products were combined through decision-level fusion, thus the mosaicking of all classifications to maximum lake extent classifications for each bi-weekly time interval between November and March of a melting season. To interpolate data gaps during specific months over Riiser-Larsen and Nivlisen ice shelves (Fig. S1d and e in the Supplement), we used the respective long-term mean of the period 2016–2021 at bi-weekly scale. Since data gaps were mostly present for months of low lake coverage, this interpolation strategy was considered acceptable. For analysis of environmental controls on Antarctic supraglacial lake occurrence, we converted the bi-weekly lake extent time series to fractional lake extent considering ERA5-Land grids as AOIs (see Fig. 1). Similarly, the daily ERA5-Land data were aggregated to average bi-weekly time series, and the grid values over the AOIs were extracted. For temperature, we also calculated bi-weekly maxima to capture temperature extreme events and positive degree days, resulting in seven climate variables used for statistical analysis. In order to investigate drivers of anomalous meltwater ponding and to analyse where above- or below-normal climatic conditions result in above- or below-normal lake formation with respect to the investigation period 2015–2021, we additionally converted the bi-weekly fractional lake extent and climate time series to time series of anomalies. In this study, anomalies are calculated with respect to the long-term mean 2015–2021 of each bi-weekly time interval. Finally, for joint analysis of January lake extents and total precipitation in a year preceding lake coverage, we extracted the corresponding aggregates and grid values over each study region. In this study, previous-year precipitation was used as an indirect indicator for the FAC of snow, thus for analysis of relationships between supraglacial lake formation and the state of the snowpack. Additionally, January lake extents were considered for analysis of links with annual Southern Annular Mode (SAM) (Marshall, 2003, 2018) as well as for evaluation of the inter-annual recurrence of lakes, both spatially and temporally supporting the investigation of local controls.
To establish a link between environmental variables and fractional lake extents, we use the Pearson correlation. Pearson's correlation coefficient (r) measures the linear relationship between two variables, where r lies in the range of −1 to +1, reflecting a strong negative and strong positive linear relationship, respectively. Calculation of r also raises the p value (p), an indicator for statistical significance of correlations. In this study, significance levels of , and ) were defined. In order to obtain more robust correlation values, the bi-weekly statistical analysis was restricted to summer months (December, January and February), when lake coverage is highest, and data gaps and classification errors are lowest. Apart from correlating multi-temporal observations of fractional lake extents and climate variables at identical time steps (lag 0), we performed cross-correlation with climate data at time lags 1–4, with each individual lag representing a shift of half a month with respect to the previous lag. These lags capture climatic conditions up to 2 months preceding a summer season. Considering the investigation periods December to February 2015–2021 and 2016–2021, each individual time series consisted of 36 (API) and 30 (EAIS) observations. Correlation of multi-temporal observations was performed with spatial averages, anomalies of spatial averages and pixel-based values. Additionally, fluctuations in previous-year precipitation and SAM were correlated with January fractional lake extents based on six (API) and five (EAIS) observations. For completeness, further local controls including melt–albedo feedbacks and topographical factors were investigated based on the visual comparison of lake density to the TanDEM-X PolarDEM, Sentinel-2 rock classification products and blue ice occurrence in optical imagery.
4.1 Supraglacial lake extent dynamics
4.1.1 Antarctic Peninsula ice shelves
As shown in Fig. 3a–c, supraglacial lake extents on the API varied strongly both inter-annually and intra-annually. For George VI, Bach and Wilkins ice shelves, supraglacial lake extents were highest during melting seasons 2019–2020 and 2020–2021, reaching peak values of ∼805, ∼110 and ∼45 km2 during January 2020. Comparatively low lake extents were observed for melting seasons 2015–2019. For years with high supraglacial lake coverage, the peak of lake formation was in late January, reducing significantly during the first or second half of February. Moreover, the calculation of intra-annual anomalies with respect to the reference period 2015–2021 (Fig. 4a–c) revealed that lake extents during the 2019–2020 and 2020–2021 melting season were above average during their peak and slightly below average in parts of early 2019–2020 and late 2020–2021.
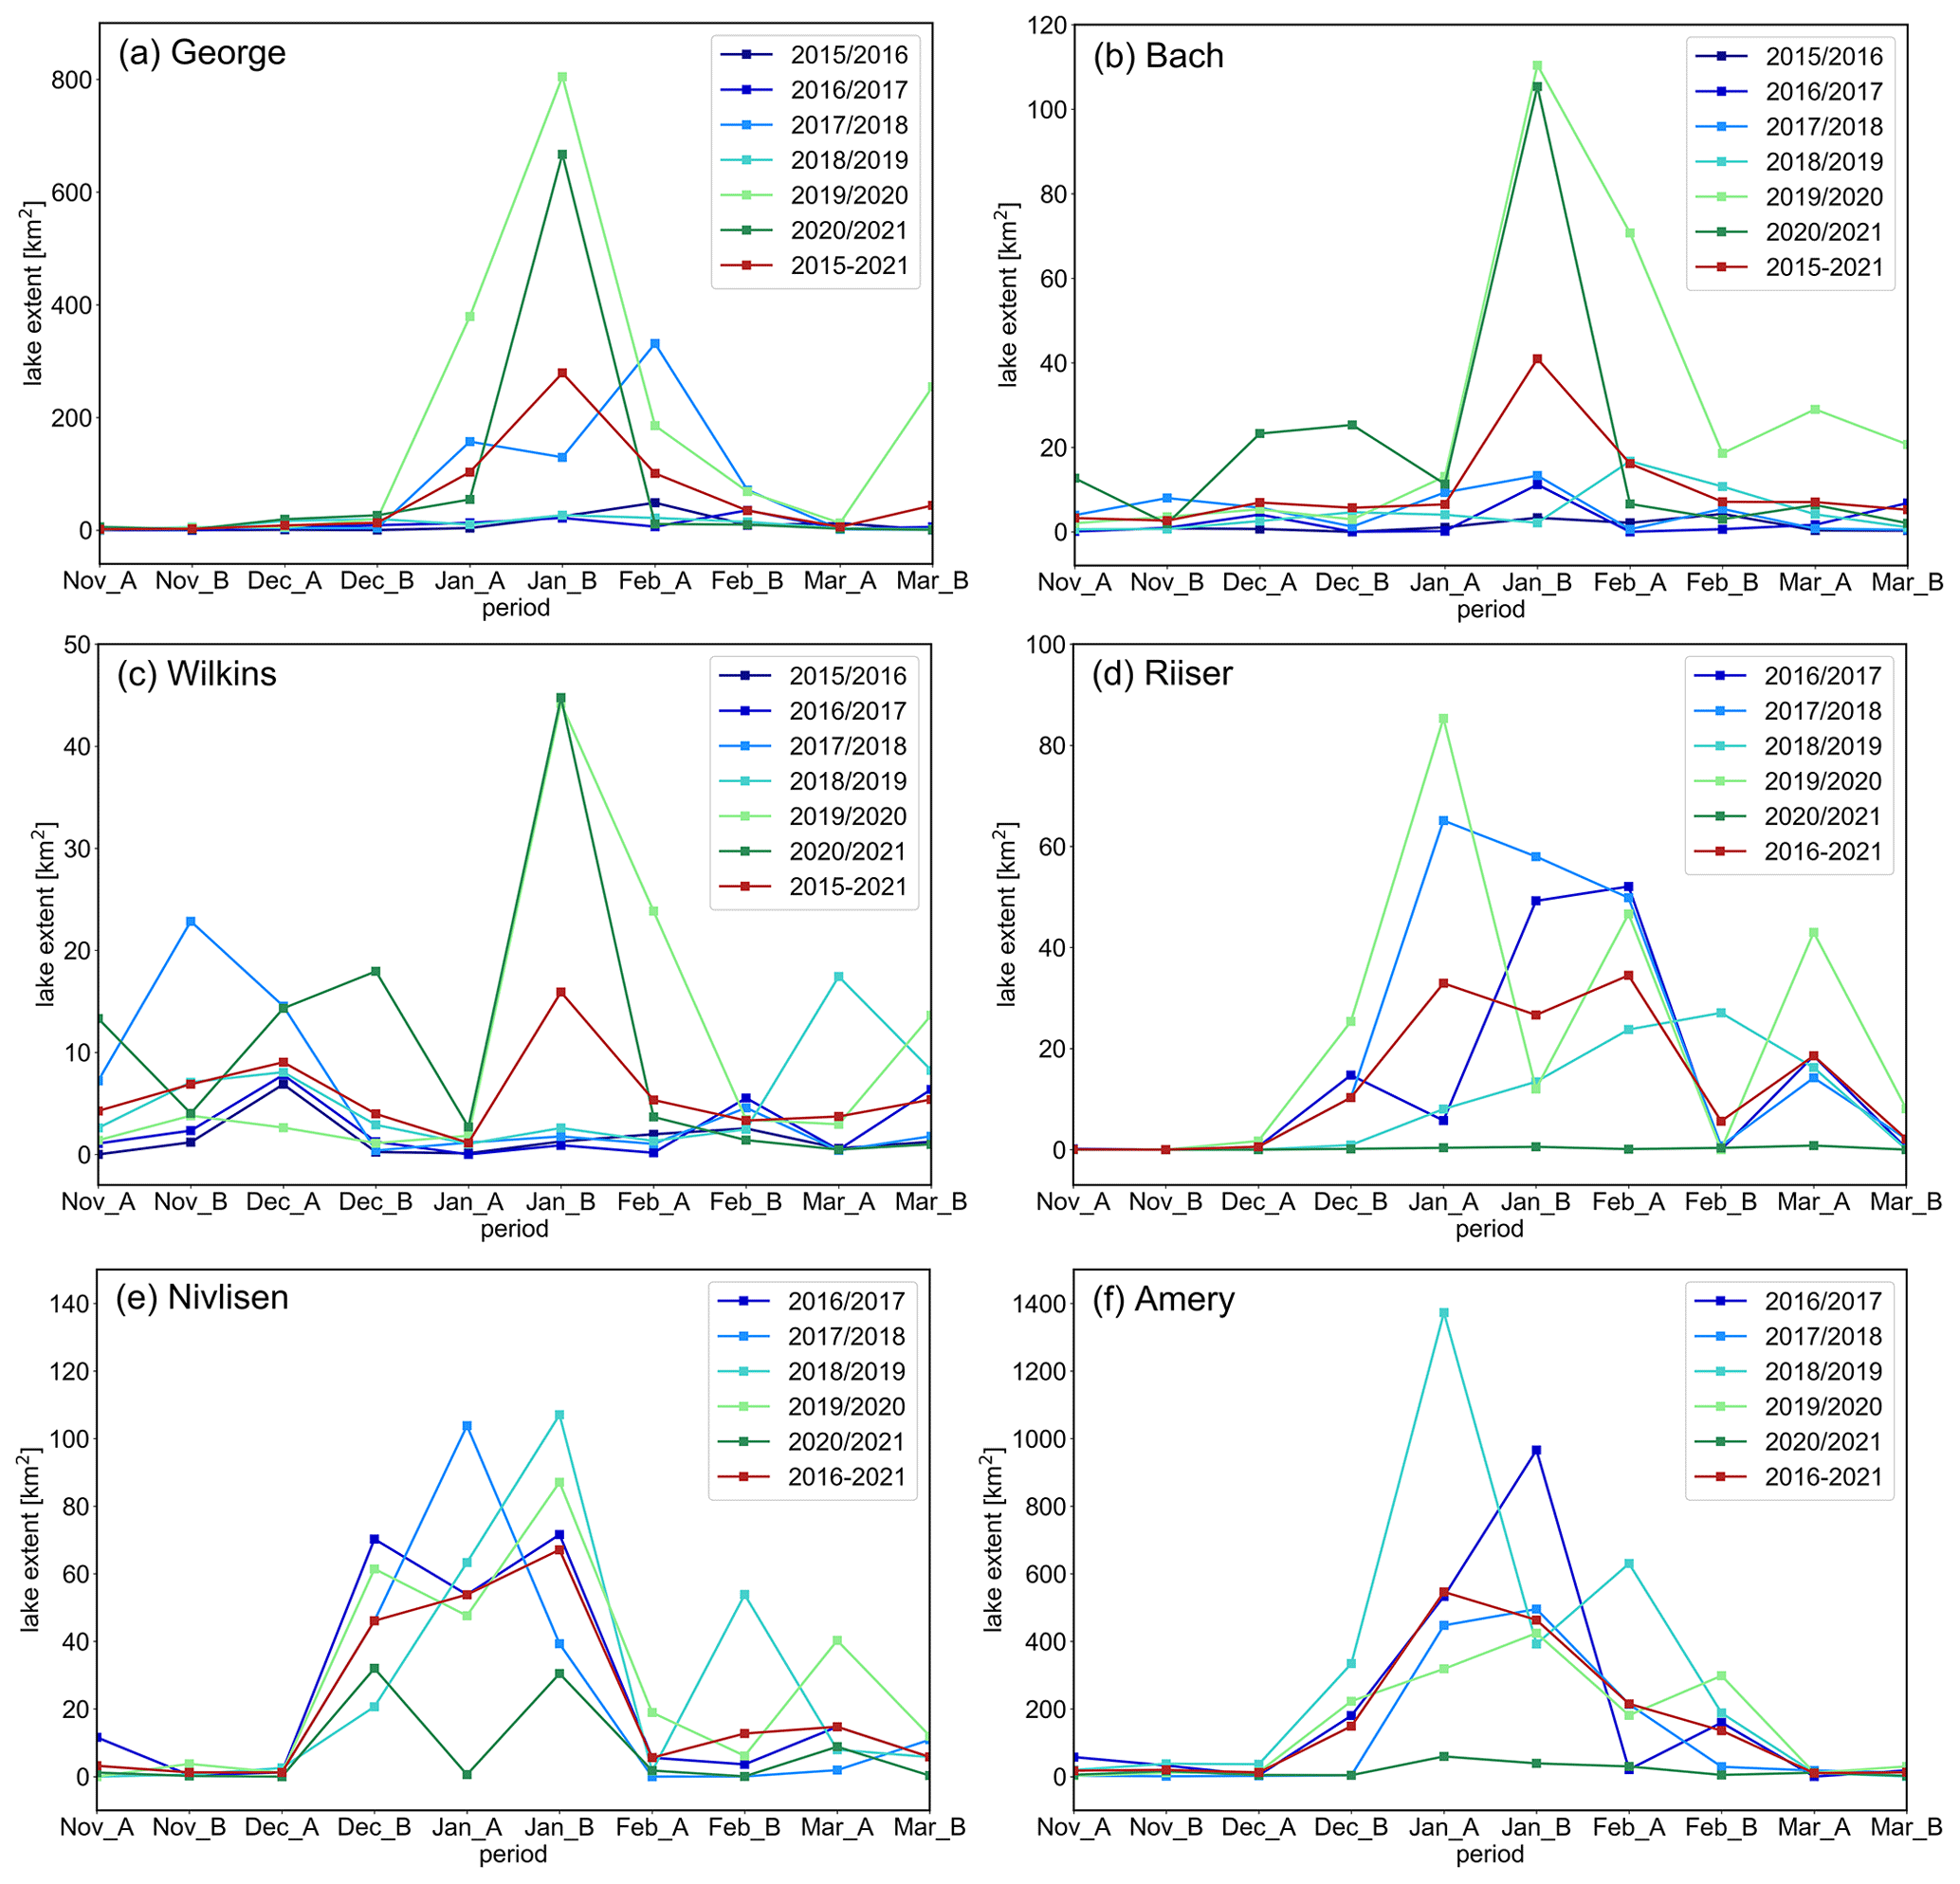
Figure 3Supraglacial lake extent dynamics over (a) George VI, (b) Bach, (c) Wilkins, (d) Riiser-Larsen, (e) Nivlisen and (f) Amery ice shelves, as computed with Sentinel-1 and Sentinel-2 imagery. The red line in each plot represents the dynamic long-term mean 2015–2021 for each respective bi-weekly time interval. The periods represent the bi-weekly time intervals during a melting season, with “A” representing the first half of a given month and “B” the second half.

Figure 4Intra-annual supraglacial lake extent anomalies over (a) George VI, (b) Bach, (c) Wilkins, (d) Riiser-Larsen, (e) Nivlisen and (f) Amery ice shelves, as calculated with respect to the long-term mean 2015–2021 of each bi-weekly time interval within the investigation period 2015–2021. For Riiser and Nivlisen ice shelves, data gaps are visible due to interpolation with the bi-weekly long-term mean 2016–2021. Each bar represents a bi-weekly time interval within the period November to March of an individual melting season. Melting seasons are outlined through separation with dashed grey lines.
Figure 5a–c illustrate the annual recurrence of lakes during January 2016–2021. As can be seen, supraglacial lakes tend to form at low elevations and low surface slopes downstream of the grounding line. On Bach and Wilkins ice shelves, lakes are clustered closer to the grounding line than on George VI Ice Shelf, where lakes accumulated in flow stripes over vast parts of the flat ice shelf during the last two melting seasons. Near Wilkins Ice Shelf, lakes extended furthest onto the adjacent grounded ice, where rock outcrop is present (Fig. 5c). Further, supraglacial lakes on George VI Ice Shelf are clustered closer to the grounding line and rock outcrop in years with low supraglacial lake coverage (see Fig. 5a and b), as reflected in higher recurrence times of lakes up to 5–6 years.
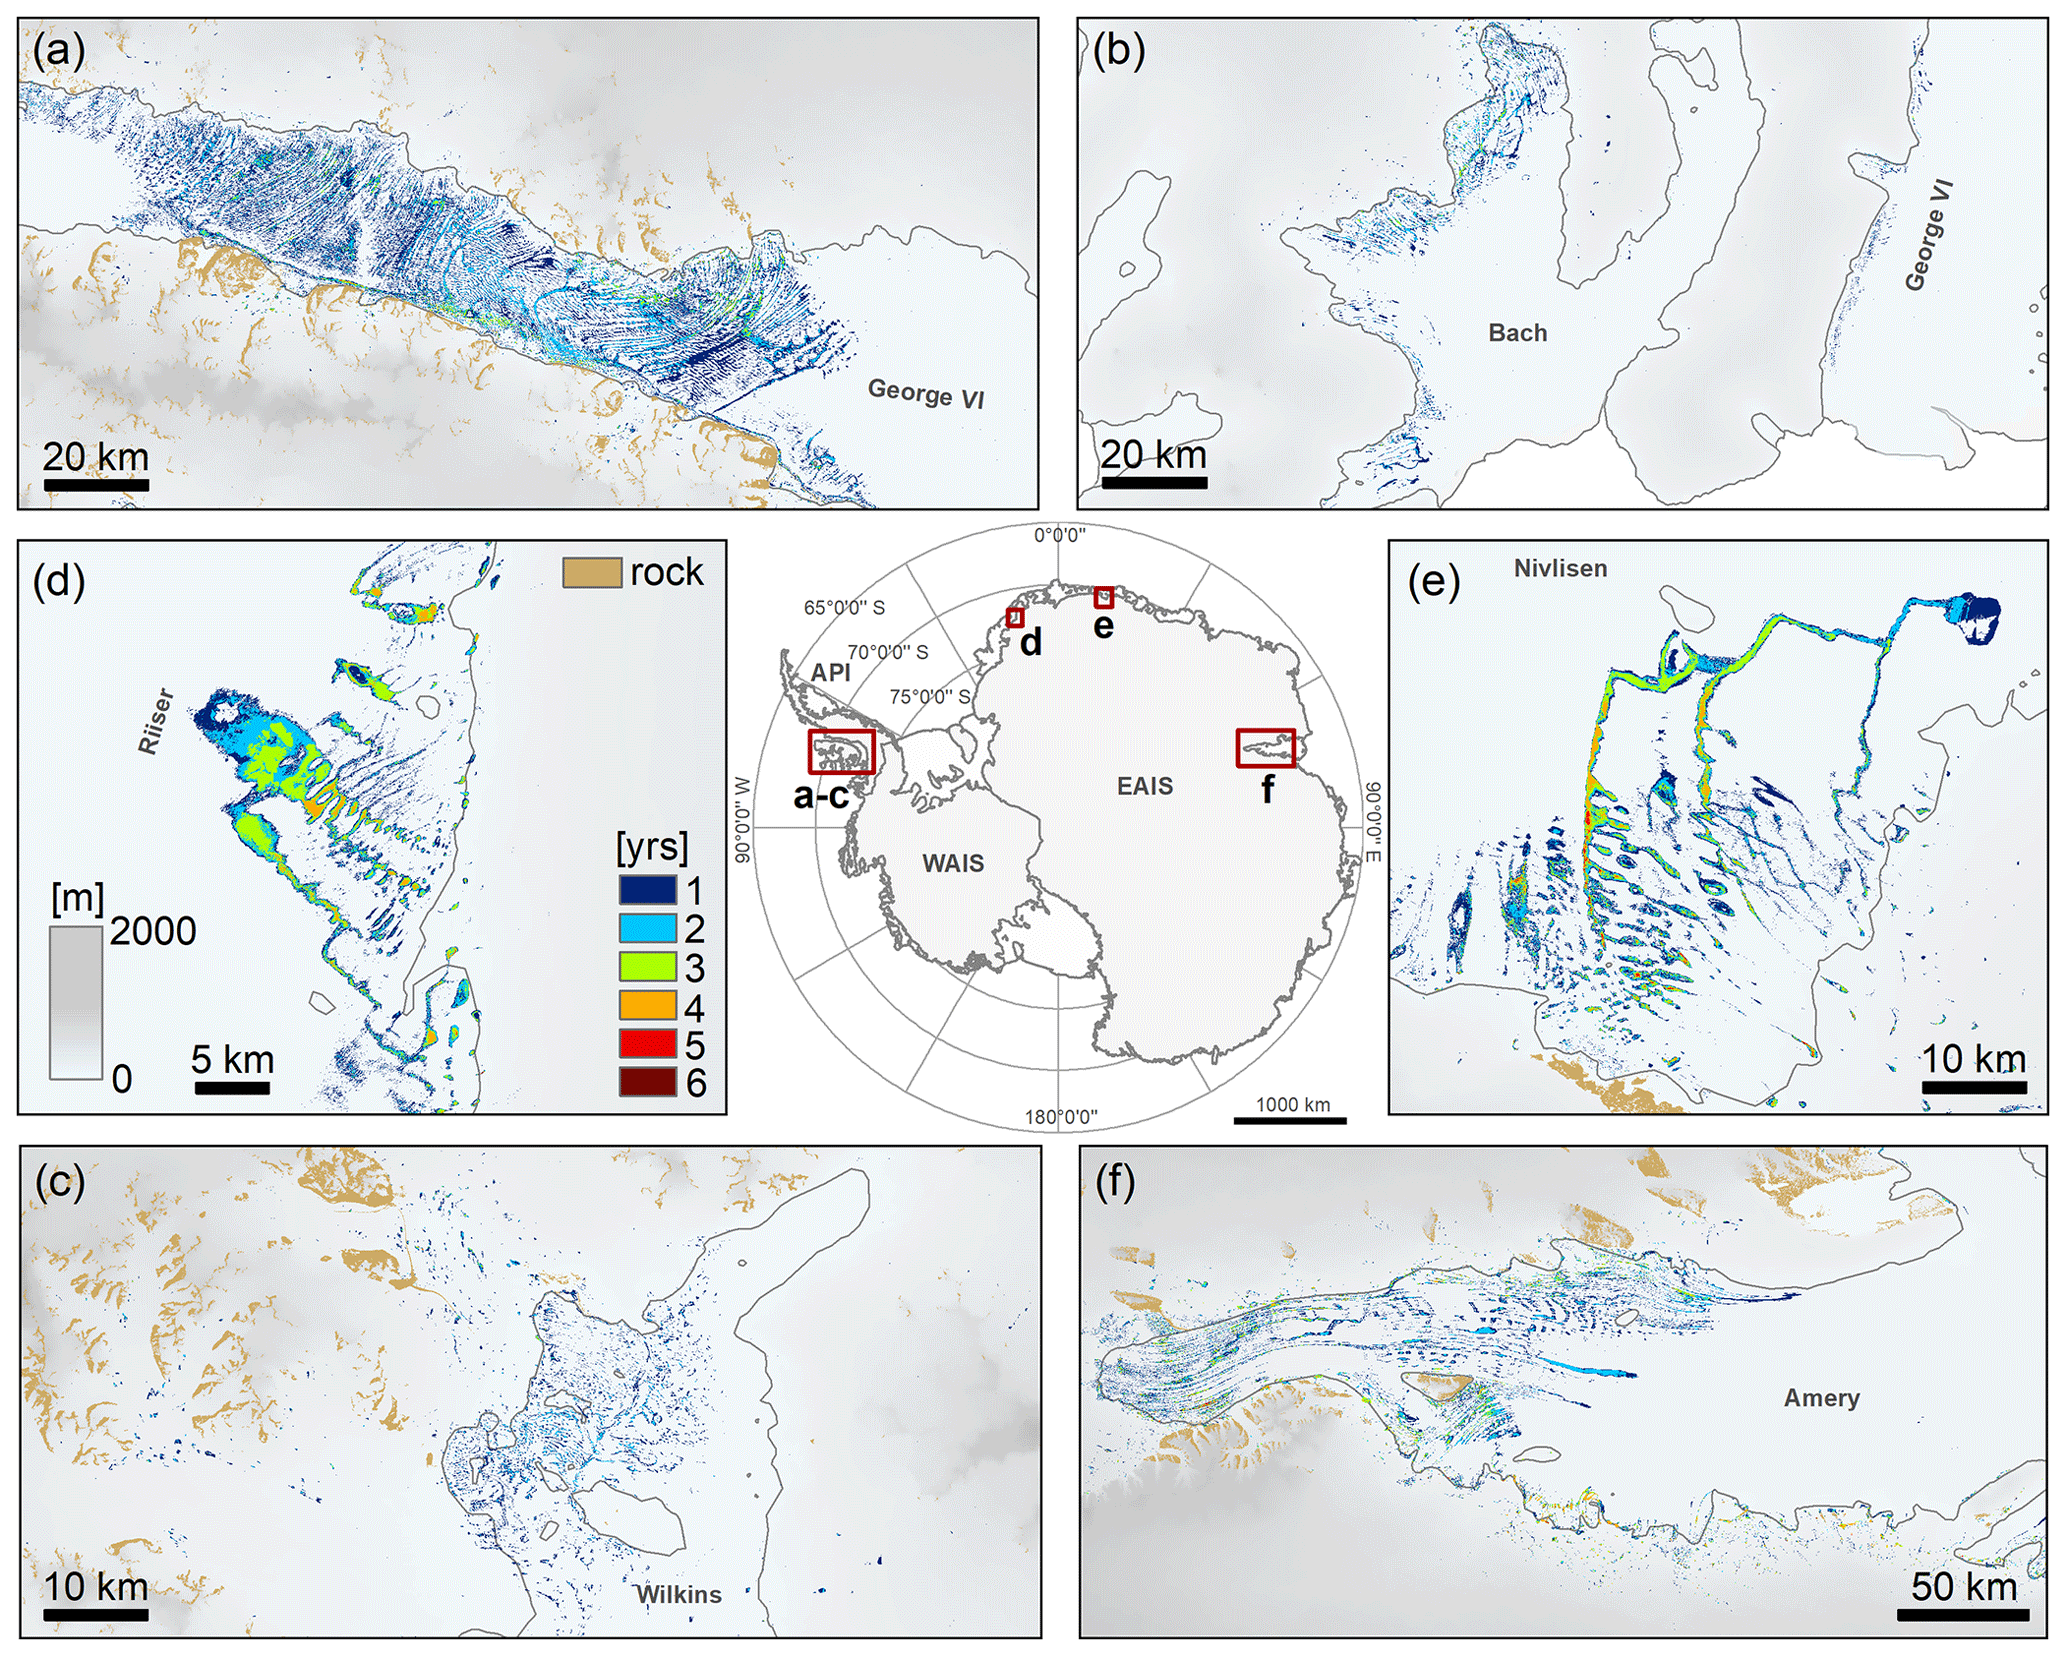
Figure 5Inter-annual January recurrence of supraglacial lakes over George VI (a), Bach (b), Wilkins (c), Riiser-Larsen (d), Nivlisen (e) and Amery ice shelves (f). The overview map in the middle shows the approximate location of the AOIs. The outline of the Antarctic ice sheets is taken from IMBIE (2016), the coastline and grounding line (grey) data are from Mouginot et al. (2017) and Rignot et al. (2013), and Sentinel-2 bedrock data are from Dirscherl et al. (2020). The background elevation is the gap-filled 200 m Reference Elevation Model of Antarctica (Howat et al., 2019). In some regions, the movement of lakes with ice flow might have biased the calculation of annual lake recurrence times. Bigger map plots for each ice shelf can be found in Fig. S2. API: Antarctic Peninsula. WAIS: West Antarctic Ice Sheet. EAIS: East Antarctic Ice Sheet.
4.1.2 East Antarctic ice shelves
Supraglacial lake extent dynamics on the EAIS (Fig. 3d–f) differ from the pattern observed on the API. Over all three ice shelves, comparatively high lake coverage was observed during the 2016–2019 melting seasons, while particularly low lake coverage was found for the 2020–2021 melting season. This pattern is also reflected in the calculation of supraglacial lake extent anomalies for the overall period 2016–2021 (Fig. 4d–f). The highest supraglacial lake extents over Riiser-Larsen (∼85 km2), Nivlisen (∼107 km2) and Amery (∼1373 km2) ice shelves were observed during early January 2020, late January 2019 and early January 2019, respectively. The average onset of EAIS supraglacial lake formation was in late December, with lakes persisting longer throughout the melting seasons compared to API lakes.
The annual recurrence of lakes during January shows clustered supraglacial lake occurrence near the grounding line of Riiser-Larsen Ice Shelf, where a blue ice region is present (Figs. 2d and 5d); lakes spreading across Nivlisen Ice Shelf, with a progressive advance in a north-easterly direction (Figs. 5e and S3); and widespread lake occurrence on the southern and eastern Amery Ice Shelf (Fig. 5f). During years of peak lake occurrence, lakes expanded further onto the flat ice shelves, while years with lower lake coverage were characterized by lakes clustering closer to the grounding line, rock outcrop or blue ice (Figs. 1d–f, 2d, 5d–f and S3). Over all three ice shelves, lakes formed at low elevations and low surface slopes. At the same time, the January recurrence of lakes reached up to 4–5 years in local depressions upstream of the grounding line (Fig. 5d–f).
4.2 Multi-temporal correlation analysis
4.2.1 Correlation analysis with spatial averages
Figure 6 presents the results of the statistical correlation analysis between climate variables and fractional lake extents (see Tables S1 and S2 in the Supplement for individual correlation values). As can be seen, bi-weekly mean and maximum air temperature correlates positively at lag 0–1 over all three ice shelves considering both spatial averages (Fig. 6a) and anomalies of spatial averages (Fig. 6b). Moreover, lake extents over George VI Ice Shelf correlate positively with spatial averages of lag 2 solar radiation, and lake extents over Wilkins Ice Shelf correlate negatively with anomalies of lag 1 solar radiation and lag 1 wind direction. Lastly, surface melt correlates positively over Bach and Wilkins ice shelves considering spatial averages and anomalies.
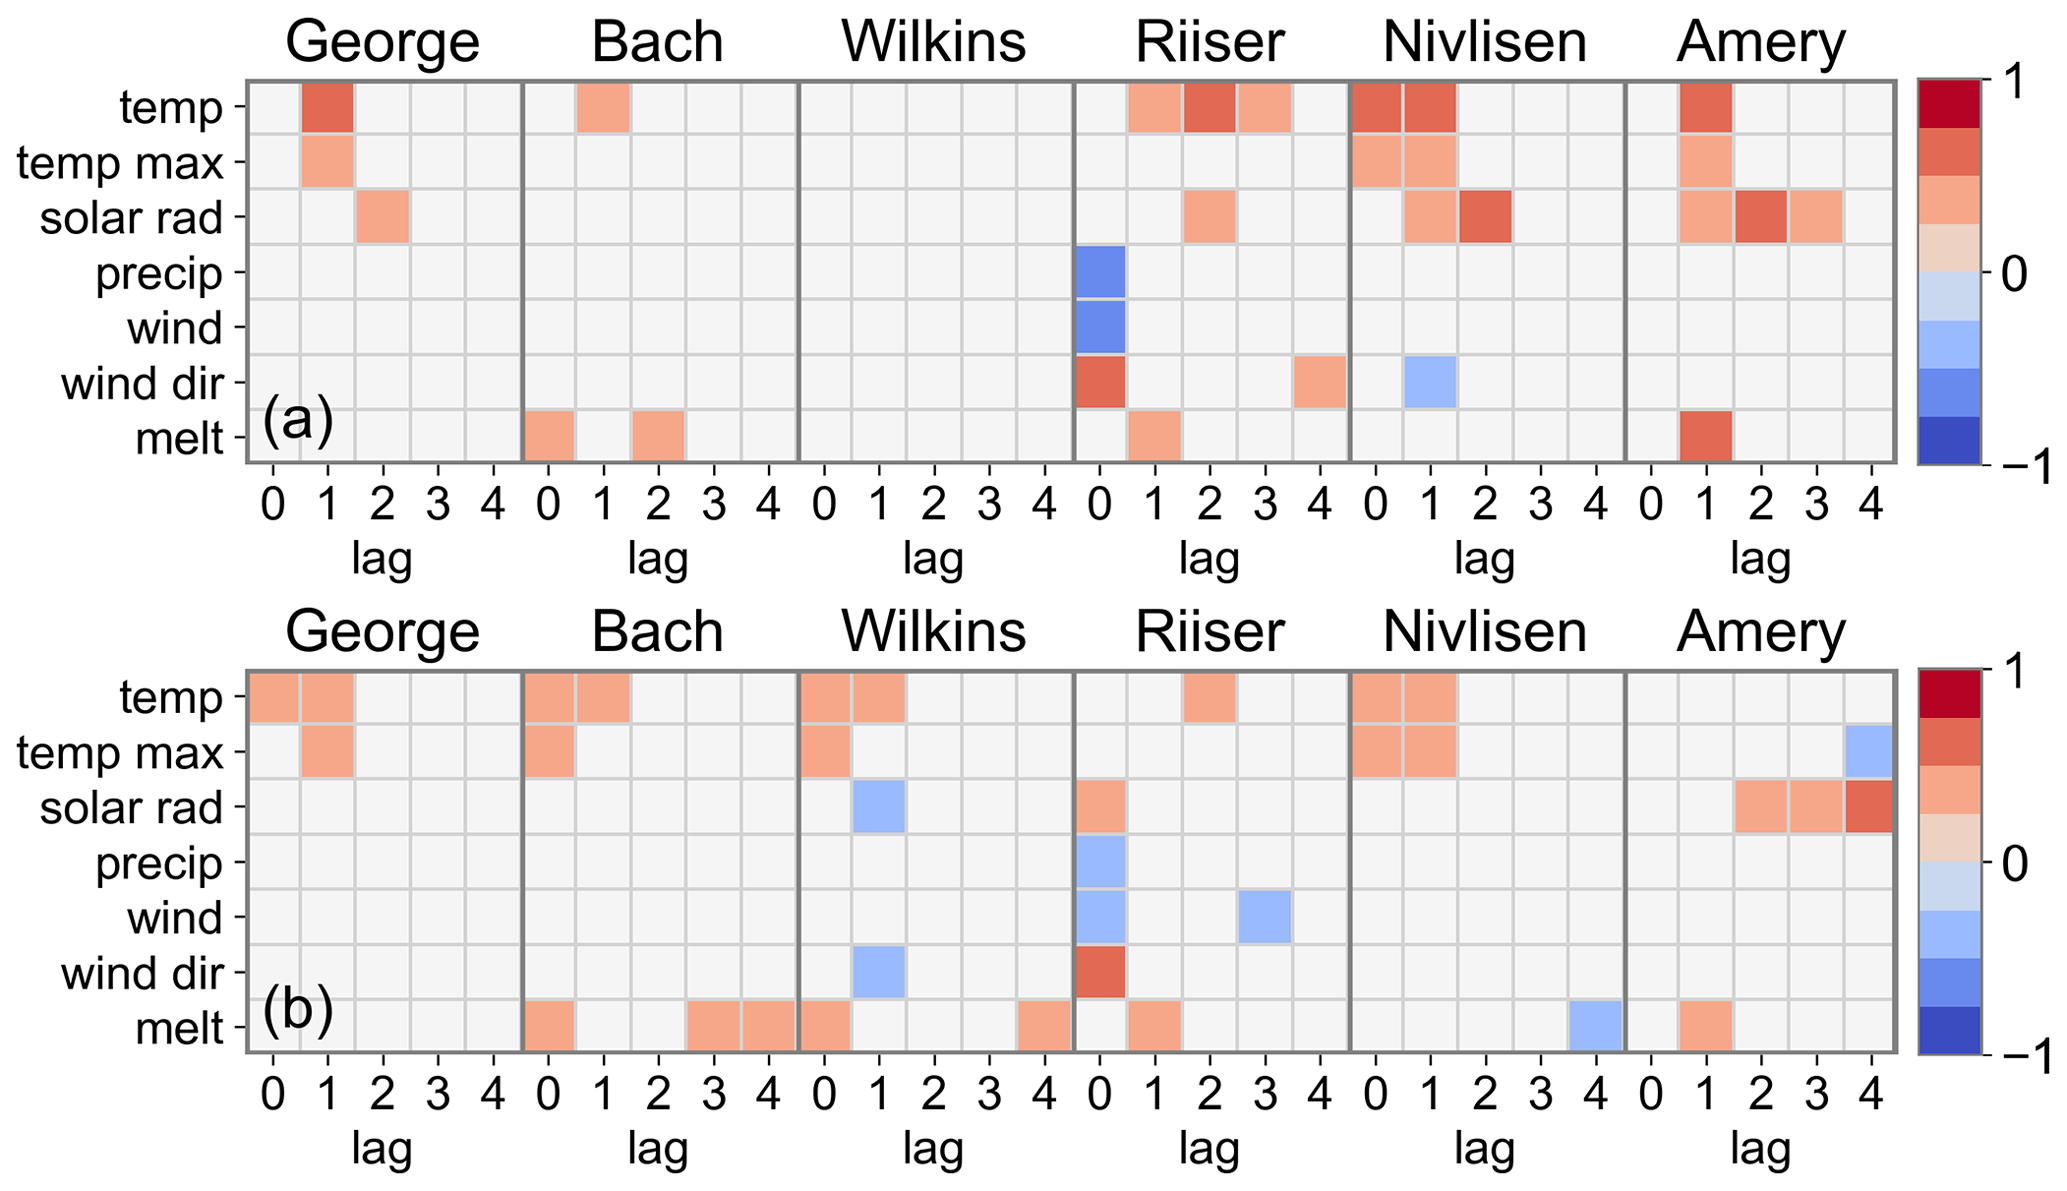
Figure 6(a) Results of the statistical correlation analysis between spatially averaged fractional lake extents and climate variables air temperature (temp), maximum air temperature (temp max), solar radiation (solar rad), precipitation (precip), wind magnitude (wind), wind direction (wind dir) and snowmelt (melt) at time lags 0–4 over George VI, Bach, Wilkins, Riiser-Larsen, Nivlisen and Amery ice shelves. (b) Results of the statistical correlation analysis between anomalies of spatial averages of fractional lake extents and anomalies of climate variables. The correlation coefficient is given in the interval [−1, +1] and is illustrated for significant correlations with p<0.05 only. Correlations with p>0.05 are masked. More detail on the individual correlation values can be found in Tables S1 and S2.
Linear correlation analysis over EAIS ice shelves (Fig. 6a and b) returned significant positive lag 0–3 relationships with bi-weekly mean and maximum air temperature considering both spatial averages and anomalies. Likewise, solar radiation correlates positively at varying lags over all three ice shelves. Over Riiser-Larsen Ice Shelf, significant negative lag 0 correlation was found for precipitation and wind magnitude, and significant positive lag 0 correlation was found for wind direction considering spatial averages and anomalies. Further, statistical analysis over Nivlisen Ice Shelf returned negative lag 1 correlation for wind direction. Finally, surface melt correlates positively at lag 1 over Riiser-Larsen and Amery ice shelves.
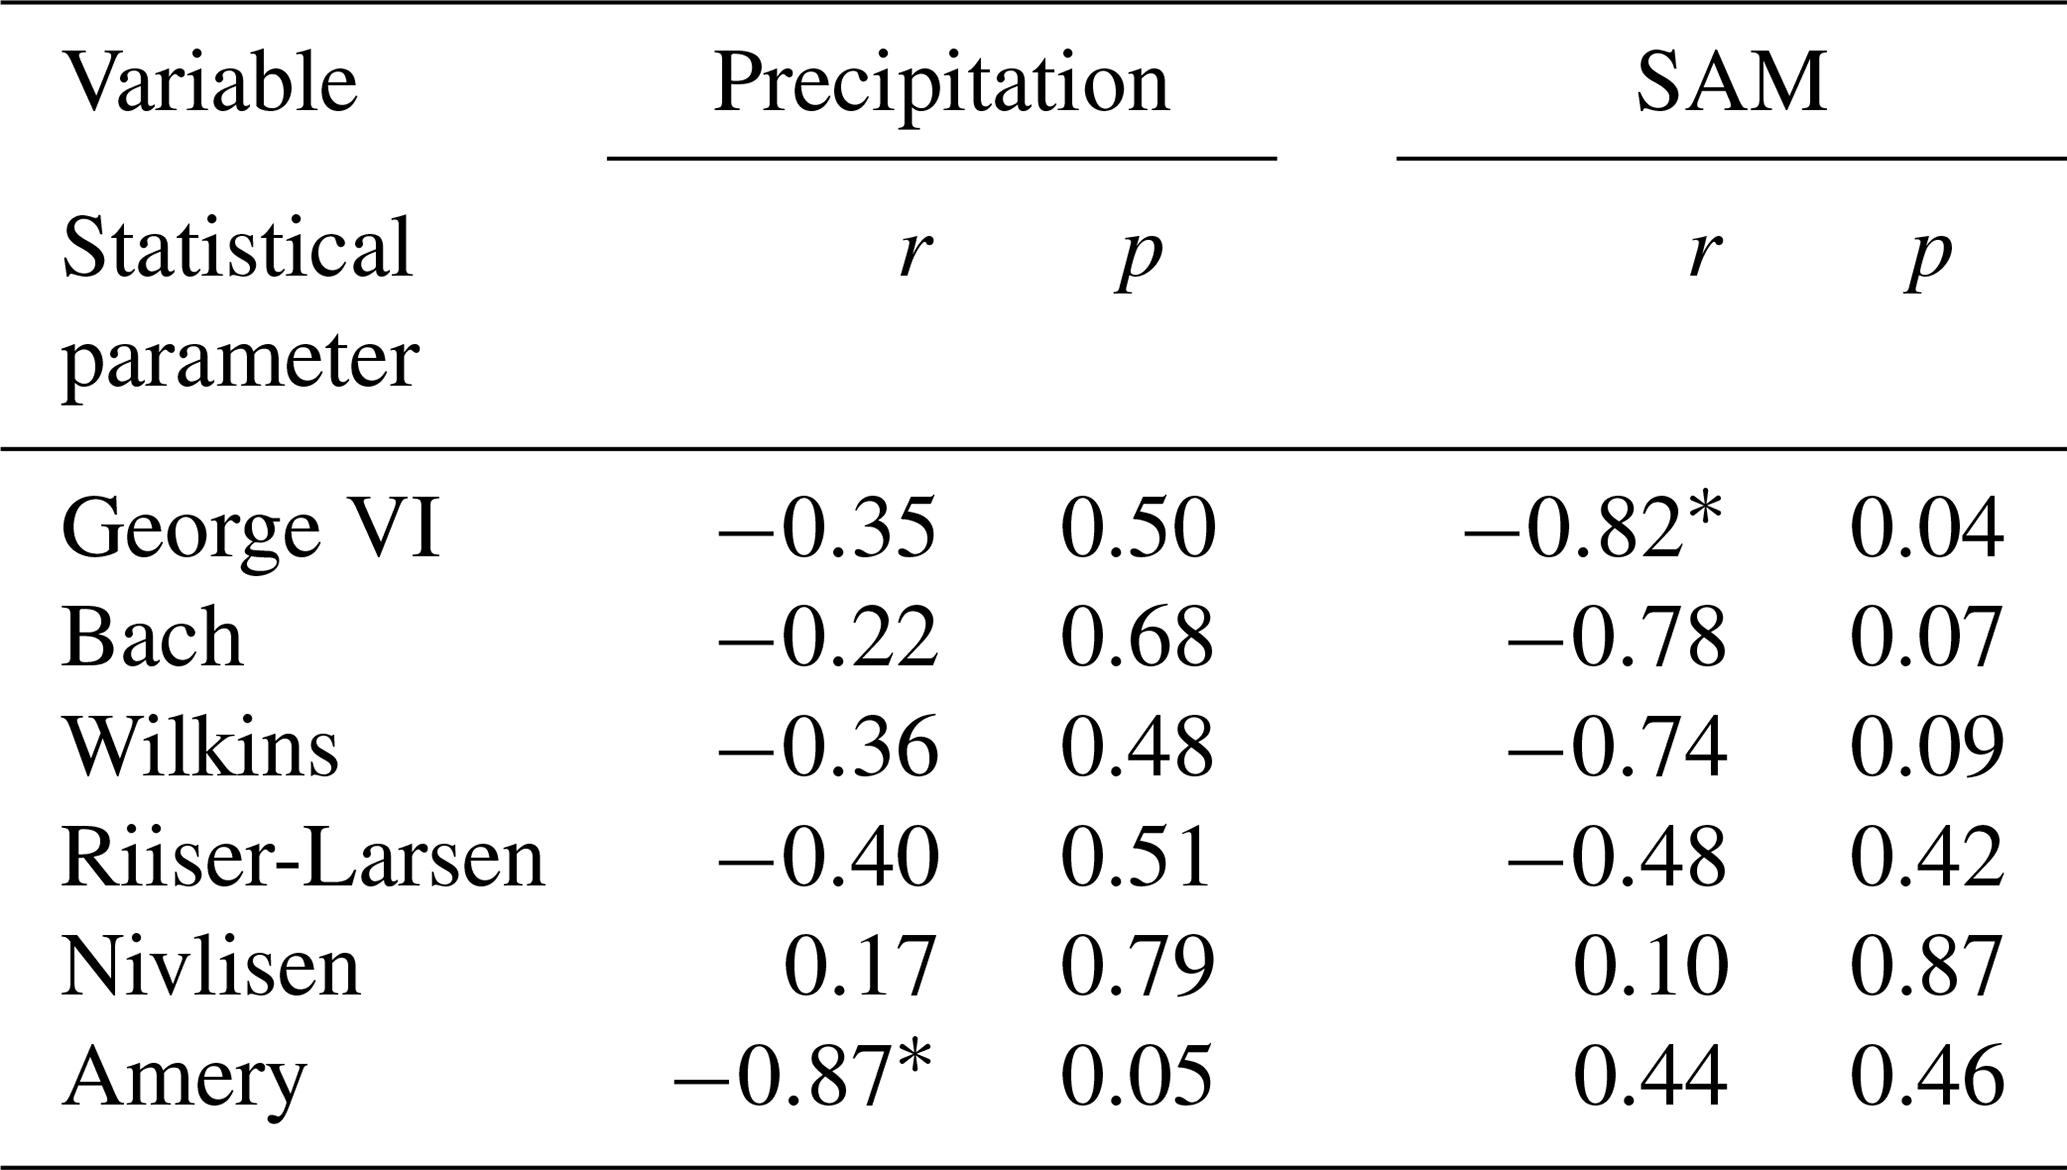
Correlation with annual SAM (Table 1) indicates a strong negative linear relationship over all three API ice shelves. Over EAIS ice shelves, r values are comparatively low, with Riiser-Larsen correlating negatively and Nivlisen and Amery returning positive correlation values. Regarding correlation with previous-year precipitation (Table 1), we find negative relationships over Amery, George VI, Bach, Wilkins and Riiser-Larsen ice shelves and low positive correlation over Nivlisen Ice Shelf.
Table 1Results of the statistical correlation analysis between fractional lake extents and previous-year precipitation as well as annual Southern Annular Mode (SAM), with r reflecting the Pearson correlation and p the p value describing statistical significance. Due to the low number of observations used for correlation, the p value might not be representative, and rather r should be used for interpretation. Statistical significance levels of p<0.05 (*), p<0.01 () and p<0.001 () are used.
4.2.2 Correlation analysis at pixel level
Figures 7 and 8 illustrate selected results for pixel-based correlations, chosen on the basis of Fig. 6. The figures show only significant pixels with the highest correlations considering all performed cross-correlations as well as the corresponding lags. Remaining pixel-based correlations can be found in the Supplement (Figs. S4 and S5). Pixel-based correlation over George VI Ice Shelf (Fig. 7a–h) revealed positive relationships for temperature and solar radiation correlating at higher lags in the central ice shelf section compared to locations near the grounding line. Likewise, statistical analysis over Bach Ice Shelf (Fig. 7i–p) implies predominant positive correlations for temperature and radiation. Over both ice shelves, snowmelt correlates positively, and wind direction correlates positively in the east and negatively in the west. Spatial correlations over Wilkins Ice Shelf were rather heterogeneous (see Figs. 5c and 7q–x).
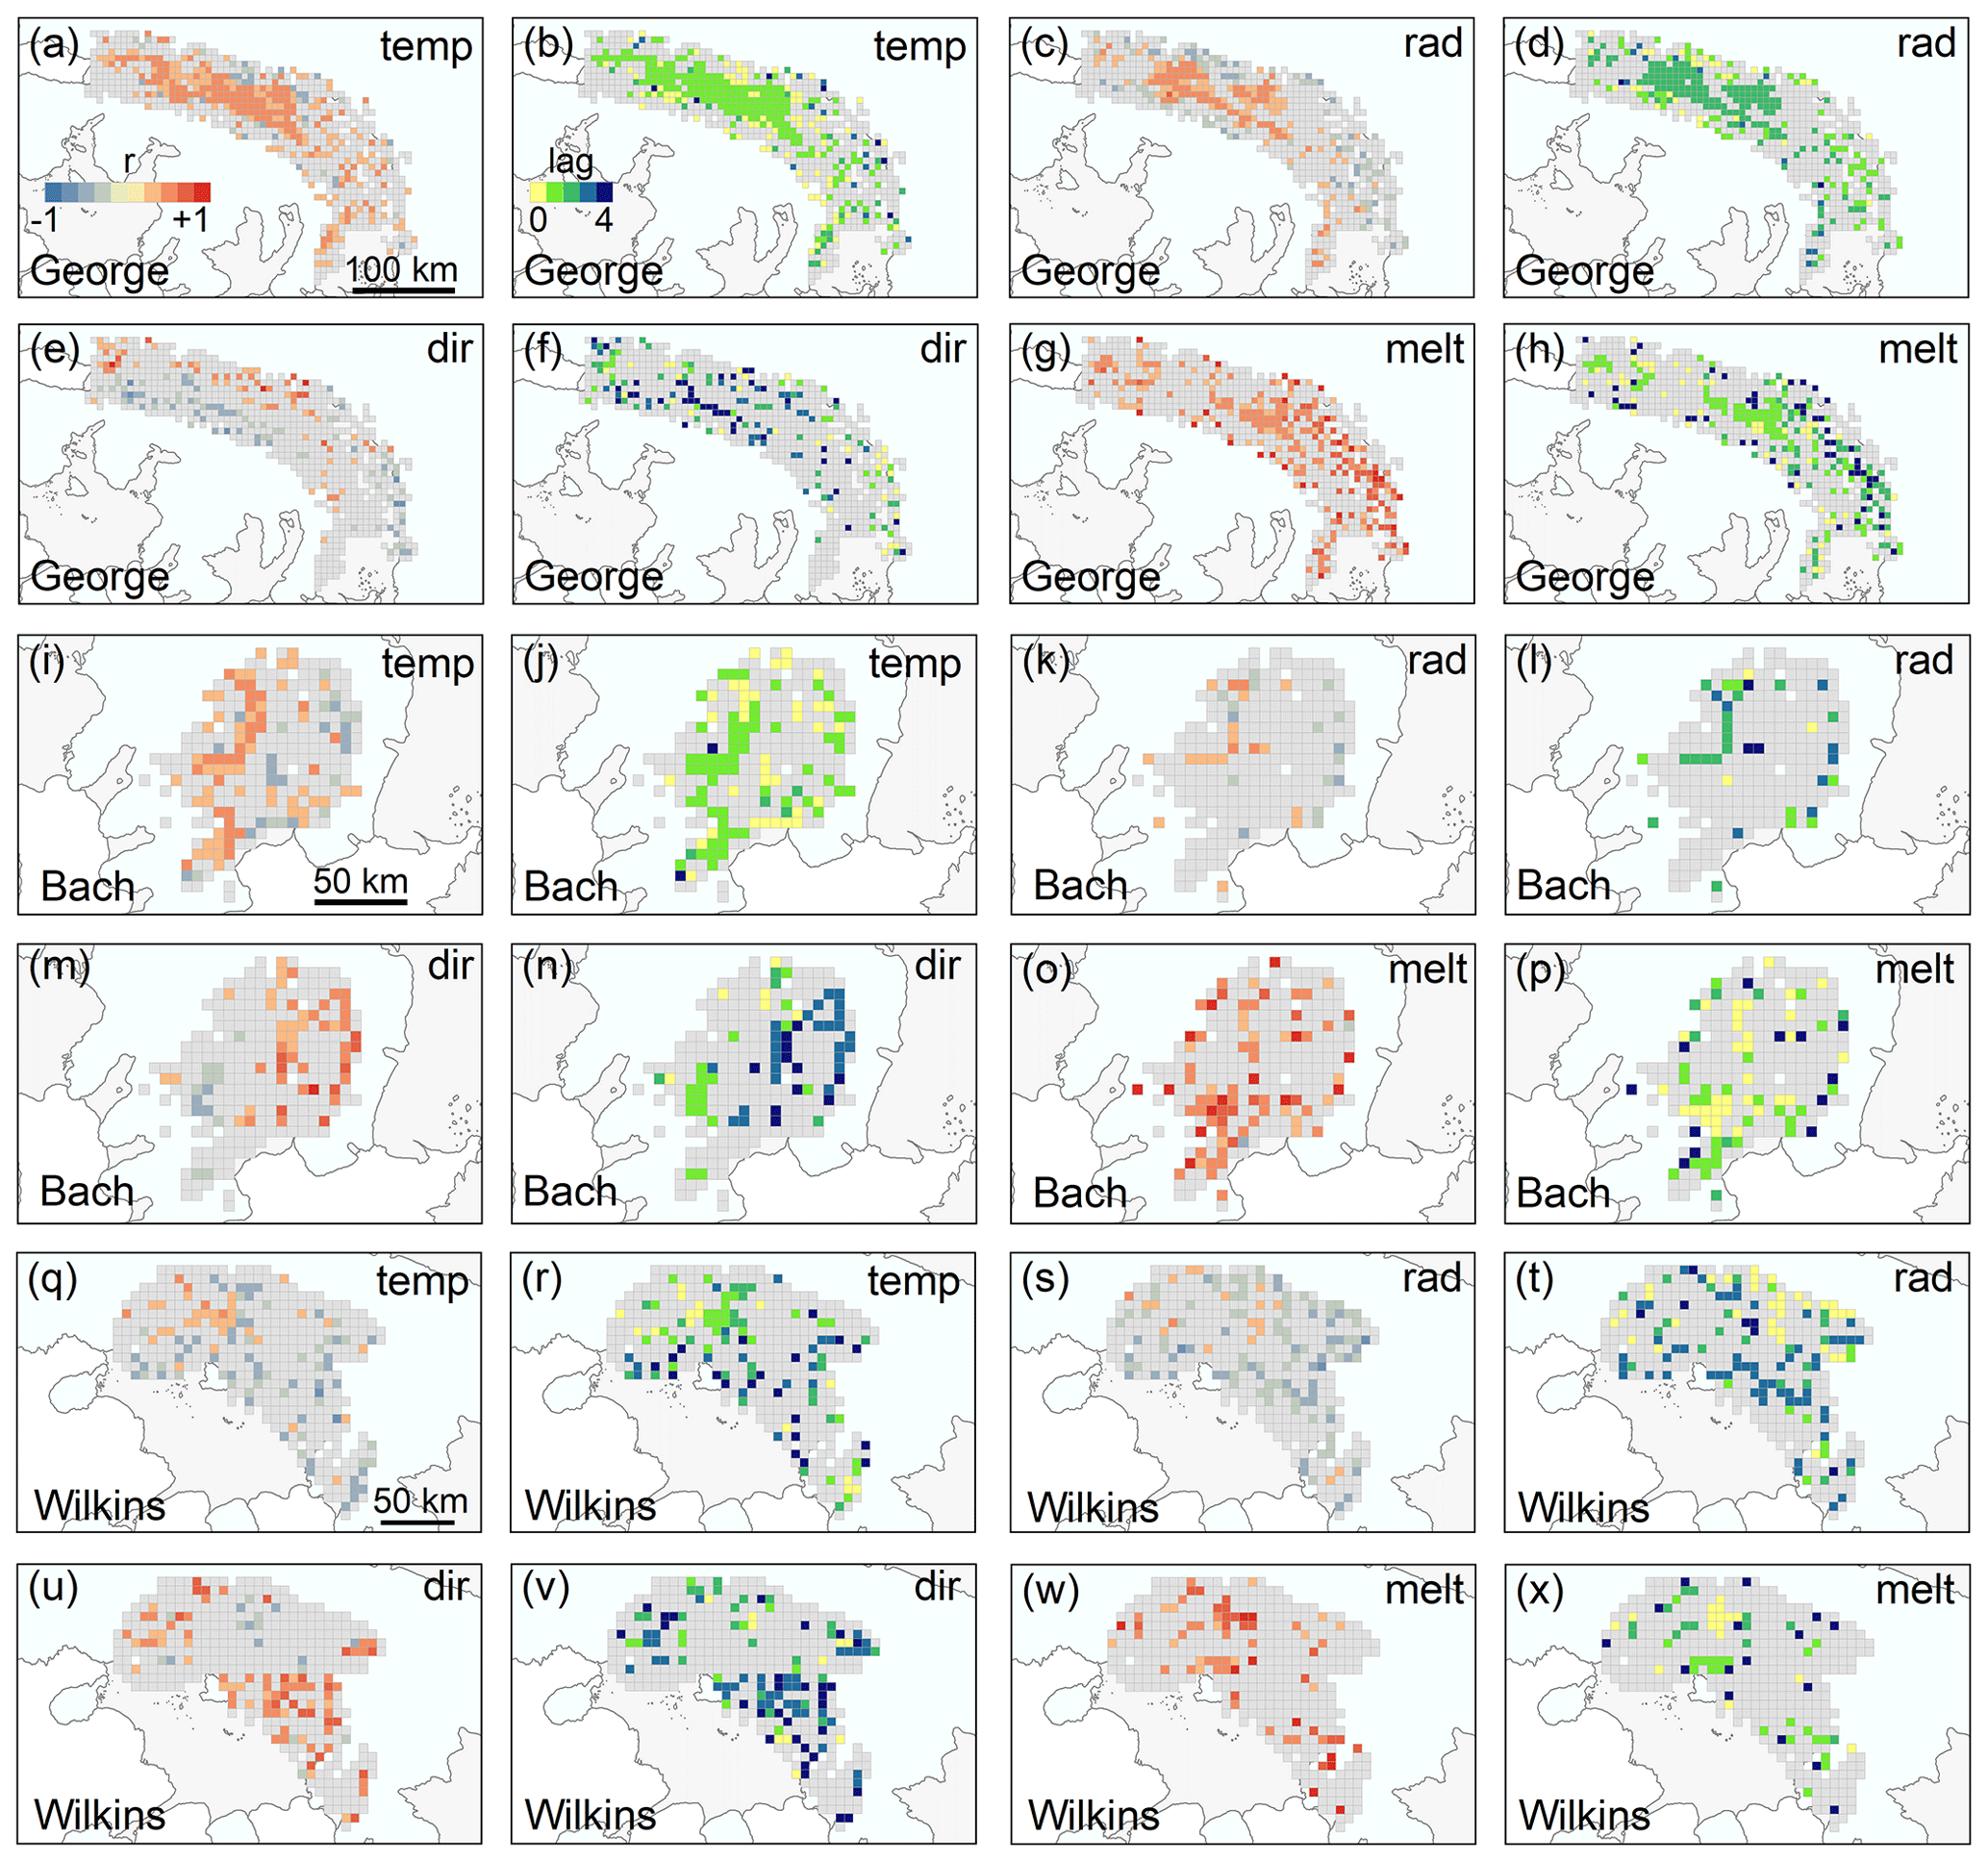
Figure 7Pixel-based Pearson correlations (r) (a, c, e, g, i, k, m, o, q, s, u, w) and corresponding temporal lags (b, d, f, h, j, l, n, p, r, t, v, x) between fractional lake extents and climate variables air temperature (temp), solar radiation (rad), wind direction (dir) and snowmelt (melt) over the API ice shelves George VI (a–h), Bach (i–p) and Wilkins (q–x). Pixels with p>0.05 are masked. The coastline and grounding line (grey) data are from Mouginot et al. (2017) and Rignot et al. (2013).
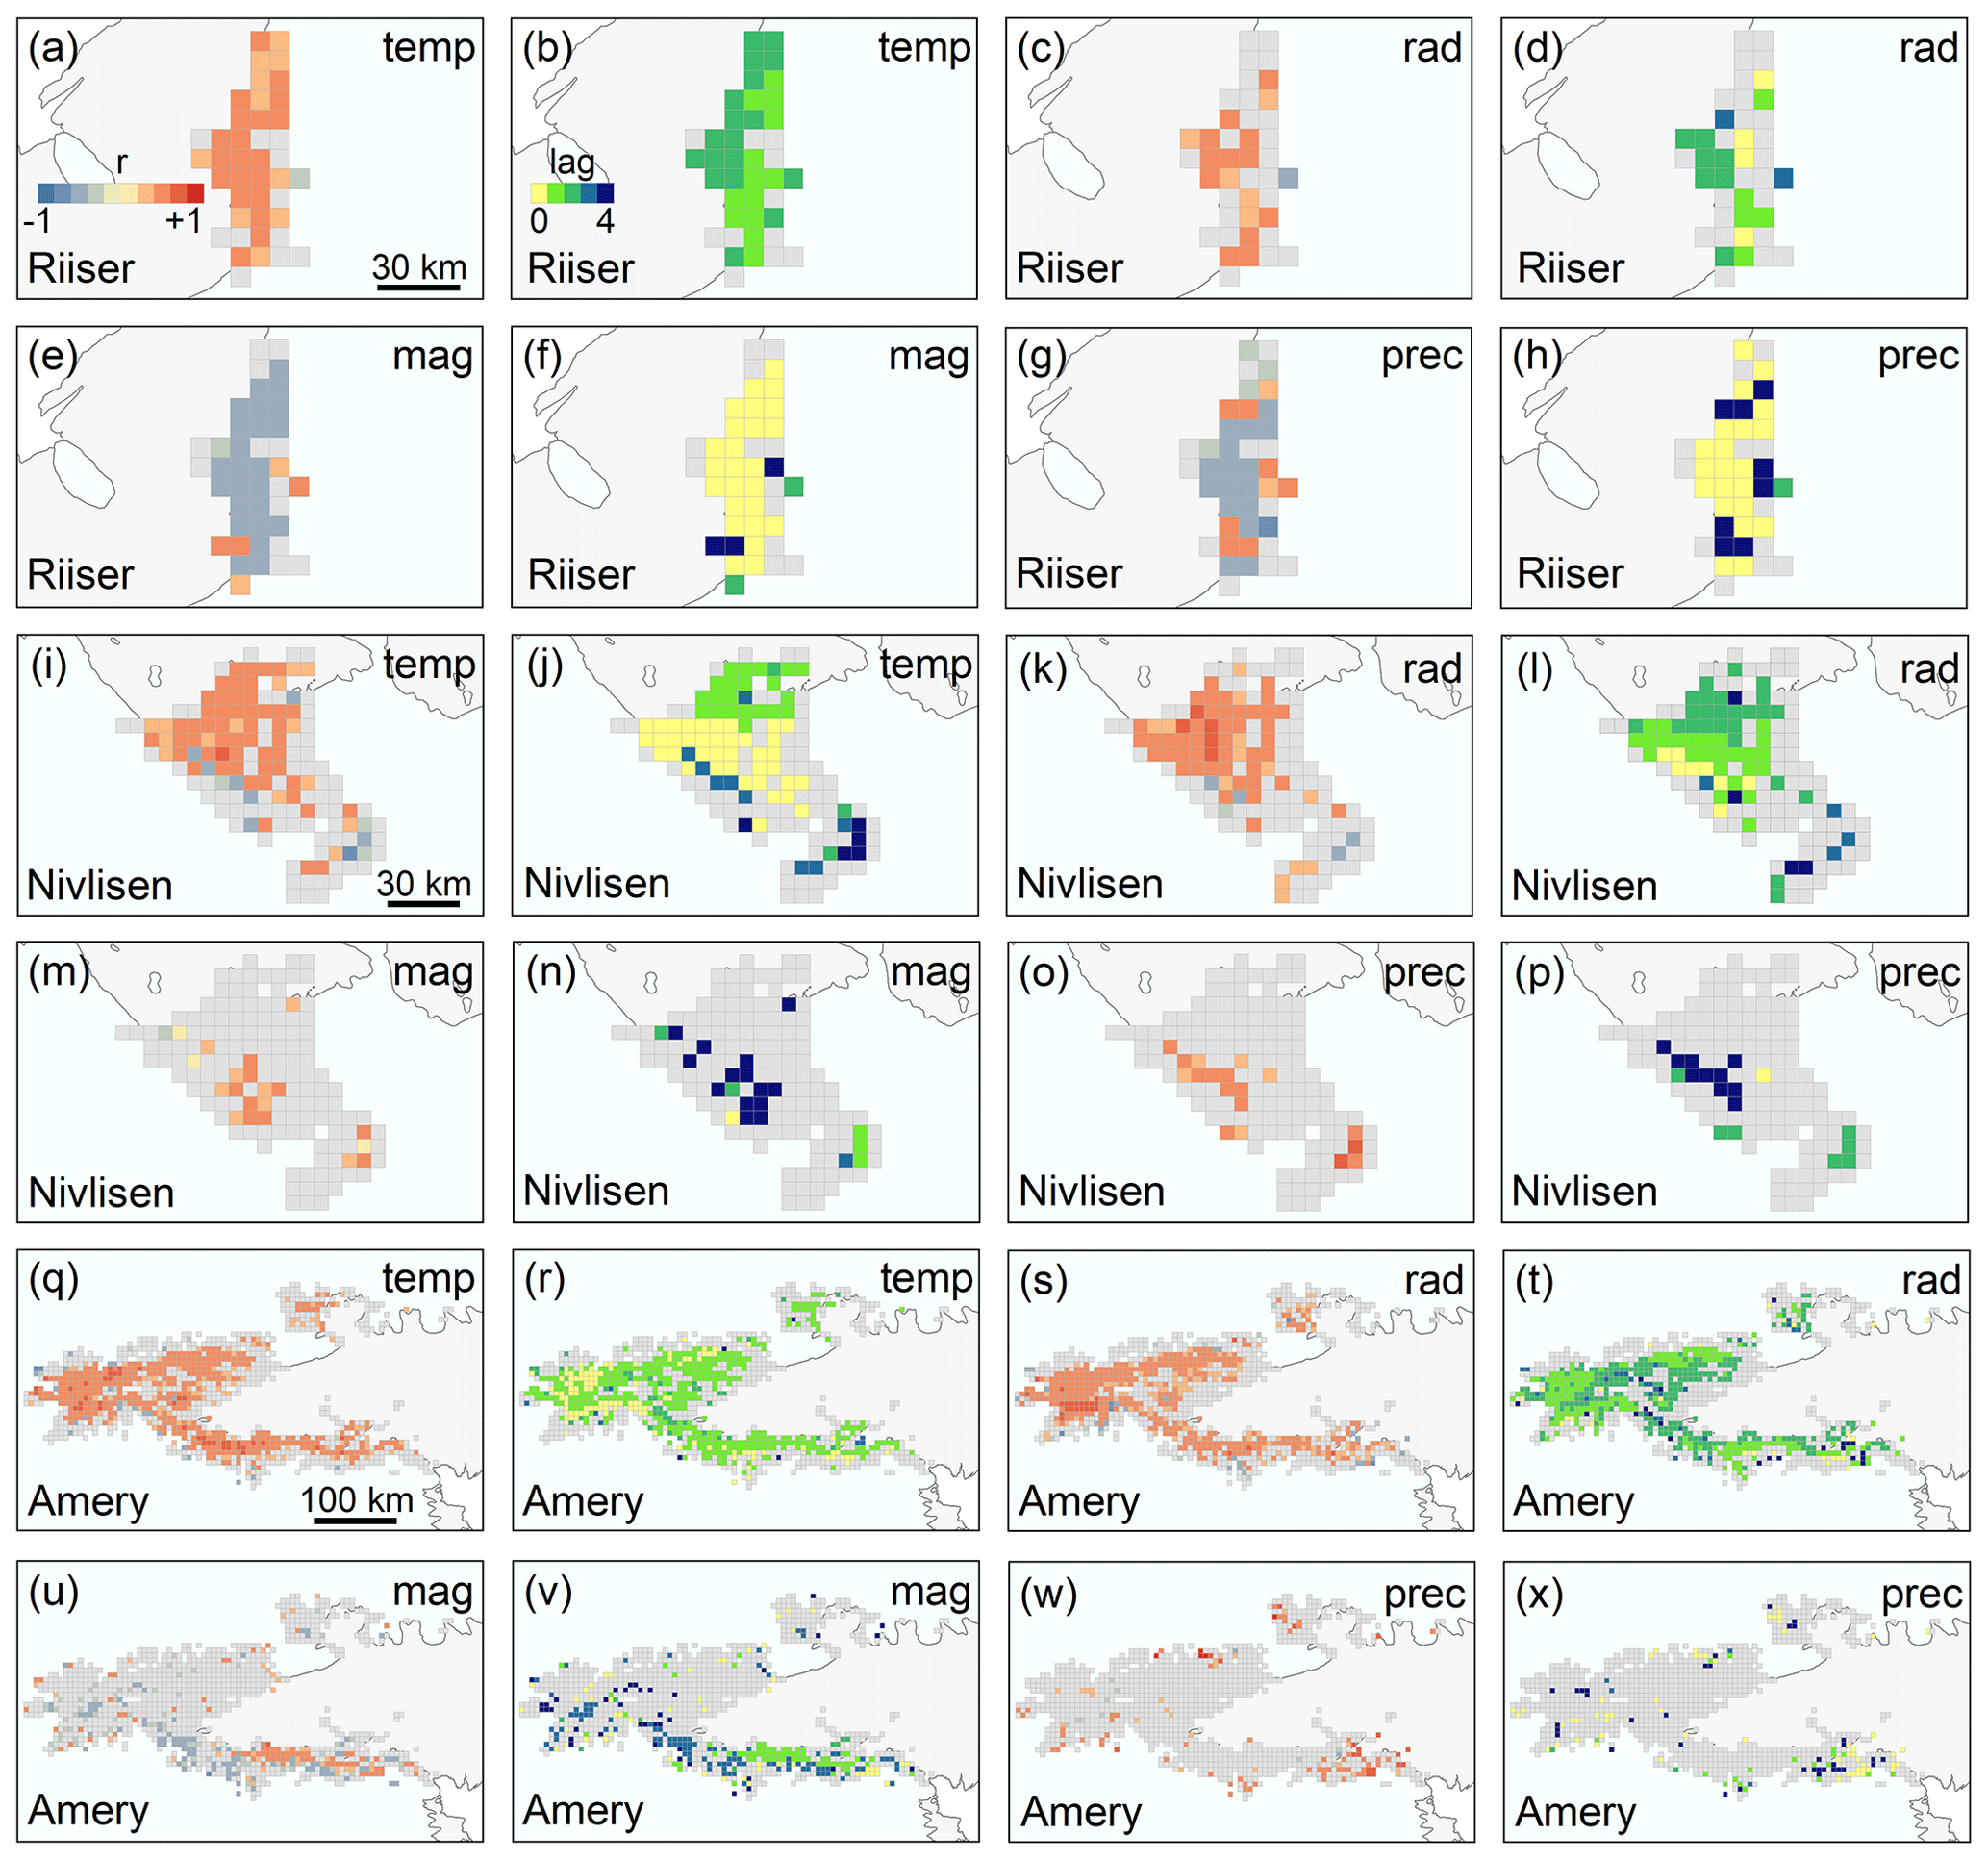
Figure 8Pixel-based Pearson correlations (r) (a, c, e, g, i, k, m, o, q, s, u, w) and corresponding temporal lags (b, d, f, h, j, l, n, p, r, t, v, x) between fractional lake extents and climate variables air temperature (temp), solar radiation (rad), wind magnitude (mag) and precipitation (prec) over the EAIS ice shelves Riiser-Larsen (a–h), Nivlisen (i–p) and Amery (q–x). Pixels with p>0.05 are masked. The coastline and grounding line (grey) data are from Mouginot et al. (2017) and Rignot et al. (2013).
Over EAIS ice shelves (Fig. 8a–x), positive correlation was found for bi-weekly average air temperature and solar radiation. While lags were varying for each ice shelf, they were generally higher on the ice shelf area than on adjacent inland ice and near the grounding line. Moreover, correlation of lake extents with wind magnitude and precipitation over Riiser-Larsen Ice Shelf revealed a negative relationship at lag 0, and correlation with wind magnitude over Amery Ice Shelf revealed negative and positive relationships at varying lags along the south-eastern and eastern grounding zone.
Finally, Fig. 9 outlines the spatial correlation pattern between previous-year precipitation and January fractional lake extents. As correlations result from only few observations, potentially leading to unreliable values of p, correlations with p>0.05 are also shown. As can be seen, previous-year precipitation correlates negatively over regions of frequent lake recurrence (Fig. 5) on George VI, Bach, Wilkins, Riiser-Larsen and Amery ice shelves and positively over most of Nivlisen Ice Shelf.
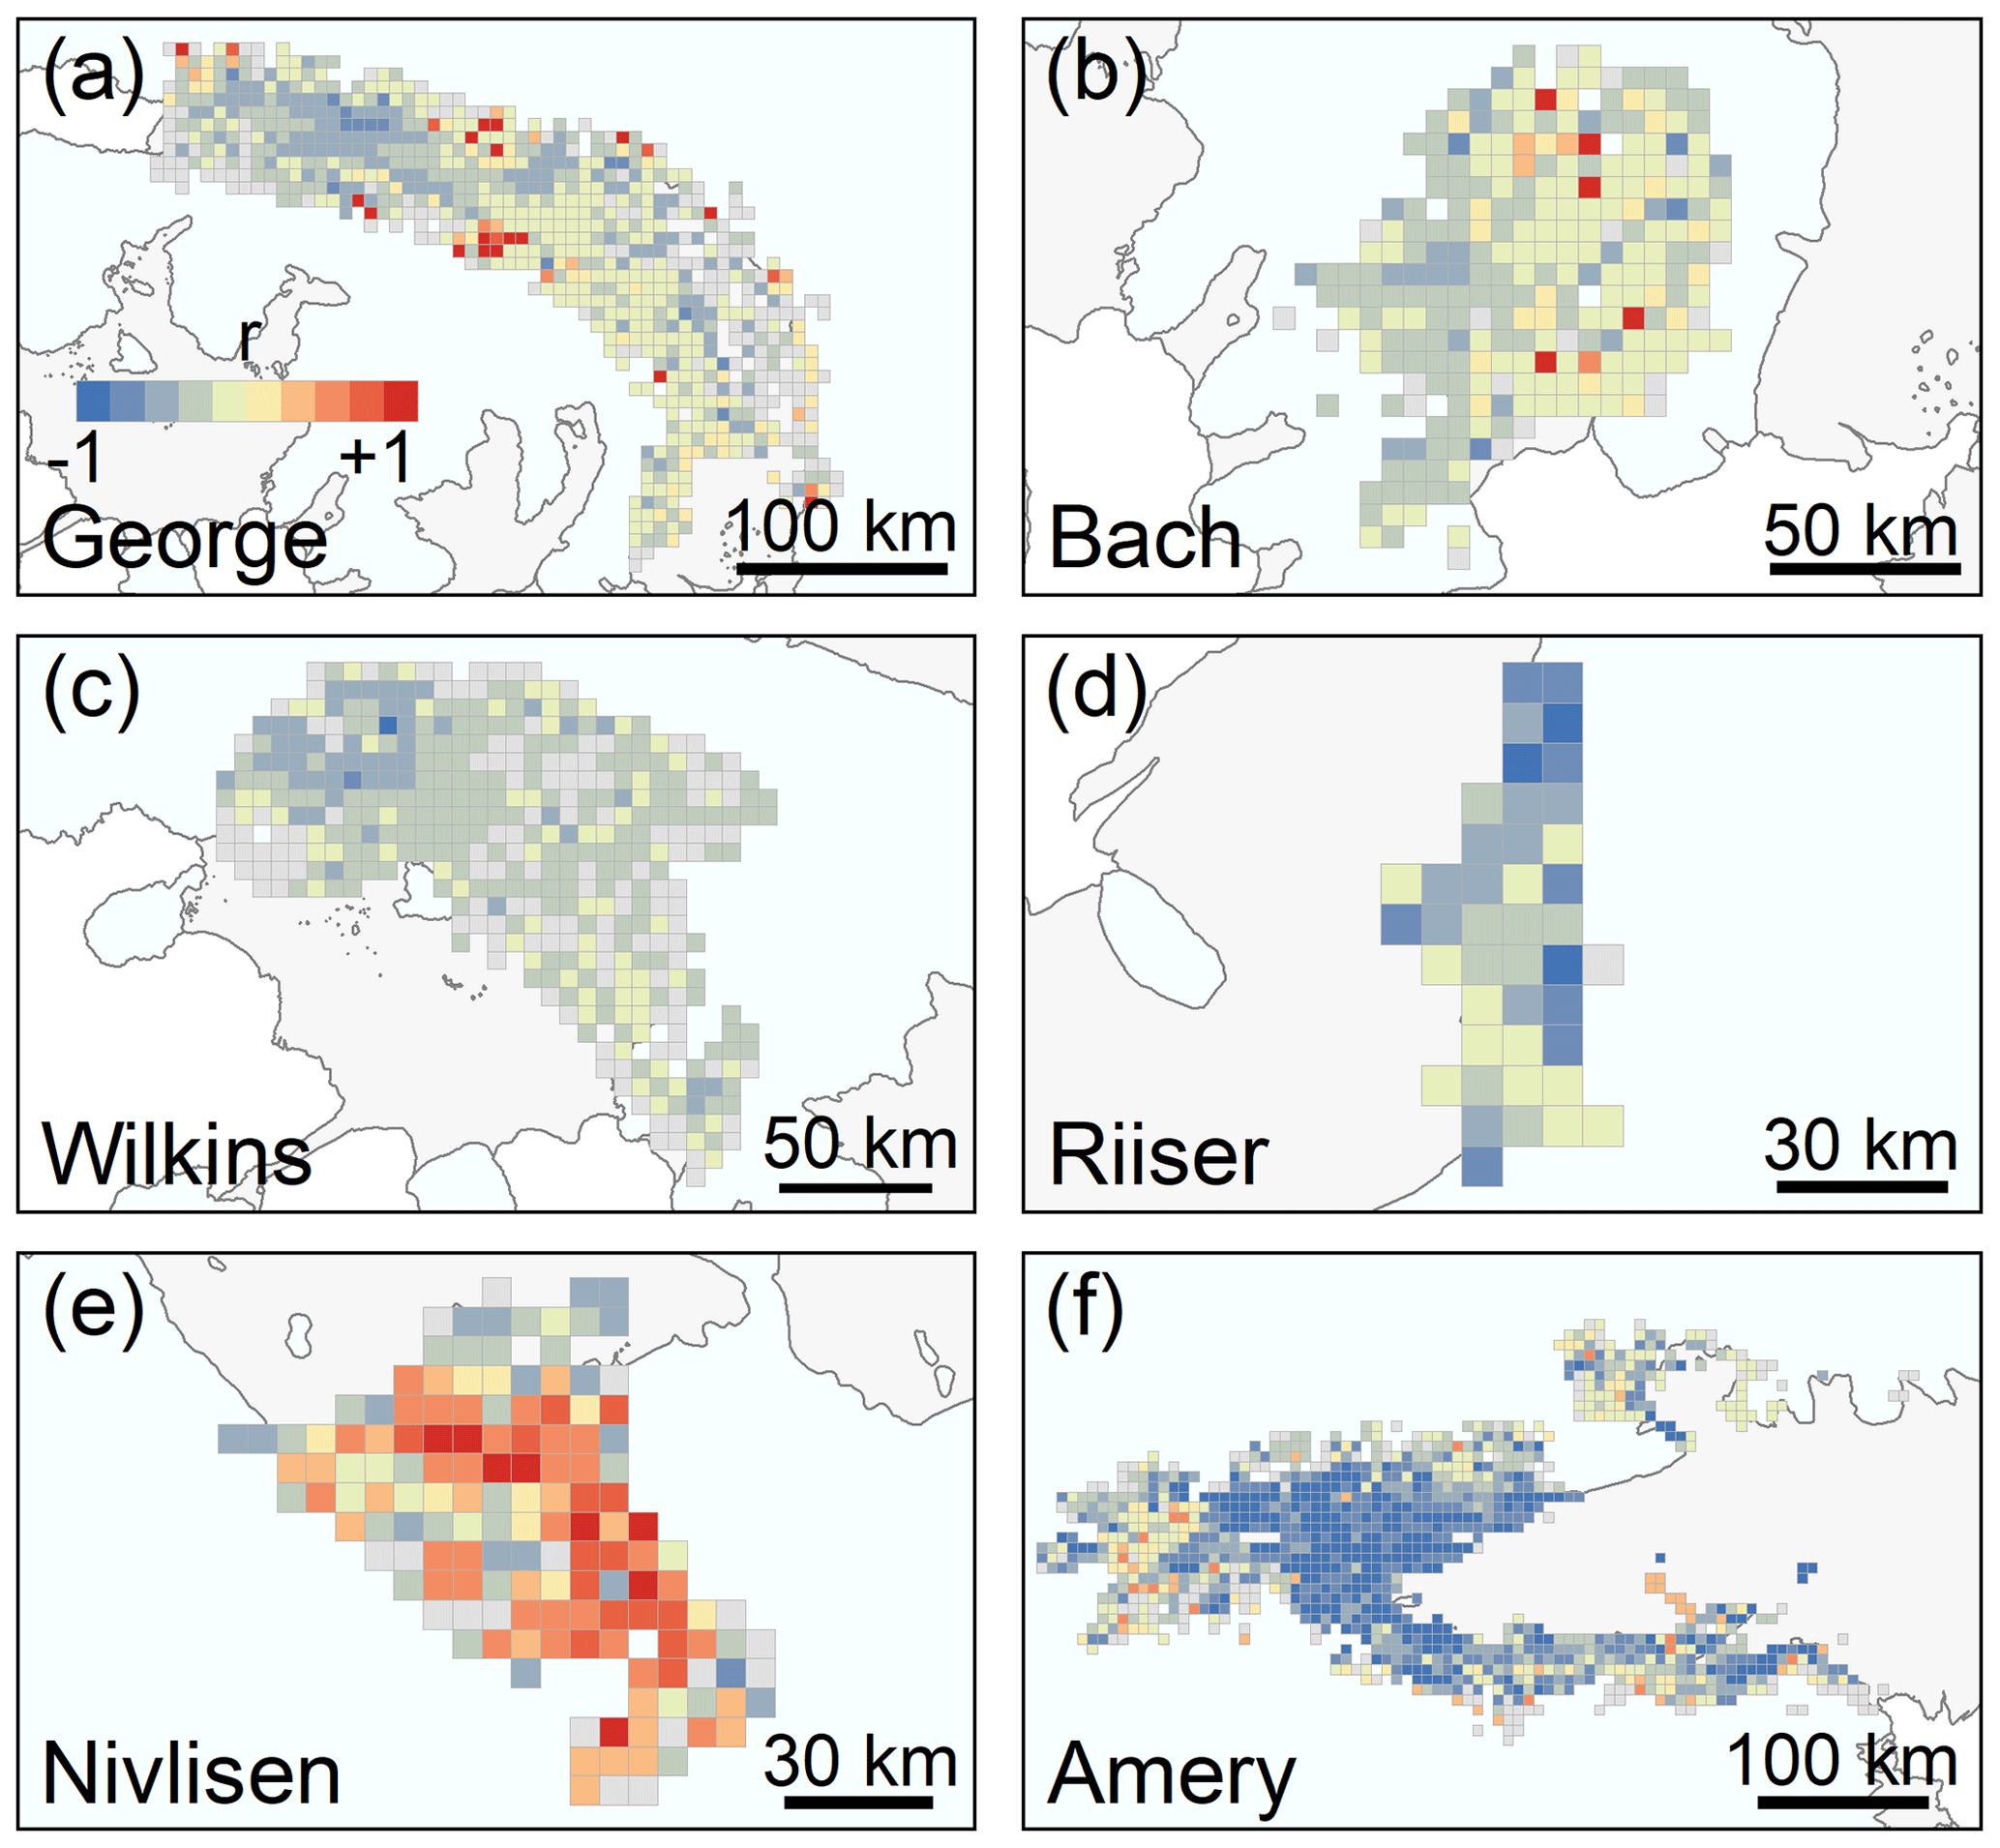
Figure 9Pixel-based correlations (r) between January fractional lake extents and previous-year precipitation over George VI, Bach, Wilkins, Riiser-Larsen, Nivlisen and Amery ice shelves. Due to the low number of observations, also correlations with p>0.05 are shown. The coastline and grounding line (grey) data are from Mouginot et al. (2017) and Rignot et al. (2013).
5.1 Environmental controls on supraglacial lake extent dynamics in 2015–2021
5.1.1 Antarctic Peninsula ice shelves
Starting with local control factors, correlation analysis with precipitation revealed API lake coverage to be peaking in years with previous-year low precipitation (Table 1, Fig. 9a–c). This highlights that supraglacial lake formation is promoted over more compact, air-depleted firn (Arthur et al., 2020a; Leeson et al., 2020), while fresh snow dampens lake evolution allowing the percolation of meltwater into the low-density firn layer before it can accumulate on the surface (Kuipers Munneke et al., 2014; Lenaerts et al., 2017; Stokes et al., 2019). In fact, low precipitation in 2017, 2019 and 2020 might have led to increased firn air depletion, potentially contributing to facilitated meltwater ponding in 2017–2018, 2019–2020 and 2020–2021. Apart from the local glaciological setting, also the local topography and ice shelf geometry control lake distribution. Over George VI Ice Shelf, meltwater accumulated in flow stripes controlled by the prevailing compressive flow regime (Fig. 5a) (LaBarbera and MacAyeal, 2011; Hambrey et al., 2015). Further, lakes on all three ice shelves appeared at low elevations and low surface slopes (Fig. 5a–c), being favourable to meltwater ponding (Arthur et al., 2020b; Stokes et al., 2019). Additionally, lake ponding was dictated by the ice shelf geometry and grounding line location where lakes tended to cluster (Fig. 5a–c). Other local factors that could have influenced lake distribution are the refreezing of meltwater in firn pore space and channelized basal melting, causing a modified ice surface topography (Spergel et al., 2021; Dow et al., 2018; McGrath et al., 2012).
In addition, cross-correlation analysis demonstrated a positive relationship between API supraglacial lake formation and air temperature, also considering temperature extremes, with lag 1 prevailing in regions where lakes form during high-melt years and lag 0 in regions where lakes form during low-melt years closer to the grounding line and rock outcrop (Figs. 5a–c, 6, and 7b, j, r). Moreover, the observed correlation pattern reveals that anomalously high or low lake extents result from anomalously high or low air temperatures (Fig. 6b). On the one hand, this indicates that meltwater ponding is initiated directly after temperature rises, particularly in regions where meltwater accumulation is promoted through melt–albedo feedbacks near rock outcrop, as present upstream of the grounding line of Wilkins and George VI ice shelves (Fig. 5a and c), while lake formation farthest from these regions occurs at slower timescales. On the other hand, meltwater transport across the ice shelves (Kingslake et al., 2017) later in the melting season can likely be attributed to higher lags downstream of the grounding lines (see connected drainage systems in Fig. 2a–c). The detected link between supraglacial lake formation and air temperature was previously reported for other Antarctic regions (Kingslake et al., 2015; Langley et al., 2016; Dell et al., 2020) and is well in line with the analysis in Banwell et al. (2021), suggesting that high meltwater ponding in 2019–2020 over George VI Ice Shelf results from sustained air temperatures ≥ 0 ∘C.
Over George VI and Bach ice shelves, solar radiation exhibited a positive relationship with supraglacial lake occurrence, particularly in regions where lakes cluster during high-melt years (Figs. 5a, b and 7c, d, k, l). This points towards the amount of incoming solar radiation being an equally important driver for supraglacial lake formation on API ice shelves. Similar conclusions were drawn by Laffin et al. (2021), who proposed that enhanced solar radiation is a main driver for foehn-induced melt on Bach and George VI ice shelves. In contrast, correlation with anomalies of solar radiation over Wilkins Ice Shelf returned a negative link at lag 1, which could indicate that lake formation results from enhanced longwave radiation, e.g. due to cloud cover and thus the higher importance of effects such as sensible heat transport, as discussed in Laffin et al. (2021) and Banwell et al. (2021). As correlations over Wilkins Ice Shelf were rather heterogeneous overall, the detected pattern could also reflect spurious correlation. However, weak negative lag 0–1 correlation was also found for George VI and Bach ice shelves (Table S2), reflecting an anomalously low availability of incoming solar radiation during the last two melting seasons (Fig. S6c and d).
Furthermore, cross-correlation of supraglacial lake extents over Wilkins Ice Shelf with anomalies of wind direction (Fig. 6b) point towards the existence of a negative link over regions of frequent lake coverage (Figs. 5c and 7u). Analysing the corresponding time series in more detail, negative correlations seem to be caused by predominant occurrence of north(-easterly) winds (i.e. north-easterly winds that are inclined more towards northerly direction) preceding recent increased lake ponding (Fig. S6). At the same time, positive correlations were visible, reflecting short-lived shifts to north-westerly winds preceding periods of high lake formation. Similar shifts in wind direction are also visible along the western and eastern grounding lines of George VI and Bach ice shelves (Fig. 7e and m). Wind conditions are a known driver for supraglacial lake occurrence on the API, with previous studies reporting that warm air temperatures over George VI Ice Shelf are promoted by sensible heat transport with warm north-westerly and north-easterly winds as well as a shift towards more frequent north-easterlies (Banwell et al., 2021). Moreover, foehn winds are known to influence surface melting on the north-eastern API (Cape et al., 2015; Datta et al., 2019; Luckman et al., 2014; Turton et al., 2020) and can equally be observed on the western API with (north-)easterly prevailing wind direction (Laffin et al., 2021). This suggests the occurrence of both foehn conditions and sensible heat transport on the API. Foehn winds could also explain the clustering of lakes near the grounding lines, where foehn wind influence is assumed to be highest (Lenaerts et al., 2017), as well as the positive link with lag 0–1 snowmelt (Fig. 7) (Cape et al., 2015; Turton et al., 2020). Further, the detected relationship is in good agreement with our observations of air temperature and solar radiation, where radiation potentially influences foehn conditions, and foehn conditions influence air temperature.
For investigation of large-scale climatic drivers, annual SAM was correlated with January lake extents. Our results imply a negative relationship for all investigated API ice shelves (Table 1), mostly due to occurrence of a negative SAM year in 2019 (Fig. 10) coincident with enhanced melting in 2019–2020 (Fig. 4a–c). Although the detected relationship seems counterintuitive because negative SAM years usually lead to cold conditions on the API, Bevan et al. (2020) suggest that teleconnections between the tropics and high latitudes in 2019 are responsible for the observed 2019–2020 melt and negative SAM. In detail, these teleconnections caused unusual perturbations of Southern Hemisphere atmospheric flow as well as sudden stratospheric warming (SSW), thus causing SAM to be negative and the ongoing positive Indian Ocean Dipole (IOD) in 2019 (BOM, 2021), represented via the dipole mode index (DMI) (Fig. 10), to bring warm air to the API via northerly winds. This overarching driver is well in line with correlations between lake extents and air temperature as well as wind and could potentially explain increased 2019–2020 meltwater ponding. As DMI returned to neutral values in 2020, other overarching drivers, including SAM returning to positive values (Fig. 10) as well as modified pressure conditions in the Amundsen Sea Low (ASL) (NSIDC, 2021), are believed to have contributed to high and low lake extents during the early and late 2020–2021 melting season, respectively.
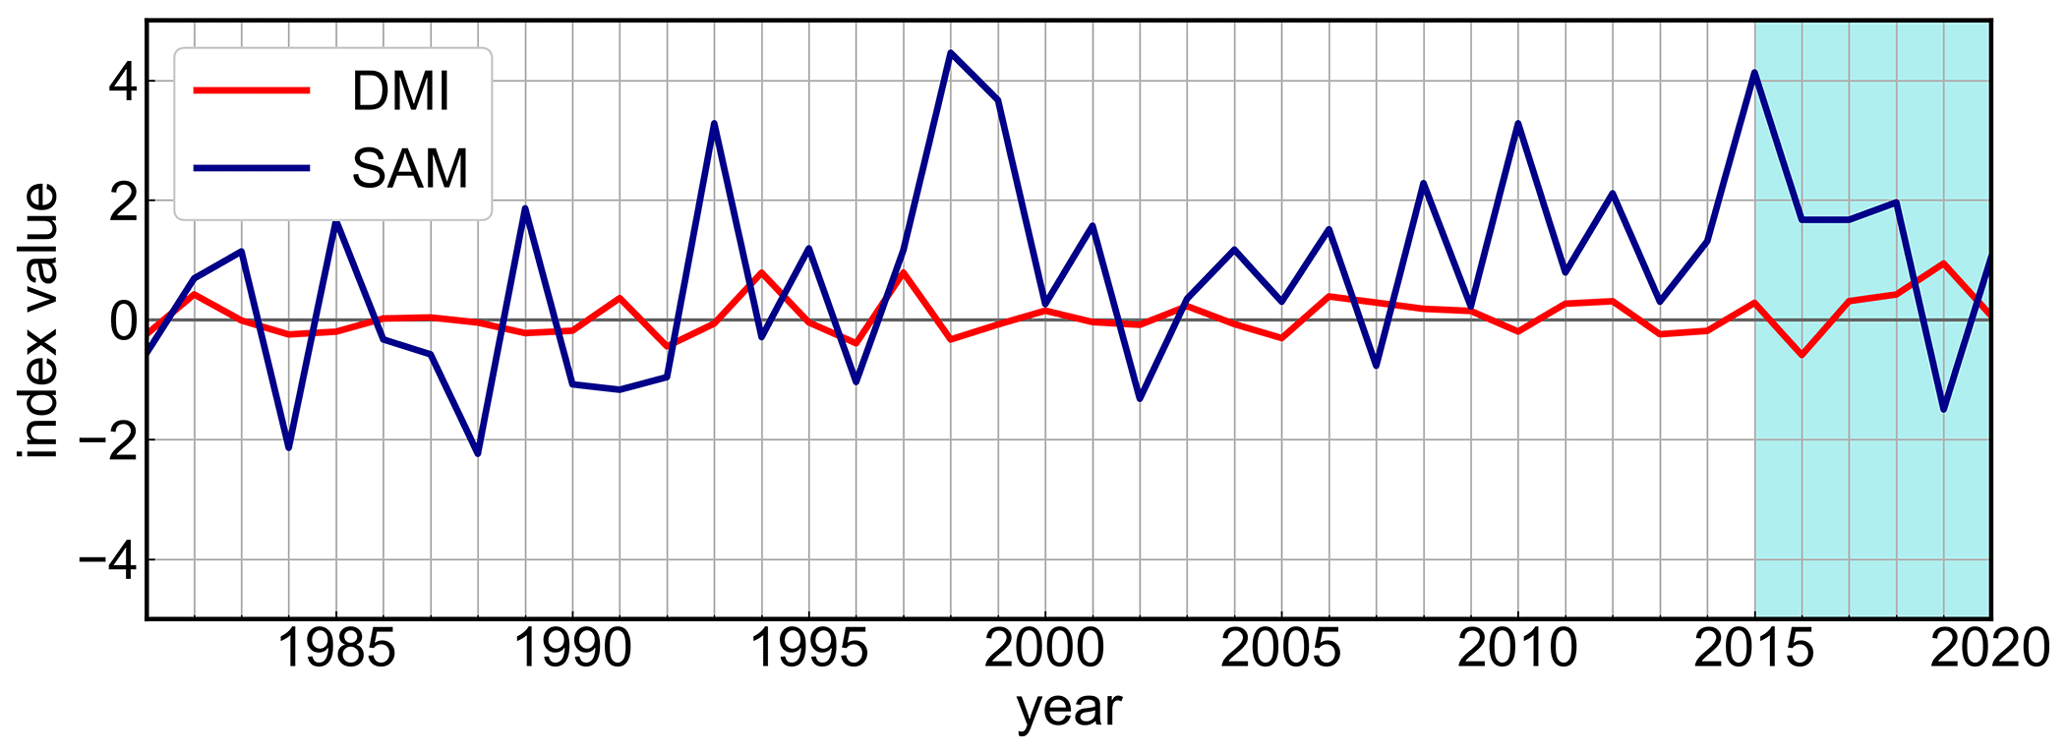
Figure 10Annual observations of Southern Annular Mode (SAM) and dipole mode index (DMI) between 1981 and 2020. DMI captures the east-to-west sea surface temperature gradient across the tropical Indian Ocean. Years 2015–2020 are shaded in turquoise, representing our study period. SAM data are from Marshall (2018), and DMI data are available at https://stateoftheocean.osmc.noaa.gov/sur/ind/dmi.php (last access: 29 June 2021).
Overall, our results indicate that the complex interplay of local, regional and large-scale environmental controls dictates supraglacial lake formation on the API. In particular, the local glaciological and microclimatic setting including melt–albedo feedbacks, sensible heat exchange or the ice shelf topography was found to play an important role for supraglacial lake distribution. Likewise, long-term precipitation conditions influence the FAC and were found to be a primary control on the location and strength of meltwater ponding over all ice shelves. On the other hand, regional climatic conditions and particularly air temperature, solar radiation and (foehn) wind conditions are among the main controlling factors for temporal dynamics of supraglacial lakes in 2015–2021 and are mainly driven by large-scale atmospheric modes including SAM, IOD or ASL. In consequence of the good agreement between lake evolution and detected driving factors on all ice shelves (Table 2), a similar response of other API ice shelves resulting in high meltwater coverage during 2019–2020 and 2020–2021 is suggested.
Table 2Summary of suggested controls on 2015–2021 meltwater ponding across six Antarctic ice shelves. The results present a summary of pixel-based and spatially averaged correlations, also considering weak correlations and neglecting spurious results where appropriate. Positive and negative signs indicate positive and negative relationships, respectively. The signs “±” and “/” denote the coexistence of positive and negative links as well as no observed links, respectively. The strength or lag of correlations is not shown.
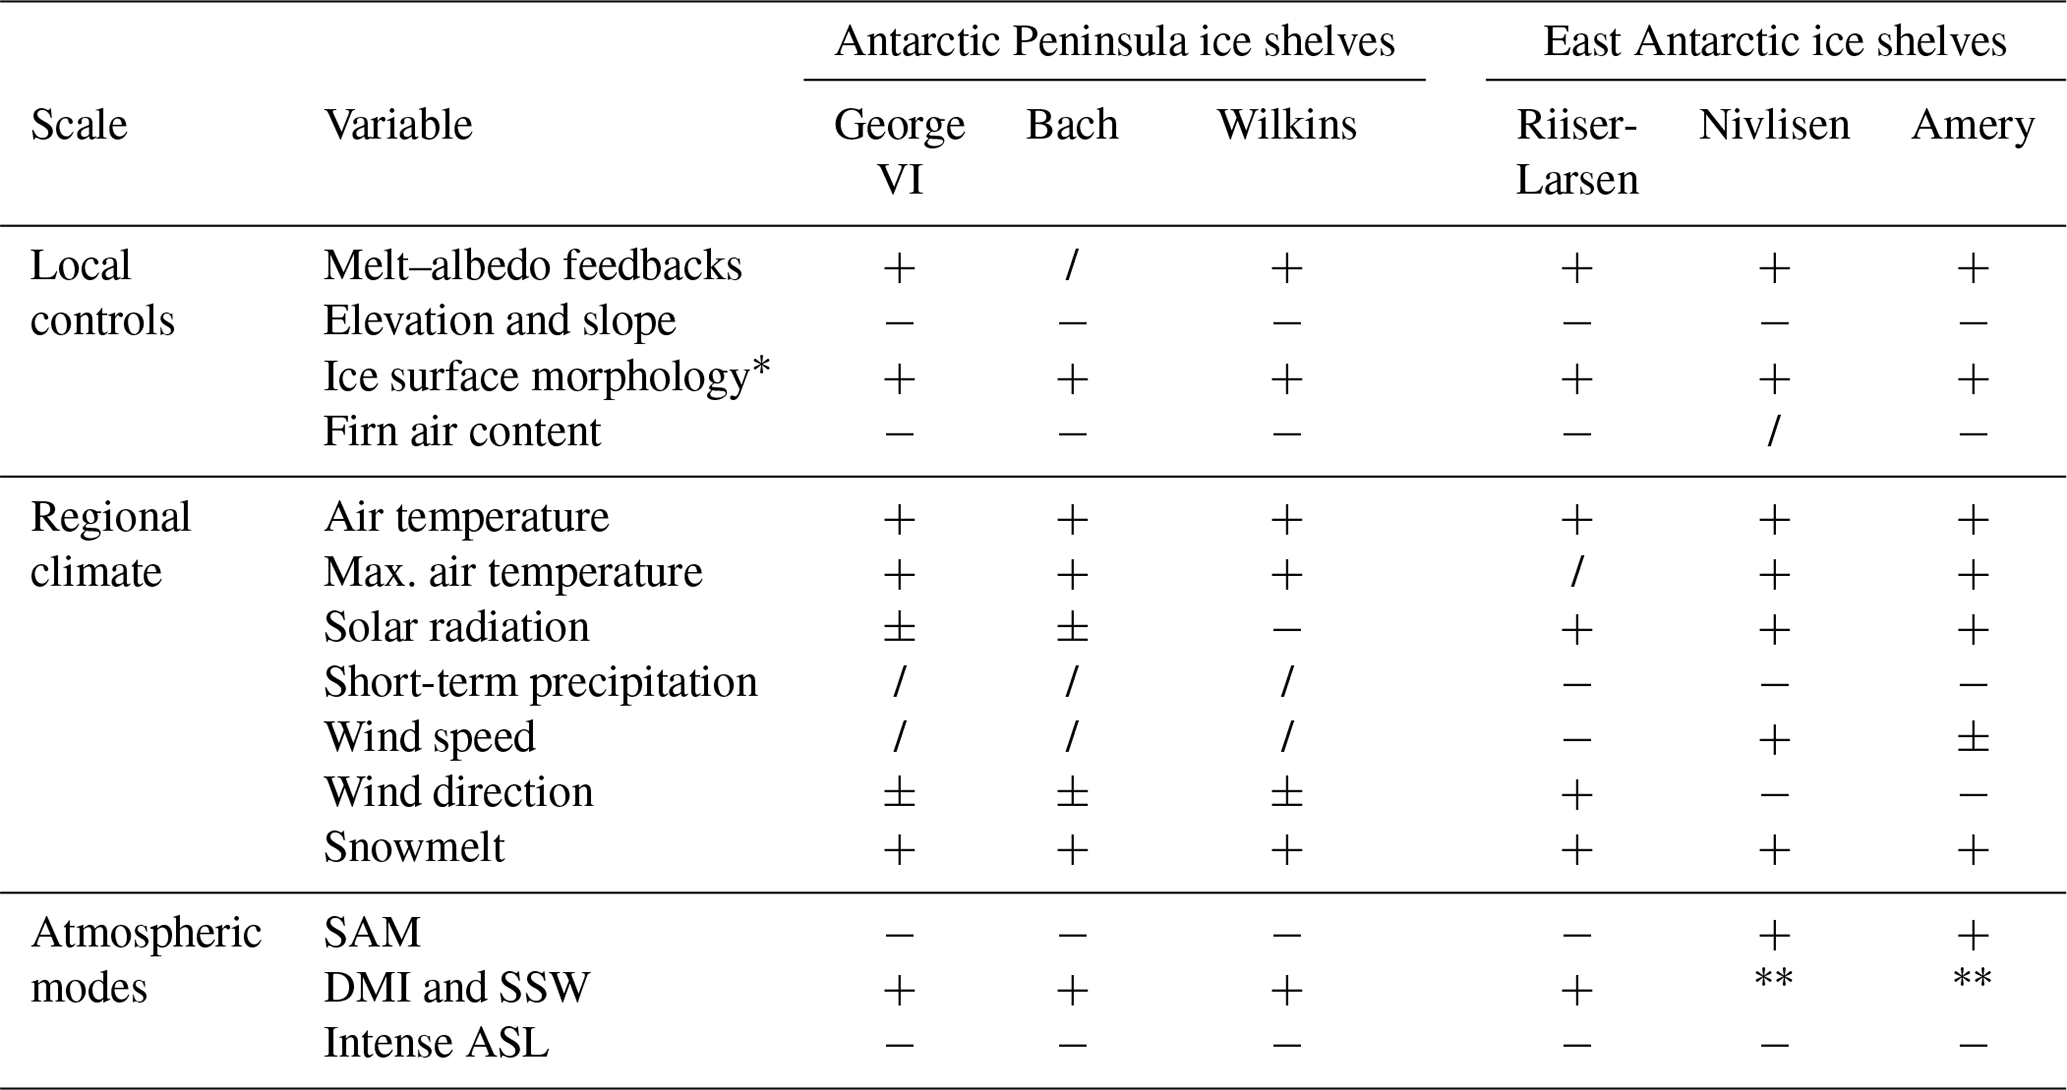
* The positive sign refers to the existence of a link without a directional component; not investigated but likely weakly negative.
5.1.2 East Antarctic ice shelves
For EAIS ice shelves, the observed negative relationship with short-term precipitation over Riiser-Larsen Ice Shelf again highlights that supraglacial lake formation is controlled by the local glaciological setting and a reduced FAC (Figs. 6 and 8g, h). At the same time, weak negative correlation (p>0.05) was found over Nivlisen and Amery ice shelves (Figs. 6 and 8o, w, Tables S1 and S2), potentially reflecting the higher importance of long-term precipitation effects. In this context, correlation analysis with previous-year precipitation revealed significant negative relationships over Riiser-Larsen and particularly Amery Ice Shelf (Table 1, Fig. 9d and f). Most notably, we found a strong link between 2016–2017 and 2018–2019 high meltwater ponding and previous-year low precipitation over Amery Ice Shelf. In contrast, correlation with previous-year precipitation over Nivlisen Ice Shelf showed a mostly positive correlation pattern, implying the higher importance of other drivers (Fig. 9e). In this context, the high recurrence of lakes on EAIS ice shelves (Fig. 5d–f) reflects lakes reforming in the same location each year and thus the high importance of the local topography further controlling supraglacial lake distribution (Arthur et al., 2020b; Echelmeyer et al., 1991; Langley et al., 2016). Over Riiser-Larsen and particularly Nivlisen Ice Shelf, elongated meltwater bodies were found to reoccupy the same ice shelf surface depressions (Fig. 5e) at low elevations and low surface slopes, while lake ponding over Amery Ice Shelf seems to be dictated by both local surface depressions on grounded ice and longitudinal flow stripes migrating with ice flow on floating ice (Figs. 2f and 5f) (Glasser and Gudmundsson, 2012; Spergel et al., 2021). Furthermore, the refreezing of meltwater in firn pore space could have influenced lake ponding through a modification of the ice surface topography and firn air depletion (Kuipers Munneke et al., 2014; Spergel et al., 2021).
Furthermore, cross-correlation analysis with air temperature indicates that supraglacial lake formation is driven by temperature at lags 0–2 (Figs. 6 and 8a, b, i, j, q, r). Similarly to what is found for API ice shelves, the spatial pattern of temperature time lags (Fig. 8b, j and r) revealed larger lags for regions where lakes are spreading onto the ice shelves during years of high meltwater ponding and lower lags close to and upstream of the grounding lines. This likely reflects the temporal evolution of drainage systems through lateral meltwater transport across the ice shelves (Dell et al., 2020; Spergel et al., 2021; Kingslake et al., 2017) (Figs. 2d–f, 5d–f and S3) or a longer response time to air temperature, particularly in regions where the local glaciological setting does not promote supraglacial lake formation through melt–albedo feedbacks.
Cross-correlation with solar radiation returned positive relationships at lags 0–2 over all three ice shelves (Figs. 6 and 8c, d, k, l, s, t). As above, time lags were highest where lakes expanded farthest onto the ice shelves during years of high lake coverage, likely reflecting similar effects as described for air temperature also given the widespread distribution of blue ice or rock near all three EAIS ice shelves (Figs. 1d–f, 2d, and 5e, f). Similarly, the availability of incoming solar radiation was shown to contribute to enhanced melting over Roi Baudouin Ice Shelf, EAIS, where katabatic-wind-driven blue ice and firn exposure initiated albedo lowering and enhanced absorption of solar radiation (Lenaerts et al., 2017).
Moreover, we note that supraglacial lake formation on Riiser-Larsen Ice Shelf is dictated by prevailing low wind speeds from a (south-)easterly direction following periods of anomalously high wind speeds from a north-easterly direction (Figs. 6, 8e, S5a, and S7a, b). Considering the detected pattern, we suggest that meltwater ponding on Riiser-Larsen is driven by katabatic wind forcing. A similar pattern can be observed over Nivlisen Ice Shelf (Fig. 8m). Here, shifts in wind direction from low-speed south-easterly winds to strong (south-)easterly katabatic winds preceding high supraglacial lake coverage can be attributed to the observed correlations (Fig. S7c and d, Table S2) and meltwater ponding, e.g. by preserving the nearby blue ice region near the Wohlthat Mountains (Fig. 1) (Horwath et al., 2006). The spatial correlation pattern over Amery Ice Shelf is twofold (Figs. 8u, S5i and S7e, f). Along the north-east grounding line, the correlation pattern revealed that supraglacial lakes peak shortly after occurrence of high-speed (south-)easterly winds, likely reflecting the influence of katabatic winds flowing onto the ice shelf via the adjacent eastern plateau (Stokes et al., 2019). In contrast, supraglacial lakes in the south of Amery Ice Shelf peak during low-speed winds from the south(-east) or south-(west) following high-speed southerly katabatic winds. This indicates that katabatic winds drive melting in agreement with the local topography, determining the direction of wind inflow. Easterly katabatic winds warm adiabatically through vertical mixing and can lead to the exposure of albedo-lowering blue ice and firn through wind scouring, which further enhances surface melt, as observed over other EAIS ice shelves (Arthur et al., 2020a; Lenaerts et al., 2017). In fact, lag 1 correlation with modelled snowmelt events over Riiser-Larsen and Amery ice shelves (Figs. 6 and S5c, d, k, l) could reflect localized katabatic wind-induced peaks in melting.
In addition, the negative correlation with SAM over Riiser-Larsen Ice Shelf (Table 1) could point towards Southern Hemisphere atmospheric modes similarly affecting western East Antarctica, e.g. due to the spatial proximity to the Weddell Sea. In fact, January 2020 lake extents were above average with respect to the overall period 2016–2021, in agreement with a positive DMI and negative SAM (Fig. 10). Correlations with SAM over Nivlisen and Amery ice shelves were weakly positive, potentially reflecting the opposite climate effects SAM can have on the API and EAIS (Kwok and Comiso, 2002; Wachter et al., 2020). As mentioned, also the influence of an atypical ASL driving below-average temperature in 2020–2021 (NSIDC, 2021) has to be considered, most likely explaining the observed low lake extents over EAIS ice shelves in 2020–2021.
To summarize, EAIS supraglacial lake formation in 2016–2021 was mainly controlled by the regional near-surface climate, with air temperature, solar radiation and (katabatic) wind conditions showing the strongest influence. In this context, some of the observed climate variability can be explained by large-scale climatic drivers including SAM, IOD or ASL. Further, local controls including melt–albedo feedbacks, the firn air content and the ice surface topography showed strong influence on EAIS supraglacial lake formation and distribution.
Table 2 provides a summary of all detected drivers for the API and EAIS. Even though each ice shelf showed slightly different driving factors for supraglacial lake formation, local controls as well as regional climate variability with respect to air temperature, solar radiation and wind conditions were found to influence all six investigated regions in a similar manner. This points towards their transferability to other ice sheet regions as well as their role as primary driving factors. Furthermore, the potential influence of large-scale atmospheric modes at continent-wide scale is highlighted through the influence of the intense ASL in 2020–2021 on air temperature and lake formation across all six Antarctic ice shelves. Considering this, similar trends in lake evolution can be expected, e.g. in terms of low lake extents over other Antarctic ice shelves during the 2020–2021 summer melting season. Likewise, also the influence of SAM and IOD was shown to influence adjacent ice sheet sections (Table 2) over the API and EAIS, making it likely that similar lake evolution can be observed in surrounding regions, e.g. in the form of high lake extents during the 2019–2020 melting season over the API. At the same time, it has to be noted that the complex interplay of climate variables might have led to non-linear relations not captured in our correlations, and the comparatively low number of observations might have led to correlations being flagged as insignificant despite the existence of causal links. Further, also the coarse resolution of climate reanalysis data might have affected correlation values particularly at a small scale. Finally, more detailed investigation of teleconnections would require additional atmospheric indices.
5.2 Potential implications for future ice shelf stability
Future atmospheric warming is expected to enhance meltwater production and ponding on Antarctic ice shelves (Bell et al., 2018; Kingslake et al., 2017; Trusel et al., 2015; Gilbert and Kittel, 2021). Extensive surface ponding threatens ice shelf stability due to variations in stress, causing flexure (Banwell et al., 2019) and ultimately vertical fracturing and ice shelf collapse, effectively reducing ice shelf buttressing (Banwell and Macayeal, 2015; Dunmire et al., 2020; Leeson et al., 2020; Rott et al., 2018; Scambos et al., 2004). Ice shelves that are vulnerable to hydrofracturing are widespread around Antarctica (Alley et al., 2018; Lai et al., 2020), particularly when they are pre-weakened by fractures and crevasses (Lhermitte et al., 2020) or firn air depletion (Kuipers Munneke et al., 2014; Lenaerts et al., 2017; Spergel et al., 2021). Lateral meltwater transport across ice shelves delivers meltwater to regions with only little or no surface melt, effectively reducing the FAC and making them more vulnerable to hydrofracture (Dell et al., 2020). This is particularly prevalent in the absence of an efficient drainage system transporting meltwater to the ocean (Bell et al., 2017). Given repeated meltwater ponding and drainage across the investigated ice shelves during the last 5–6 melting seasons (Fig. 5), future ice shelf destabilization could be imminent considering the classification of respective ice shelf areas as potentially vulnerable to hydrofracture (Lai et al., 2020). This particularly applies to ice shelves on the API, where exceptional meltwater ponding during the last two melting seasons likely contributed to further firn air depletion, as suggested for Larsen C (Bevan et al., 2020). Future enhanced precipitation due to an enhanced moisture holding capacity of warmer air may partly compensate this (Bell et al., 2018; Bengtsson et al., 2011; Krinner et al., 2007; Lenaerts et al., 2016) even though additional research is required for a better evaluation of all factors, e.g. considering an increasing presence of firn aquifers under high-precipitation scenarios with similar effects on ice shelf stability (Bell et al., 2018; van Wessem et al., 2021). Similarly, increasingly positive IODs under high-emission scenarios may counteract API warming in the absence of perturbations such as SSW (Bevan et al., 2020).
This study presents the first intra-annual and inter-annual investigation of Antarctic surface hydrology across six major Antarctic ice shelves, employing state-of-the-art machine learning on spaceborne observations from Sentinel-1 SAR and optical Sentinel-2. We derive fused classification products at unprecedented 10 m spatial resolution and bi-weekly temporal scale to map Antarctic supraglacial lake extent in 2015–2021. In this context, the integration of SAR data enabled the delineation of buried and partly frozen lakes, providing a more complete mapping record than single-sensor products. For the investigated Antarctic Peninsula ice shelves, our results reveal anomalously low supraglacial lake coverage during most 2015–2018 melting seasons and anomalously high lake coverage during 2019–2020 and 2020–2021 summers considering the years 2015–2021 as a reference period. Peak lake coverage reached 805 km2 in late January 2020 over George VI Ice Shelf. Over East Antarctic ice shelves, supraglacial lake extents fluctuated more substantially, with most 2016–2020 melting seasons being characterized by above-average lake coverage and the 2020–2021 melting season by record low lake coverage with respect to the observational period 2016–2021. On the EAIS, the highest lake coverage was found on Amery Ice Shelf, peaking at 1373 km2 in early January 2019. Further, we observe lateral meltwater transport in surface drainage systems to occur over both Antarctic Peninsula and East Antarctic ice shelves, with potential implications for future ice shelf stability.
To establish a link between intra-annual supraglacial lake extent dynamics in 2015–2021 and potential environmental drivers, we employ multi-temporal linear correlation analysis at different time lags using spatio-temporal observations of ERA5-Land climate reanalysis data. Moreover, inter-annual observations of supraglacial lake extents are used to investigate the influence of large-scale atmospheric modes as well as of the local glaciological setting, including the state of the firn layer. Results of the statistical analysis with spatial averages and anomalies as well as with pixel-based values return a strong coupling between temporal fluctuations in Antarctic Peninsula supraglacial lake extents and the regional near-surface climate, including air temperature, the amount of incoming solar radiation and (foehn) wind conditions, with lake extents above or below average being linked to anomalies of climate variables. In addition, correlations with large-scale atmospheric drivers including annual Southern Annular Mode revealed their influence on the regional near-surface climate and thus supraglacial lake formation. Further, investigation of previous-year precipitation implied the strong influence of reduced-snow conditions, promoting supraglacial lake formation through a reduction in the firn air content. Also, pixel-based analysis revealed a faster response time of lake evolution to climate drivers in regions where surface features such as blue ice or rock initiate melt–albedo feedbacks. Similarly to Antarctic Peninsula ice shelves, air temperature, solar radiation and (katabatic) wind conditions were found to be primary drivers for supraglacial meltwater ponding on East Antarctic ice shelves. Likewise, the influence of Southern Hemisphere atmospheric modes on the regional near-surface climate as well as the local glaciological setting, including the ice shelf geometry, elevation and melt–albedo feedbacks, is found to exert strong control on supraglacial lake formation. Moreover, the influence of a reduced firn air content over Riiser-Larsen and particularly Amery Ice Shelf was related to above-normal supraglacial lake formation.
To summarize, our findings provide important insight into present-day Antarctic surface hydrology and associated drivers and could be particularly useful for an improved representation of meltwater transport across Antarctic ice shelves in modelling efforts (Buzzard et al., 2018). Specifically, the created dataset on bi-weekly supraglacial lake extent dynamics over six Antarctic ice shelves is particularly useful for future analyses on supraglacial lake characteristics or temporal variations over individual lakes and drainage structures. In addition, the results of this study underline the complex interplay of climate variables at different time lags and the local glaciological setting, which influences supraglacial lake formation both spatially and temporally, with similar implications for other ice sheet regions. Furthermore, the value of ERA5-Land and Copernicus Sentinel data was highlighted, with the growing archive of satellite data enabling more detailed analyses on supraglacial lake dynamics in the future. In particular, future work will focus on the generation of circum-Antarctic supraglacial lake extent mapping products, to be made available via the GeoService of the Earth Observation Center (EOC) at the German Aerospace Center; the expansion of statistical analyses to continental scale; and the application of advanced causal analysis techniques. Once available, the integration of higher-resolution model outputs from RACMO (Regional Atmospheric Climate Model) (van Wessem et al., 2018) as well as more detailed investigation of teleconnections with additional atmospheric indices will be considered to better constrain climate drivers.
The Supplement provides results from the statistical correlation of fractional supraglacial lake extents and bi-weekly spatial averages (Table S1) and anomalies (Table S2) over all six investigated Antarctic ice shelves. Moreover, Fig. S1 provides information on the share of data originating from Sentinel-1 and Sentinel-2 in bi-weekly classifications. Figure S2 shows larger map plots of Fig. 5, and Fig. S3 shows the temporal development of January supraglacial lake extents in 2017–2021 over Nivlisen Ice Shelf. Figures S4 and S5 provide pixel-based correlation results for all variables not shown in Figs. 7 and 8. Figures S6 and S7 show auxiliary plots on spatially averaged wind direction and lake extents for Wilkins, Riiser-Larsen, Nivlisen and Amery ice shelves to complement the conclusions made in Sect. 5. Figure S6 also shows results for lag 1 solar radiation.
The bi-weekly maximum lake extent mapping products for all six ice shelves are available via the EOC GeoService of the German Aerospace Center (DLR) (https://download.geoservice.dlr.de/ANTARCTICLAKES/files/; Dirscherl, 2021). The outline of the Antarctic ice sheets is taken from http://imbie.org/imbie-2016/drainage-basins/ (IMBIE, 2016), and coastline and grounding line data are available at https://nsidc.org/data/NSIDC-0709/versions/2# (Mouginot et al., 2017; Rignot et al., 2013). The Landsat Image Mosaic of Antarctica (LIMA) was downloaded from the USGS web page at https://lima.usgs.gov/fullcontinent.php (last access: 17 October 2021; Bindschadler et al., 2008), and the gap-filled 200 m Reference Elevation Model of Antarctica is from https://data.pgc.umn.edu/elev/dem/setsm/REMA/ (last access: 10 October 2021; Howat et al., 2019). The TanDEM-X PolarDEM 90 m (https://download.geoservice.dlr.de/TDM_POLARDEM90/ANTARCTICA/, last access: 12 October 2021; Wessel et al., 2021) and the 2018 Antarctic coastline (https://download.geoservice.dlr.de/icelines/files/, last access: 19 October 2021; Baumhoer et al., 2021) are provided via the EOC GeoService of the DLR. Southern Annular Mode index data can be accessed at https://legacy.bas.ac.uk/met/gjma/sam.html (last access: 14 October 2021; Marshall, 2003, 2018), and dipole mode index data are provided by NOAA/ESRL, Boulder, Colorado, USA, from their website at https://stateoftheocean.osmc.noaa.gov/sur/ind/dmi.php (last access: 11 October 2021). ERA5-Land reanalysis data were downloaded from the Copernicus Climate Change Service (C3S) Climate Data Store (https://doi.org/10.24381/cds.e2161bac, Munoz Sabater, 2019). The results contain modified Copernicus Climate Change Service information from 2021. Neither the European Commission nor the ECMWF is responsible for any use that may be made of the Copernicus information or data it contains.
The supplement related to this article is available online at: https://doi.org/10.5194/tc-15-5205-2021-supplement.
MD designed the study, conducted the analysis and wrote the original draft of the manuscript. CK and AD assisted in the study design. MD, CK and AD contributed to the discussion of the results and were involved in editing the manuscript.
The contact author has declared that neither they nor their co-authors have any competing interests.
Publisher's note: Copernicus Publications remains neutral with regard to jurisdictional claims in published maps and institutional affiliations.
We thank the Copernicus Climate Change Service (C3S) Climate Data Store for providing ERA5-Land reanalysis data. Moreover, we thank the European Union Copernicus programme for providing Sentinel-1 and Sentinel-2 data. Matthias Hofmann and Andreas Jahnke, DLR, are acknowledged for their support with Sentinel data access, and Julian Zeidler and Soner Uereyen, DLR, are acknowledged for IT support and proofreading, respectively. The authors also acknowledge Gareth Marshall for granting open access to the Southern Annular Mode index and NOAA/ESRL for dipole mode index data. Finally, we thank the editor (Johannes Fürst) and two anonymous reviewers for their constructive and helpful remarks on the manuscript.
The article processing charges for this open-access publication were covered by the German Aerospace Center (DLR).
This paper was edited by Johannes J. Fürst and reviewed by two anonymous referees.
Alley, K. E., Scambos, T. A., Miller, J. Z., Long, D. G., and MacFerrin, M.: Quantifying vulnerability of Antarctic ice shelves to hydrofracture using microwave scattering properties, Remote Sens. Environ., 210, 297–306, https://doi.org/10.1016/j.rse.2018.03.025, 2018.
Arthur, J. F., Stokes, C. R., Jamieson, S. S. R., Carr, J. R., and Leeson, A. A.: Distribution and seasonal evolution of supraglacial lakes on Shackleton Ice Shelf, East Antarctica, The Cryosphere, 14, 4103–4120, https://doi.org/10.5194/tc-14-4103-2020, 2020a.
Arthur, J. F., Stokes, C. R., Jamieson, S. S. R., Carr, J. R., and Leeson, A. A.: Recent understanding of Antarctic supraglacial lakes using satellite remote sensing, Prog. Phys. Geogr., 44, 837–869, https://doi.org/10.1177/0309133320916114, 2020b.
Banwell, A. F. and Macayeal, D. R.: Ice-shelf fracture due to viscoelastic flexure stress induced by fill/drain cycles of supraglacial lakes, Antarct. Sci., 27, 587–597, https://doi.org/10.1017/S0954102015000292, 2015.
Banwell, A. F., MacAyeal, D. R., and Sergienko, O. V.: Breakup of the Larsen B Ice Shelf triggered by chain reaction drainage of supraglacial lakes, Geophys. Res. Lett., 40, 5872–5876, https://doi.org/10.1002/2013GL057694, 2013.
Banwell, A. F., Willis, I. C., Macdonald, G. J., Goodsell, B., and MacAyeal, D. R.: Direct measurements of ice-shelf flexure caused by surface meltwater ponding and drainage, Nat. Commun., 10, 1–10, https://doi.org/10.1038/s41467-019-08522-5, 2019.
Banwell, A. F., Datta, R. T., Dell, R. L., Moussavi, M., Brucker, L., Picard, G., Shuman, C. A., and Stevens, L. A.: The 32-year record-high surface melt in 2019/2020 on the northern George VI Ice Shelf, Antarctic Peninsula, The Cryosphere, 15, 909–925, https://doi.org/10.5194/tc-15-909-2021, 2021.
Bartholomew, I., Nienow, P., Mair, D., Hubbard, A., King, M. A., and Sole, A.: Seasonal evolution of subglacial drainage and acceleration in a Greenland outlet glacier, Nat. Geosci., 3, 408–411, https://doi.org/10.1038/ngeo863, 2010.
Baumhoer, C. A., Dietz, A. J., Kneisel, C., Paeth, H., and Kuenzer, C.: Environmental drivers of circum-Antarctic glacier and ice shelf front retreat over the last two decades, The Cryosphere, 15, 2357–2381, https://doi.org/10.5194/tc-15-2357-2021, 2021.
Bell, R. E., Chu, W., Kingslake, J., Das, I., Tedesco, M., Tinto, K. J., Zappa, C. J., Frezzotti, M., Boghosian, A., and Lee, W. S.: Antarctic ice shelf potentially stabilized by export of meltwater in surface river, Nature, 544, 344–348, https://doi.org/10.1038/nature22048, 2017.
Bell, R. E., Banwell, A. F., Trusel, L. D., and Kingslake, J.: Antarctic surface hydrology and impacts on ice-sheet mass balance, Nat. Clim. Change, 8, 1044, https://doi.org/10.1038/s41558-018-0326-3, 2018.
Bengtsson, L., Koumoutsaris, S., and Hodges, K.: Large-Scale Surface Mass Balance of Ice Sheets from a Comprehensive Atmospheric Model, Surv. Geophys., 32, 459–474, https://doi.org/10.1007/s10712-011-9120-8, 2011.
Berthier, E., Scambos, T. A., and Shuman, C. A.: Mass loss of Larsen B tributary glaciers (Antarctic Peninsula) unabated since 2002, Geophys. Res. Lett., 39, L13501, https://doi.org/10.1029/2012GL051755, 2012.
Bevan, S., Luckman, A., Hendon, H., and Wang, G.: The 2020 Larsen C Ice Shelf surface melt is a 40-year record high, The Cryosphere, 14, 3551–3564, https://doi.org/10.5194/tc-14-3551-2020, 2020.
Bindschadler, R., Vornberger, P., Fleming, A., Fox, A., Mullins, J., Binnie, D., Paulsen, S. J., Granneman, B., and Gorodetzky, D.: The Landsat Image Mosaic of Antarctica, Remote Sens. Environ., 112, 4214–4226, https://doi.org/10.1016/j.rse.2008.07.006, 2008.
BOM: Climate Driver Update, available at: http://www.bom.gov.au/climate/enso/, last access: 22 June 2021.
Buzzard, S., Feltham, D. L., and Flocco, D.: Modelling the fate of surface melt on the Larsen C Ice Shelf, The Cryosphere, 12, 3565–3575, https://doi.org/10.5194/tc-12-3565-2018, 2018.
Cape, M. R., Vernet, M., Skvarca, P., Marinsek, S., Scambos, T., and Domack, E.: Foehn winds link climate-driven warming to ice shelf evolution in Antarctica, J. Geophys. Res.-Atmos., 120, 11037–11057, https://doi.org/10.1002/2015JD023465, 2015.
Cook, A. J. and Vaughan, D. G.: Overview of areal changes of the ice shelves on the Antarctic Peninsula over the past 50 years, The Cryosphere, 4, 77–98, https://doi.org/10.5194/tc-4-77-2010, 2010.
Datta, R. T., Tedesco, M., Fettweis, X., Agosta, C., Lhermitte, S., Lenaerts, J. T. M., and Wever, N.: The Effect of Foehn-Induced Surface Melt on Firn Evolution Over the Northeast Antarctic Peninsula, Geophys. Res. Lett., 46, 3822–3831, https://doi.org/10.1029/2018GL080845, 2019.
Dell, R., Arnold, N., Willis, I., Banwell, A., Williamson, A., Pritchard, H., and Orr, A.: Lateral meltwater transfer across an Antarctic ice shelf, The Cryosphere, 14, 2313–2330, https://doi.org/10.5194/tc-14-2313-2020, 2020.
Dirscherl, M.: Antarctic Supraglacial Lake Extents 2015–2021, available at: https://download.geoservice.dlr.de/ANTARCTICLAKES/files/, DLR Portal [data set], last access: 18 October 2021.
Dirscherl, M., Dietz, A. J., Kneisel, C., and Kuenzer, C.: Automated Mapping of Antarctic Supraglacial Lakes Using a Machine Learning Approach, Remote Sens., 12, 1203, https://doi.org/10.3390/rs12071203, 2020.
Dirscherl, M., Dietz, A. J., Kneisel, C., and Kuenzer, C.: A Novel Method for Automated Supraglacial Lake Mapping in Antarctica Using Sentinel-1 SAR Imagery and Deep Learning, Remote Sens., 13, 197, https://doi.org/10.3390/rs13020197, 2021.
Dow, C. F., Lee, W. S., Greenbaum, J. S., Greene, C. A., Blankenship, D. D., Poinar, K., Forrest, A. L., Young, D. A., and Zappa, C. J.: Basal channels drive active surface hydrology and transverse ice shelf fracture, Sci. Adv., 4, 6, https://doi.org/10.1126/sciadv.aao7212, 2018.
Dunmire, D., Lenaerts, J. T. M., Banwell, A. F., Wever, N., Shragge, J., Lhermitte, S., Drews, R., Pattyn, F., Hansen, J. S. S., Willis, I. C., Miller, J., and Keenan, E.: Observations of Buried Lake Drainage on the Antarctic Ice Sheet, Geophys. Res. Lett., 47, e2020GL087970, https://doi.org/10.1029/2020GL087970, 2020.
Echelmeyer, K., Clarke, T. S., and Harrison, W. D.: Surficial glaciology of Jakobshavns Isbræ, West Greenland: Part I. Surface morphology, J. Glaciol., 37, 368–382, https://doi.org/10.3189/S0022143000005803, 1991.
Foley, K. M., Ferrigno, J. G., Swithinbank, C., Williams Jr., R. S., and Orndorff, A. L.: Coastal-Change and Glaciological Map of the Amery Ice Shelf Area, Antarctica: 1961–2004, Int. J. Applied Earth Obs. Geoinform., 78, 1–13, https://doi.org/10.1016/j.jag.2019.01.008, 2013.
Fürst, J. J., Durand, G., Gillet-Chaulet, F., Tavard, L., Rankl, M., Braun, M., and Gagliardini, O.: The safety band of Antarctic ice shelves, Nat. Clim. Change, 6, 479–482, https://doi.org/10.1038/nclimate2912, 2016.
Gardner, A. S., Moholdt, G., Scambos, T., Fahnstock, M., Ligtenberg, S., Van den Broeke, M., and Nilsson, J.: Increased West Antarctic and unchanged East Antarctic ice discharge over the last 7 years, The Cryosphere, 12, 521–547, https://doi.org/10.5194/tc-12-521-2018, 2018.
Gilbert, E. and Kittel, C.: Surface Melt and Runoff on Antarctic Ice Shelves at 1.5 ∘C, 2 ∘C, and 4 ∘C of Future Warming, Geophys. Res. Lett., 48, 8, https://doi.org/10.1029/2020GL091733, 2021.
Glasser, N. F. and Gudmundsson, G. H.: Longitudinal surface structures (flowstripes) on Antarctic glaciers, The Cryosphere, 6, 383–391, https://doi.org/10.5194/tc-6-383-2012, 2012.
Gossart, A., Helsen, S., Lenaerts, J. T. M., Broucke, S. V., van Lipzig, N. P. M., and Souverijns, N.: An Evaluation of Surface Climatology in State-of-the-Art Reanalyses over the Antarctic Ice Sheet, J. Climate, 32, 6899–6915, https://doi.org/10.1175/JCLI-D-19-0030.1, 2019.
Halberstadt, A. R. W., Gleason, C. J., Moussavi, M. S., Pope, A., Trusel, L. D., and DeConto, R. M.: Antarctic Supraglacial Lake Identification Using Landsat-8 Image Classification, Remote Sens., 12, 1327, https://doi.org/10.3390/rs12081327, 2020.
Hambrey, M. J., Davies, B. J., Glasser, N. F., Holt, T. O., Smellie, J. L., and Carrivick, J. L.: Structure and sedimentology of George VI Ice Shelf, Antarctic Peninsula: implications for ice-sheet dynamics and landform development, J. Geol. Soc., 172, 599–613, https://doi.org/10.1144/jgs2014-134, 2015.
Hogg, A. E., Shepherd, A., Cornford, S. L., Briggs, K. H., Gourmelen, N., Graham, J. A., Joughin, I., Mouginot, J., Nagler, T., Payne, A. J., Rignot, E., and Wuite, J.: Increased ice flow in Western Palmer Land linked to ocean melting, Geophys. Res. Lett., 44, 4159–4167, https://doi.org/10.1002/2016GL072110, 2017.
Holt, T., Glasser, N. F., Quincey, D. J., and Siegfried, M. R.: Speedup and fracturing of George VI Ice Shelf, Antarctic Peninsula, The Cryosphere, 7, 797–816, https://doi.org/10.5194/tc-7-797-2013, 2013a.
Holt, T., Glasser, N., and Quincey, D.: The structural glaciology of southwest Antarctic Peninsula Ice Shelves (ca. 2010), J. Maps, 9, 523–531, https://doi.org/10.1080/17445647.2013.822836, 2013b.
Horwath, M., Dietrich, R., Baessler, M., Nixdorf, U., Steinhage, D., Fritzsche, D., Damm, V., and Reitmayr, G.: Nivlisen, an Antarctic ice shelf in Dronning Maud Land: geodetic–glaciological results from a combined analysis of ice thickness, ice surface height and ice-flow observations, J. Glaciol., 52, 17–30, https://doi.org/10.3189/172756506781828953, 2006.
Howat, I. M., Porter, C., Smith, B. E., Noh, M.-J., and Morin, P.: The Reference Elevation Model of Antarctica, The Cryosphere, 13, 665–674, https://doi.org/10.5194/tc-13-665-2019, 2019.
IMBIE: Antarctica and Greenland Ice Sheet Drainage Basins, IMBIE [data set], http://imbie.org/imbie-2016/drainage-basins/ (last access: 15 June 2021), 2016.
Jiang, H., Yang, Y., Bai, Y., and Wang, H.: Evaluation of the Total, Direct, and Diffuse Solar Radiations From the ERA5 Reanalysis Data in China, IEEE Geosci. Remote Sens. Lett., 17, 47–51, https://doi.org/10.1109/LGRS.2019.2916410, 2020.
Jolly, K.: Machine Learning with scikit-learn Quick Start Guide, Packt Publishing Ltd., Birmingham, UK, 2018.
Kingslake, J., Ng, F., and Sole, A.: Modelling channelized surface drainage of supraglacial lakes, J. Glaciol., 61, 185–199, https://doi.org/10.3189/2015JoG14J158, 2015.
Kingslake, J., Ely, J. C., Das, I., and Bell, R. E.: Widespread movement of meltwater onto and across Antarctic ice shelves, Nature, 544, 349–352, https://doi.org/10.1038/nature22049, 2017.
Kleiner, T. and Humbert, A.: Numerical simulations of major ice streams in Western Dronning Maud Land, Antarctica, under wet and dry basal conditions, J. Glaciol., 60, 215–232, https://doi.org/10.3189/2014JoG13J006, 2014.
Krinner, G., Magand, O., Simmonds, I., Genthon, C., and Dufresne, J.-L.: Simulated Antarctic precipitation and surface mass balance at the end of the twentieth and twenty-first centuries, Clim. Dynam., 28, 215–230, https://doi.org/10.1007/s00382-006-0177-x, 2007.
Kuipers Munneke, P., Ligtenberg, S. R. M., Broeke, M. R. V. D., and Vaughan, D. G.: Firn air depletion as a precursor of Antarctic ice-shelf collapse, J. Glaciol., 60, 205–214, https://doi.org/10.3189/2014JoG13J183, 2014.
Kwok, R. and Comiso, J. C.: Spatial patterns of variability in Antarctic surface temperature: Connections to the Southern Hemisphere Annular Mode and the Southern Oscillation, Geophys. Res. Lett., 29, 50-1–50-4, https://doi.org/10.1029/2002GL015415, 2002.
LaBarbera, C. H. and MacAyeal, D. R.: Traveling supraglacial lakes on George VI Ice Shelf, Antarctica, Geophys. Res. Lett., 38, 24, https://doi.org/10.1029/2011GL049970, 2011.
Laffin, M. K., Zender, C. S., Singh, S., Wessem, J. M. V., Smeets, C. J. P. P., and Reijmer, C. H.: Climatology and Evolution of the Antarctic Peninsula Föhn Wind-Induced Melt Regime From 1979–2018, Geophys. Res. Lett., 126, e2020JD033682, https://doi.org/10.1029/2020JD033682, 2021.
Lai, C.-Y., Kingslake, J., Wearing, M. G., Chen, P.-H. C., Gentine, P., Li, H., Spergel, J. J., and van Wessem, J. M.: Vulnerability of Antarctica's ice shelves to meltwater-driven fracture, Nature, 584, 574–578, https://doi.org/10.1038/s41586-020-2627-8, 2020.
Langley, E. S., Leeson, A. A., Stokes, C. R., and Jamieson, S. S. R.: Seasonal evolution of supraglacial lakes on an East Antarctic outlet glacier, Geophys. Res. Lett., 43, 8563–8571, https://doi.org/10.1002/2016GL069511, 2016.
Leeson, A. A., Forster, E., Rice, A., Gourmelen, N., and Van Wessem, J. M.: Evolution of supraglacial lakes on the Larsen B ice shelf in the decades before it collapsed, Geophys. Res. Lett., 47, 4, https://doi.org/10.1029/2019GL085591, 2020.
Lenaerts, J. T. M., Vizcaino, M., Fyke, J., van Kampenhout, L., and van den Broeke, M. R.: Present-day and future Antarctic ice sheet climate and surface mass balance in the Community Earth System Model, Clim. Dynam., 47, 1367–1381, https://doi.org/10.1007/s00382-015-2907-4, 2016.
Lenaerts, J. T. M., Lhermitte, S., Drews, R., Ligtenberg, S. R. M., Berger, S., Helm, V., Smeets, C. J. P. P., van den Broeke, M. R., van de Berg, W. J., van Meijgaard, E., Eijkelboom, M., Eisen, O., and Pattyn, F.: Meltwater produced by wind–albedo interaction stored in an East Antarctic ice shelf, Nat. Clim. Change, 7, 58–62, https://doi.org/10.1038/nclimate3180, 2017.
Lhermitte, S., Sun, S., Shuman, C., Wouters, B., Pattyn, F., Wuite, J., Berthier, E., and Nagler, T.: Damage accelerates ice shelf instability and mass loss in Amundsen Sea Embayment, P. Natl. Acad. Sci. USA, 117, 24735–24741, https://doi.org/10.1073/pnas.1912890117, 2020.
Louis, J., Debaecker, V., Pflug, B., Main-Knorn, M., Bieniarz, J., Mueller-Wilm, U., Cadau, E., and Gascon, F.: Sentinel-2 Sen2Cor: L2A Processor For Users, in: Proc. Living Planet Symposium 2016, Prague, Czech Republic, 2016.
Luckman, A., Elvidge, A., Jansen, D., Kulessa, B., Munneke, P. K., King, J., and Barrand, N. E.: Surface melt and ponding on Larsen C Ice Shelf and the impact of föhn winds, Antarct. Sci., 26, 625–635, https://doi.org/10.1017/S0954102014000339, 2014.
Marshall, G. J.: Trends in the Southern Annular Mode from Observations and Reanalyses, J. Climate, 16, 4134–4143, https://doi.org/10.1175/1520-0442(2003)016<4134:TITSAM>2.0.CO;2, 2003.
Marshall, G. J.: The Climate Data Guide: Marshall Southern Annular Mode (SAM) Index (Station-based), National Center for Atmospheric Research Staff [data set], https://climatedataguide.ucar.edu/climate-data/marshall-southern-annular-mode-sam-index-station-based, (last access: 20 June 2021), 2018.
McGrath, D., Steffen, K., Rajaram, H., Scambos, T., Abdalati, W., and Rignot, E.: Basal crevasses on the Larsen C Ice Shelf, Antarctica: Implications for meltwater ponding and hydrofracture, Geophys. Res. Lett., 39, 16, https://doi.org/10.1029/2012GL052413, 2012.
Meredith, M., Sommerkorn, M., Cassotta, S., Derksen, C., Ekaykin, A., Hollowed, A., Kofinas, G., Mackintosh, A., Melbourne-Thomas, J., Muelbert, M. M. C., Ottersen, G., Pritchard, H., and Schuur, E. A. G.: Polar Regions, in: IPCC Special Report on the Ocean and Cryosphere in a Changing Climate, edited by: Pörtner, H.-O., Roberts, D. C., Masson-Delmotte, V., Zhai, P., Tignor, M., Poloczanska, E., Mintenbeck, K., Alegría, A., Nicolai, M., Okem, A., Petzold, J., Rama, B., and Weyer, N. M., in press, 2019.
Minchew, B. M., Gudmundsson, G. H., Gardner, A. S., Paolo, F. S., and Fricker, H. A.: Modeling the dynamic response of outlet glaciers to observed ice-shelf thinning in the Bellingshausen Sea Sector, West Antarctica, J. Glaciol., 64, 333–342, https://doi.org/10.1017/jog.2018.24, 2018.
Mouginot, J., Scheuchl, B., and Rignot, E.: MEaSUREs Antarctic Boundaries for IPY 2007–2009 from Satellite Radar, Version 2, [Coastline, grounding line data], NASA National Snow and Ice Data Center Distributed Active Archive Center [data set], Boulder, Colorado, USA, https://doi.org/10.5067/AXE4121732AD (last access: 17 October 2021), 2017.
Moussavi, M., Pope, A., Halberstadt, A. R. W., Trusel, L. D., Cioffi, L., and Abdalati, W.: Antarctic Supraglacial Lake Detection Using Landsat 8 and Sentinel-2 Imagery: Towards Continental Generation of Lake Volumes, Remote Sens., 12, 134, https://doi.org/10.3390/rs12010134, 2020.
Müller, C. and Guido, S.: Introduction to Machine Learning with Python: A Guide for Data Scientists, O'Reilly Media, Inc., Sebastopol, USA, 2016.
Munoz Sabater, J.: ERA5-Land hourly data from 1981 to present, Copernicus Climate Change Service (C3S) Climate Data Store (CDS) [data set] https://doi.org/10.24381/cds.e2161bac, 2019.
NSIDC: The Antarctic 2020 to 2021 melt season in review, available at: http://nsidc.org/greenland-today/2021/04/the-antarctic-2020-to-2021-melt-season-in-review/, last access: 23 June 2021.
Padman, L., Costa, D. P., Dinniman, M. S., Fricker, H. A., Goebel, M. E., Huckstadt, L. A., Humbert, A., Joughin, I., Lenaerts, J. T. M., Ligtenberg, S. R. M., Scambos, T., and van den Broeke, M. R.: Oceanic controls on the mass balance of Wilkins Ice Shelf, Antarctica, J. Geophys. Res.-Oceans, 117, C1, https://doi.org/10.1029/2011JC007301, 2012.
Reynolds, J. M.: Lakes on George VI Ice Shelf, Antarctica, Polar Rec., 20, 425–432, https://doi.org/10.1017/S0032247400003636, 1981.
Reynolds, J. M. and Hambrey, M. J.: The structural glaciology of George VI Ice Shelf, Antarctic Peninsula, Brit. Antarct. Surv. B., 79, 79–95, 1988.
Rignot, E., Casassa, G., Gogineni, P., Krabill, W., Rivera, A., and Thomas, R.: Accelerated ice discharge from the Antarctic Peninsula following the collapse of Larsen B ice shelf, Geophys. Res. Lett., 31, 18, https://doi.org/10.1029/2004GL020697, 2004.
Rignot, E., Jacobs, S., Mouginot, J., and Scheuchl, B.: Ice-Shelf Melting Around Antarctica, Science, 341, 266–270, https://doi.org/10.1126/science.1235798, 2013.
Rignot, E., Mouginot, J., Scheuchl, B., Van den Broeke, M., Van Wessem, M., and Morlighem, M.: Four decades of Antarctic Ice Sheet mass balance from 1979–2017, P. Natl. Acad. Sci. USA, 116, 1095–1103, https://doi.org/10.1073/pnas.1812883116, 2019.
Rott, H., Abdel Jaber, W., Wuite, J., Scheiblauer, S., Floricioiu, D., Van Wessem, J. M., Nagler, T., Miranda, N., and Van den Broeke, M. R.: Changing pattern of ice flow and mass balance for glaciers discharging into the Larsen A and B embayments, Antarctic Peninsula, 2011 to 2016, The Cryosphere, 12, 1273–1291, https://doi.org/10.5194/tc-12-1273-2018, 2018.
Scambos, T. A., Bohlander, J. A., Shuman, C. A., and Skvarca, P.: Glacier acceleration and thinning after ice shelf collapse in the Larsen B embayment, Antarctica, Geophys. Res. Lett., 31, 18, https://doi.org/10.1029/2004GL020670, 2004.
Shen, Q., Wang, H., Shum, C. K., Jiang, L., Hsu, H. T., and Dong, J.: Recent high-resolution Antarctic ice velocity maps reveal increased mass loss in Wilkes Land, East Antarctica, Sci. Rep., 8, 4477, https://doi.org/10.1038/s41598-018-22765-0, 2018.
Siegert, M. J., Kulessa, B., Bougamont, M., Christoffersen, P., Key, K., Andersen, K. R., Booth, A. D., and Smith, A. M.: Antarctic subglacial groundwater: a concept paper on its measurement and potential influence on ice flow, Geol. Soc., 461, 197–213, https://doi.org/10.1144/SP461.8, 2018.
Spergel, J. J., Kingslake, J., Creyts, T., van Wessem, M., and Fricker, H. A.: Surface meltwater drainage and ponding on Amery Ice Shelf, East Antarctica, 1973–2019, J. Glaciol., 67, 985–998, https://doi.org/10.1017/jog.2021.46, 2021.
Stokes, C. R., Sanderson, J. E., Miles, B. W. J., Jamieson, S. S. R., and Leeson, A. A.: Widespread distribution of supraglacial lakes around the margin of the East Antarctic Ice Sheet, Sci. Rep., 9, 1–14, https://doi.org/10.1038/s41598-019-50343-5, 2019.
Tetzner, D., Thomas, E., and Allen, C.: A Validation of ERA5 Reanalysis Data in the Southern Antarctic Peninsula–Ellsworth Land Region, and Its Implications for Ice Core Studies, Geosciences, 9, 289, https://doi.org/10.3390/geosciences9070289, 2019.
The IMBIE Team: Mass balance of the Antarctic Ice Sheet from 1992 to 2017, Nature, 558, 219–222, https://doi.org/10.1038/s41586-018-0179-y, 2018.
Tong, X., Liu, S., Li, R., Xie, H., Liu, S., Qiao, G., Feng, T., Tian, Y., and Ye, Z.: Multi-track extraction of two-dimensional surface velocity by the combined use of differential and multiple-aperture InSAR in the Amery Ice Shelf, East Antarctica, Remote Sens. Environ., 204, 122–137, https://doi.org/10.1016/j.rse.2017.10.036, 2018.
Trusel, L. D., Frey, K. E., Das, S. B., Karnauskas, K. B., Kuipers Munneke, P., van Meijgaard, E., and van den Broeke, M. R.: Divergent trajectories of Antarctic surface melt under two twenty-first-century climate scenarios, Nat. Geosci., 8, 927–932, https://doi.org/10.1038/ngeo2563, 2015.
Tuckett, P. A., Ely, J. C., Sole, A. J., Livingstone, S. J., Davison, B. J., van Wessem, J. M., and Howard, J.: Rapid accelerations of Antarctic Peninsula outlet glaciers driven by surface melt, Nat. Commun., 10, 1–8, https://doi.org/10.1038/s41467-019-12039-2, 2019.
Turton, J. V., Kirchgaessner, A., Ross, A. N., King, J. C., and Kuipers Munneke, P.: The influence of föhn winds on annual and seasonal surface melt on the Larsen C Ice Shelf, Antarctica, The Cryosphere, 14, 4165–4180, https://doi.org/10.5194/tc-14-4165-2020, 2020.
Urraca, R., Huld, T., Gracia-Amillo, A., Martinez-de-Pison, F. J., Kaspar, F., and Sanz-Garcia, A.: Evaluation of global horizontal irradiance estimates from ERA5 and COSMO-REA6 reanalyses using ground and satellite-based data, Solar Energy, 164, 339–354, https://doi.org/10.1016/j.solener.2018.02.059, 2018.
van Wessem, J. M., van de Berg, W. J., Noël, B. P. Y., van Meijgaard, E., Amory, C., Birnbaum, G., Jakobs, C. L., Krüger, K., Lenaerts, J. T. M., Lhermitte, S., Ligtenberg, S. R. M., Medley, B., Reijmer, C. H., van Tricht, K., Trusel, L. D., van Ulft, L. H., Wouters, B., Wuite, J., and van den Broeke, M. R.: Modelling the climate and surface mass balance of polar ice sheets using RACMO2 – Part 2: Antarctica (1979–2016), The Cryosphere, 12, 1479–1498, https://doi.org/10.5194/tc-12-1479-2018, 2018.
van Wessem, J. M., Steger, C. R., Wever, N., and van den Broeke, M. R.: An exploratory modelling study of perennial firn aquifers in the Antarctic Peninsula for the period 1979–2016, The Cryosphere, 15, 695–714, https://doi.org/10.5194/tc-15-695-2021, 2021.
Wachter, P., Beck, C., Philipp, A., Höppner, K., and Jacobeit, J.: Spatiotemporal Variability of the Southern Annular Mode and its Influence on Antarctic Surface Temperatures, J. Geophys. Res., 125, e2020JD033818, https://doi.org/10.1029/2020JD033818, 2020.
Wagner, A. C.: Flooding of the ice shelf in George VI Sound, Brit. Antarct. Surv. B., 28, 71–74, 1972.
Wessel, B., Huber, M., Wohlfart, C., Bertram, A., Osterkamp, N., Marschalk, U., Gruber, A., Reuß, F., Abdullahi, S., Georg, I., and Roth, A.: TanDEM-X PolarDEM 90 m of Antarctica: Generation and error characterization, The Cryosphere Discuss. [preprint], https://doi.org/10.5194/tc-2021-19, in review, 2021.