the Creative Commons Attribution 4.0 License.
the Creative Commons Attribution 4.0 License.
 | 21 Oct 2021
Brief communication: Detection of glacier surge activity using cloud computing of Sentinel-1 radar data
Paul Willem Leclercq
Andreas Kääb
Bas Altena
For studying the flow of glaciers and their response to climate change it is important to detect glacier surges. Here, we compute within Google Earth Engine the normalized differences between winter maxima of Sentinel-1 C-band radar backscatter image stacks over subsequent years. We arrive at a global map of annual backscatter changes, which are for glaciers in most cases related to changed crevassing associated with surge-type activity. For our demonstration period 2018–2019 we detected 69 surging glaciers, with many of them not classified so far as surge type. Comparison with glacier surface velocities shows that we reliably find known surge activities. Our method can support operational monitoring of glacier surges and some other special events such as large rock and snow avalanches.
- Article
(3940 KB) - Full-text XML
-
Supplement
(19642 KB) - BibTeX
- EndNote


Glacier surges are an example of glacier flow instability where the ice velocities strongly increase over a short period of time, typically less than a decade (Meier and Post, 1969). Only a small fraction of the world's glaciers are of surge type (Jiskoot et al., 1998; Sevestre and Benn, 2015). Still, glacier surging is of special scientific and applied interest. Studying glacier surges increases understanding of glacier flow and its instability (e.g. Thøgersen et al., 2019). Glacier surges disturb the link with climate and thus climatic interpretation of changes in glacier size or mass balance (Zemp et al., 2020). Surges can also constitute potential natural hazards (Kääb et al., 2021; Truffer et al., 2021).
Glacier surges have been detected by a wide variety of methods, including in situ observations of strong glacier advance or increase in surface velocity (e.g. Kamb et al., 1985). Several studies provide regional inventories of surge-type glaciers based on remote-sensing images of morphological features of past or ongoing surge activity, such as strong glacier advance, looped moraines, crevasse patterns, and sheared-off glacier tributaries (e.g. Jiskoot et al., 2003; Grant et al., 2009; Mukherjee et al., 2017) or automated analysis of medial moraine displacement (Herreid and Truffer, 2016). Morphological evidence of surges provides a more complete overview of surge-type glaciers than directly observed surge activity alone. However, the connection between different types of morphological evidence and glacier surge activity is not always straightforward, leading to uncertainty in the attribution of surge activity (Jiskoot et al., 2003; Sevestre and Benn, 2015). Surges can be more directly detected from measurements of glacier surface velocity using feature tracking in optical or radar satellite images (e.g. Quincey et al., 2011; Altena et al., 2019; Haga et al., 2020) and by measurement of surface elevation change (e.g. Sund et al., 2009; Gardelle et al., 2013).
In the present study we explore the potential of comparing the backscatter brightness of satellite synthetic aperture radar (SAR) backscatter images over time in order to monitor glacier surging. The underlying aim behind our study is to find a comparably simple and robust method to detect surges at a global scale and at an annual time interval.
Our method is based on variations in the strength of radar backscatter over time. As a surge implies substantial increase in the flow velocity and velocity gradients of a glacier, the glacier surface typically becomes more crevassed and radar backscatter is increased during an active surge. Likewise the glacier surface will become less crevassed and therefore the backscatter will decrease at the end of an active surge phase. Glacier crevasses represent strong surface roughness for incoming radar waves, with rectangular shapes and even side walls, and radar backscatter is thus typically stronger over crevasses than for most other glacier surface types. Comparison of the radar backscatter strength between two time intervals, i.e. investigating whether backscatter increases or decreases with time, therefore helps to detect the build-up or decay of glacier surges. Thereby, the weather and daylight independence of SAR data offers the opportunity for highly systematic surveys and a flexible choice of the time intervals to compare. In this study, we demonstrate annual changes in surge activity, noting that shorter or longer time intervals might also be of interest for certain applications. We use radar backscatter imagery from the EU ESA Copernicus Sentinel-1 C-band mission that has provided data with potential global coverage since launching in April 2014 (Torres et al., 2012). The actual Sentinel-1 coverage depends on the acquisition plan, meaning that certain areas of interest may have infrequent coverage.
To detect annual change in radar backscatter, we compare radar image stacks from two consecutive winter seasons, January to March for the Northern Hemisphere and June to August for the Southern Hemisphere. Winter radar imagery reduces complications by additional backscatter changes such as from surface melt and changing water content of the snow and firn (Winsvold et al., 2018). We create aggregated images of maximum backscatter values for each pixel location over the 3-month winter periods. Then we calculate the normalized difference between the two aggregated maximum images to search for change in backscatter and to eventually identify surge activity.
We implemented our method in Google Earth Engine (GEE), a cloud-based platform that provides easy access to high-performance computation on global remote-sensing datasets (Gorelick et al., 2017). Our implementation is inspired by the detection of ship traffic lanes in radar image stacks as exemplified by different authors (Gascoin, 2019, and the sources cited therein). The results given in this study are based on calibrated and ortho-corrected Sentinel-1 Ground Range Detected (GRD) scenes in cross-polarized (VH or HV) Interferometric Wide Swath (IW) mode, mainly from the descending path of Sentinel-1, that are available in GEE. However, we also use data from the ascending path where descending data have no coverage (see Supplement for more details). The normalized difference index (NDI) between the 2018 and 2019 stack maximum images is calculated as , and we apply a moderate filter (3×3 median filter) to NDIMaxGRD,2018–2019 to reduce the effect of speckle noise. The final assessment is performed manually, and we use GEE to visually explore the glacierized regions of the world and look for features of increased or decreased radar backscatter that can indicate glacier surge activity.
GEE also provides the possibility of including optical images in additional image layers. We display Sentinel-2 images from summer 2017 and summer 2019 to examine visual signs of surge activity that can support our conclusions drawn from the analysis of the backscatter images. For that purpose we create an optical composite image from the selection of all available Sentinel-2 images during July and August (Northern Hemisphere; January and February for the Southern Hemisphere) that have less than 80 % cloud cover. We then take the pixel-wise median of the selected images after applying the provided cloud cover threshold and plot an RGB colour image of bands B4, B3, and B2, respectively.
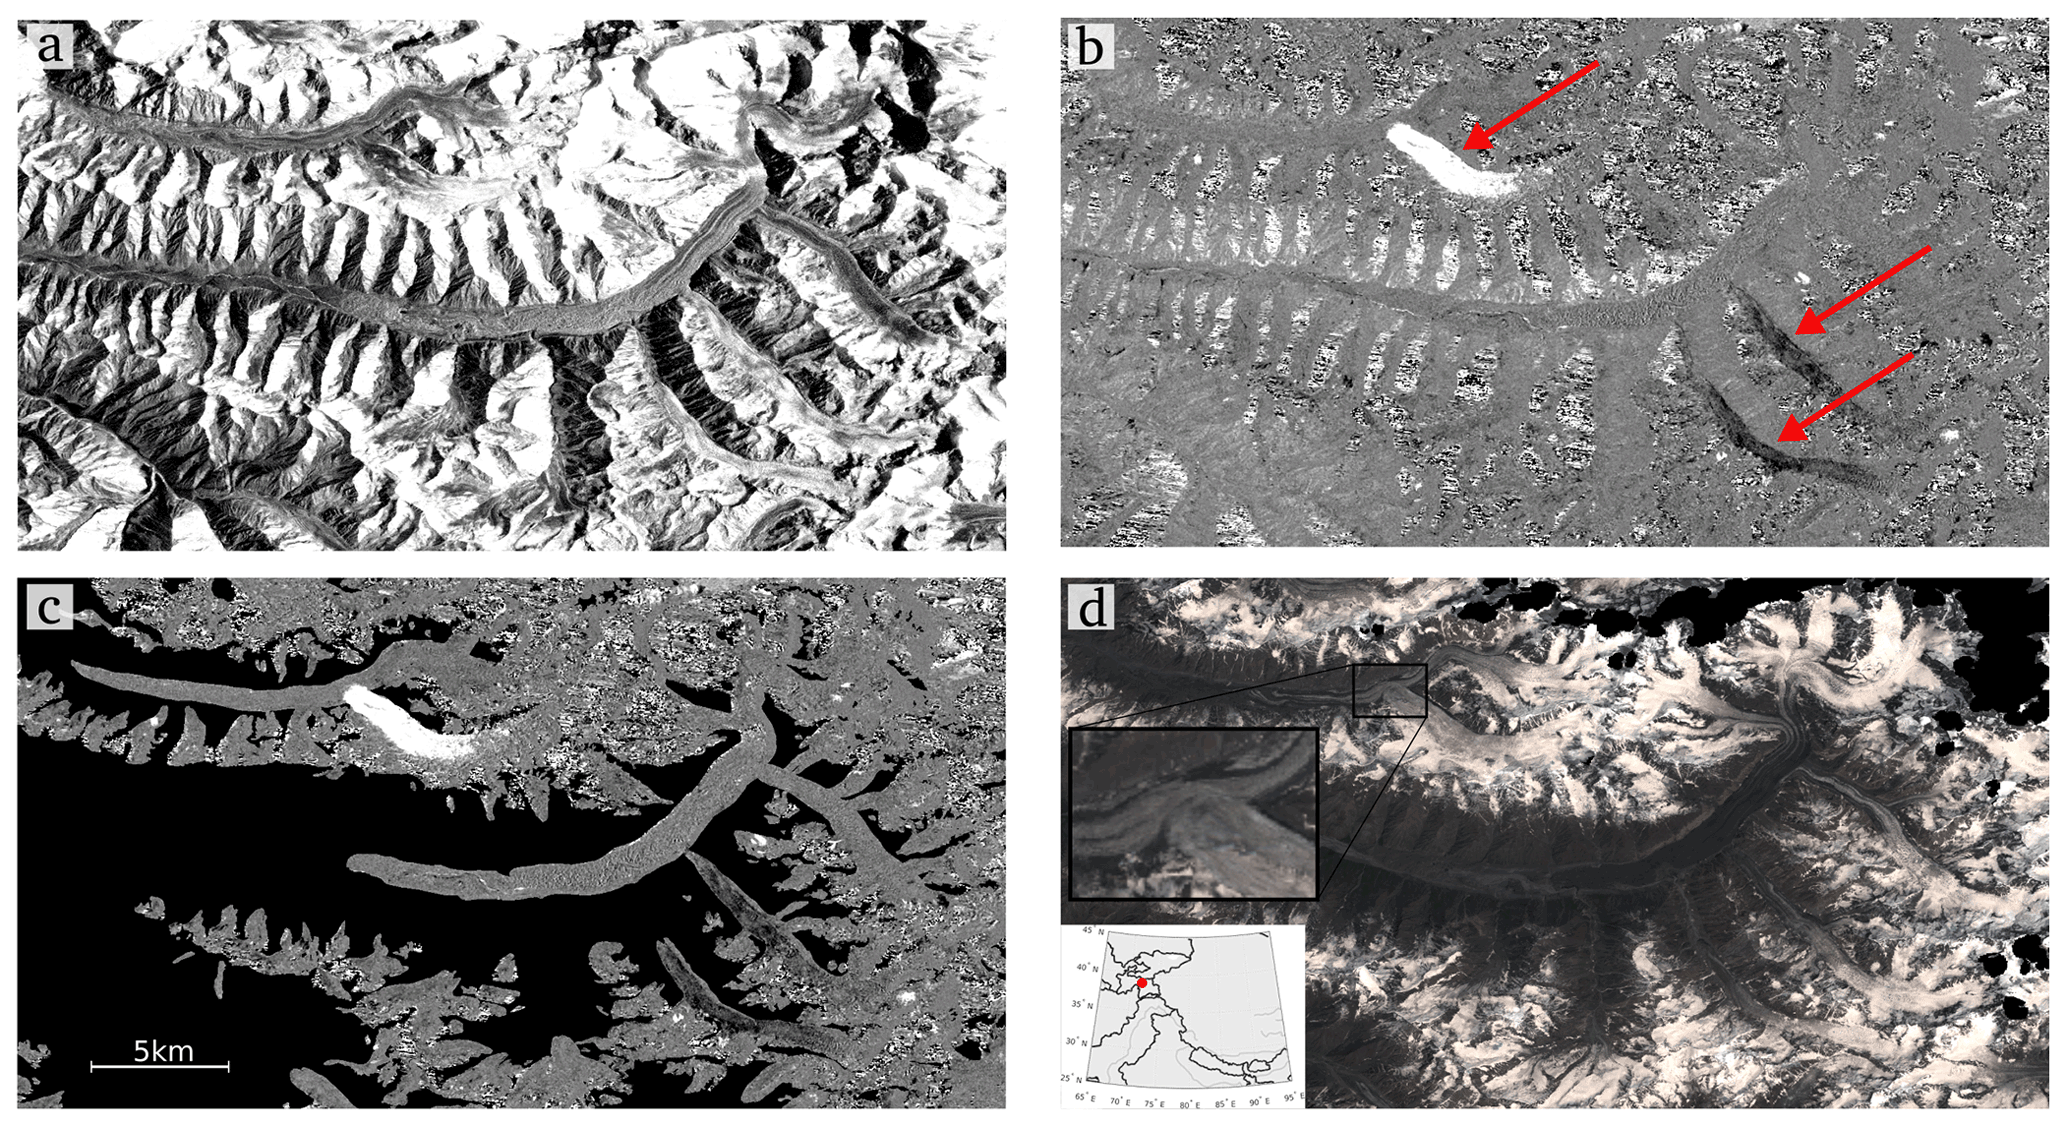
Figure 1Example for detecting glacier surges from differencing backscatter stack maxima of different winter seasons for a glacierized area surrounding the Obihingo (also called Obikhingou) river basin in the central Pamirs, Tajikistan. (a) Aggregated Copernicus Sentinel-1 maximum backscatter winter 2018. (b) Normalized Difference Index (NDI) image from Sentinel-1 maximum backscatter winter 2018–winter 2019. Arrows indicate areas with increased and decreased radar backscatter over glaciers: Gando Glacier, Vanchdara Glacier, and Shocalscogo Glacier, from top to bottom. (c) NDI image 2018–2019 masked with GLIMS glacier outlines. (d) Copernicus Sentinel-2 optical image summer 2019, with cloud mask in black and zoomed-in view of the protruding in the main trunk of Gando Glacier; inset shows the location of the images.
An example of an aggregated backscatter stack maximum image from the central Pamirs is shown in Fig. 1a, and the 2018–2019 NDI image for the same area is shown in Fig. 1b. This NDI image can be noisy, especially on steep mountain faces. Nevertheless, one can clearly recognize some larger distinct bright and dark regions in the NDI image that correspond to exceptional changes in backscatter from glacier surfaces. We have also masked the NDI image with the GLIMS glacier outlines (GLIMS and NSIDC, 2015) included in GEE to help identify the glacierized areas, as shown in the example in Fig. 1c. In this image it is easy to identify the bright patch as a glacier with increased backscatter in winter 2019 with respect to winter 2018. In Fig. 1c, two dark patches also reflect two glaciers, or tributaries, with decreased backscatter. In all three cases the changes in backscatter cover a large part of the glacier tongue, and we interpret these changes as an indicator of surge activity. In the optical image (Fig. 1d) we can see the protruding of the surging tributary in the main trunk of Gando Glacier, which supports our interpretation of the increase in backscatter as surge activity.
We also compare our detection of surge activity from changing backscatter with identification of surges from glacier surface velocity measurements in Svalbard and Alaska. For Svalbard, we derive glacier surface velocity from our own unpublished standard offset tracking between Sentinel-1 data (for method see e.g. Strozzi et al., 2017). For Alaska, we use glacier surface velocity generated from repeat Landsat optical satellite images using autoRIFT (Gardner et al., 2018) provided by the NASA MeaSUREs ITS_LIVE project (Gardner et al., 2020). In Svalbard we include all glaciers to control for both false positives and false negatives, while for Alaska we only include the velocity fields of the glaciers on which we detected surge activity and control for false positives.
3.1 Detailed example
As a detailed example we discuss results for Negribreen and Sonklarbreen on the east coast of Spitsbergen, Svalbard. Figure 2a shows a clear increase in radar backscatter between winter 2018 and winter 2019 for Negribreen, which started to surge in late summer 2016 and had surface velocities peak in the melt season of 2017 (Haga et al., 2020). After the 2017 peak in surface velocity, Haga et al. (2020) find a gradual slowdown in which the crevassing of the glacier surface, however, further intensified during the years 2018 and 2019. Haga et al. (2020) explain this through flow velocity being still high after the peak, which in turn led to continued stretching in the glacier ice. This indicates we can observe an increase in backscatter even after the surge velocity peak. Our method reflects surface roughness maxima and not necessarily ice velocity maxima during a surge. Close to the terminus of Negribreen, the backscatter has still increased over the period 2019–2020 (Fig. 2b), indicating that the terminus continued to advance. Upstream from the terminus, backscatter decreased, indicating less crevassing in this area, while the backscatter increased further upstream. The 2019–2020 NDI image on Negribreen thus represents an example of a glacier with both increased and decreased backscatter related to surge activity. We thus divide the detected surge activity into three groups: increased backscatter, decreased backscatter, and both increased and decreased backscatter (see also Table S1 and Fig. S2 in the Supplement). In the upper right of Fig. 2a and b the development of a surge of Sonklarbreen is visible. In the 2018–2019 NDI image (Fig. 2a) a slight increase in backscatter is already visible as well as a small advance of the glacier terminus. The surge is far more clear in the NDI image from the following year, 2019–2020 (Fig. 2b), with a prominent increase in radar backscatter and a clear advance of the glacier terminus.
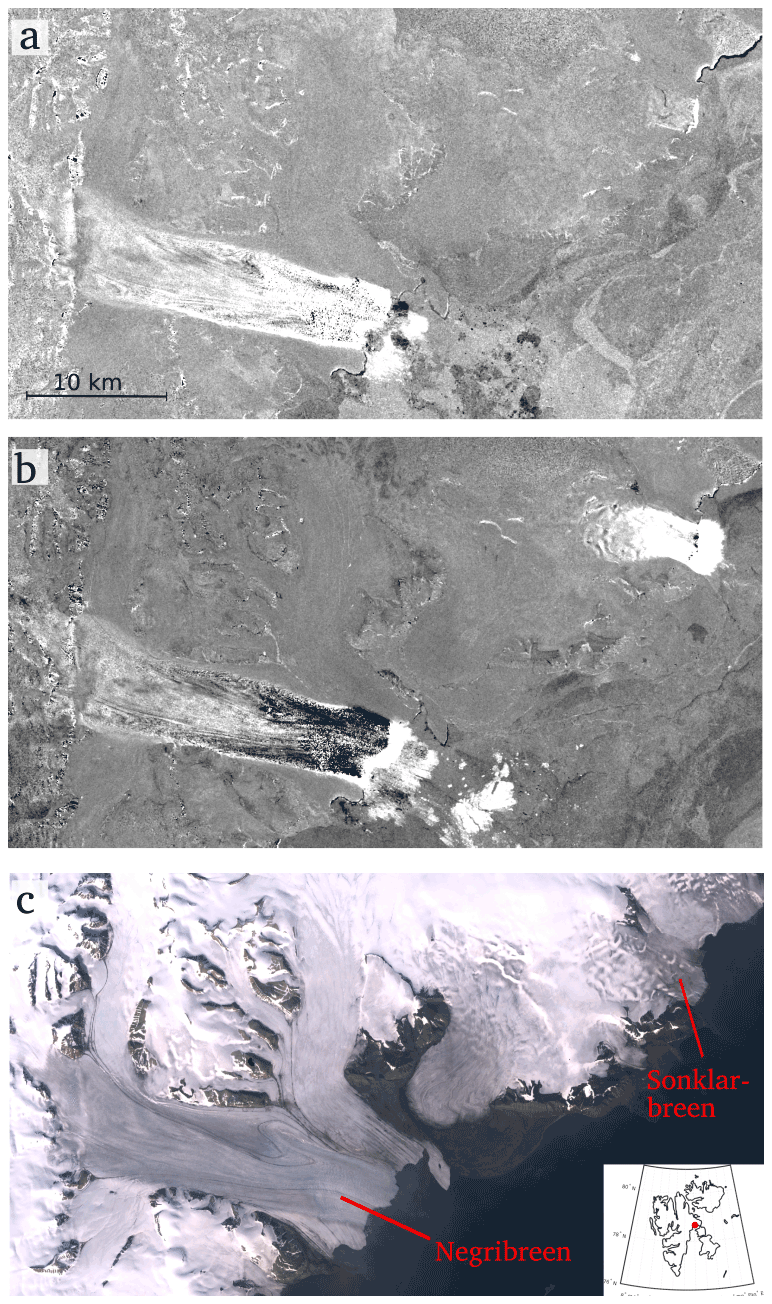
Figure 2Copernicus Sentinel-1 NDI image of Negribreen and Sonklarbreen, Svalbard, for the periods (a) 2018–2019, and (b) 2019–2020. (c) Copernicus Sentinel-2 1 July–31 August 2019 optical composite image, with a cloud mask in black. The inset shows the location in Svalbard of the glaciers shown in the images.
3.2 Global results 2018–2019
In total we found 69 glaciers with surge activity in the period 2018–2019 from changes in the radar backscatter. Of these, 31 displayed an increase, 29 a decrease, and 9 a combination of both an increase and a decrease in Sentinel-1 radar backscatter. The glaciers are located in the first-order Randolph Glacier Inventory (RGI) regions (RGI Consortium, 2017) Alaska (18 glaciers), Canadian Arctic North (2), Canadian Arctic South (2), Greenland (5), Svalbard (14), Russian Arctic (2), Central Asia (13), South Asia (West) (10), South Asia (East) (1), and Southern Andes (2) (see Supplement Table S1 and Supplement Fig. S2). We have also found 18 cases of change in backscatter for which we are not certain whether they can be classified as surge activity, listed in Table S1. In these cases the change in backscatter could be due to processes other than changes in ice velocity (see Sect. S3 in the Supplement), or the velocity change could be related to a process other than surge activity, such as calving instabilities.
According to the surge classification from Sevestre and Benn (2015) included in the RGI, there are earlier observations of surge activity for 16 of the 69 glaciers that we find to have surge activity in the year 2018–2019. A further 8 of these 69 glaciers are classified as either possible or probable in terms of having surge activity. For 10 glaciers where we find surge activity, the RGI includes no evidence of surge, and 35 of the 69 glaciers are not yet assigned a surge classification.
3.3 Comparison with velocity measurements
In Svalbard, the annual differences between winter surface velocities indicate surge behaviour for all the glaciers for which we detected surge activity in the radar backscatter difference. In addition, measurements of glacier velocity indicate only one glacier acceleration other than the surges we find in the NDI images. Interestingly, for several cases of distinct backscatter changes, surge activity is not immediately obvious from the radar velocities or supporting optical images. Only close inspection of velocity differences over time and velocity changes from several years confirm then the backscatter-based detection of surge activity. Examples of such cases include early phases of surges or “partial” surges (surges that do not propagate into large parts of a glacier) (Sund et al., 2009). In Alaska, where we only compare for glaciers with detected surge activity, 16 of the 18 detected surges are supported by measured changes in surface velocity. For the two glaciers where velocity measurements do not support surge activity, changes in radar backscatter due to firn processes are probably misinterpreted as an indication of surge activity. See Sect. S4 and Figs. S5–S11 in the Supplement for more details.
Comparison of the surge activity we detect from the radar backscatter difference images with glacier surface velocity suggests that the method we propose for surge detection is reliable. For both Svalbard and Alaska the velocity measurements support most of the surge activity we detect with the backscatter difference images. In addition, from the NDI images we detect almost all instabilities visible in the velocity measurements in Svalbard. For two cases in Alaska where the backscatter differences indicated surge activity, we find no evidence of a surge in the velocity measurements. Our backscatter-based method of surge detection may in part be more sensitive than remotely sensed velocity changes or visual inspection of optical images for morphological indicators, such that partial surges or surge onsets are picked up in the NDI image that are not (yet) easily visible otherwise. It should be noted that due to the resolution of the method, no instabilities smaller than ca. 100×100 m can be detected, nor can surges of glaciers that are smaller than this be detected, even if such small instabilities would not normally be classified as surges. Also, the time of switch from increasing to decreasing backscatter strength is not necessarily equivalent to the maximum ice velocity (see above example of Negribreen).
There are many possible causes other than glacier surge activity for differences in the brightness of radar backscatter stack maxima in 2 consecutive years. There can be acquisition and processing effects related to particularly steep terrain, such as radar layover and foreshortening (see Sect. S2 in the Supplement). In addition, we find cases of differences due to natural changes other than glacier velocity changes, such as changing glacial lakes, landslides, snow avalanche activity, and changes in the firn conditions in the accumulation area (see Sect. S3 in the Supplement). There is not always a clear distinction between changes in glacier velocity due to surge activity and other glacier instabilities such as calving instabilities (e.g. Wychen et al., 2020). On the one hand this means that the method we present here could be interesting for many purposes other than detecting glacier surges. On the other hand, it is possible that backscatter changes resulting from other processes are misinterpreted as surge activity, leading to uncertainty in the classification. Following up on this uncertainty, Table S1 includes 18 cases where we detect backscatter changes that could be related to surge activity but that we did not classify as such. To avoid misinterpretation it is helpful to complement the information from the radar backscatter difference images with optical images. Sometimes, the aggregated maximum radar backscatter images themselves, i.e. before differencing them, provide useful information. The backscatter difference images over multiple annual intervals can be investigated to find if the entire surge cycle can be detected.
The results we present here are based on the fairly straightforward differencing of stacks of radar images over a period of a year. We have tried other stack statistics such as the median and mean brightness, but we find that in order to detect glacier surges, taking the maximum brightness over the stack of radar images in the winter period works best. Likewise, differencing over the period of a year, with the comparison of one winter to the next, and using cross-polarization (VH and HV) rather than co-polarization (HH and VV) works very well for surge detection as we show in this study. That does not exclude that other choices could be better suited, especially when applying this method to detect other events and processes. Based on our results, we expect no difference in the detection of surge activity between ascending and descending tracks and we expect no influence of the direction of glacier flow relative to the line of sight of the Sentinel-1 radar images (see Sect. S2 for more details).
Sevestre and Benn (2015) provide currently the most extensive global compilation of glacier surge activity. Their database includes 2317 surge-type glaciers. We look at a very limited time span and only detect surges that induce changes in radar backscatter in the year 2018 to 2019. Nevertheless, almost two-thirds of the surging glaciers we find are not identified by Sevestre and Benn (2015), as included in the RGI, being either not assigned a surging class or classified as having no indication of surge activity. This indicates there are many more surge-type glaciers than those yet identified and that our method could contribute in global surge detection to fill this gap. However, it should be kept in mind that the global dataset in RGI, based on Sevestre and Benn (2015), is not complete and does not cover our study period 2018–2019 such that surge-type glaciers that are not included in the RGI could have been reported in other literature. For example, the glacier with GLIMS ID G330976E68786N in east Greenland is classified as likely surge-type by Jiskoot et al. (2003), while it has no surge class assigned in the RGI. As our method detects ongoing surges only, in contrast to methods that study evidence of past surges (e.g. Copland et al., 2003; Jiskoot et al., 2003), a systematic overview of surging glaciers requires constant monitoring over a long period of time. It could be explored whether some form of object-oriented classification or machine learning could be of help to reduce the workload of exploring the backscatter difference images.
We have shown that differencing aggregated Sentinel-1 radar backscatter images over subsequent years has great potential to detect glacier surges. Surge-induced changes in surface roughness lead to an easily discernible increase or decrease in radar backscatter that we use to identify ongoing surge activity. We compare the results from our method with surge detection from surface velocity measurements for Alaska and Svalbard. The two methods largely identify the same surge activity. Some differences in surge detection could be due to the higher sensitivity of our backscatter-based method that is able to detect partial surges or surge onsets before these are well visible in the surface velocity data. For some cases, we might have misinterpreted backscatter changes caused by processes other than surge activity. The method presented here has a wider application than just glacier surge detection and could be further adapted to study these other processes as well. For correct surge detection we recommend additional information from optical satellites, aggregated radar backscatter images, and the temporal evolution of the normalized difference images. For our demonstration period 2018–2019 almost two-thirds of the 69 surging glaciers found are not yet assigned as surge activity in the global database. There could be far more surging glaciers than identified so far, and the method presented here could contribute to their detection.
The GEE code developed for this study is available at the DOI https://doi.org/10.5281/zenodo.5285712 (Leclercq et al., 2021a) or directly in GEE by following https://code.earthengine.google.com/272da22a685100c0dcfe65981445afcd (Leclercq et al., 2021b) (requires a GEE account).
The supplement related to this article is available online at: https://doi.org/10.5194/tc-15-4901-2021-supplement.
AK conceived the study. PWL and AK performed the analysis. BA helped with the analysis of velocity measurements. PWL prepared the manuscript with contributions from all authors.
The authors declare that they have no conflict of interest.
Publisher's note: Copernicus Publications remains neutral with regard to jurisdictional claims in published maps and institutional affiliations.
We thank the two anonymous reviewers, Nanna Bjørnholt Karlsson, and Hester Jiskoot for their comments that helped to improve this paper.
This research has been supported by ESA through Glaciers CCI and Earth Explorer 10 Harmony studies (grant nos. 4000109873/14/I-NB, 4000127593/19/I-NS, 4000127656/19/NL/FF/gp) and the Norwegian Copernicus Service, Norwegian Space Centre (NIT.06.15.5). The study is also a contribution to the Svalbard Integrated Arctic Earth Observing System SIOS and the MAMMAMIA project (RCN grant no. 301837).
This paper was edited by Nanna Bjørnholt Karlsson and reviewed by two anonymous referees.
Altena, B., Scambos, T., Fahnestock, M., and Kääb, A.: Extracting recent short-term glacier velocity evolution over southern Alaska and the Yukon from a large collection of Landsat data, The Cryosphere, 13, 795–814, https://doi.org/10.5194/tc-13-795-2019, 2019. a
Copland, L., Sharp, M. J., and Dowdeswell, J. A.: The distribution and flow characteristics of surge-type glaciers in the Canadian High Arctic, Ann. Glaciol., 36, 73–81, https://doi.org/10.3189/172756403781816301, 2003. a
Gardelle, J., Berthier, E., Arnaud, Y., and Kääb, A.: Region-wide glacier mass balances over the Pamir–Karakoram–Himalaya during 1999–2011, The Cryosphere, 7, 1263–1286, https://doi.org/10.5194/tc-7-1263-2013, 2013. a
Gardner, A. S., Moholdt, G., Scambos, T., Fahnstock, M., Ligtenberg, S., van den Broeke, M., and Nilsson, J.: Increased West Antarctic and unchanged East Antarctic ice discharge over the last 7 years, The Cryosphere, 12, 521–547, https://doi.org/10.5194/tc-12-521-2018, 2018. a
Gardner, A. S., Fahnestock, M. A., and Scambos, T. A.: ITS LIVE Regional Glacier and Ice Sheet Surface Velocities, National Snow and Ice Data Center [data], https://doi.org/10.5067/6II6VW8LLWJ7, 2020. a
Gascoin, S.: Visualizing shipping lanes from Sentinel-1, website, available at: https://labo.obs-mip.fr/multitemp/visualizing-shipping-lanes-from-sentinel-1/ (last access: March 2021), 2019. a
GLIMS and NSIDC: Global Land Ice Measurements from Space glacier database, Compiled and made available by the international GLIMS community and the National Snow and Ice Data Center, Boulder CO, USA, https://doi.org/10.7265/N5V98602, 2015 (updated 2018). a
Gorelick, N., Hancher, M., Dixon, M., Ilyushchenko, S., Thau, D., and Moore, R.: Google Earth Engine: Planetary-scale geospatial analysis for everyone, big Remotely Sensed Data: tools, applications and experiences, Remote Sens. Environ., 202, 18–27, https://doi.org/10.1016/j.rse.2017.06.031, 2017. a
Grant, K. L., Stokes, C. R., and Evans, I. S.: Identification and characteristics of surge-type glaciers on Novaya Zemlya, Russian Arctic, J. Glaciol., 55, 960–972, https://doi.org/10.3189/002214309790794940, 2009. a
Haga, O. N., McNabb, R., Nuth, C., Altena, B., Schellenberger, T., and Kääb, A.: From high friction zone to frontal collapse: dynamics of an ongoing tidewater glacier surge, Negribreen, Svalbard, J. Glaciol., 66, 742–754, https://doi.org/10.1017/jog.2020.43, 2020. a, b, c, d
Herreid, S. and Truffer, M.: Automated detection of unstable glacier flow and a spectrum of speedup behavior in the Alaska Range, J. Geophys. Res.-Earth, 121, 64–81, https://doi.org/10.1002/2015JF003502, 2016. a
Jiskoot, H., Boyle, P., and Murray, T.: The incidence of glacier surging in Svalbard: evidence from multivariate statistics, Comput. Geosci., 24, 387–399, https://doi.org/10.1016/S0098-3004(98)00033-8, 1998. a
Jiskoot, H., Murray, T., and Luckman, A.: Surge potential and drainage-basin characteristics in East Greenland, Ann. Glaciol., 36, 142–148, https://doi.org/10.3189/172756403781816220, 2003. a, b, c, d
Kääb, A., Jacquemart, M., Gilbert, A., Leinss, S., Girod, L., Huggel, C., Falaschi, D., Ugalde, F., Petrakov, D., Chernomorets, S., Dokukin, M., Paul, F., Gascoin, S., Berthier, E., and Kargel, J. S.: Sudden large-volume detachments of low-angle mountain glaciers – more frequent than thought?, The Cryosphere, 15, 1751–1785, https://doi.org/10.5194/tc-15-1751-2021, 2021. a
Kamb, B., Raymond, C. F., Harrison, W. D., Engelhardt, H., Echelmeyer, K. A., Humphrey, N., Brugman, M. M., and Pfeffer, T.: Glacier Surge Mechanism: 1982–1983 Surge of Variegated Glacier, Alaska, Science, 227, 469–479, 1985. a
Leclercq, P. W., Kääb, A. M., and Altena, B.: surge_detection_Sentinel1-v1.0, Zenodo [code], https://doi.org/10.5281/zenodo.5285712, 2021a. a
Leclercq, P. W., Kääb, A., and Altena, B.: https://code.earthengine.google.com/272da22a685100c0dcfe65981445afcd, last access: 27 August 2021b. a
Meier, M. F. and Post, A.: What are glacier surges?, Can. J. Earth Sci., 6, 807–817, https://pubs.geoscienceworld.org/cjes/article-abstract/6/4/807/54772/What-are-glacier-surges, 1969. a
Mukherjee, K., Bolch, T., Goerlich, F., Kutuzov, S., Osmonov, A., Pieczonka, T., and Shesterova, I.: Surge-Type Glaciers in the Tien Shan (Central Asia), Arct. Antarct. Alp. Res., 49, 147–171, https://doi.org/10.1657/AAAR0016-021, 2017. a
Quincey, D. J., Braun, M., Glasser, N. F., Bishop, M. P., Hewitt, K., and Luckman, A.: Karakoram glacier surge dynamics, Geophys. Res. Lett., 38, L18504, https://doi.org/10.1029/2011GL049004, 2011. a
RGI Consortium: Randolph Glacier Inventory – A dataset of Global Glacier Outlines: Version 6.0, Technical Report, Global Land Ice Measurements from Space, Digital Media, CO, USA,https://doi.org/10.7265/N5-RGI-60, 2017. a
Sevestre, H. and Benn, D. I.: Climatic and geometric controls on the global distribution of surge-type glaciers: implications for a unifying model of surging, J. Glaciol., 61, 646–662, https://doi.org/10.3189/2015JoG14J136, 2015. a, b, c, d, e, f
Strozzi, T., Paul, F., Wiesmann, A., Schellenberger, T., and Kääb, A.: Circum-Arctic Changes in the Flow of Glaciers and Ice Caps from Satellite SAR Data between the 1990s and 2017, Remote Sens., 9, 947, https://doi.org/10.3390/rs9090947, 2017. a
Sund, M., Eiken, T., Hagen, J. O., and Kääb, A.: Svalbard surge dynamics derived from geometric changes, Ann. Glaciol., 50, 50–60, https://doi.org/10.3189/172756409789624265, 2009. a, b
Thøgersen, K., Gilbert, A., Schuler, T. V., and Malthe-Sørenssen, A.: Rate-and-state friction explains glacier surge propagation, Nat. Commun., 10, 2823, https://doi.org/10.1038/s41467-019-10506-4, 2019. a
Torres, R., Snoeij, P., Geudtner, D., Bibby, D., Davidson, M., Attema, E., Potin, P., Rommen, B., Floury, N., Brown, M., Traver, I. N., Deghaye, P., Duesmann, B., Rosich, B., Miranda, N., Bruno, C., L' Abbate, M., Croci, R., Pietropaolo, A., Huchler, M., and Rostan, F.: GMES Sentinel-1 mission, Remote Sens. Environ., 120, 9–24, https://doi.org/10.1016/j.rse.2011.05.028, 2012. a
Truffer, M., Kääb, A., Harrison, W., Osipova, G., Nosenko, G., Espizua, L., Gilbert, A., Fischer, L., Huggel, C., Craw Burns, P., and Lai, A.: Snow and Ice-Related Hazards, Risks, and Disasters (Second Edition), chap. 13 – Glacier surges, 417–466, Elsevier, 2021. a
Winsvold, S. H., Kääb, A., Nuth, C., Andreassen, L. M., van Pelt, W. J. J., and Schellenberger, T.: Using SAR satellite data time series for regional glacier mapping, The Cryosphere, 12, 867–890, https://doi.org/10.5194/tc-12-867-2018, 2018. a
Van Wychen, W., Burgess, D., Kochtitzky, W., Nikolic, N., Copland, L., and Gray, L.: RADARSAT-2 Derived Glacier Velocities and Dynamic Discharge Estimates for the Canadian High Arctic: 2015–2020, Can. J. Remote Sens., 46, 695–714, https://doi.org/10.1080/07038992.2020.1859359, 2020. a
Zemp, M., Gärtner-Roer, I., Nussbaumer, S. U., Bannwart, J., Rastner, P., Paul, F., and Hoelzle, M. (Eds.): WGMS 2020, Global Glacier Change Bulletin no. 3 (2016–2017), ISC(WDS)/IUGG(IACS)/UNEP/UNESCO/WMO, World Glacier Monitoing Service, Zürich, Switzerland, 2020. a