the Creative Commons Attribution 4.0 License.
the Creative Commons Attribution 4.0 License.
 | 12 Oct 2021
Recent changes in pan-Arctic sea ice, lake ice, and snow-on/off timing
Alicia A. Dauginis
Arctic snow and ice cover are vital indicators of climate variability and change, yet while the Arctic shows overall warming and dramatic changes in snow and ice cover, the response of these high-latitude regions to recent climatic change varies regionally. Although previous studies have examined changing snow and ice separately, examining phenology changes across multiple components of the cryosphere together is important for understanding how these components and their response to climate forcing are interconnected. In this work, we examine recent changes in sea ice, lake ice, and snow together at the pan-Arctic scale using the Interactive Multisensor Snow and Ice Mapping System 24 km product from 1997–2019, with a more detailed regional examination from 2004–2019 using the 4 km product. We show overall that for sea ice, trends toward earlier open water (−7.7 d per decade, p<0.05) and later final freeze (10.6 d per decade, p<0.05) are evident. Trends toward earlier first snow-off (−4.9 d per decade, p<0.05), combined with trends toward earlier first snow-on (−2.8 d per decade, p<0.05), lead to almost no change in the length of the snow-free season, despite shifting earlier in the year. Sea ice-off, lake ice-off, and snow-off parameters were significantly correlated, with stronger correlations during the snow-off and ice-off season compared to the snow-on and ice-on season. Regionally, the Bering and Chukchi seas show the most pronounced response to warming, with the strongest trends identified toward earlier ice-off and later ice-on. This is consistent with earlier snow-off and lake ice-off and later snow-on and lake ice-on in west and southwest Alaska. In contrast to this, significant clustering between sea ice, lake ice, and snow-on trends in the eastern portion of the North American Arctic shows an earlier return of snow and ice. The marked regional variability in snow and ice phenology across the pan-Arctic highlights the complex relationships between snow and ice, as well as their response to climatic change, and warrants detailed monitoring to understand how different regions of the Arctic are responding to ongoing changes.
- Article
(23155 KB) - Full-text XML
- BibTeX
- EndNote


The cryosphere is the second largest component of the global climate system after the ocean, exerting significant effects on the Earth's energy balance, atmospheric circulation, and heat transport (Lemke et al., 2007; Callaghan et al., 2011; Derksen et al., 2012). The relevance for climate variability and change is based on physical properties, such as high surface reflectivity (albedo) and latent heat associated with phase changes, both of which have a strong impact on the surface energy balance (Lemke et al., 2007). The extent and duration of snow and ice cover have direct feedbacks to the climate system as they strongly influence planetary albedo (Rahmstorf, 2010; Derksen et al., 2012). Seasonal snow and ice cover are also important for Arctic ecosystems as they rely on snow and ice cover for feeding, transportation, and habitat (Dersken et al., 2012). Additionally, the traditional ways of life of many northern residents depend on snow and ice cover for sources of food, transportation, and economic activities (Derksen et al., 2012). Recent assessments reveal strong linkages between decreasing snow and ice cover and increasing temperatures in the Arctic (e.g. Hernandez-Henriquez et al., 2015; Johannessen et al., 2016; Druckenmiller and Richter-Menge, 2020). Reductions in sea ice extent, decreases in snow cover duration, and earlier melt onset in Arctic and sub-Arctic lakes have been reported (Serreze and Stroeve, 2015; Surdu et al., 2016; Mudryk et al., 2018). Arctic surface air temperatures in 2019 were the second highest in the 120-year (1900–present) observational record (Druckenmiller and Richter-Menge, 2020) and are projected to continue to increase well into the 21st century (Overland, 2020). Though the Arctic as a whole is undergoing climatic change, observations are often marked by regional differences tied in part to global connections via the atmosphere and ocean (Druckenmiller and Richter-Menge, 2020). For example, sea ice in the Alaska/Russia region has shown large reductions in extent over the past decade, which has been linked to strong warming and large sea surface temperature anomalies in this area (Druckenmiller and Richter-Menge, 2020; Perovich et al., 2020). The Canadian Arctic Archipelago (CAA), however, has been shown to exhibit earlier freeze trends during recent years (e.g. Dauginis and Brown, 2020) and weaker trends toward earlier melt onset compared to other Arctic regions (e.g. Mahmud et al., 2016; Marshall et al., 2019). Furthermore, the effect of warming on sea ice dynamics in this region can be counterintuitive as warming could result in increased ice import from the Arctic Ocean into the CAA (Melling, 2002; Howell and Brady, 2019; Moore et al., 2021). Therefore, monitoring Arctic snow and ice cover is critical to improve our understanding of this complex and variable region in the context of climate variability and change.
Monitoring Arctic snow and ice cover largely relies on the use of satellite observations, as ground-based observations are constrained by limited in situ data, large gaps and biases in surface observing networks, and limited geographic coverage (Brown et al., 2010; Brown and Duguay, 2011). Satellite-based microwave data are most used in snow and ice monitoring as they provide information regardless of solar illumination and cloud cover (Brown et al., 2014). Microwave measurements have been used to estimate snow (both on land and on sea ice) and ice melt and freeze onset (e.g. Howell et al., 2006; Yackel et al., 2007; Wang et al., 2011; Zheng et al., 2017; Bliss et al., 2017, 2019) at various spatial resolutions ranging from 6.25 to 25 km (Brown et al., 2014). The Special Sensor Microwave/Imager (SSM/I) and Scanning Multichannel Microwave Radiometer (SMMR) passive microwave datasets have been widely used in snow and sea ice mapping (e.g. Cho et al., 2017; Lynch et al., 2016; Crawford et al., 2018). Passive microwave data are well suited for snow and ice monitoring due to all-weather imaging capabilities and long available records (since the late 1970s), though the coarse resolution (25 km) limits their application and reduces the accuracy of estimates (Derksen et al., 2004; Mudryk et al., 2015; Pulliainen et al., 2020). There are well-documented uncertainties in using passive microwave measurements to retrieve snow water equivalent and snow cover extent due to differences in snow and surface cover properties (e.g. snow depth, snow grain size, topography, vegetation), which influence microwave emission and backscatter (Brown et al., 2010; Park et al., 2012; Tedesco et al., 2015). The coarse spatial resolution also limits the ability of the sensors to resolve small leads and polynyas and can result in errors near coastal areas due to pixel-based land contamination (Howell et al., 2006; Brown et al., 2014). Johnson and Eicken (2016) note that strong brightness temperature contrasts across pixels can result in falsely high estimates of sea ice concentration, particularly during the summer when there is open water near coastal areas, while in contrast, it is known that passive microwave data can underrepresent sea ice coverage when liquid water is present (melt ponds on the ice, or wet snow) (e.g. Meier, 2005). SMMR and SSM/I are less commonly used in lake ice applications as the spatial resolution limits analyses to large lakes only. Additionally, the 85 GHz channel is susceptible to considerable atmospheric interference, and the 25 km spatial resolution can result in large differences in water/land brightness temperatures (Cavalieri et al., 1999; Howell et al., 2009).
Optical remote sensing data have also been used to monitor Arctic snow and ice cover (e.g. Nitze et al., 2017; Young et al., 2018) as they provide an improved spatial resolution (e.g. 500 m Moderate Resolution Imaging Spectroradiometer snow product) compared to passive microwave data. The use of optical imagery is limited to the spring and summer months in high-latitude regions as there is no source of illumination during late fall and winter due to polar darkness. Additionally, the poor temporal resolution of some optical data (e.g. 16 d for Landsat, 8 d MODIS snow product) can introduce uncertainty and inaccuracy into estimates of snow conditions on the Earth's surface. Active microwave data have been used successfully in snow (e.g. Brown et al., 2007), sea ice (e.g. Mortin et al., 2014), and lake ice (e.g. Howell et al., 2009) applications. Active microwave algorithms using synthetic aperture radar (SAR) provide high-resolution (20 to 100 m) retrieval of snow and ice parameters (e.g. Surdu et al., 2016; Zhu et al., 2018; Howell and Brady, 2019). SAR estimates of snow and ice cover provide the highest spatial resolution compared to other products, and while previously limited by the moderate temporal resolution, narrow swath width, and limited image availability across the Arctic (Brown et al., 2014; Howell et al., 2019), recent advances through additional sensors (e.g. RADARSAT Constellation Mission, Sentinel-1) have much improved both temporal and spatial coverage as well as data availability. Multisensor approaches exploiting advantages of microwave and optical sensors have been used to estimate snow thickness on first-year sea ice (e.g. Zheng et al., 2017) and to resolve leads and polynyas at an improved spatial resolution (e.g. Ludwig et al., 2019). The all-weather capabilities of microwave data combined with high temporal resolution of optical imagery can improve estimates of snow and ice parameters in the Arctic.
A combined approach to snow and ice mapping is possible with the use of the National Ice Center Interactive Multisensor Snow and Ice Mapping System (IMS) product. IMS is created using a variety of multi-sourced datasets (e.g. optical imagery, microwave data, ancillary data) and provides daily maps of snow and ice cover at 24, 4, and 1 km spatial resolutions (Ramsay, 1998; Helfrich et al., 2007). The daily temporal resolution and all-weather monitoring capabilities make IMS suitable in snow cover applications (e.g. Brubaker et al., 2005; Chen et al., 2012) and lake ice monitoring on large lakes (e.g. Brown and Duguay, 2012; Duguay et al., 2012, 2013, 2014, 2015; Duguay and Brown, 2018). Though not commonly used in sea ice applications, Brown et al. (2014) show that IMS is advantageous over several automated algorithms for monitoring sea ice phenology. IMS is also able to improve sea ice estimates by reducing land contamination and better representing coastal regions compared to passive microwave estimates (Brown et al., 2014), as well as to resolve finer-scale details between narrow ocean channels (Dauginis and Brown, 2020). This work expands on the work of Dauginis and Brown (2020) and examines changes in sea ice, lake ice, and snow phenology from 1997–2019 across the pan-Arctic. The objectives of this paper are to (1) assess changes in sea ice, lake ice, and snow phenology from 1997–2019 across the pan-Arctic and (2) analyze regional changes in snow and ice phenology during more recent years (2004–2019) across the pan-Arctic.
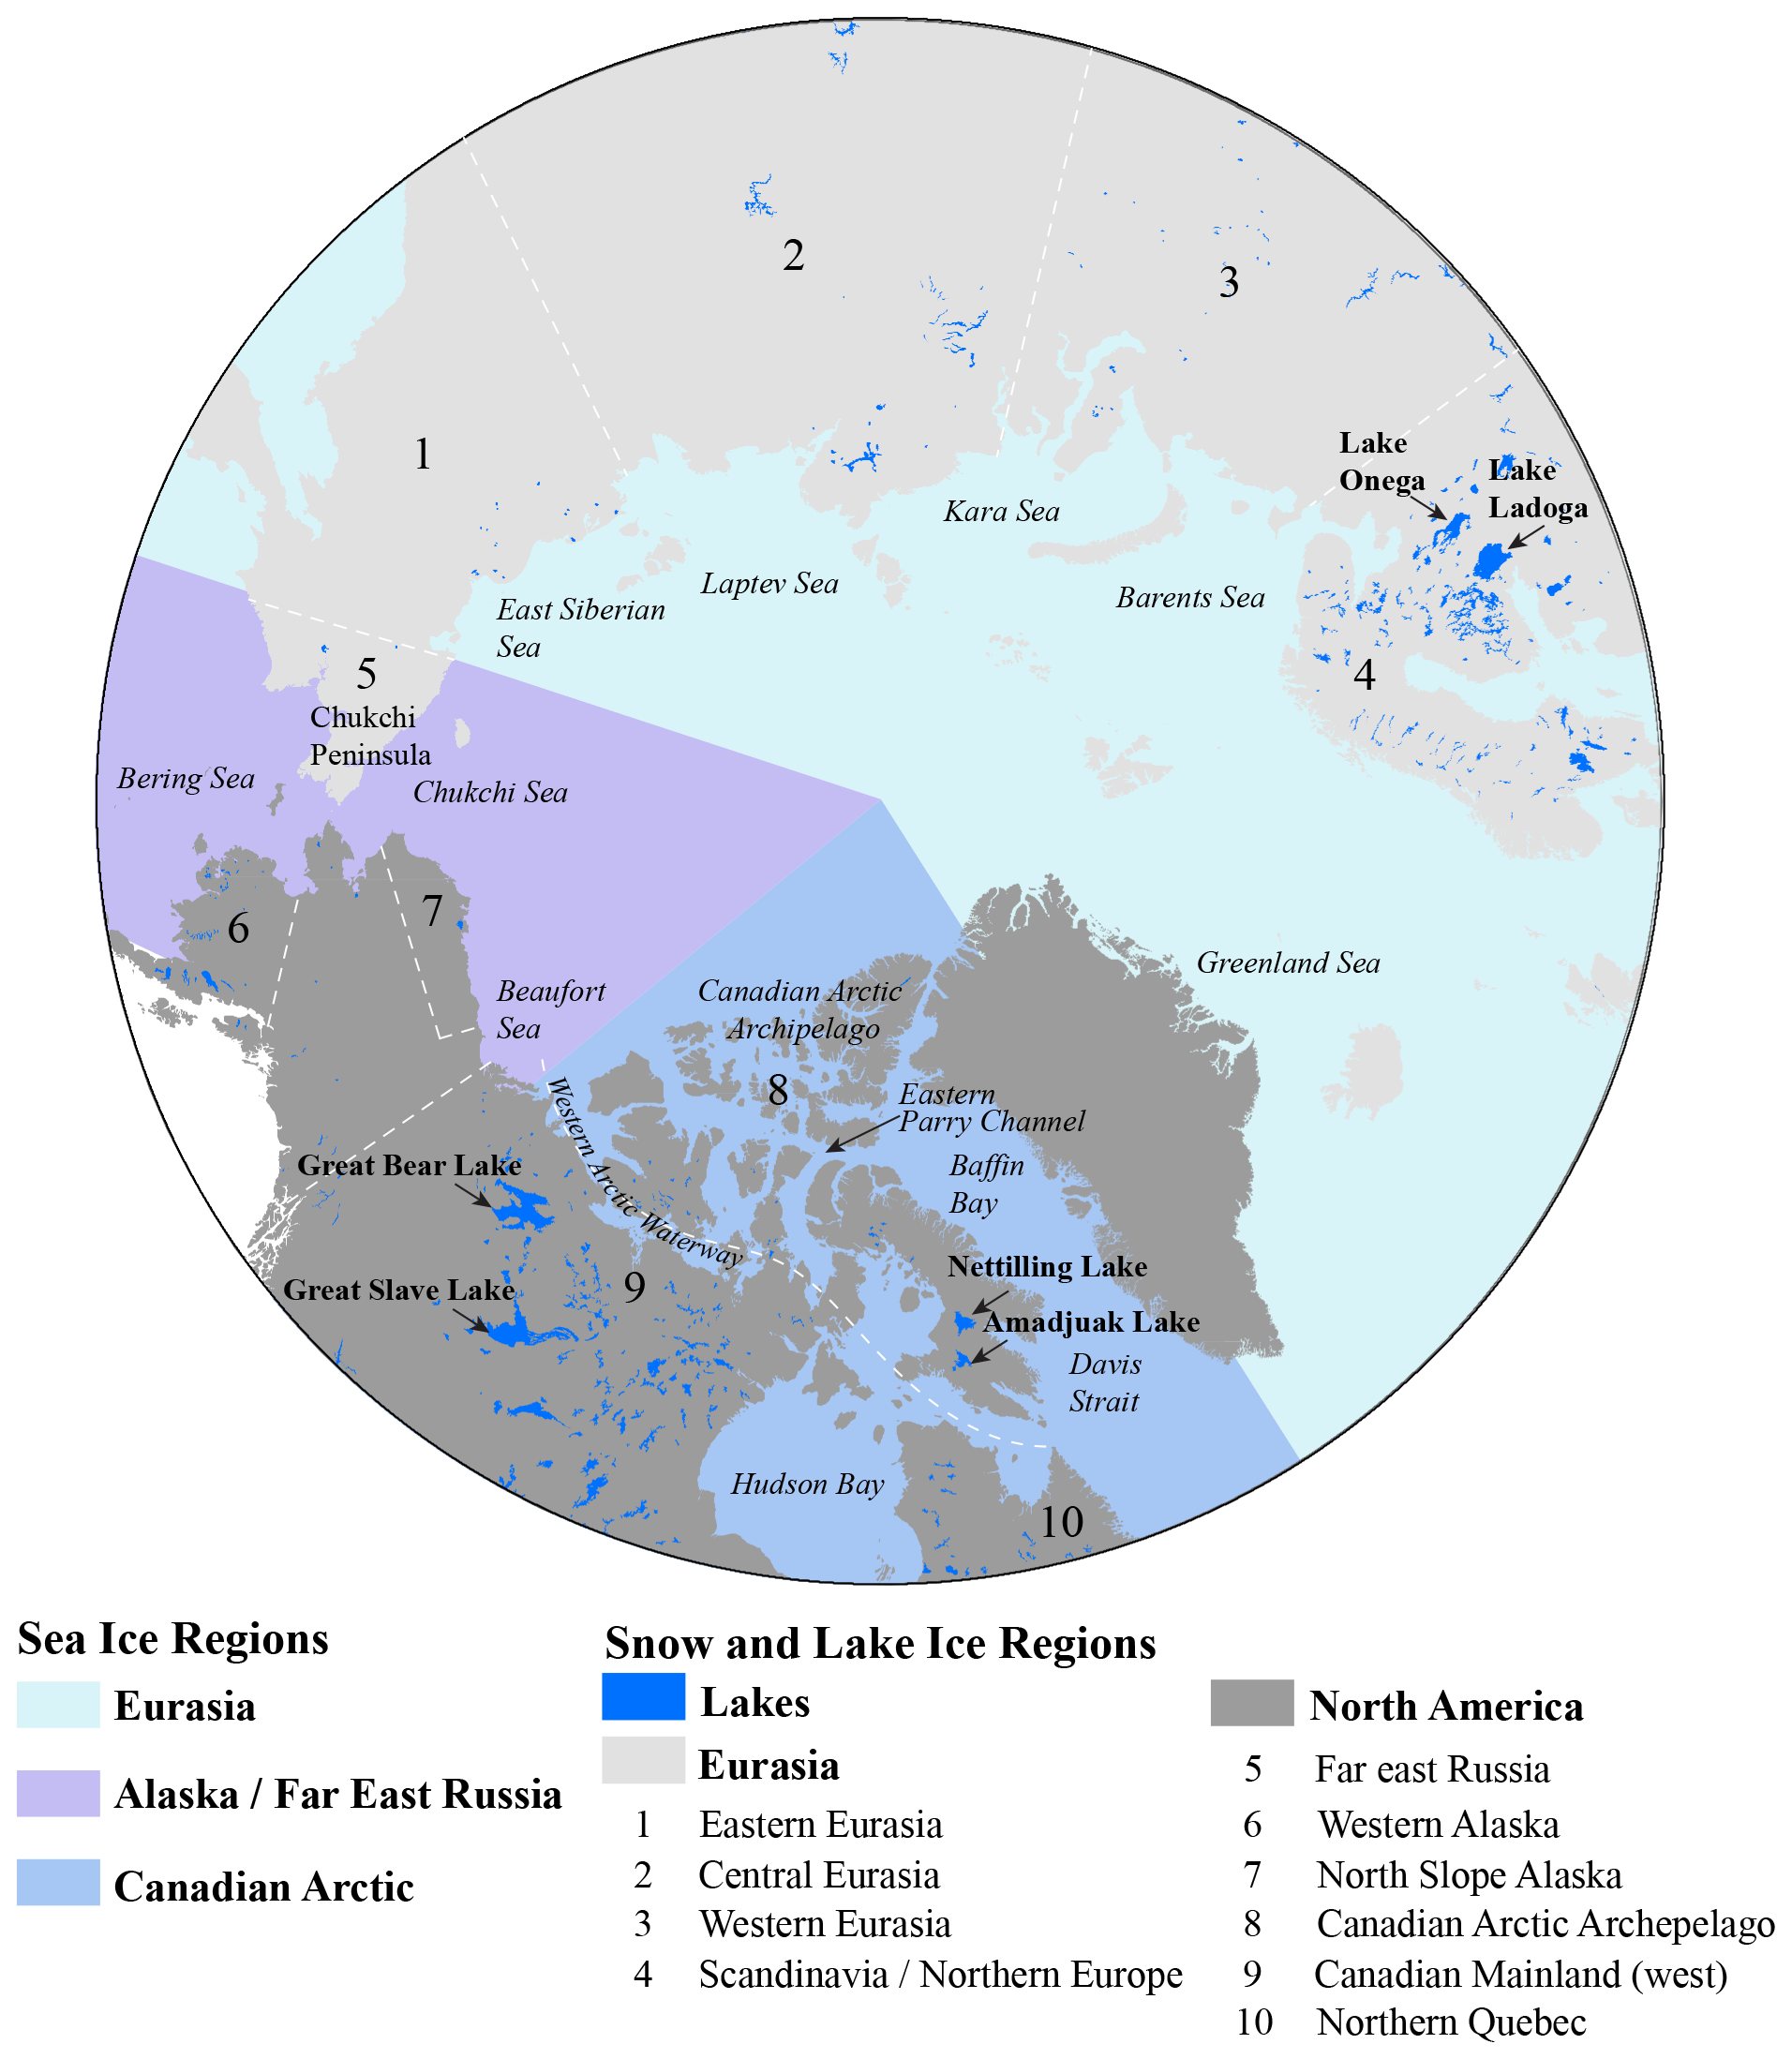
Figure 1Map of the study area, including the main sea ice, snow and lake ice regions (coloured), and subregions (numbered) included in Table 3.
2.1 Study regions
In this study, regions north of 56∘ were considered when examining pan-Arctic snow and ice phenology (Fig. 1) to include much of the southern limits of the sea ice in the Bering Strait and large Arctic lakes that can be resolved using IMS. For the second section of the results, a regional approach was taken. For snow and lake ice, phenology parameters were considered on a hemispheric scale (i.e. North America and Eurasia). Further regional subdivisions are provided in Table 3 for the snow and lake ice trends. For sea ice, phenology parameters were examined in three broad regions (with some subregions included in Table 3): Canadian Arctic, Alaska/Far East Russia, and Eurasian Arctic. “Canadian Arctic” includes Baffin Bay, Hudson Bay, and the CAA; “Alaska/Far East Russia” includes the Beaufort, Chukchi, and Bering seas; “Eurasian Arctic” includes the East Siberian, Laptev, Kara, Barents, and Greenland seas. These regions were grouped based on similar trends in phenology parameters and differences in climate and weather characteristics at the hemispheric scale.
2.2 Data
Snow and ice data were obtained from the Interactive Multisensor Snow and Ice Mapping System archived at the National Snow and Ice Data Center (2004–present, https://nsidc.org/data/G02156/versions/1, last access: 4 October 2021) as well as from the National Ice Center (2014–present, https://usicecenter.gov/Products/ImsHome, last access: 4 October 2021) (U.S. National Ice Center, 2008). IMS is an operational product used to map daily snow and ice cover over the Northern Hemisphere at 1 km (2014–present; not used in this study due to the limited time series), 4 km (2004–present), and 24 km (1997–present) spatial resolutions. Analysts use a variety of multi-sourced datasets (for a complete list of data sources, see the National Snow and Ice Data Center, https://nsidc.org/data/g02156, last access: 4 October 2021) to subjectively produce maps with discrete values assigned to land, snow-covered land, water, and ice. Snow mapping primarily relies on visible imagery; however, if visible imagery is unavailable due to cloud occlusion or low solar illumination, microwave data are used instead (Helfrich et al., 2007; Brown et al., 2010). As misidentification errors associated with microwave data can occur, analysts rely more on snow climatology compared to microwave data to estimate high-latitude snow cover during winter months (Chang et al., 1996; Foster et al., 2005; Helfrich et al., 2007; Derksen, 2008; Brown et al., 2010). Ice cover analysis primarily relies on Advanced Very High Resolution Radiometer (AVHRR) or Moderate Resolution Imaging Spectroradiometer (MODIS) observations; however, microwave-based retrievals and ice climatology are used when visible imagery is unavailable, with microwave retrievals representing approximately 30 %–35 % of the ice cover input (Helfrich et al., 2007). IMS has been shown to outperform data from traditional passive microwave products (AMSR-E, SSM/I, SSMI-SSMIS) for both the timing and extent of first open water in the Arctic (Brown et al., 2014). For example, through the Barrow Strait in the CAA, the ability of the 4 km IMS data to resolve narrow channels leads to 17 % more open water detected than with SSM/I and 35 % more open water than detected with AMSR-E, validated with RADARSAT-1 (Brown et al., 2014). Overall, most pixels compared between IMS and the two passive microwave datasets for first-open-water dates were within ±5 d, with a greater percentage of the pixels in the categories beyond the ±5 d identifying open water earlier with IMS than the other products (Brown et al., 2014). IMS has been shown to map higher snow cover fractions during the spring melt period than other snow products (Brown et al., 2010; Frei and Lee, 2010) but is reported to have mostly between 80 %–90 % agreement with other snow products during the winter season of non-arctic North America, with better agreement in the later part of the winter season when deeper and more extensive snow cover is present (Chen et al., 2012). For lake ice, the 4 km IMS product occasionally identifies earlier lake ice-on dates in regions of prolonged cloud cover (e.g. northern Quebec, Canada), though both ice-on and ice-off timing detected using IMS are significantly correlated with, and comparable to, phenology dates extracted from the MODIS snow cover product (Brown and Duguay, 2012).
Temperature data (2 m) are from the European Centre for Medium-Range Weather Forecasts (ECMWF) ERA5 global reanalysis (Copernicus Climate Change Service, 2017, https://doi.org/10.24381/cds.f17050d7; Hersbach et al., 2020) and were compared to changes in snow and ice phenology. ERA5 provides coverage of the entire Arctic at a spatial resolution of approximately 31 km (0.25∘). Monthly temperature data were used to calculate temperature trends from 2004–2019. Temperature data near the surface (1000 mbar) were reported to have a 0.89 K difference from radiosonde observations, and the ensemble spread is quite low at ∼0.4 K or less, from 1979–2018, which can be used as an indicator of uncertainty (Hersbach et al., 2020). Compared to radiosonde temperature profiles in the Fram Strait, ERA5 had the smallest bias (≤0.3∘) and RMSE (≤1.0∘) and the highest correlation coefficients (≥0.96) over four other reanalysis datasets tested (ERA-Interim, JRA-55, MERRA-2, CFSv2) (Graham et al., 2019). The 2 m air temperature in ERA5 has improved fit to observations in the Arctic compared to its predecessor ERA-Interim (Hersbach et al., 2020), though Wang et al. (2019) show ERA5 has a warm bias over sea ice compared to observation data from buoys. The identified warm bias is stronger in the cold season, particularly when the 2 m air temperature is below −25 ∘C (daily mean value of 5.4 ∘C); however, monthly mean differences between ERA5 and buoys are ∼2 ∘C or less through all months other than March, April, and May (Wang et al., 2019). Regionally, ERA5 performs best in the Central Arctic, followed by the Pacific Sector; the Atlantic sector shows good agreement only while the 2 m temperatures are above −25 ∘C (Wang et al., 2019). We acknowledge that some small potentially spurious regions of opposite trend directions appear in some months of the temperature trend maps (e.g. February: eastern Siberia; March and October: Arctic Ocean); however, these data are not used in a quantitative comparison and therefore do not affect the overall discussion.
Downwelling longwave radiation has been linked to melt onset in the Arctic Ocean (e.g. Mortin et al., 2016). To further explore the linkages in the phenology data, downwelling longwave radiation data from the Extended AVHRR Polar Pathfinder (APP-x) were obtained from the NOAA National Centers for Environmental Information (https://www.ncei.noaa.gov/data/avhrr-polar-pathfinder-extended/access/, last access: 4 October 2021) (Key et al., 2019). APP-x data are provided as 25 km EASE grid projection, processed for 04:00 and 14:00 LST. Due to large areas of missing data between ∼59–64∘ N, the mean monthly values were created from the 04:00 and 14:00 separately to avoid averaging errors where data exist for one time and not the other (to avoid skewing the average with the diurnal differences). Some artificial patterns are evident in the data (e.g. March, Fig. 9c, near the pole); however, for the purpose of regional comparisons this is not limiting as this region is not used in quantitative comparisons. Downwelling longwave radiation at the surface (LW↓) is calculated using a neural network to simulate a radiative model (see Key and Schweiger, 1998; Key et al., 2016). LW↓ was selected from APP-x rather than ERA5 as the APP-x dataset has been determined as climate data record quality and has been validated against in situ data with a bias of only 2.1 W m−2 and RMSE of 22.4 W m−2 (with the higher RMSE values attributed to differences in surface snowfall between the sampling site and the 25 km×25 km area represented) (Key et al., 2016).
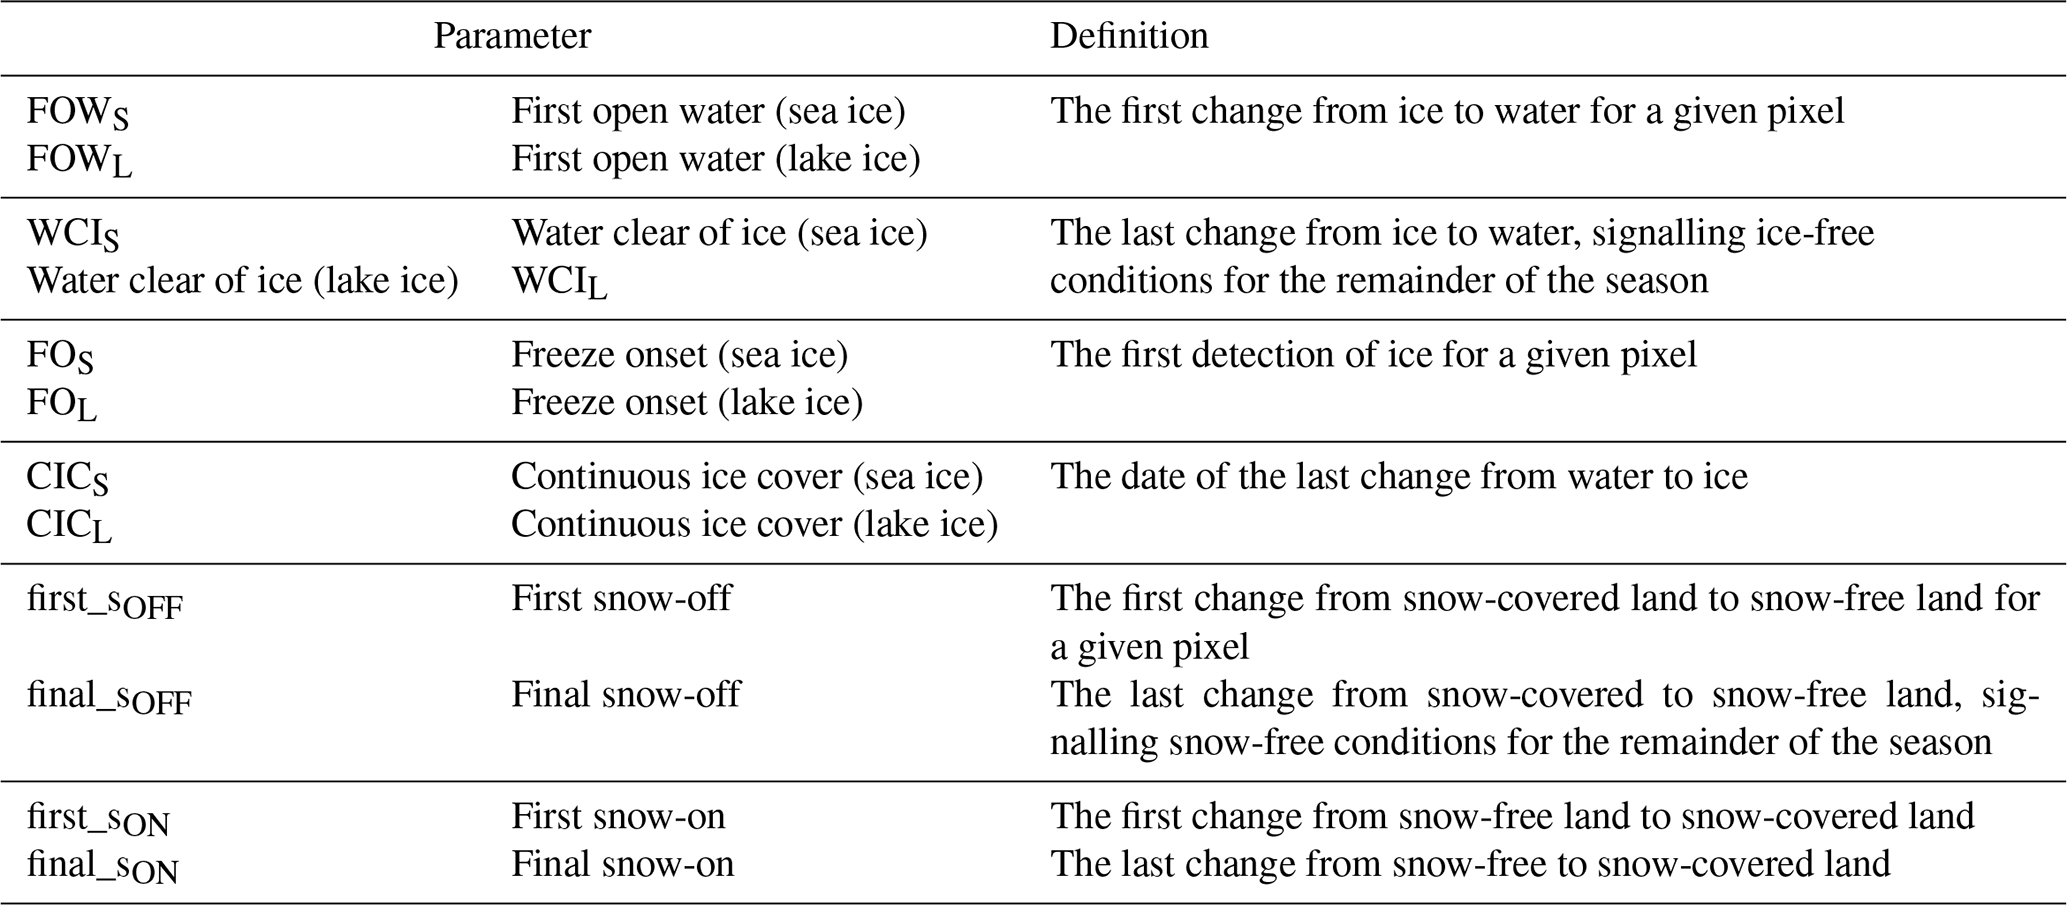
Table 1Sea ice, lake ice, and snow phenology parameters and definitions in this study.
2.3 Methodology
The 24 and 4 km IMS products were used to examine changes in snow and ice phenology dates across the pan-Arctic following the methodology of Brown et al. (2014) and Dauginis and Brown (2020). For each pixel, consecutive days of IMS imagery were compared to determine the first and last changes between snow/ice and land/water to determine the timing of the snow/ice-on and off parameters examined. The phenology parameters used in this study and their definitions can be found in Table 1. Only the first and last change from ice and water and vice versa are tracked for this work, giving first and final dates of change. In sea ice regions dominated by thermodynamics, there is little difference between first and final timing, whereas in more active ice regions there could be a more notable difference between the first and final timings as the ice moves past that pixel. Most lakes are dominated by thermodynamics and return similar first and final dates; however, lakes with more ice motion (e.g. Lake Onega and Ladoga) may show a difference in their timings. For snow, warmer regions where more frequent snowmelt occurs tend to show a larger variation in first and final dates compared to the northern regions where the snow typically remains on the ground for the season. Open-water duration and snow-free duration are defined as the time between the final change in the spring to the first change in the fall (WCIS to FOS, and last_sOFF to first_sON). The 24 km IMS product was used to examine trends in mean snow and sea ice phenology dates across the pan-Arctic from 1997–2019. For lake ice, only the 4 km IMS product (2004–2019) was used since the 24 km product can only detect very large lakes (Fig. 2). In addition to detecting more lakes, the 4 km IMS product can also provide more detailed information on lake ice phenology within each lake, as shown in Fig. 2.
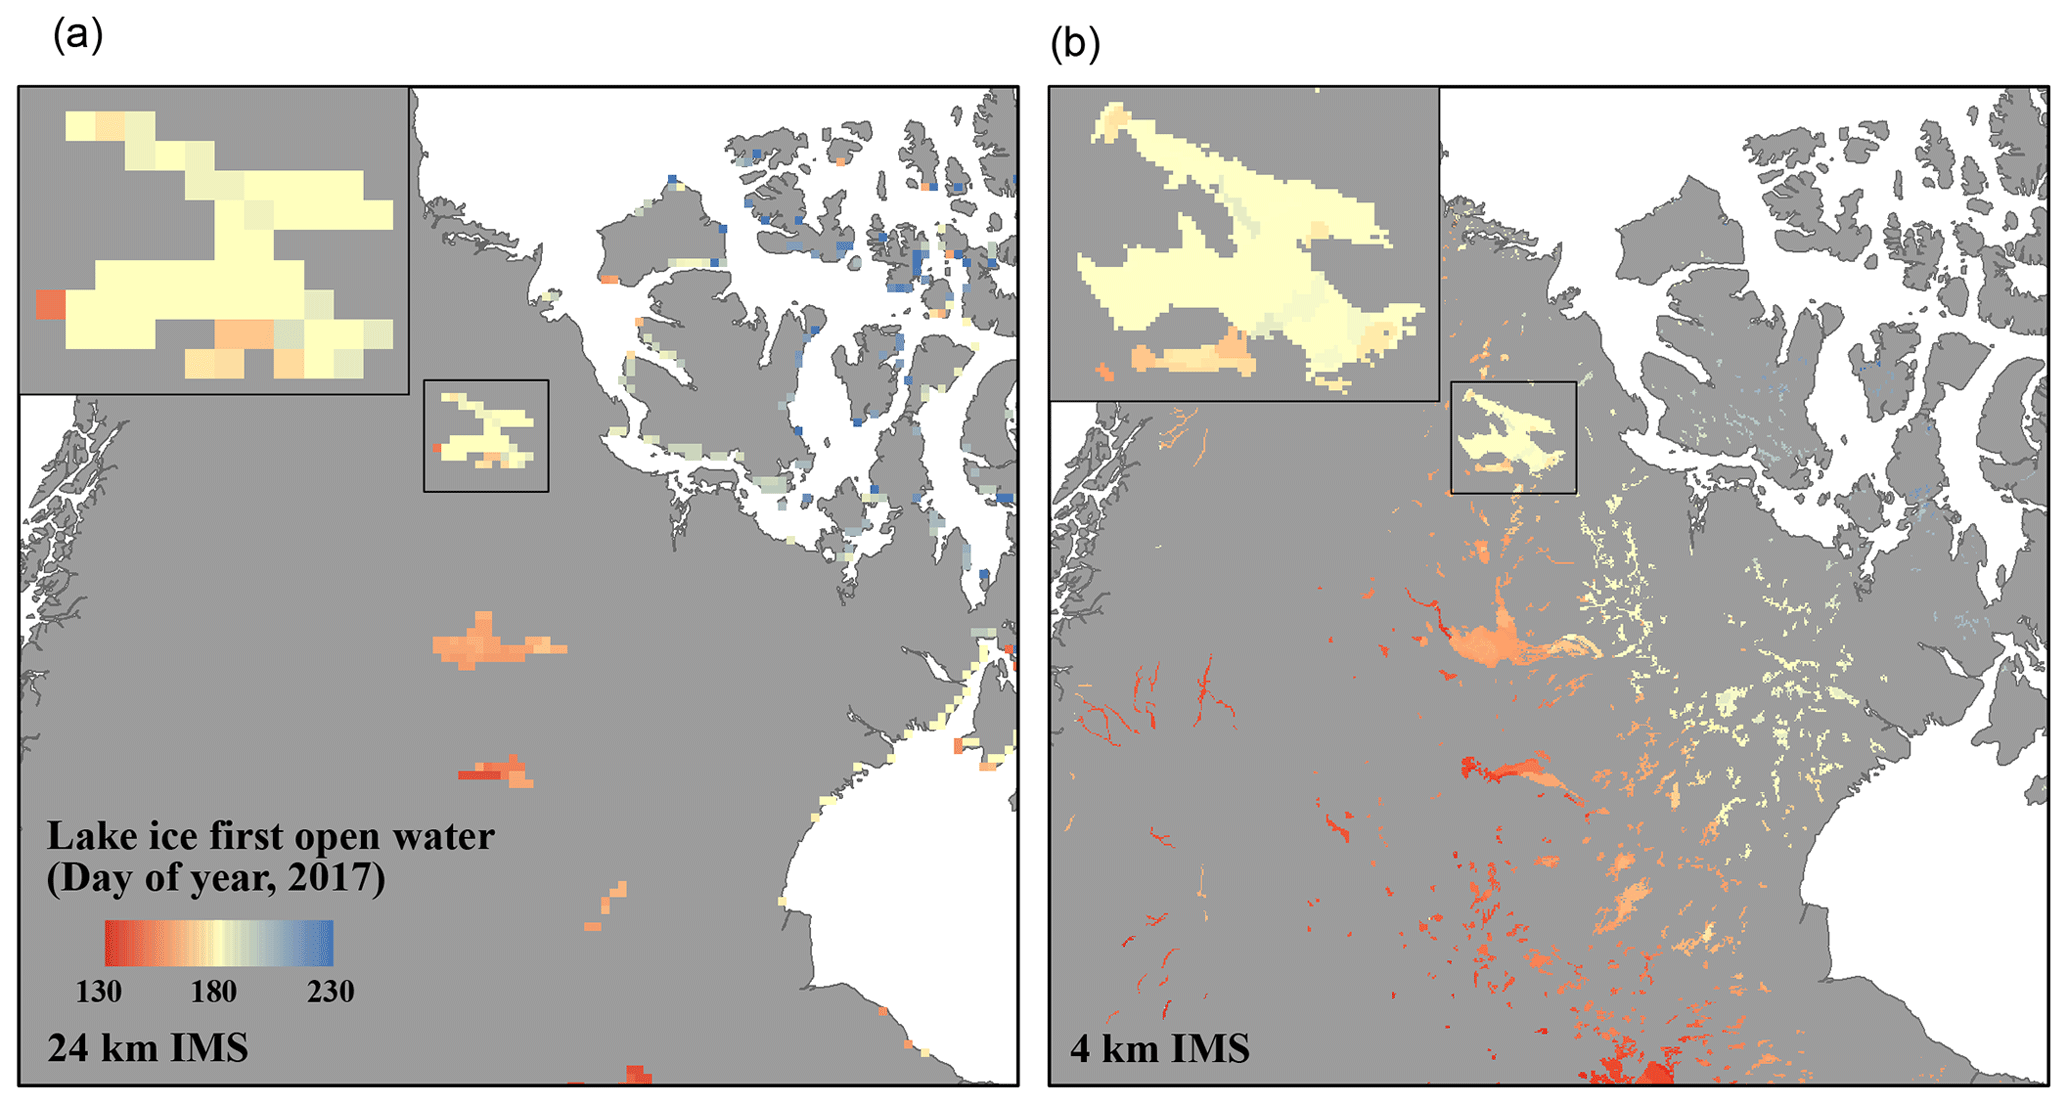
Figure 2Comparison of 24 km (a) and 4 km (b) lake ice first open water in 2017.
To investigate the relationship between phenology parameters and temperature, and phenology parameters and LW↓ (two important drivers of phenology in the arctic), regional correlations between variables were examined using Spearman's rank correlation coefficient (ρ) as this method describes the overall strength of the relationship between two variables and does not require data to follow independent normal distributions (non-parametric) (Hauke and Kossowski, 2011). All data were projected to match the IMS data, and the centre point of all grid cells within each specific region was used for the analysis. Datasets were detrended prior to correlation analysis to ensure relationships were not a result of a shared trend but rather driven by actual relationships between variability in phenology parameters and temperature (Pizzolato et al., 2014). Data were detrended using the pracma package in R (https://CRAN.R-project.org/package=pracma, last access: 4 October 2021), which removes the linear trend from a given dataset by computing the least-squares fit of a straight line to the data and subtracting the resulting function from the data (Borchers, 2019). The detrended data were then used to calculate Spearman correlation coefficients between phenology parameters and temperature.
To evaluate spatial trends in snow and ice phenology, 4 km IMS phenology dates, 2 m air temperature data, and LW↓ were analyzed using the Zhang method of trend analysis, available in the zyp package in R (Bronaugh and Werner, 2019). This method of trend analysis was proposed by Zhang et al. (2000) and has been successfully used to represent trends in temperature and precipitation (Zhang et al., 2000), lake ice phenology (Murfitt and Brown, 2017), and sea ice and snow phenology (Dauginis and Brown, 2020. The Zhang method is suitable for analyzing spatial trends in this study as it employs non-parametric tests and accounts for autocorrelation. The linear trend is removed from the time series if it is significant, and the autocorrelation computation repeats until the differences in the estimates of the slope and autoregressive model in two consecutive iterations are smaller than 1 % (Bronaugh and Werner, 2019). The Mann–Kendall test is applied to the resulting time series and the Sen slope of the trend is computed (Bronaugh and Werner, 2019). The final result is the Sen slope (amount of increase or decrease) at each location over the given time period, as well as the significance of each trend (Bronaugh and Werner, 2019). Interannual and regional variability in snow and ice conditions will inherently affect phenology parameters, particularly for sea ice, which may not entirely clear out of some regions in a particular season, leading to no ice-off or ice-on phenology detected for that year (Dauginis and Brown, 2020). Pixels with less than 14 years of phenology data (e.g. regions where ice-off only occurs occasionally) are treated as No Data, meaning the spatial extent of the trend examination represents the geographic region where snow/ice-off has occurred in at least 14 of the last 16 years.
Finally, clustering in the trend data was explored using local indicators of spatial association (Anselin, 1995) through Esri ArcGIS. Clusters of spatially statistically significant trends of high and low trend strengths were mapped. Clusters crossing the shorelines indicate significantly clustered trends between the sea ice and snow or lake ice phenology parameters and show regions of interest where the phenology variables were responding with similar trend strength over the study period.
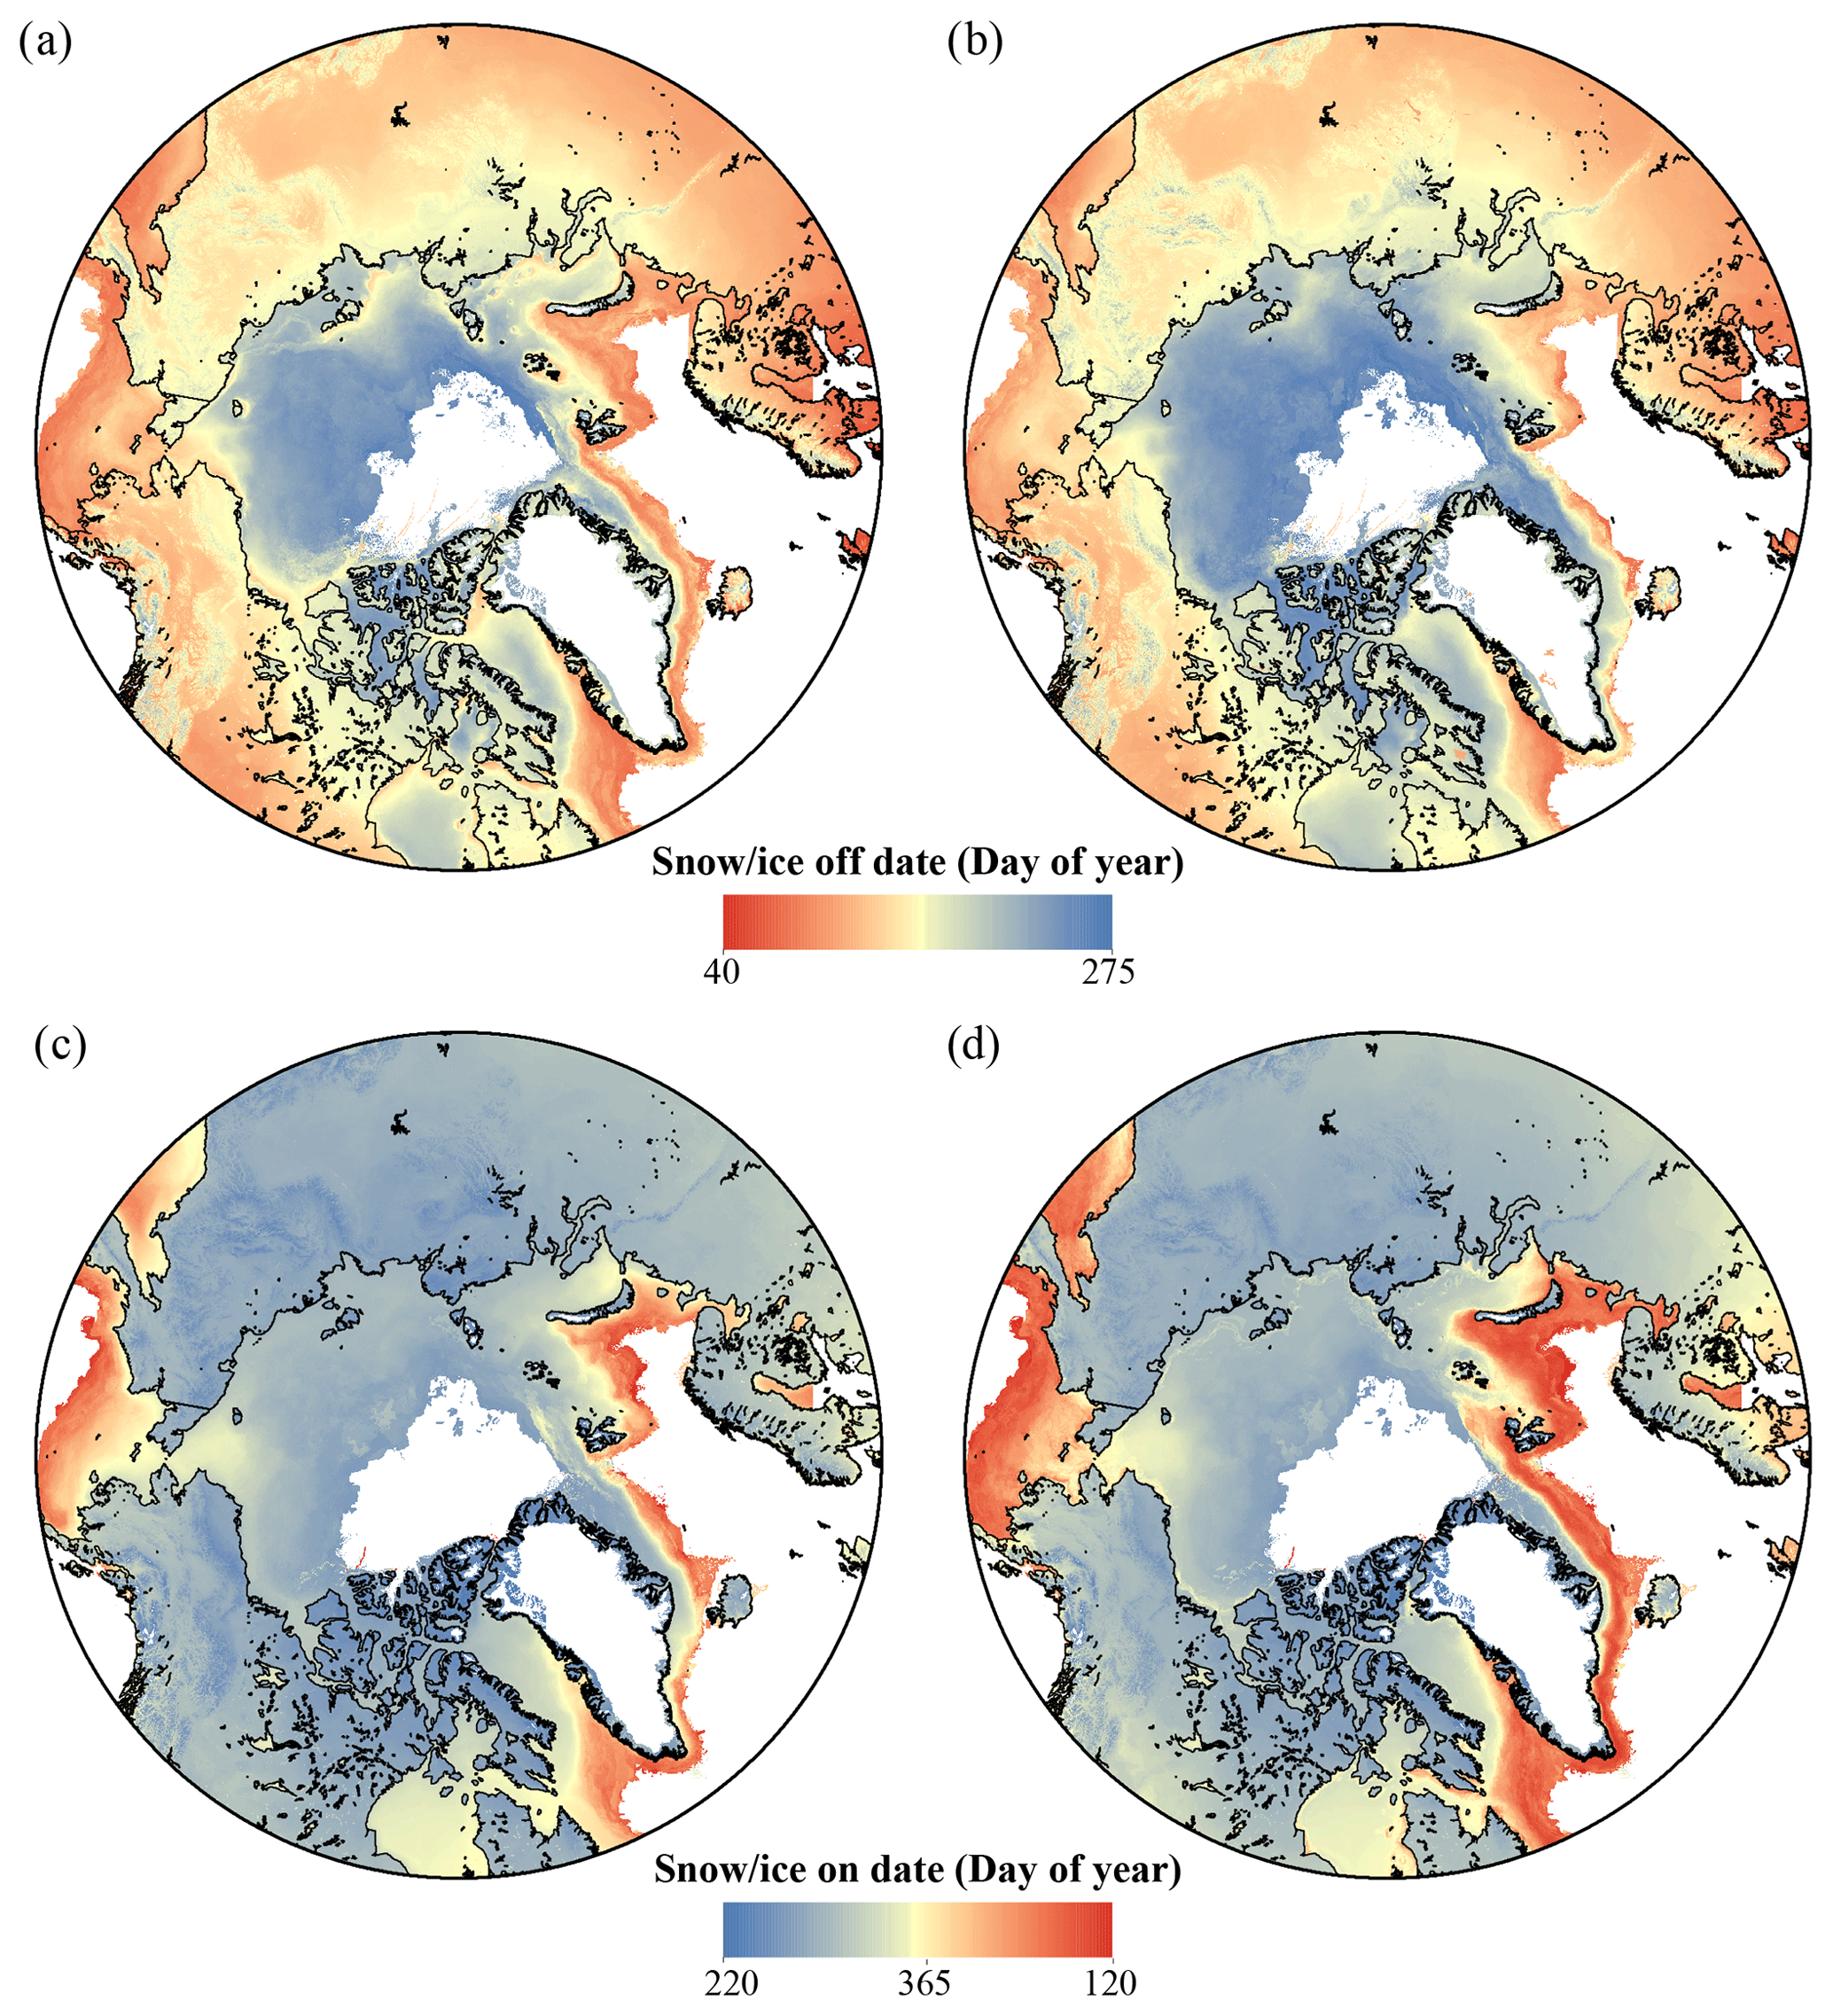
Figure 3Mean 4 km IMS (2004–2019) (a) sea ice first open water (FOWS), first snow-off (first_sOFF), and lake ice first open water (FOWL); (b) sea ice water clear of ice (WCIS), final snow-off (final_sOFF), and lake ice water clear of ice (WCIL); (c) sea ice freeze onset (FOS), first snow-on (first_sON), and lake ice freeze onset (FOL); and (d) sea ice continuous ice cover (CICS), final snow-on (final_sON), and lake ice continuous ice cover (CICL). White regions indicate where either no snow/ice forms or snow/ice remains all year in 14 or more years of the dataset.
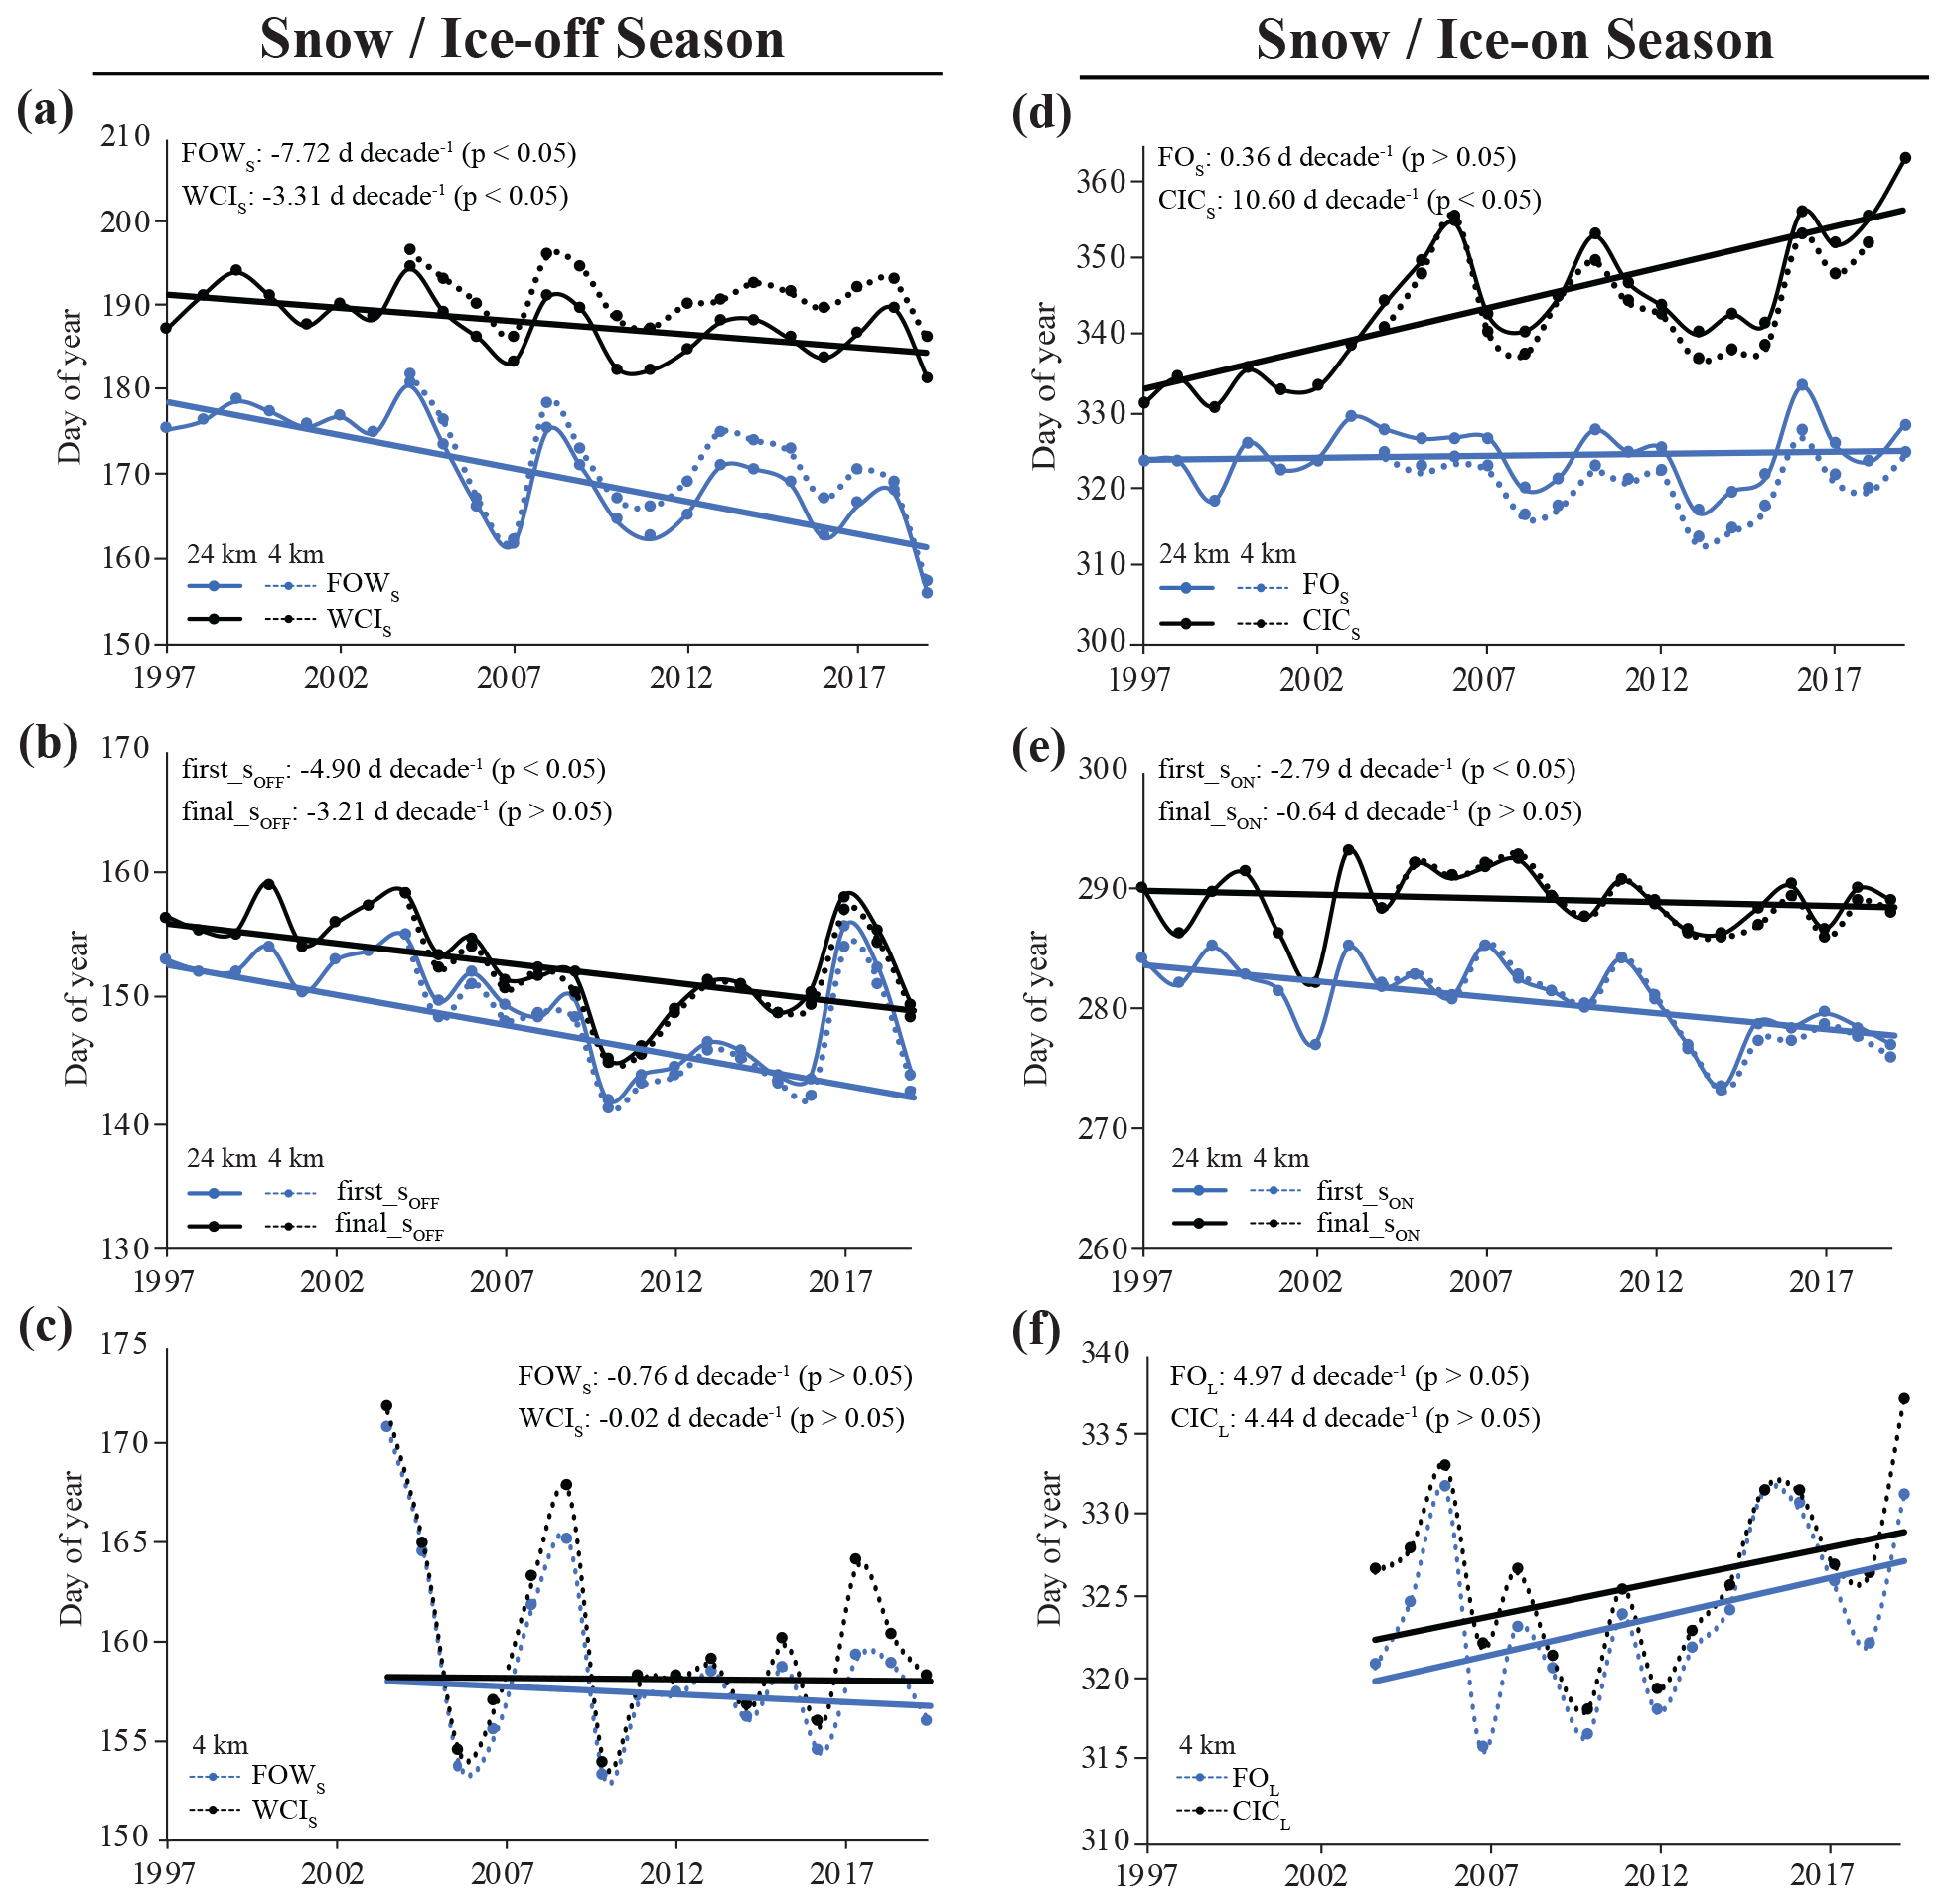
Figure 4Mean 24 km (1997–2019) and 4 km (2004–2019) (a) IMS sea ice first open water (FOWS) and water clear of ice (WCIS), (b) first snow-off (first_sOFF) and final snow-off (final_sOFF), (c) lake ice first open water (FOWL) and water clear of ice (WCIL), (d) sea ice freeze onset (FOS) and continuous ice cover (CICS), (e) first snow-on (first_sON) and final snow-on (final_sON), and (f) lake ice freeze onset (FOL) and continuous ice cover (CICL). Sen's slope and significance are indicated for each phenology parameter using the 24 km IMS product. Note that for lake ice, only the 4 km IMS product was used in this study.
3.1 Trends and correlations
Mean snow, sea ice, and lake ice phenology dates across the pan-Arctic are shown in Fig. 3 (4 km IMS, 2004–2019). Mean snow, sea ice, and lake ice phenology trends for the 24 km (1997–2019) and 4 km (2004–2019) IMS products are shown in Fig. 4. Overall, the pan-Arctic shows trends toward a longer snow-free and ice-free season (Fig. 4) from 1997–2019, with trends toward earlier snow-off and ice-off and later freeze detected. While the annual variability is similar between the 24 and 4 km mean phenology dates, a difference of 3.5 d later for ice-off and 3.4 d earlier for ice-on (average) is evident in the sea ice phenology as a result of the resolution differences, mainly attributed to the improved ability of the 4 km product to resolve smaller-scale features and changes in the ice cover extent than the 24 km product can detect (e.g. leads, polynyas, nearshore conditions, and changes at the ice edges) (Brown et al., 2014; Dauginis and Brown, 2020). The overall agreement between the products is <1 d for the snow phenology dates.
Sea ice open-water dates both show significant negative (earlier) trends (Fig. 4a), with a larger negative trend detected for first open water (FOWS, −7.72 d per decade, p<0.05) compared to water clear of ice (WCIS, −3.31 d per decade, p<0.05). Snow-off dates show similar trends to ice-off parameters, with both first snow-off (first_sOFF, −4.90 d per decade, p<0.05) and final snow-off (final_sOFF, −3.21 d per decade, p>0.05) becoming earlier (Fig. 4b). Trends for lake ice first-open-water and water-clear-of-ice dates from 2004–2019 are negative (−0.76 and −0.02 d per decade, p>0.05), though neither are statistically significant. We acknowledge that the 16-year time series (Fig. 4c) does not provide a comparative time span to the other trends examined; however, it should be noted that the direction of the trends is negative (earlier) and therefore follows a similar pattern observed in snow and sea ice trends during the 1997–2019 melt season.
Sea ice freeze onset (FOS) shows a slightly positive (later) trend (0.36 d per decade, p>0.05), while the continuous ice cover (CICS) trend is much larger and statistically significant (10.60 d per decade, p<0.05) (Fig. 4d). Both first and final snow-on (first_sON, final_sON) trends are negative, indicating that the pan-Arctic saw earlier snow onset over the 1997–2019 study period. First snow-on is becoming earlier by 2.79 d per decade (p<0.05), while final snow-on is becoming slightly earlier by 0.64 d per decade (p>0.05) (Fig. 4e). Lake ice freeze onset (FOL) and continuous ice cover (CICL) exhibit trends toward later freeze (4.97 and 4.44 d per decade, p>0.05; Fig. 4f), and although caution should be taken with the short time span, it should again be noted that lake ice freeze dates show an overall shift toward later freeze.
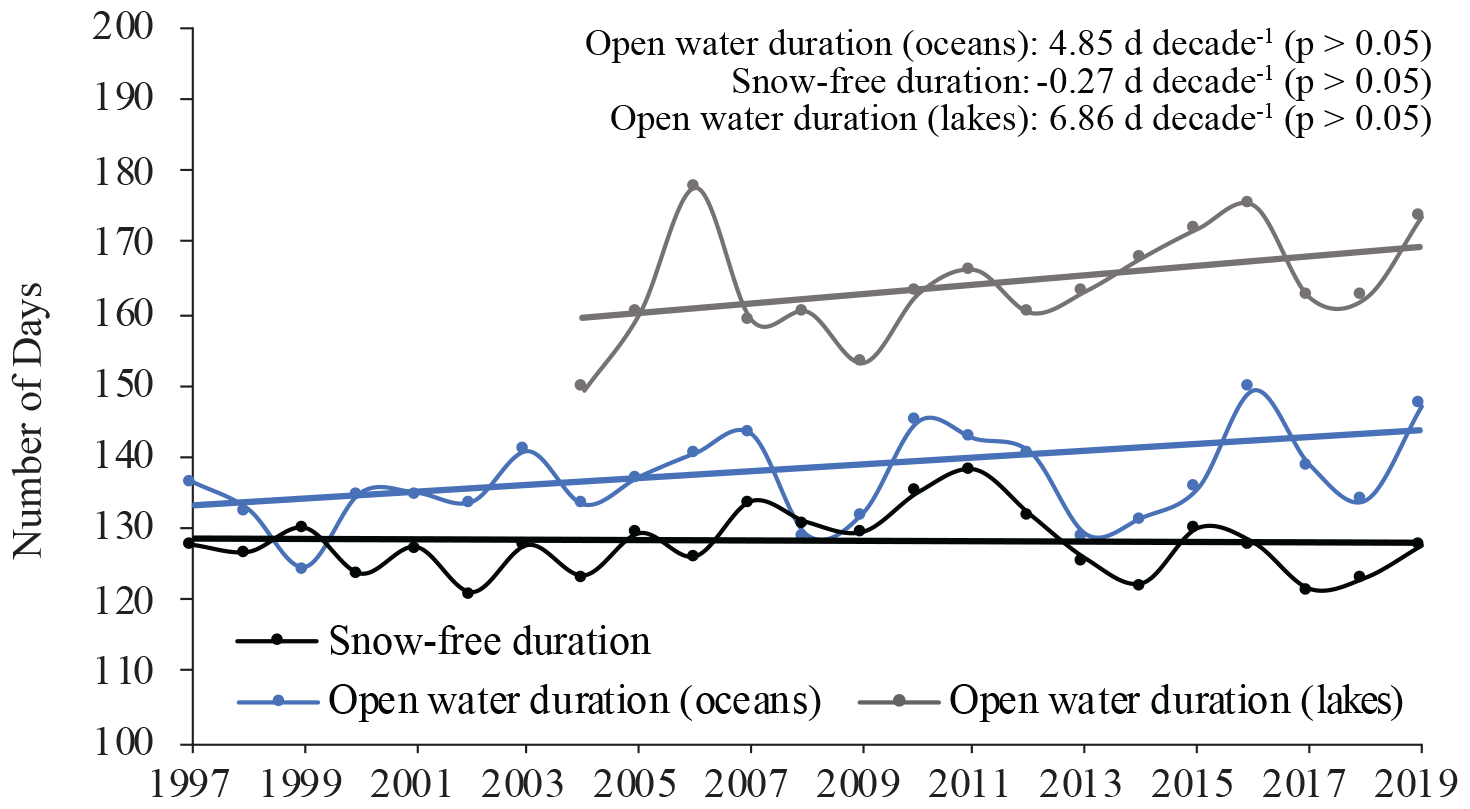
Figure 5Pan-Arctic open-water duration for oceans (1997–2019), snow-free duration (1997–2019) over land, and open-water duration for lakes (2004–2019). Sen's slope of the trend and significance are shown.
Overall, snow and ice cover are coming off earlier across the pan-Arctic, while trends during the freeze season vary for sea ice, lake ice, and snow. Earlier sea ice water-clear-of-ice dates contribute to longer open-water duration detected across the pan-Arctic (4.85 d per decade, p>0.05; Fig. 5). Non-significant trends are detected in lake ice parameters, with the resulting open-water duration in Arctic lakes increasing by 6.86 d per decade from 2004–2019 (p>0.05) (Fig. 5). Almost no trend in snow-free duration is identified (−0.27 d per decade, p>0.05; Fig. 5), despite first snow-off trending significantly earlier (Fig. 4b).
Table 2Pan-Arctic Spearman rank correlations (ρ) for snow and ice phenology dates using the 24 km (1997–2019) and 4 km (2004–2019) IMS products. An asterisk (*) represents statistically significant correlations at the 95 % confidence level.
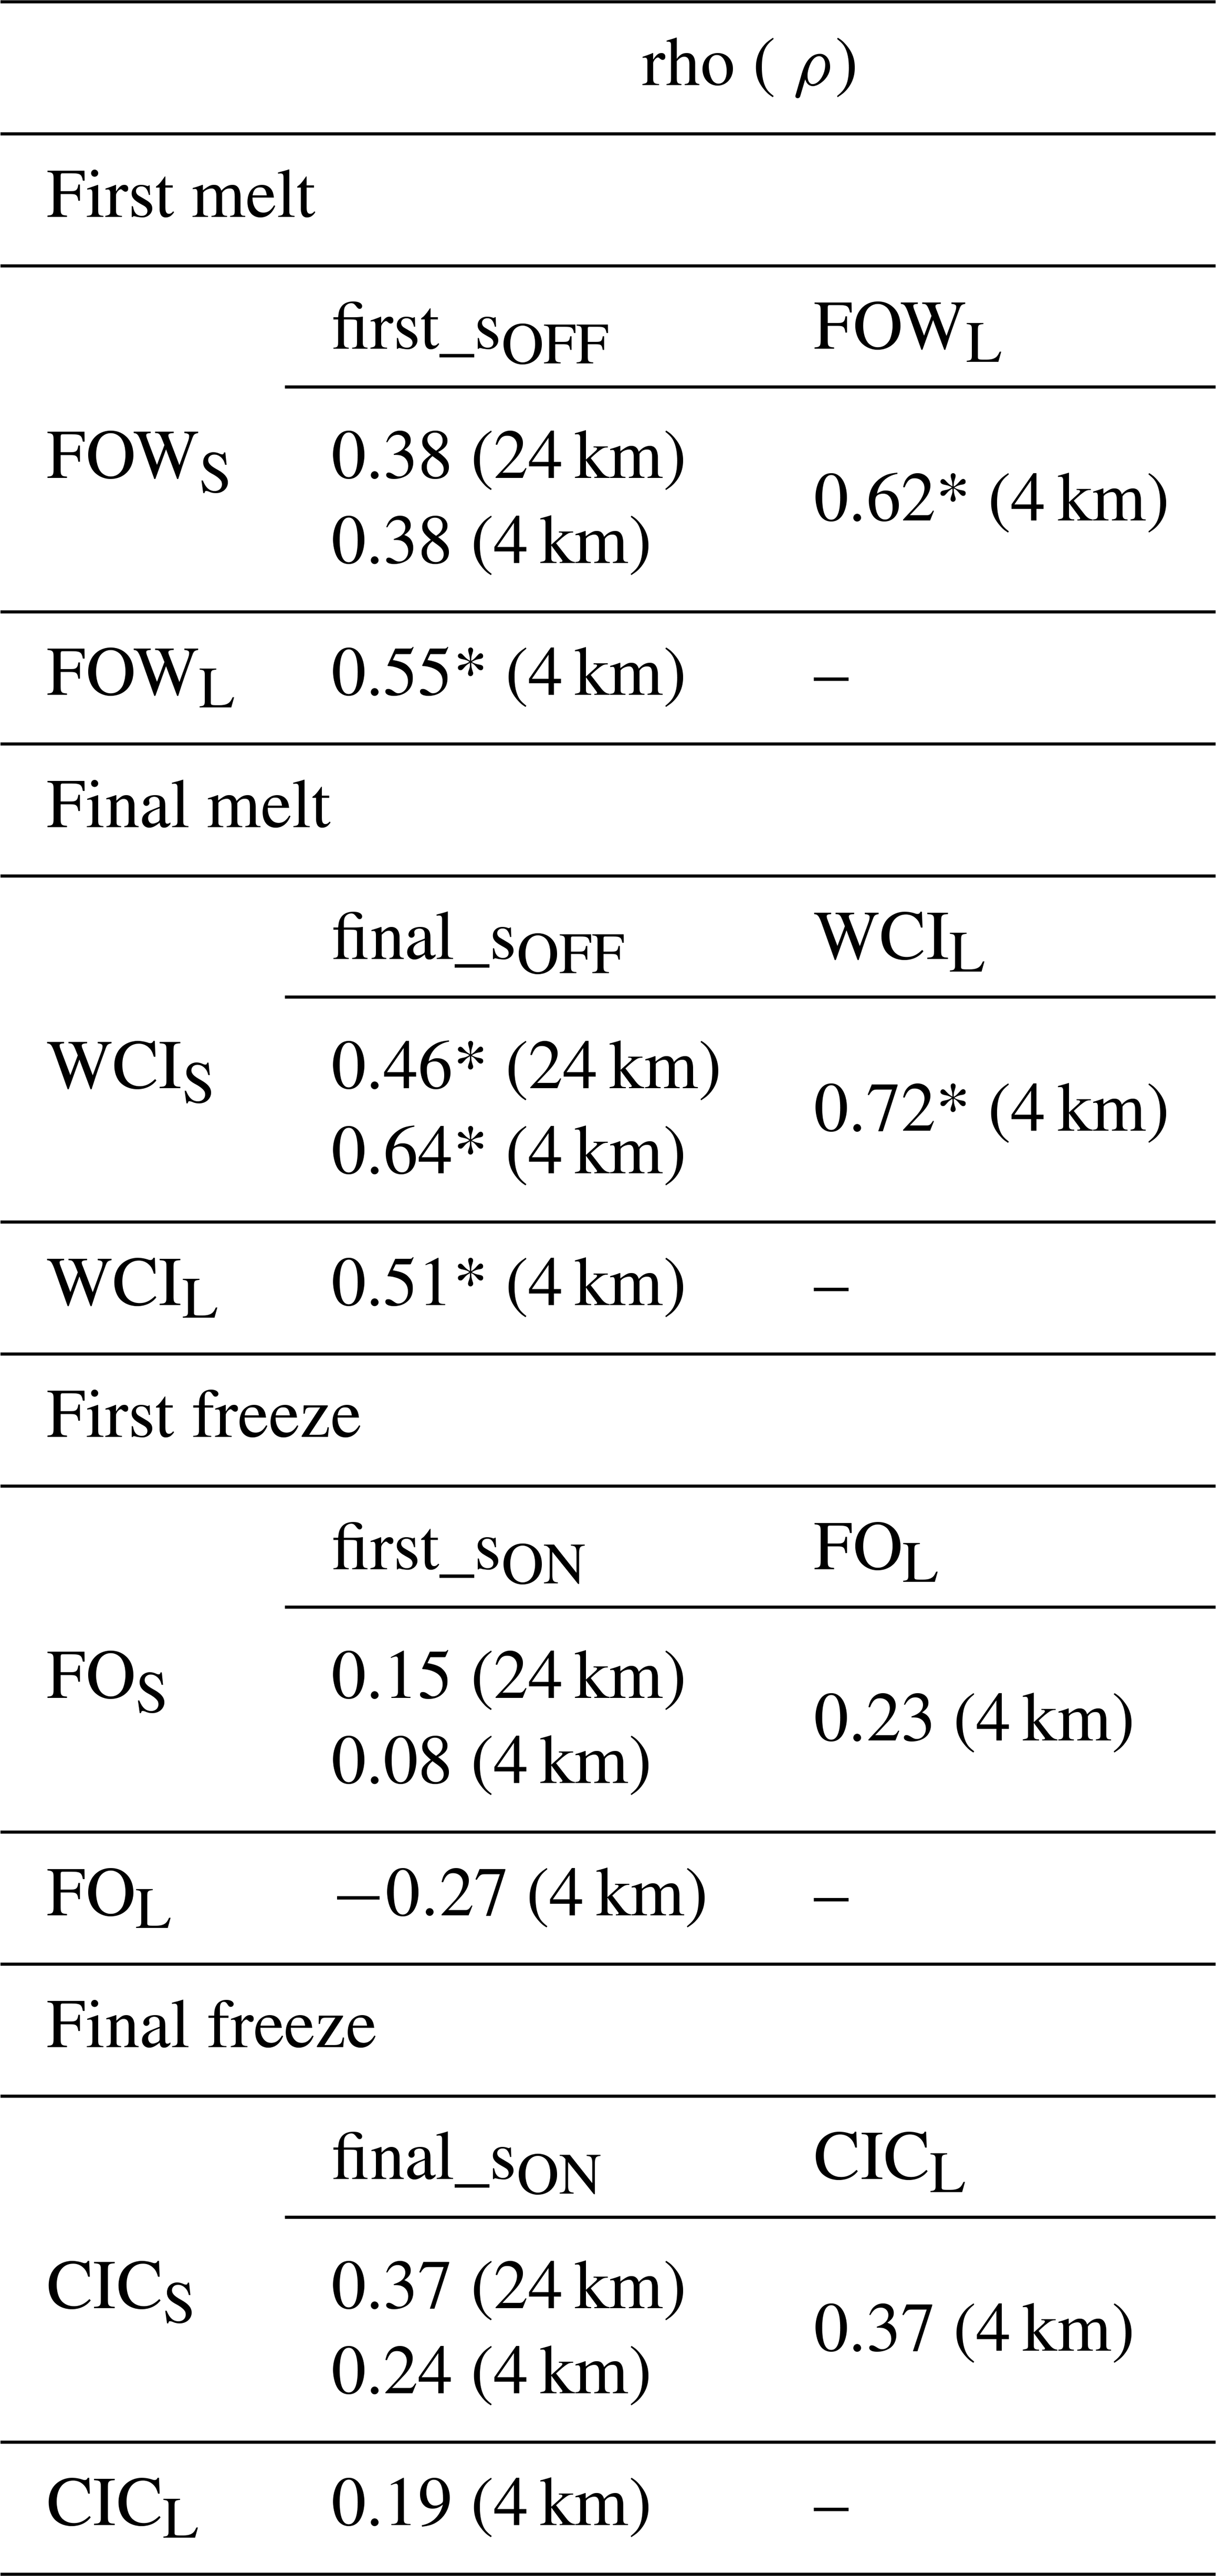
Table 3Regional analysis (see Fig. 1) of the median trend strength (days/16 years) and direction (− earlier, + later) for all of the phenology parameters: first open water (FOW, subscript S denotes sea ice, L denotes lake ice), water clear of ice (WCI, subscript S denotes sea ice, L denotes lake ice), freeze onset (FO, subscript S denotes sea ice, L denotes lake ice), complete ice cover (CIC, subscript S denotes sea ice, L denotes lake ice), first and final snow-off (_SOFF), and first and final snow-on (_SON).
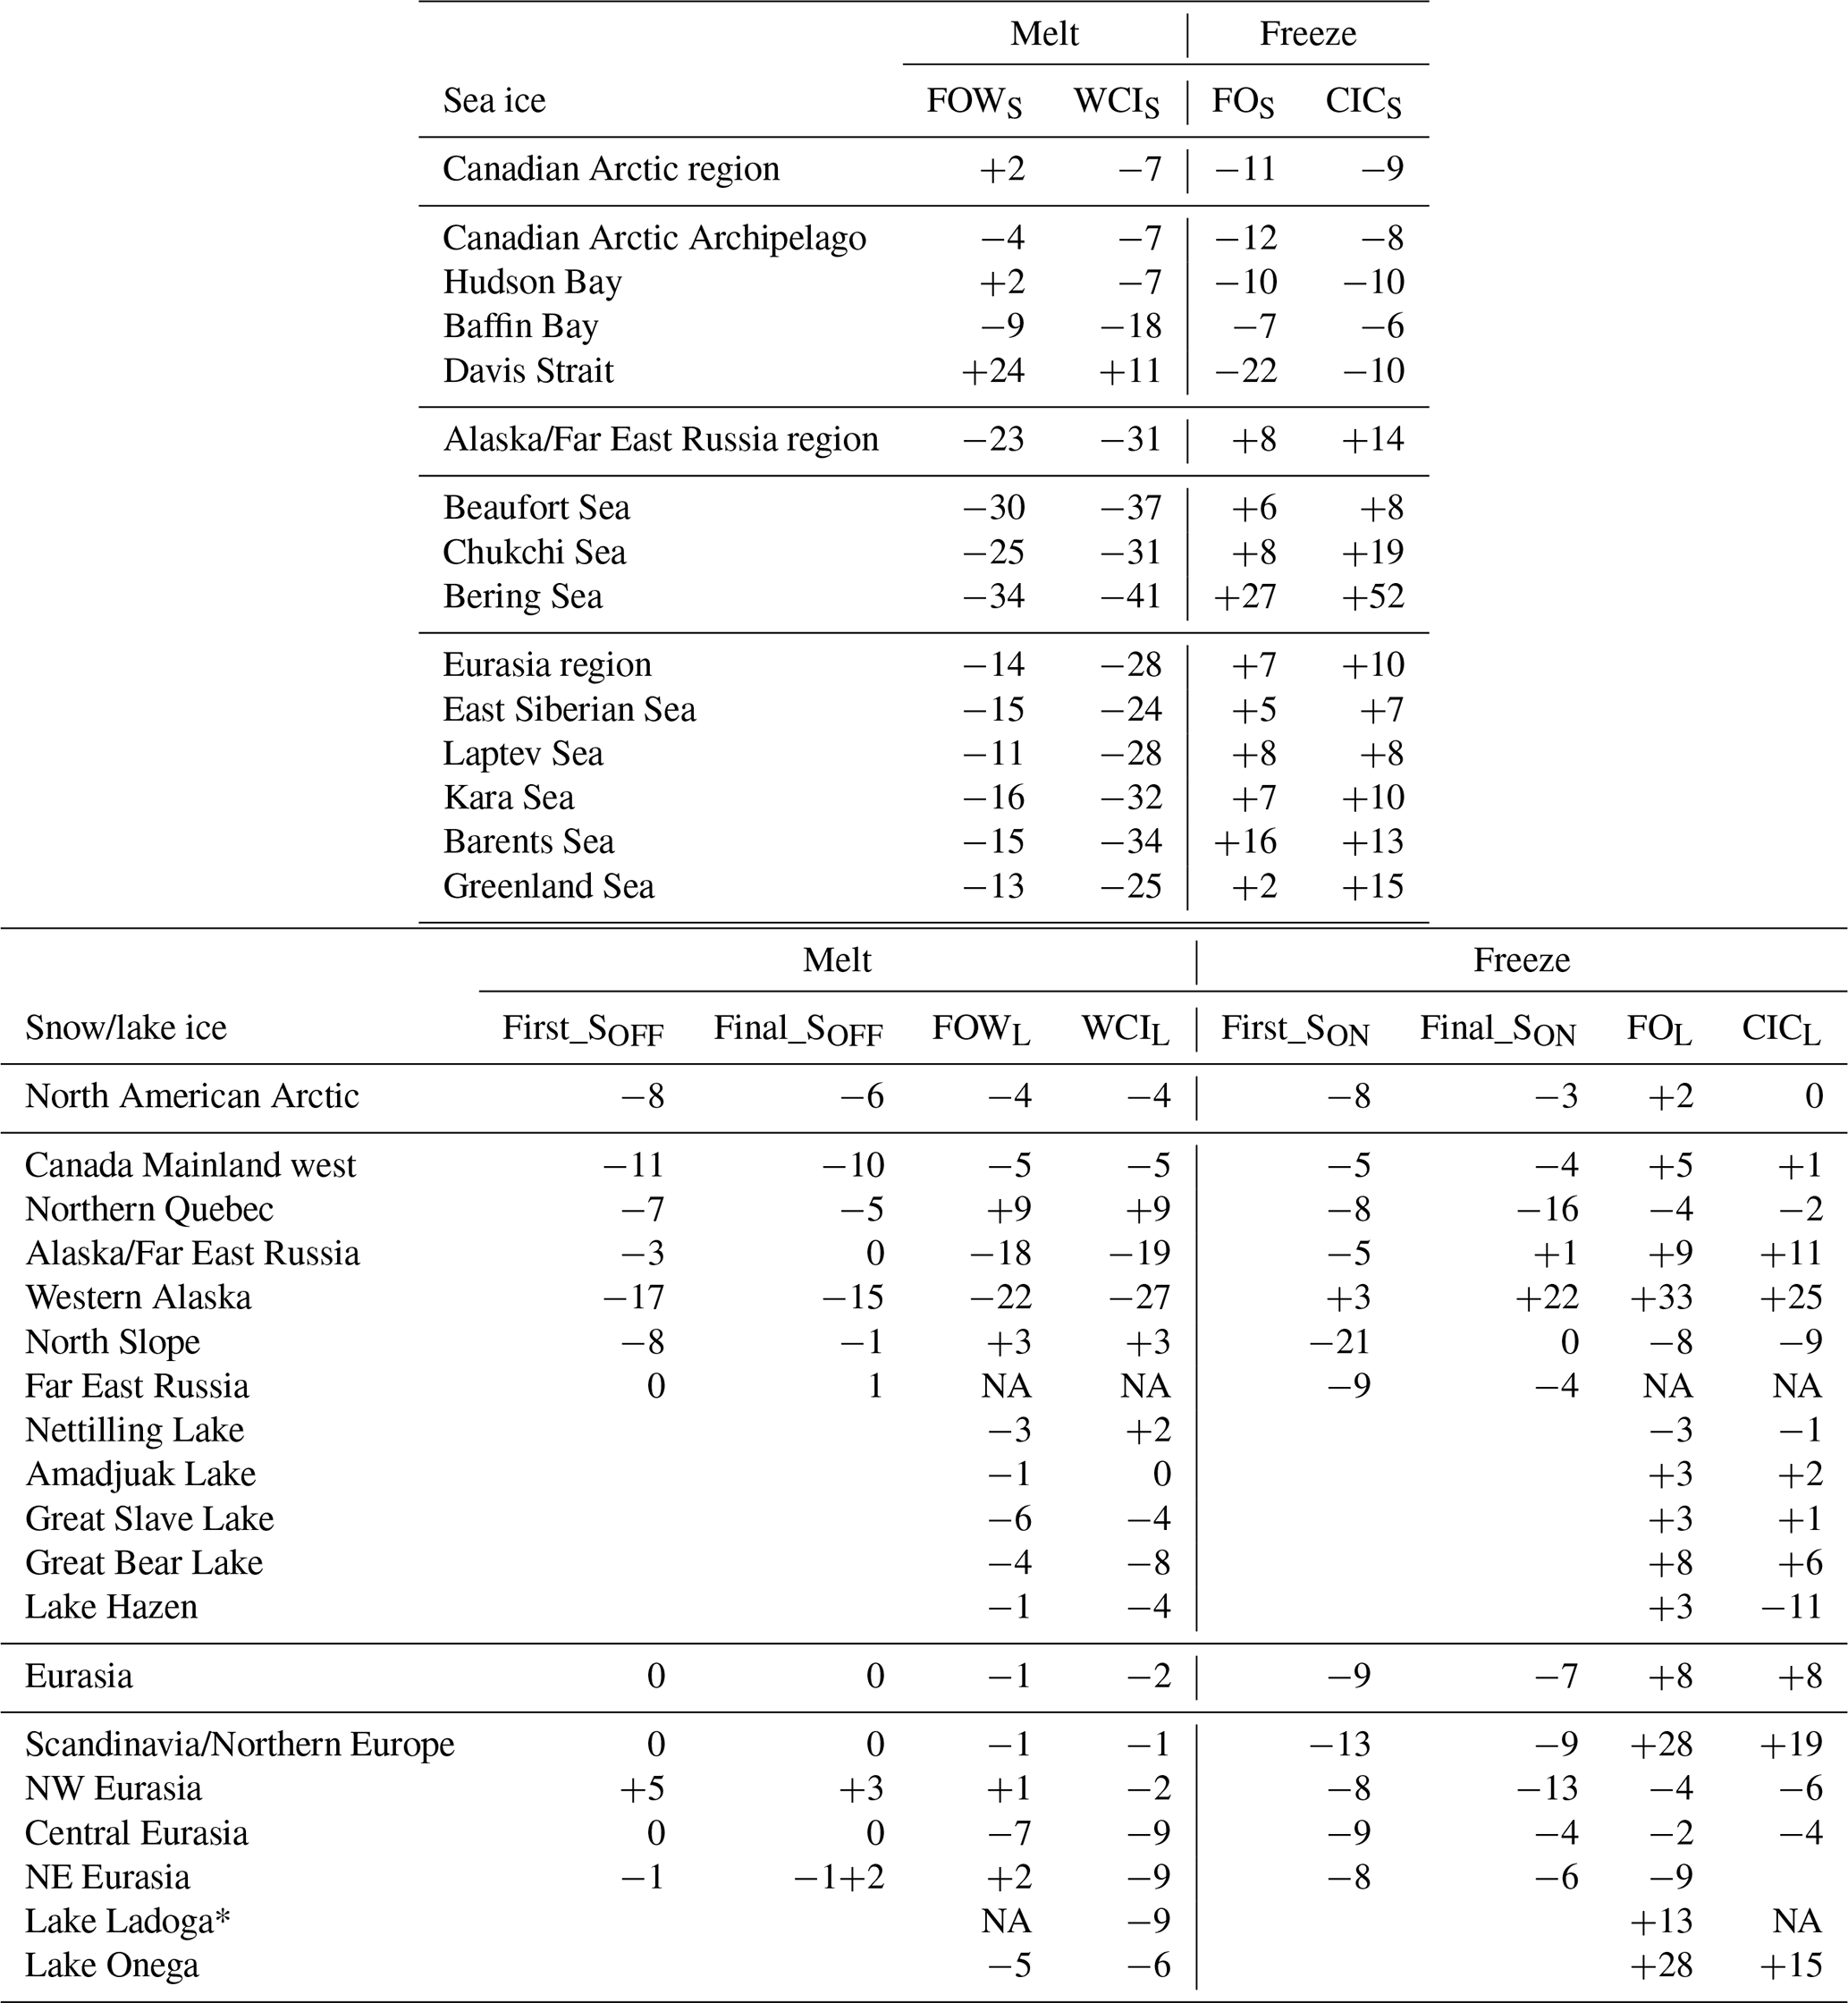
* FOWL and CICL are not included for Lake Ladoga as the lake did not fully freeze in several of the study years. NA: not available.
Examining the pan-Arctic links between the phenology parameters shows that while the first-open-water and first-snow-off dates are not significantly correlated, the final-snow/ice-off parameters are (sea ice water-clear-of-ice and final-snow-off dates, ρ=0.46 and 0.64, p<0.05, for 24 and 4 km IMS products respectively) (Table 2). During the snow-off and ice-off season, lake ice first-open-water (FOWL) and water-clear-of-ice (WCIL) dates are significantly correlated with their equivalent snow and sea ice-off parameters from 2004–2019 (Table 2). Stronger relationships are identified between lake ice and sea ice-off parameters (ρFOW Sea Ice and Lake Ice=0.62 and ρWCI Sea Ice and Lake Ice=0.72, p<0.05) compared to lake ice and snow ( and , p<0.05). Snow-on dates show small positive correlations with sea ice freeze parameters, though none are statistically significant (Table 3). No significant correlations are detected between lake ice and sea ice and lake ice and snow parameters during the freeze season, though similar to the snow/ice-off season, stronger correlations are detected between lake ice and sea ice freeze compared to lake ice-on and snow-on (Table 2).
Examining snow and ice cover at the pan-Arctic scale provides important information on how the cryosphere is responding to climate change as a whole; however, the large degree of spatial variability warrants further investigation into snow and ice conditions at regional scales. For example, Dauginis and Brown (2020) demonstrate that the CAA is responding differently to warming compared to other regions of the Arctic; their findings show later summer clearing of ice and earlier sea ice freeze and snow onset since 2004 (due, at least in part, to increased ice dynamics through the CAA), in line with findings from previous studies that showed no significant trends toward earlier sea ice melt onset dates in the CAA (e.g. Mahmud et al., 2016; Marshall et al., 2019). Other Arctic regions have shown significantly earlier sea ice melt onset: Barents Sea 8.2 per decade, Kara seas 5.1 per decade, Baffin Bay 6.6 per decade, and Greenland Sea 7.1 per decade (Stroeve and Notz, 2018). The response of snow cover to changes in climatic and hydrologic regimes also varies regionally, with northern Canada and eastern Siberia experiencing increased snowfall, while Scandinavia and regions around the Greenland ice sheet are experiencing increasing rainfall (Box et al., 2019). Additionally, ice cover duration in Arctic lakes since 2004 shows interannual and regional variability, with lakes in western Russia showing anomalies ranging from 59 d shorter to 57 d longer, while smaller anomalies were identified in Canadian lakes (Duguay and Brown, 2018). Therefore, the following section will examine regional variability in sea ice, lake ice, and snow phenology from 2004–2019 using the 4 km IMS product as the higher spatial resolution (compared to the 24 km product) allows finer-scale changes in snow and ice cover to be detected.
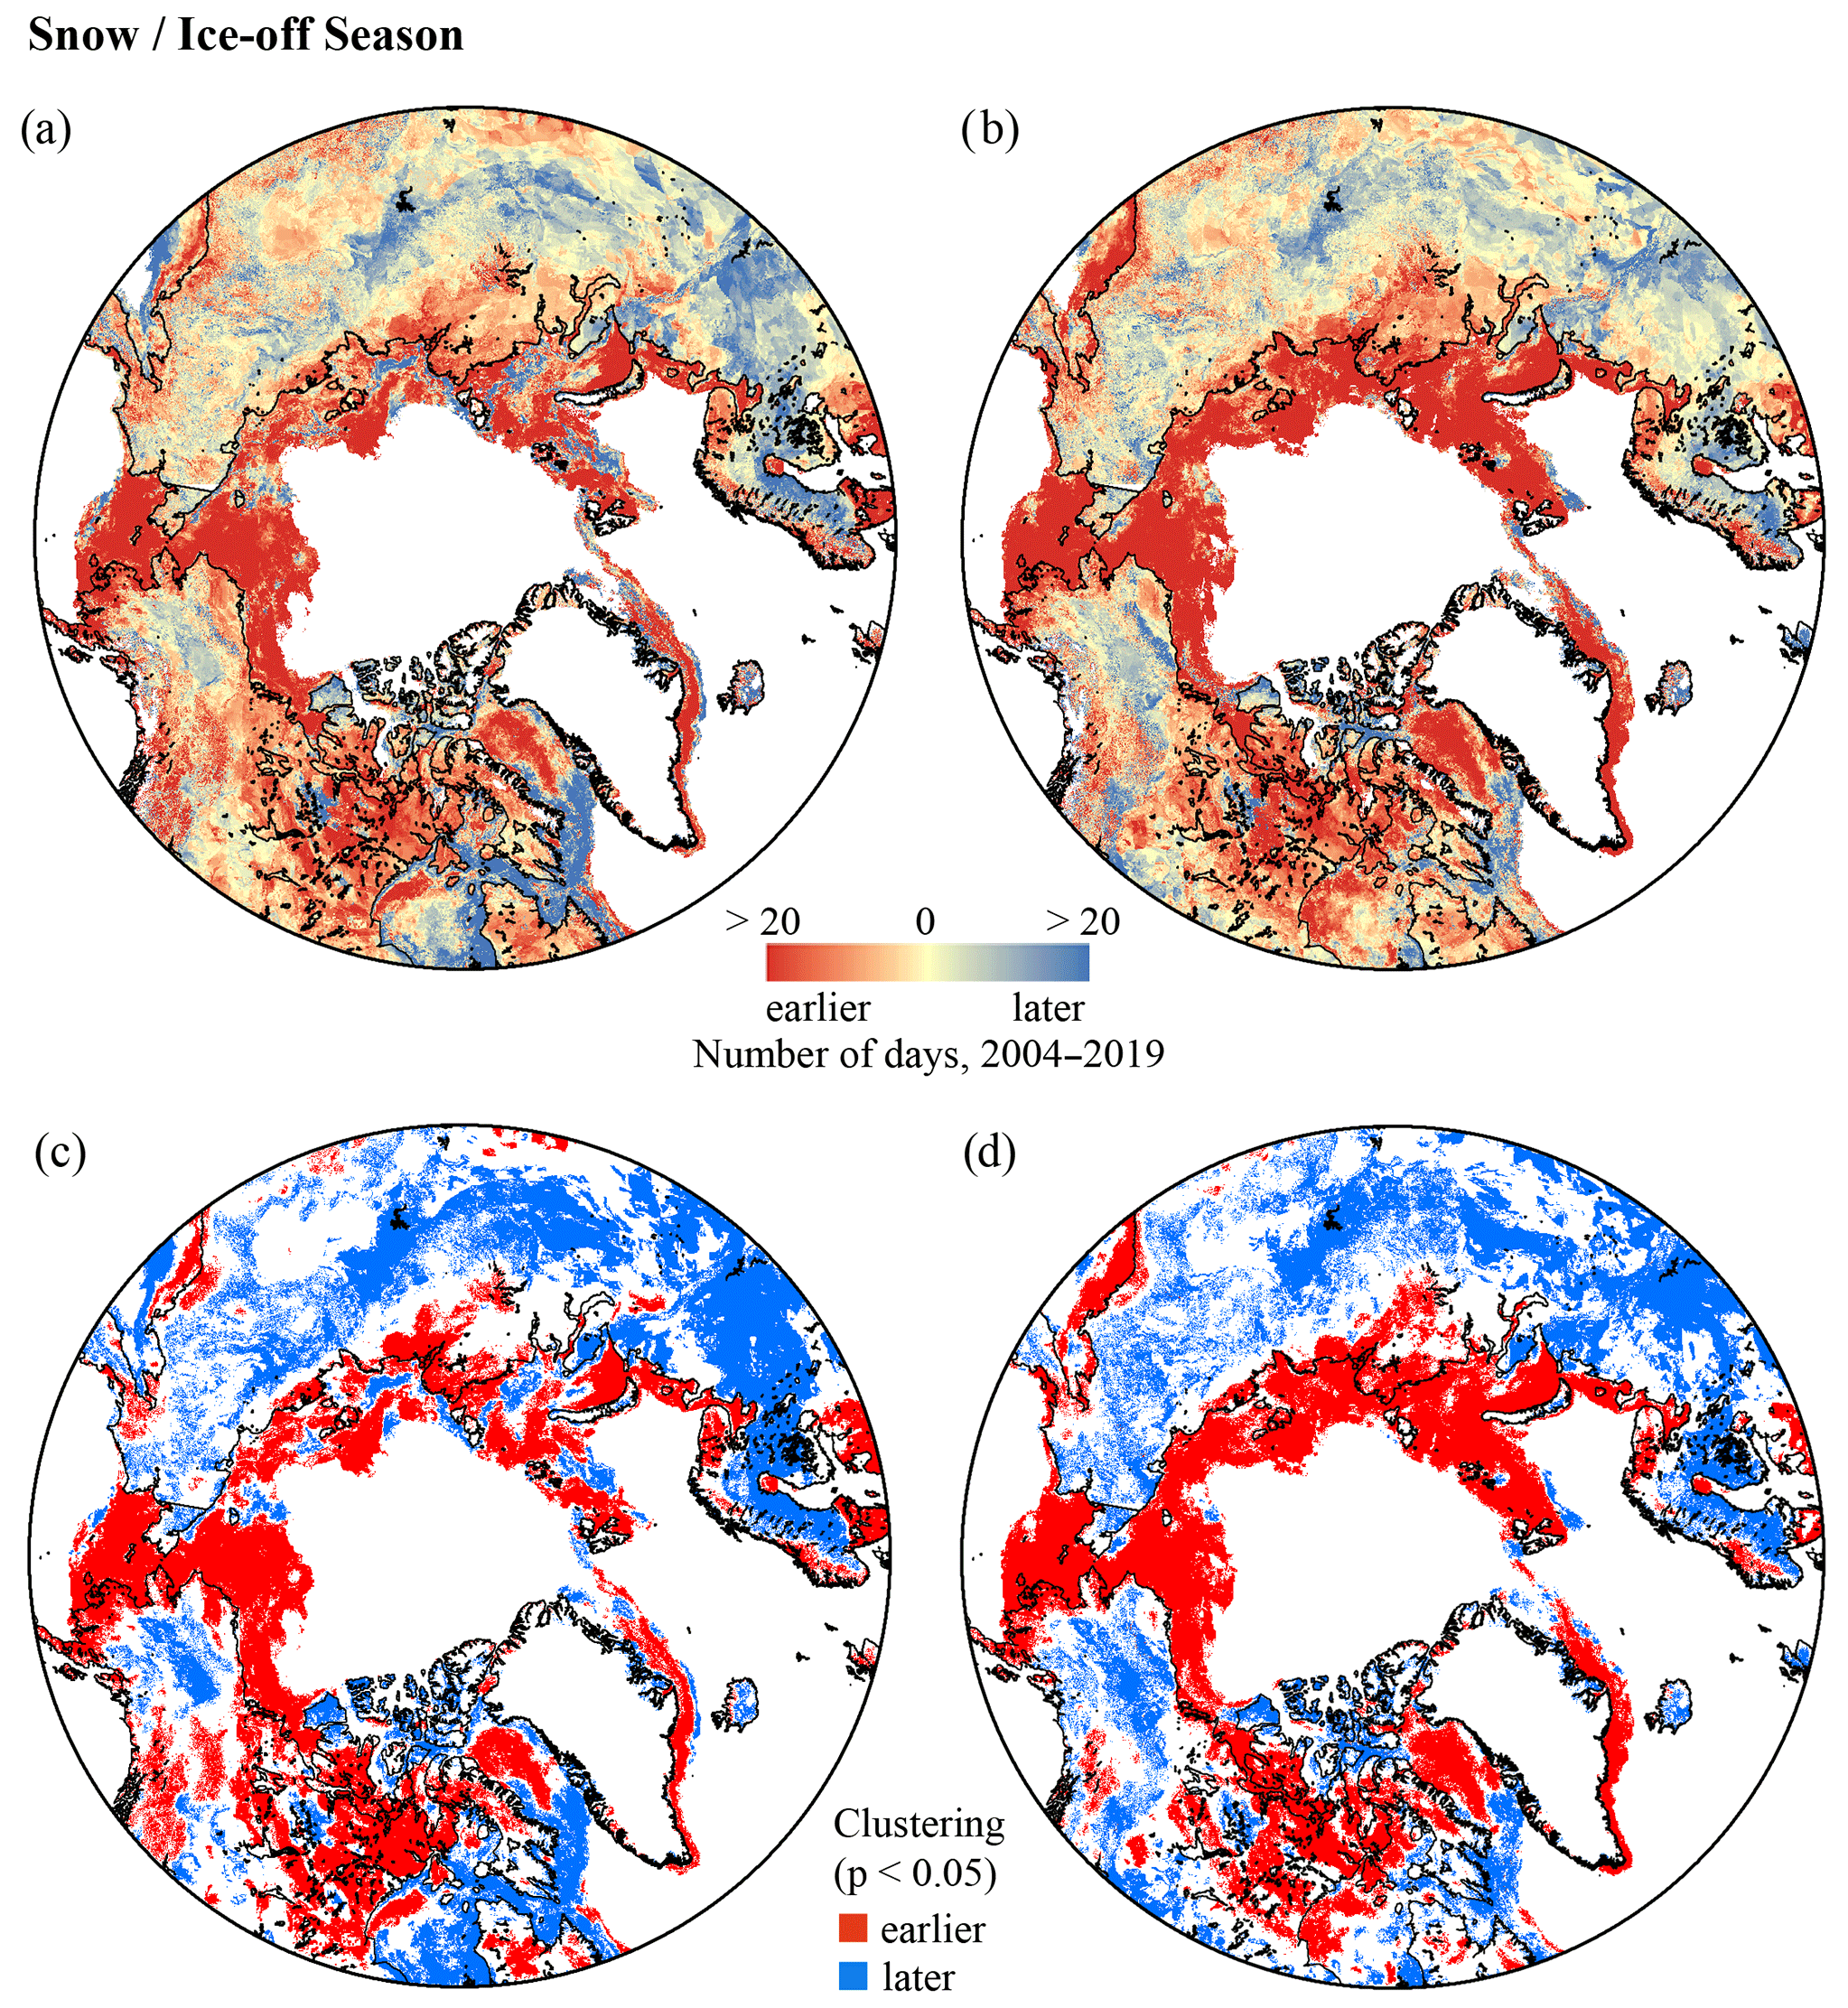
Figure 6Trends in 4 km IMS (2004–2019) (a) sea ice first open water (FOWS), first snow-off (first_sOFF), and lake ice first open water (FOWL); (b) sea ice water clear of ice (WCIS), final snow-off (final_sOFF), and lake ice water clear of ice (WCIL); (c) significant trend clusters in FOWs, FOWL, and first_SOFF; and (d) significant trend clusters in WCIS, WCIL, and final_SOFF.
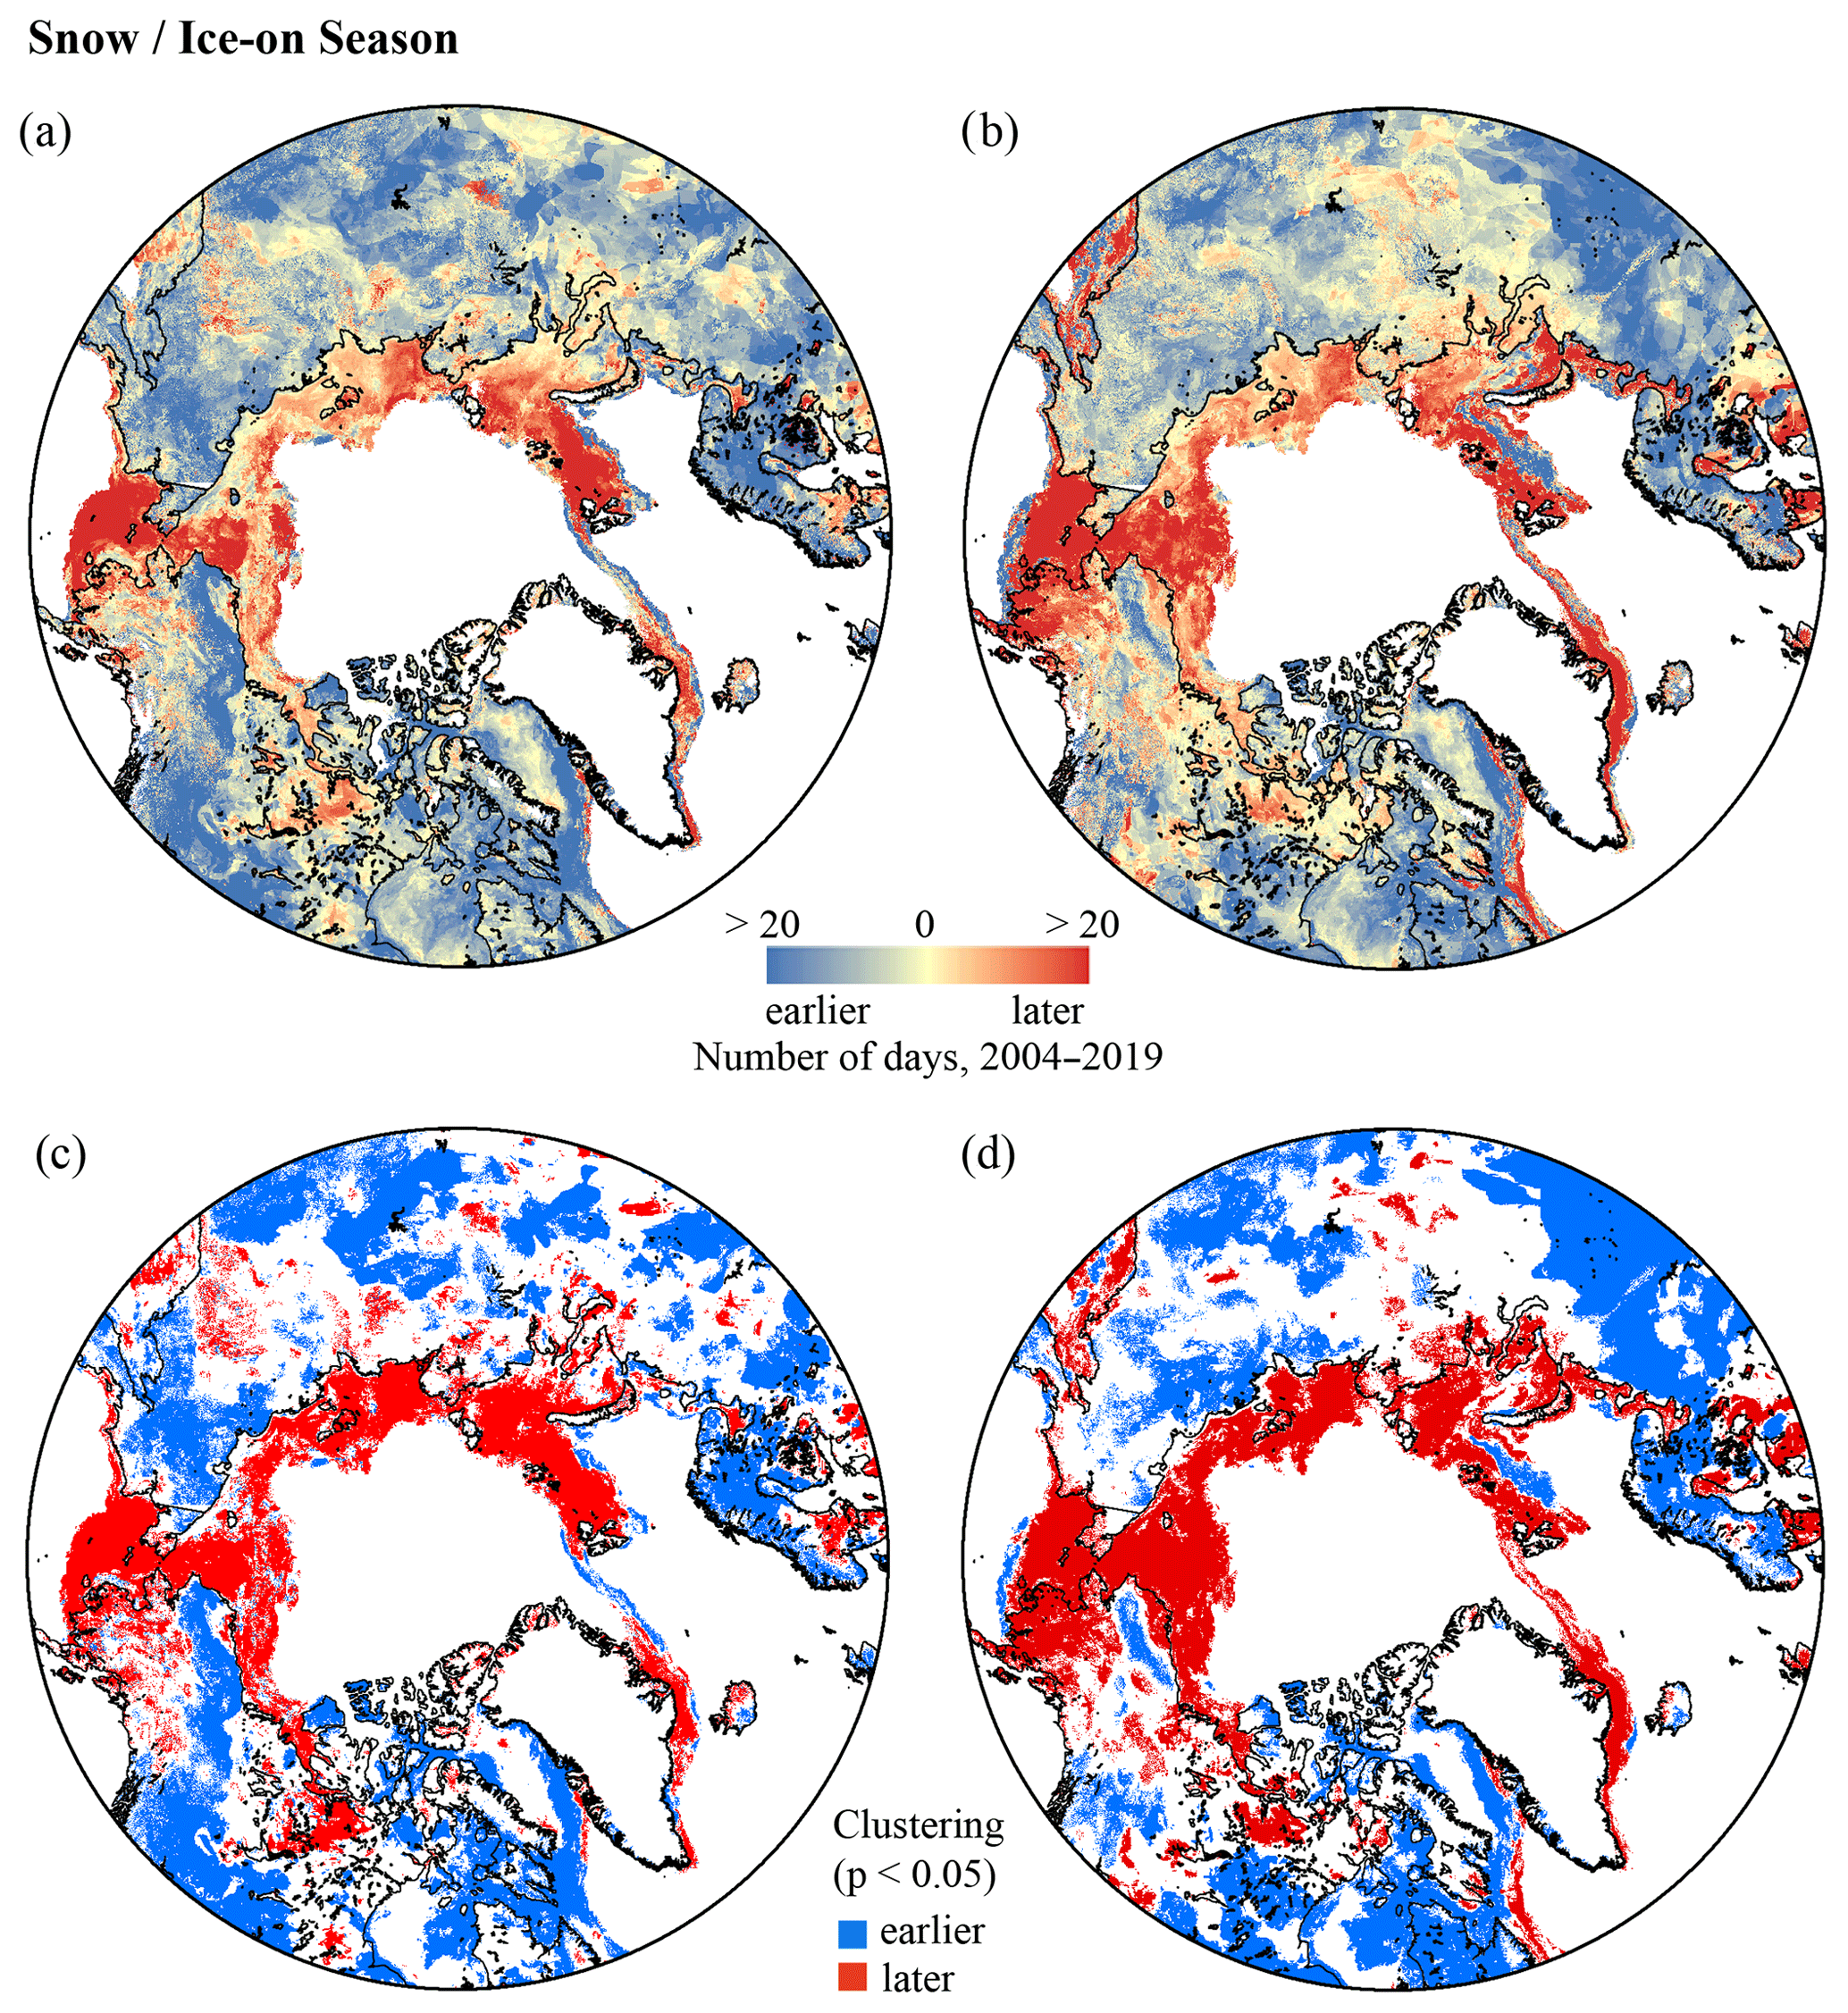
Figure 7Trends in 4 km IMS (2004–2019) (a) sea ice freeze onset (FOS), first snow-on (first_sON), and lake ice freeze onset (FOL); (b) and sea ice continuous ice cover (CICS), final snow-on (final_sON), and lake ice continuous ice cover (CICL); (c) significant trend clusters in FOs, FOL, and first_sON; and (d) significant trend clusters in CICS, CICL, and final_sON.
3.2 Regional variability
3.2.1 Snow-off and ice-off season
Short-term trends in sea ice, snow, and lake ice phenology from 2004–2019 are presented in Figs. 6 (snow/ice-off) and 7 (snow/ice-on) along with maps identifying significant local clustering in the trends, indicating similar trends between the phenology parameters. Median values of the spatial trends in Figs. 6 and 7 for regions defined in Fig. 1 are reported throughout the following section and included in Table 3. Correlations with 2 m air temperature for the three main sea ice regions and two main snow/lake ice regions (Fig. 1) are presented in Table 4. Overall, sea ice, snow, and lake ice show tendencies toward earlier melt, with the exception of (1) Eurasian snow-off parameters, which show little change from 2004–2019 compared to other Arctic regions, and (2) sea ice first open water in the Canadian Arctic. The Alaska/Far East Russia region exhibited the largest trends toward earlier sea ice-off (medianFirst Open Water Sea Ice=23 d), and North America showed larger trends toward earlier snow-off and lake ice-off compared to Eurasia (North America: median d, medianFirst Open Water Lake Ice=4 d; Eurasia median d, medianFirst Open Water Lake Ice=1 d).
Table 4Regional Spearman rank correlations (ρ) for snow and ice phenology dates and monthly 2 m temperature from 2004–2019 using 4 km IMS. For sea ice, Canadian Arctic includes Baffin Bay, Hudson Bay, and the CAA; Alaska/Far East Russia includes the Beaufort, Chukchi, and Bering seas; and Eurasian Arctic includes the East Siberian, Laptev, Kara, Bering, and Greenland seas (see Fig. 1). Months were selected for each phenology parameter based on mean phenology dates in Fig. 3. Bold represents statistically significant correlations at the 95 % confidence level.
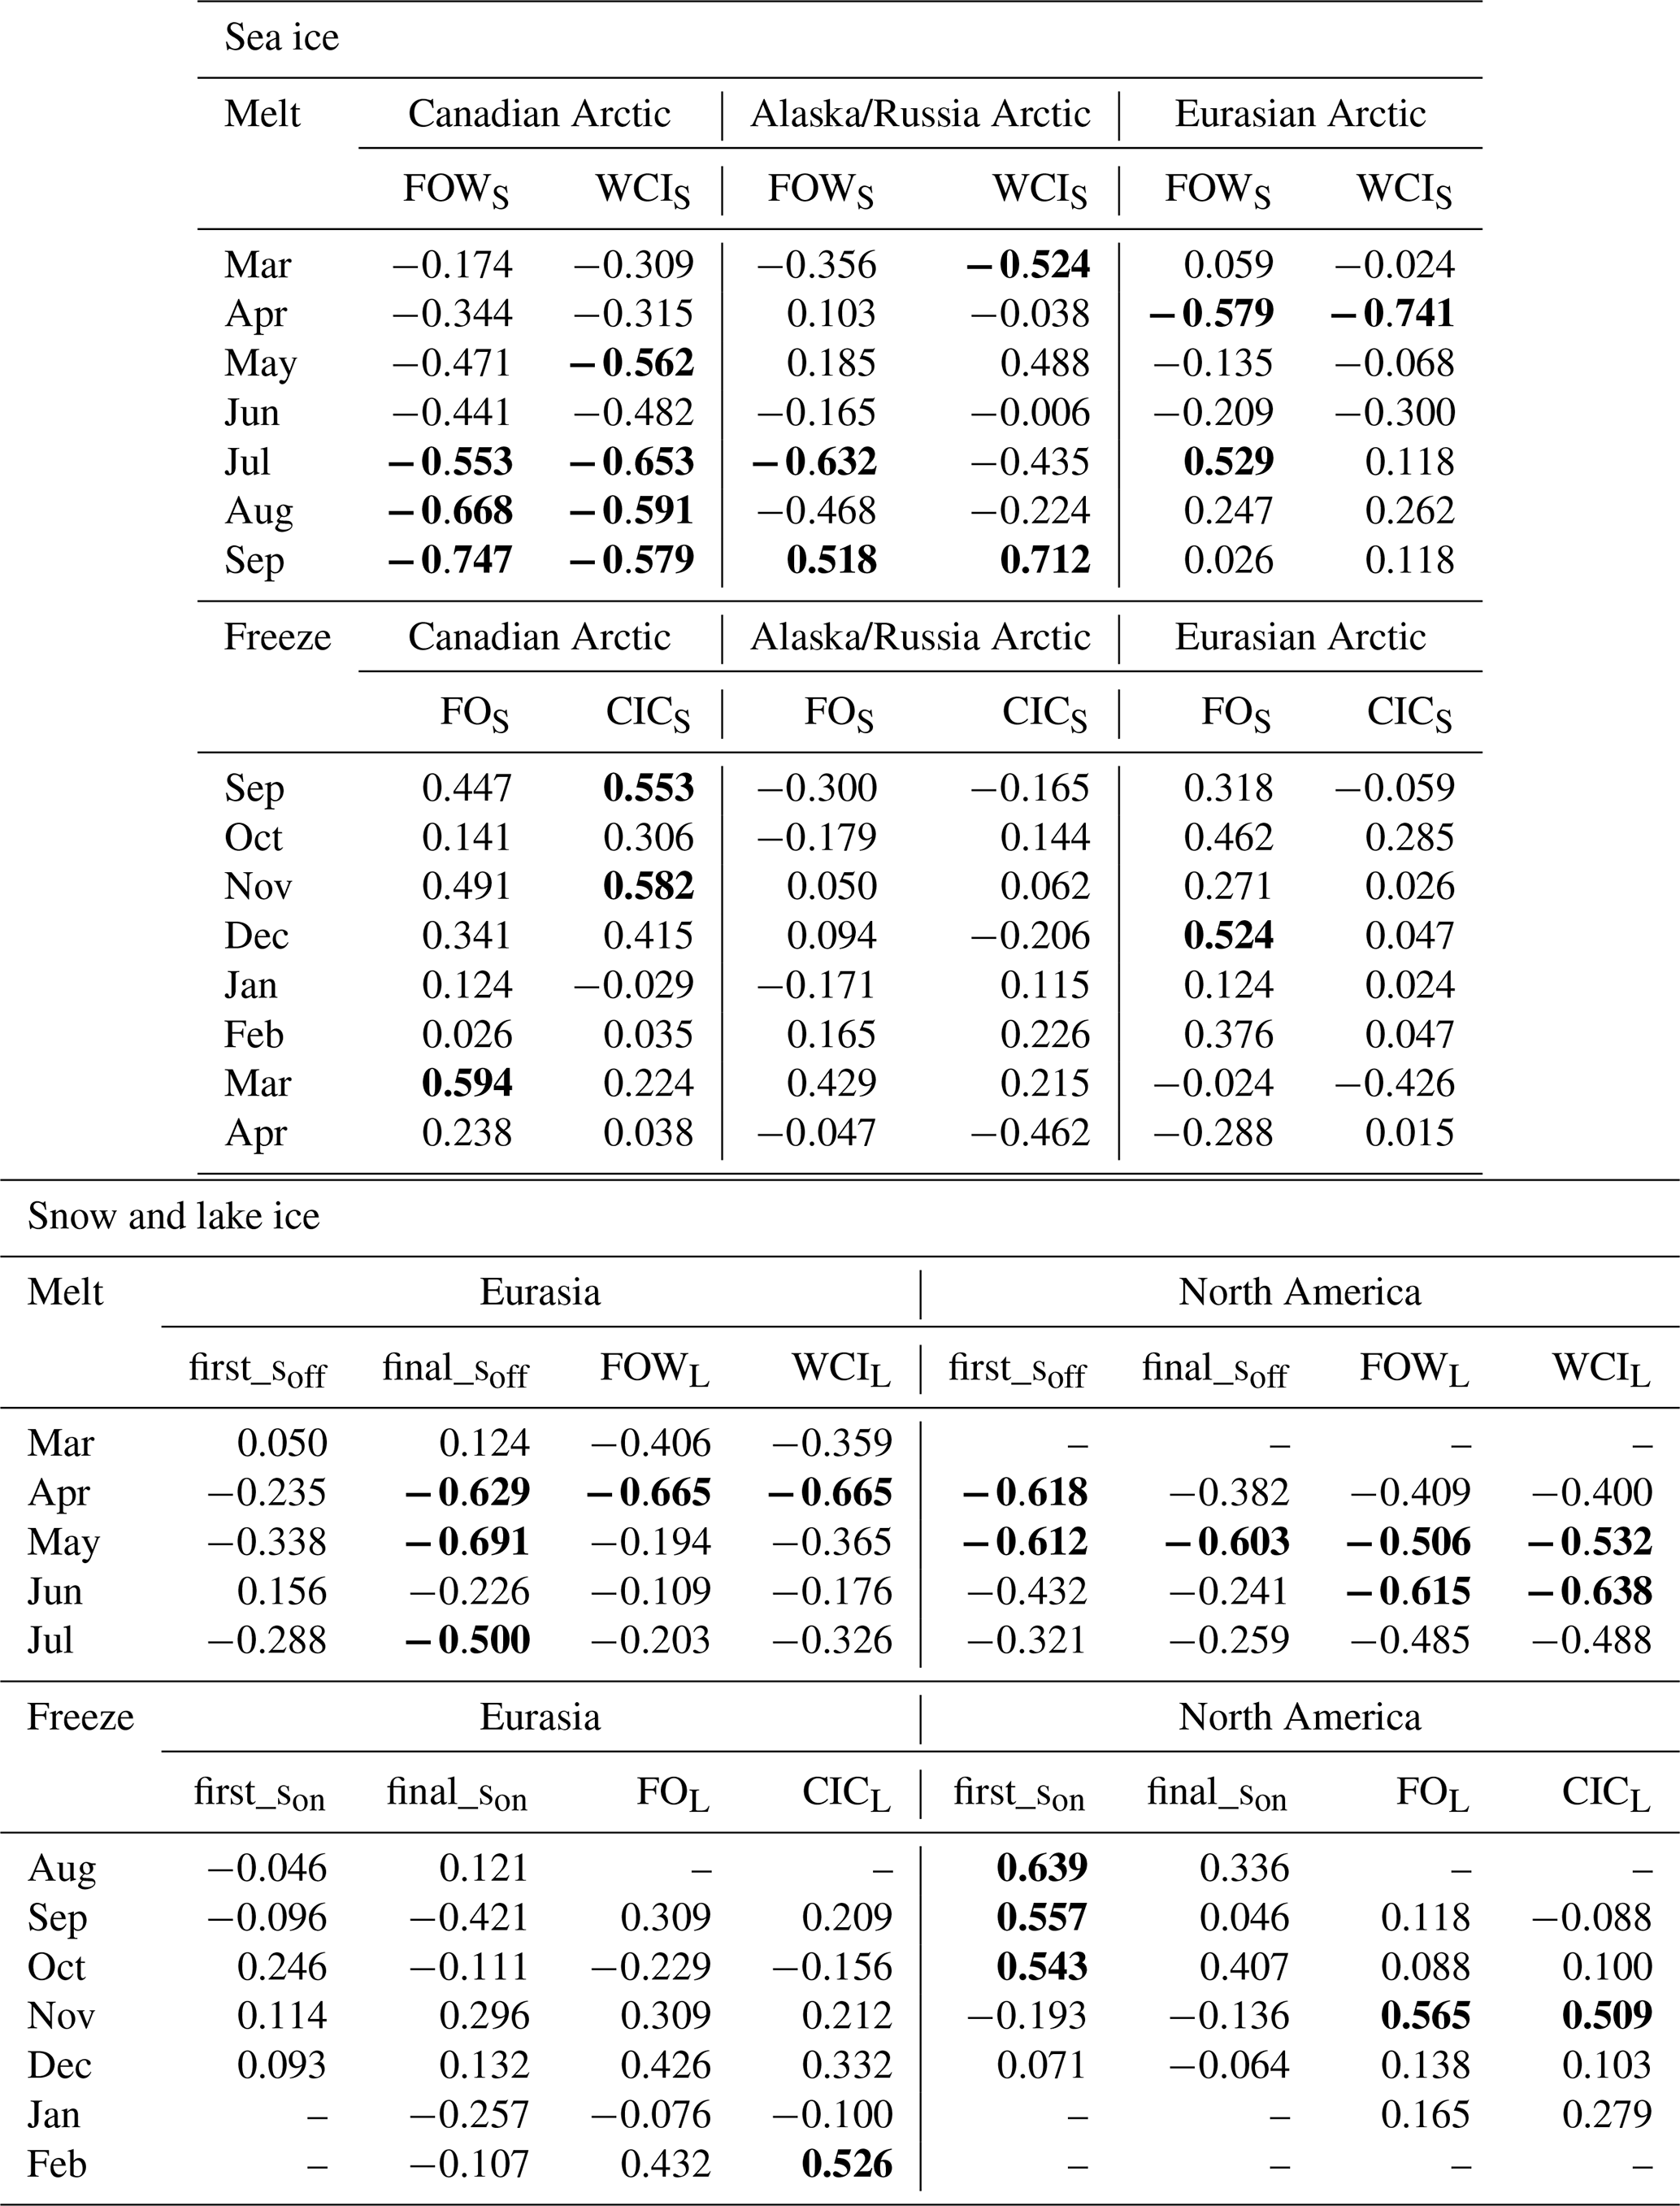
Table 5Regional Spearman rank correlations (ρ) for snow and ice phenology dates and monthly downwelling longwave radiation (APP-x) from 2004–2019. For sea ice, Canadian Arctic includes Baffin Bay, Hudson Bay, and the CAA; Alaska/Far East Russia includes the Beaufort, Chukchi, and Bering seas; and Eurasian Arctic includes the East Siberian, Laptev, Kara, Bering, and Greenland seas (see Fig. 1). Months were selected for each phenology parameter based on mean phenology dates in Fig. 3. Bold represents statistically significant correlations at the 95 % confidence level.

Canadian Arctic
In the Canadian Arctic, sea ice has a wide range of ice-off timing, spanning from March in the far southern reaches to early May in the north for nearshore, polynya, and lead regions and to late August clearing from the channels of the CAA – in the portions where clearing occurs. The majority of the region experiences ice-off conditions through June, July, and August, and these months show significant (negative) correlations between regional mean sea ice-off dates and the regional mean 2 m temperature (as well as May and WCIS, Table 4), indicating that earlier sea ice-off dates here are strongly related to air temperature during the ice-off season. LW↓ shows significant (negative) correlations to WCIS in September, which is also when ice can clear from the channels of the CAA (where it clears) (Table 5). For the North American Arctic region, snow-free timing ranges from mid-April in the south to mid-July in the north. Regional mean first-snow-off dates are significantly correlated with both 2 m temperature and LW↓ values for April and May, while final snow-off is significantly correlated only with May (when much of the mainland area of Canada becomes snow-free, Fig. 3). Lake ice-off timing spans from April in the south to July in the northern islands (very few lake pixels experience ice-off in August, other than Lake Hazen). Both first and final lake ice-off regional mean dates are significantly correlated with May and June 2 m air temperatures, while the bulk of the ice-off dates in this region are through June and July; it is established that there is lag in air temperatures crossing the 0 ∘C isotherm and the timing of lake ice-off – up to about a month on average for lakes across Canada (Duguay et al., 2006). Regional mean LW↓ through this region shows significant (negative) correlations between first and final open water in both June and July (as well as May WCIL, Table 5). A strong example of the lag between lake ice-off and snow-off can be seen using Great Bear and Great Slave lakes compared to their surrounding areas (Fig. 3): snow-free timing occurs here in May, while the ice remains on the large lakes until June/early July due to the extra energy required to melt ice vs. snow.
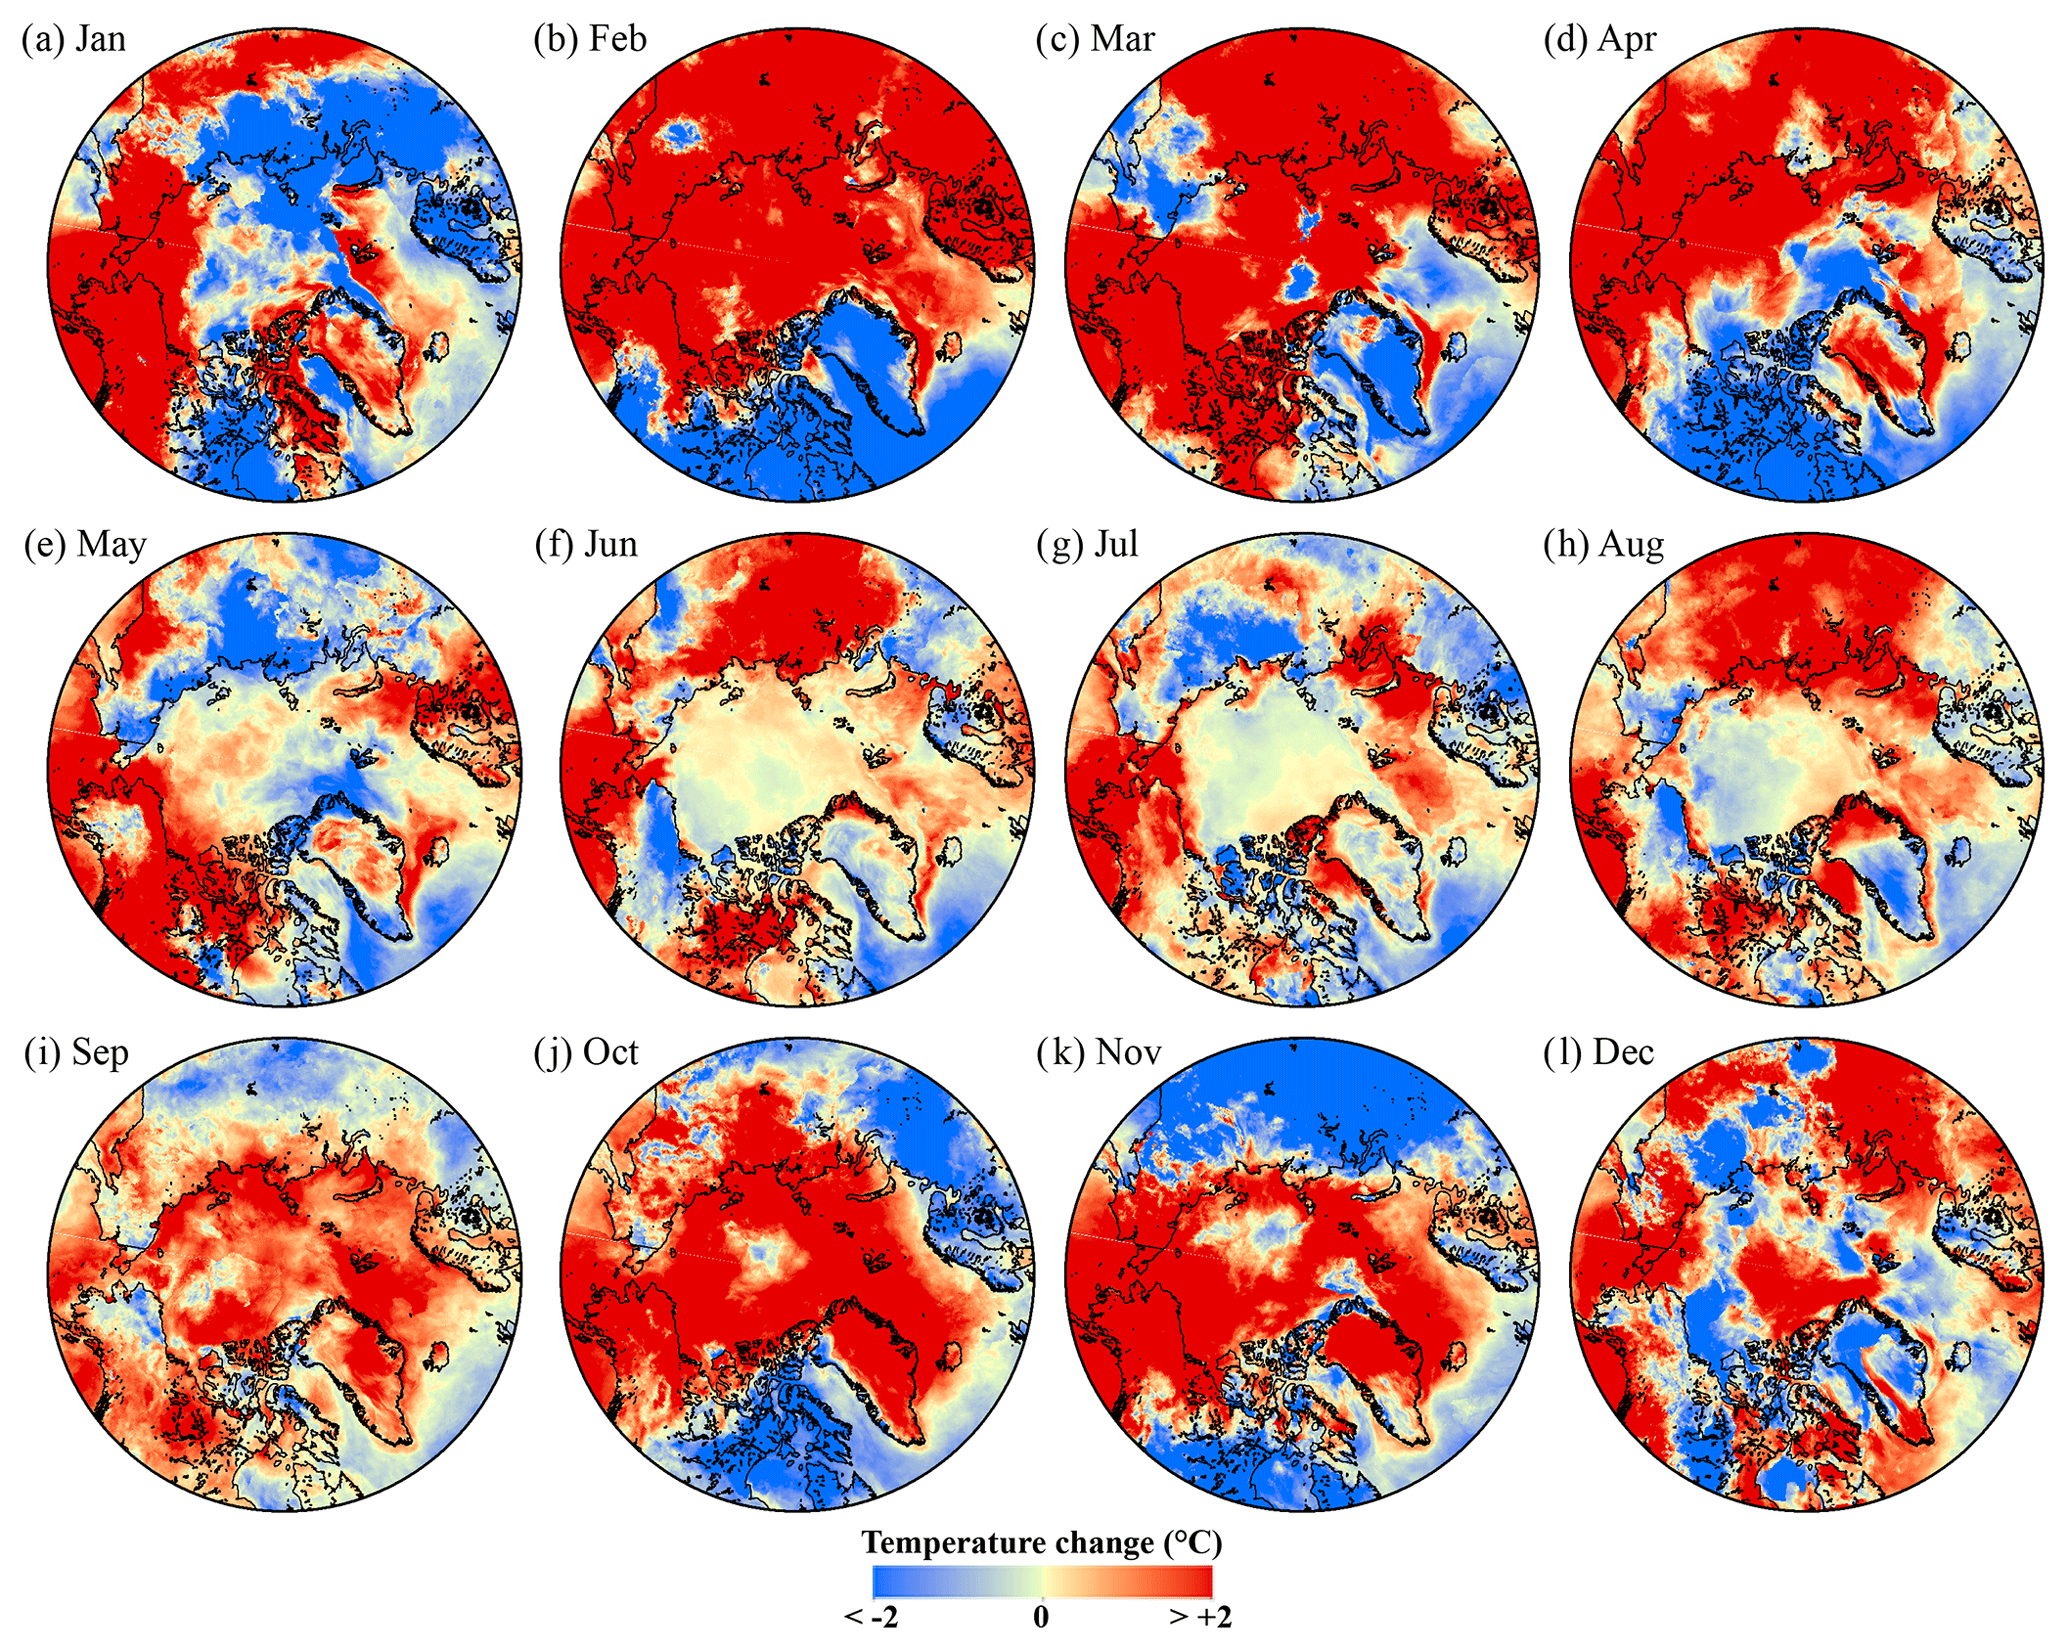
Figure 8Trends in monthly 2 m temperature from 2004–2019 in (a) January, (b) February, (c) March, (d) April, (e) May, (f) June, (g) July, (h) August, (i) September, (j) October, (k) November, and (l) December.
Sea ice is clearing out of the Canadian Arctic earlier, while the first detection of open water (FOWS) shows a later trend, albeit with considerable regional variability. In the CAA, earlier first open water is detected (median = 4 d), though changes toward earlier water clear of ice are mostly confined to the southern channels, where temperature increases are larger in August and September (Fig. 8h and i). The significant clustering between water and land pixels in the northern CAA (Fig. 6c and d), with predominantly later trends for both open water and snow-off (no lakes are large enough in this area to be detected by IMS), indicates ice and snow are responding similarly in this region. For example, the eastern Parry Channel and the surrounding area (Cornwallis Island, Bathurst Island, and northern Somerset Island) show significant clustering between the sea ice and snow trends (Fig. 6c and d), further highlighting this region of later ice/snow-off (Dauginis and Brown, 2020). The Baffin Bay/Davis Strait region overall shows a median trend of 1 d earlier; however, the northern portion (Baffin Bay) and southern portion (Davis Strait) show opposite trend directions (9 d earlier vs. 24 d later, respectively) (Fig. 6a, Table 3). Warming trends are identified over the northern region of Baffin Bay in July and August ranging from 0.01 to 3 ∘C (Fig. 8g and h) where the notable trends toward earlier ice-off are detected (Fig. 6a and b). Later first-open-water trends are evident for Hudson Bay (median = 2 d), with earlier water-clear-of-ice trends (median = 7 d). The median temperature increase during July over Hudson Bay is 0.55 ∘C, though while the majority of the northern and western portions show warming trends, the eastern and more southern portions exhibit cooling (Fig. 8g). These regions of cooling correspond with the region of predominantly later FOWS trends (median = 2 d). Significant clustering is shown in the ice and snow-off trends along the southern stretches of Hudson Bay and nearshore regions (Fig. 6c and d), indicating links in the response of ice and snow in those regions.
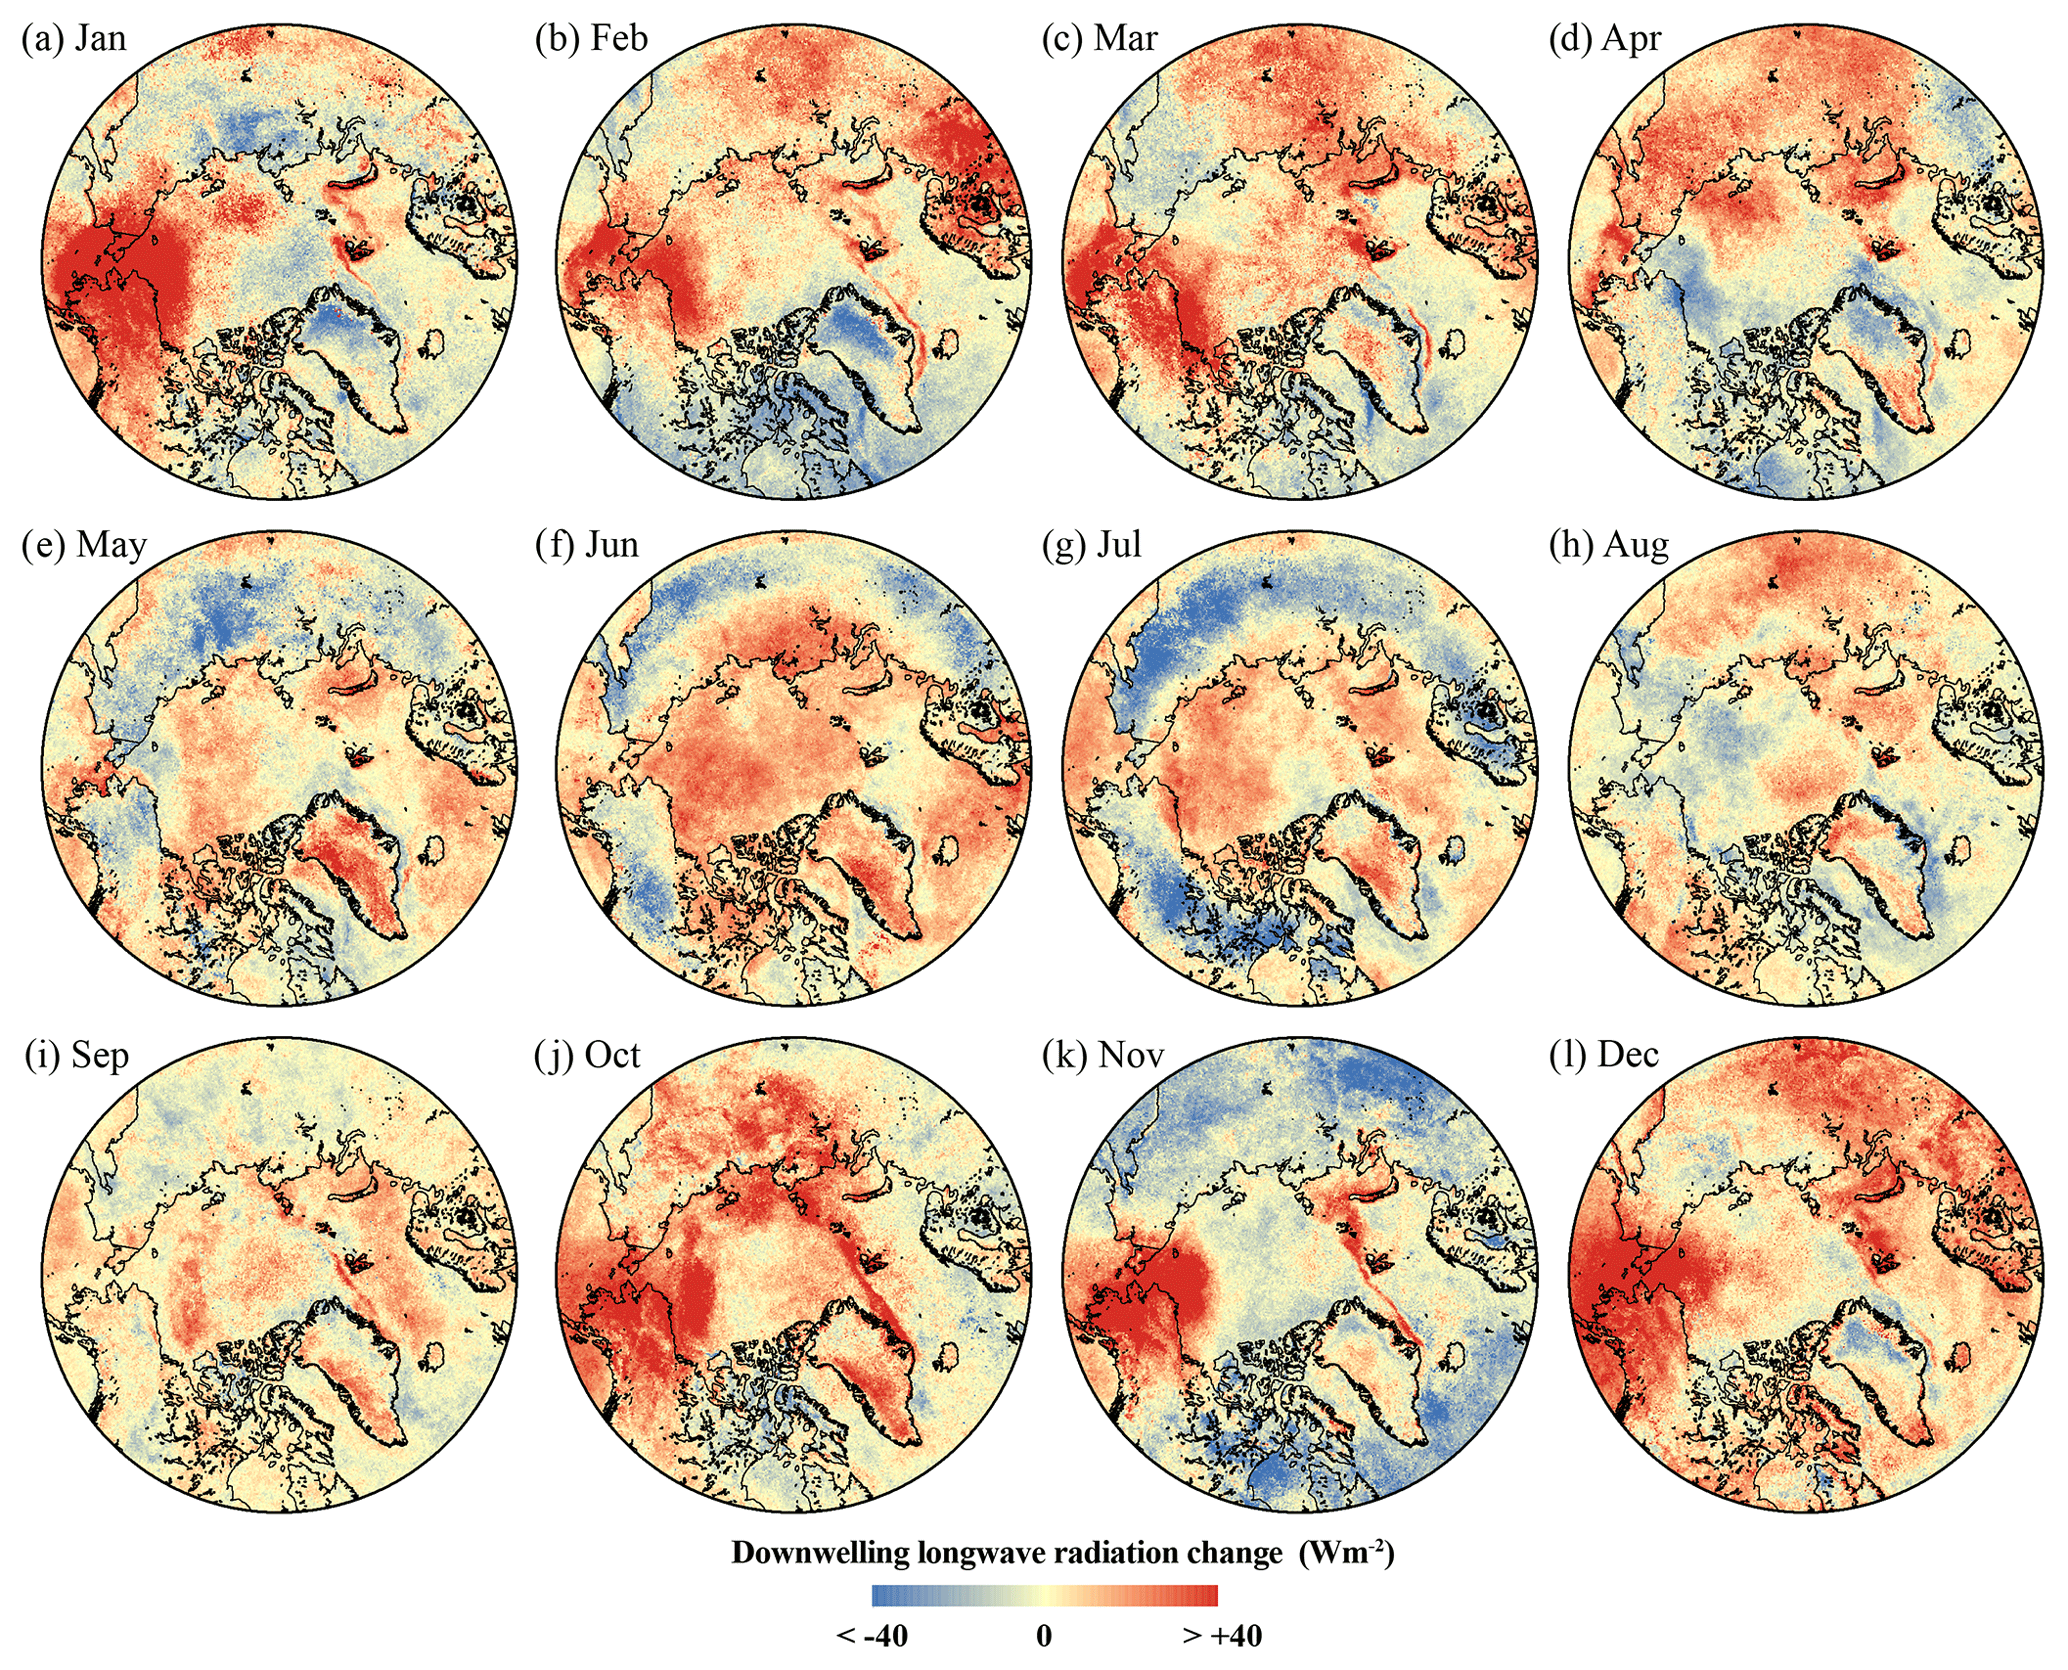
Figure 9Trends in downwelling longwave radiation 2004–2019 in (a) January, (b) February, (c) March, (d) April, (e) May, (f) June, (g) July, (h) August, (i) September, (j) October, (k) November, and (l) December.
Earlier trends for snow and lake ice-off parameters are detected across North America. Looking at the western mainland areas of the Canadian Arctic, snow-off trends are predominantly earlier over the 2004–2019 period (median first_sOFF=11 d, median final_sOFF=10 d, Table 3). Links between the sea ice trends and the snow and lake ice trends are evident in the region spanning east from Victoria Island into the central mainland Arctic region, where significant local clustering is identified, with more clustering evident during first snow-off and ice-off events. Lake ice first open water and water clear of ice are both trending earlier here as well (median = 5 d for both), with larger trends detected in the eastern portions, likely related to strong warming over the region in May and June (Fig. 8e and f). Examining Great Slave Lake and Great Bear Lake indicates that trends for water clear of ice are 4 and 8 d (median values) earlier, consistent with negative ice cover duration anomalies (shorter ice cover duration) for 9 of the last 14 years identified by Duguay and Brown (2018). While the snow trends surrounding these large lakes are also earlier, they are not significantly clustered with the lake ice trends, with the exception of the eastern portion of Great Bear Lake and a small portion of the western edge. The western portion of Great Slave Lake shows mostly earlier ice-off trends, while the surrounding snow trends show very slight tendency toward later snow-off, which aligns with both cooling temperature trends and less LW↓ in that region (e.g. June, Figs. 8f and 9f). Interestingly, the temperature and radiation trends here clearly show the effect of the lakes on their surroundings with contrasting trends for the lakes compared to land to the west. Lake ice-off dates in northern Quebec (bordered by Hudson Bay and Baffin Bay) show later trends, with both ice-off parameters showing median trends of 9 d later, which corresponds to a widespread cooling pattern over northern Quebec in July from 2004–2019 (Fig. 8g). North of this region, the two large lakes on Baffin Island, Nettilling Lake and Amadjuak Lake, show that trends for first open water are 3 d (median values) earlier for both lakes, though from 2004–2018 these lakes showed positive ice cover duration anomalies for 7 of the last 14 ice seasons, with most of the longer ice cover duration anomalies observed during the last 6 seasons (Duguay and Brown, 2018). Lake Hazen, in the far north, indicates trends toward earlier first open water and water clear of ice overall; however, while the eastern portion of the lake shows earlier ice-off trends, the western portion does indicate later ice-off trends (with ice cover remaining the longest on the western portion of the lake for several years).
Alaska/Far East Russia
Mean sea ice-off timing in this region is quite different for the Bering Sea (mainly April through May, with some late March first open water) and the Chukchi/Beaufort seas (mainly late August through mid-September). Significant (negative) correlations between sea ice-off dates and air temperature are identified in this broad region only for FOWS in May; however, warming patterns are present over the Bering/Chukchi seas for almost all months since 2004 (Fig. 8). Interestingly, both ice-off parameters show positive correlations with September temperatures – likely an artifact of the large region compared, as only the far northern sections of this region experience ice-off in September (Table 4). LW↓ in this region is significantly correlated with the ice-off parameters in both March and May and is likely a reflection of the conditions initiating melt onset (e.g. Mortin et al., 2016), as timing of onset is correlated with timing of ice retreat (Stroeve et al., 2016). Snow-free timing in this region is predominantly through late April, early May in the interior, and mid-June on the North Slope and Chukchi Peninsula, with regions of higher elevations not becoming snow-free until August. Lake ice-off timing spans from May in the southern coastal regions to July in the northern coastal regions. This land region is included in the North American Arctic snow and lake ice correlations, discussed in the previous section.
Sea ice in the Alaska/Far East Russian coastal region shows large trends toward earlier ice-off, with first-open-water trends indicating 30 d earlier in the Beaufort Sea, 25 d earlier in Chukchi Sea, and 34 d earlier in the Bering Sea (median values, with slightly larger values for WCIS). The Chukchi and Bering seas have shown larger sea surface temperature warming trends in August compared to the Arctic-wide August mean, and the September sea ice extent in the Chukchi Sea was well below the 1981–2010 median in 2012, 2018, and 2019 (Druckenmiller and Richter-Menge, 2020; Perovich et al., 2020). First-snow-off trends across Alaska/Far East Russia (median = 3 d earlier) are smaller compared to Canada, though western Alaska shows strong trends toward earlier snow-off. Strong warming over western Alaska from 2004–2019 during April (Fig. 8d) may contribute to earlier snowmelt in the region. The median lake ice first-open-water date shows trends of 18 d earlier in the Alaska/Far East Russia region, though southwestern Alaska shows some of the largest trends toward earlier ice-off (both FOWL and WCIL) across the pan-Arctic (Fig. 6a, Table 3). Local clustering in this western region shows that the on-land and sea ice parameters have statistically significant clustered trends and are changing similarly. Focusing on the more northern regions of Alaska, first-snow-off trends across North Slope Alaska (NSA) are toward earlier dates (median = 8 d), though final-snow-off trends are considerably smaller (median = 1 d). Lake ice-off across NSA is trending later, with both first open water and water clear of ice showing median dates of 3 d later. Arp et al. (2013) found that the Arctic Coastal Plain (northern Alaska) and Beringia (western Alaska) areas experienced the latest ice-out timing from 2007–2012 compared to other lakes across Alaska, as climatology in these regions is influenced by sea ice conditions along the Arctic Ocean coast. Though long-term trends (1950–2011) indicate earlier ice break-up and shorter ice seasons in NSA (Surdu et al., 2014), the trends toward later ice-off in northern Alaska identified in this study from 2004–2019 (Fig. 6a) may reflect interannual variability and the complex responses of lake ice to changes in temperature, sea ice, and snow cover conditions. Little to no significant clustering between the snow and ice trends is identified in this region, other than a limited swath of the nearshore region, showing the sea ice trends here are stronger than the onshore snow/ice trends.
Eurasia
The broad Eurasian region has sea ice-off timing from April (with a few small regions showing March) in the Barents Sea to September in the East Siberian Sea and Arctic Ocean areas. Both sea ice parameters are correlated with April 2 m air temperature (Table 4), and strong warming patterns can be seen here (Fig. 8). FOWS is correlated with July as well, and ice-off in the Laptev Sea region aligns with positive air temperature trends through July in this region (Figs. 3 and 8, Table 4). Snow-free timing spans mid-March in the western areas through June along the northern coasts, with some very small regions extending into mid-August on the northern islands. Final snow-off is significantly correlated to 2 m air temperature for April, May, and July and final snow-off with LW↓ for April and July. Lake ice clearing spans from April in the western European lakes to July in the northern regions (similar to the Canadian Arctic, very few pixels show August ice-free timing in the northern islands), with the 2 m air temperature in April correlated to both ice-off parameters, coinciding with when the lake-rich region in western Europe becomes ice-free.
Trends in sea ice first open water range from 11 to 16 d earlier while water clear of ice ranges from 24 to 34 d earlier across the Eurasian Arctic seas (Table 3). Warming patterns over the Eurasian seas are detected in July and August (with the strongest warming over the Laptev and Barents seas in both months). The earlier ice-off trends detected in this study across the Eurasian Arctic are consistent with Bliss and Anderson (2018), who report negative (earlier) trends in sea ice melt onset across Eurasia from 1979–2017 of −9.45 d per decade (East Siberian), −7.3 d per decade (Laptev), −8.19 d per decade (Kara), −8.47 d per decade (Barents), and −2.37 d per decade (Greenland). Furthermore, earlier ice-off trends in these regions are consistent with large reductions in September sea ice extent in the East Siberian and Laptev seas from 1979–2016 (Onarheim et al., 2018). Significant local clustering is identified in the sea ice trends near the Laptev and Kara Sea region and the onshore snow and lake ice trends in the northern region of Central Eurasia (Fig. 6c and d). Overall, snow-off across the broad Eurasian region shows no trend. Only NW Eurasia shows notable trends in the snow-off timing, with first snow-off and final snow-off 5 and 3 d later respectively (Fig. 6a and b). Crawford et al. (2018) identified links between the reduction of sea ice in the Laptev Sea and the earlier retreat of snow in the Western Siberian Plain, while our results show linked sea ice and onshore trends near the Laptev Sea with earlier snow retreat but a mix of trend direction in the vicinity of the Western Siberian Plain for snow-off timing. A notable distinction on the Eurasian side of the Arctic is the prominent trend toward later ice-off through the seas, but the presence of mixed trend directions for the snow-off, and a prominence of clustered later trends through the continental areas. Trends toward decreased LW↓ can be seen through this region (Fig. 9) as well as cooling trends through September, October, November, and January (Fig. 8). Lake ice shows variability across Eurasia with ±2 d (median) or less detected, with the exception of Central Eurasia, where the ice cover shows trends toward 7 (FOWL) and 9 d earlier (WCIL). Lake Onega (northwest Russia) shows earlier first open water (median = 5 d), and both Onega and nearby Lake Ladoga show earlier water-clear-of-ice trends (Onega median = 6 d, Ladoga median = 9 d). The eastern portion of Lake Ladoga shows very slight trends toward later WCIL, which is in sync with later snow-off trends in that region, while the south/western portions show stronger earlier WCIL trends, likely related to delayed freeze (resulting in thinner, more easily melted ice) and the predominant location of the ice over the season (as the ice forms in the southern shallower potions of the lake first) (Karetnikov et al., 2017). FOWL trends were not calculated for Lake Ladoga as the intermittent and moving ice cover through the season presents limitation to the current search algorithm. There is only an 80 % chance that Ladoga will experience a full ice cover during the ice season (Karetnikov et al., 2017). From 1955–2015, total ice cover duration in Lake Onega decreased by 50 d, though decreases were mostly attributed to delayed freeze (Filatov et al., 2019). Earlier break-up dates have been detected in 40 lakes across Finland from 1963–2014 (Kuusisto, 2015); however, our recent short-term trends show that lake ice-off is becoming slightly later (median = 2 d) in Finnish lakes near Lake Ladoga and Onega. Mean 4 km IMS imagery shows that the average break-up dates range from mid-April to mid-May in this region, though temperature trends are only negative (cooler) in southwestern Finland during April and positive (warmer) over all of Finland during May (Fig. 8d and e).
3.2.2 Snow-on and ice-on season
Sea ice freeze onset in the Canadian Arctic shows trends toward earlier timing (median = 11 d), while sea ice within the Alaska/Far East Russia region and Eurasian regions shows delays in freeze (trends of 8 and 7 d later respectively for freeze onset) (Fig. 7a and b). On land, the North American Arctic and the Eurasian regions both show trends toward earlier first snow-on (medianNorth America=8 d and medianEurasia=9 d) and final snow-on (medianNorth America=3 d and medianEurasia=7 d), though spatial variability is evident. Unlike the snow/ice-off season where lake ice-off trends were larger over North America compared to Eurasia, overall trends toward later lake ice freeze onset are larger across Eurasia (median = 8 d) than North America (median = 2 d) (Fig. 6c). Local clustering is again evident across the Arctic (Fig. 7c and d); however, fewer sea ice/snow clusters are evident in the freeze maps, with the exception of southern Alaska and northern Quebec (Nunavik), particularly for final freeze. A more detailed regional breakdown follows.
Canadian Arctic
Sea ice freeze in the northern portions of the archipelago takes place through in late September and October. Most of Hudson Bay freezes back mainly between late November and December, Baffin Bay through November, and the Davis Strait much later with freeze onset generally through February and final freeze through March. Sea ice freeze onset through this broad region shows significant correlations to September and October LW↓, as well as March 2 m air temperatures (freeze is still occurring in the Davis Strait in March), while complete freeze shows correlations to September and November 2 m air temperatures and December LW↓. Increased cloud cover is reported in some sections of the Canadian region through September–November (Boisvert and Stroeve, 2015), which is likely related to the LW↓ correlations identified here. Feedbacks between longer open water, increased atmospheric moisture, and cloud formation may be related to the delayed freeze, while also resulting in the increased LW↓ here. September, October, and December show some trends in increasing LW↓ across the region (Fig. 9), while November shows clear decreases through most of the region. This furthers the suggestion that feedbacks are driving the correlations with LW↓ as no correlations are identified in November. Snow returns to the High Arctic in late August through September and to most of the mainland Canadian areas through October – though final snow-on does not occur until November in the southern reaches of the western region. First snow-on is significantly correlated with August, September, and October 2 m air temperatures and LW↓ with September. Most lakes in the Canadian Arctic region freeze in November (with final freeze on the large Great Slave Lake extending into early December in some places), while some lakes in the High Arctic freeze earlier through September and October. Lake ice freeze is significantly correlated with the November 2 m air temperatures, which coincides with when the majority of lakes freeze.
Earlier sea ice freeze and snow-on trends are detected across the Canadian Arctic. Sea ice shows freeze onset trending earlier by 8 d in the CAA and 10 d in Hudson Bay and Baffin Bay (median values) (Fig. 6c). First snow-on across the western mainland Canada shows earlier trends (median = 5 d), though delayed snow onset can be identified along north and northwest regions of Canada (south of the Western Arctic Waterway) (Fig. 7a and b). Snow-on also shows earlier trends in northern Quebec (median d, median d) and corresponds to both earlier lake ice and sea ice freeze onset trends identified in this region. A large cooling pattern can be seen over eastern Canada in October, which may contribute to the earlier snow and ice-on dates in this region (Fig. 8j). Earlier snow-on dates in the Canadian Arctic are consistent with observed increases in precipitation across all seasons in Canada from 1948–2012 (Vincent et al., 2015). Global climate models project increases in Arctic precipitation over the 21st century due to enhanced local surface evaporation resulting from sea ice loss; however, recent projections show a shift toward a rain-dominated Arctic, particularly during summer months (Bintanja and Selten, 2014; Bintanja and Andry, 2017). Nettilling Lake shows trends toward earlier freeze onset (median = 3 d) and continuous ice cover (median = 1 d), though there is considerable variability in freeze-up as the east shows trends toward earlier freeze and west shows trends toward later freeze. Great Slave Lake, Great Bear Lake, Amadjuak Lake, and Lake Hazen all show trends toward later freeze onset, consistent with later ice formation across Arctic lakes from 2002–2015 (Du et al., 2017; Derksen et al., 2019). Increases in mean monthly lake surface temperatures in August have been reported to delay freeze-up by 0.3 d per decade on Lake Hazen from 2000–2012 (Lehnherr et al., 2018), and warming air temperature trends are evident in the August ERA5 data from 2004–2019 as well (Fig. 8h). Interestingly, from 2004–2019, freeze onset shows later trends across most of Lake Hazen, while final freeze shows earlier trends across the entire lake despite the delayed start to the freeze season. September 2 m temperature trends show slight cooling trends for the pixels covering the lake ranging from −0.6 to −1.4 ∘C and would correspond to the time of complete freeze over.
Alaska/Far East Russia
Sea ice freeze starts in late September in the northern areas of the Chukchi Sea and ends in late March/Early April in the southern reaches of the Bering Sea. No correlations between temperature and sea ice phenologies in this region were found; however, final freeze for sea ice was significantly correlated with LW↓ in January, February, and March, coinciding with when most of the freeze is occurring in the Bering Sea. Stronger trends toward increasing 2 m air temperatures and LW↓ are seen in this area through the winter (Figs. 8 and 9). This region shows a mix of trends in cloud cover for December–February between 2003–2013 with some decreasing trends over the Bering Sea and increasing trends over the Chukchi Sea (Boisvert and Stroeve, 2015), and the correlations between ice-on and LW↓ identified here are again likely a result of feedbacks taking place. Snow returns to most of the region through September and October, with final snow-on occurring as late as November/December in the southwestern coastal regions and as early as late August in the highest elevations. Snow-on and lake ice-on correlations for this region are included in the main North American Arctic region, with first snow-on correlating to August, September, and October 2 m air temperatures and to LW↓ in September. November 2 m air temperature is significantly correlated with lake ice freeze, coinciding with when the majority of the lakes in this region freeze, with later freeze through December and January in the southwest coastal regions of Alaska and September freeze through the NSA.
Delayed sea ice freeze is identified throughout the Alaska/Far East Russia region, while there is considerable variability in snow onset and lake ice freeze (Fig. 7a and b). Trends toward later freeze (FOS=6 d median, CICS=8 d) in the Beaufort Sea are consistent with multi-year ice losses and lengthening of the open-water season in this region (Galley et al., 2016). The Chukchi and Bering seas both show trends toward later freeze onset (medianChukchi Sea=8 d and medianBering Sea=27 d) and continuous ice cover (medianChukchi Sea=19 d and medianBering Sea=52 d), with the Bering Sea representing the region with the largest delay in sea ice freeze across the pan-Arctic. During the ice cover season in 2017–2018 the Bering Sea ice extent was lower than any previous winter in the reconstructed or observed record, attributed to warmer sea surface temperatures, delayed freeze, and frequent storms (Thoman et al., 2020). In 2019 the Bering Sea also had extremely low ice cover during the winter and may have acted as a precursor to low-summer-ice conditions in the Chukchi Sea (Perovich et al., 2020). Sea ice did not completely freeze over in the Chukchi Sea until 24 December in 2019 (approximately a month later than average), with only 2007 and 2016 showing similar freeze patterns since satellite observations began in 1979 (Perovich et al., 2020). Strong warming trends observed over the Bering and Chukchi seas from October through January (+1 to +6 ∘C) likely contribute to the delayed freeze detected (Fig. 8j and k), though no significant correlations between FOS or CICS and 2 m temperatures from October to January are identified in this region. First-snow-on trends for Alaska are becoming earlier (median = 5 d), while final snow-on is showing smaller changes (median = 1 d later). The largest trends toward later snow cover are evident in western Alaska, with 3 d later for first snow-on and 22 d later for final snow-on. Wendler et al. (2017) report a 17 % increase in mean snowfall across Alaska from 1946–2014, with the largest increases occurring in west and southwest Alaska. More snowfall here may be tied to warming in this region identified during almost all months from 2004–2019 (Fig. 8), as warmer air is able to sustain more moisture which can thus facilitate increases in precipitation (Thackeray et al., 2019). First snow-on in the NSA region is becoming earlier (median = 21 d), whereas final snow-on shows no change overall due to the mix of earlier and later trends throughout the region. Lake ice within the NSA region shows trends toward earlier freeze (FOL=8 d and CICL=9 d).
Eurasia
Ice returns to the East Siberian, Laptev, and Kara seas from late September through October, while freeze timing extends through the winter into March for some regions of the Barents and Greenland seas. The freeze onset timing is significantly correlated with the December 2 m air temperatures, while LW↓ is significantly correlated with October and February through this broad Eurasian region. Snow first returns to the islands of the Eurasian Arctic in August, with the continental mainland receiving its snow cover predominantly through September and early October (with final-snow-on timing mainly through October). The western regions tend to receive snow later from October into early November, though final snow-on does not typically occur until January in this region. Lakes through eastern and central Eurasia freeze back through October and early November, while the western regions remain mostly ice-free until December or January, with freeze on the large Lake Ladoga typically extending into February (though intermittent or partial ice cover is common here). Mean snow-on and lake ice-on do not show correlations to temperature or LW↓ in this broad region, with the exception of final lake ice freeze in February – though this should be interpreted with caution as only Lake Ladoga experiences final freeze that late in the season and the intermittent and partial ice cover on this lake may affect the mean values.
In Eurasia, sea ice freeze onset is becoming later, though the trends in freeze (Fig. 7a and b) are smaller in magnitude than the trends for sea ice-off (Fig. 6a and b). The later freeze coincides broadly with the regions of earlier ice-off (Fig. 6a and b) where ocean–atmosphere feedbacks will enhance warming through the summer and fall, ultimately delaying freeze (e.g. Stroeve et al., 2014). Warming can be seen over the region from July to November (Fig. 8) and increasing LW↓ in October, as well as in the western portions December (Fig. 9). The strongest trends toward later freeze in this region were identified in the Barents, Kara, and Laptev seas, which is in agreement with trends identified from 2000–2013 showing the strongest freeze onset trends in this region in the Barents/Kara seas followed by the Laptev Sea (Boisvert and Stroeve, 2015; Table 4). Snow-on shows predominantly earlier trends across all regions of Eurasia ranging from 4 to 13 d (medians). Increased fall and early winter snow cover through the eastern portions of Eurasia have been linked to decreasing September sea ice cover in the Pacific sector (Ghatak et al., 2010, 2012), and trends toward increasing snow cover extent in October have been linked to increased moisture transport possible because of the delayed sea ice freeze (Yeo et al., 2017). Lake ice shows similar patterns to snow onset, with earlier freeze detected over the Eurasian regions, with the exception of the Scandinavian/Northern Europe region where freeze onset shows delays of 28 d (median value) and continuous ice cover shows delays of 19 d (median value) later. Large freeze-up anomalies in this region were also identified through previous lake ice research (e.g. Duguay and Brown, 2018); for example the 2017–2018 freeze season showed delayed freeze-up by approximately 2–5 weeks compared to the 2004–2018 mean. Using data from 1890–2015, Karetnikov et al. (2017) show that the number of winters with complete freeze over of Lake Ladoga decreased after 1950 and that the ice season has become shorter. The contrasting trends for delays in freeze onset compared to the earlier snow onset surrounding Lake Ladoga to the north and east also highlight the differences affecting snow-on and ice-on in the freeze season. While the air temperature may be cold enough to sustain a snowfall (first snow-on), the lake water remains warmer through the fall, releasing the stored energy that was absorbed through the extended open-water season, as trends here are toward earlier WCIL through much of the lake. In fact, for final freeze, although no trends were calculated for Lake Ladoga due to the intermittent ice, the region surrounding the lake shows a delay in final snow-on, and the 2 m air temperature for January (Fig. 8a) shows a region of localized warming in the vicinity east of Lake Ladoga and Onega. Whether these localized trends are a direct result of temperature moderation from the lakes or potentially from feedback processes in the ERA5 data is unknown, but as this is in a common downwind direction of the lakes (Kondratyev and Filatov, 1999), it would suggest lake induced temperature moderation as these lakes tend to freeze through January. Ice cover trends for first open water and complete ice cover are not included for Lake Ladoga in this study as a complete ice cover did not form in several of the examined years. Trends for water clear of ice (full open water) and freeze onset (first detection of ice) are detectable and included in Table 3.
This paper examined sea ice, snow, and lake ice phenology across the pan-Arctic using the Interactive Multisensor Snow and Ice Mapping System (IMS) snow and ice products. Using IMS, we were able to examine both long-term snow and ice-on/off trends (1997–2019) at a 24 km spatial resolution, as well as more recent short-term trends in snow and ice phenology (2004–2019) at an improved resolution of 4 km. Our results show that the Arctic is moving toward a longer snow-free and ice-free season, with trends toward earlier snow/ice-off and later freeze detected. Sea ice showed the largest trends toward earlier ice-off and later freeze, with FOWS timing becoming earlier by 7.72 d per decade and CICS becoming later by 10.60 d per decade. Lake ice and snow-off parameters also showed earlier trends, though not as large as those detected for sea ice. Lake ice-off are also showing significant correlations with snow-off and sea ice-off, while no significant correlations were found between any snow/lake ice/sea ice parameters during the freeze season. This likely reflects the strong influence of surface air temperature on snow and ice-off timing, whereas during the freeze season, precipitation patterns play an important role in determining the timing of snow onset, and lake size/volume is an important determinant for freeze timing.
Sea ice in the Canadian Arctic is clearing earlier overall, though regional variability does indicate some regions of later clearing, while during the freeze season, sea ice-on trends are predominantly earlier (11 and 9 d median for first and final ice cover), showing opposite trends compared to other regions across the pan-Arctic. Snow-off and lake ice-off show predominantly earlier trends across North America with some regional exceptions in the east. Snow onset also shows earlier trends across North America, with snow-on trends moving earlier by 4 to 16 d. Lake ice shows a mixed response, with later freeze in the west and earlier freeze in the east – reflective of the cooling air temperature trends over the eastern regions. The largest trends toward earlier sea ice-off were detected in the Alaska/Far East Russia region, with trends toward ice clearing a month later. Snow and lake ice-off timing in this region also shows earlier trends, with some of the largest snow and lake ice trends identified in the Western Alaska region. Delays in sea ice freeze were also observed here (trends of 8 and 14 d later for first and final freeze) with much stronger trends in the Bering Sea region, along with delayed snow onset over land and delayed freeze onset in lakes across most of Alaska. Sea ice on the Eurasian side of the Arctic shows larger trends toward earlier ice-off than later ice-on (roughly a month later ice-off, 1–2 weeks later freeze). No trend in first-snow-off dates was detected in Eurasia, and only a small change toward earlier final snow-off (median = 1 d) was identified, though larger trends toward earlier snow-off were detected in northwest Eurasia compared to the east. Lake ice shows a similar east–west pattern, with Lake Ladoga and Lake Onega showing larger earlier first-open-water trends compared to northeast. In Eurasia the snow cover trends are stronger in the freeze season and predominantly toward earlier snow-on, while later lake freeze occurs on the large lakes. Earlier snowfall occurs through this region and is related to feedbacks from the longer open ocean water; however, the contrast in trends between snow and lake ice here shows that the heat retained in the mixed layer of the lakes through the longer open-water season is enough to delay freeze, despite snow falling earlier in the fall/winter.
Overall, stronger trends toward longer open-water duration on both the northern oceans and lakes are shown compared to the lack of overall trend in snow-free duration (the earlier snow-off trends are offset by the earlier snow-on trends) (Fig. 5). This is in line with stronger Arctic Amplification processes over the Arctic Ocean compared to land (e.g. Miller et al., 2010), with the lower albedo of water allowing for more energy absorption and increased heating than occurs on land. This would apply to lakes as well and is particularly evident in lakes through Alaska with stronger trends toward earlier ice-off and later ice-on compared to snow, as well as in Scandinavia/Northern Europe, where strong opposite trends are shown between later lake ice-on and earlier snow-on. Furthermore, feedbacks related to ocean–atmosphere interactions during the longer open-water season are contributing to earlier snow-on timing in some regions. By examining multiple components of the cryosphere together, we can better understand how warming affects snow and ice cover and how these components are interrelated. As the Arctic continues to experience unprecedented change as a response to increasing temperatures, continuous monitoring of changes in snow and ice cover is essential to improve our understanding of climate variability and changes occurring at not only the pan-Arctic scale but at the regional scale as well.
All datasets used in the study are freely available online and detailed in the methods section.
Project conceptualization and methodology were designed by AAD and LCB, with the formal data analysis carried out by AAD. The original draft was prepared by AAD, with review and editing from both AAD and LCB and revisions by LCB.
The authors declare that they have no conflict of interest.
Publisher's note: Copernicus Publications remains neutral with regard to jurisdictional claims in published maps and institutional affiliations.
Graduate student support for this project has come from the National Science and Engineering Research Council (NSERC Discovery Grant to Laura C. Brown), the Queen Elizabeth II Graduate Scholarship in Science and Technology (QEII-GSST), and the Graduate Expansion Fund (GEF) from the University of Toronto Mississauga. We would also like to thank Stephen Howell and Michael Brady from Environment Canada for their valuable insight and technical support. We also thank the anonymous reviewers for their helpful suggestions that contributed toward the final paper.
This paper was edited by John Yackel and reviewed by three anonymous referees.
Anselin, L.: Local Indicators of Spatial Association – LISA, Geogr. Anal., 27, 93–115, https://doi.org/10.1111/j.1538-4632.1995.tb00338.x, 1995.
Arp, C. D., Jones, B. M., and Grosse, G.: Recent lake ice-out phenology within and among lake districts of Alaska, USA, Limnol. Oceanogr., 58, 2013–2028, https://doi.org/10.4319/lo.2013.58.6.2013, 2013.
Bintanja, R. and Andry, O.: Towards a rain-dominated Arctic, Nat. Clim. Change, 7, 263–267, https://doi.org/10.1038/nclimate3240, 2017.
Bintanja, R. and Selten, F. M.: Future increases in Arctic precipitation linked to local evaporation and sea-ice retreat, Nature, 509, 479–482, https://doi.org/10.1038/nature13259, 2014.
Bliss, A. C. and Anderson, M. R.: Arctic sea ice melt onset timing from passive microwave-based and surface air temperature-based methods, J. Geophys. Res., 123, 9063–9080, https://doi.org/10.1029/2018JD028676, 2018.
Bliss, A. C., Miller, J. A., and Meier, W. N.: Comparison of Passive Microwave-Derived Early Melt Onset Records on Arctic Sea Ice. Remote Sens., 9, 199, https://doi.org/10.3390/rs9030199, 2017.
Bliss, A. C., Steele, M., Peng, G., and Meier, W. N.: Regional variability of Arctic sea ice seasonal change climate indicators from a passive microwave climate data record, Environ. Res. Lett., 14, 045003, https://doi.org/10.1088/1748-9326/aafb84, 2019.
Boisvert, L. N. and Stroeve, J. C.: The Arctic is becoming warmer and wetter as revealed by the Atmospheric Infrared Sounder, Geophys. Res. Lett., 42, 4439–4446, https://doi.org/10.1002/2015GL063775, 2015.
Borchers, H. W.: Package “pracma”, available at: https://cran.r-project.org/web/packages/pracma/pracma.pdf (last access: 4 October 2021), CRAN [code], 2019.
Box, J. E., Colgan, W. T., Christensen, T. R., Schmidt, N. M., Lund, M., Parmentier, F. W., Brown, R., Bhatt, U. S., Euskirchen, E. S., Romanovsky, V. E., Walsh, J. E., Overland, J. E., Wang, M., Corell, R. W., Meier, W. N., Wouters, B., Mernild, S., Mård, J., Pawlak, J., and Olsen, M. S.: Key indicators of Arctic climate change: 1971–2017, Environ. Res. Lett., 14, 045010, https://doi.org/10.1088/1748-9326/aafc1b, 2019.
Bronaugh, D. and Werner, A.: “zyp”, available at: https://cran.r-project.org/web/packages/zyp/zyp.pdf (last access: 4 October 2021), CRAN [code], 2019.
Brown, L. C. and Duguay, C. R.: The fate of lake ice in the North American Arctic, The Cryosphere, 5, 869–892, https://doi.org/10.5194/tc-5-869-2011, 2011.
Brown, L. C. and Duguay, C. R.: Modelling lake ice phenology with sub-grid cell variability, Adv. Meteorol., 2012, 529064, https://doi.org/10.1155/2012/529064, 2012.
Brown, L. C., Howell, S. E., Mortin, J., and Derksen, C.: Evaluation of the Interactive Multisensor Snow and Ice Mapping System (IMS) for monitoring sea ice phenology, Remote Sens. Environ., 147, 65–78, https://doi.org/10.1016/j.rse.2014.02.012, 2014.
Brown, R., Derksen, C., and Wang, L.: Assessment of spring snow cover duration variability over northern Canada from satellite datasets, Remote Sens. Environ., 111, 367–381, https://doi.org/10.1016/j.rse.2006.09.035, 2007.
Brown, R., Derksen, C., and Wang, L.: A multi-data set analysis of variability and change in Arctic spring snow cover extent, 1967–2008, Geophys. Res., 115, D16111, https://doi.org/10.1029/2010JD013975, 2010.
Brubaker, K. L., Pinker, R. T., and Deviatova, E.: Evaluation and comparison of MODIS and IMS snow-cover estimates for the continental United States using station data, J. Hydrometeorol, 6, 1002–1017, 2005.
Callaghan, T. V., Johansson, M., Brown, R. D., Groisman, P. Y., Labba, N., Radionov, V. Barry, R. G., Bulygina, O. N., Essery, R. H. L., Frolov, D. M., Golubev, V. N., Grenfell, T. C., Petrushina, M. N., Razuvaev, V. N., Robinson, D. A., Romanov, P., Shindell, D., Shmakin, A. B., Sokratov, S. A., Warren, S., and Yang, D.: The changing face of Arctic snow cover: a synthesis of observed and projected changes, Ambio, 40, 17–31, https://doi.org/10.1007/s13280-011-0212-y, 2011.
Cavalieri, D. J., Parkinson, C. L., Gloersen, P., Comiso, J. C., and Zwally, H. J.: Deriving long-term time series of sea ice cover from satellite passive-microwave multisensor data sets, J. Geophys. Res., 104, 15803–15814, https://doi.org/10.1029/1999JC900081, 1999.
Chang, A. T. C., Foster, J. L., and Hall, D. K.: Effects of forest on the snow parameters derived from microwave measurements during the BOREAS winter field campaign, Hydrol. Process., 10, 1565–1574, https://doi.org/10.1002/(SICI)1099-1085(199612)10:12<1565::AID-HYP501>3.0.CO;2-5, 1996.
Chen, C., Lakhankar, T., Romanov, P., Helfrich, S., Powell, A., and Khanbilvardi, R.: Validation of NOAA-Interactive Multisensor Snow and Ice Mapping System (IMS) by Comparison with Ground-Based Measurements over Continental United States. Remote Sens., 4, 1134–1145, https://doi.org/10.3390/rs4051134, 2012.
Cho, E., Tuttle, S. E., and Jacobs, J. M.: Evaluating consistency of snow water equivalent retrievals from passive microwave sensors over the north central US: SSM/I vs. SSMIS and AMSR-E vs. AMSR2, Remote Sens., 9, 465, https://doi.org/10.3390/rs9050465, 2017.
Copernicus Climate Change Service (C3S): ERA5: Fifth generation of ECMWF atmospheric reanalyses of the global climate, Copernicus Climate Change Service Climate Data Store (CDS) [data set], 1 September 2020, 2017.
Crawford, A. D., Horvath, S., Stroeve, J., Balaji, R., and Serreze, M. C.: Modulation of sea ice melt onset and retreat in the Laptev Sea by the timing of snow retreat in the West Siberian Plain, J. Geophys. Res., 123, 8691–8707, https://doi.org/10.1029/2018JD028697, 2018.
Dauginis, A. and Brown, L. C.: Sea ice and snow phenology in the Canadian Arctic Archipelago from 1997–2018, Arctic Sci., 7, https://doi.org/10.1139/AS-2020-0024, 2020.
Derksen, C.: The contribution of AMSR-E 18.7 and 10.7 GHz measurements to improved boreal forest snow water equivalent retrievals, Remote Sens. Environ., 112, 2701–2710, https://doi.org/10.1016/j.rse.2008.01.001, 2008.
Derksen, C., Brown, R., and Walker, A.: Merging conventional (1915–92) and passive microwave (1978–2002) estimates of snow extent and water equivalent over central North America, J. Hydrometeor., 5, 850–861, https://doi.org/10.1175/1525-7541(2004)005<0850:MCAPME>2.0.CO;2, 2004.
Derksen, C., Smith, S. L., Sharp M., Brown, L., Howell, S., Copland, L., Mueller, D., Gauthier, Y., Fletcher, C., Tivy, A., Bernier, M., Bourgeois, J., Brown, R., Burn, C. R., Duguay, C., Kushner, P., Langlois, A., Lewkowicz, A.G., Royer, A., and Walker, A.: Variability and Change in the Canadian Cryosphere, Clim. Change, 115, 59–88, https://doi.org/10.1007/s10584-012-0470-0, 2012.
Derksen, C., Burgess, D., Duguay, C., Howell, S., Mudryk, L., Smith, S., Thackeray, C., and Kirchmeier-Young, M.: Changes in snow, ice, and permafrost across Canada, Chapter 5, in: Canada's Changing Climate Report, edited by: Bush, E. and Lemmen, D. S., Government of Canada, Ottawa, Ontario, 194–260, 2019.
Druckenmiller, M. L. and Richter-Menge, J.: Overview, in: State of the Climate in 2019, B. Am. Meteorol. Soc., 101, S245–S246, https://doi.org/10.1175/BAMS-D-20-0086.1, 2020.
Du, J., Kimball, J. S., Duguay, C., Kim, Y., and Watts, J. D.: Satellite microwave assessment of Northern Hemisphere lake ice phenology from 2002 to 2015, The Cryosphere, 11, 47–63, https://doi.org/10.5194/tc-11-47-2017, 2017.
Duguay, C. and Brown, L.: Lake Ice, in: Arctic Report Card 2018, available at: https://arctic.noaa.gov/Report-Card/Report-Card-2018/ArtMID/7878/ArticleID/785/Lake-Ice (last access: 4 October 2021), 2018.
Duguay, C., Brown, L., Kang, K., and Kheyrollah Pour, H.: [The Arctic] Lake Ice, in: State of the Climate 2011, B. Am. Meteorol. Soc., 93, S138–S140, https://doi.org/10.1175/2012BAMSStateoftheClimate.1, 2012.
Duguay, C., Brown, L., Kang, K.-K., and Kheyrollah Pour, H.: [The Arctic] Lake ice, in: State of the Climate in 2012, B. Am. Meteorol. Soc., 94, S124–S126, https://doi.org/10.1175/2013BAMSStateoftheClimate.1, 2013.
Duguay, C., Brown, L., Kang, K.-K., and Kheyrollah Pour, H.: [The Arctic] Lake ice, in: State of the Climate in 2013, B. Am. Meteorol. Soc., 95, 138, https://doi.org/10.1175/2014BAMSStateoftheClimate.1, 2014.
Duguay, C. R., Prowse, T. D., Bonsal, B. R., Brown, R. D., Lacroix, M. P., and Ménard, P.: Recent trends in Canadian lake ice cover, Hydrol. Process., 20, 781–801, 2006.
Duguay, C., Brown, L., Kang, K.-K., and Kheyrollah Pour, H.: [The Arctic] Lake ice, in: State of the Climate in 2014, B. Am. Meteorol. Soc., 96, S144–S145, https://doi.org/10.1175/2015BAMSStateoftheClimate.1, 2015.
Filatov, N., Baklagin, V., Efremova, T., Nazarova, L., and Palshin, N.: Climate change impacts on the watersheds of Lakes Onego and Ladoga from remote sensing and in situ data, Inland Waters, 9, 130–141, https://doi.org/10.1080/20442041.2018.1533355, 2019.
Foster, J. L., Sun, C., Walker, J. P., Kelly, R., Chang, A., Dong, J., and Powell, H.: Quantifying the uncertainty in passive microwave snow water equivalent observations, Remote Sens. Environ., 94, 187–203, https://doi.org/10.1016/j.rse.2004.09.012, 2005.
Frei, A. and Lee, S.: A comparison of optical-band based snow extent products during spring over North America, Remote Sens. Environ., 114, 1940–1948, 2010.
Galley, R. J., Babb, D., Ogi, M., Else, B. G. T., Geilfus, N.-X., Crabeck, O., Barber, D. G., and Rysgaard, S.: Replacement of multiyear sea ice and changes in the open water season duration in the Beaufort Sea since 2004, J. Geophys. Res. Lett., 121, 1806–1823, https://doi.org/10.1002/2015JC011583, 2016.
Ghatak, D., Frei A., Gong, G., Stroeve, J., and Robinson, D.: On the emergence of an Arctic amplification signal in terrestrial Arctic snow extent, J. Geophys. Res., 115, D24105, https://doi.org/10.1029/2010JD014007, 2010.
Ghatak, D., Deser C., Frei, A., Gong, G., Phillips, A., Robinson, D. A., and Stroeve, J.: Simulated Siberian snow cover response to observed Arctic sea ice loss, 1979–2008, J. Geophys. Res., 117, D23108, https://doi.org/10.1029/2012JD018047, 2012.
Graham, R. M., Hudson, S. R., and Maturilli, M.: Improved performance of ERA5 in Arctic gateway relative to four global atmospheric reanalyses, Geophys. Res. Lett., 46, 6138–6147, https://doi.org/10.1029/2019GL082781, 2019.
Hauke, J. and Kossowski, T.: Comparison of values of Pearson's and Spearman's correlation coefficients on the same sets of data, Quaestiones Geographicae, 30, 87–93, https://doi.org/10.2478/v10117-011-0021-1, 2011.
Helfrich, S. R., McNamara, D., Ramsay, B. H., Baldwin, T., and Kasheta, T.: Enhancements to, and forthcoming developments in the Interactive Multisensor Snow and Ice Mapping System (IMS), Hydrol. Process., 21, 1576–1586, https://doi.org/10.1002/hyp.6720, 2007.
Hernandez-Henriquez, M. A., Déry, S. J., and Derksen, C.: Polar amplification and elevation-dependence in trends of Northern Hemisphere snow cover extent, 1971–2014, Environ. Res. Lett., 10, 044010, https://doi.org/10.1088/1748-9326/10/4/044010, 2015.
Hersbach, H., Bell, B., Berrisford, P., Hirahara, S., Horányi, A., Muñoz-Sabater, J., Nicolas, J., Peubey, C., Radu, R., Schepers, D., Simmons, A., Soci, C., Abdalla, S., Abellan, X., Balsamo, G., Bechtold, P., Biavati, G., Bidlot, J., Bonavita, M., De Chiara, G., Dahlgren, P., Dee, D., Diamantakis, M., Dragani, R., Flemming, J., Forbes, R., Fuentes, M., Geer, A., Haimberger, L., Healy, S., Hogan, R.J., Hólm, E., Janisková, M., Keeley, S., Laloyaux, P., Lopez, P., Lupu, C., Radnoti, G., De Rosnay, P., Rozum, I., Vamborg, F., Villaume, S., and Thépaut, J. N.: The ERA5 global reanalysis, Q. J. Roy. Meteor. Soc., 146, 1999–2049, https://doi.org/10.1002/qj.3803, 2020.
Howell, S. E. and Brady, M.: The dynamic response of sea ice to warming in the Canadian Arctic Archipelago, Geophys. Res. Lett., 46, 13119–13125, https://doi.org/10.1029/2019GL085116, 2019.
Howell, S. E., Tivy, A., Yackel, J. J., and Scharien, R. K.: Application of a SeaWinds/QuikSCAT sea ice melt algorithm for assessing melt dynamics in the Canadian Arctic Archipelago, J. Geophys. Res., 111, C07025, https://doi.org/10.1029/2005JC003193, 2006.
Howell, S. E., Duguay, C. R., and Markus, T.: Sea ice conditions and melt season duration variability within the Canadian Arctic Archipelago: 1979–2008, Geophys. Res. Lett., 36, L10502, https://doi.org/10.1029/2009GL037681, 2009.
Howell, S. E. L, Small, D., Rohner, C., Mahmud, M. S., Yackel, J. J., and Brady, M.: Estimating melt onset over Arctic sea ice from time series multi-sensor Sentinel-1 and RADARSAT-2 backscatter, Remote Sens. Environ., 229, 48–59, https://doi.org/10.1016/j.rse.2019.04.031, 2019.
Johannessen, O. M., Kuzmina, S. I., Bobylev, L. P., and Miles, M. W.: Surface air temperature variability and trends in the Arctic: new amplification assessment and regionalisation, Tellus A, 68, 28234, https://doi.org/10.3402/tellusa.v68.28234, 2016.
Johnson, M. and Eicken, H.: Estimating Arctic sea-ice freeze-up and break-up from the satellite record: A comparison of different approaches in the Chukchi and Beaufort Seas, Elem. Sci. Anth., 4, https://doi.org/10.12952/journal.elementa.000124, 2016.
Karetnikov, S., Leppäranta, M., and Montonen, A.: A time series of over 100 years of ice seasons on Lake Ladoga, J. Great Lakes Res., 43, 979–988, https://doi.org/10.1016/j.jglr.2017.08.010, 2017.
Key, J. and Schweiger, A. J.: Tools for atmospheric radiative transfer: Streamer and FluxNet, Comput. Geosci., 24, 443–451, 1998.
Key, J., Wang, X., Liu, Y., Dworak, R., and Letterly, A.: The AVHRR Polar Pathfinder Climate Data Records, Remote Sens.,, 8, 167, https://doi.org/10.3390/rs8030167, 2016.
Key, J., Wang, X., Liu, Y., and NOAA CDR Program: NOAA Climate Data Record of AVHRR Polar Pathfinder Extended (APP-X), Version 2. 2004–2019, NOAA National Centers for Environmental Information [data set], https://doi.org/10.25921/AE96-0E57, 2019.
Kondratyev, K. Ya. and Filatov, N.: Limnology and Remote Sensing: A Contemporary Approach, Springer-Verlag, London, 406, 1999.
Kuusisto, E.: Trends of breakup dates in Finnish lakes in 1963–2014, in: 20th International Northern Research Basins Symposium and Workshop Kuusamo, Finland, 16–21 August 2015, 35, 2015.
Lehnherr, I., Louis, V. L. S., Sharp, M., Gardner, A. S., Smol, J. P., Schiff, S. L., Muir, D. C., Mortimer, C. A., Michelutti, N., Tarnocai, C., and Pierre, K. A. S.: The world's largest High Arctic lake responds rapidly to climate warming, Nat. Commun., 9, 1290, https://doi.org/10.1038/s41467-018-03685-z, 2018.
Lemke, P., Ren, J., Alley, R. B., Allison, I., Carrasco, J., Flato, G., Fujii, Y., Kaser, G., Mote, P., Thomas, R. H., and Zhang, T.: Observations: changes in snow, ice and frozen ground, in: Climate Change 2007: The Physical Science Basis. Contribution of Working Group I to the Fourth Assessment Report of the Intergovernmental Panel on Climate Change, edited by: Solomon, S., Qin, D., Manning, M., Chen, Z., Marquis, M., Averyt, K. B., Tignor, M., and Miller, H. L., Cambridge University Press, Cambridge, United Kingdom and New York, NY, USA, 2007.
Ludwig, V., Spreen, G., Haas, C., Istomina, L., Kauker, F., and Murashkin, D.: The 2018 North Greenland polynya observed by a newly introduced merged optical and passive microwave sea-ice concentration dataset, The Cryosphere, 13, 2051–2073, https://doi.org/10.5194/tc-13-2051-2019, 2019.
Lynch, A. H., Serreze, M. C., Cassano, E. N., Crawford, A. D., and Stroeve, J.: Linkages between Arctic summer circulation regimes and regional sea ice anomalies, J. Geophys. Res., 121, 7868–7880, https://doi.org/10.1002/2016JD025164, 2016.
Mahmud, M. S., Howell, S. E., Geldsetzer, T., and Yackel, J.: Detection of melt onset over the northern Canadian Arctic Archipelago sea ice from RADARSAT, 1997–2014, Remote Sens. Environ., 178, 59–69, https://doi.org/10.1016/j.rse.2016.03.003, 2016.
Marshall, S., Scott, K. A., and Scharien, R. K.: Passive Microwave Melt Onset Retrieval Based on a Variable Threshold: Assessment in the Canadian Arctic Archipelago, Remote Sens., 11, 1304, https://doi.org/10.3390/rs11111304, 2019.
Meier, W.: Comparison of passive microwave ice concentration algorithm retrievals with AVHRR imagery in arctic peripheral seas, IEEE T. Geosci. Remote, 43, 1324–1337, https://doi.org/10.1109/TGRS.2005.846151, 2005.
Melling, H.: Sea ice of the northern Canadian Arctic Archipelago, J. Geophys. Res., 107, 2–1, https://doi.org/10.1029/2001JC001102, 2002.
Miller, G. H., Alley, R. B., Brigham-Grette, J., Fitzpatrick, J. J., Polyak, L., Serreze, M. C., and White, J. W. C.: Arctic amplification: can the past constrain the future?, Quaternary Sci. Rev., 29, 1779–1790, https://doi.org/10.1016/j.quascirev.2010.02.008, 2010.
Moore, G. W. K., Howell, S. E. L., Brady, M., Xu, X., and McNeil, K.: Anomalous collapses of Nares Strait ice arches leads to enhanced export of Arctic sea ice, Nat. Commun., 12, 1, https://doi.org/10.1038/s41467-020-20314-w, 2021.
Mortin, J., Howell, S. E., Wang, L., Derksen, C., Svensson, G., Graversen, R. G., and Schrøder, T. M.: Extending the QuikSCAT record of seasonal melt–freeze transitions over Arctic sea ice using ASCAT, Remote Sens. Environ., 141, 214–230, https://doi.org/10.1016/j.rse.2013.11.004, 2014.
Mortin, J., Svensson, G., Graversen, R. G., Kapsch, M. L., Stroeve, J. C., and Boisvert, L. N.: Melt onset over Arctic sea ice controlled by atmospheric moisture transport, Geophys. Res. Lett., 43, 6636–6642, https://doi.org/10.1002/2016GL069330, 2016.
Mudryk, L. R., Derksen, C., Kushner, P. J., and Brown, R.: Characterization of Northern Hemisphere Snow Water Equivalent Datasets, 1981–2010, J. Climate, 28, 8037–8051, https://doi.org/10.1175/JCLI-D-15-0229.1, 2015.
Mudryk, L. R., Derksen, C., Howell, S., Laliberté, F., Thackeray, C., Sospedra-Alfonso, R., Vionnet, V., Kushner, P. J., and Brown, R.: Canadian snow and sea ice: historical trends and projections, The Cryosphere, 12, 1157–1176, https://doi.org/10.5194/tc-12-1157-2018, 2018.
Murfitt, J. and Brown, L. C.: Lake Ice and Temperature Trends for Ontario and Manitoba: 2001 to 2014, Hydrol. Process., 31, 3596–3609, https://doi.org/10.1002/hyp.11295, 2017.
Nitze, I., Grosse, G., Jones, B. M., Arp, C. D., Ulrich, M., Fedorov, A., and Veremeeva, A.: Landsat-based trend analysis of lake dynamics across northern permafrost regions, Remote Sens., 9, 640, https://doi.org/10.3390/rs9070640, 2017.
Onarheim, I. H., Eldevik, T., Smedsrud, L. H., and Stroeve, J. C.: Seasonal and regional manifestation of Arctic sea ice loss, J. Climate, 31, 4917–4932, https://doi.org/10.1175/JCLI-D-17-0427.1, 2018.
Overland, J. E.: Less climatic resilience in the arctic Weather, Clim. Extremes, 30, 100275, https://doi.org/10.1016/j.wace.2020.100275, 2020.
Park, H., Yabuki, H., and Ohata, T.: Analysis of satellite and model datasets for variability and trends in Arctic snow extent and depth, 1948–2006, Polar Sci., 6, 23–37, https://doi.org/10.1016/j.polar.2011.11.002, 2012.
Perovich, D., Meier, W., Tschudi, M., Wood, K., Farrell, S., Hendricks, S., Gerland, S., Kaleschke, L., Ricker, R., Tian-Kunze, X., and Webster, M.: Sea ice, in: State of the Climate in 2019, B. Am. Meteorol. Soc., 101, S251–S256, https://doi.org/10.1175/BAMS-D-20-0086.1, 2020.
Pizzolato, L., Howell, S. E., Derksen, C., Dawson, J., and Copland, L.: Changing sea ice conditions and marine transportation activity in Canadian Arctic waters between 1990 and 2012, Clim. Change, 123, 161–173, https://doi.org/10.1007/s10584-013-1038-3, 2014.
Pulliainen, J., Luojus, K., Derksen, C., Mudryk, L., Lemmetyinen, J., Salminen, M., Ikonen, J., Takala, M., Cohen, J., Smolander, T., and Norberg, J.: Patterns and trends of Northern Hemisphere snow mass from 1980 to 2018, Nature, 581, 294–298, https://doi.org/10.1038/s41586-020-2258-0, 2020.
Rahmstorf, S.: A new view on sea level rise, Nat. Clim. Change, 4, 44–45, https://doi.org/10.1038/climate.2010.29, 2010.
Ramsay, B. H.: The interactive multisensor snow and ice mapping system, Hydrol. Process., 12, 1537–1546, https://doi.org/10.1002/(SICI)1099-1085(199808/09)12:10/11<1537::AID-HYP679>3.0.CO;2-A, 1998.
Serreze, M. C. and Stroeve, J.: Arctic sea ice trends, variability and implications for seasonal ice forecasting, Philos. T. R. Soc. A., 373, 20140159, https://doi.org/10.1098/rsta.2014.0159, 2015.
Stroeve, J. and Notz, D.: Changing state of Arctic sea ice across all Seasons, Environ. Res. Lett., 13, 103001, https://doi.org/10.1088/1748-9326/aade56, 2018.
Stroeve, J. C., Markus, T., Boisvert, L., Miller, J., and Barrett, A.: Changes in Arctic melt season and implications for sea ice loss, Geophys. Res. Lett., 41, 1216–1225, https://doi.org/10.1002/2013GL058951, 2014.
Stroeve, J. C., Crawford, A. D., and Stammerjohn, S: Using timing of ice retreat to predict timing of fall freeze‐up in the Arctic, Geophys. Res. Lett., 43, 6332–6340, https://doi.org/10.1002/2016GL069314, 2016.
Surdu, C. M., Duguay, C. R., Brown, L. C., and Fernández Prieto, D.: Response of ice cover on shallow lakes of the North Slope of Alaska to contemporary climate conditions (1950–2011): radar remote-sensing and numerical modeling data analysis, The Cryosphere, 8, 167–180, https://doi.org/10.5194/tc-8-167-2014, 2014.
Surdu, C. M., Duguay, C. R., and Fernández Prieto, D.: Evidence of recent changes in the ice regime of lakes in the Canadian High Arctic from spaceborne satellite observations, The Cryosphere, 10, 941–960, https://doi.org/10.5194/tc-10-941-2016, 2016.
Tedesco, M., Derksen, C., Deems, J. S., and Foster, J. L: Remote sensing of the cryosphere: Remote sensing of snow depth and snow water equivalent: 1st edn., John Wiley & Sons, Ltd, UK, https://doi.org/10.1002/9781118368909.ch5, 2015.
Thackeray, C. W., Derksen, C., Fletcher, C. G., and Hall, A.: Snow and climate: Feedbacks, drivers, and indices of change, Curr. Clim. Change Rep., 5, 322–333, https://doi.org/10.1007/s40641-019-00143-w, 2019.
Thoman, R. L., Bhatt, U. S., Bieniek, P. A., Brettschneider, B. R., Brubaker, M., Danielson, S. L., Labe, Z., Lader, R., Meier, W. N., Sheffield, G., and Walsh, J. E.: The record low Bering Sea ice extent in 2018, in: Context, impacts, and an assessment of the role of anthropogenic climate change in Explaining extreme events of 2018 from a climate perspective, B. Am. Meteorol. Soc. 101, 53–59, https://doi.org/10.1175/BAMS-D-19-0175.1, 2020.
U.S. National Ice Center: IMS Daily Northern Hemisphere Snow and Ice Analysis at 1 km, 4 km, and 24 km Resolutions, Version 1, 2 & 3, 1998–2019. Boulder, Colorado USA, NSIDC: National Snow and Ice Data Center [data set], https://doi.org/10.7265/N52R3PMC (last access: May 2021), 2008, updated daily.
Vincent, L. A., Zhang, X., Brown, R. D., Feng, Y., Mekis, E., Milewska, E. J., Wan, H., and Wang, X. L.: Observed trends in Canada's climate and influence of low-frequency variability modes, J. Climate, 28, 4545–4560, https://doi.org/10.1175/JCLI-D-14-00697.1, 2015.
Wang, C., Graham, R. M., Wang, K., Gerland, S., and Granskog, M. A.: Comparison of ERA5 and ERA-Interim near-surface air temperature, snowfall and precipitation over Arctic sea ice: effects on sea ice thermodynamics and evolution, The Cryosphere, 13, 1661–1679, https://doi.org/10.5194/tc-13-1661-2019, 2019.
Wang, L., Wolken, G. J., Sharp, M. J., Howell, S. E. L., Derksen, C., Brown, R. D., Markus, T., and Cole, J.: Integrated pan-Arctic melt onset detection from satellite active and passive microwave measurements, 2000–2009, J. Geophys. Res., 116, D22103, https://doi.org/10.1029/2011JD016256, 2011.
Wendler, G., Gordon, T., and Stuefer, M.: On the precipitation and precipitation change in Alaska, Atmosphere, 8, 253, https://doi.org/10.3390/atmos8120253, 2017.
Yackel, J. J., Barber, D. G., Papakyriakou, T. N., and Breneman, C.: First-year sea ice spring melt transitions in the Canadian Arctic Archipelago from time-series synthetic aperture radar data, 1992–2002, Hydrol. Process., 21, 253–265, 2007.
Yeo, S. R., Kim, W., and Kim, K. Y.: Eurasian snow cover variability in relation to warming trend and Arctic Oscillation, Clim. Dynam., 48, 499–511, https://doi.org/10.1007/s00382-016-3089-4, 2017.
Young, K. L., Brown, L., and Labine, C.: Snow cover variability at Polar Bear Pass, Nunavut, Arct. Sci., 4, 669–690, https://doi.org/10.1139/as-2017-0016, 2018.
Zhang, X., Vincent, L. A., Hogg, W. D., and Niitsoo, A.: Temperature and precipitation trends in Canada during the 20th century, Atmos.-Ocean, 38, 395–429, https://doi.org/10.1080/07055900.2000.9649654, 2000.
Zheng, J., Geldsetzer, T., and Yackel, J.: Snow thickness estimation on first-year sea ice using microwave and optical remote sensing with melt modelling, Remote Sens. Environ., 199, 321–332, https://doi.org/10.1016/j.rse.2017.06.038, 2017.
Zhu, J., Tan, S., King, J., Derksen, C., Lemmetyinen, J., and Tsang, L.: Forward and inverse radar modeling of terrestrial snow using SnowSAR data, IEEE Geosci. Remote, 56, 7122–7132, https://doi.org/10.1109/TGRS.2018.2848642, 2018.