the Creative Commons Attribution 4.0 License.
the Creative Commons Attribution 4.0 License.
 | 03 Sep 2021
Impacts of the photo-driven post-depositional processing on snow nitrate and its isotopes at Summit, Greenland: a model-based study
Zhuang Jiang
Becky Alexander
Joel Savarino
Joseph Erbland
Atmospheric information embedded in ice-core nitrate is disturbed by post-depositional processing. Here we used a layered snow photochemical column model to explicitly investigate the effects of post-depositional processing on snow nitrate and its isotopes (δ15N and Δ17O) at Summit, Greenland, where post-depositional processing was thought to be minimal due to the high snow accumulation rate. We found significant redistribution of nitrate in the upper snowpack through photolysis, and up to 21 % of nitrate was lost and/or redistributed after deposition. The model indicates post-depositional processing can reproduce much of the observed δ15N seasonality, while seasonal variations in δ15N of primary nitrate are needed to reconcile the timing of the lowest seasonal δ15N. In contrast, post-depositional processing can only induce less than 2.1 ‰ seasonal Δ17O change, much smaller than the observation (9 ‰) that is ultimately determined by seasonal differences in nitrate formation pathway. Despite significant redistribution of snow nitrate in the photic zone and the associated effects on δ15N seasonality, the net annual effect of post-depositional processing is relatively small, suggesting preservation of atmospheric signals at the annual scale under the present Summit conditions. But at longer timescales when large changes in snow accumulation rate occur this post-depositional processing could become a major driver of the δ15N variability in ice-core nitrate.
- Article
(1460 KB) - Full-text XML
-
Supplement
(840 KB) - BibTeX
- EndNote


Nitrate () is one of the most abundant and commonly measured species in ice cores. One of the major subjects of ice-core nitrate studies involves its oxygen isotope mass-independent fractionation signal (), which is a proxy of atmospheric oxidation capacity (Alexander and Mickley, 2015; Alexander et al., 2004; Geng et al., 2017). Ice-core records have also been studied, but the interpretation remains immature and sometimes conflicting (Freyer et al., 1996; Geng et al., 2014a, 2015; Hasting et al., 2005, 2009). There are many factors, e.g., NOx sources, atmospheric chemistry and transport, deposition, and post-depositional processing of nitrate, affecting ice-core nitrate and its isotopes (Geng et al., 2014a, 2015; Hastings et al., 2004, 2005; Morin et al., 2008; Wolff et al., 2008).
Deposition of atmospheric nitrate to snow is not irreversible. The ultimate source of snow nitrate in the polar regions is from tropospheric long-range transport and stratospheric denitrification (Goto-Azuma and Koerner, 2001; Legrand and Delmas, 1986), which can be termed as primary nitrate (Fpri) (Erbland et al., 2013). After deposition, nitrate undergoes post-depositional processing which causes changes in its concentration and isotopes (Blunier et al., 2005; Erbland et al., 2013; Frey et al., 2009). Post-depositional processing of snow nitrate includes physical release (i.e., desorption and evaporation) and ultraviolet photolysis. Both processes result in loss of snow nitrate and isotope fractionations of nitrogen and oxygen. However, laboratory experiments and model calculations indicate a minor influence of the physical processes, with photolysis dominating post-depositional processing (Berhanu et al., 2014; Erbland et al., 2013; Frey et al., 2009; Zatko et al., 2016).
Snow nitrate photolysis occurs when it is exposed to sunlight at wavelengths less than 345 nm (Chu and Anastasio, 2003). The dominant photolysis product is NO2, which is effectively transported to the overlying atmosphere via diffusion or wind pumping (Zatko et al., 2013) and impacts the local atmospheric oxidation environment (Thomas et al., 2012). The released NO2 can reform HNO3 (i.e., the snow-sourced nitrate hereafter) in the overlaying atmosphere, which is then redeposited to or exported from the site of photolysis. The above-mentioned processes form a cycle of nitrate between the air–snow interface, resulting in the redistribution of nitrate in snowpack.
The photolysis also causes isotope fractionation. The isotope fractionation factors (εp) associated with snow nitrate photolysis are ‰ and −34 ‰ for δ15N and δ18O, respectively, for local conditions at Dome C, East Antarctica (Berhanu et al., 2014; Blunier et al., 2005; Frey et al., 2009). These large negative values indicate the photolysis would enrich nitrate remaining in snow with heavier isotopes (i.e., 15N and 18O). In comparison, in snow will not be directly disturbed by photolysis. However, part of the photoproduct can undergo recombination reactions within snow grains to reform nitrate (i.e., the cage effect) (McCabe et al., 2005; Meusinger et al., 2014). This process results in exchanges in oxygen atoms with snow and decreasing and . In addition, once the photoproduct NO2 is released to the overlying atmosphere, it is rapidly converted to nitrate and carries different values from its precursors. These isotope effects have been documented in multiple snowpack studies on the East Antarctic Plateau, with increasing δ15N and decreasing with depth (Erbland et al., 2013; Frey et al., 2009; Shi et al., 2015).
The degree of post-depositional processing and the induced effects on snow nitrate and isotopes vary site by site, depending on several factors including actinic flux, snow properties (e.g., density, light-absorbing impurities, specific surface area) and snow accumulation rate (Zatko et al., 2013). Actinic flux describes the light intensity reaching the snow surface, while snow properties determine the penetration of light in snow. Actinic flux decreases exponentially from the snow surface, and the depth of the snow photic zone is defined as 3 times the e-folding depth of the actinic flux (Erbland et al., 2013). Snow accumulation rate determines the residence time of nitrate in the photic zone where photolysis occurs, and thus at sites with high snow accumulation rate the degree of post-depositional processing will be limited (Erbland et al., 2013; Noro et al., 2018; Shi et al., 2015).
Summit, Greenland, is a typical high snow accumulation site (250 ; Dibb and Fahnestock, 2004), where snowpack and ice-core nitrate isotope records have been studied, but the interpretation of δ15N remains conflicting (Geng et al., 2014a, 2015; Hastings et al., 2005, 2009). Hastings et al. (2005) proposed the glacial–interglacial δ15N difference observed in the GISP2 ice core was due to changes in NOx source strengths despite the fact that there is no known NOx source carrying high enough δ15N to explain the glacial δ15N value (28.4±1.1 ‰). In contrast, Geng et al. (2015) concluded that changes in the degree of post-depositional processing between the glacial and interglacial climates can explain the more enriched δ15N in the glacial period. On seasonal timescales, there are also distinct variations in nitrate δ15N and Δ17O at Summit (Geng et al., 2014b; Hastings et al., 2004; Jarvis et al., 2009; Kunasek et al., 2008). The seasonality of δ15N was originally attributed to variations in NOx sources (Hastings et al., 2004), and the Δ17O was suggested to be mainly caused by changes in atmospheric nitrate formation pathways (Kunasek et al., 2008). However, the effect of post-depositional processing on seasonal δ15N variation was not thoughtfully examined by Hastings et al. (2004). Two later studies by Fibiger et al. (2013, 2016) examined nitrate isotopes in the atmosphere and surface snow (<3 cm depth) at Summit to investigate the effects of post-depositional processing, and they concluded that the effects of post-depositional processing on nitrate isotope preservation is negligible. These studies, however, relied only on surface snow samples and did not cover a full year of nitrate deposition. The snow photic zone at Summit is 30 to 40 cm deep (Galbavy et al., 2007), and thus surface snow samples cannot readily reflect the full degree of post-depositional processing as the effects increase with time in the snow photic zone and thus depth. In particular, Fibiger et al. (2013) used the observed linear relationship between surface snow and to exclude the effects of post-depositional processing on nitrate isotopes at Summit, Greenland. This approach is flawed as neither nor is a good indicator of post-depositional processing because the oxygen isotopes are mainly controlled by atmospheric processes (Alexander et al., 2020; Kunasek et al., 2008). This is why a strong linear relationship between and is observed in atmospheric and surface snow samples at Dome C, Antarctica, where severe post-depositional processing of nitrate occurs (Erbland et al., 2013; Frey et al., 2009). At sites with extremely low snow accumulation rates (e.g., Dome C and Dome A in Antarctica) the cage effect would cause apparent changes in and in samples at depth but not at the surface (Erbland et al., 2013; Shi et al., 2015).
Given the distinct seasonal differences in actinic flux in the polar regions including Summit, Greenland, seasonal differences in the degree of post-depositional processing and its effects on snow nitrate isotopes should be examined. In fact, observations at Summit indicate that δ15N in surface snow nitrate is negative during most of the year with an annual mean of ‰ (Jarvis et al., 2009), while in bulk snowpack (0 to 1 m) the annual mean δ15N is 0±2.4 ‰ (Jarvis et al., 2009) and 0±6.3 ‰ (Geng et al., 2014b). During spring and summer when snow photochemistry is most active, δ15N in surface snow is ‰, while in snowpack (average of two springs at depths of 0.15 and 0.9 m) is 5.6±1.8 ‰. These differences between nitrate at the surface and at depth suggest enrichment in nitrate δ15N after deposition and recycling at the surface, and they are consistent with the known isotope effects of post-depositional processing. In addition, Burkhart et al. (2004) and Dibb et al. (2007) have observed <7 % to 25 % loss of nitrate after deposition at Summit. This is close to the estimate of 16 %–23 % loss based on ice-core (Geng et al., 2015). These results are also qualitatively consistent with the observations of NO2 and HONO fluxes from snowpack at Summit which were attributed to snow nitrate photolysis (Dibb et al., 2002; Honrath et al., 2002). The spatial variations in the photo-driven nitrate recycling at the air–snow interface and its impact on snow in Greenland have been studied by Zatko et al. (2016) using a global 3-D chemical transport model (GEOS-Chem). Their model captures the increasing trend in snow from the coast to inland as snow accumulation rate decreases, which enhances the degree of post-depositional processing. This is consistent with field studies of snow nitrate in West Greenland (Curtis et al., 2018). But the model treated snowpack as a whole and did not specify the behaviors of nitrate at different depths in the photic zone, and it cannot distinguish seasonal differences. In addition, it did not incorporate isotope fractionation associated with photolysis but instead using a fixed fractionation constant and a Rayleigh fractionation model to calculate the changes in isotope with mass loss.
In order to investigate the impacts of snow nitrate photolysis on the preservation of nitrate and its isotopes on the seasonal timescale at Summit, Greenland, we used a snow photochemical column model to simulate the recycling of nitrate at the air–snow interface. We use the model to quantify to what degree the magnitude of the observed seasonality of nitrate isotopes at Summit can be explained by post-depositional processing. The model was built to explicitly investigate the loss of snow nitrate due to photolysis and quantify the induced isotope effects with layer specific calculations (i.e., changes in δ15N and Δ17O after deposition). A comparison of the model results with observations should add insight into the preservation of nitrate at high snow accumulation sites and shed light on the interpretation of ice-core nitrate and its isotopes.
TRANSITS (TRansfer of Atmospheric Nitrate Stable Isotopes To the Snow) is a multi-layer, 1-D model that simulates nitrate recycling at the air–snow interface and its preservation in snow including its isotopes (Erbland et al., 2015). The model divides a year into 52 time steps (i.e., weekly resolution), and at each step the snowpack is divided into 1 mm layers in which photolysis of nitrate is calculated according to the depth-dependent actinic flux and nitrate concentration. The produced NO2 is transported to the overlying atmosphere where it is re-oxidized to nitrate. At the next time step, a portion of the reformed nitrate together with primary nitrate originating from long-range transport is deposited onto the snow surface. When snowfall occurs, the snowpack moves down, and the newly deposited snow is immediately re-divided into 1 mm layers. Nitrate is considered as archived once it is buried below the photic zone.
At each step, the model also calculates the isotope effects. In the model, nitrogen isotope fractionation mainly occurs during the photolysis with a wavelength-sensitive fractionation constant εp, and another fractionation occurs during nitrate deposition with a fractionation constant εd. The oxygen isotope effect is only calculated for Δ17O, which is caused by (1) exchange of oxygen atoms with water during the photolysis (i.e., the cage effect) and (2) local atmospheric NO–NO2 cycling and the subsequent conversion of NO2 to HNO3.
To run the model, actinic flux and its e-folding depth in snowpack, snow accumulation rate, and other atmospheric properties including the boundary layer height, surface ozone and HOx concentrations are needed. Additional model inputs are the flux of primary nitrate from long-range transport and its isotopic composition (i.e., δ15N and Δ17O). In this study we focus on the seasonal changes in isotopes caused by post-depositional processing, making the results independent of δ15N and Δ17O of primary nitrate.
In this study, we run the model from the year 2004 to 2007 constrained by local observations at Summit. The modeled snow nitrate concentration and isotope profiles were compared with observations in Geng et al. (2014b).
2.1 Model inputs
2.1.1 Atmospheric characterizations
The overlying atmosphere at Summit was assumed to be a 1-D box with a constant boundary layer height of 156 m (Cohen et al., 2007), where primary and the snow-sourced nitrate are assumed to be well mixed. Weekly air temperature, pressure, surface ozone concentration and total column ozone (TCO) at Summit were obtained from the NOAA ozonesonde dataset (https://gml.noaa.gov/aftp/ozwv/Ozonesonde/, last access: 1 September 2021). Concentrations of local atmospheric oxidants including O3, OH, peroxyl radicals and BrO are needed to calculate the cycling of NO–NO2 and the conversion of NO2 to HNO3. At Summit, there are no long-term observations of OH and peroxyl radicals (RO2, HO2) which are necessary to calculate the atmospheric transformation of NOx to HNO3, so we estimated their mixing ratio by assuming a linear relationship with local . More specifically, the photolysis rate constants of NO2 were first calculated using local actinic flux, and the concentrations of OH and peroxyl radicals were calculated by assuming their linear relationships with (Kukui et al., 2014). Diurnal observations of OH and peroxyl radicals exist at Summit with noon values of 6.3×10⁶ and 2.4×10⁸ (Sjostedt et al., 2007), respectively. We used these values to justify the calculated OH and peroxyl radical values by applying scaling factors to match them with the observations. We set a constant BrO concentration of 2 pptv (parts per trillion volume) in summer and zero in other seasons, given the observed summer BrO concentration (1–3 pptv) at Summit (Fibiger et al., 2016).
The mass balance of nitrate in snowpack and the overlying atmosphere is controlled by nitrate flux in and out of the snow. We denote the nitrate fluxes as “FY” following Erbland et al. (2015), with Fpri, FP, FD and FA representing the primary nitrate flux from long-range transport, the nitrate flux that originates from photolysis of snow nitrate, the deposition flux (FD) of atmospheric nitrate and the archived snow nitrate flux that is buried under the photic zone, respectively. These fluxes determine the variations in snow and atmospheric nitrate and their isotope compositions.
2.1.2 Radiative transfer and nitrate photolysis rate in snow
Downward/upward actinic flux spectrum at the snow surface was calculated using the Troposphere Ultraviolet and Visible (TUV) radiation model (Madronich et al., 1998) constrained by TCO. Radiative transfer inside the snowpack was then computed using the Two-stream Analytical Radiative TransfEr in Snow (TARTES) model (Libois et al., 2013). The attenuation of light in snow is characterized by its e-folding depth, which represents the depth where radiation decreases to of the surface intensity. Snow e-folding depth depends on its optical properties (e.g., bulk density, snow grain size) and on the concentrations of light-absorbing impurities (Zatko et al., 2013). In this study, for simplification, we set constant snowpack concentrations of the three main snow light-absorbing impurities – soot, dust and organic humic-like substance (HULIS) – at 1.4, 138 and 31 ng g−1, respectively (Zatko et al., 2013; Carmagnola et al., 2013). Snow density and grain size also impact the e-folding depth. The snow radiation equivalent mean grain radius (re) is linked to the specific surface area (SSA) of snow grains by ). Since direct observations of SSA of the reported snowpack in Geng et al. (2004b) are lacking and only density profile data exist, we used the regression relationship between SSA and ρsnow (, in units of cm2 g−1 for SSA and g cm−3 for density) from Domine et al. (2007) to calculate SSA. Using the observed snow density, fixed light-absorbing impurity concentrations and the calculated SSA profile, we obtained an e-folding depth of 12.3 cm (at a wavelength of 305 nm, which is the peak wavelength of nitrate photolysis) that is similar to the measured average summer midday value (11.6 cm) at Summit (Galbavy et al., 2007) but lower than the modeled result (15–17 cm) by Zatko et al. (2013). Note Zatko et al. (2013) applied the measured snow re profile at Dome C to Summit conditions with SSA ranging from 7 to 38 m2 kg−1, which was lower than our calculated SSA of 44 to 51 m2 kg−1. This likely explains why our calculated e-folding depth was smaller than Zatko et al. (2013) despite using the same impurity content. We also note that the regression relationship between SSA and ρ snow from Domine et al. (2007) was for fresh snow, which may not be suitable for SSA prediction for the whole snowpack. However, using this equation yielded an e-folding depth that is similar to the observations by Galbavy et al. (2007) despite the yielded SSA appearing to be larger than the observed values (20 to 40 m2 kg−1) by Carmagnola et al. (2013) for a Summit snowpack which has a much lower snow density (averaged 330 kg m−3 in the top 50 cm) than ours (averaged 395 kg m−3). Nevertheless, given the uncertainties related to the calculation of snow radiative transfer that are currently not well constrained, the regression relationship between SSA and ρ snow used here yielded a reasonable e-folding depth similar to the observations. Improvements can be made if snow physicochemical properties (e.g., SSA, density and impurity concentrations) can be precisely well constrained by future observations.
The photolysis rate constant of snow was calculated by the following:
where I is actinic flux, and Φ and σ are the quantum yield and absorption cross section of nitrate photolysis, respectively. The absorption cross sections of and were from Berhanu et al. (2014). In this study, we used the measured surface snow nitrate photolysis rate constant (Galbavy et al., 2007) to constrain the quantum yield at Summit. Galbavy et al. (2007) reported that in surface snow at summer noon generally falls in the range of 1– s−1 with a mean value of s−1. This value corresponds to a quantum yield of 0.002 given typical Summit summer column ozone density (350 DU) and noon solar zenith angle (50∘). We adopted this value of quantum yield in our model, and, according to summer actinic flux, its penetration in snowpack and snow nitrate concentration at Summit, we calculated a summer mean NOx flux from the snowpack of that is close to the observation of 2.52×10¹² by Honrath et al. (2002).
2.1.3 Flux of primary nitrate (Fpri) and the export fraction
Primary nitrate from long-range transport was assumed to be the only external nitrate source for Summit. Given the mean snow accumulation rate (250 ) and the mean snowpack nitrate concentration (117 ng g−1) at Summit, a minimum annual Fpri of kg N m2 a−1 was estimated and used in the model. This value is at the same order of magnitude ( kg N m2 a−1) as that modeled by Zatko et al. (2016). The seasonal variability in Fpri was adjusted to , , and kg N m−2 per season for spring, summer, autumn and winter, respectively, according to back-trajectory analyses and a regional emission inventory (Iizuka et al., 2018). The values and seasonal variations in δ15N and Δ17O of Fpri are currently unknown. We set δ15N and Δ17O of Fpri at 0 and 30 ‰ (close to their average values in snowpack), respectively, throughout the year. This has the advantage of the model explicitly assessing the effects of the photolysis while excluding other influencing factors. In addition, previous studies proposed δ15N of snow nitrate at Summit should reflect δ15N of NOx sources (Hasting el al., 2004, 2005); thus, in order to investigate the sensitivity of snowpack to δ15N of Fpri, we also used the measured δ15N in surface snow nitrate at Summit that varies seasonally (Jarvis et al., 2009) as a first-order estimation of δ15N of Fpri. Note this may underestimate δ15N of Fpri as surface snow nitrate could be influenced by snow-sourced nitrate that is in general depleted of δ15N. Nevertheless, we note that δ15N and Δ17O of Fpri are just starting points to run the model, and the predicted changes caused by post-depositional processing are independent of these values.
Another parameter influencing the preservation of nitrate is the export fraction, fexp, which represents the fraction of the snow-sourced NOx and nitrate transported away from the site of photolysis. At the site of photolysis, part of the reformed nitrate in the atmosphere will be exported, and this represents the net loss of nitrate through the post-depositional processing. We estimated the export fraction (fexp) following the method used by Erbland et al. (2015):
where τ1, τ2 and τ3 denote the lifetimes of horizontal transport, oxidation of NO2 by OH radicals and vertical deposition, respectively. τ1, τ2 and τ3 were calculated as follows:
where Hand L represent the vertical and horizontal characteristic dimensions of 156 m (average summer boundary layer height at Summit) and 350 km (characteristic length of summit of the Greenland ice cap; Honrath et al., 2002), respectively, vh is the mean horizontal wind speed at Summit (5 m s−1), vd is the dry deposition velocity of HNO3 (0.63 cm s−1) (Björkman et al., 2013), and k is the kinetic rate constant as a function of temperature and pressure for ( on average in summer; Atkinson et al., 2004). From Eq. (2) we obtained a value of 0.35 for fexp in summer conditions and kept it constant in the model simulations. Note this value is irrelevant in winter when photolysis stops; therefore, there is no need to consider the seasonal difference of fexp. In addition, we note the fexp calculated from the above equations is just a rough estimate as it may oversimplify the processes governing nitrate deposition and chemical loss pathways of NOx. The sensitivity of model results to fexp is discussed in Sect. 3.3.
2.2 Calculation of the isotope effects
The nitrogen isotope fractionation constant (15εp) during photolysis was calculated from the ratio of and photolysis rates in each snow layer (). The deposition of atmosphere nitrate can induce isotope fractionation (εd) in δ15N based on simultaneous measurements of atmospheric and surface (Erbland et al., 2013; Fibiger et al., 2016). Fibiger et al. (2016) suggested that at Summit the fresh snow is enriched in δ15N by +13 ‰ compared to atmospheric , similar to the observation at Dome C, Antarctica (+10 ‰, Erbland et al., 2013). In contrast, Jarvis et al. (2009) found no difference in δ15N of gas-phase HNO3 and surface snow at Summit. Here we followed Erbland et al. (2013) to set εd at +10 ‰. We did not use the results from Fibiger et al. (2013) whose study was conducted in spring when photolysis of snow nitrate had already started and disturbed the connection between atmospheric nitrate and that in surface snow. For oxygen isotopes, the Δ17O of the reformed nitrate in the air was assumed to be of Δ17O(NO2), which assumes that NO2+OH is the dominant nitrate production mechanism under sunlight. Δ17O(NO2) was estimated according to the relative importance of O3 and BrO versus HO2 and RO2 oxidation of NO to NO2. The Δ17O value of bulk O3 is taken at 26 ‰ (Vicars and Savarino, 2014), that of BrO is 39 ‰, and other oxidants are 0 ‰. We assumed a cage effect of 15 % following Erbland et al. (2015).
2.3 Model initiation
The model was initiated by deposition of primary nitrate mixed with snow-sourced nitrate. A real snowpack with a depth of 2.1 m and known nitrate concentration and isotope profiles (Geng et al., 2014b) was set at time (t)=0. Weekly snow accumulation rate was obtained by averaging the observed snow accumulation of the same week (week 1 to week 52) of a year over 2003 to 2007 at Summit. Average instead of real accumulation data were used to avoid negative values in some weeks due to wind blowing which causes net loss instead of gain of snow. After a 3-year simulation, the snow nitrate concentration and isotope profiles above the pre-existing snowpack were sampled from the model to compare with the observations from Geng et al. (2014b). All parameters needed to run the model are listed in Table S1.
3.1 The simulated snowpack nitrate depth profiles at Summit, Greenland
The observed and modeled snowpack nitrate concentration and its isotopes (i.e., δ15N and Δ17O) from July 2004 to 2007 are plotted in Fig. 1. The observations were from a snow pit collected in July 2007 so that the top of the observed profiles represents a summer, and we used the observed Δ17O minimum and concentration maximum to identify other summers to match the modeled profiles with the observations. In addition, the depth of the modeled snowpack was adjusted according to the difference in fresh snow density and the measured snow density profile in the upper 2 m at Summit (Geng et al., 2014b).

Figure 1Snowpack nitrate concentration and isotope profiles at Summit, Greenland (red: observations; blue: modeled). The gray curve in (a) is the modeled weekly data, while the blue curve is the monthly average. The dashed green line in (b) represents measured δ15N in surface snow throughout a year (Jarvis et al., 2009). The measured minimum ) was used as the indicator of June–July when local photochemistry is the most active.
As shown in Fig. 1, nitrate concentrations and isotopes in the modeled snowpack in general display similar seasonal patterns to the observations except for Δ17O whose magnitude of seasonal change is much smaller than the observations. The modeled average concentration was 115±65 ng g−1, similar to the observation of 117±62 ng g−1. The modeled concentration profile displays high variability which is mainly caused by variations in weekly snow accumulation. The modeled results indicate clear summer peaks and winter valleys similar to the observations. In addition, we found with or without seasonal variations in Fpri that the modeled concentration and isotope profiles were almost identical.
The modeled deviated by about 2.1 ‰ from primary nitrate ‰) in summer. This is consistent with expectations as post-depositional processing will not cause mass-independent fractionation, so it has no direct effects on Δ17O. The model deviation is mainly caused by the reformation of nitrate in the local atmosphere which leads to nitrate with different Δ17O from primary nitrate. In summer, nitrate reformed in the overlying atmosphere occurs mainly through OH oxidation of NO2. In the model, nitrate formed through this process possessed Δ17O of 19.6±0.3 ‰ on average. This value is close to the modeled results (18.9 ‰) for summer at Summit by Kunasek et al. (2008) who used a box model and assumed local NOx chemistry is the only nitrate source. Δ17O of nitrate formed from local chemistry is lower than that in summer snow (∼25 ‰), and this could be related to transport of external nitrate as suggested by Kunasek et al. (2008). Indeed, unlike in summer conditions at Summit, nitrate transported from outside of the Arctic would be formed by both night- and daytime reactions and should possess higher Δ17O than locally formed nitrate which is mainly from OH oxidation (Kunasek et al., 2008). In our model, the of Fpri was assumed to be 30 ‰. Although this is unlikely to be the true value of long-range-transported nitrate, it can be viewed as the starting value from which we can assess the effects of post-depositional processing (i.e., the changes caused by post-depositional processing) which is the focus of this study. In the model, the summer-deposited nitrate possesses Δ17O that is 1.9 ‰ lower than that of Fpri due to the mixing of Fpri with snow-sourced nitrate. In wintertime, local nitrate formation in the overlying atmosphere is muted in the model as there is no sunlight, and thus the deposited is completely controlled by of Fpri.
In addition, the cage effect during photolysis further reduces Δ17O in snow nitrate by ∼0.2 ‰. This is different from what occurs on the East Antarctic Plateau where the cage effect dominates the post-depositional decrease (Erbland et al., 2013). This is because on the East Antarctic Plateau, the snow accumulation rate is very low, and nitrate remains in the photic zone for 5 years or longer (compared to less than a year at Summit, Greenland). Taking into account the cage effect in Summit snow, a 2.1 ‰ Δ17O seasonality was simulated by the model, which is much smaller compared to the observed 9 ‰ seasonality (Fig. 1c). Note that as our model does not consider nitrate formation via BrONO2 hydrolysis, which tends to produce nitrate with higher Δ17O than OH oxidation, the modeled 2.1 ‰ seasonality is an upper limit. In all, the results suggest that post-depositional processing does not play a significant role in regulating the observed seasonality of at Summit, which is probably mainly caused by seasonal differences in of Fpri in addition to seasonal differences in local nitrate formations as suggested by Kunasek et al. (2008).
The observed surface snow (green curve in Fig. 1b) varies from −13.0 ‰ to −2.8 ‰ in a year (Jarvis et al., 2009). In comparison, observed snowpack varies from ‰ of the annual valleys to 6.3±1.8 ‰ of the annual peaks (average of 3 years of observations) and displays apparent enrichments in spring and early summer. This difference suggests substantial changes in after deposition. The model with constant δ15N of Fpri (i.e., 0 ‰ throughout the year) predicted a seasonality with a spring peak (dashed black curve in Fig. 2b), and the modeled magnitude of seasonal difference is ∼17.5 ‰, which is similar to the observations (16.1±3.6 ‰ seasonality). But there is a constant model–observation discrepancy that the lowest value in a year appears earlier in the model than in the observations. When including seasonal variations in δ15N of Fpri (i.e., using year-round surface ), the modeled seasonal pattern, as well as the magnitude (∼18.3 ‰) (blue curve in Fig. 1b), became almost identical to the observations except that the absolute values of the modeled are on average 5.2 ‰ lower than the observations. This modeled underestimate could be due to the use of observed δ15N of surface snow nitrate ( ‰ on average) which may underestimate δ15N of Fpri. The δ15N of surface snow nitrate is affected by the input of snow-sourced nitrate depleted of δ15N in the summer. Therefore, the modeled snowpack δ15N should be lower than the observation given that the starting values in the model are biased low. In comparison, the simulation with constant δ15N of Fpri (i.e., 0 ‰) predicted absolute values generally higher than the observations, which may be because the value of 0 ‰ might be an overestimate.
The occurrence of the spring δ15N peak should be also driven by post-depositional processing. Post-depositional processing starts after polar sunrise and continues to operate until the beginning of polar winter. During this time, the effect of post-depositional processing accumulates, and the spring snow layer has experienced the largest degree of post-depositional loss and thus exhibits the most enriched δ15N. The annual snow thickness at Summit is cm a−1, which is twice the depth of the photic zone, and therefore there should be no additional post-depositional processing after a year, and the spring high caused by post-depositional processing is preserved as seen in the model and observations.
3.2 Seasonality of photolysis flux (FP) and deposition flux (FD)
To discern the processes leading to the seasonal isotope patterns, we further investigated the weekly nitrate deposition flux (FD) and isotopes, as well as the weekly flux of snow-sourced nitrate (FP) and isotopes, using the model. As shown in Fig. 2a, during mid-summer when actinic flux reaches its maximum, FP reaches the maximum (and is zero in winter). Our simulated average daily NO2 flux from snowpack in summer was 2.96×10¹² , in good agreement with summer observations at Summit (2.52×10¹² ; Honrath et al., 2002). FD is a mixture of Fpri and FP, so it also reaches the maximum in summer due to the contribution of FP, in addition to the summer high Fpri. This at least in part explains the modeled summer nitrate concentration maximum. But even in summer, FP was only about 25 % of FD, demonstrating the importance of Fpri in determining the budget of snow nitrate at Summit.
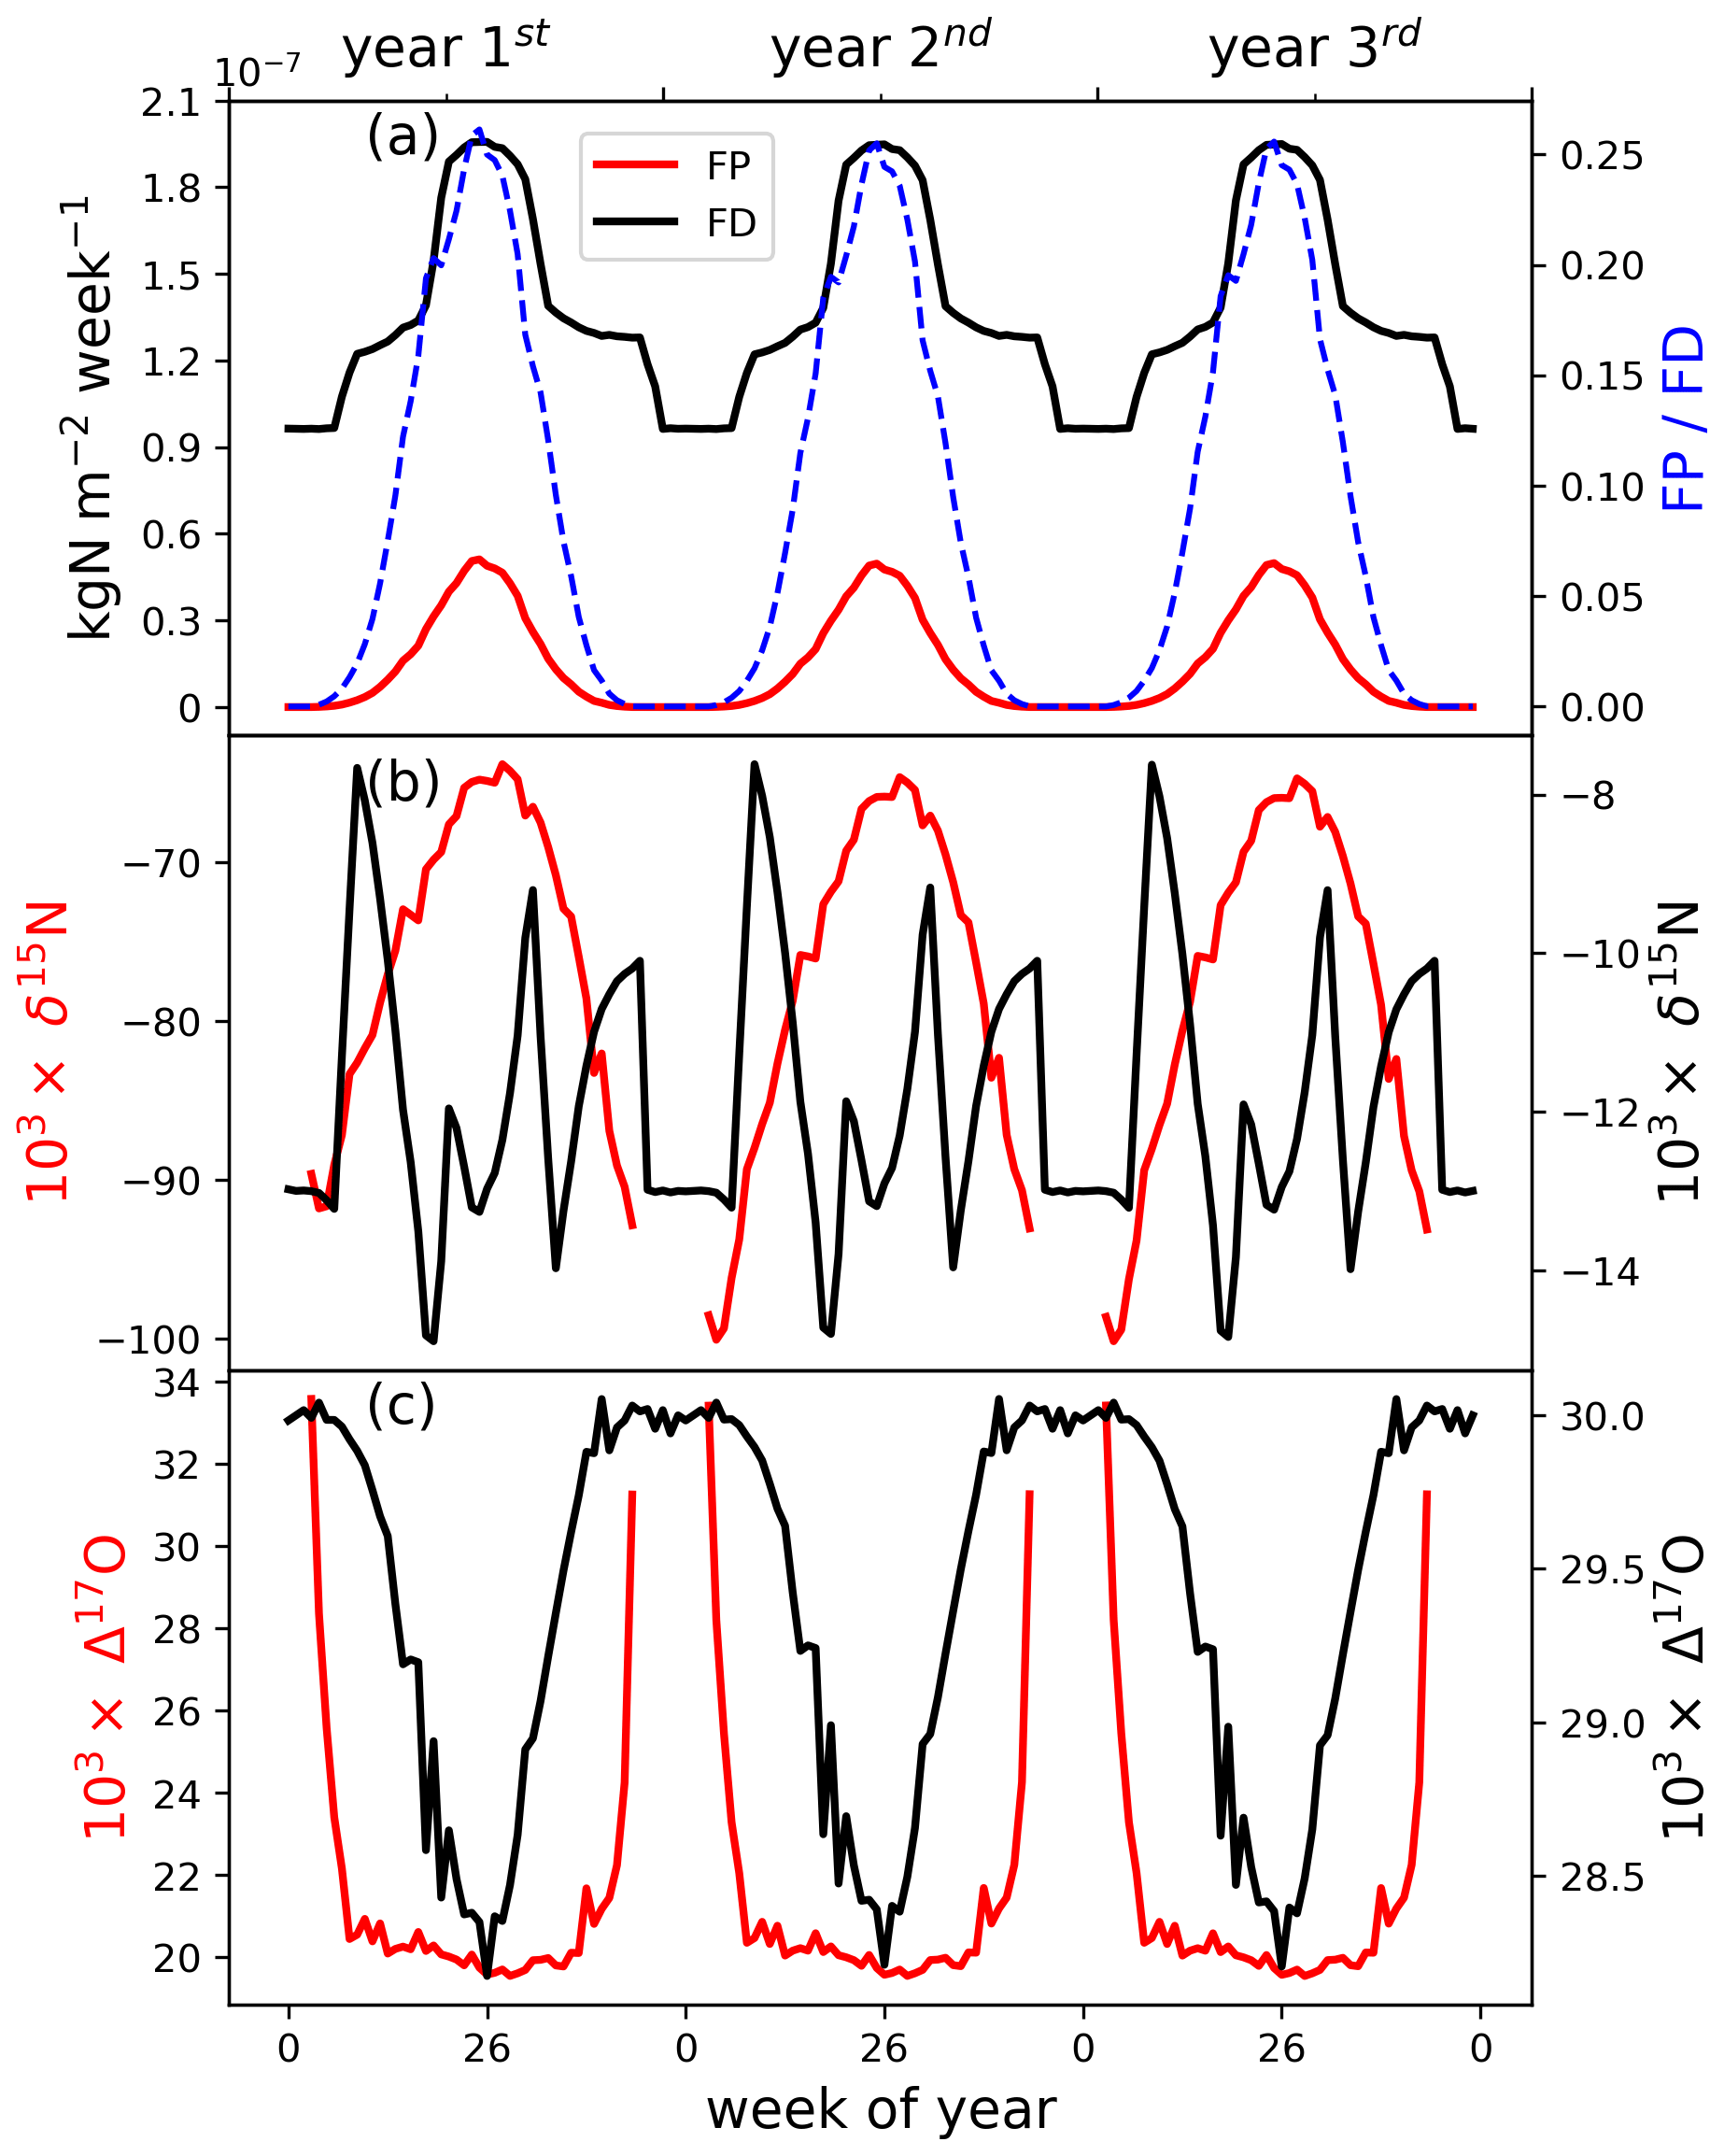
Figure 2Weekly distribution of photolysis flux (FP) and deposition flux (FD) and their nitrate isotopic compositions. Gaps in FP (red line) are during the winter when there is no sunlight and thus no photolysis. The results shown are those simulated with seasonal variations in the flux and δ15N of primary nitrate (Fpri).
The δ15N of FP in the half year of summer (−77 ‰ to −65 ‰) was severely depleted compared toFpri (−6.7 ‰ to −2.8 ‰). As shown in Fig. 2b, δ15N of FP gradually increased from the onset of photolysis and reached the highest in mid-summer and decreased after that. This is mainly caused by the wavelength-dependent εp (Berhanu et al., 2014) which varies from −57 ‰ to −87 ‰ and peaks in mid-summer at Summit (Fig. 3a), corresponding to the smallest isotope effect in mid-summer. The of FD was a combination of FP and Fpri. Therefore, a clear decrease in of FD can be expected in summer (Fig. 2b) when the contribution of FP was the largest. The isotope effect in δ15N during the deposition of nitrate was also included in the model but turns out to have no apparent impact on the modeled snowpack profile. This is because essentially all nitrate in the atmosphere except the fraction being exported was deposited (i.e., FD) over the period of each simulation step (i.e., 1 week), and thus the isotope effects were negligible due to mass balance.
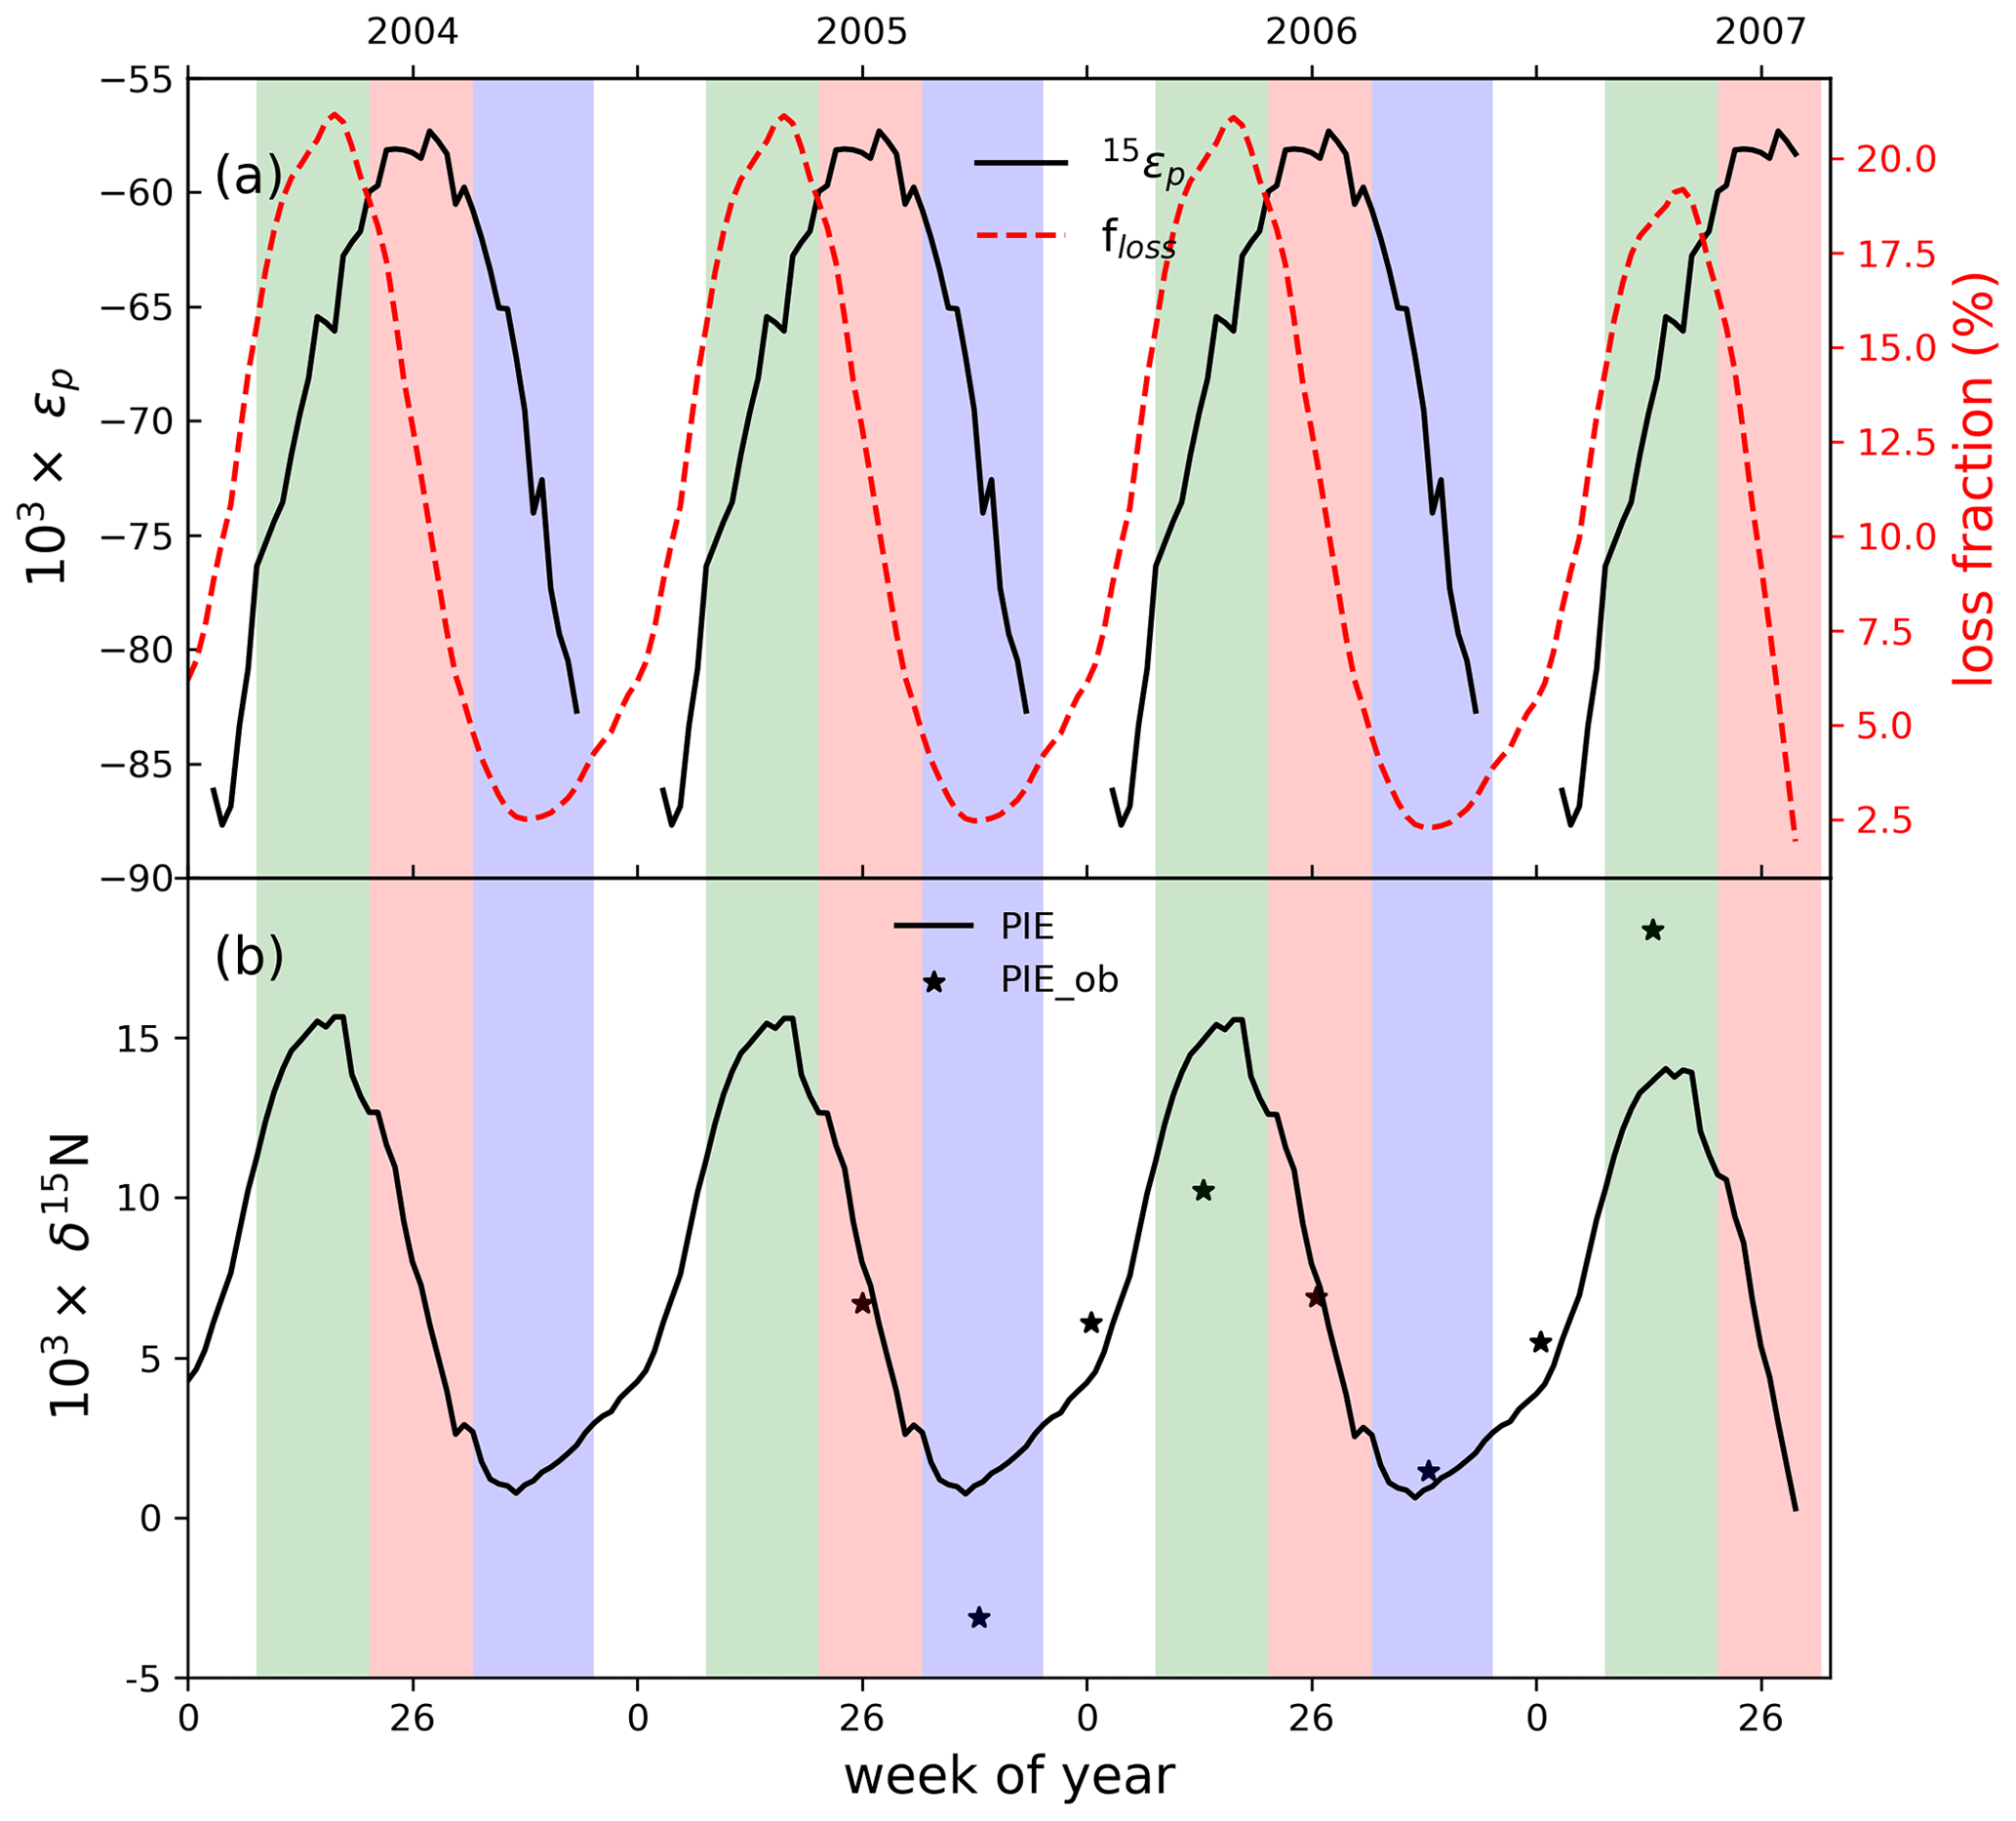
Figure 3(a) The fraction of nitrate loss after deposition and the photolysis fractionation factor (εp) at different weeks. (b) PIE: the photo-induced isotope effect. The solid star represents the estimated PIE from surface and snowpack nitrate data reported by Jarvis et al. (2009). The green, red, blue and white background colors represent spring, summer, autumn and winter, respectively.
The modeled of FP is mainly determined by local atmospheric chemistry, e.g., the NO–NO2 cycling and the subsequent formation of HNO3. Under the prescribed Summit atmospheric conditions, we calculated the of FP with a mean of 19.7±0.3 ‰ during summer. This of FP combined with Fpri (Δ17O=30 ‰), leading to a summer minimum Δ17O of FD that was 1.9 ‰ lower than that of Fpri. An additional ∼0.2 ‰ difference was induced upon archiving from the cage effect, suggesting the cage effect plays a negligible role in snow Δ17O () at Summit. This reinforces why oxygen isotopes should not be used to investigate the degree of post-depositional processing, especially at high snow accumulation sites, because it is dominated by regionally and/or local atmospheric processes.
In addition, our model results indicate apparent recycling of nitrate at the air–snow interface leading to changes in snow nitrate isotopes. This is opposite to Fibiger et al. (2016) who concluded there is little to no local recycling of nitrate at Summit based on the fact that surface snow nitrate Δ17O was not elevated when atmospheric BrO concentration increased. However, high BrO concentration does not necessarily lead to high atmospheric and/or snow nitrate Δ17O for several reasons. First, the production of BrO will consume O3, and this is a tradeoff in terms of influencing . Second, BrO concentration always covaries with HOx (HOx = OH, RO2 and HO2) (Liao et al., 2011), and increases in HOx tend to lower , which offsets the effect of increased BrO concentration on . Third, the BrO increase observed by Fibiger et al. (2016) only lasted for a few hours, and whether this is long enough to significantly perturb the local atmospheric nitrate budget over longer time periods and nitrate in snow is questionable. Nevertheless, BrONO2 hydrolysis is only one of the many pathways of atmospheric nitrate formation, and for atmospheric nitrate to perturb the surface snow nitrate budget (in the top 2 cm, the observations of Fibiger et al., 2016) through dry deposition, it will need days to weeks of nitrate deposition given its dry deposition flux (7.16×10¹¹ ) at Summit (Honrath et al., 2002). A chemical transport model with the post-depositional processing incorporated would be best to investigate this further but is out of the scope of this study.
3.3 Loss of snow nitrate due to photolysis at Summit
The lost fraction (floss) of snow nitrate upon archiving is plotted in Fig. 3a, calculated as the difference in nitrate concentration of an archived layer to the concentration when it was at the surface. As shown in Fig. 3a, throughout a year, floss varied from 1.9 % to 21.1 %, similar to the <7 % to 25 % loss estimated by Burkhart et al. (2004) and Dibb et al. (2007). In particular, Dibb et al. (2007) calculated the average concentrations in fresh and buried snow layers and found a mean of ∼9 % loss which is in good agreement with our calculated mean floss of 10.4±6.6 %. The loss of nitrate in a snow layer corresponds to the enrichment of in that layer. Here we defined the enrichment in snow due to photolysis as PIE (the photo-induced isotope effect), i.e., the difference between of a newly deposited snow layer and the same layer that was finally buried below the photic zone. As shown in Fig. 3b, PIE is the highest in the 18th week of the year, corresponding to the time of the highest floss. In addition, PIE displays a maximum in spring and minimum in autumn, in good agreement with the observed seasonal pattern in snowpack. We also estimated PIE based on the observed in surface snow and snowpack at Summit as reported by Jarvis et al. (2009). As shown in Fig. 3b, PIE estimated based on observations (PIE_ob) agrees well with the modeled PIE. These further confirm the dominant role of the photo-driven post-depositional processing in the seasonal snowpack pattern. Note in the model neither floss nor PIE varied with seasonal differences in the flux and δ15N of Fpri, respectively. The agreement between the modeled and observed PIE further demonstrates the dominant role of photo-driven post-depositional processing in seasonal variations at Summit. Physical loss of snow nitrate through adsorption/evaporation is associated with very small εp (e.g., 3.6 ‰ by Erbland et al., 2013), and given the mean summertime temperature at Summit (261±3 K) and a maximum lost fraction of 25 % (Dibb et al., 2007), only a ∼1 ‰ change in can be caused by physical loss.
The floss calculated above referred to a specific archived layer relative to when it was at the surface, and part of the loss was recycled to layers above that specific layer. Therefore, the net loss integrated over a certain period should be less than floss. Here we calculated an annual net loss floss as follows:
where Fa represents the archival flux of nitrate ( kg N m2 a−1), and was calculated as 4.1 %. This is consistent with the annual mean which was 2.6 ‰ enriched compared to δ15N of Fpri. For , upon archiving, the annual mean is 0.9 ‰ lower than Δ17O of Fpri. These values represent the integrated effects of the post-depositional processing on isotopes of the archived nitrate under present Summit conditions. In addition, these results suggest that although photochemistry was active and resulted in significant redistribution of snow nitrate in the photic zone at Summit, the annual net loss is small, consistent with the results of previous studies at Summit based on cumulative inventory assessments of nitrate mass in snow pits (Burkhart et al., 2004; Dibb et al., 2007), as well as the result from a southeastern Greenland ice core where negligible annual nitrate loss was suggested due to the even higher snow accumulation rate (≈300 cm snow per year) than Summit (≈65 cm snow per year) (Iizuka el al., 2018). It is also interesting to note that despite having a similar source region (Geng et al., 2015, Iizuka el al., 2018), in this southeastern Greenland ice core is lower than in Summit ice cores (Shohei Hattori, personal communication, 2021). This is qualitatively consistent with the difference in the snow accumulation rate at the two sites since the lower snow accumulation rate at Summit will result in a higher degree of post-depositional processing.
The annual net loss in the model is mainly determined by fexp which represents the fraction of exported nitrate from the site of photolysis. Although fexp does not influence the loss fraction of a specific snow layer and subsequently the predicted seasonal pattern as modeled (Fig. S3 in the Supplement), it determines how much of the reformed nitrate was recycled back to snow. In Fig. 4, we investigated the sensitivity of the annual net loss, as well as the annual mean archived and to fexp. We found the archived decreases with increasing fexp, while is the opposite because larger fexp corresponds to less of a contribution of FP to FD. Under the extreme circumstance with fexp=1, i.e., all snow-sourced nitrate was exported, in snow was on average 6.8 ‰ enriched compared to primary Fpri under present Summit conditions, while was only 0.2 ‰ lower than Δ17O ofFpri caused entirely by the cage effect. In this study, fexp was determined to be 0.35 following the method used by Erbland et al. (2015), but this could be an underestimate. At Summit, observations by Honrath et al. (2002) indicate that NOx and/or HNO3 emitted from sunlit snow are largely exported from the local boundary layer if no wet deposition occurs.
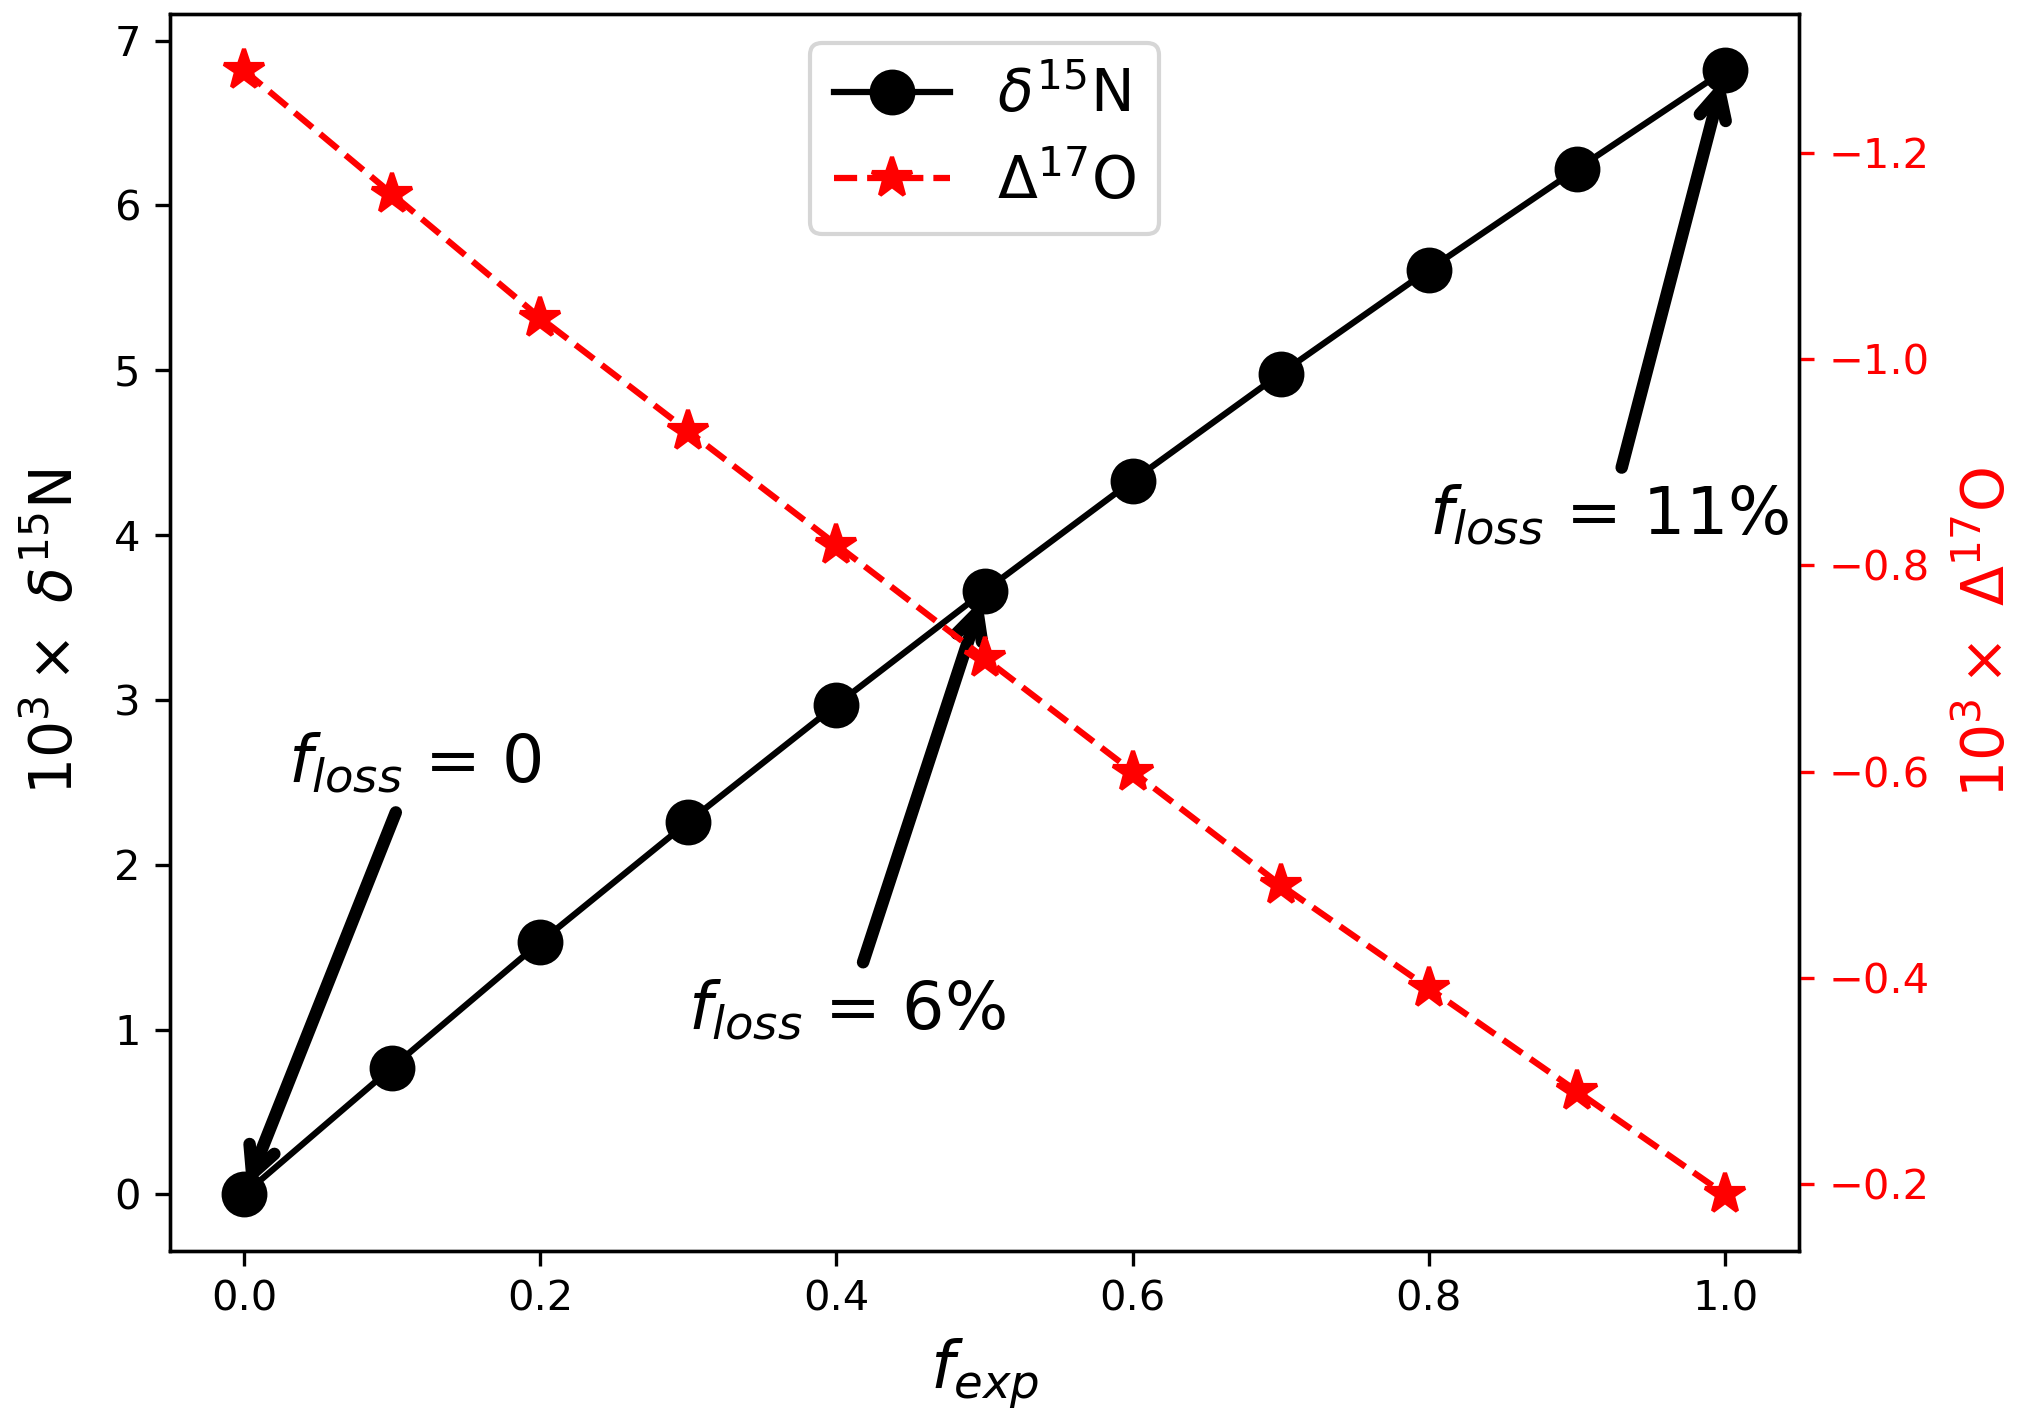
Figure 4Sensitivity of annual mean ) upon archiving to fexp. Positive/negative values indicate the deviations of Fpri. Note when fexp is set to 1, the small non-zero value (−0.19 ‰) of ) represents the effects of the cage effect.
3.4 Implications for interpretation of ice-core nitrate isotope records
Due to the fast cycling of nitrate at the air–snow interface, the annual net loss (4.1 %) and the associated annual mean changes in (2.6 ‰) and (0.9 ‰) caused by post-depositional processing are small under present Summit conditions. Despite this, at seasonal scale, given the strong variations in actinic flux, post-depositional processing plays an important role in the seasonal δ15N fluctuation. The degree of post-depositional processing is also strongly depending on snow accumulation rate which is usually very different in different climates. As such, the net loss and the associated isotope effects could be increased in periods with a reduced snow accumulation rate. For example, over the last glacial–interglacial period, considering only the changes in snow accumulation rate at Summit (Geng et al., 2015), the model calculated a 11 % annual nitrate loss in the glacial period and a glacial–interglacial δ15N difference of 9.2 ‰. In comparison, the observed glacial–interglacial δ15N difference is 16.7±4.8 ‰ (Geng et al., 2015). This suggests changes in the degree of post-depositional processing caused by the glacial–interglacial snow accumulation rate difference alone can explain more than half of the observed difference. Note the modeled 11 % net loss in the glacial climate according to Eq. (2) is not in conflict with the 45–54 % loss estimated by Geng et al. (2015), who calculated the loss fraction from Fa and FD instead of Fpri. If Fpri in Eq. (2) is replaced with FD, the loss fraction is then 31 %. With the effects of changes in snow accumulation rate alone, the model predicted the glacial would be 2 ‰ lower than in the present. This amount is significant compared to the observed glacial–interglacial difference of 6.2 ‰ (Geng et al., 2017). Note that many other factors can influence the degree of post-depositional processing in the glacial climate, e.g., local wind speed, actinic flux, quantum yield of snow nitrate photolysis, etc., which are out of the scope of this study. But our results here reinforce the effects of post-depositional processing on ice-core nitrate concentrations and isotopes even at high snow accumulation rate sites, and such effects must be quantified and corrected in order to use ice-core nitrate records to retrieve past information on NOx emissions and abundance and atmospheric oxidation capacity especially when the records cover different climates.
In this study we applied the TRANSITS model to explicitly investigate the impact of the photo-driven post-depositional processing on the preservation of nitrate and its isotopes at Summit, Greenland, with the focus on changes in nitrate isotopes after deposition. The results suggest that the photo-driven post-depositional processing is active at Summit, causing strong redistribution of snow nitrate accompanied by isotope effects in the photic zone. Despite the high snow accumulation rate at Summit, up to 21 % loss/redistribution of nitrate can be induced by the photolysis, resulting in a spring peak consistent with the observations. Despite uncertainties in the model, e.g., specific surface area, quantum yield of snow nitrate photolysis and the export fraction, the modeled loss/redistribution of nitrate after deposition is consistent with previous studies and explains the observed difference between in surface snow and snow at depth. The latter is evidence of changes in after deposition. The model also reproduced the observed seasonal patterns of snow nitrate concentration and reasonably well, and the model–observation discrepancy in the timing of the lowest seasonal was addressed when seasonal variations in of Fpri were included. But the effects of δ15N of Fpri on snow seasonality appear to be mainly pronounced in autumn and winter, i.e., the period with the lowest seasonal when photolysis is negligible. This makes sense as when photolysis is muted snow nitrate should be the same as that of Fpri. When photolysis is active, the signal of Fpri is not preserved. In contrast, the post-depositional processing only led to 2.1 ‰ seasonal change in Δ17O. These results are consistent with the expectation that photo-driven post-depositional processing modifies δ15N but has only moderate impacts on Δ17O.
Overall, the model results suggest an important, perhaps even dominant role of post-depositional processing in regulating the snowpack seasonality at Summit. Although the impact of photolysis of snow nitrate on must be carefully evaluated when interpreting snowpack and ice-core nitrate isotope records even at sites with high snow accumulation rates such as Summit, Greenland, we note that this study does not address to what extent seasonal variations in of Fpri affect the snowpack . Observations on the concentration and isotopic composition of Fpri and its seasonal variations would be best to answer this question. However, it would be difficult to distinguish primary from recycled nitrate during sunlit time periods due to the local influence of snow-sourced nitrate. Additional observations including a full year or multiple years of atmospheric nitrate isotopes along with surface snow and snowpack data at a single site should be pursued in the future to fully investigate the evolution of nitrate isotopes before and after deposition, as well as to thoughtfully evaluate the effects of post-depositional processing. On the other hand, precise measurements of snowpack properties, e.g., specific surface area, impurity concentrations and observational constraints on the quantum yield of snow nitrate photolysis, and better constraints on the export fraction are also needed in order to improve the model's performance.
The codes for the numerical simulations and their analysis will be provided upon direct request to the corresponding author.
The model output data are available through OSF, the Open Science Framework: https://doi.org/10.17605/OSF.IO/A4B7D (Jiang et al., 2020).
The supplement related to this article is available online at: https://doi.org/10.5194/tc-15-4207-2021-supplement.
LG conceived this study. ZJ performed the model simulations, analyzed the data and wrote the manuscript with LG. JE, JS and BA providing the model and helping with the model setup. All authors contributed to data interpretation and writing.
The authors declare that they have no conflict of interest.
Publisher's note: Copernicus Publications remains neutral with regard to jurisdictional claims in published maps and institutional affiliations.
Zhuang Jiang thanks John Robinson for his assistance in starting the TRANSITS model, and we would like to thank the reviewers and the editors of the Cryosphere for their suggestions and comments to improve the manuscript. The French Polar institute (Institut Polaire Français – program SUNITEDC 1011) is thanked for field and funding support (Joel Savarino, Joseph Erbland).
This research is funded by the National Natural Science Foundation of China (Awards: 41822605, 41871051 and 41727901), the Fundamental Research Funds for Central Universities, the Strategic Priority Research Program of Chinese Academy of Sciences (grant no. XDB 41000000), and the National Key R&D Program of China (grant nos. 2019YFC1509100 and 2016YFA0302200). Support for Joel Savarino and Joseph Erbland was provided by the French national programme LEFE/INSU and the ANR grants ANR-15-IDEX-02 (project IDEX Université Grenoble Alpes) and ANR-16-CE01-0011-01 (EAIIST project) of the French Agence Nationale de la Recherche. Becky Alexander was supported by the NSF (grant no. PLR 1542723).
This paper was edited by Florent Dominé and reviewed by two anonymous referees.
Alexander, B. and Mickley, L. J.: Paleo-perspectives on potential future changes in the oxidative capacity of the atmosphere due to climate change and anthropogenic emissions, Current Pollution Reports, 1, 57–69, https://doi.org/10.1007/s40726-015-0006-0, 2015.
Alexander, B., Savarino, J., Kreutz, K. J., and Thiemens, M.: Impact of preindustrial biomass-burning emissions on the oxidation pathways of tropospheric sulfur and nitrogen, J. Geophys. Res.-Atmos., 109, D08303, https://doi.org/10.1029/2003JD004218, 2004.
Alexander, B., Sherwen, T., Holmes, C. D., Fisher, J. A., Chen, Q., Evans, M. J., and Kasibhatla, P.: Global inorganic nitrate production mechanisms: comparison of a global model with nitrate isotope observations, Atmos. Chem. Phys., 20, 3859–3877, https://doi.org/10.5194/acp-20-3859-2020, 2020.
Atkinson, R., Baulch, D. L., Cox, R. A., Crowley, J. N., Hampson, R. F., Hynes, R. G., Jenkin, M. E., Rossi, M. J., and Troe, J.: Evaluated kinetic and photochemical data for atmospheric chemistry: Volume I – gas phase reactions of Ox, HOx, NOx and SOx species, Atmos. Chem. Phys., 4, 1461–1738, https://doi.org/10.5194/acp-4-1461-2004, 2004. z
Berhanu, T. A., Meusinger, C., Erbland, J., Jost, R., Bhattacharya, S., Johnson, M. S., and Savarino, J.: Laboratory study of nitrate photolysis in Antarctic snow. II. Isotopic effects and wavelength dependence, J. Chem. Phys., 140, 244306, https://doi.org/10.1063/1.4882899, 2014.
Björkman, M., Kühnel, R., Partridge, D., Roberts, T., Aas, W., Mazzola, M., Viola, A., Hodson, A., Ström, J., and Isaksson, E.: Nitrate dry deposition in Svalbard, Tellus B, 65, 19071, https://doi.org/10.3402/tellusb.v65i0.19071, 2013.
Blunier, T., Floch, G. L., Jacobi, H. W., and Quansah, E.: Isotopic view on nitrate loss in Antarctic surface snow, Geophys. Res. Lett., 32, L13501, https://doi.org/10.1029/2005GL023011, 2005.
Burkhart, J. F., Hutterli, M., Bales, R. C., and McConnell, J. R.: Seasonal accumulation timing and preservation of nitrate in firn at Summit, Greenland, J. Geophys. Res.-Atmos., 109, D22309, https://doi.org/10.1029/2004JD004658, 2004.
Carmagnola, C. M., Domine, F., Dumont, M., Wright, P., Strellis, B., Bergin, M., Dibb, J., Picard, G., Libois, Q., Arnaud, L., and Morin, S.: Snow spectral albedo at Summit, Greenland: measurements and numerical simulations based on physical and chemical properties of the snowpack, The Cryosphere, 7, 1139–1160, https://doi.org/10.5194/tc-7-1139-2013, 2013.
Chu, L. and Anastasio, C.: Quantum yields of hydroxyl radical and nitrogen dioxide from the photolysis of nitrate on ice, J. Phys Chem., 107, 9594–9602, 2003.
Cohen, L., Helmig, D., Neff, W. D., Grachev, A. A., and Fairall, C. W.: Boundary-layer dynamics and its influence on atmospheric chemistry at Summit, Greenland, Atmos. Environ., 41, 5044–5060, https://doi.org/10.1016/j.atmosenv.2006.06.068, 2007.
Curtis, C. J., Kaiser, J., Marca, A., Anderson, N. J., Simpson, G., Jones, V., and Whiteford, E.: Spatial variations in snowpack chemistry, isotopic composition of and nitrogen deposition from the ice sheet margin to the coast of western Greenland, Biogeosciences, 15, 529–550, https://doi.org/10.5194/bg-15-529-2018, 2018.
Dibb, J. E. and Fahnestock, M.: Snow accumulation, surface height change, and firn densification at Summit, Greenland: Insights from 2 years of in situ observation, J. Geophys. Res.-Atmos., 109, D24113, https://doi.org/10.1029/2003JD004300, 2004.
Dibb, J. E., Arsenault, M., Peterson, M. C., and Honrath, R. E.: Fast nitrogen oxide photochemistry in Summit, Greenland snow, Atmos. Environ, 36, 2501–2511, https://doi.org/10.1016/S1352-2310(02)00130-9, 2002.
Dibb, J. E., Whitlow, S. I., and Arsenault, M.: Seasonal variations in the soluble ion content of snow at Summit. Greenland: Constraints from three years of daily surface snow samples, Atmos. Environ., 41, 5007–5019, https://doi.org/10.1016/j.atmosenv.2006.12.010, 2007.
Domine, F., Taillandier, A. S., and Simpson, W. R.: A parameterization of the specific surface area of seasonal snow for field use and for models of snowpack evolution, J. Geophys. Res.-Earth, 112, F02031, https://doi.org/10.1029/2006JF000512, 2007.
Erbland, J., Vicars, W. C., Savarino, J., Morin, S., Frey, M. M., Frosini, D., Vince, E., and Martins, J. M. F.: Air–snow transfer of nitrate on the East Antarctic Plateau – Part 1: Isotopic evidence for a photolytically driven dynamic equilibrium in summer, Atmos. Chem. Phys., 13, 6403–6419, https://doi.org/10.5194/acp-13-6403-2013, 2013.
Erbland, J., Savarino, J., Morin, S., France, J. L., Frey, M. M., and King, M. D.: Air–snow transfer of nitrate on the East Antarctic Plateau – Part 2: An isotopic model for the interpretation of deep ice-core records, Atmos. Chem. Phys., 15, 12079–12113, https://doi.org/10.5194/acp-15-12079-2015, 2015.
Fibiger, D. L., Hastings, M. G., Dibb, J. E., and Huey, L. G.: The preservation of atmospheric nitrate in snow at Summit, Greenland, Geophys. Res. Lett., 40, 3484–3489, https://doi.org/10.1002/grl.50659, 2013.
Fibiger, D. L., Dibb, J. E., Chen, D., Thomas, J. L., Burkhart, J. F., Huey, L. G., and Hastings, M. G.: Analysis of nitrate in the snow and atmosphere at Summit, Greenland: Chemistry and transport, J. Geophys. Res.-Atmos., 121, 5010–5030, https://doi.org/10.1002/2015JD024187, 2016.
Frey, M. M., Savarino, J., Morin, S., Erbland, J., and Martins, J. M. F.: Photolysis imprint in the nitrate stable isotope signal in snow and atmosphere of East Antarctica and implications for reactive nitrogen cycling, Atmos. Chem. Phys., 9, 8681–8696, https://doi.org/10.5194/acp-9-8681-2009, 2009.
Freyer, H. D., Kobel, K., Delmas, R. J., Kley, D., and Legrand, M. R.: First results of 15NN ratios in nitrate from alpine and polar ice cores, Tellus, 48, 93–105, https://doi.org/10.1034/j.1600-0889.1996.00009.x, 1996.
Galbavy, E. S., Anastasio, C., Lefer, B. L., and Hall, S. R.: Light penetration in the snowpack at Summit, Greenland: Part 1: Nitrite and hydrogen peroxide photolysis, Atmos. Environ., 41, 5077–5090, https://doi.org/10.1016/j.atmosenv.2006.04.072, 2007.
Geng, L., Alexander, B., Cole-Dai, J., Steig, E. J., Savarino, J., Sofen, E. D., and Schauer, A. J.: Nitrogen isotopes in ice core nitrate linked to anthropogenic atmospheric acidity change, P. Natl. Acad. Sci. USA, 111, 5808–5812. https://doi.org/10.1073/pnas.1319441111, 2014a.
Geng, L., Cole-Dai, J., Alexander, B., Erbland, J., Savarino, J., Schauer, A. J., Steig, E. J., Lin, P., Fu, Q., and Zatko, M. C.: On the origin of the occasional spring nitrate peak in Greenland snow, Atmos. Chem. Phys., 14, 13361–13376, https://doi.org/10.5194/acp-14-13361-2014, 2014b.
Geng, L., Zatko, M. C., Alexander, B., Fudge, T., Schauer, A. J., Murray, L. T., and Mickley, L. J.: Effects of postdepositional processing on nitrogen isotopes of nitrate in the Greenland Ice Sheet Project 2 ice core, Geophys. Res. Lett., 42, 5346–5354, https://doi.org/10.1002/2015GL064218, 2015.
Geng, L., Murray, L. T., Mickley, L. J., Lin, P., Fu, Q., Schauer, A. J., and Alexander, B.: Isotopic evidence of multiple controls on atmospheric oxidants over climate transitions, Nature, 546, 133–136, https://doi.org/10.1038/nature22340, 2017.
Goto-Azuma, K. and Koerner, R. M.: Ice core studies of anthropogenic sulfate and nitrate trends in the Arctic, J. Geophys. Res.-Atmos., 106, 4959–4969, https://doi.org/10.1029/2000JD900635, 2001.
Hastings, M., Jarvis, J., and Steig, E.: Anthropogenic impacts on nitrogen isotopes of ice-core nitrate, Science, 324, 1288–1288, https://doi.org/10.1126/science.1170510, 2009.
Hastings, M. G., Steig, E., and Sigman, D. M.: Seasonal variations in N and O isotopes of nitrate in snow at Summit, Greenland: Implications for the study of nitrate in snow and ice cores, J. Geophys. Res.-Atmos., 109, D20306, https://doi.org/10.1029/2004JD004991, 2004.
Hastings, M. G., Sigman, D. M., and Steig, E. J.: Glacial/interglacial changes in the isotopes of nitrate from the Greenland Ice Sheet Project 2 (GISP2) ice core, Global Biogeochem. Cy., 19, GB4024, https://doi.org/10.1029/2005GB002502, 2005.
Honrath, R., Lu, Y., Peterson, M. C., Dibb, J. E., Arsenault, M., Cullen, N., and Steffen, K.: Vertical fluxes of NOx, HONO, and HNO3 above the snowpack at Summit, Greenland, Atmos. Environ., 36, 2629–2640, https://doi.org/10.1016/S1352-2310(02)00132-2, 2002.
Iizuka, Y., Uemura, R., Fujita, K., Hattori, S., Seki, O., Miyamoto, C., Suzuki, T., Yoshida, N., Motoyama, H., and Matoba, S: A 60 Year Record of Atmospheric Aerosol Depositions Preserved in a High-Accumulation Dome Ice Core, Southeast Greenland, J. Geophys. Res.-Atmos., 123, 574–589, https://doi.org/10.1002/2017JD026733, 2018.
Jarvis, J. C., Hastings, M. G., Steig, E. J., and Kunasek, S. A.: Isotopic ratios in gas-phase HNO3 and snow nitrate at Summit, Greenland, J. Geophys. Res.-Atmos., 114, D17301, https://doi.org/10.1029/2009JD012134, 2009.
Jiang, Z.: TRANSITS Simulation Results on Summit Snow, OSF [data set], https://doi.org/10.17605/OSF.IO/A4B7D, 2020.
Kukui, A., Legrand, M., Preunkert, S., Frey, M. M., Loisil, R., Gil Roca, J., Jourdain, B., King, M. D., France, J. L., and Ancellet, G.: Measurements of OH and RO2 radicals at Dome C, East Antarctica, Atmos. Chem. Phys., 14, 12373–12392, https://doi.org/10.5194/acp-14-12373-2014, 2014.
Kunasek, S., Alexander, B., Steig, E., Hastings, M., Gleason, D., and Jarvis, J.: Measurements and modeling of Δ17O of nitrate in snowpits from Summit, Greenland, J. Geophys. Res.-Atmos., 113, D24302, https://doi.org/10.1029/2008JD010103, 2008.
Legrand, M. R. and Delmas, R. J.: Relative contributions of tropospheric and stratospheric sources to nitrate in Antarctic snow, Tellus B, 38, 236–249, https://doi.org/10.3402/tellusb.v38i3-4.15132, 1986.
Liao, J., Huey, L. G., Tanner, D. J., Brough, N., Brooks, S., Dibb, J. E., Stutz, J., Thomas, J. L., Lefer, B., Haman, C., and Gorham, K.: Observations of hydroxyl and peroxy radicals and the impact of BrO at Summit, Greenland in 2007 and 2008, Atmos. Chem. Phys., 11, 8577–8591, https://doi.org/10.5194/acp-11-8577-2011, 2011.
Libois, Q., Picard, G., France, J. L., Arnaud, L., Dumont, M., Carmagnola, C. M., and King, M. D.: Influence of grain shape on light penetration in snow, The Cryosphere, 7, 1803–1818, https://doi.org/10.5194/tc-7-1803-2013, 2013.
Madronich, S., McKenzie, R. L., Björn, L. O., and Caldwell, M. M.: Changes in biologically active ultraviolet radiation reaching the Earth's surface, J. Photoch. Photobio. B, 46, 5–19, https://doi.org/10.1016/S1011-1344(98)00182-1, 1998.
McCabe, J., Boxe, C., Colussi, A., Hoffmann, M., and Thiemens, M.: Oxygen isotopic fractionation in the photochemistry of nitrate in water and ice, J. Geophys. Res.-Atmos., 110, D15310, https://doi.org/10.1029/2004JD005484, 2005.
Meusinger, C., Berhanu, T. A., Erbland, J., Savarino, J., and Johnson, M. S.: Laboratory study of nitrate photolysis in Antarctic snow. I. Observed quantum yield, domain of photolysis, and secondary chemistry, J. Chem. Phys., 140, 244305, https://doi.org/10.1063/1.4882898, 2014.
Morin, S., Savarino, J., Frey, M. M., Yan, N., Bekki, S., Bottenheim, J. W., and Martins, J. M.: Tracing the origin and fate of NOx in the Arctic atmosphere using stable isotopes in nitrate, Science, 322, 730–732, https://doi.org/10.1126/science.1161910, 2008.
Noro, K., Hattori, S., Uemura, R., Fukui, K., Hirabayashi, M., Kawamura, K., Motoyama, H., Takenaka, N., and Yoshida, N.: Spatial variation of isotopic compositions of snowpack nitrate related to post-depositional processes in eastern Dronning Maud Land, East Antarctica, Geochem. J., 52, e7–e14, https://doi.org/10.2343/geochemj.2.0519, 2018.
Shi, G., Buffen, A. M., Hastings, M. G., Li, C., Ma, H., Li, Y., Sun, B., An, C., and Jiang, S.: Investigation of post-depositional processing of nitrate in East Antarctic snow: isotopic constraints on photolytic loss, re-oxidation, and source inputs, Atmos. Chem. Phys., 15, 9435–9453, https://doi.org/10.5194/acp-15-9435-2015, 2015.
Sjostedt, S. J., Huey, L. G., Tanner, D. J., Peischl, J., Chen, G., Dibb, J. E., Lefer, B., Hutterli, M. A., Beyersdorf, A. J., Blake, N. J., Blake, D. R., Sueper, D., Ryerson, T., Burkhart, J., and Stohl, A.: Observations of hydroxyl and the sum of peroxy radicals at Summit, Greenland during summer 2003, Atmos. Environ., 41, 5122–5137, https://doi.org/10.1016/j.atmosenv.2006.06.065, 2007.
Thomas, J. L., Dibb, J. E., Huey, L. G., Liao, J., Tanner, D., Lefer, B., von Glasow, R., and Stutz, J.: Modeling chemistry in and above snow at Summit, Greenland – Part 2: Impact of snowpack chemistry on the oxidation capacity of the boundary layer, Atmos. Chem. Phys., 12, 6537–6554, https://doi.org/10.5194/acp-12-6537-2012, 2012.
Vicars, W. C. and Savarino, J.: Quantitative constraints on the 17O-excess (Δ17O) signature of surface ozone: Ambient measurements from 50∘ N to 50∘ S using the nitrite-coated filter technique, Geochim. Cosmochim. Ac., 135, 270–287, https://doi.org/10.1016/j.gca.2014.03.023, 2014.
Wolff, E. W., Jones, A. E., Bauguitte, S. J.-B., and Salmon, R. A.: The interpretation of spikes and trends in concentration of nitrate in polar ice cores, based on evidence from snow and atmospheric measurements, Atmos. Chem. Phys., 8, 5627–5634, https://doi.org/10.5194/acp-8-5627-2008, 2008.
Zatko, M., Geng, L., Alexander, B., Sofen, E., and Klein, K.: The impact of snow nitrate photolysis on boundary layer chemistry and the recycling and redistribution of reactive nitrogen across Antarctica and Greenland in a global chemical transport model, Atmos. Chem. Phys., 16, 2819–2842, https://doi.org/10.5194/acp-16-2819-2016, 2016.
Zatko, M. C., Grenfell, T. C., Alexander, B., Doherty, S. J., Thomas, J. L., and Yang, X.: The influence of snow grain size and impurities on the vertical profiles of actinic flux and associated NOx emissions on the Antarctic and Greenland ice sheets, Atmos. Chem. Phys., 13, 3547–3567, https://doi.org/10.5194/acp-13-3547-2013, 2013.